Embed Size (px)
Citation preview
Journal of Neurochemistry. 2020;00:1–14. wileyonlinelibrary.com/journal/jnc | 1© 2020 International Society for Neurochemistry
Received: 11 April 2020 | Revised: 19 May 2020 | Accepted: 5 November 2020
DOI: 10.1111/jnc.15241
O R I G I N A L A R T I C L E
Trajectory of change in brain complement factors from neonatal to young adult humans
Rachel E. H. Sager1 | Adam K. Walker2,3,4 | Frank Middleton1 | Kate Robinson5 | Maree J. Webster6 | Cynthia Shannon Weickert1,3,5
Abbreviations: ASD, autism spectrum disorder; C-B, Cox-Box; C1QA, complement component 1, Q subcomponent, Alpha polypeptide; C1QB, complement component 1, Q subcomponent, Beta polypeptide; C1QC, complement component 1, Q subcomponent, C chain; C1R, complement component 1, R subcomponent; C1S, complement component 1, S subcomponent; C2, complement component 2; C3, complement component 3; C3a, C3 cleavage product a; C3AR1, complement component 3a receptor 1; C4, complement component 4; C5, complement component 5; C5AR1, complement component C5a receptor 1; C5AR2, complement component C5a receptor 2; C6, complement component 6; C7, complement component 7; C8A, complement component 8, subunit alpha; C8B, complement component 8 subunit beta; C8G, complement component 8, gamma polypeptide; C9, complement component 9; CD11B, integrin subunit alpha M; CD46, CD46 molecule; CD55, CD55 molecule, decay accelerating factor for complement; CD59, CD59 molecule; CD163, CD163 molecule; cDNA, complementary DNA; CFB, complement factor B; CFD, complement factor D; CFH, complement factor H; CFI, complement factor I; CFP, complement factor properdin; CR1, complement C3b/C4b receptor 1 (Knops blood group); CR2, complement C3d receptor 2; CR3, macrophage-1 antigen; CSMD1, CUB and Sushi multiple domains 1; C-B, Cox-Box; CT, computerized tomography; DLPFC, dorsolateral prefrontal cortex; GUSB, glucuronidase beta; GWAS, genome-wide association study; LSD, least significant difference; HMBS, hydroxymethylbilane synthase; MASP1, mannan-binding lectin serine peptidase 1; MHCII, major histocompatibility complex, class II, DR beta 1; MOPS, 3-(N-morpholino)propanesulfonic acid; MRI, magnetic resonance imaging; PMI, postmortem interval; QPCR, quantitative PCR; RIN, RNA integrity number; SEM, standard error of the mean; SERPING1, serpin family G member 1; SDS, sodium dodecyl sulfate; SIDS, sudden infant death syndrome; TBP, TATA box protein; TGF-β, transforming growth factor beta 1; UBC, ubiquitin C.
1Department of Neuroscience and Physiology, SUNY Upstate Medical University, Syracuse, NY, USA2Laboratory of Immunopsychiatry, Neuroscience Research Australia, Sydney, NSW, Australia3School of Psychiatry, University of New South Wales, Sydney, NSW, Australia4Monash Institute of Pharmaceutical Science, Monash University, Parkville, Vic, Australia5Schizophrenia Research Laboratory, Neuroscience Research Australia, Sydney, NSW, Australia6Stanley Medical Research Institute, Kensington, MD, USA
CorrespondenceCynthia S. Weickert, Department of Neuroscience and Physiology, SUNY Upstate Medical University, Syracuse, NY, USA.Email: [email protected]
Funding informationThe NSW Ministry of Health; National Health and Medical Research Council, Grant/Award Number: 1117079
AbstractImmune system components also regulate synapse formation and refinement in neu-rodevelopment. The complement pathway, associated with cell lysis and phagocyto-sis, is implicated in synaptic elimination. Aberrant adolescent synaptic pruning may underpin schizophrenia onset; thus, changes in cortical complement activity during human development are of major interest. Complement is genetically linked to schiz-ophrenia via increased C4 copy number variants, but the developmental trajectory of complement expression in the human brain is undetermined. As complement in-creases during periods of active synaptic engulfment in rodents, we hypothesized that complement expression would increase during postnatal development in hu-mans, particularly during adolescence. Using human postmortem prefrontal cortex, we observed that complement activator (C1QB and C3) transcripts peaked in early neurodevelopment, and were highest in toddlers, declining in teenagers (all ANCOVAs between F = 2.41 –3.325, p = .01–0.05). We found that C4 protein was higher at 1–5 years (H = 16.378, p = .012), whereas C3 protein levels were unchanged with age. The microglial complement receptor subunit CD11b increased in mRNA early in life and peaked in the toddler brain (ANCOVA: pH, F = 4.186, p = .003). Complement inhibitors (CD46 and CD55) increased at school age, but failed to decrease like com-plement activators (both ANCOVAs, F > 4.4, p < .01). These data suggest the activa-tion of complement in the human prefrontal cortex occurs between 1 and 5 years. We did not find evidence of induction of complement factors during adolescence and instead found increased or sustained levels of complement inhibitor mRNA at maturation. Dysregulation of these typical patterns of complement may predispose the brain to neurodevelopmental disorders such as autism or schizophrenia.
2 | SAGER Et Al.
1 | INTRODUC TION
The development and maturation of the human brain is a lengthy process requiring exceptional growth, organization, and re-organi-zation. In recent years, a number of immune system pathways tradi-tionally associated with pathogen response have been identified as contributing to brain development. Among these is the complement pathway, which is traditionally associated with the lysis and phago-cytosis of pathogens (Newman et al., 1980; Schiela et al., 2018). However, recent research demonstrates a role for complement in tar-geted synaptic pruning (Stephan et al., 2012; Stevens et al., 2007), as well as in modulating neural progenitor cell proliferation (Coulthard et al., 2017, 2018; Gorelik et al., 2017), and guiding cortical migration (Gorelik, Sapir, Haffner-Krausz, et al., 2017; Gorelik, Sapir, Woodruff, et al., 2017).
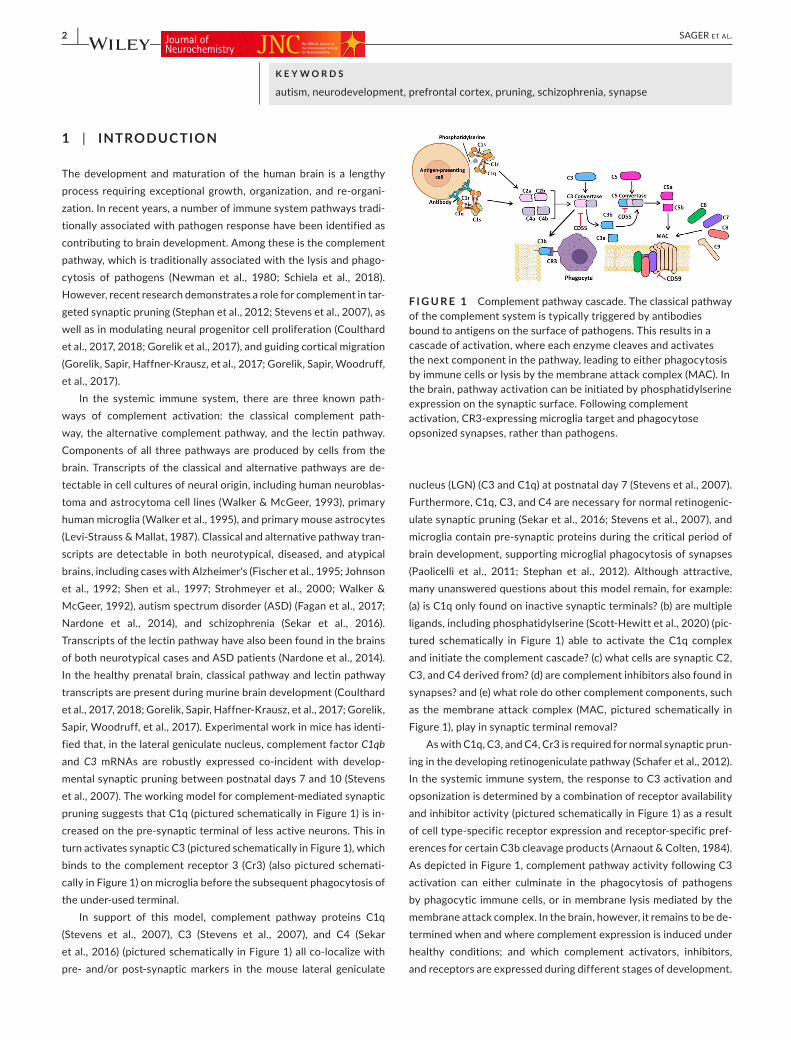
In the systemic immune system, there are three known path-ways of complement activation: the classical complement path-way, the alternative complement pathway, and the lectin pathway. Components of all three pathways are produced by cells from the brain. Transcripts of the classical and alternative pathways are de-tectable in cell cultures of neural origin, including human neuroblas-toma and astrocytoma cell lines (Walker & McGeer, 1993), primary human microglia (Walker et al., 1995), and primary mouse astrocytes (Levi-Strauss & Mallat, 1987). Classical and alternative pathway tran-scripts are detectable in both neurotypical, diseased, and atypical brains, including cases with Alzheimer's (Fischer et al., 1995; Johnson et al., 1992; Shen et al., 1997; Strohmeyer et al., 2000; Walker & McGeer, 1992), autism spectrum disorder (ASD) (Fagan et al., 2017; Nardone et al., 2014), and schizophrenia (Sekar et al., 2016). Transcripts of the lectin pathway have also been found in the brains of both neurotypical cases and ASD patients (Nardone et al., 2014). In the healthy prenatal brain, classical pathway and lectin pathway transcripts are present during murine brain development (Coulthard et al., 2017, 2018; Gorelik, Sapir, Haffner-Krausz, et al., 2017; Gorelik, Sapir, Woodruff, et al., 2017). Experimental work in mice has identi-fied that, in the lateral geniculate nucleus, complement factor C1qb and C3 mRNAs are robustly expressed co-incident with develop-mental synaptic pruning between postnatal days 7 and 10 (Stevens et al., 2007). The working model for complement-mediated synaptic pruning suggests that C1q (pictured schematically in Figure 1) is in-creased on the pre-synaptic terminal of less active neurons. This in turn activates synaptic C3 (pictured schematically in Figure 1), which binds to the complement receptor 3 (Cr3) (also pictured schemati-cally in Figure 1) on microglia before the subsequent phagocytosis of the under-used terminal.
In support of this model, complement pathway proteins C1q (Stevens et al., 2007), C3 (Stevens et al., 2007), and C4 (Sekar et al., 2016) (pictured schematically in Figure 1) all co-localize with pre- and/or post-synaptic markers in the mouse lateral geniculate
nucleus (LGN) (C3 and C1q) at postnatal day 7 (Stevens et al., 2007). Furthermore, C1q, C3, and C4 are necessary for normal retinogenic-ulate synaptic pruning (Sekar et al., 2016; Stevens et al., 2007), and microglia contain pre-synaptic proteins during the critical period of brain development, supporting microglial phagocytosis of synapses (Paolicelli et al., 2011; Stephan et al., 2012). Although attractive, many unanswered questions about this model remain, for example: (a) is C1q only found on inactive synaptic terminals? (b) are multiple ligands, including phosphatidylserine (Scott-Hewitt et al., 2020) (pic-tured schematically in Figure 1) able to activate the C1q complex and initiate the complement cascade? (c) what cells are synaptic C2, C3, and C4 derived from? (d) are complement inhibitors also found in synapses? and (e) what role do other complement components, such as the membrane attack complex (MAC, pictured schematically in Figure 1), play in synaptic terminal removal?
As with C1q, C3, and C4, Cr3 is required for normal synaptic prun-ing in the developing retinogeniculate pathway (Schafer et al., 2012). In the systemic immune system, the response to C3 activation and opsonization is determined by a combination of receptor availability and inhibitor activity (pictured schematically in Figure 1) as a result of cell type-specific receptor expression and receptor-specific pref-erences for certain C3b cleavage products (Arnaout & Colten, 1984). As depicted in Figure 1, complement pathway activity following C3 activation can either culminate in the phagocytosis of pathogens by phagocytic immune cells, or in membrane lysis mediated by the membrane attack complex. In the brain, however, it remains to be de-termined when and where complement expression is induced under healthy conditions; and which complement activators, inhibitors, and receptors are expressed during different stages of development.
K E Y W O R D S
autism, neurodevelopment, prefrontal cortex, pruning, schizophrenia, synapse
F I G U R E 1 Complement pathway cascade. The classical pathway of the complement system is typically triggered by antibodies bound to antigens on the surface of pathogens. This results in a cascade of activation, where each enzyme cleaves and activates the next component in the pathway, leading to either phagocytosis by immune cells or lysis by the membrane attack complex (MAC). In the brain, pathway activation can be initiated by phosphatidylserine expression on the synaptic surface. Following complement activation, CR3-expressing microglia target and phagocytose opsonized synapses, rather than pathogens.
| 3SAGER Et Al.
Complement dysregulation has the potential to disrupt multiple developmental processes in the brain, including progenitor cell pro-liferation, neuronal migration, and synaptic pruning. Disruption of these processes is implicated in multiple neurodevelopmental disor-ders, including schizophrenia (Glantz & Lewis, 2000; Ishii et al., 2016; Kolluri et al., 2005; Reif et al., 2006; Yang et al., 2011), autism spec-trum disorder (ASD) (Gilbert & Man, 2017; Ishii et al., 2016; Neniskyte & Gross, 2017; Thomas et al., 2016), and epilepsy (Chu et al., 2010; Ma et al., 2013; Represa, 2019; Zhou et al., 2012). In the dorsolateral prefrontal cortex (DLPFC), the dysregulation of complement activity is more likely to affect synaptic pruning than neurogenesis or neu-ronal migration, which are traditionally considered restricted to the subependymal zone and hippocampus after birth, though this is an area of continued debate (Dennis et al., 2016; Inta et al., 2008; Sanai et al., 2011; Sorrells et al., 2018). Indeed, schizophrenia and ASD are neurodevelopmental disorders which have previously been asso-ciated with synaptic pruning alterations in the cortex. Gray matter loss, measured by magnetic resonance imaging, has been reported in schizophrenia patients in the frontal lobe (Cannon et al., 2015; Leung et al., 2011; Zipursky et al., 1992), and excessive synaptic pruning is considered a potential cause of this finding (Feinberg, 1982; Johnson & Stevens, 2018; Keshavan et al., 1994). In support of this hypothe-sis, reduced dendritic spine density in the basilar dendrites of layer III pyramidal neurons has been reported in postmortem DLPFC tis-sues from schizophrenia patients (Glantz & Lewis, 2000) as well as reduced spines per dendrite (Konopaske et al., 2014). In contrast to schizophrenia, ASD is associated with increases in dendritic spine density (Hutsler & Zhang, 2010) and increases in overall brain size (Sacco et al., 2015). Recent evidence in mice supports reduced syn-aptic pruning as a putative pathogenetic mechanism for ASD (Fagan et al., 2017; Kim et al., 2017). Furthermore, both ASD and schizo-phrenia have been linked to altered levels of complement expres-sion in recent years (Fagan et al., 2017; Nardone et al., 2014; Sekar et al., 2016). In particular, complement component C4 is implicated as a major contributor to the association of the GWAS-identified major histocompatibility complex locus in schizophrenia (Sekar et al., 2016), and the complement regulator-like gene, CSMD1, has also been identified in GWAS studies as a transcript of interest in schizophrenia (Fatima et al., 2017; Havik et al., 2011; Liu et al., 2017).
However, to date, complement genes have not been directly linked to ASD in GWAS.
Despite the association between complement and synaptic pruning, no work has been done to describe normal complement ex-pression levels during typical human cortical development in either the classical, lectin, or alternative pathways of complement activa-tion. Here, we analyze complement gene expression across human postnatal development in brains from non-diseased human subjects ranging from two months of age to 26 years, focusing our efforts on the DLPFC, a brain region of particular interest in psychiatric and neurodevelopmental disorders. The DLPFC is also of considerable interest in normal human neurodevelopment since it is one of the last brain regions to mature (Gogtay et al., 2004), and is involved in highly advanced cognitive functions, including planning (Tanji & Hoshi, 2001) and working memory (Levy & Goldman-Rakic, 2000). We hypothesized that gene expression encoding complement fac-tors would be highest during human adolescence, concomitant with the putative increase in synaptic pruning in the prefrontal cortex.
2 | METHODS
2.1 | Subjects
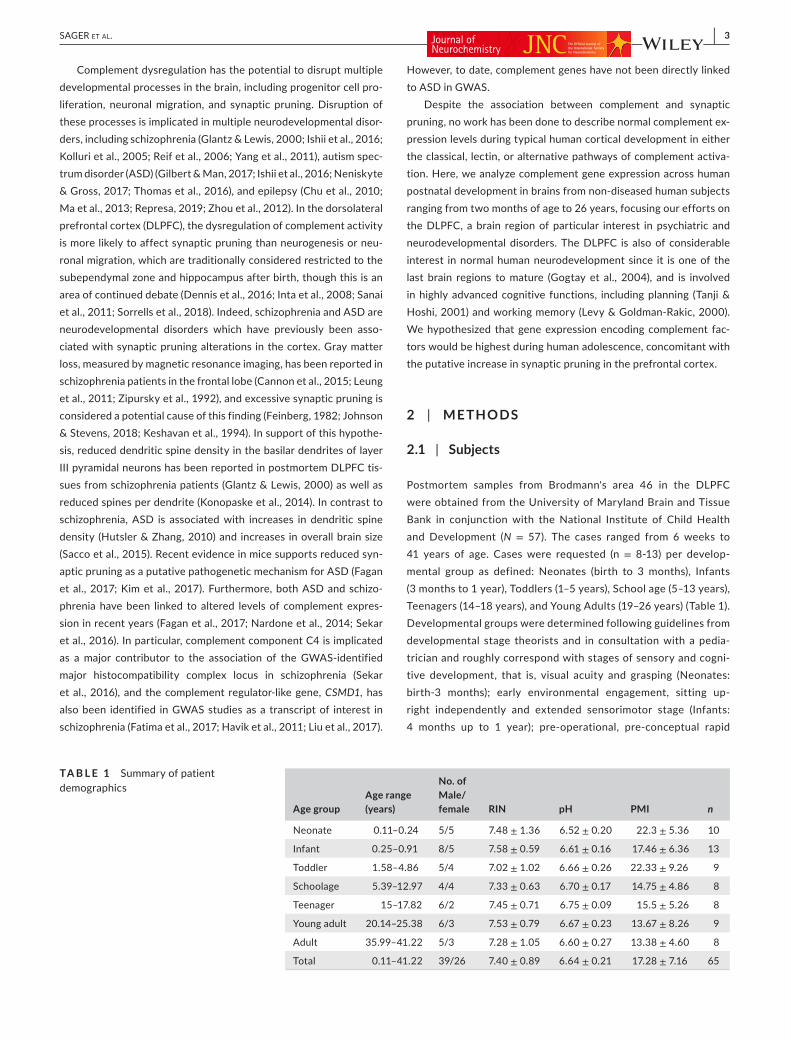
Postmortem samples from Brodmann's area 46 in the DLPFC were obtained from the University of Maryland Brain and Tissue Bank in conjunction with the National Institute of Child Health and Development (N = 57). The cases ranged from 6 weeks to 41 years of age. Cases were requested (n = 8-13) per develop-mental group as defined: Neonates (birth to 3 months), Infants (3 months to 1 year), Toddlers (1–5 years), School age (5–13 years), Teenagers (14–18 years), and Young Adults (19–26 years) (Table 1). Developmental groups were determined following guidelines from developmental stage theorists and in consultation with a pedia-trician and roughly correspond with stages of sensory and cogni-tive development, that is, visual acuity and grasping (Neonates: birth-3 months); early environmental engagement, sitting up-right independently and extended sensorimotor stage (Infants: 4 months up to 1 year); pre-operational, pre-conceptual rapid
Age groupAge range (years)
No. of Male/female RIN pH PMI n
Neonate 0.11–0.24 5/5 7.48 ± 1.36 6.52 ± 0.20 22.3 ± 5.36 10
Infant 0.25–0.91 8/5 7.58 ± 0.59 6.61 ± 0.16 17.46 ± 6.36 13
Toddler 1.58–4.86 5/4 7.02 ± 1.02 6.66 ± 0.26 22.33 ± 9.26 9
Schoolage 5.39–12.97 4/4 7.33 ± 0.63 6.70 ± 0.17 14.75 ± 4.86 8
Teenager 15–17.82 6/2 7.45 ± 0.71 6.75 ± 0.09 15.5 ± 5.26 8
Young adult 20.14–25.38 6/3 7.53 ± 0.79 6.67 ± 0.23 13.67 ± 8.26 9
Adult 35.99–41.22 5/3 7.28 ± 1.05 6.60 ± 0.27 13.38 ± 4.60 8
Total 0.11–41.22 39/26 7.40 ± 0.89 6.64 ± 0.21 17.28 ± 7.16 65
TA B L E 1 Summary of patient demographics
4 | SAGER Et Al.
language development (Toddlers: 2–4 years); concrete operations (School Age: 5–12 years); formal operations, reproductive compe-tence and heightened peer interactions (Teenager: 14–18 years); heightened cognitive ability, social independence and early ma-turity (Young Adult: around 22 years); and full maturity/peak vo-cational capabilities (Adult: 35–50 years, protein and microarray only). Cases used in the transcriptional analysis were restricted to age 26 and under in order to focus on developmental, rather than aging, processes (Franceschi & Campisi, 2014). Groups were established with care to balance male and female cases as best as possible and to match cases on RNA integrity number (RIN), brain tissue pH and postmortem interval. We have also included a num-ber of sudden infant death syndrome cases in our age groups under 2 years (Table S2). Some research has proposed a role for inflam-mation in sudden infant death syndrome (Blood-Siegfried, 2009), but the syndrome remains poorly understood, with much poten-tial for heterogeneous causes. Thus, the biological cause of death is unclear in those cases. All subjects were free of neurological and psychiatric symptoms at the time of death, and experiments involving human tissue were approved by the University of New South Wales Human Research Ethics Committee (HC16441). This study was not pre-registered.
2.2 | RNA extraction and cDNA synthesis
Total RNA was extracted from 30–100 mg of frozen DLPFC tis-sue using Trizol (Cat# 15,596,026, Invitrogen, Thermo Scientific). Following extraction, the RIN was determined for each sample using the Agilent Bioanalyzer 2100 (RRID:SCR_018043, Agilent Technologies). All cases had RIN values >6 and 260/280 ratios >1.70. These RNA samples were converted into cDNA using Superscript IV First Strand Synthesis Kit (Cat # 18,091,200; Thermo Scientific) as previously described (Fillman et al., 2014).
2.3 | High-throughput quantitative PCR
High-throughput quantitative PCR was run on a Biomark HD (Fluidigm) using a 96.96 Dynamic IFC high-throughput qPCR chip (Cat# 100–6123, Fluidigm) with a 1:5 cDNA dilution, enabling simultaneous Taqman gene expression assays (Table S1) on all samples. The high-throughput quantitative PCR was performed by the Ramaciotti Centre for Genomics (RRID:SCR_011071) at the University of New South Wales (RRID:SCR_006094, Sydney, New South Wales, Australia). Serial dilutions of pooled cDNA from these cases (1:3, 1:9, 1:27, 1:81, 1:243, 1:729, 1:2,187) were used as standards. The quality threshold for Fluidigm analysis was set to 0.50. The minimum criterion for “acceptable” readings was an absence of signal above the set cycle threshold value in the no-reverse transcriptase (no-RT) control RNA sample per gene. At this time, 26 genes passed quality control analysis in addition to housekeeper genes: C1QA, C1QB, C1QC, C1R, C1S, C2, C3, C3AR1,
C4, C5, C5AR1, C5AR2, C7, CD46, CD55, CD59, CR1, CSMD1, CFB, CFD, CFH, CFI, CFP, SERPING1, mannan-binding lectin serine pepti-dase 1 (MASP1), and CD163. The following nine transcripts were excluded from further analysis based on: signal in the no-RT con-trol that exceeds cycle threshold levels: C4A, C4B or low expres-sion: C6, C8A, C8B, C8G, C9, CR2, MASP2. Low expression was categorized as having detectable signal in less than five cases of any given age group, or less than three points of the standard curve. For the remaining genes, the expression was normalized to the geometric mean (geomean) of four housekeepers: glucu-ronidase beta, hydroxymethylbilane synthase, TATA box binding protein, and ubiquitin-C mRNAs, with no differences found in the transcripts or geomean across age groups (Figure S1).
2.4 | Quantitative PCR
Using Taqman gene expression assays (Table S1), quantitative PCR was run on an Applied Biosystems 7900HT Fast Real-Time PCR System (RRID:SCR_018060; Thermo Fisher). A 1:30 plate dilution was used for CD11B, a transcript which was added for analysis fol-lowing the high-throughput quantitative PCR. Serial dilutions of pooled cDNA from these cases were used to establish a standard curve, with dilutions dependent on plate dilution. 1:6 plates used di-lutions 1:1, 1:3, 1:9, 1:27, 1:81, 1:243, and 1:729, whereas 1:30 plates used dilutions 1:3, 1:9, 1:27, 1:81, 1:243, 1:729, and 1:2,187.
2.5 | Western blot
100 mg of DLPFC tissue were homogenized as previously de-scribed (Weickert et al., 2003). Protein yield was determined using the Bradford method. Ten micrograms of protein homogenate were diluted in NuPAGE Lithium Dodecyl Sulfate Sample Buffer (Cat# NP0007; Invitrogen, Thermo Fisher Scientific) without reducing agent and heated at 95°C for 2 min. Samples were run on 4%–12% Bis-Tris NuPAGE Bis-Tris Protein Gel (Cat#NP0329; Invitrogen, Thermo Fisher Scientific) with NuPAGE 3-(N-morpholino) pro-panesulfonic acid sodium dodecyl sulfate Running Buffer (Cat# NP0001; Invitrogen, Thermo Fisher Scientific) and transferred onto 0.45 μm nitrocellulose membranes (Cat#LC2001; Invitrogen) at 30V for one hour. Gels were probed with a primary polyclonal antibody against C3 (1:3,000, ab97462, RRID:AB_10679468, Abcam) or C4 (1:3,000, ab173577; Abcam). Each membrane was incubated with either a combination of diluted anti-C4 and anti-β-actin primary antibody (1:20,000; Millipore Cat# MAB1501, RRID:AB_2223041), or anti-C3 and anti-β-actin primary an-tibody. Following washes, membranes were incubated with goat anti-mouse secondary antibody (1:10,000; Millipore Cat# AP124, RRID:AB_92455) and goat anti-rabbit secondary antibody (1:,5,000; Millipore Cat# AP307P, RRID:AB_92641). Duplicate samples were run in separate experimental runs, with the same batch of each antibody used for all runs. Immunoreactive bands
| 5SAGER Et Al.
were detected using the ECL Prime Western Blotting detection reagent (Cat# RPN2232; Cytiva), visualized and quantified with Image Studio (Li-Cor, RRID:SCR_015795). Within each membrane, the total intensity of each immunoreactive band was normalized to an internal control on that membrane (an aliquot of pooled pro-tein from all adult cases), dividing band intensity of each case by intensity of internal control. Analysis of β-actin bands showed a significant difference in the expression between age groups, so β-actin was not used as a housekeeper for this analysis.
2.6 | Statistical analysis
Statistical tests of high-throughput qPCR were performed using SPSS statistics (Version 25, OSX, RRID:SCR_002865; IBM). Data were log and Cox-Box transformed (Real Statistics Excel plug in, Release 5.4. Copyright 2013—2018 Charles Zaiontz. www.real-stati stics.com. We conducted a sensitivity analysis using G*Power (RRID:SCR_013726, Heinrich Heine Universität Düsseldorf) using an alpha of 0.05 and expected effect sizes equal to or exceed-ing f = 0.6 and found that our study has a power of 0.95 (Faul et al., 2007). Thus, effect sizes are reported with significant results and are converted from partial eta squared to Cohen's f. However, if the Cohen's effect size fell to = 0.4, then our power drops to only 0.60, suggesting that our samples size (N = 57) is underpow-ered to detect low-moderate effects (Cohen, 1988). Statistical analysis for microarray was performed using the R Project for Statistical Computing (RRID:SCR_001905, www.r-proje ct.org) and Bioconductor software and included linear regression and ANOVA by age group.
For qPCR, Fluidigm, and western blot data, population outli-ers were assessed for each developmental group following trans-formation using the mean ± 2SD. Outliers were removed from the transformed data, then data were tested for normality using Kolmogorov–Smirnoff testing and for homogeneity of variance using Levene's test. Data transformations were selected for fur-ther analysis based on the results of Kolmogorov–Smirnoff and Levene's tests. Data normally distributed within age groups were analyzed using ANOVA, and non-normally distributed data were analyzed using Kruskal–Wallis testing. All RNA and protein were tested for covariance using Pearson's r correlation with RIN, pH, and postmortem interval. Data with significant r values (p ≤ .05) were further analyzed with their covariates using ANCOVA. Sex differences were not analyzed because of the low number of fe-male cases within certain age groups. Welch's ANOVA was used for normally distributed data exhibiting non-homogenous variance within groups (Welch, 1951; Tomarken & Serlin, 1986). Significance was set at p ≤ .05. ANCOVA analyses were followed by Fisher's Least Significant Difference tests. ANOVA analyses performed for data with homogenous variance were also followed by Fisher's Least Significant Difference tests. Welch's ANOVA analyses, for which data had significantly non-homogenous variance within
groups as determined by Levene's test, were followed by Games–Howell post hoc tests.
3 | RESULTS
3.1 | Complement mRNA expression in the DLPFC is increased early in development
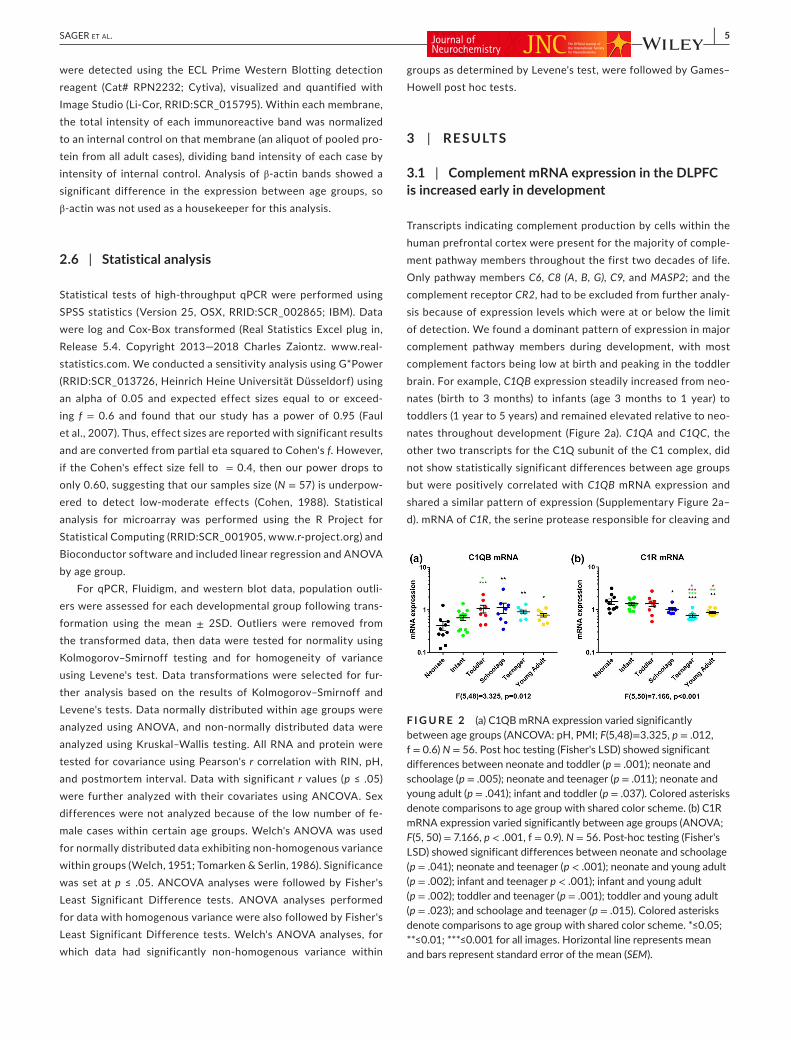
Transcripts indicating complement production by cells within the human prefrontal cortex were present for the majority of comple-ment pathway members throughout the first two decades of life. Only pathway members C6, C8 (A, B, G), C9, and MASP2; and the complement receptor CR2, had to be excluded from further analy-sis because of expression levels which were at or below the limit of detection. We found a dominant pattern of expression in major complement pathway members during development, with most complement factors being low at birth and peaking in the toddler brain. For example, C1QB expression steadily increased from neo-nates (birth to 3 months) to infants (age 3 months to 1 year) to toddlers (1 year to 5 years) and remained elevated relative to neo-nates throughout development (Figure 2a). C1QA and C1QC, the other two transcripts for the C1Q subunit of the C1 complex, did not show statistically significant differences between age groups but were positively correlated with C1QB mRNA expression and shared a similar pattern of expression (Supplementary Figure 2a–d). mRNA of C1R, the serine protease responsible for cleaving and
F I G U R E 2 (a) C1QB mRNA expression varied significantly between age groups (ANCOVA: pH, PMI; F(5,48)=3.325, p = .012, f = 0.6) N = 56. Post hoc testing (Fisher's LSD) showed significant differences between neonate and toddler (p = .001); neonate and schoolage (p = .005); neonate and teenager (p = .011); neonate and young adult (p = .041); infant and toddler (p = .037). Colored asterisks denote comparisons to age group with shared color scheme. (b) C1R mRNA expression varied significantly between age groups (ANOVA; F(5, 50) = 7.166, p < .001, f = 0.9). N = 56. Post-hoc testing (Fisher's LSD) showed significant differences between neonate and schoolage (p = .041); neonate and teenager (p < .001); neonate and young adult (p = .002); infant and teenager p < .001); infant and young adult (p = .002); toddler and teenager (p = .001); toddler and young adult (p = .023); and schoolage and teenager (p = .015). Colored asterisks denote comparisons to age group with shared color scheme. *≤0.05; **≤0.01; ***≤0.001 for all images. Horizontal line represents mean and bars represent standard error of the mean (SEM).
6 | SAGER Et Al.
activation of the C1S subunit, was expressed throughout devel-opment, but expression was significantly reduced beginning in school age (ages 5 years-13 years) and remained down-regulated into young adults (ages 19–26 years) (Figure 2b). C1S, the protein of which cleaves and activates C2 and C4 in order to form C3 con-vertase, was present at all ages but did not show any significant changes in expression (Figure S2e).
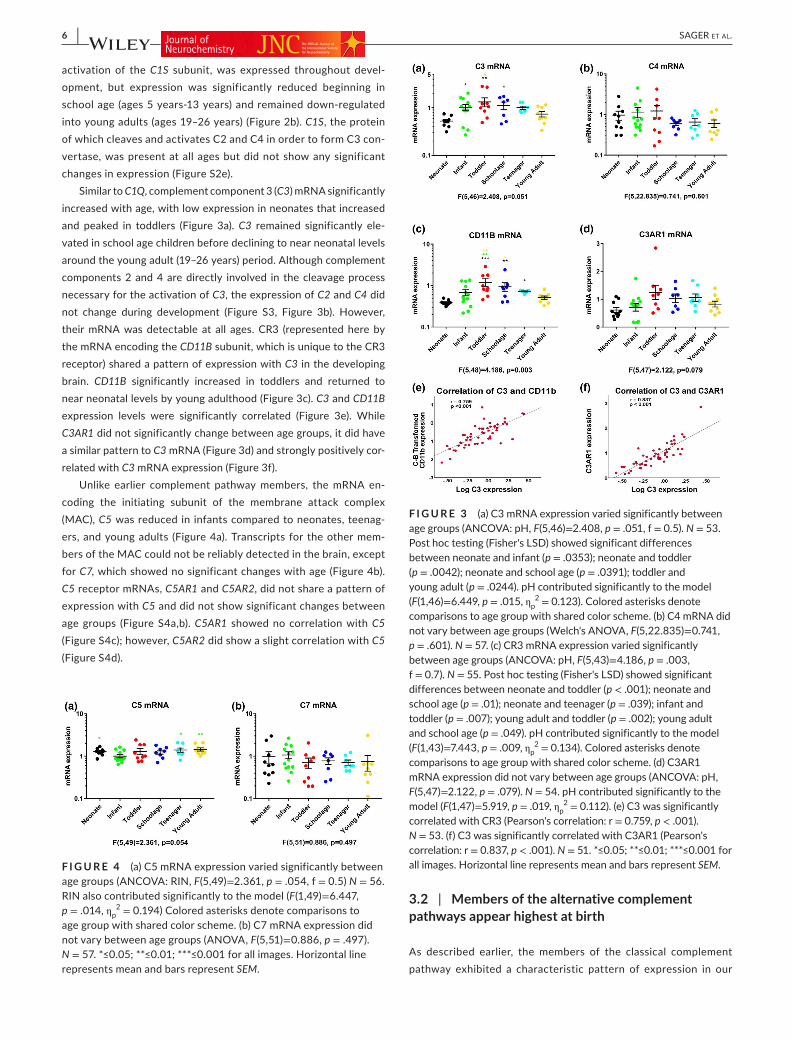
Similar to C1Q, complement component 3 (C3) mRNA significantly increased with age, with low expression in neonates that increased and peaked in toddlers (Figure 3a). C3 remained significantly ele-vated in school age children before declining to near neonatal levels around the young adult (19–26 years) period. Although complement components 2 and 4 are directly involved in the cleavage process necessary for the activation of C3, the expression of C2 and C4 did not change during development (Figure S3, Figure 3b). However, their mRNA was detectable at all ages. CR3 (represented here by the mRNA encoding the CD11B subunit, which is unique to the CR3 receptor) shared a pattern of expression with C3 in the developing brain. CD11B significantly increased in toddlers and returned to near neonatal levels by young adulthood (Figure 3c). C3 and CD11B expression levels were significantly correlated (Figure 3e). While C3AR1 did not significantly change between age groups, it did have a similar pattern to C3 mRNA (Figure 3d) and strongly positively cor-related with C3 mRNA expression (Figure 3f).
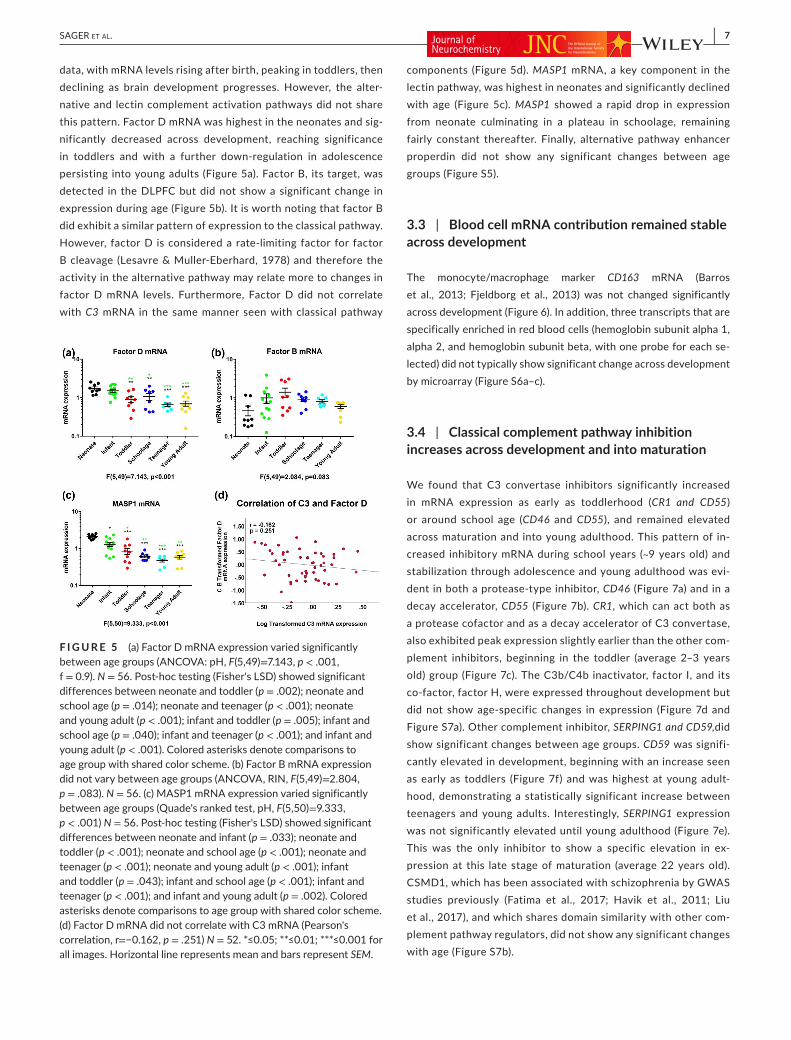
Unlike earlier complement pathway members, the mRNA en-coding the initiating subunit of the membrane attack complex (MAC), C5 was reduced in infants compared to neonates, teenag-ers, and young adults (Figure 4a). Transcripts for the other mem-bers of the MAC could not be reliably detected in the brain, except for C7, which showed no significant changes with age (Figure 4b). C5 receptor mRNAs, C5AR1 and C5AR2, did not share a pattern of expression with C5 and did not show significant changes between age groups (Figure S4a,b). C5AR1 showed no correlation with C5 (Figure S4c); however, C5AR2 did show a slight correlation with C5 (Figure S4d).
3.2 | Members of the alternative complement pathways appear highest at birth
As described earlier, the members of the classical complement pathway exhibited a characteristic pattern of expression in our
F I G U R E 3 (a) C3 mRNA expression varied significantly between age groups (ANCOVA: pH, F(5,46)=2.408, p = .051, f = 0.5). N = 53. Post hoc testing (Fisher's LSD) showed significant differences between neonate and infant (p = .0353); neonate and toddler (p = .0042); neonate and school age (p = .0391); toddler and young adult (p = .0244). pH contributed significantly to the model (F(1,46)=6.449, p = .015, ηp
2 = 0.123). Colored asterisks denote comparisons to age group with shared color scheme. (b) C4 mRNA did not vary between age groups (Welch's ANOVA, F(5,22.835)=0.741, p = .601). N = 57. (c) CR3 mRNA expression varied significantly between age groups (ANCOVA: pH, F(5,43)=4.186, p = .003, f = 0.7). N = 55. Post hoc testing (Fisher's LSD) showed significant differences between neonate and toddler (p < .001); neonate and school age (p = .01); neonate and teenager (p = .039); infant and toddler (p = .007); young adult and toddler (p = .002); young adult and school age (p = .049). pH contributed significantly to the model (F(1,43)=7.443, p = .009, ηp
2 = 0.134). Colored asterisks denote comparisons to age group with shared color scheme. (d) C3AR1 mRNA expression did not vary between age groups (ANCOVA: pH, F(5,47)=2.122, p = .079). N = 54. pH contributed significantly to the model (F(1,47)=5.919, p = .019, ηp
2 = 0.112). (e) C3 was significantly correlated with CR3 (Pearson's correlation: r = 0.759, p < .001). N = 53. (f) C3 was significantly correlated with C3AR1 (Pearson's correlation: r = 0.837, p < .001). N = 51. *≤0.05; **≤0.01; ***≤0.001 for all images. Horizontal line represents mean and bars represent SEM.F I G U R E 4 (a) C5 mRNA expression varied significantly between
age groups (ANCOVA: RIN, F(5,49)=2.361, p = .054, f = 0.5) N = 56. RIN also contributed significantly to the model (F(1,49)=6.447, p = .014, ηp
2 = 0.194) Colored asterisks denote comparisons to age group with shared color scheme. (b) C7 mRNA expression did not vary between age groups (ANOVA, F(5,51)=0.886, p = .497). N = 57. *≤0.05; **≤0.01; ***≤0.001 for all images. Horizontal line represents mean and bars represent SEM.
| 7SAGER Et Al.
data, with mRNA levels rising after birth, peaking in toddlers, then declining as brain development progresses. However, the alter-native and lectin complement activation pathways did not share this pattern. Factor D mRNA was highest in the neonates and sig-nificantly decreased across development, reaching significance in toddlers and with a further down-regulation in adolescence persisting into young adults (Figure 5a). Factor B, its target, was detected in the DLPFC but did not show a significant change in expression during age (Figure 5b). It is worth noting that factor B did exhibit a similar pattern of expression to the classical pathway. However, factor D is considered a rate-limiting factor for factor B cleavage (Lesavre & Muller-Eberhard, 1978) and therefore the activity in the alternative pathway may relate more to changes in factor D mRNA levels. Furthermore, Factor D did not correlate with C3 mRNA in the same manner seen with classical pathway
components (Figure 5d). MASP1 mRNA, a key component in the lectin pathway, was highest in neonates and significantly declined with age (Figure 5c). MASP1 showed a rapid drop in expression from neonate culminating in a plateau in schoolage, remaining fairly constant thereafter. Finally, alternative pathway enhancer properdin did not show any significant changes between age groups (Figure S5).
3.3 | Blood cell mRNA contribution remained stable across development
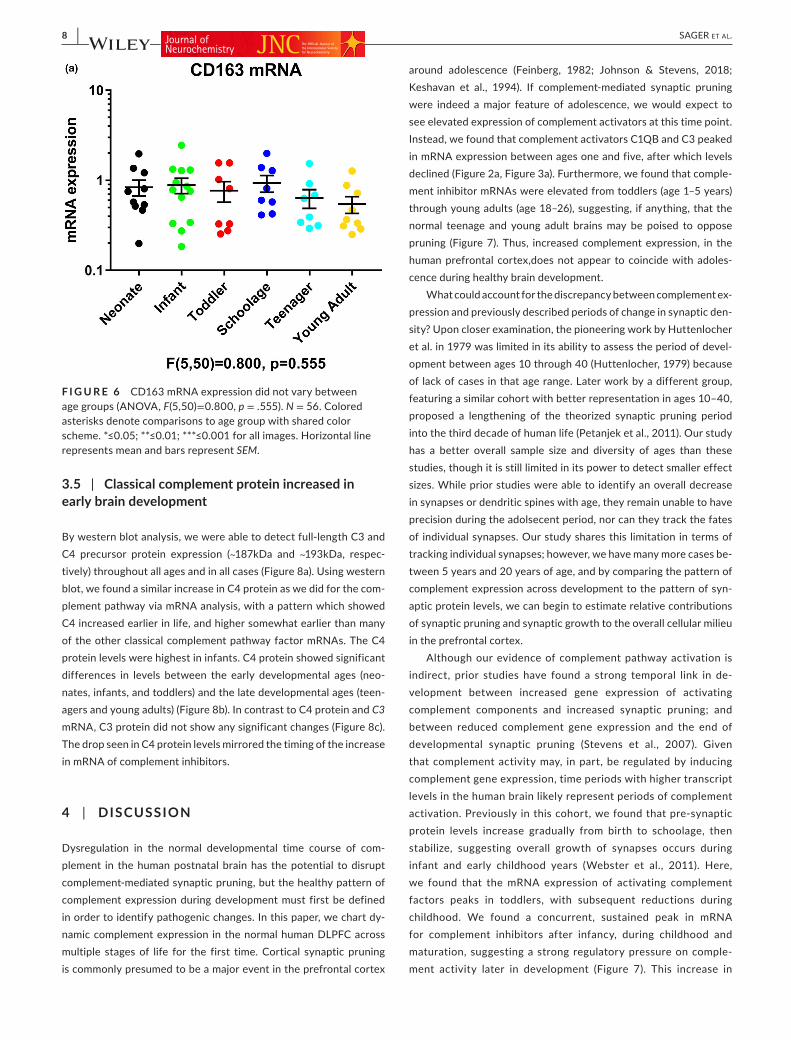
The monocyte/macrophage marker CD163 mRNA (Barros et al., 2013; Fjeldborg et al., 2013) was not changed significantly across development (Figure 6). In addition, three transcripts that are specifically enriched in red blood cells (hemoglobin subunit alpha 1, alpha 2, and hemoglobin subunit beta, with one probe for each se-lected) did not typically show significant change across development by microarray (Figure S6a–c).
3.4 | Classical complement pathway inhibition increases across development and into maturation
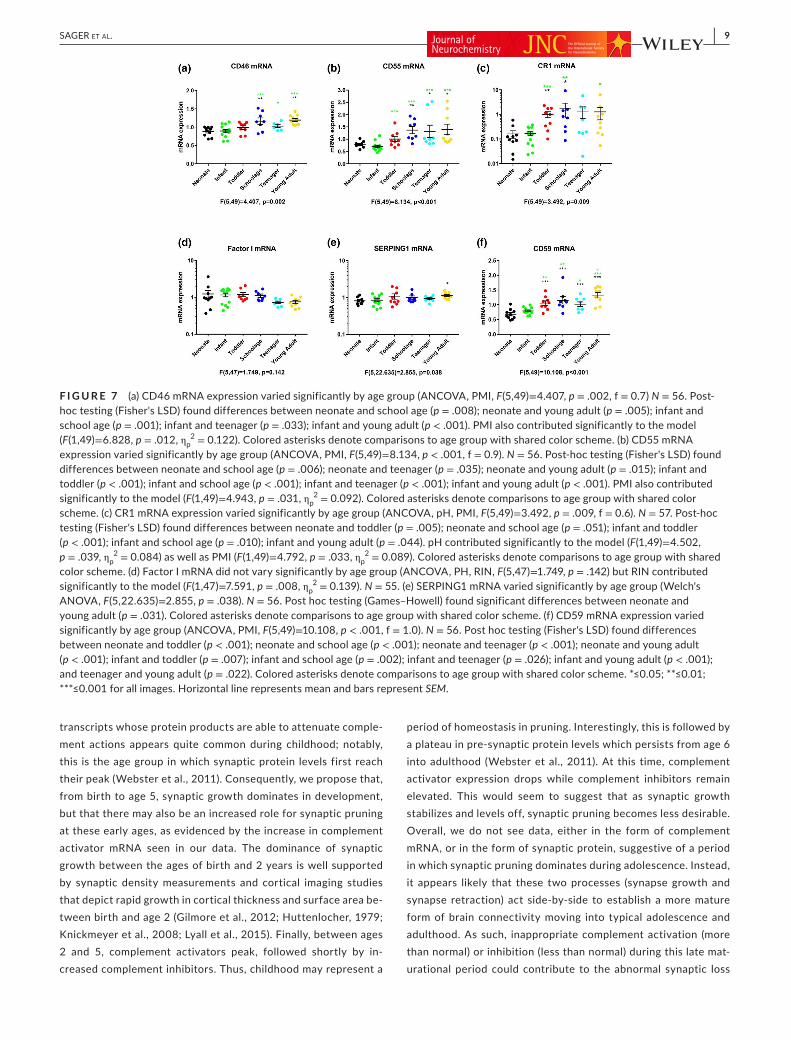
We found that C3 convertase inhibitors significantly increased in mRNA expression as early as toddlerhood (CR1 and CD55) or around school age (CD46 and CD55), and remained elevated across maturation and into young adulthood. This pattern of in-creased inhibitory mRNA during school years (~9 years old) and stabilization through adolescence and young adulthood was evi-dent in both a protease-type inhibitor, CD46 (Figure 7a) and in a decay accelerator, CD55 (Figure 7b). CR1, which can act both as a protease cofactor and as a decay accelerator of C3 convertase, also exhibited peak expression slightly earlier than the other com-plement inhibitors, beginning in the toddler (average 2–3 years old) group (Figure 7c). The C3b/C4b inactivator, factor I, and its co-factor, factor H, were expressed throughout development but did not show age-specific changes in expression (Figure 7d and Figure S7a). Other complement inhibitor, SERPING1 and CD59,did show significant changes between age groups. CD59 was signifi-cantly elevated in development, beginning with an increase seen as early as toddlers (Figure 7f) and was highest at young adult-hood, demonstrating a statistically significant increase between teenagers and young adults. Interestingly, SERPING1 expression was not significantly elevated until young adulthood (Figure 7e). This was the only inhibitor to show a specific elevation in ex-pression at this late stage of maturation (average 22 years old). CSMD1, which has been associated with schizophrenia by GWAS studies previously (Fatima et al., 2017; Havik et al., 2011; Liu et al., 2017), and which shares domain similarity with other com-plement pathway regulators, did not show any significant changes with age (Figure S7b).
F I G U R E 5 (a) Factor D mRNA expression varied significantly between age groups (ANCOVA: pH, F(5,49)=7.143, p < .001, f = 0.9). N = 56. Post-hoc testing (Fisher's LSD) showed significant differences between neonate and toddler (p = .002); neonate and school age (p = .014); neonate and teenager (p < .001); neonate and young adult (p < .001); infant and toddler (p = .005); infant and school age (p = .040); infant and teenager (p < .001); and infant and young adult (p < .001). Colored asterisks denote comparisons to age group with shared color scheme. (b) Factor B mRNA expression did not vary between age groups (ANCOVA, RIN, F(5,49)=2.804, p = .083). N = 56. (c) MASP1 mRNA expression varied significantly between age groups (Quade's ranked test, pH, F(5,50)=9.333, p < .001) N = 56. Post-hoc testing (Fisher's LSD) showed significant differences between neonate and infant (p = .033); neonate and toddler (p < .001); neonate and school age (p < .001); neonate and teenager (p < .001); neonate and young adult (p < .001); infant and toddler (p = .043); infant and school age (p < .001); infant and teenager (p < .001); and infant and young adult (p = .002). Colored asterisks denote comparisons to age group with shared color scheme. (d) Factor D mRNA did not correlate with C3 mRNA (Pearson's correlation, r=−0.162, p = .251) N = 52. *≤0.05; **≤0.01; ***≤0.001 for all images. Horizontal line represents mean and bars represent SEM.
8 | SAGER Et Al.
3.5 | Classical complement protein increased in early brain development
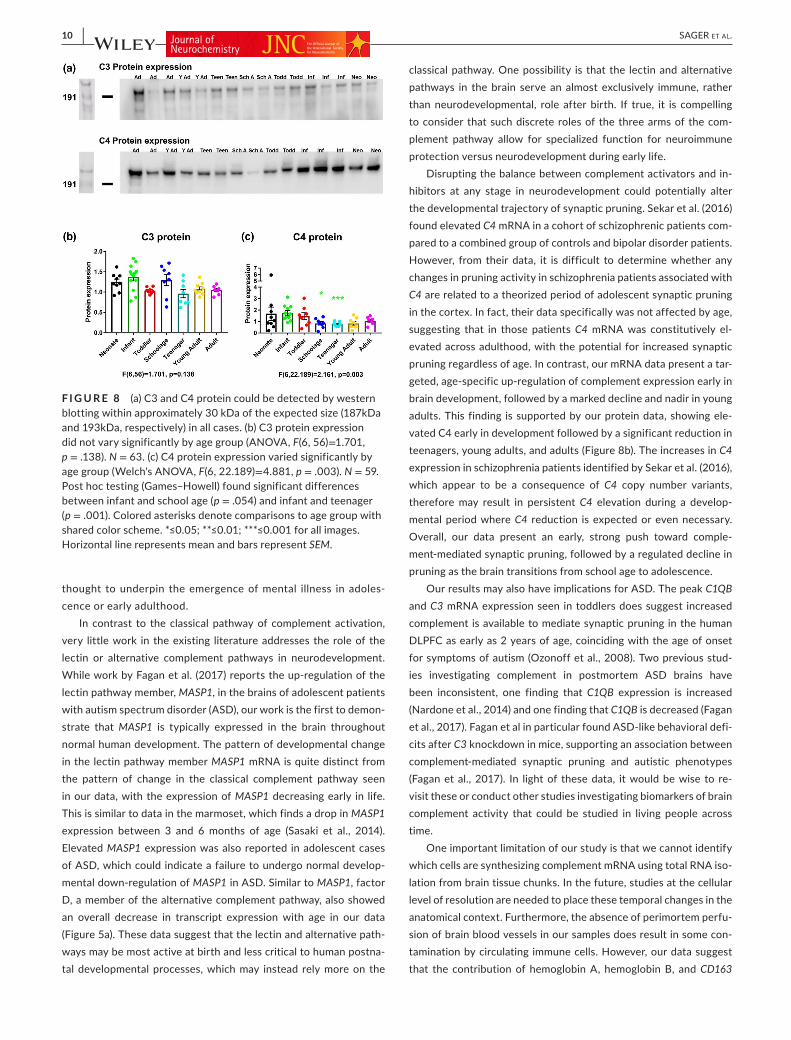
By western blot analysis, we were able to detect full-length C3 and C4 precursor protein expression (~187kDa and ~193kDa, respec-tively) throughout all ages and in all cases (Figure 8a). Using western blot, we found a similar increase in C4 protein as we did for the com-plement pathway via mRNA analysis, with a pattern which showed C4 increased earlier in life, and higher somewhat earlier than many of the other classical complement pathway factor mRNAs. The C4 protein levels were highest in infants. C4 protein showed significant differences in levels between the early developmental ages (neo-nates, infants, and toddlers) and the late developmental ages (teen-agers and young adults) (Figure 8b). In contrast to C4 protein and C3 mRNA, C3 protein did not show any significant changes (Figure 8c). The drop seen in C4 protein levels mirrored the timing of the increase in mRNA of complement inhibitors.
4 | DISCUSSION
Dysregulation in the normal developmental time course of com-plement in the human postnatal brain has the potential to disrupt complement-mediated synaptic pruning, but the healthy pattern of complement expression during development must first be defined in order to identify pathogenic changes. In this paper, we chart dy-namic complement expression in the normal human DLPFC across multiple stages of life for the first time. Cortical synaptic pruning is commonly presumed to be a major event in the prefrontal cortex
around adolescence (Feinberg, 1982; Johnson & Stevens, 2018; Keshavan et al., 1994). If complement-mediated synaptic pruning were indeed a major feature of adolescence, we would expect to see elevated expression of complement activators at this time point. Instead, we found that complement activators C1QB and C3 peaked in mRNA expression between ages one and five, after which levels declined (Figure 2a, Figure 3a). Furthermore, we found that comple-ment inhibitor mRNAs were elevated from toddlers (age 1–5 years) through young adults (age 18–26), suggesting, if anything, that the normal teenage and young adult brains may be poised to oppose pruning (Figure 7). Thus, increased complement expression, in the human prefrontal cortex,does not appear to coincide with adoles-cence during healthy brain development.
What could account for the discrepancy between complement ex-pression and previously described periods of change in synaptic den-sity? Upon closer examination, the pioneering work by Huttenlocher et al. in 1979 was limited in its ability to assess the period of devel-opment between ages 10 through 40 (Huttenlocher, 1979) because of lack of cases in that age range. Later work by a different group, featuring a similar cohort with better representation in ages 10–40, proposed a lengthening of the theorized synaptic pruning period into the third decade of human life (Petanjek et al., 2011). Our study has a better overall sample size and diversity of ages than these studies, though it is still limited in its power to detect smaller effect sizes. While prior studies were able to identify an overall decrease in synapses or dendritic spines with age, they remain unable to have precision during the adolsecent period, nor can they track the fates of individual synapses. Our study shares this limitation in terms of tracking individual synapses; however, we have many more cases be-tween 5 years and 20 years of age, and by comparing the pattern of complement expression across development to the pattern of syn-aptic protein levels, we can begin to estimate relative contributions of synaptic pruning and synaptic growth to the overall cellular milieu in the prefrontal cortex.
Although our evidence of complement pathway activation is indirect, prior studies have found a strong temporal link in de-velopment between increased gene expression of activating complement components and increased synaptic pruning; and between reduced complement gene expression and the end of developmental synaptic pruning (Stevens et al., 2007). Given that complement activity may, in part, be regulated by inducing complement gene expression, time periods with higher transcript levels in the human brain likely represent periods of complement activation. Previously in this cohort, we found that pre-synaptic protein levels increase gradually from birth to schoolage, then stabilize, suggesting overall growth of synapses occurs during infant and early childhood years (Webster et al., 2011). Here, we found that the mRNA expression of activating complement factors peaks in toddlers, with subsequent reductions during childhood. We found a concurrent, sustained peak in mRNA for complement inhibitors after infancy, during childhood and maturation, suggesting a strong regulatory pressure on comple-ment activity later in development (Figure 7). This increase in
F I G U R E 6 CD163 mRNA expression did not vary between age groups (ANOVA, F(5,50)=0.800, p = .555). N = 56. Colored asterisks denote comparisons to age group with shared color scheme. *≤0.05; **≤0.01; ***≤0.001 for all images. Horizontal line represents mean and bars represent SEM.
| 9SAGER Et Al.
transcripts whose protein products are able to attenuate comple-ment actions appears quite common during childhood; notably, this is the age group in which synaptic protein levels first reach their peak (Webster et al., 2011). Consequently, we propose that, from birth to age 5, synaptic growth dominates in development, but that there may also be an increased role for synaptic pruning at these early ages, as evidenced by the increase in complement activator mRNA seen in our data. The dominance of synaptic growth between the ages of birth and 2 years is well supported by synaptic density measurements and cortical imaging studies that depict rapid growth in cortical thickness and surface area be-tween birth and age 2 (Gilmore et al., 2012; Huttenlocher, 1979; Knickmeyer et al., 2008; Lyall et al., 2015). Finally, between ages 2 and 5, complement activators peak, followed shortly by in-creased complement inhibitors. Thus, childhood may represent a
period of homeostasis in pruning. Interestingly, this is followed by a plateau in pre-synaptic protein levels which persists from age 6 into adulthood (Webster et al., 2011). At this time, complement activator expression drops while complement inhibitors remain elevated. This would seem to suggest that as synaptic growth stabilizes and levels off, synaptic pruning becomes less desirable. Overall, we do not see data, either in the form of complement mRNA, or in the form of synaptic protein, suggestive of a period in which synaptic pruning dominates during adolescence. Instead, it appears likely that these two processes (synapse growth and synapse retraction) act side-by-side to establish a more mature form of brain connectivity moving into typical adolescence and adulthood. As such, inappropriate complement activation (more than normal) or inhibition (less than normal) during this late mat-urational period could contribute to the abnormal synaptic loss
F I G U R E 7 (a) CD46 mRNA expression varied significantly by age group (ANCOVA, PMI, F(5,49)=4.407, p = .002, f = 0.7) N = 56. Post-hoc testing (Fisher's LSD) found differences between neonate and school age (p = .008); neonate and young adult (p = .005); infant and school age (p = .001); infant and teenager (p = .033); infant and young adult (p < .001). PMI also contributed significantly to the model (F(1,49)=6.828, p = .012, ηp
2 = 0.122). Colored asterisks denote comparisons to age group with shared color scheme. (b) CD55 mRNA expression varied significantly by age group (ANCOVA, PMI, F(5,49)=8.134, p < .001, f = 0.9). N = 56. Post-hoc testing (Fisher's LSD) found differences between neonate and school age (p = .006); neonate and teenager (p = .035); neonate and young adult (p = .015); infant and toddler (p < .001); infant and school age (p < .001); infant and teenager (p < .001); infant and young adult (p < .001). PMI also contributed significantly to the model (F(1,49)=4.943, p = .031, ηp
2 = 0.092). Colored asterisks denote comparisons to age group with shared color scheme. (c) CR1 mRNA expression varied significantly by age group (ANCOVA, pH, PMI, F(5,49)=3.492, p = .009, f = 0.6). N = 57. Post-hoc testing (Fisher's LSD) found differences between neonate and toddler (p = .005); neonate and school age (p = .051); infant and toddler (p < .001); infant and school age (p = .010); infant and young adult (p = .044). pH contributed significantly to the model (F(1,49)=4.502, p = .039, ηp
2 = 0.084) as well as PMI (F(1,49)=4.792, p = .033, ηp2 = 0.089). Colored asterisks denote comparisons to age group with shared
color scheme. (d) Factor I mRNA did not vary significantly by age group (ANCOVA, PH, RIN, F(5,47)=1.749, p = .142) but RIN contributed significantly to the model (F(1,47)=7.591, p = .008, ηp
2 = 0.139). N = 55. (e) SERPING1 mRNA varied significantly by age group (Welch's ANOVA, F(5,22.635)=2.855, p = .038). N = 56. Post hoc testing (Games–Howell) found significant differences between neonate and young adult (p = .031). Colored asterisks denote comparisons to age group with shared color scheme. (f) CD59 mRNA expression varied significantly by age group (ANCOVA, PMI, F(5,49)=10.108, p < .001, f = 1.0). N = 56. Post hoc testing (Fisher's LSD) found differences between neonate and toddler (p < .001); neonate and school age (p < .001); neonate and teenager (p < .001); neonate and young adult (p < .001); infant and toddler (p = .007); infant and school age (p = .002); infant and teenager (p = .026); infant and young adult (p < .001); and teenager and young adult (p = .022). Colored asterisks denote comparisons to age group with shared color scheme. *≤0.05; **≤0.01; ***≤0.001 for all images. Horizontal line represents mean and bars represent SEM.
10 | SAGER Et Al.
thought to underpin the emergence of mental illness in adoles-cence or early adulthood.
In contrast to the classical pathway of complement activation, very little work in the existing literature addresses the role of the lectin or alternative complement pathways in neurodevelopment. While work by Fagan et al. (2017) reports the up-regulation of the lectin pathway member, MASP1, in the brains of adolescent patients with autism spectrum disorder (ASD), our work is the first to demon-strate that MASP1 is typically expressed in the brain throughout normal human development. The pattern of developmental change in the lectin pathway member MASP1 mRNA is quite distinct from the pattern of change in the classical complement pathway seen in our data, with the expression of MASP1 decreasing early in life. This is similar to data in the marmoset, which finds a drop in MASP1 expression between 3 and 6 months of age (Sasaki et al., 2014). Elevated MASP1 expression was also reported in adolescent cases of ASD, which could indicate a failure to undergo normal develop-mental down-regulation of MASP1 in ASD. Similar to MASP1, factor D, a member of the alternative complement pathway, also showed an overall decrease in transcript expression with age in our data (Figure 5a). These data suggest that the lectin and alternative path-ways may be most active at birth and less critical to human postna-tal developmental processes, which may instead rely more on the
classical pathway. One possibility is that the lectin and alternative pathways in the brain serve an almost exclusively immune, rather than neurodevelopmental, role after birth. If true, it is compelling to consider that such discrete roles of the three arms of the com-plement pathway allow for specialized function for neuroimmune protection versus neurodevelopment during early life.
Disrupting the balance between complement activators and in-hibitors at any stage in neurodevelopment could potentially alter the developmental trajectory of synaptic pruning. Sekar et al. (2016) found elevated C4 mRNA in a cohort of schizophrenic patients com-pared to a combined group of controls and bipolar disorder patients. However, from their data, it is difficult to determine whether any changes in pruning activity in schizophrenia patients associated with C4 are related to a theorized period of adolescent synaptic pruning in the cortex. In fact, their data specifically was not affected by age, suggesting that in those patients C4 mRNA was constitutively el-evated across adulthood, with the potential for increased synaptic pruning regardless of age. In contrast, our mRNA data present a tar-geted, age-specific up-regulation of complement expression early in brain development, followed by a marked decline and nadir in young adults. This finding is supported by our protein data, showing ele-vated C4 early in development followed by a significant reduction in teenagers, young adults, and adults (Figure 8b). The increases in C4 expression in schizophrenia patients identified by Sekar et al. (2016), which appear to be a consequence of C4 copy number variants, therefore may result in persistent C4 elevation during a develop-mental period where C4 reduction is expected or even necessary. Overall, our data present an early, strong push toward comple-ment-mediated synaptic pruning, followed by a regulated decline in pruning as the brain transitions from school age to adolescence.
Our results may also have implications for ASD. The peak C1QB and C3 mRNA expression seen in toddlers does suggest increased complement is available to mediate synaptic pruning in the human DLPFC as early as 2 years of age, coinciding with the age of onset for symptoms of autism (Ozonoff et al., 2008). Two previous stud-ies investigating complement in postmortem ASD brains have been inconsistent, one finding that C1QB expression is increased (Nardone et al., 2014) and one finding that C1QB is decreased (Fagan et al., 2017). Fagan et al in particular found ASD-like behavioral defi-cits after C3 knockdown in mice, supporting an association between complement-mediated synaptic pruning and autistic phenotypes (Fagan et al., 2017). In light of these data, it would be wise to re-visit these or conduct other studies investigating biomarkers of brain complement activity that could be studied in living people across time.
One important limitation of our study is that we cannot identify which cells are synthesizing complement mRNA using total RNA iso-lation from brain tissue chunks. In the future, studies at the cellular level of resolution are needed to place these temporal changes in the anatomical context. Furthermore, the absence of perimortem perfu-sion of brain blood vessels in our samples does result in some con-tamination by circulating immune cells. However, our data suggest that the contribution of hemoglobin A, hemoglobin B, and CD163
F I G U R E 8 (a) C3 and C4 protein could be detected by western blotting within approximately 30 kDa of the expected size (187kDa and 193kDa, respectively) in all cases. (b) C3 protein expression did not vary significantly by age group (ANOVA, F(6, 56)=1.701, p = .138). N = 63. (c) C4 protein expression varied significantly by age group (Welch's ANOVA, F(6, 22.189)=4.881, p = .003). N = 59. Post hoc testing (Games–Howell) found significant differences between infant and school age (p = .054) and infant and teenager (p = .001). Colored asterisks denote comparisons to age group with shared color scheme. *≤0.05; **≤0.01; ***≤0.001 for all images. Horizontal line represents mean and bars represent SEM.
| 11SAGER Et Al.
mRNA coming from circulating red and white blood cells (specifi-cally monocytes/macrophages) to the bulk RNA does not change substantially across development, indicating that there may not be large changes in blood vessel density or contamination from blood between developmental groups. The mean value of mRNAs consid-ered specific to red blood cells (Hemoglobin A and hemoglobin B) are somewhat higher in the neonate and young adult sample (Figure S6) but a corresponding higher mean value at these two age groups is not found in complement mRNA in brain. In fact, many comple-ment mRNAs were at their lowest in neonates, except factor D and MASP1 mRNAs, and most complement mRNAs were reduced in young adults in our samples. The low level of classical complement mRNA expression in the neonatal brain does share similarities with the low level of serum complement protein levels found during early development in humans (Willems et al., 2019). However, there is a key difference: serum complement levels are typically elevated or steadily increasing through toddler, school age, teenage, and young adult years, with no subsequent decline in level after infancy. As dis-cussed previously, multiple prior studies have established that cells of neural origin are competent to express complement. Thus, it is likely that the patterns of mRNA expression we report here are rep-resentative of brain-based gene expression and local protein pro-duction, rather than blood-based, complement production.
5 | CONCLUSION
Traditional models of synaptic pruning predict that peak synaptic pruning occurs during adolescence. However, our data suggest that a contribution of complement to synaptic pruning is primed to occur earlier in development, between the ages of 1 and 5. Furthermore, the mRNA of key complement inhibitors shows a synchronized el-evation that persists into or even increases in young adulthood, sug-gesting stronger control of complement activity in pivotal years of brain maturation. Based on the expression patterns in our data, the classical complement pathway is most likely to contribute to synap-tic pruning in toddlerhood, though the alternative pathway may play a role in amplifying the C3 signal as well. Our data support a model in which an initial period of exuberant neonatal growth in the DLPFC is paralleled by induction and expression of key classical comple-ment factors in the first few postnatal years, setting the stage for a later “homeostatic” period of synaptic growth and retraction where complement activators and inhibitors work together to regulate, strengthen and dispose of synapses as required based on experience and learning during postnatal life.
ACKNOWLEDG EMENTSThe NSW Ministry of Health, Office of Health and Medical Research provided funding for this work. CSW is a recipient of a National Health and Medical Research Council (Australia) Principal Research Fellowship (1117079). Cynthia Shannon Weickert is on an advisory board for Lundbeck, Australia Pty Ltd and in collaboration with Astellas Pharma Inc., Japan, but this work is unrelated to our study.
Frank A Middleton has served as a paid statistical reviewer for the Journal of Neurochemistry but played no role in the reviews of this work.
All experiments were conducted in compliance with the ARRIVE guidelines.
CONFLIC T OF INTERE S TAll other co-authors declare no conflicts of interest.
ORCIDRachel E. H. Sager https://orcid.org/0000-0002-2055-484X Adam K. Walker https://orcid.org/0000-0003-3772-5745 Frank Middleton https://orcid.org/0000-0002-3107-7188 Kate Robinson https://orcid.org/0000-0002-4654-8456 Maree J. Webster https://orcid.org/0000-0002-8778-4148 Cynthia Shannon Weickert https://orcid.org/0000-0002-4560-0259
R E FE R E N C E SArnaout, M. A., & Colten, H. R. (1984). Complement C3 receptors:
Structure and function. Molecular Immunology, 21, 1191–1199. https://doi.org/10.1016/0161-5890(84)90009 -9
Barros, M. H., Hauck, F., Dreyer, J. H., Kempkes, B., & Niedobitek, G. (2013). Macrophage polarisation: An immunohistochemical approach for identifying M1 and M2 macrophages. PLoS One, 8, e80908. https://doi.org/10.1371/journ al.pone.0080908
Blood-Siegfried, J. (2009). The role of infection and inflammation in sudden infant death syndrome. Immunopharmacology and Immunotoxicology, 31, 516–523. https://doi.org/10.3109/08923 97090 2814137
Cannon, T. D., Chung, Y., He, G., Sun, D., Jacobson, A., van Erp, T. G. M., McEwen, S., Addington, J., Bearden, C. E., Cadenhead, K., Cornblatt, B., Mathalon, D. H., McGlashan, T., Perkins, D., Jeffries, C., Seidman, L. J., Tsuang, M., Walker, E., Woods, S. W., & Heinssen, R. (2015). Progressive reduction in cortical thickness as psychosis develops: A multisite longitudinal neuroimaging study of youth at elevated clini-cal risk. Biological Psychiatry, 77, 147–157. https://doi.org/10.1016/j.biops ych.2014.05.023
Chu, Y., Jin, X., Parada, I., Pesic, A., Stevens, B., Barres, B., & Prince, D. A. (2010). Enhanced synaptic connectivity and epilepsy in C1q knockout mice. Proceedings of the National Academy of Sciences of the United States of America, 107, 7975–7980. https://doi.org/10.1073/pnas.09134 49107
Cohen, J. E. (1988). Statistical Power Analysis for the Behavioral Sciences. Lawrence Erlbaum Associates Inc.
Coulthard, L. G., Hawksworth, O. A., Conroy, J., Lee, J. D., & Woodruff, T. M. (2018). Complement C3a receptor modulates embryonic neural progen-itor cell proliferation and cognitive performance. Molecular Immunology, 101, 176–181. https://doi.org/10.1016/j.molimm.2018.06.271
Coulthard, L. G., Hawksworth, O. A., Li, R., Balachandran, A., Lee, J. D., Sepehrband, F., Kurniawan, N., Jeanes, A., Simmons, D. G., Wolvetang, E., & Woodruff, T. M. (2017). Complement C5aR1 signaling promotes polarization and proliferation of embryonic neural progenitor cells through PKCzeta. Journal of Neuroscience, 37, 5395–5407.
Dennis, C. V., Suh, L. S., Rodriguez, M. L., Kril, J. J., & Sutherland, G. T. (2016). Human adult neurogenesis across the ages: An immunohis-tochemical study. Neuropathology and Applied Neurobiology, 42, 621–638. https://doi.org/10.1111/nan.12337
Fagan, K., Crider, A., Ahmed, A. O., & Pillai, A. (2017). Complement C3 ex-pression is decreased in autism spectrum disorder subjects and con-tributes to behavioral deficits in rodents. Molecular Neuropsychiatry, 3, 19–27. https://doi.org/10.1159/00046 5523
12 | SAGER Et Al.
Fatima, A., Farooq, M., Abdullah, U., Tariq, M., Mustafa, T., Iqbal, M., Tommerup, N., & Mahmood Baig, S. (2017). Genome-wide supported risk variants in MIR137, CACNA1C, CSMD1, DRD2, and GRM3 contribute to schizophrenia susceptibility in Pakistani population. Psychiatry Investigation, 14, 687–692.
Faul, F., Erdfelder, E., Lang, A. G., & Buchner, A. (2007). G*Power 3: A flexible statistical power analysis program for the social, behavioral, and biomedical sciences. Behavior Research Methods, 39, 175–191. https://doi.org/10.3758/BF031 93146
Feinberg, I. (1982). Schizophrenia: Caused by a fault in programmed syn-aptic elimination during adolescence? Journal of Psychiatric Research, 17, 319–334. https://doi.org/10.1016/0022-3956(82)90038 -3
Fillman, S. G., Sinclair, D., Fung, S. J., Webster, M. J., & Shannon Weickert, C. (2014). Markers of inflammation and stress distinguish subsets of individuals with schizophrenia and bipolar disorder. Translational Psychiatry, 4, e365. https://doi.org/10.1038/tp.2014.8
Fischer, B., Schmoll, H., Riederer, P., Bauer, J., Platt, D., & Popa-Wagner, A. (1995). Complement C1q and C3 mRNA expression in the frontal cortex of Alzheimer's patients. Journal of Molecular Medicine (Berlin), 73, 465–471. https://doi.org/10.1007/BF002 02265
Fjeldborg, K., Christiansen, T., Bennetzen, M., J. Møller, H., Pedersen, S. B., & Richelsen, B. (2013). The macrophage-specific serum marker, soluble CD163, is increased in obesity and reduced after dietary-in-duced weight loss. Obesity (Silver Spring), 21, 2437–2443. https://doi.org/10.1002/oby.20376
Franceschi, C., & Campisi, J. (2014). Chronic inflammation (inflammaging) and its potential contribution to age-associated diseases. Journals of Gerontology Series A, Biological Sciences and Medical Sciences, 69(Suppl 1), S4–9. https://doi.org/10.1093/geron a/glu057
Gilbert, J., & Man, H. Y. (2017). Fundamental elements in autism: From neu-rogenesis and neurite growth to synaptic plasticity. Frontiers in Cellular Neuroscience, 11, 359. https://doi.org/10.3389/fncel.2017.00359
Gilmore, J. H., Shi, F., Woolson, S. L., Knickmeyer, R. C., Short, S. J., Lin, W., Zhu, H., Hamer, R. M., Styner, M., & Shen, D. (2012). Longitudinal development of cortical and subcortical gray matter from birth to 2 years. Cerebral Cortex, 22, 2478–2485. https://doi.org/10.1093/cerco r/bhr327
Glantz, L. A., & Lewis, D. A. (2000). Decreased dendritic spine density on pre-frontal cortical pyramidal neurons in schizophrenia. Archives of General Psychiatry, 57, 65–73. https://doi.org/10.1001/archp syc.57.1.65
Gogtay, N., Giedd, J. N., Lusk, L., Hayashi, K. M., Greenstein, D., Vaituzis, A. C., Nugent, T. F., Herman, D. H., Clasen, L. S., Toga, A. W., Rapoport, J. L., & Thompson, P. M. (2004). Dynamic mapping of human cortical development during childhood through early adulthood. Proceedings of the National Academy of Sciences of the United States of America, 101, 8174–8179. https://doi.org/10.1073/pnas.04026 80101
Gorelik, A., Sapir, T., Haffner-Krausz, R., Olender, T., Woodruff, T. M., & Reiner, O. (2017). Developmental activities of the complement path-way in migrating neurons. Nature Communications, 8, 15096. https://doi.org/10.1038/ncomm s15096
Gorelik, A., Sapir, T., Woodruff, T. M., & Reiner, O. (2017). Serping1/C1 inhibitor affects cortical development in a cell autonomous and non-cell autonomous manner. Frontiers in Cellular Neuroscience, 11, 169. https://doi.org/10.3389/fncel.2017.00169
Håvik, B., Le Hellard, S., Rietschel, M., Lybæk, H., Djurovic, S., Mattheisen, M., Mühleisen, T. W., Degenhardt, F., Priebe, L., Maier, W., Breuer, R., Schulze, T. G., Agartz, I., Melle, I., Hansen, T., Bramham, C. R., Nöthen, M. M., Stevens, B., Werge, T., … Steen, V. M. (2011). The complement control-related genes CSMD1 and CSMD2 associate to schizophre-nia. Biological Psychiatry, 70, 35–42. https://doi.org/10.1016/j.biops ych.2011.01.030
Hutsler, J. J., & Zhang, H. (2010). Increased dendritic spine densi-ties on cortical projection neurons in autism spectrum disor-ders. Brain Research, 1309, 83–94. https://doi.org/10.1016/j.brain res.2009.09.120
Huttenlocher, P. R. (1979). Synaptic density in human frontal cortex - de-velopmental changes and effects of aging. Brain Research, 163, 195–205. https://doi.org/10.1016/0006-8993(79)90349 -4
Inta, D., Alfonso, J., von Engelhardt, J., Kreuzberg, M. M., Meyer, A. H., van Hooft, J. A., & Monyer, H. (2008). Neurogenesis and widespread forebrain migration of distinct GABAergic neurons from the post-natal subventricular zone. Proceedings of the National Academy of Sciences of the United States of America, 105, 20994–20999. https://doi.org/10.1073/pnas.08070 59105
Ishii, K., Kubo, K. I., & Nakajima, K. (2016). Reelin and neuropsychiat-ric disorders. Frontiers in Cellular Neuroscience, 10, 229. https://doi.org/10.3389/fncel.2016.00229
Johnson, M. B., & Stevens, B. (2018). Pruning hypothesis comes of age. Nature, 554, 438–439. https://doi.org/10.1038/d4158 6-018-02053 -7
Johnson, S. A., Lampert-Etchells, M., Pasinetti, G. M., Rozovsky, I., & Finch, C. E. (1992). Complement mRNA in the mammalian brain: Responses to Alzheimer's disease and experimental brain lesioning. Neurobiology of Aging, 13, 641–648. https://doi.org/10.1016/0197-4580(92)90086 -D
Keshavan, M. S., Anderson, S., & Pettegrew, J. W. (1994). Is schizophre-nia due to excessive synaptic pruning in the prefrontal cortex? The Feinberg hypothesis revisited. Journal of Psychiatric Research, 28, 239–265. https://doi.org/10.1016/0022-3956(94)90009 -4
Kim, H. J., Cho, M. H., Shim, W. H., Kim, J. K., Jeon, E. Y., Kim, D. H., & Yoon, S. Y. (2017). Deficient autophagy in microglia impairs synaptic pruning and causes social behavioral defects. Molecular Psychiatry, 22, 1576–1584. https://doi.org/10.1038/mp.2016.103
Knickmeyer, R. C., Gouttard, S., Kang, C., Evans, D., Wilber, K., Smith, J. K., Hamer, R. M., Lin, W., Gerig, G., & Gilmore, J. H. (2008). A struc-tural MRI study of human brain development from birth to 2 years. Journal of Neuroscience, 28, 12176–12182. https://doi.org/10.1523/JNEUR OSCI.3479-08.2008
Kolluri, N., Sun, Z., Sampson, A. R., & Lewis, D. A. (2005). Lamina-specific reductions in dendritic spine density in the prefrontal cortex of sub-jects with schizophrenia. American Journal of Psychiatry, 162, 1200–1202. https://doi.org/10.1176/appi.ajp.162.6.1200
Konopaske, G. T., Lange, N., Coyle, J. T., & Benes, F. M. (2014). Prefrontal cortical dendritic spine pathology in schizophrenia and bipolar disor-der. JAMA Psychiatry, 71, 1323–1331. https://doi.org/10.1001/jamap sychi atry.2014.1582
Lesavre, P. H., & Muller-Eberhard, H. J. (1978). Mechanism of action of factor D of the alternative complement pathway. Journal of Experimental Medicine, 148, 1498–1509. https://doi.org/10.1084/jem.148.6.1498
Leung, M., Cheung, C., Yu, K., Yip, B., Sham, P., Li, Q., Chua, S., & McAlonan, G. (2011). Gray matter in first-episode schizophre-nia before and after antipsychotic drug treatment. Anatomical likelihood estimation meta-analyses with sample size weighting. Schizophrenia Bulletin, 37, 199–211. https://doi.org/10.1093/schbu l/sbp099
Levi-Strauss, M., & Mallat, M. (1987). Primary cultures of murine astro-cytes produce C3 and factor B, two components of the alternative pathway of complement activation. The Journal of Immunology, 139, 2361–2366.
Levy, R., & Goldman-Rakic, P. S. (2000). Segregation of working memory functions within the dorsolateral prefrontal cortex. Experimental Brain Research, 133, 23–32. https://doi.org/10.1007/s0022 10000397
Liu, W., Liu, F., Xu, X., & Bai, Y. (2017). Replicated association between the European GWAS locus rs10503253 at CSMD1 and schizophrenia in Asian population. Neuroscience Letters, 647, 122–128. https://doi.org/10.1016/j.neulet.2017.03.039
Lyall, A. E., Shi, F., Geng, X., Woolson, S., Li, G., Wang, L., Hamer, R. M., Shen, D., & Gilmore, J. H. (2015). Dynamic development of regional cortical thickness and surface area in early childhood. Cerebral Cortex, 25, 2204–2212. https://doi.org/10.1093/cerco r/bhu027
| 13SAGER Et Al.
Ma, Y., Ramachandran, A., Ford, N., Parada, I., & Prince, D. A. (2013). Remodeling of dendrites and spines in the C1q knockout model of genetic epilepsy. Epilepsia, 54, 1232–1239.
Nardone, S., Sams, D. S., Reuveni, E., Getselter, D., Oron, O., Karpuj, M., & Elliott, E. (2014). DNA methylation analysis of the autistic brain reveals multiple dysregulated biological pathways. Translational Psychiatry, 4, e433. https://doi.org/10.1038/tp.2014.70
Neniskyte, U., & Gross, C. T. (2017). Errant gardeners: Glial-cell-dependent synaptic pruning and neurodevelopmental disorders. Nature Reviews Neuroscience, 18, 658–670. https://doi.org/10.1038/nrn.2017.110
Newman, S. L., Musson, R. A., & Henson, P. M. (1980). Development of functional complement receptors during in vitro maturation of human monocytes into macrophages. The Journal of Immunology, 125, 2236–2244.
Ozonoff, S., Heung, K., Byrd, R., Hansen, R., & Hertz-Picciotto, I. (2008). The onset of autism: Patterns of symptom emergence in the first years of life. Autism Research, 1, 320–328. https://doi.org/10.1002/aur.53
Paolicelli, R. C., Bolasco, G., Pagani, F., Maggi, L., Scianni, M., Panzanelli, P., Giustetto, M., Ferreira, T. A., Guiducci, E., Dumas, L., Ragozzino, D., & Gross, C. T. (2011). Synaptic pruning by microglia is necessary for normal brain development. Science, 333, 1456–1458. https://doi.org/10.1126/scien ce.1202529
Petanjek, Z., Judas, M., Simic, G., Rasin, M. R., Uylings, H. B., Rakic, P., & Kostovic, I. (2011). Extraordinary neoteny of synaptic spines in the human prefrontal cortex. Proceedings of the National Academy of Sciences of the United States of America, 108, 13281–13286. https://doi.org/10.1073/pnas.11051 08108
Reif, A., Fritzen, S., Finger, M., Strobel, A., Lauer, M., Schmitt, A., & Lesch, K. P. (2006). Neural stem cell proliferation is decreased in schizo-phrenia, but not in depression. Molecular Psychiatry, 11, 514–522. https://doi.org/10.1038/sj.mp.4001791
Represa, A. (2019). Why malformations of cortical development cause epilepsy. Frontiers in Neuroscience, 13, 250. https://doi.org/10.3389/fnins.2019.00250
Sacco, R., Gabriele, S., & Persico, A. M. (2015). Head circumference and brain size in autism spectrum disorder: A systematic review and meta-analysis. Psychiatry Research, 234, 239–251. https://doi.org/10.1016/j.pscyc hresns.2015.08.016
Sanai, N., Nguyen, T., Ihrie, R. A., Mirzadeh, Z., Tsai, H.-H., Wong, M., Gupta, N., Berger, M. S., Huang, E., Garcia-Verdugo, J.-M., Rowitch, D. H., & Alvarez-Buylla, A. (2011). Corridors of migrating neurons in the human brain and their decline during infancy. Nature, 478, 382–386. https://doi.org/10.1038/natur e10487
Sasaki, T., Oga, T., Nakagaki, K., Sakai, K., Sumida, K., Hoshino, K., Miyawaki, I., Saito, K., Suto, F., & Ichinohe, N. (2014). Developmental expression profiles of axon guidance signaling and the immune system in the marmoset cortex: Potential molecular mechanisms of pruning of dendritic spines during primate synapse forma-tion in late infancy and prepuberty (I). Biochemical and Biophysical Research Communications, 444, 302–306. https://doi.org/10.1016/j.bbrc.2014.01.024
Schafer, D. P., Lehrman, E. K., Kautzman, A. G., Koyama, R., Mardinly, A. R., Yamasaki, R., Ransohoff, R. M., Greenberg, M. E., Barres, B. A., & Stevens, B. (2012). Microglia sculpt postnatal neural circuits in an activity and complement-dependent manner. Neuron, 74, 691–705. https://doi.org/10.1016/j.neuron.2012.03.026
Schiela, B., Bernklau, S., Malekshahi, Z., Deutschmann, D., Koske, I., Banki, Z., Thielens, N. M., Würzner, R., Speth, C., Weiss, G., Stiasny, K., Steinmann, E., & Stoiber, H. (2018). Active human complement reduces the Zika virus load via formation of the membrane-attack complex. Frontiers in Immunology, 9, 2177. https://doi.org/10.3389/fimmu.2018.02177
Scott-Hewitt, N., Perrucci, F., Morini, R. et al (2020). Local externaliza-tion of phosphatidylserine mediates developmental synaptic pruning by microglia. EMBO Journal, 39, e105380.
Sekar, A., Bialas, A. R., de Rivera, H., Davis, A., Hammond, T. R., Kamitaki, N., Tooley, K., Presumey, J., Baum, M., Van Doren, V., Genovese, G., Rose, S. A., Handsaker, R. E., Daly, M. J., Carroll, M. C., Stevens, B., & McCarroll, S. A. (2016). Schizophrenia risk from complex variation of complement component 4. Nature, 530, 177–183. https://doi.org/10.1038/natur e16549
Shen, Y., Li, R., McGeer, E. G., & McGeer, P. L. (1997). Neuronal ex-pression of mRNAs for complement proteins of the classical path-way in Alzheimer brain. Brain Research, 769, 391–395. https://doi.org/10.1016/S0006 -8993(97)00850 -0
Sorrells, S. F., Paredes, M. F., Cebrian-Silla, A., Sandoval, K., Qi, D., Kelley, K. W., James, D., Mayer, S., Chang, J., Auguste, K. I., Chang, E. F., Gutierrez, A. J., Kriegstein, A. R., Mathern, G. W., Oldham, M. C., Huang, E. J., Garcia-Verdugo, J. M., Yang, Z., & Alvarez-Buylla, A. (2018). Human hippocampal neurogenesis drops sharply in children to undetectable levels in adults. Nature, 555, 377–381. https://doi.org/10.1038/natur e25975
Stephan, A. H., Barres, B. A., & Stevens, B. (2012). The complement sys-tem: An unexpected role in synaptic pruning during development and disease. Annual Review of Neuroscience, 35, 369–389. https://doi.org/10.1146/annur ev-neuro -06101 0-113810
Stevens, B., Allen, N. J., Vazquez, L. E., Howell, G. R., Christopherson, K. S., Nouri, N., Micheva, K. D., Mehalow, A. K., Huberman, A. D., Stafford, B., Sher, A., Litke, A. M., Lambris, J. D., Smith, S. J., John, S. W. M., & Barres, B. A. (2007). The classical complement cascade mediates CNS synapse elimination. Cell, 131, 1164–1178. https://doi.org/10.1016/j.cell.2007.10.036
Strohmeyer, R., Shen, Y., & Rogers, J. (2000). Detection of complement alternative pathway mRNA and proteins in the Alzheimer's disease brain. Molecular Brain Research, 81, 7–18. https://doi.org/10.1016/S0169 -328X(00)00149 -2
Tanji, J., & Hoshi, E. (2001). Behavioral planning in the prefrontal cor-tex. Current Opinion in Neurobiology, 11, 164–170. https://doi.org/10.1016/S0959 -4388(00)00192 -6
Thomas, M. S., Davis, R., Karmiloff-Smith, A., Knowland, V. C., & Charman, T. (2016). The over-pruning hypothesis of autism. Developmental Science, 19, 284–305. https://doi.org/10.1111/desc.12303
Tomarken, A. J., & Serlin, R. C. (1986). Comparison of ANOVA al-ternatives under variance heterogeneity and specific noncen-trality structures. Psychological Bulletin, 99, 90–99. https://doi.org/10.1037/0033-2909.99.1.90
Walker, D. G., Kim, S. U., & McGeer, P. L. (1995). Complement and cyto-kine gene expression in cultured microglial derived from postmortem human brains. Journal of Neuroscience Research, 40, 478–493.
Walker, D. G., & McGeer, P. L. (1992). Complement gene expression in human brain: Comparison between normal and Alzheimer dis-ease cases. Molecular Brain Research, 14, 109–116. https://doi.org/10.1016/0169-328X(92)90017 -6
Walker, D. G., & McGeer, P. L. (1993). Complement gene expres-sion in neuroblastoma and astrocytoma cell lines of human origin. Neuroscience Letters, 157, 99–102. https://doi.org/10.1016/0304-3940(93)90652 -2
Webster, M. J., Elashoff, M., & Weickert, C. S. (2011). Molecular evidence that cortical synaptic growth predominates during the first decade of life in humans. International Journal of Developmental Neuroscience, 29, 225–236. https://doi.org/10.1016/j.ijdev neu.2010.09.006
Weickert, C. S., Hyde, T. M., Lipska, B. K., Herman, M. M., Weinberger, D. R., & Kleinman, J. E. (2003). Reduced brain-derived neurotrophic factor in prefrontal cortex of patients with schizophrenia. Molecular Psychiatry, 8, 592–610. https://doi.org/10.1038/sj.mp.4001308
Welch, B. L. (1951). On the comparison of several mean values: An alter-native approach. Biometrika, 38, 330–336. https://doi.org/10.1093/biome t/38.3-4.330
Willems, E., Alkema, W., Keizer-Garritsen, J., Suppers, A., van der Flier, M., Philipsen, R. H. L. A., van den Heuvel, L. P., Volokhina, E., van der
14 | SAGER Et Al.
Molen, R. G., Herberg, J. A., Levin, M., Wright, V. J., Ahout, I. M. L., Ferwerda, G., Emonts, M., Boeddha, N. P., Rivero-Calle, I., Torres, F. M., Wessels, H. J. C. T., … de Jonge, M. I. (2019). Biosynthetic homeo-stasis and resilience of the complement system in health and infec-tious disease. EBioMedicine, 45, 303–313. https://doi.org/10.1016/j.ebiom.2019.06.008
Yang, Y., Fung, S. J., Rothwell, A., Tianmei, S., & Weickert, C. S. (2011). Increased interstitial white matter neuron density in the dorsolateral prefrontal cortex of people with schizophrenia. Biological Psychiatry, 69, 63–70. https://doi.org/10.1016/j.biops ych.2010.08.020
Zhou, Y. D., Zhang, D., Ozkaynak, E., Wang, X., Kasper, E. M., Leguern, E., Baulac, S., & Anderson, M. P. (2012). Epilepsy gene LGI1 regulates postnatal developmental remodeling of retinogeniculate synapses. Journal of Neuroscience, 32, 903–910. https://doi.org/10.1523/JNEUR OSCI.5191-11.2012
Zipursky, R. B., Lim, K. O., Sullivan, E. V., Brown, B. W., & Pfefferbaum, A. (1992). Widespread cerebral gray matter volume deficits in
schizophrenia. Archives of General Psychiatry, 49, 195–205. https://doi.org/10.1001/archp syc.1992.01820 03002 7004
SUPPORTING INFORMATIONAdditional supporting information may be found online in the Supporting Information section.
How to cite this article: Sager RE, Walker AK, Middleton F, Robinson K, Webster MJ, Weickert CS. Trajectory of change in brain complement factors from neonatal to young adult humans. J Neurochem. 2020;00:1–14. https://doi.org/10.1111/jnc.15241