Embed Size (px)
Citation preview
Transaction Records, Impersonal Exchange, and Division of Labor
Sudipta Basu1, Marcus Kirk
2, Greg Waymire
2*
1. Fox School of Business, Temple University, Philadelphia, PA 19122 USA
2. Goizueta Business School, Emory University, Atlanta, GA 30322, USA
Draft as of February 24, 2009
Abstract
Adam Smith hypothesized that impersonal exchange was necessary for a society to develop specialized
division of labor and create wealth. Douglass North and Vernon Smith argue that successful developed
economies are the result of institutions. We hypothesize and provide evidence from ethnographic data that
the basic accounting technology of recording transactions is associated with more extensive impersonal
exchange and increased specialization in the division of labor. Our intuition is that extensive impersonal
exchange requires reliable memory of trading partners’ past behavior to sustain trust and encourage
reciprocity when a group expands beyond the size of traditional hunter-gatherer groups. Our findings are
consistent with the hypothesis that transaction records are necessary for the emergence of complex
economies as suggested by the archaeological evidence of recordkeeping in Mesopotamian societies
10,000 years ago.
Keywords: Extent of market, accounting history, economic development.
*Contact information: Tel.: +1-404-727-6589; fax: +1-404-727-6313
Email address: [email protected]
We acknowledge helpful comments received from Mark Kohlbeck, Eric Press, Richard Sansing, Denise
Schmandt-Besserat, participants in the Emory University Anthropology Department Workshop Series on
Human Behavior and Evolution, the 2007 University of Oklahoma Accounting Research Conference, the
Fifth Accounting History International Conference, the 2008 FARS Midyear Meeting, the 2008 Annual
Meeting of the International Society for New Institutional Economics, the 2008 Annual Meeting of the
American Accounting Association, and accounting seminars at Arizona State, Chicago, Florida,
Minnesota, Northwestern, Southern California, Temple, and Wisconsin. The Goizueta Business School at
Emory University provided financial support for this research. This paper previously circulated under the
title “Recordkeeping and Economic Development.”
1
Human economies vary considerably in scale, complexity, and performance; some generate great
wealth while others remain mired in poverty. Adam Smith (1776/1976, Part I, Chapter II) argued that the
growth of economies derived from extensive impersonal exchange, which grew out of a human
“propensity to truck, barter, and exchange one thing for another.” Humans sustain cooperation better than
other primate species in part because we can remember and communicate information about the
cooperative acts of others, which is a prerequisite for reciprocity and reputation formation (Axelrod and
Hamilton 1981; Nowak and Sigmund 2005). At the same time, the evolved proclivities and abilities of the
brain that favor exchange and cooperation can account for human groups only up to a size of about 200
persons (Dunbar 1992). What role did the institution of recordkeeping play in allowing some economies
to circumvent the biological constraints of memory to expand impersonal exchange and produce great
wealth?
The institutions societies use to govern economic and social interaction have been suggested as
necessary for economic development (North 2005; Smith 2008).1 These institutions include legal codes
that support property rights and money that relaxes constraints inherent to barter exchange, both of which
date back thousands of years (Saggs 1989, 156-175; Redish 2003). Recordkeeping for exchange
transactions is an even older institution found in the first human settlements of Mesopotamia circa 8000
BCE (Schmandt-Besserat 1992). Humans first invented writing to keep records (Nissen et al. 1993),
which coincided in time (c. 3000 BCE) with the emergence of the first cities, underscoring the central
importance of transaction records.
Today’s accounting standards require widespread use of fair value accounting, which eschews
accounting values established through past “arms length” exchange for estimates of a price that would
hypothetically prevail if the same transaction were consummated today (FASB 2006). Debates about fair
1 We use “institution” in the broad sense of Douglass North (1991, 97): “Institutions are the humanly devised
constraints that structure political, economic and social interaction. They consist of both informal constraints
(sanctions, taboos, customs, traditions, and codes of conduct) and formal rules (constitutions, laws, property rights).
Throughout history, institutions have been devised by human beings to create order and reduce uncertainty in
exchange … They evolve incrementally, connecting the past with the present and the future; history in consequence
is largely a story of institutional evolution in which the historical performance of economies can only be understood
as part of a sequential story.”

2
value accounting have focused on the usefulness and reliability of fair value estimates, but have not
considered what information is lost when the historical record of consummated exchange is discarded.
This is an important issue since, in the absence of any theory and evidence about why humans recorded
economic transactions in the first place, there is little scientific basis for asserting that price estimates in
hypothetical transactions provide “better” information that is superior to that acquired from previously
consummated exchanges.
Basu and Waymire (2006) hypothesize that transaction records emerge to symbolically represent
the history of exchange in a more permanent manner external to the human brain. External records lessen
the chances of individual memory failure and are valuable in tracking a trading partner’s past behavior as
a basis for current decisions. Records can also establish reliable social memory and common knowledge
useful to two or more parties in structuring an exchange. For example, “hard” records that are verified by
witnesses can make it “difficult for people to disagree” later about whether past promises have been
fulfilled (Ijiri 1975, 36). As recordkeeping evolves to encode more information, it enables drafting and
enforcing contracts that govern complex exchange transactions across time and geographical boundaries –
e.g., reliable records are needed in establishing the property rights that facilitate modern capitalism (De
Soto 2000).
Basu and Waymire (2006) predict that (1) recordkeeping emerges because increasing exchange
complexity taxes the brain’s memory resources, and (2) accounting records work in tandem with other
fundamental institutions to promote economic development. These predictions can be investigated in
several complementary ways. One is to conduct experiments using neuroscientific methods to investigate
whether the human brain’s evaluation of exchange parallels culturally evolved accounting practices
(Dickhaut et al. 2009a; 2009b). A second avenue is to investigate whether the causal links inherent in the
Basu and Waymire (2006) story are observed in a controlled experimental setting (Basu et al. 2009).
Another possibility, which we explore in this paper, is to use naturally occurring data to see whether
institutional and economic development is greater in those societies that have developed technologies for
recording transactions.
3
We present evidence on whether the association between recordkeeping technology and societal
size and complexity in ancient Mesopotamia generalizes to other human societies, and how strongly the
prevalence of recordkeeping is associated with the presence of other fundamental economic institutions.
We explore these issues using field data collected by ethnographers and archaeologists from a broad
cross-section of human societies, and subsequently coded into machine-readable data by Murdock and
White (1969). Murdock and White’s Standard Cross-Cultural Sample (SCCS) provides extensive coded
data for a variety of cultural variables – presently over 2,000 – for 186 societies selected to maximize the
cross-society independence of observations. SCCS societies are “pinpointed” to specific dates that vary
across societies. The SCCS data include a variable that measures a society’s recordkeeping technology as
well as numerous measures of economic, social, and institutional development.
We use the SCCS data to empirically evaluate whether recordkeeping is a necessary institution
for unleashing the economic forces of impersonal exchange and division of labor hypothesized by Adam
Smith to be the ultimate source of economic wealth. We document that recordkeeping use and
sophistication is greater in societies that have surpassed the modest levels suggested by Dunbar (1992),
and also that recordkeeping is present as early as or earlier in economic development than other basic
institutions such as money, property rights, hierarchical organizations, a judiciary, and the use of credit.
This evidence suggests that basic accounting institutions are a precursor to rather than a result of
economic complexity. Our analyses also demonstrate that the extent of impersonal exchange is positively
associated with the use of recordkeeping, and that specialized division of labor and the level of capital
accumulation are more extensive in societies with greater opportunities for market exchange.
Collectively, our findings are consistent with the hypothesis that basic accounting institutions are
necessary to foster the extensive impersonal exchange and complex economic interactions that
characterize modern developed economies.
Our analysis complements other recent studies on the origins and consequences of basic
accounting institutions (Basu and Waymire, 2006). First, Dickhaut et al. (2009a, 2009b) review the
neuroscientific evidence for the proposition that the antecedent conditions of accounting records are
4
mental operations that parallel subsequent culturally evolved accounting principles. Second, Basu et al.
(2009) show experimentally that people start recording transactions when their brains are “taxed” by
increasing exchange complexity, and that these external records alleviate within-brain constraints to
increase reciprocity and trust in exchanges between strangers. These parallel studies provide evidence for
the causal relations that we argue generate our cross-societal associations. These papers, along with the
evidence we report, collectively suggest that verifiable historical transaction records play a foundational
role in the development of market economies.
As with all studies, ours is subject to important caveats. Because we examine naturally occurring
data that are subject to measurement error and do not directly measure intertemporal change in
economies, our analysis does not speak directly to causality in the relations between recordkeeping,
exchange, and economic development. Thus, our paper is an attempt to investigate whether the
experimental evidence presented in Basu, et al. (2009) is consistent with cross-cultural statistical
associations between recordkeeping and patterns of economic interaction observed in societies at early
stages of their development.
We first discuss the history of recordkeeping and describe how recordkeeping systems vary
across the SCCS societies. We then present our hypotheses. We next offer evidence on the emergence of
recordkeeping in the course of social and economic development. Following that, we present evidence on
the association between recordkeeping, impersonal exchange, and the division of labor. Conclusions from
and implications of our findings are summarized in the paper’s final section.
I. The History of Transaction Records and Recordkeeping in SCCS Societies
A. Historical Background on the Origins and Nature of Transaction Records
Eric Kohler’s (1952, 356) A Dictionary for Accountants defines a “record” as “A book or
document containing or evidencing some or all of the activities of an enterprise or containing or
supporting a transaction, entry, or account.” Examples include “a book of account; subsidiary ledger;
invoice; voucher; contract; correspondence; internal report; minute book.” This definition and examples
5
evoke images of a “paper trail” where writing symbolically portrays the types and quantities of goods
exchanged, the persons buying and selling the goods, and their obligations under the exchange. Implicit in
this characterization is that a written language, numbers, and a system of weights and measures already
exist that shape the specifics of a transaction record.
Yet, this assumes more than existed in the earliest recordkeeping systems. Indeed, the earliest
transaction records precede writing by thousands of years (Schmandt-Besserat, 1992). The sophistication
of records is directly tied to how well various properties of exchange goods can be categorized, described
and measured. A transaction record is merely an artifact that does not per se require written language or
the use of refined weights and measures, although such things are useful (Hutchins 1999; Schmandt-
Besserat 1999). A record is valuable because it allows a person to remember important attributes of a
transaction; two or more persons can also use a transaction record to state their common knowledge about
the nature of the transaction. Preserving exchange information on records outside the brain increases the
life of common knowledge – that is, shared understandings can be carried forward in time to a greater
extent than would be the case with the spoken word.
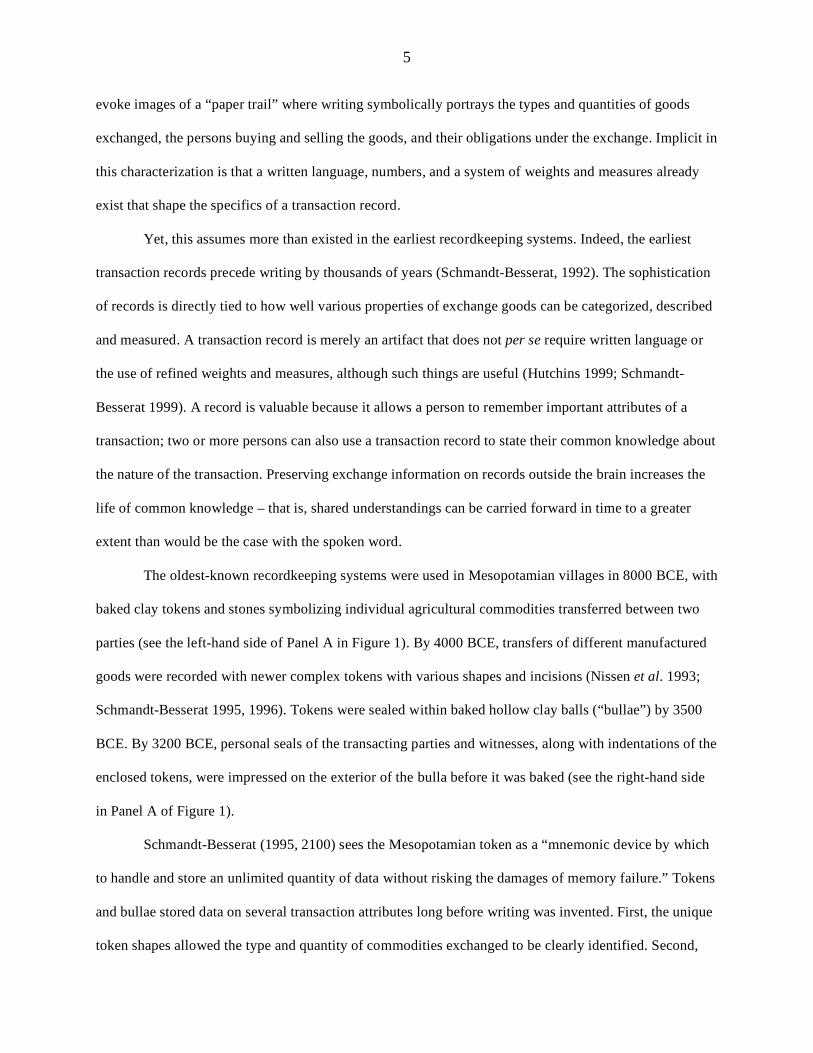
The oldest-known recordkeeping systems were used in Mesopotamian villages in 8000 BCE, with
baked clay tokens and stones symbolizing individual agricultural commodities transferred between two
parties (see the left-hand side of Panel A in Figure 1). By 4000 BCE, transfers of different manufactured
goods were recorded with newer complex tokens with various shapes and incisions (Nissen et al. 1993;
Schmandt-Besserat 1995, 1996). Tokens were sealed within baked hollow clay balls (“bullae”) by 3500
BCE. By 3200 BCE, personal seals of the transacting parties and witnesses, along with indentations of the
enclosed tokens, were impressed on the exterior of the bulla before it was baked (see the right-hand side
in Panel A of Figure 1).
Schmandt-Besserat (1995, 2100) sees the Mesopotamian token as a “mnemonic device by which
to handle and store an unlimited quantity of data without risking the damages of memory failure.” Tokens
and bullae stored data on several transaction attributes long before writing was invented. First, the unique
token shapes allowed the type and quantity of commodities exchanged to be clearly identified. Second,
6
personal seals enabled identification of the exchange parties and witnesses from the affixed “signatures”
on a bulla. Third, the external token impressions let everyone know the commodities involved without
breaking open the bulla. This was advantageous since the bulla need then be broken only at the
transaction settlement, thereby facilitating complex intertemporal exchange. Fourth, the baking of bullae
and their storage in a secure location rendered the information “hard” both literally and also
metaphorically in that it made it “difficult for people to disagree” later (Ijiri 1975, 36).
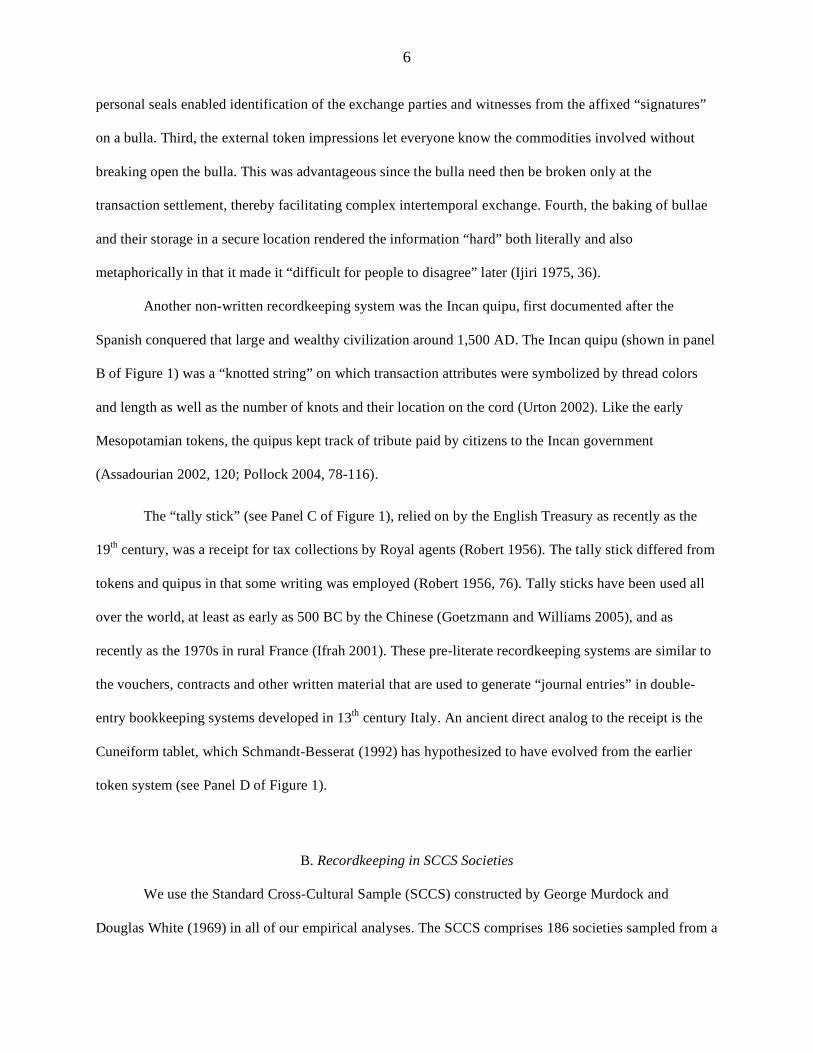
Another non-written recordkeeping system was the Incan quipu, first documented after the
Spanish conquered that large and wealthy civilization around 1,500 AD. The Incan quipu (shown in panel
B of Figure 1) was a “knotted string” on which transaction attributes were symbolized by thread colors
and length as well as the number of knots and their location on the cord (Urton 2002). Like the early
Mesopotamian tokens, the quipus kept track of tribute paid by citizens to the Incan government
(Assadourian 2002, 120; Pollock 2004, 78-116).
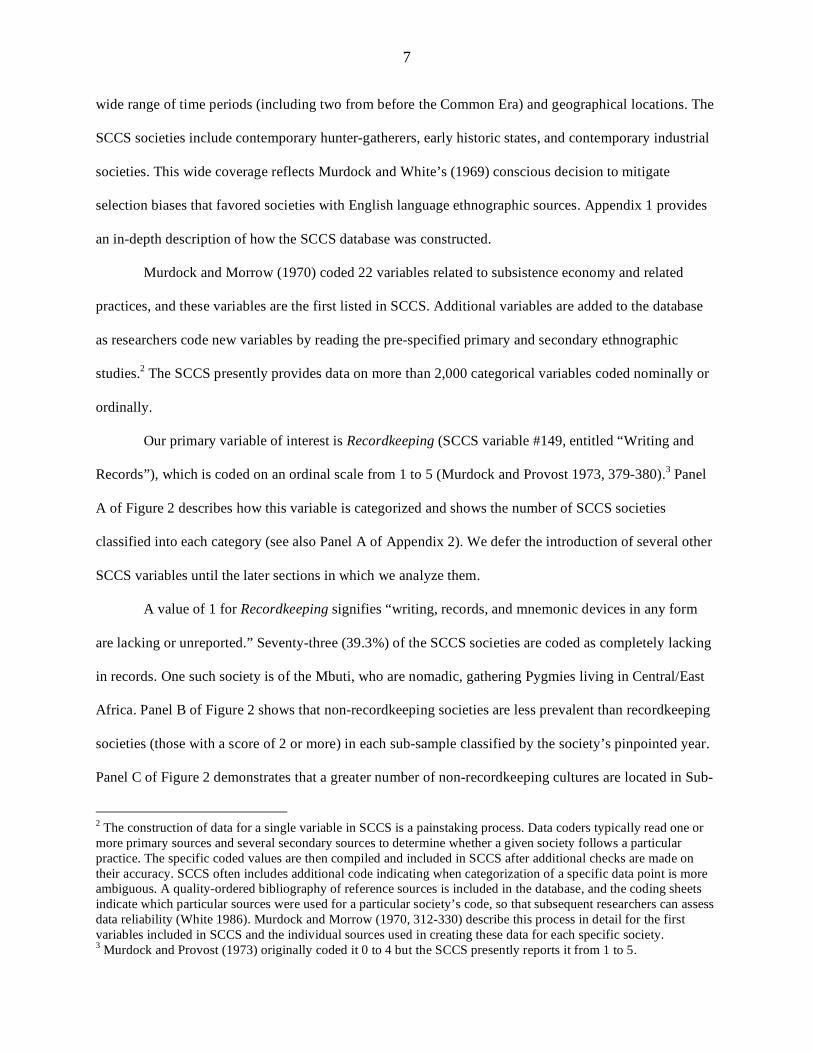
The “tally stick” (see Panel C of Figure 1), relied on by the English Treasury as recently as the
19th
century, was a receipt for tax collections by Royal agents (Robert 1956). The tally stick differed from
tokens and quipus in that some writing was employed (Robert 1956, 76). Tally sticks have been used all
over the world, at least as early as 500 BC by the Chinese (Goetzmann and Williams 2005), and as
recently as the 1970s in rural France (Ifrah 2001). These pre-literate recordkeeping systems are similar to
the vouchers, contracts and other written material that are used to generate “journal entries” in double-
entry bookkeeping systems developed in 13th
century Italy. An ancient direct analog to the receipt is the
Cuneiform tablet, which Schmandt-Besserat (1992) has hypothesized to have evolved from the earlier
token system (see Panel D of Figure 1).
B. Recordkeeping in SCCS Societies
We use the Standard Cross-Cultural Sample (SCCS) constructed by George Murdock and
Douglas White (1969) in all of our empirical analyses. The SCCS comprises 186 societies sampled from a
7
wide range of time periods (including two from before the Common Era) and geographical locations. The
SCCS societies include contemporary hunter-gatherers, early historic states, and contemporary industrial
societies. This wide coverage reflects Murdock and White’s (1969) conscious decision to mitigate
selection biases that favored societies with English language ethnographic sources. Appendix 1 provides
an in-depth description of how the SCCS database was constructed.
Murdock and Morrow (1970) coded 22 variables related to subsistence economy and related
practices, and these variables are the first listed in SCCS. Additional variables are added to the database
as researchers code new variables by reading the pre-specified primary and secondary ethnographic
studies.2 The SCCS presently provides data on more than 2,000 categorical variables coded nominally or
ordinally.
Our primary variable of interest is Recordkeeping (SCCS variable #149, entitled “Writing and
Records”), which is coded on an ordinal scale from 1 to 5 (Murdock and Provost 1973, 379-380).3 Panel
A of Figure 2 describes how this variable is categorized and shows the number of SCCS societies
classified into each category (see also Panel A of Appendix 2). We defer the introduction of several other
SCCS variables until the later sections in which we analyze them.
A value of 1 for Recordkeeping signifies “writing, records, and mnemonic devices in any form
are lacking or unreported.” Seventy-three (39.3%) of the SCCS societies are coded as completely lacking
in records. One such society is of the Mbuti, who are nomadic, gathering Pygmies living in Central/East
Africa. Panel B of Figure 2 shows that non-recordkeeping societies are less prevalent than recordkeeping
societies (those with a score of 2 or more) in each sub-sample classified by the society’s pinpointed year.
Panel C of Figure 2 demonstrates that a greater number of non-recordkeeping cultures are located in Sub-
2 The construction of data for a single variable in SCCS is a painstaking process. Data coders typically read one or
more primary sources and several secondary sources to determine whether a given society follows a particular
practice. The specific coded values are then compiled and included in SCCS after additional checks are made on
their accuracy. SCCS often includes additional code indicating when categorization of a specific data point is more
ambiguous. A quality-ordered bibliography of reference sources is included in the database, and the coding sheets
indicate which particular sources were used for a particular society’s code, so that subsequent researchers can assess
data reliability (White 1986). Murdock and Morrow (1970, 312-330) describe this process in detail for the first
variables included in SCCS and the individual sources used in creating these data for each specific society. 3 Murdock and Provost (1973) originally coded it 0 to 4 but the SCCS presently reports it from 1 to 5.
8
Saharan Africa and South America. Conversely, the frequency of cultures possessing records is highest in
the Circum-Mediterranean and Eurasia.4
The next Recordkeeping value of 2 indicates that “writing and significant records are lacking but
the people employ mnemonic devices, e.g., simple tallies.” Forty-nine SCCS societies (26.3%) are coded
as using mnemonic devices. Examples include the ancient Mesopotamian tokens, shown in Panel A of
Figure 1, or the shells used as wampum by American Indians (Schmandt-Besserat 1992; Szabo 2005). A
specific SCCS example is that of the Kapauku Papuans of New Guinea, who use shell artifacts
extensively in exchange (Pospisil 1963, 291-293 and 300-311).
A value of 3 for Recordkeeping indicates that the societies “lacks true writing but possess
significant non-written records in the form of picture writing, quipus, pictorial inscriptions, or the like.”
Twenty-one SCCS societies (11.3%) are coded as having non-written records. One of these societies is
that of the Incas, who were pinpointed in 1530 AD shortly after the Spanish invasion of the Americas.
The Incan quipu shown in Panel B of Figure 1 has long been recognized as an accounting device to record
transactions (Keister 1964; Urton 2002).
A value of 4 for Recordkeeping indicates a society that “has an indigenous system of writing but
lacks any significant accumulation of written records or alternatively has long used the script of alien
people.” Twelve SCCS societies (6.5%) fall into this category.5 The ethnographic texts on which this code
is based indicate that written records exist but provide few specifics. For example, Longrigg (1953, 21-
25) describes book production and newspapers in Kurdistan around 1900, Barth (1960, 32) notes that
marriage contracts among the Basseri were drafted by specialists in marriage rites, and Gamble (1967, 22-
6) remarks that Wolof was the commercial language in the Wolof society and that school books on this
language existed as early as 1823.
4 These findings are consistent with Diamond’s (1997) theory that useful technologies were more likely to spread
along the same latitudes in Eurasia than along the same longitudes in Africa and South America. 5 Although these societies are ranked higher than those in the Recordkeeping category 3, their order could arguably
be reversed. To reduce such ranking ambiguity, we redid all our analyses excluding all societies in Recordkeeping
category 4 and found very similar results.
9
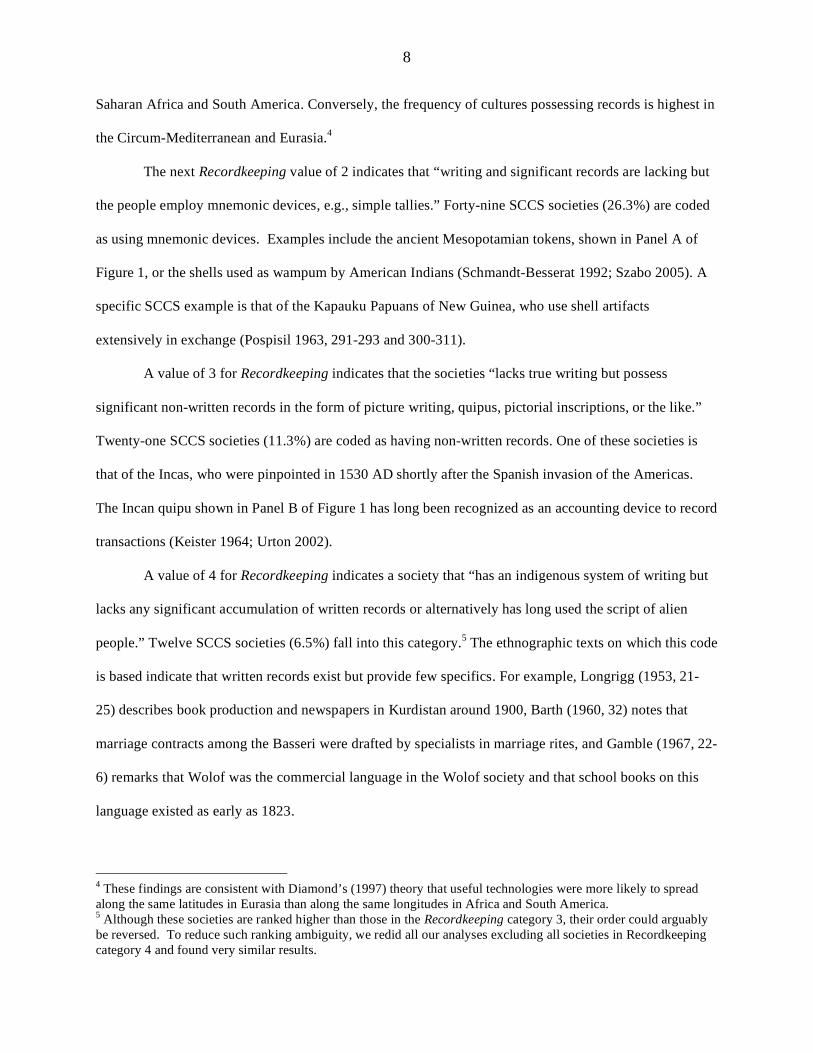
The highest category for Recordkeeping (coded as 5) applies to 31 SCCS societies (16.7%) where
the “society has an indigenous system of true writing and possess records of at least modest significance.”
This group includes the society (Babylonia) with the earliest pinpointing date (1,750 BCE) in the SCCS
sample. This date is at the end of Hammurabi’s reign as Babylonian monarch in a period when
information on transactions and contracts was regularly stored on Cuneiform clay tablets (Van De
Mieroop 2002; 2004). Panel D of Figure 1 shows an example of a Cuneiform tablet.
II. Hypotheses
The simplest accounting systems provide a historical record of economic transactions in which a
one-way transfer or bilateral exchange has occurred. Transactions generate a “paper trail” of receipts,
vouchers and contracts that can be used to verify transaction details in case of forgetfulness or subsequent
disputes.6 Transaction records are common to large-scale societies, even those that are pre-literate. The
oldest known accounting records using “tokens” appear at the same time and place (circa 8,000 BCE
Mesopotamia) as the emergence of agriculture and permanent human settlements (Schmandt-Besserat
1992). The Sumerians invented writing to keep records and accounts (circa 3,200 BCE), which occurred
at the same time as substantial increases in group size and population density in the earliest cities (Nissen
et al. 1993). Thus, accounting innovations in ancient Mesopotamia coincided with increased societal and
economic complexity, suggesting a potential causal connection.
Our focus in this paper is on whether the tight coupling between accounting advances and
economic development in the ancient Near East was unique, or a pattern that describes human societies
more generally. We are also interested in the extent to which recordkeeping expands the scope of
impersonal exchange and promotes increasingly specialized division of labor. We investigate three
hypotheses that are depicted in Figure 3. Each hypothesis is stated in the lower portion of the figure.
6 Accounting scholars have long recognized the importance of basic recordkeeping and its role in providing memory
of past exchange transactions (e.g., Hatfield 1924; Littleton 1933, 1953; Potter 1952; Ijiri 1975; Demski 1993).
10
Our first hypothesis concerns the emergence of recordkeeping as a society expands in size. We
investigate two implications of the hypothesis. First, recordkeeping is more likely to emerge once a
society has reached the size implied by mental memory constraints. Second, recordkeeping is a necessary
institution for extensive impersonal exchange. As such, recordkeeping will emerge as early as or earlier
than other economic institutions that support exchange. The arrow between the box labeled “Internal
Memory” and the box labeled “External Records” in Figure 3 depicts our first hypothesis.
Relying solely on mental memory, humans sustain greater social exchange than other primates.
This is largely because our evolved brains remember past interactions and analyze exchange opportunities
more effectively than other species (Wilson 2000; Cosmides and Tooby 2005). That is, human brains are
adapted for social exchange and cooperation that improves our prospects for resource acquisition and
survival. Within a small kin-based group, mental memory of past interactions and third-party gossip
helps actors identify trustworthy partners for a contemplated cooperative venture (Barkow 1992; Demsetz
2002). Hence, small groups have little need for external records because members can accurately track
others’ reputations even if they cannot perfectly recall the particulars of all past interactions (Silk 2004).
Keeping physical records outside the brain allows people to reliably store greater amounts of
information on past interactions and better evaluate the desirability of exchange with a specific partner
(Basu and Waymire 2006; Dickhaut et al. 2008a, 2008b). Recordkeeping expands human capacity to
“recognize other individuals and keep score” (Ridley 1996, 83), which is a prerequisite for sustaining
repeated cooperative social exchange and reciprocity (Axelrod and Hamilton 1981; Nowak and Sigmund
2005).7 This suggests that sole reliance on mental records will constrain societal expansion beyond a
modest group size.
7 An organism’s ability to recall past interactions with its environment and adjust behavior in response is of first-
order importance to its survival. This ability is important even for single cell organisms like the E. coli bacterium
(Allman 2000, 3-8).
11
The evolved human brain can sustain stable cooperative groups to an upper limit of between 125
and 200 members.8 Dunbar (2001, 181) writes:
“(T)here is indeed a characteristic group size of around 125-200 that reappears with surprising
frequency in a wide range of contemporary and Neolithic horticultural societies. These groups … all
share one crucial characteristic: they consist of a set of individuals who know one another intimately
and interact on a regular basis… Thus there seems to be quite strong evidence that at least one
component of human grouping patterns is as much determined by relative neocortex size as are
groups of other primates. We have bigger, more complexly organized groups than other species
simply because we have a larger onboard computer (the neocortex) to allow us to do the calculations
necessary to keep track of and manipulate the ever-changing world of social relationships within
which we live.”
Dunbar’s Number is the estimated limit to human group size in the absence of institutions that
store data on past economic and social interactions outside the human brain. However, transaction records
serve as an (expandable) external hard drive for the mental computer. This suggests that external
recordkeeping should become increasingly prevalent for groups that exceed 200 persons. Thus, our first
hypothesis is that the extent of recordkeeping and group size will be associated nonlinearly, with little
relation for groups of 200 or fewer persons and a positive relation for groups exceeding 200 persons.
As a group grows in size, repeated interaction with familiar partners occurs less often. In addition,
individual cooperation with members of other groups cannot rely on familiarity or repeated interaction.
Recordkeeping helps people successfully consummate impersonal exchange and it subsequently enables
the emergence of other exchange-supporting institutions that rely on hard evidence of past transactions.
For example, hard transaction records often provide a basis for establishing and enforcing property rights
subsequent to property transfers (VerSteeg 2000; de Soto 2000, 46-66). Records also provide the basis for
compiling an individual’s exchange and credit histories, either in a specific market (e.g., eBay) or more
generally with credit ratings like Moody’s. Thus, our first hypothesis implies also that recordkeeping is a
8 “Dunbar’s Number” of 125-200 persons was calculated by correlating troop size and (neocortical) brain size across
different primates such as monkey, baboons and chimpanzees, and extrapolating to expected human group size using
actual human brain size (Dunbar, 1992, 1998). Dunbar validated his predicted number by studying the historical
maximum sizes of hunter-gatherer tribes, Neolithic villages, Hutterite settlements, Roman army units, and other
human groups. Edney (1981, 27) independently estimated that “the upper limit for a simple, self-contained,
sustaining, well-functioning commons may be as low as 150 people.”
12
precursor to other exchange-supporting institutions. As such, recordkeeping is expected to appear as early
as or earlier than other exchange-supporting institutions as an economy expands.
Our second hypothesis is about how essential recordkeeping is for a market to expand and
encompass larger numbers of impersonal exchange transactions. This hypothesis is depicted by the curved
arrow in Figure 3 connecting “External Records” to “Market.” Within human families, many resource
transfers are unidirectional grants that can be motivated by love (by parents for children), fear (by low
status members of alpha males) and ignorance (not recognizing that an object is valuable) (Boulding et al.
1972).9 Most primitive human societies are extended kin groups with a norm of generalized reciprocity,
where help is expected from and is available to all group members (Sahlins 1972).
These societies begin to transcend the bounds of the immediate group through gift exchanges
with neighboring groups. Such complex interactions inevitably entail rigid norms of behavior that reduce
cheating and any resultant misinterpretation of intentions (Malinowski 1922; Mauss 1925). As a by-
product of formal gift exchange, trading in less elaborate economic goods often develops. The scope of
exchange expands to include items that are not “gifts” per se but rather are given outside the elaborate
rituals of gift exchange, with informal norms of balanced or symmetrical reciprocity in which a fair return
is expected from individual recipients in the future (Sahlins 1972). Thus, as the size of an exchange
network grows, economic interaction with less-closely-related acquaintances occurs more often.10
At some point in the recent human past, a new form of economic interaction arose in the form of
bilateral impersonal exchange or barter between strangers (Seabright 2005), with an associated norm of
negative reciprocity where each person gives up valuable things and expects to be reciprocated
immediately in a quid pro quo manner (Sahlins 1972). Basu’s et al. (2009) experimental results suggest
that recordkeeping may be crucial to this transformation towards market exchange, in that experimental
9 Over lifetimes, such one-way resource transfers likely balance out, but given high mortality rates in these groups,
there is less expectation of stable partnerships. In more egalitarian societies, transfers between spouses may have
more of an implicit exchange character than in less egalitarian cultures. Thus, we do not mean to characterize these
transfers as necessarily excluding an exchange component, but rather want to emphasize that they are not purely
exchange transactions between equals. 10
In industrialized societies, generalized reciprocity typically characterizes interactions between parents and
children, while balanced reciprocity characterizes transactions with cousins, neighbors and co-workers.
13
economies with recordkeeping exhibited stronger patterns of negative reciprocity in impersonal exchange
than non-recordkeeping economies. Thus, our second hypothesis is that recordkeeping will be associated
with more extensive and more complex exchange transactions within a given society.
Our third hypothesis is that the expanded exchange enabled by recordkeeping is associated with
increased specialization in division of labor. Adam Smith (1776/1976, 17) first articulated the relation
between exchange and division of labor in The Wealth of Nations (see also Stigler 1951):
This division of labour, from which so many advantages are derived, is not originally the effect of
any human wisdom, which foresees and intends that general opulence to which it gives occasion. It
is the necessary, though very slow and gradual, consequence of a certain propensity in human nature
which has in view no such extensive utility; the propensity to truck, barter, and exchange one thing
for another.
If this proposition is correct, then the extent of exchange will also be associated with more specialized
division of labor. We depict this hypothesis with the arrow from “Market” to “Division of Labor” in
Figure 3. If recordkeeping promotes market expansion (our second hypothesis), which in turn enables
division of labor, we can also expect a positive association between recordkeeping and division of labor
when market extent is excluded from the regression.
III. Recordkeeping Emerges as Group Size Increases
Our first hypothesis is that recordkeeping becomes more prevalent after a group reaches the
maximum size achievable under biological constraints and that recordkeeping emerges as early as or
earlier than other economic institutions. A direct test of this hypothesis requires a measure of group size
that reflects the total number of people in the group taking account of network ties with non-group
members.11
The closest proxy within SCCS for this construct is variable #63, Community Size, which is
available for all but one of the 186 SCCS societies. Community Size is only a proxy for the overall size of
a networked group since it refers to the size of a typical community (i.e., city or village) in the society
being studied (Murdock and Wilson 1972). This is an imperfect proxy to the extent that a community may
11
Group size is extensively used to measure the scale of sustained cooperation within a given species; likewise it is
used as a parsimonious measure of the scale and development of human social complexity (Chick 1997; Johnson
and Earle 2000; Wilson 2000, 131-138; Dunbar 2001).
14
have network links to individuals outside the local community. Community Size takes on eight possible
categorical values. At the lowest are societies where ethnographers estimate the typical community size to
be less than 50 persons and at the highest are communities that each consist of more than 50,000 people.
Panel B of Appendix 2 shows the various categories of Community Size.
Panel A of Figure 4 shows a plot of the frequency of each Recordkeeping score for a given level
of Community Size, where bubble sizes are proportional to frequency. A line connects the mean
Recordkeeping score for each of the eight Community Size categories. Consistent with our first
hypothesis, the association between the Recordkeeping and Community Size is positive and non-linear
with a monotonically increasing mean once Community Size reaches the level of 200 persons or more.
This relation is reliably positive and significantly different from zero (Spearman = 0.32; p < 0.01).
Visual inspection of Panel A in Figure 4 indicates that most of the SCCS societies without
recordkeeping cluster in the lower Community Size communities. However, this effect is not uniform as
14 SCCS societies containing fewer than 200 persons in the typical community also have recordkeeping
systems based on a written language (i.e., Recordkeeping = 4 or 5 and Community Size = 1, 2, or 3).
These 14 societies include some cultures where the size of the total population in the society is quite
large. For example, these SCCS societies include both Korea and Japan, which were subjected to
ethnographic study in 1947 and 1950, respectively.
To reduce the impact of measurement error in Community Size, we also estimated a more
comprehensive measure of a society’s demographics. We performed a factor analysis on four SCCS
variables: (1) Community Size, (2) Settlement Patterns (SCCS Variable #234), (3) Population Size (SCCS
Variable #1122), and (4) Population Density (SCCS Variable #1130). Settlement Patterns measures the
extent to which a society is nomadic versus sedentary, Population Size is a measure of the society’s total
size (based on census data when available), and Population Density measures the number of persons per
square mile in the society. Definitions of these variables are provided in Panel B of Appendix 2.
Panel B of Figure 4 shows results from an iterated principal factor analysis using communalities
among these four variables. A minimum Eigenvalue of one is used to choose factors for our subsequent
15
analysis. A single factor with an Eigenvalue of 2.15 explains 90% of the variation of the four variables.
Accordingly, we retain a single factor to specify a variable that we refer to as Demographics. Factor
loadings for Demographics with the four variables are shown in Panel B of Figure 4. The factor loading is
the standardized coefficient in a regression of the variable on the factor and reflects the strength of the
relationship. Population Density has the most positive factor loading while Community Size has the least
positive factor loading. The weaker association between Demographics and Community Size suggests that
important features of a society’s demographic complexity are not fully captured by Community Size.
Panel C of Figure 4 shows a plot of the frequency of each Recordkeeping score for each of eight
levels of Demographics, where again bubble sizes are proportional to frequency. To enable direct
comparison with Panel A, we rank the societies on the basis of Demographics, and then partition them
into eight sub-samples using the same number of societies in each of the eight ordered categories of
Community Size used to produce Panel A. Inspection of Panel C suggests that using Demographics in lieu
of Community Size modestly increases the strength of association between Recordkeeping and the
measure of group size (Spearman = 0.37, p < 0.01). In addition, the plotted relation between mean
Recordkeeping score and Demographics shows a generally increasing trend.
Panel D of Figure 4 shows estimates from a regression model where Recordkeeping is the
dependent variable and either Community Size or Demographics is the independent variable. The model
allows a kinked relation between Recordkeeping and the independent variable, with the kink located at
group size or complexity value equal to “4.” Intuitively, this means that we allow the relation between
Recordkeeping and Community Size to differ once groups have reached a level of Community Size greater
than or equal to 200 persons (or a comparable level of complexity based on Demographics). The results
indicate a non-linear positive relation between the extent of recordkeeping and group size. In both
models, the coefficient on the interaction between group size and a 0-1 indicator for whether the society is
“large/complex” is positive and significant (p < 0.02 for both models). This evidence suggests that, as a
society surpasses the modest group-size threshold of 200 suggested by Dunbar (1992), recordkeeping
becomes more complex.
16
A second implication of our first hypothesis is that recordkeeping emerges as early as or earlier
than other exchange-supporting institutions. We identified other exchange-supporting institutions using
SCCS variables reflecting the use of money and credit in an economy, the presence of a judiciary and
property rights, and the presence of administrative hierarchies. Money and property rights are likely
fundamental to expansion of exchange (Menger 1892; Demsetz 2002) and the demand for accounting
arises in part from the existence of complex organizations and credit markets (Kimbrough et al. 2008;
Watts and Zimmerman 1986). We use the following five variables: Credit (SCCS variable #18), Judiciary
(SCCS variable #89), Administrative Hierarchy (SCCS variable #91), Money (SCCS variable #155), and
Inheritance of Land (SCCS variable #278). These variables are defined in Panel C of Appendix 2.
Figure 5 plots the cumulative percentage of societies in which Recordkeeping or each of the other
five institutions is present, where societies are ordered by Community Size level. A specific institution is
deemed to be present if the society’s code for a given variable exceeds the minimum possible value. Each
point on a given line represents the total number of societies up to that size level where the institution is
present divided by the total number of societies with a code available for that variable.
The six SCCS variables’ cumulative frequency functions cluster into three groups referenced by
the capital letters on the right-hand side of the figure. The first cluster (labeled A) includes Recordkeeping
along with Money and Inheritance of Land. These institutions are present in approximately 60% of the
SCCS societies. The cumulative frequencies for Inheritance of Land and Money are not statistically
different from the cumulative frequency of Recordkeeping (p > 0.10 based on a z-test of proportions).
This suggests that recordkeeping is a fundamental institution that, like the use of money in exchange and
simple property rights systems, emerges early as an economy develops. That recordkeeping and money
emerge in similar fashion is likely not surprising. Economists have noted that shells and similar artifacts
can serve as money to promote exchange and that these monetary artifacts provide memory of past
exchanges (Townsend 1989; Kocherlakota 1998).12
12
Also, the tally sticks used by the British Exchequer beginning several hundred years ago evolved into bills of
exchange, which served a monetary function in exchange (Robert 1956, 80; Goetzmann & Williams 2005).
17
The other two clusters include Administrative Hierarchies and Judiciary (cluster B) and Use of
Credit (cluster C), which are present in about 45% and 33% of the SCCS societies, respectively. In each
case, the frequency of these institutions is statistically different from Recordkeeping at conventional
levels (p 0.01). These data indicate that more advanced institutions like hierarchies, courts, and the
availability of credit beyond the family are less likely to appear in the earliest stages of an economy’s
development relative to recordkeeping, money and basic property rights.
The lower part of Figure 5 shows the percentage of societies with or without recordkeeping in
which a given institution is present. Each institution is present more frequently in societies with
recordkeeping than societies without recordkeeping. Chi-square tests reject the null of independence at p
0.05 for each of the five comparisons. This pattern is consistent with institutional co-evolution where
multiple interdependent institutions emerge as a society grows in size and complexity.
Overall, the evidence in Figures 4 and 5 is consistent with the hypothesis that recordkeeping is a
foundational institution that emerges early as an economy expands. Furthermore, recordkeeping societies
are more likely to develop other exchange-supporting institutions.
IV. The Influence of Recordkeeping on Impersonal Exchange and Division of Labor
A. Recordkeeping Promotes Impersonal Exchange
We require a proxy for the extent of impersonal exchange to test our second hypothesis, which is
that recordkeeping promotes impersonal exchange. We develop a multi-attribute measure based on the
extent to which impersonal exchange takes place in the society as well as whether the society has other
institutions that support more extensive exchange. We use a broader measure of exchange because Smith
(1776/1976, 21-33) argues that the extent of the market depends on an effective infrastructure for storing
and moving goods as well as a medium of exchange.
Our measure of impersonal exchange is based on a factor analysis applied to the Money and three
other SCCS variables defined in Panel C of Appendix 2. Intercommunity Trade as a Food Source (SCCS
Variable #1) is a direct measure of impersonal exchange as reflected in a society’s food import levels.
18
Similarly, Food Storage Via Surplus (SCCS Variable #21) measures the extent to which exchange is
likely to occur as a result of food production in excess of immediate consumption needs. Land Transport
(SCCS Variable #154) reflects the extent to which a society has a transportation infrastructure necessary
to support exchange with more geographically distant areas. Money (SCCS Variable #155) was used in
our previous analyses and measures whether a medium of exchange that could support more extensive
impersonal exchange is available.
We perform a principal factor analysis using the communalities among these four variables to
extract underlying dimensions, and we used a minimum Eigenvalue of one to determine which factors to
retain. Panel A of Table 1 shows that one factor with an Eigenvalue of 1.27 accounts for 91% of the total
variance of the four SCCS variables. Thus, we retain only one factor to specify Exchange. The factor
loadings in Panel B of Table 1 show that Money is strongly associated with Exchange. Intercommunity
Trade as a Food Source, the most direct measure of exchange, and Land Transport also exert a strong
effect. Food Surplus Via Storage shows the weakest association.
We estimate the following empirical model of the relation between Recordkeeping and Exchange:
Exchangei = 0 + 1RK_Bi + 2 Large_Commi + 3RK_B*Large_Commi + 4AgPotentiali + 5Climatei +
6Regioni + i
Exchange is the factor derived from the factor analysis in Panels A and B of Table 1. RK_B is a
transformed binary version of SCCS #149 (Records and Writing) where 0 indicates recordkeeping of any
kind is absent and 1 indicates recordkeeping of any kind is present. We use a 0-1 indicator for
Recordkeeping since we expect a bi-directional causal relation between the quantity and complexity of
recordkeeping and exchange. Because Recordkeeping appears early in development (see Figure 5), we
expect that these effects (and any resultant endogeneity problems) will be lessened with use of a 0-1
variable. Large_Comm is an indicator variable that equals 0 when Community Size (SCCS #63) is less
than 200 persons and equals 1 when Community Size is greater than or equal to 200 persons. Under our
second hypothesis, we expect that 1 and 3 will be positive.

19
The model includes three control variables (defined in Panel C of Appendix 2): (1) Agricultural
Potential (SCCS #921) of the society’s region, (2) Climate (SCCS #857) is an ordinal variable reflecting
open access to rich ecological resources, and (3) Region represents a series of 0-1 variables for a society’s
location within one of six major world regions. These variables are included to capture cross-society
differences in resource endowments, which Diamond (1997) argues are prerequisites for economic
development.
The OLS models are estimated using the 182 SCCS societies where data are available for all
variables. P-values are one-tailed when a signed prediction is present and are based on heteroskedasticity-
consistent standard errors adjusted for residual correlation among observations belonging to the same
major language family.13
Estimation results are shown in Panel C of Table 1. The first column shows results for the model
when only RK_B and the control variables are included. The estimated coefficient, 1, equals 0.51, which
is significantly different from zero at p < 0.00 (one-tailed). 1 remains positive (0.26) and significant at p
< 0.02 for the full model (shown in the second column) and 3 equals .57, which is significant at p < 0.02
(one-tailed). This latter effect suggests that the presence of recordkeeping exerts a substantially larger
effect on the extent of impersonal exchange in larger societies. Results in the right-most column
demonstrate that a significant relation between recordkeeping and exchange persists when Demographics
is included as an additional control for social complexity. This evidence supports our second hypothesis
that recordkeeping supports an expansion in impersonal exchange.
13
An analysis of the SCCS data indicates that Recordkeeping is subject to stronger patterns of cultural and historical
diffusion than other SCCS variables. Each SCCS culture is assigned a number from 1 to 186 where the societies are
ordered according to geographical proximity and cultural similarity. Because societies with close geographical
proximity are likely ones where cultural diffusion may still be a prominent force, the correlation between adjacent
numbered societies within the SCCS measures the extent to which the pinpointing process did not completely
eliminate cross-sectional dependence (Murdock and White 1969). Recordkeeping displays strong correlation ( =
0.30) when comparing adjacent neighbors within the SCCS database. Thus, we estimate all models using
heteroskedasticity-consistent standard errors adjusted for residual correlation among observations belonging to the
same major language family.
20
B. The Influence of Impersonal Exchange on Division of Labor
Thus far we have seen that recordkeeping becomes more prevalent once a society has reached
modest size levels, recordkeeping emerges early relative to other basic institutions as societies grow
larger, and that the emergence of recordkeeping is associated with increased impersonal exchange. Our
final hypothesis is, consistent with Smith (1776/1976, 17), that expanded opportunities for impersonal
exchange are associated with increasingly specialized division of labor within an economy.
Testing this hypothesis requires first that we specify a measure of a society’s division of labor. As
with our tests examining market exchange, we specify a measure of division of labor using factor analysis
applied to multiple SCCS variables likely related to the underlying construct. Most SCCS societies are
heavily dependent on agriculture and depend far less on industrial manufacturing and complex services
than modern Western economies. We thus construct division of labor using measures of the extent to
which complex agriculture and other forms of occupational specialization are present in the society.
Five SCCS variables serve as inputs to a factor analysis to specify Division of Labor, as defined
in Panel D of Appendix 2. The two agricultural measures include: (1) Agriculture (SCCS variable # 151),
which takes on five possible values ranging from 1 indicating no agriculture is present to 5 indicating that
intensive agriculture provides the primary food sources for the society, and (2) Intensity of Cultivation
(SCCS variable # 232), which takes on six possible values ranging from 1 (“no agriculture”) to 6
(“intensive irrigated agriculture”). Technological Specialization (SCCS variable # 153) is a variable
reflecting whether specialist potters, loom weavers, or metalworkers are present in the society.
Administrative Hierarchy (SCCS variable #91) measures the extent to which decision-making in the
society is delegated to heads of sub-groups and Class Stratification (SCCS variable #270) measures the
extent to which social status arises from resources or power possessed by an individual or group.
Panel A of Table 2 shows that one factor with an Eigenvalue of 2.86 accounts for 81% of the total
variance of the five SCCS variables used; we therefore retain only one factor to specify Division of
Labor. Panel B of Table 2 indicates that Intensity of Cultivation and Agriculture exert more influence on
21
Division of Labor than do Technological Specialization, Administrative Hierarchy, and Class
Stratification.
We estimate a model of the relation between Division of Labor and Exchange as follows:
Division of Labori = 0 + 1 Exchangei + 3Controlsi + i
Division of Labor is the factor obtained from the analysis described in Panels A and B of Table 2 and
Exchange is the factor derived from the analysis in Panels A and B of Table 1. The model includes the
same control variables used in the regressions in Table 1: AgPotential (SCCS #921), Climate (SCCS
#857), and Region (definitions are in Appendix 2). We hypothesize that 1 will be positive. The sample
includes the 180 SCCS societies for which data for all variables are available. Models are estimated using
OLS and p-values are one-tailed and are based on heteroskedasticity-consistent standard errors adjusted
for residual correlation among observations belonging to the same major language family.
The results in Panel C of Table 2 support the hypothesis that Exchange exhibits a positive
association with Division of Labor. The coefficient on Exchange ( 1) equals .44 (p < 0.00, one-tailed),
and remains significantly positive ( 1 = .29, p < 0.00) when Community Size is used as an additional
control. The relation between Division of Labor and Exchange becomes weakly significant (p = 0.06)
when Demographics is added as a control. This is the artifact of Exchange being strongly correlated with
variables included in Demographics other than Community Size. In particular, variables capturing the
dispersion and density of a population such as Settlement Patterns (SCCS Variable #234) and Population
Density (SCCS Variable #1130) reflect the location of individuals within a society who can take
advantage of exchange opportunities. The final two columns indicate that the coefficient on RK_B is
positive and statistically significant (coefficient = 0.30, p = 0.04) when included with Exchange as an
independent variable. In contrast, RK_B is positive and highly significant when included on a stand-alone
basis (coefficient = 0.50, p < 0.00). The 40% decline from 0.50 to 0.30 for the coefficient on RK_B
suggests that the effect of Recordkeeping on Division of Labor flows partially through Exchange.
22
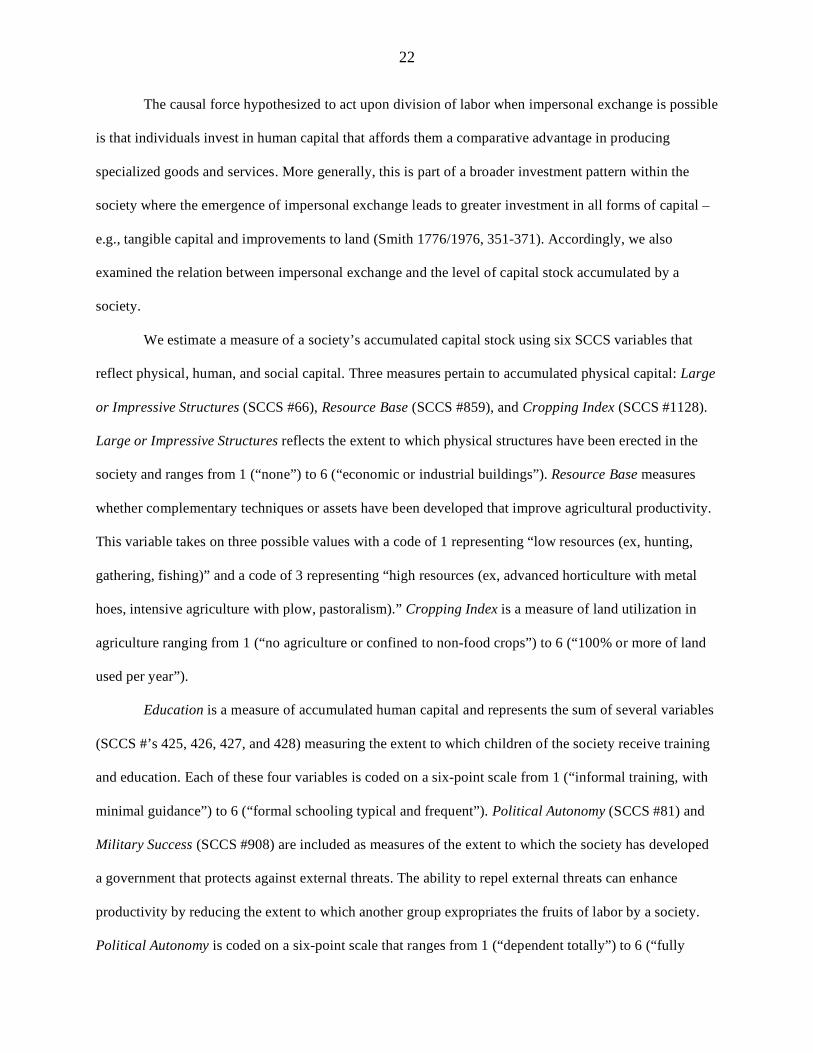
The causal force hypothesized to act upon division of labor when impersonal exchange is possible
is that individuals invest in human capital that affords them a comparative advantage in producing
specialized goods and services. More generally, this is part of a broader investment pattern within the
society where the emergence of impersonal exchange leads to greater investment in all forms of capital –
e.g., tangible capital and improvements to land (Smith 1776/1976, 351-371). Accordingly, we also
examined the relation between impersonal exchange and the level of capital stock accumulated by a
society.
We estimate a measure of a society’s accumulated capital stock using six SCCS variables that
reflect physical, human, and social capital. Three measures pertain to accumulated physical capital: Large
or Impressive Structures (SCCS #66), Resource Base (SCCS #859), and Cropping Index (SCCS #1128).
Large or Impressive Structures reflects the extent to which physical structures have been erected in the
society and ranges from 1 (“none”) to 6 (“economic or industrial buildings”). Resource Base measures
whether complementary techniques or assets have been developed that improve agricultural productivity.
This variable takes on three possible values with a code of 1 representing “low resources (ex, hunting,
gathering, fishing)” and a code of 3 representing “high resources (ex, advanced horticulture with metal
hoes, intensive agriculture with plow, pastoralism).” Cropping Index is a measure of land utilization in
agriculture ranging from 1 (“no agriculture or confined to non-food crops”) to 6 (“100% or more of land
used per year”).
Education is a measure of accumulated human capital and represents the sum of several variables
(SCCS #’s 425, 426, 427, and 428) measuring the extent to which children of the society receive training
and education. Each of these four variables is coded on a six-point scale from 1 (“informal training, with
minimal guidance”) to 6 (“formal schooling typical and frequent”). Political Autonomy (SCCS #81) and
Military Success (SCCS #908) are included as measures of the extent to which the society has developed
a government that protects against external threats. The ability to repel external threats can enhance
productivity by reducing the extent to which another group expropriates the fruits of labor by a society.
Political Autonomy is coded on a six-point scale that ranges from 1 (“dependent totally”) to 6 (“fully

23
autonomous”). Military Success is coded on a scale that ranges from 1 (“no – its boundaries/population
are shrinking”) to 4 (“yes – its boundaries/population are expanding”).
These six variables provide the inputs to a factor analysis used to identify a variable we label
Capital Stock. As before, we conduct a principal factor analysis using the communalities among these
variables, along with a minimum Eigenvalue of one to determine which factors to retain. Panel A of Table
3 shows that one factor with an Eigenvalue of 1.85 accounts for 71% of the total variance of the six SCCS
variables used to identify Capital Stock. Panel B of Table 3 shows that Cropping Index is the most
influential variable and Education, Resource Base, and Large Impressive Structures are also of
importance. The political variables, Political Autonomy and Military Success, are the least important
variables in specifying Capital Stock.
We estimate a model of the relation between Capital Stock and Exchange as follows:
Capital Stocki = 0 + Exchangei + 4 Controlsi + i
Capital Stock is the variable identified in the factor analysis in Panels A and B of table 3 and all other
variables are as previously defined for purposes of our prior analyses. Each model includes the control
variables used previously (AgPotential, Climate, and Region). Definitions of all variables are provided in
Panel E of Appendix 2. The sample used to estimate Models (3), (4), and (5) includes the 143 SCCS
societies where data for all variables are available.
The hypothesis of interest is that Capital Stock is associated with the emergence of impersonal
exchange after controlling for other factors. Thus, we expect that 1 will be positive. As with the previous
models, OLS estimation is used, p-values are one-tailed, and heteroskedasticity-consistent standard errors
adjusted for residual correlation among observations belonging to the same major language family are
used.
The evidence in Panel C supports the hypothesis that cross-society differences in Capital Stock
are associated with differences in Exchange. The first column of results indicates that the coefficient on
Exchange equals 0.56 (p < 0.00). Further, this result is highly robust. Exchange remains significant after
controlling for factors already captured by Division of Labor (see second column). The third column
24
indicates that RK_B shows no significant association with Capital Stock after controlling for Exchange
and Division of Labor. This suggests that recordkeeping’s role is one of an enabling technology that
supports expanded exchange and division of labor. The final two columns demonstrate that the relation
between Exchange and Capital Stock is not capturing purely an effect due to size and demographic
complexity.
Viewed collectively, the evidence presented in Tables 2 and 3 provides strong support for our
final hypothesis that the expansion of impersonal exchange facilitated by recordkeeping is also associated
with increasingly specialized division of labor and greater overall investment in physical, tangible, and
political capital. These results accord with prior experimental evidence that recordkeeping is associated
with greater trust (Basu et al., 2009), and that trust is associated with investment and economic growth,
both analytically and in cross-country growth regressions (Knack and Keefer, 1997; Zak and Knack,
2001). In other words, recordkeeping enables strangers to trust each other in complex inter-temporal
exchange, which then facilitates division of labor and greater productivity, which in turn enable greater
investment and even faster economic growth.
V. Conclusions and Implications
Our evidence suggests that recordkeeping is more likely in large groups that cannot sustain
cooperative interaction based solely on mental memory, and that recordkeeping, like money and
inheritance of land, emerges at relatively early stages of an economy’s development. The emergence of
recordkeeping precedes the appearance of a judiciary, administrative hierarchies and the extension of
credit, suggesting that accounting is a foundational institution. Our evidence also suggests that economies
where recordkeeping is possible are characterized by more extensive impersonal exchange. Consistent
with hypotheses by Smith (1776/1976) and Stigler (1951), we also find that the level of specialization in
division of labor and accumulated capital are strongly influenced by the extent of the market. These
findings suggest that the basic accounting function of recordkeeping is a precursor to economic
development through impersonal exchange and division of labor.
25
More broadly, our evidence is consistent with the hypothesis that transaction records external to
the human brain are necessary to extend the scale of human cooperation from small primitive groups to
large-scale modern societies characterized by extensive market exchange and complex division of labor
(Basu and Waymire 2006). Our analysis also broadly accords with conjectures offered by an earlier
generation of scholars (i.e., Sombart, Weber, Schumpeter, and von Mises) that capitalist economic
development would be impossible without accounting institutions like double-entry bookkeeping (Most
1972; Carruthers and Espeland 1991). Thus, considerably more research on how recordkeeping and more
advanced analysis of accounting’s transactional data promote economic development is warranted.
Economic development varies considerably across continents and countries (e.g. World Bank
2006), as well as within countries among different ethnic and sociolinguistic groups. Our evidence is
consistent with De Soto’s (2000) argument that accurate property records are a prerequisite for the
success of capitalistic societies. The crucial role of verifiable transaction records for legal enforcement of
property rights is explicitly indicated in legal codes ranging from the ancient Code of Hammurabi (c.
1750 BCE) through Athenian, Roman and French legal codes to the recent Sarbanes-Oxley Act of 2002
(Basu and Waymire, 2006). Thus, verifiable transaction records are a necessary part of the foundations
that lie behind the exchange-supporting institutions upon which capitalist economies have been built.
Accounting is likely an ecologically rational institution that coordinates economic interaction
through market exchange (Waymire 2009). To adapt a metaphor from Simon (1990), historical cost
accounting and today’s exchange agreements are like two blades of scissors that have become
increasingly effective together over time through co-evolution. Institutional changes such as ‘fair value’
accounting that overwrites historical records of consummated transactions may make the scissors less
effective unless a matching blade is produced.14
For instance, debt contracts and regulations rely on a set
14
Similarly, Ball (2001) argues that accounting harmonization is unlikely to produce higher quality financial reports
unless contracts and enforcement mechanisms are also changed to provide incentives for better reporting. While
Ball focuses on whether developing countries can improve their accounting quality, we worry that developed
countries are in danger of reducing their economic effectiveness.

26
of common expectations about how performance is measured, and wholesale changes to this performance
measure may entail costly “unintended consequences.”
27
References
Allman, J., 2000. Evolving Brains, New York, NY: Scientific American Library.
Assadourian, C., 2002. String registries: native accounting and memory according to the Colonial
sources, in Quilter J. and G. Urton, (eds.), Narrative Threads: Accounting and Recounting in Andean
Khipu, Austin, TX: University of Texas Press.
Axelrod, R., and W. Hamilton, 1981. The evolution of cooperation, Science 211 (4489): 1390–1396.
Ball, R., 2001. Infrastructure Requirements for an Economically Efficient System of Public Financial
Reporting and Disclosure, in R. E. Litan and R. Herring (Eds.), Brookings-Wharton Papers on
Financial Services: 2001, Washington, DC: Brookings Institute Press, 127-182.
Barkow, J., 1992. Beneath new culture is old psychology: Gossip and social stratification, in J. Barkow,
L. Cosmides, and J. Tooby (eds.), The Adapted Mind, New York, NY: Oxford University Press, 163–
228.
Barth, F., 1960. Nomads of South Persia: The Basseri Tribe of the Khamseh Confederacy, New York,
NY: Humanities Press.
Basu, S., and G. Waymire, 2006. Recordkeeping and human evolution. Accounting Horizons 20 (3): 1-29.
Basu, S., J. Dickhaut, G. Hecht, K. Towry, and G. Waymire, 2009. Recordkeeping alters economic
history by promoting reciprocity, Proceedings of the National Academy of Sciences of the USA 106
(4): 1009-1014.
Boulding, K.E., M. Pfaff, and J. Horvath, 1972. Grant economics: a simple introduction, American
Economist, 16 (1): 19-28.
Carruthers, B. and W. Espeland, 1991. Accounting for rationality: Double-entry bookkeeping and the
rhetoric of economic rationality, The American Journal of Sociology 16 (1): 31-69.
Chick, G., 1997. Cultural complexity: The concept and its measurement, Cross-Cultural Research 31 (4):
275-307.
Cosmides, L., and J. Tooby, 2005. Neurocognitive adaptations designed for social exchange, in D. M.
Buss (Ed.) Evolutionary Psychology Handbook, New York, NY: Wiley, Chapter 20.
Demsetz, H., 2002. Toward a theory of property rights II: The competition between private and collective
ownership, Journal of Legal Studies 31 (2): S653-S672.
Demski, J., 1993. Managerial Uses of Accounting Information, New York, NY: Kluwer Publishing.
De Soto, H., 2000. The Mystery of Capital: Why Capitalism Succeeds in the West and Fails Everywhere
Else, New York: Basic Books.
Diamond, J. 1997. Guns, Germs, and Steel: The Fates of Human Societies, New York, NY: W.W. Norton
& Co.
28
Dickhaut, J. W., S. Basu, K. A. McCabe, and G. B. Waymire, 2009a. NeuroAccounting, part I: The
primate brain and reciprocal exchange. Working paper, January. Available at:
http://ssrn.com/abstract=1336526
Dickhaut, J. W., S. Basu, K. A.McCabe, and G. B. Waymire, 2009b. NeuroAccounting, part II:
Consilience between accounting principles and the primate brain. Working paper, January. Available
at: http://ssrn.com/abstract=1336517
Donald, M., 1991. Origins of the Modern Mind: Three Stages in the Evolution of Culture and Cognition.
Cambridge, MA: Harvard University Press.
Dunbar, R.I.M., 1992. Neocortex size as a constraint on group size in primates, Journal of Human
Evolution, 22: 469-493.
Dunbar, R.I.M., 1998. The social brain hypothesis, Evolutionary Anthropology 6: 178-190.
Dunbar, R.I.M., 2001. Brains on two legs: Group size and the evolution of intelligence, in de Waal,
F.B.M. (ed), Tree of Origin, Cambridge, MA: Harvard University Press.
Edney, J. J., 1981. Paradoxes on the Commons: Scarcity and the Problem of Equality. Journal of
Community Psychology 9: 3-34.
Financial Accounting Standards Board (FASB), 2006. Statement of Financial Accounting Standards No.
157, Fair Value Measurements, Norwalk, CT: Financial Accounting Standards Board.
Gamble, D. P., 1967. The Wolof of Senegambia, London: International African Institute.
Goetzmann, W. N., and L. Williams, 2005. From tallies and chirographs to Franklin’s Printing Press at
Passy: The evolution of the technology of financial claims. In Goetzmann, W.N. and Rouwenhorst,
K. G. (Eds.) The Origins of Value: The Financial Innovations that Created Modern Capital Markets.
Oxford University Press: New York, NY: 105-122.
Gray, J., 1996. Is the standard cross-cultural sample biased? A simulation study. Cross-Cultural
Research 30: 301-315.
Hatfield, H., 1924. An historical defense of bookkeeping, Journal of Accountancy 37 (4): 241–253.
Hutchins, E., 1999. Cognitive artifacts. In Wilson, R. A. and Keil, F. C. (Eds.) The MIT Encyclopedia of
the Cognitive Sciences. Cambridge, MA: The MIT Press: 126-128.
Ifrah, G., 2001. The Universal History of Numbers, Wiley: New York, NY.
Ijiri, Y., 1975. Theory of Accounting Measurement: Studies in Accounting Research # 10, Sarasota, FL:
American Accounting Association.
Johnson, A., and T. Earle. 2000. The Evolution of Human Societies, Palo Alto, CA: Stanford University
Press.
Keister, O., 1964. The Incan quipu, The Accounting Review 39 (2): 414-416.
29
Kimbrough, E., V. Smith, and B. Wilson, 2008. Historical property rights, sociality, and the emergence of
impersonal exchange in long-distance trade, American Economic Review 98 (3): 1009-1039.
Kocherlakota, N., 1998. The technological role of fiat money, Federal Reserve Bank of Minneapolis
Quarterly Review 22 (3): 2-10.
Knack, S., and P. Keefer. 1997. Does social capital have an economic payoff? A cross-country
investigation, The Quarterly Journal of Economics 112 (4): 1252-1288.
Kohler, E., 1952. A Dictionary for Accountants, Englewood Cliffs, NJ: Prentice-Hall.
La Porta, R., and A. Shleifer, 2008. The unofficial economy and economic development, Brookings
Papers on Economic Activity Conference Draft, Fall.
Littleton, A. C., 1933. Accounting Evolution to 1900, New York, NY: American Institute Publishing Co.
Littleton, A. C., 1953. The Structure of Accounting Theory, Sarasota, FL: American Accounting
Association.
Longrigg, S., 1953. Iraq, 1900 to 1950: A Political, Social, and Economic History, London: Oxford
University Press.
Malinowski, B., 1922. Argonauts of the Western Pacific, London: Routledge and Kegan Paul.
Mauss, M., 1950. The Gift, London: Norton & Co. Translated by W. D. Halls, 1990.
Menger, C. 1892. On the origins of money, The Economic Journal 2 (6): 239-255.
Most, K., 1972. Sombart’s propositions revisited, The Accounting Review 47 (4): 722-34.
Murdock, G., 1968. World sampling provinces, Ethnology 7: 305-326.
Murdock, G., and D. Morrow, 1970, Subsistence economy and supportive practices: cross-cultural codes,
Ethnology 9: 302-330.
Murdock, G., and C. Provost, 1973, Measurement of cultural complexity, Ethnology 12: 379-392.
Murdock, G., and D. White, 1969. Standard cross-cultural sample, Ethnology 8: 329-69.
Murdock, G., and S. Wilson, 1972. Settlement patterns and community organization: cross-cultural codes
3, Ethnology 11 (3): 254-295.
Nissen, H. J., P. Damerow, and R.K. Englund, 1993. Archaic Bookkeeping: Writing and Techniques of
Economic Administration in the Ancient Near East. Translated by Paul Larsen, Chicago, IL:
University of Chicago Press.
North, D., 1991. Institutions, Journal of Economic Perspectives 5 (1): 97-112.
North, D., 2005. Understanding the Process of Economic Change, Princeton, NJ: Princeton University
Press.
30
Nowak, M. and K. Sigmund, 2005. Evolution of indirect reciprocity, Nature 437 (7063): 1291-1298,
October 27.
Pollock, S., 2004. Ancient Mesopotamia, Cambridge, UK: Cambridge University Press.
Pospisil, L., 1963. Kapauku Papuan Economy, New Haven, CT: Yale University Publications in
Anthropology #67 (Reprinted 1972 by Human Relations Area Files Press, New Haven, CT, 1972).
Potter, C., 1952. Initial development of accountancy, Canadian Chartered Accountant (January),
reprinted in Readings in Accounting Development, 1978, New York, NY: Arno Press.
Redish, A., 2003. Money and coinage, in Mokyr, J. (ed.), The Oxford Encyclopedia of Economic History,
Volume 3, Oxford, UK: Oxford University Press.
Ridley, M., 1996. The Origins of Virtue, New York, NY and London: Penguin Books.
Robert, R., 1956, A short history of tallies, in Littleton, A.C. and B. Yamey (eds.), Studies in the History
of Accounting, London, UK: Sweet & Maxwell.
Saggs, H. W. F., 1989. Civilization Before Greece and Rome, New Haven, CT: Yale University Press.
Sahlins, M., 1972. Stone Age Economics, New York, NY: Aldine De Gruyter.
Schmandt-Besserat, D., 1992. Before Writing, Vol. 1, Austin, TX: Univ. of Texas Press.
Schmandt-Besserat, D., 1995. Record keeping before writing,” pp. 2097–2106 in Civilizations of the
Ancient Near East, Vol. 4, Jack Sasson (ed.), New York: Scribner.
Schmandt-Besserat, D., 1996. How Writing Came About, University of Texas Press, Austin, TX.
Schmandt-Besserat 1999. Artifacts and civilization, in Wilson, R. A. and Keil, F. C. (Eds.) The MIT
Encyclopedia of the Cognitive Sciences. Cambridge, MA: The MIT Press. pp. 35-37.
Seabright, P., 2004. The Company of Strangers: A Natural History of Economic Life, Princeton, NJ:
Princeton University Press.
Silk, J. 2004. Cooperation without counting: The puzzle of friendship, chapter 3 in Hammerstein, P. (ed.)
Genetic and Cultural Evolution of Cooperation, Cambridge, MA: MIT Press, 37-54.
Simon, H. A. 1990. Invariants of human behavior, Annual Review of Psychology 41 (1), 1-19.
Smith, A., 1776. The Wealth of Nations, Chicago, IL: University of Chicago Press (Reprinted 1976).
Smith, V., 2008. Rationality in Economics: Constructivist and Ecological Forms, Cambridge, UK:
Cambridge University Press.
Stigler, G., 1951. The division of labor is limited by the extent of the market, Journal of Political
Economy 59 (3): 185-193.
Szabo, N., 2005. Shelling out – The origins of money, Copyright by N. Szabo, available online at
http://szabo.best.vwh.net/shell.html.
31
Townsend, R., 1989. Currency and credit in a private information economy, Journal of Political Economy
97 (6): 1323-1344.
Urton, G., 2002. An overview of Spanish Colonial commentary on Andean knotted string records, in
Quilter J. and G. Urton, (eds.), Narrative Threads: Accounting and Recounting in Andean Khipu,
Austin, TX: University of Texas Press.
Van De Mieroop, M., 2002. Credit as a facilitator of exchange in Old Babylonian Mesopotamia, in
Hudson M. and C. Wunsch, (eds.), Debt and Economic Renewal in the Ancient Near East, Volume 3
of the International Scholars Conference on Ancient Near Eastern Economies, Bethesda, MD: CDL
Press.
Van De Mieroop, M., 2004. A History of the Ancient Near East, Oxford, UK: Blackwell Publishing.
VerSteeg, R., 2000. Early Mesopotamian Law, Durham, NC: Carolina Academic Press.
Watts, R., and J. Zimmerman. 1986. Positive Accounting Theory. Prentice-Hall: Englewood Cliffs, NJ.
Waymire, G., 2009. Exchange guidance is the fundamental demand for accounting. The Accounting
Review 84 (1): 53-62.
White, D. R, 1986. Ethnographic bibliography for the Standard Cross-Cultural Sample. World Cultures 2
(1), 16-125.
Wilson, E., 2000. Sociobiology: The New Synthesis (25th
Anniversary Edition), Cambridge, MA: Harvard
University Press.
Zak, P. J., and S. Knack. 2001. Trust and growth, The Economic Journal 111 (470): 295-321.

32
Figure 1: Examples of Recordkeeping Technologies Present in Human History
A: Tokens of ancient Mesopotamia circa 8000 BC (left). Bullae and tokens circa 3200 BC (right)
B: Incan Quipu Dating from 1,500 AD and Earlier
C: Tally sticks used by British Exchequer circa 1,440 AD
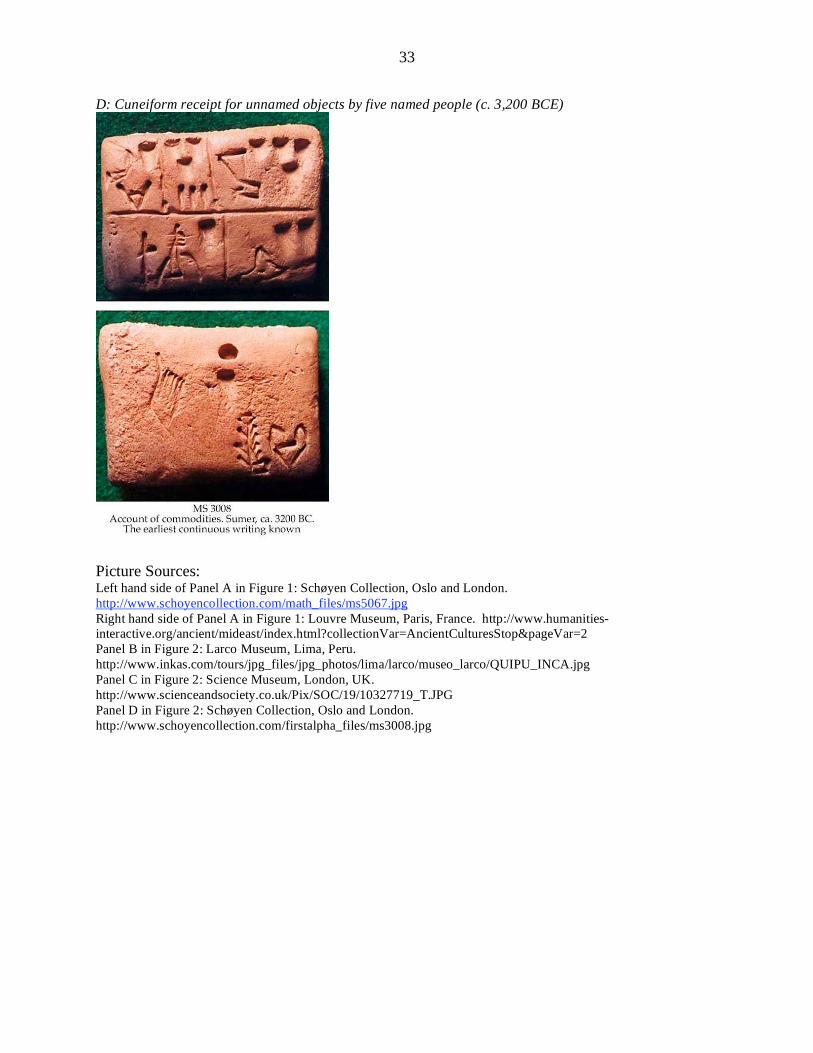
33
D: Cuneiform receipt for unnamed objects by five named people (c. 3,200 BCE)
Picture Sources: Left hand side of Panel A in Figure 1: Schøyen Collection, Oslo and London.
http://www.schoyencollection.com/math_files/ms5067.jpg
Right hand side of Panel A in Figure 1: Louvre Museum, Paris, France. http://www.humanities-
interactive.org/ancient/mideast/index.html?collectionVar=AncientCulturesStop&pageVar=2
Panel B in Figure 2: Larco Museum, Lima, Peru.
http://www.inkas.com/tours/jpg_files/jpg_photos/lima/larco/museo_larco/QUIPU_INCA.jpg
Panel C in Figure 2: Science Museum, London, UK.
http://www.scienceandsociety.co.uk/Pix/SOC/19/10327719_T.JPG
Panel D in Figure 2: Schøyen Collection, Oslo and London.
http://www.schoyencollection.com/firstalpha_files/ms3008.jpg
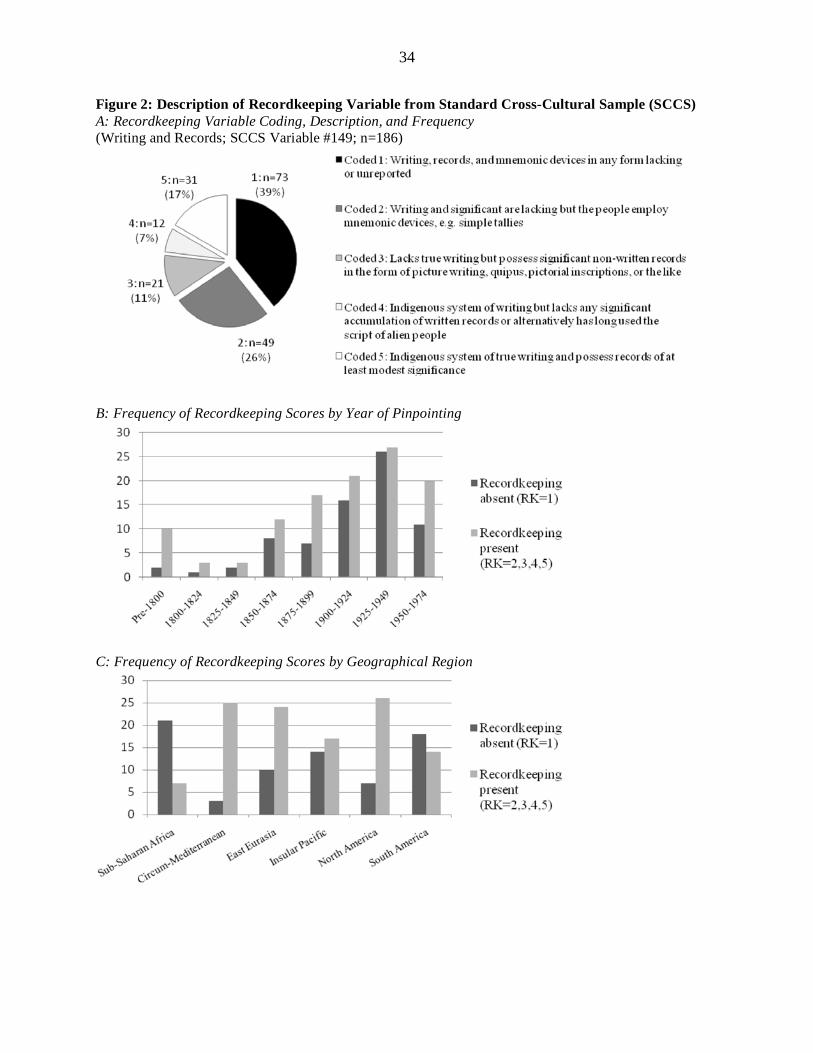
34
Figure 2: Description of Recordkeeping Variable from Standard Cross-Cultural Sample (SCCS)
A: Recordkeeping Variable Coding, Description, and Frequency
(Writing and Records; SCCS Variable #149; n=186)
B: Frequency of Recordkeeping Scores by Year of Pinpointing
C: Frequency of Recordkeeping Scores by Geographical Region
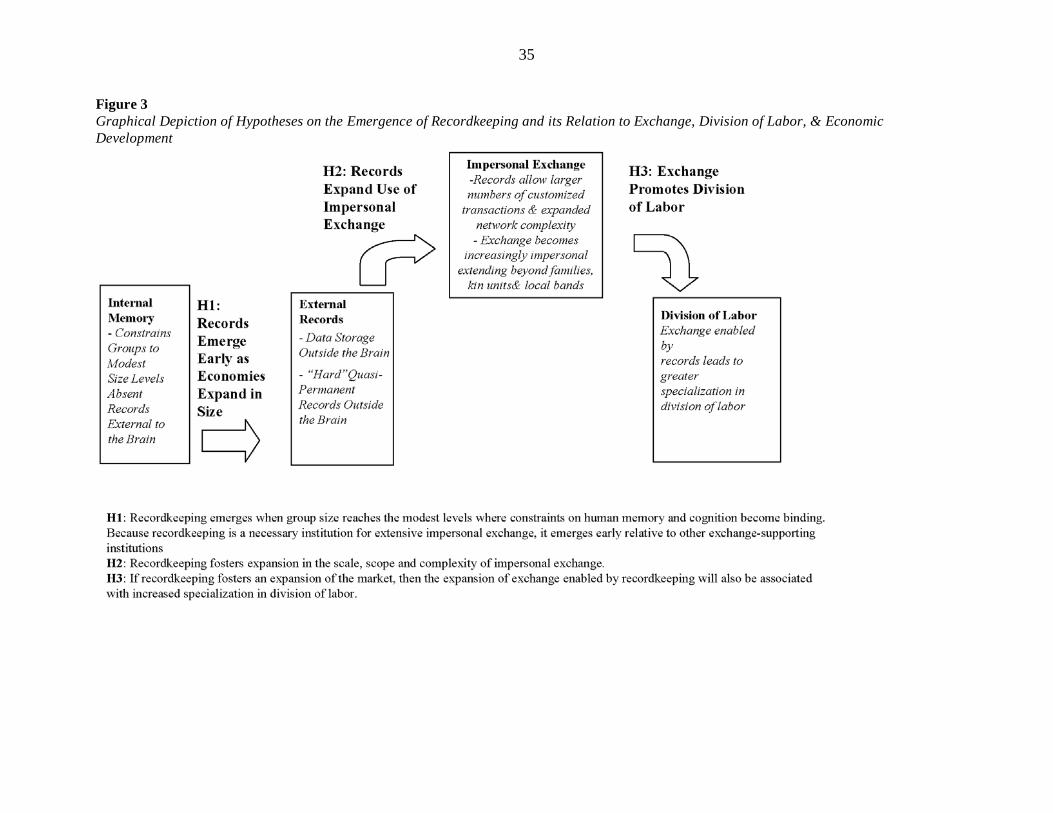
35
Figure 3
Graphical Depiction of Hypotheses on the Emergence of Recordkeeping and its Relation to Exchange, Division of Labor, & Economic
Development
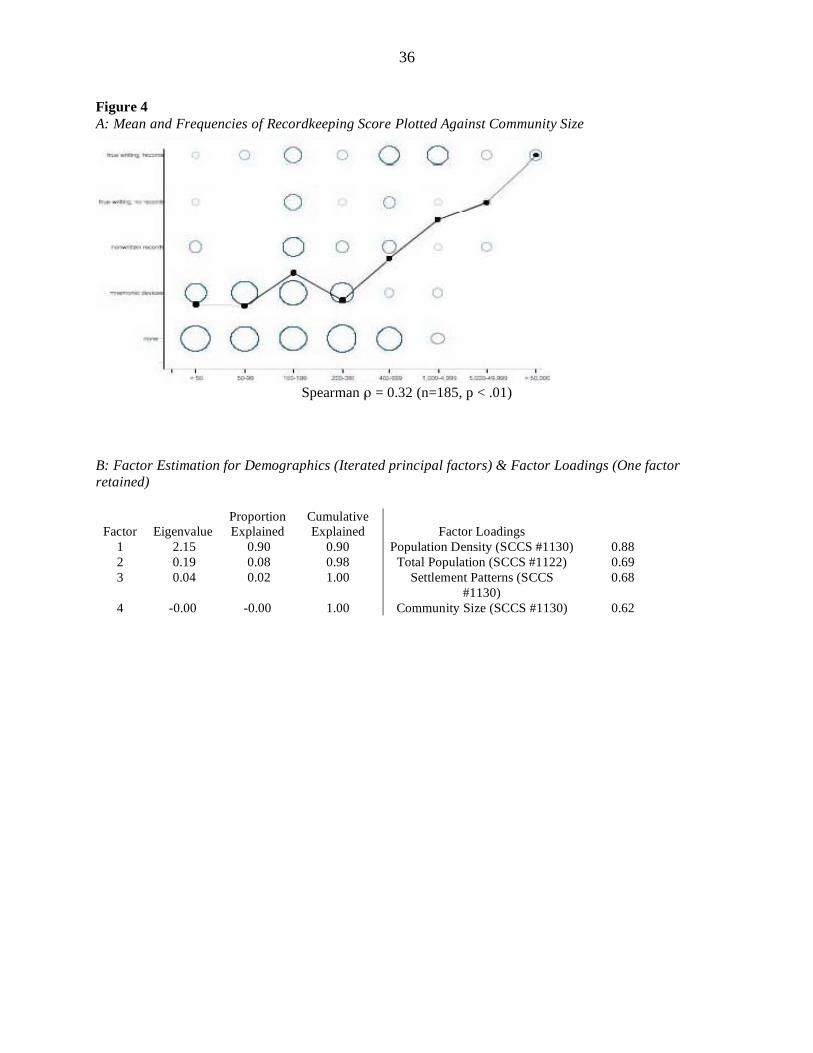
36
Figure 4
A: Mean and Frequencies of Recordkeeping Score Plotted Against Community Size
Spearman = 0.32 (n=185, p < .01)
B: Factor Estimation for Demographics (Iterated principal factors) & Factor Loadings (One factor
retained)
Factor
Eigenvalue
Proportion
Explained
Cumulative
Explained
Factor Loadings
1 2.15 0.90 0.90 Population Density (SCCS #1130) 0.88
2 0.19 0.08 0.98 Total Population (SCCS #1122) 0.69
3 0.04 0.02 1.00 Settlement Patterns (SCCS
#1130)
0.68
4 -0.00 -0.00 1.00 Community Size (SCCS #1130) 0.62
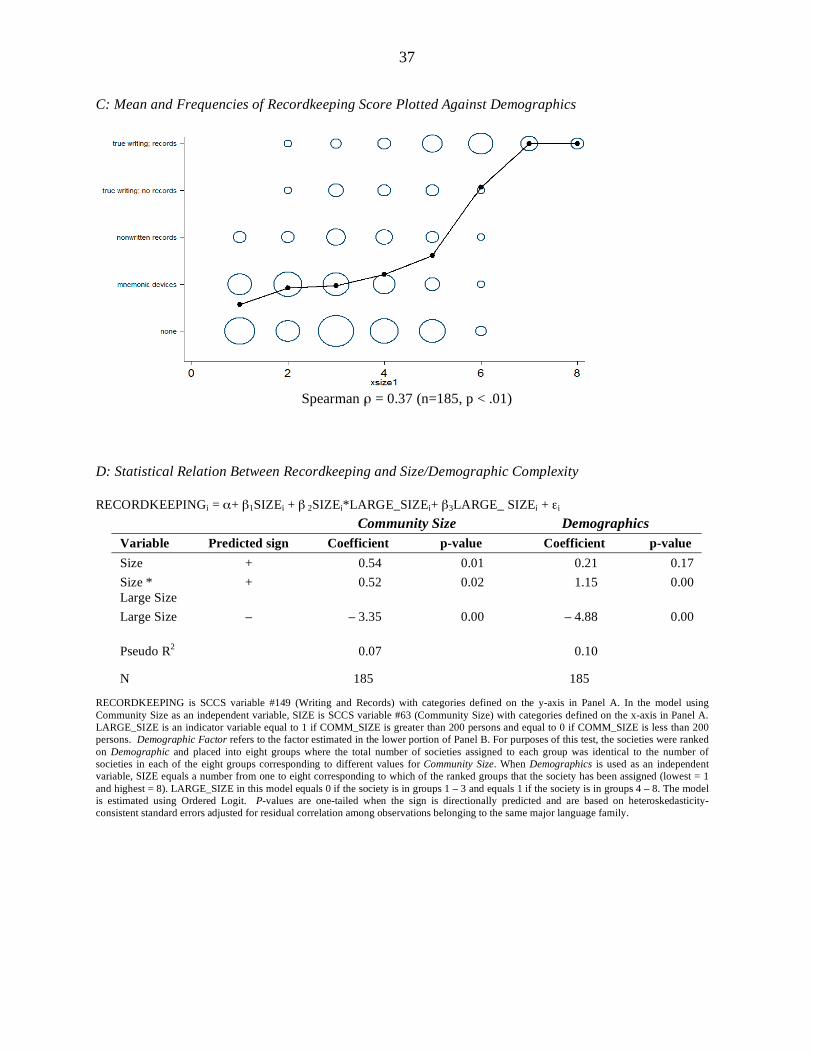
37
C: Mean and Frequencies of Recordkeeping Score Plotted Against Demographics
Spearman = 0.37 (n=185, p < .01)
D: Statistical Relation Between Recordkeeping and Size/Demographic Complexity
RECORDKEEPINGi = + 1SIZEi + 2SIZEi*LARGE_SIZEi+ 3LARGE_ SIZEi + i
Community Size Demographics
Variable Predicted sign Coefficient p-value Coefficient p-value
Size + 0.54 0.01 0.21 0.17
Size *
Large Size
+ 0.52 0.02 1.15 0.00
Large Size
– – 3.35 0.00 – 4.88 0.00
Pseudo R2 0.07 0.10
N 185 185
RECORDKEEPING is SCCS variable #149 (Writing and Records) with categories defined on the y-axis in Panel A. In the model using
Community Size as an independent variable, SIZE is SCCS variable #63 (Community Size) with categories defined on the x-axis in Panel A.
LARGE_SIZE is an indicator variable equal to 1 if COMM_SIZE is greater than 200 persons and equal to 0 if COMM_SIZE is less than 200
persons. Demographic Factor refers to the factor estimated in the lower portion of Panel B. For purposes of this test, the societies were ranked
on Demographic and placed into eight groups where the total number of societies assigned to each group was identical to the number of
societies in each of the eight groups corresponding to different values for Community Size. When Demographics is used as an independent
variable, SIZE equals a number from one to eight corresponding to which of the ranked groups that the society has been assigned (lowest = 1
and highest = 8). LARGE_SIZE in this model equals 0 if the society is in groups 1 – 3 and equals 1 if the society is in groups 4 – 8. The model
is estimated using Ordered Logit. P-values are one-tailed when the sign is directionally predicted and are based on heteroskedasticity-
consistent standard errors adjusted for residual correlation among observations belonging to the same major language family.
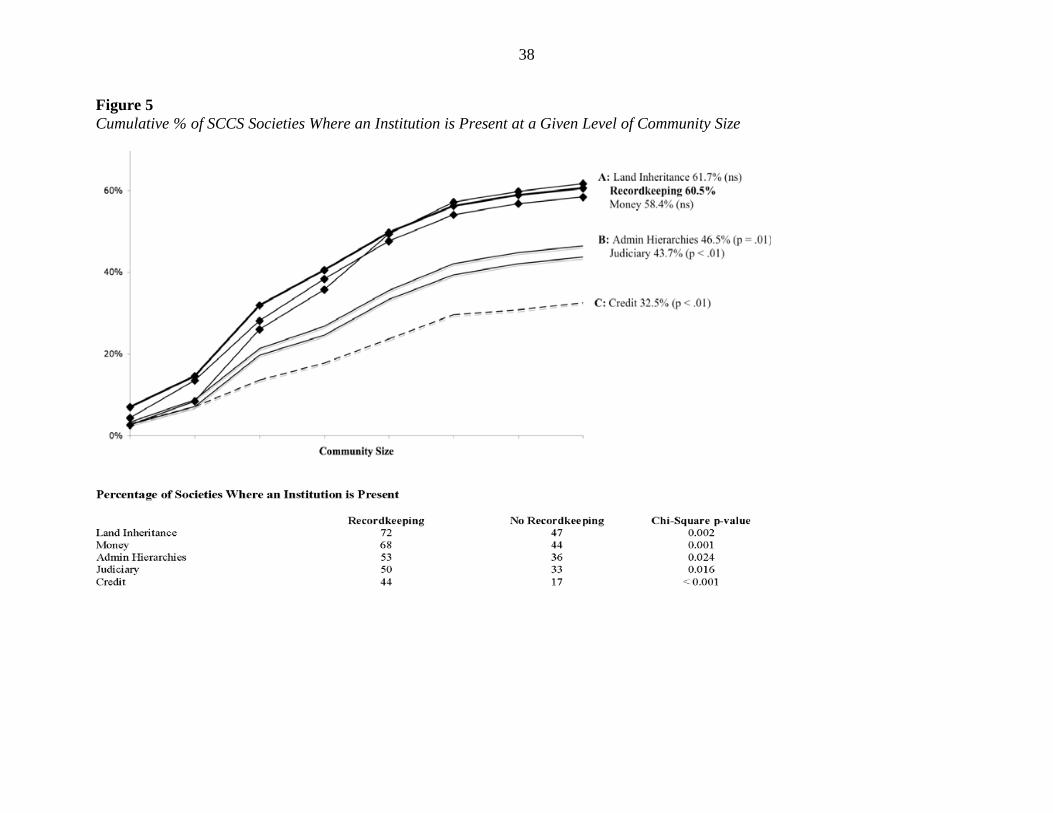
38
Figure 5
Cumulative % of SCCS Societies Where an Institution is Present at a Given Level of Community Size
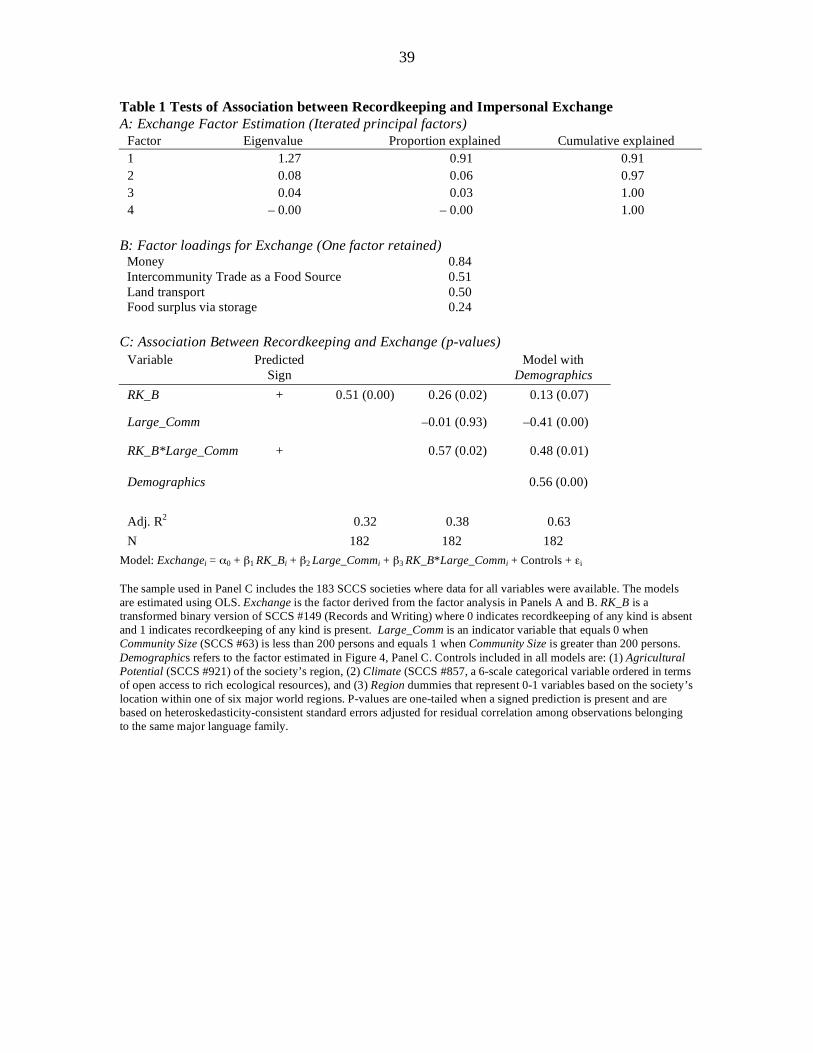
39
Table 1 Tests of Association between Recordkeeping and Impersonal Exchange
A: Exchange Factor Estimation (Iterated principal factors)
Factor Eigenvalue Proportion explained Cumulative explained
1 1.27 0.91 0.91
2 0.08 0.06 0.97
3 0.04 0.03 1.00
4 – 0.00 – 0.00 1.00
B: Factor loadings for Exchange (One factor retained)
Money 0.84
Intercommunity Trade as a Food Source 0.51
Land transport 0.50
Food surplus via storage 0.24
C: Association Between Recordkeeping and Exchange (p-values)
Variable Predicted
Sign
Model with
Demographics
RK_B + 0.51 (0.00) 0.26 (0.02) 0.13 (0.07)
Large_Comm –0.01 (0.93) –0.41 (0.00)
RK_B*Large_Comm + 0.57 (0.02) 0.48 (0.01)
Demographics 0.56 (0.00)
Adj. R2
0.32 0.38 0.63
N 182 182 182
Model: Exchangei = 0 + 1 RK_Bi + 2 Large_Commi + 3 RK_B*Large_Commi + Controls + i
The sample used in Panel C includes the 183 SCCS societies where data for all variables were available. The models
are estimated using OLS. Exchange is the factor derived from the factor analysis in Panels A and B. RK_B is a
transformed binary version of SCCS #149 (Records and Writing) where 0 indicates recordkeeping of any kind is absent
and 1 indicates recordkeeping of any kind is present. Large_Comm is an indicator variable that equals 0 when
Community Size (SCCS #63) is less than 200 persons and equals 1 when Community Size is greater than 200 persons.
Demographics refers to the factor estimated in Figure 4, Panel C. Controls included in all models are: (1) Agricultural
Potential (SCCS #921) of the society’s region, (2) Climate (SCCS #857, a 6-scale categorical variable ordered in terms
of open access to rich ecological resources), and (3) Region dummies that represent 0-1 variables based on the society’s
location within one of six major world regions. P-values are one-tailed when a signed prediction is present and are
based on heteroskedasticity-consistent standard errors adjusted for residual correlation among observations belonging
to the same major language family.
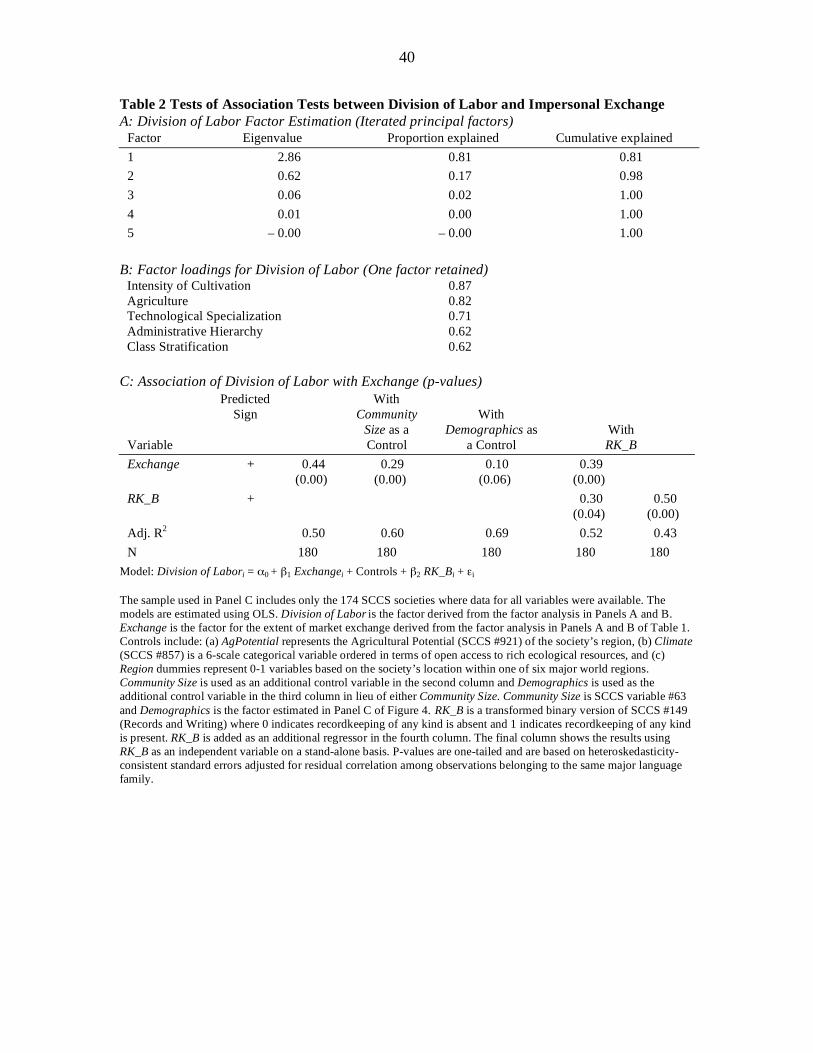
40
Table 2 Tests of Association Tests between Division of Labor and Impersonal Exchange
A: Division of Labor Factor Estimation (Iterated principal factors) Factor Eigenvalue Proportion explained Cumulative explained
1 2.86 0.81 0.81
2 0.62 0.17 0.98
3 0.06 0.02 1.00
4 0.01 0.00 1.00
5 – 0.00 – 0.00 1.00
B: Factor loadings for Division of Labor (One factor retained)
Intensity of Cultivation 0.87
Agriculture 0.82
Technological Specialization 0.71
Administrative Hierarchy 0.62
Class Stratification 0.62
C: Association of Division of Labor with Exchange (p-values)
Variable
Predicted
Sign
With
Community
Size as a
Control
With
Demographics as
a Control
With
RK_B
Exchange + 0.44
(0.00)
0.29
(0.00)
0.10
(0.06)
0.39
(0.00)
RK_B + 0.30
(0.04)
0.50
(0.00)
Adj. R2
0.50 0.60 0.69 0.52 0.43
N 180 180 180 180 180
Model: Division of Labori = 0 + 1 Exchangei + Controls + 2 RK_Bi + i
The sample used in Panel C includes only the 174 SCCS societies where data for all variables were available. The
models are estimated using OLS. Division of Labor is the factor derived from the factor analysis in Panels A and B.
Exchange is the factor for the extent of market exchange derived from the factor analysis in Panels A and B of Table 1.
Controls include: (a) AgPotential represents the Agricultural Potential (SCCS #921) of the society’s region, (b) Climate
(SCCS #857) is a 6-scale categorical variable ordered in terms of open access to rich ecological resources, and (c)
Region dummies represent 0-1 variables based on the society’s location within one of six major world regions.
Community Size is used as an additional control variable in the second column and Demographics is used as the
additional control variable in the third column in lieu of either Community Size. Community Size is SCCS variable #63
and Demographics is the factor estimated in Panel C of Figure 4. RK_B is a transformed binary version of SCCS #149
(Records and Writing) where 0 indicates recordkeeping of any kind is absent and 1 indicates recordkeeping of any kind
is present. RK_B is added as an additional regressor in the fourth column. The final column shows the results using
RK_B as an independent variable on a stand-alone basis. P-values are one-tailed and are based on heteroskedasticity-
consistent standard errors adjusted for residual correlation among observations belonging to the same major language
family.
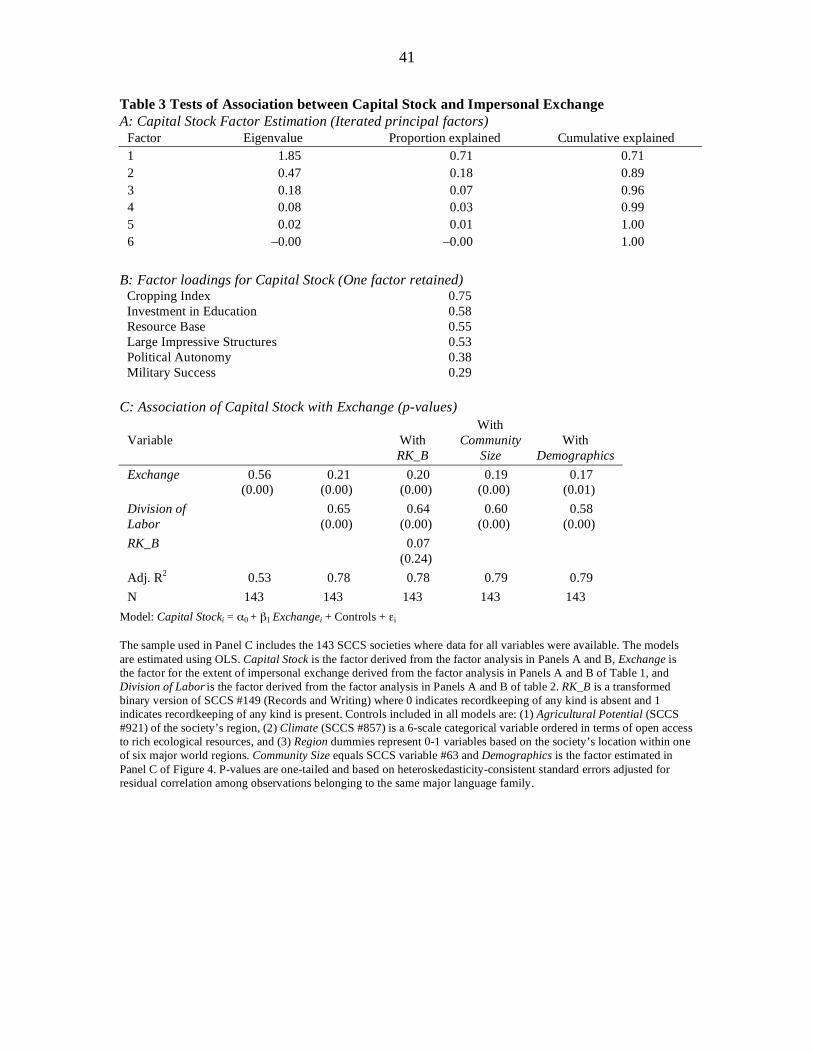
41
Table 3 Tests of Association between Capital Stock and Impersonal Exchange
A: Capital Stock Factor Estimation (Iterated principal factors) Factor Eigenvalue Proportion explained Cumulative explained
1 1.85 0.71 0.71
2 0.47 0.18 0.89
3 0.18 0.07 0.96
4 0.08 0.03 0.99
5 0.02 0.01 1.00
6 –0.00 –0.00 1.00
B: Factor loadings for Capital Stock (One factor retained)
Cropping Index 0.75
Investment in Education 0.58
Resource Base 0.55
Large Impressive Structures 0.53
Political Autonomy 0.38
Military Success 0.29
C: Association of Capital Stock with Exchange (p-values)
Variable
With
RK_B
With
Community
Size
With
Demographics
Exchange 0.56
(0.00)
0.21
(0.00)
0.20
(0.00)
0.19
(0.00)
0.17
(0.01)
Division of
Labor
0.65
(0.00)
0.64
(0.00)
0.60
(0.00)
0.58
(0.00)
RK_B 0.07
(0.24)
Adj. R2
0.53 0.78 0.78 0.79 0.79
N 143 143 143 143 143
Model: Capital Stocki = 0 + 1 Exchangei + Controls + i
The sample used in Panel C includes the 143 SCCS societies where data for all variables were available. The models
are estimated using OLS. Capital Stock is the factor derived from the factor analysis in Panels A and B, Exchange is
the factor for the extent of impersonal exchange derived from the factor analysis in Panels A and B of Table 1, and
Division of Labor is the factor derived from the factor analysis in Panels A and B of table 2. RK_B is a transformed
binary version of SCCS #149 (Records and Writing) where 0 indicates recordkeeping of any kind is absent and 1
indicates recordkeeping of any kind is present. Controls included in all models are: (1) Agricultural Potential (SCCS
#921) of the society’s region, (2) Climate (SCCS #857) is a 6-scale categorical variable ordered in terms of open access
to rich ecological resources, and (3) Region dummies represent 0-1 variables based on the society’s location within one
of six major world regions. Community Size equals SCCS variable #63 and Demographics is the factor estimated in
Panel C of Figure 4. P-values are one-tailed and based on heteroskedasticity-consistent standard errors adjusted for
residual correlation among observations belonging to the same major language family.
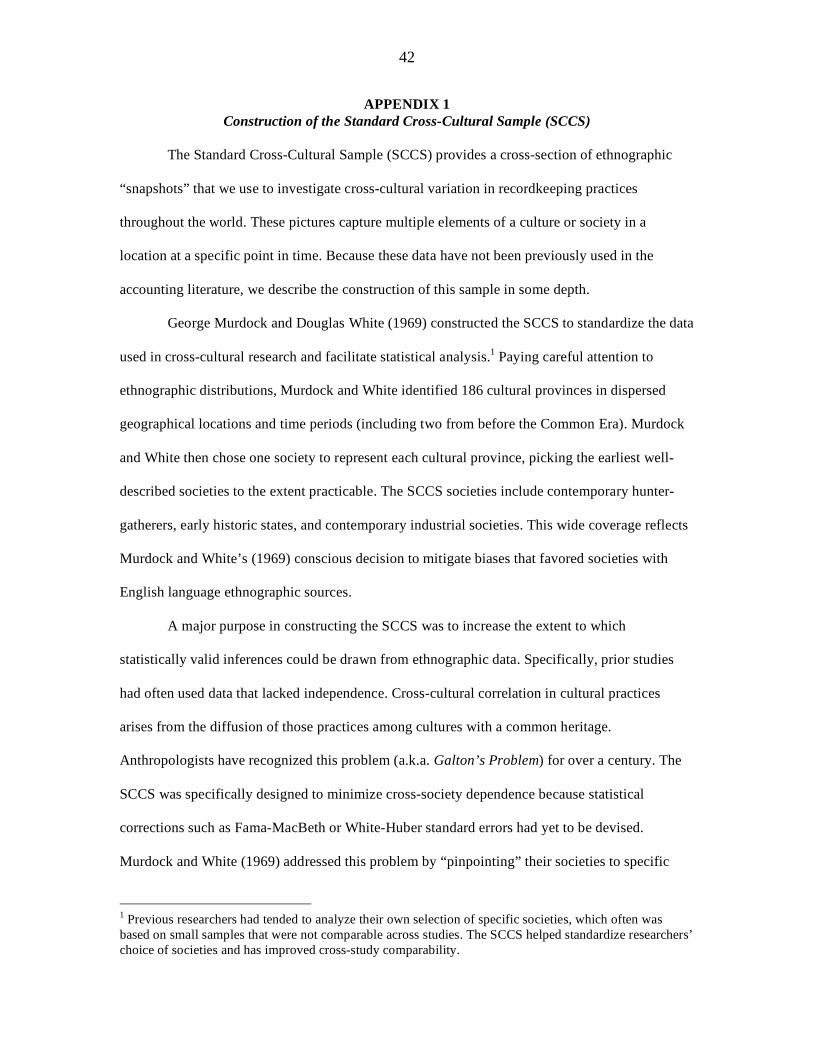
42
APPENDIX 1
Construction of the Standard Cross-Cultural Sample (SCCS)
The Standard Cross-Cultural Sample (SCCS) provides a cross-section of ethnographic
“snapshots” that we use to investigate cross-cultural variation in recordkeeping practices
throughout the world. These pictures capture multiple elements of a culture or society in a
location at a specific point in time. Because these data have not been previously used in the
accounting literature, we describe the construction of this sample in some depth.
George Murdock and Douglas White (1969) constructed the SCCS to standardize the data
used in cross-cultural research and facilitate statistical analysis.1 Paying careful attention to
ethnographic distributions, Murdock and White identified 186 cultural provinces in dispersed
geographical locations and time periods (including two from before the Common Era). Murdock
and White then chose one society to represent each cultural province, picking the earliest well-
described societies to the extent practicable. The SCCS societies include contemporary hunter-
gatherers, early historic states, and contemporary industrial societies. This wide coverage reflects
Murdock and White’s (1969) conscious decision to mitigate biases that favored societies with
English language ethnographic sources.
A major purpose in constructing the SCCS was to increase the extent to which
statistically valid inferences could be drawn from ethnographic data. Specifically, prior studies
had often used data that lacked independence. Cross-cultural correlation in cultural practices
arises from the diffusion of those practices among cultures with a common heritage.
Anthropologists have recognized this problem (a.k.a. Galton’s Problem) for over a century. The
SCCS was specifically designed to minimize cross-society dependence because statistical
corrections such as Fama-MacBeth or White-Huber standard errors had yet to be devised.
Murdock and White (1969) addressed this problem by “pinpointing” their societies to specific
1 Previous researchers had tended to analyze their own selection of specific societies, which often was
based on small samples that were not comparable across studies. The SCCS helped standardize researchers’
choice of societies and has improved cross-study comparability.
43
locales and dates. The pinpointing of societies permitted selection of cultures with weaker
cultural and historical diffusion relationships – i.e., the SCCS was constructed to maximize
independence in terms of cultural and historical origin while preserving a large enough sample to
permit sufficiently powerful statistical tests.
Murdock (1967) initiated the pinpointing process when he analyzed nearly 1,300
societies chosen for the completeness of their ethnographic coverage to construct his
Ethnographic Atlas. He classified these societies into clusters based on the similarity of the
cultures and categorized groups of clusters into 200 “sampling provinces” (Murdock 1967;
Murdock and White 1969). From the initial 200 sampling provinces, two had no culture that
could be accurately pinpointed to a particular locale and date, two were split in half, and 14 others
were dropped because they were too similar to others in the sample.
Murdock and White (1969) then identified that culture from each of the 186 sampling
provinces with the earliest period of satisfactory ethnographic coverage unless significantly richer
data were available for a later period. The 186 cultures selected in this step comprise the SCCS.2
The cultures in SCCS are assigned a number from 1 to 186, which facilitate statistical
identification of those cultural practices that originate from a common cultural heritage. This is
done because societies with close geographical proximity are likely ones where cultural diffusion
may still be a prominent force. Thus, the correlation between adjacent societies within the SCCS
measures the extent to which the pinpointing process did not completely eliminate Galton’s
Problem.
The initial study using the SCCS coded 22 variables related to subsistence economy and
related practices (Murdock and Morrow 1970). The electronic database includes a bibliography of
ethnographic sources for each society-year, ranked on a scale from 1 “Principal Authority(ies)” to
2 Some have argued that the 186 SCCS societies constitute a sample biased in favor of those studied more
intensively by Murdock, his colleagues, and their students (Otterbein 1976). Subsequent research
demonstrates that such bias is not present in the SCCS (Gray 1996). Rather, the predominant bias in the
SCCS is towards societies that have been more intensively studied by ethnographers, as previously noted
by Murdock and White (1969, 332).
44
6 “Sources to be Avoided” (White 1986). The hard copy archives include coding sheets
indicating which individual sources were relied on most for each culture for coding different
groups of variables. Researchers who use the database code new variables and these additional
variables are added to the database as a result. Not all 186 societies are coded for each new
variable as some researchers elected to code data for only a subset of the SCCS cultures. For
example, many variables are coded for only 93 cultures suggesting, for example, a sampling
scheme such as using every other culture in the database.
Thus, each new study increases the depth of the database. There are presently more than
2,000 categorical variables (as of 2007) coded nominally or ordinally by over 60 different
studies.3 Unlike the usual market studies, the data we use are limited to only one observation per
culture; thus, SCCS does not provide a pooled time-series cross-sectional data set. The SCCS was
designed to ensure that standard errors are not inflated by multiple observations from the same
unit.
3 An online journal, World Cultures, founded by Douglas White in 1985, maintains, refines and expands
the SCCS. The journal is available in paper and CD-ROM as well as over the Internet. The journal can be
accessed at http://eclectic.ss.uci.edu/~drwhite/worldcul/world.htm.
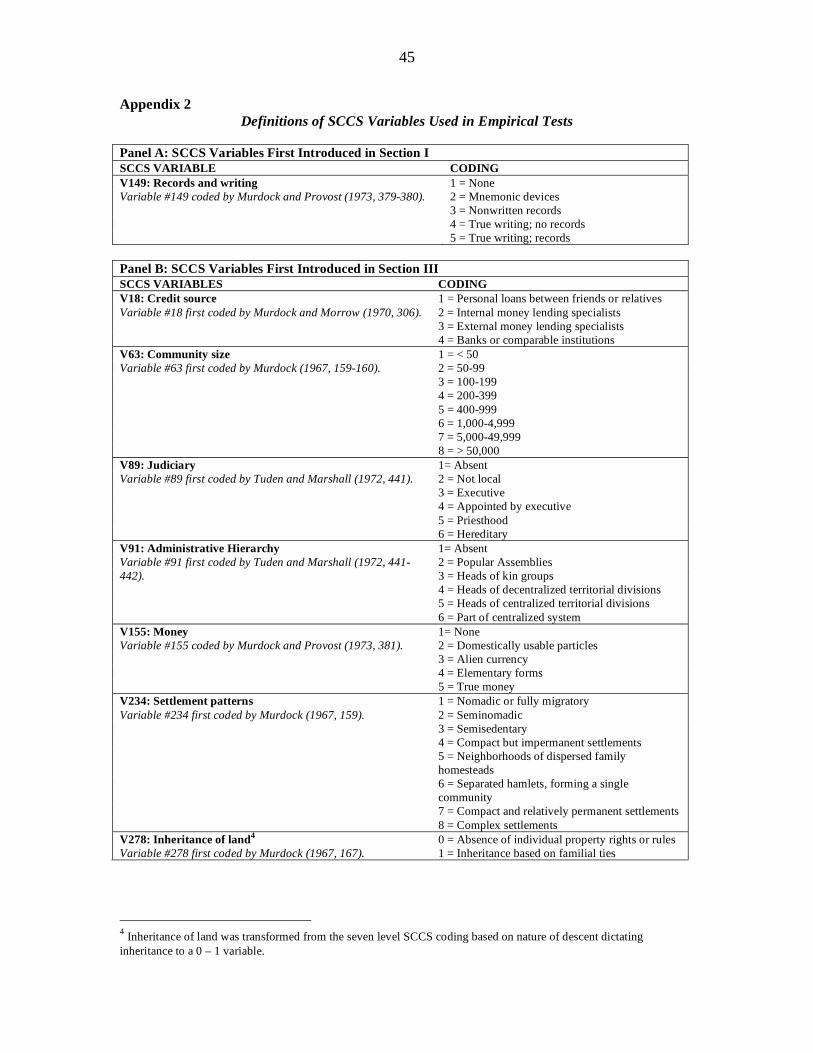
45
Appendix 2
Definitions of SCCS Variables Used in Empirical Tests
Panel A: SCCS Variables First Introduced in Section I
SCCS VARIABLE CODING
V149: Records and writing 1 = None
Variable #149 coded by Murdock and Provost (1973, 379-380). 2 = Mnemonic devices
3 = Nonwritten records
4 = True writing; no records
5 = True writing; records
Panel B: SCCS Variables First Introduced in Section III
SCCS VARIABLES CODING
V18: Credit source 1 = Personal loans between friends or relatives
Variable #18 first coded by Murdock and Morrow (1970, 306). 2 = Internal money lending specialists
3 = External money lending specialists
4 = Banks or comparable institutions
V63: Community size 1 = < 50
Variable #63 first coded by Murdock (1967, 159-160). 2 = 50-99
3 = 100-199
4 = 200-399
5 = 400-999
6 = 1,000-4,999
7 = 5,000-49,999
8 = > 50,000
V89: Judiciary 1= Absent
Variable #89 first coded by Tuden and Marshall (1972, 441). 2 = Not local
3 = Executive
4 = Appointed by executive
5 = Priesthood
6 = Hereditary
V91: Administrative Hierarchy 1= Absent
Variable #91 first coded by Tuden and Marshall (1972, 441- 2 = Popular Assemblies
442). 3 = Heads of kin groups
4 = Heads of decentralized territorial divisions
5 = Heads of centralized territorial divisions
6 = Part of centralized system
V155: Money 1= None
Variable #155 coded by Murdock and Provost (1973, 381). 2 = Domestically usable particles
3 = Alien currency
4 = Elementary forms
5 = True money
V234: Settlement patterns 1 = Nomadic or fully migratory
Variable #234 first coded by Murdock (1967, 159). 2 = Seminomadic
3 = Semisedentary
4 = Compact but impermanent settlements
5 = Neighborhoods of dispersed family
homesteads
6 = Separated hamlets, forming a single
community
7 = Compact and relatively permanent settlements
8 = Complex settlements
V278: Inheritance of land4 0 = Absence of individual property rights or rules
Variable #278 first coded by Murdock (1967, 167). 1 = Inheritance based on familial ties
4 Inheritance of land was transformed from the seven level SCCS coding based on nature of descent dictating
inheritance to a 0 – 1 variable.
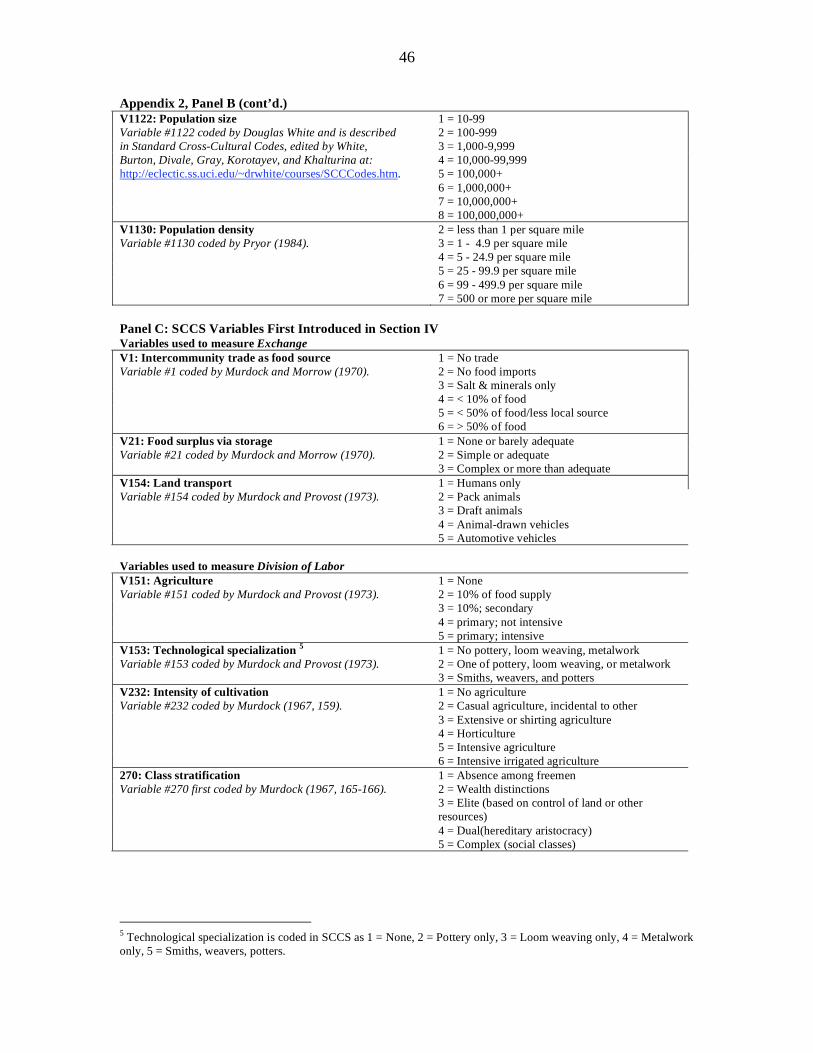
46
Appendix 2, Panel B (cont’d.)
V1122: Population size 1 = 10-99
Variable #1122 coded by Douglas White and is described 2 = 100-999
in Standard Cross-Cultural Codes, edited by White, 3 = 1,000-9,999
Burton, Divale, Gray, Korotayev, and Khalturina at: 4 = 10,000-99,999
http://eclectic.ss.uci.edu/~drwhite/courses/SCCCodes.htm. 5 = 100,000+
6 = 1,000,000+
7 = 10,000,000+
8 = 100,000,000+
V1130: Population density 2 = less than 1 per square mile
Variable #1130 coded by Pryor (1984). 3 = 1 - 4.9 per square mile
4 = 5 - 24.9 per square mile
5 = 25 - 99.9 per square mile
6 = 99 - 499.9 per square mile
7 = 500 or more per square mile
Panel C: SCCS Variables First Introduced in Section IV Variables used to measure Exchange
V1: Intercommunity trade as food source 1 = No trade
Variable #1 coded by Murdock and Morrow (1970). 2 = No food imports
3 = Salt & minerals only
4 = < 10% of food
5 = < 50% of food/less local source
6 = > 50% of food
V21: Food surplus via storage 1 = None or barely adequate
Variable #21 coded by Murdock and Morrow (1970). 2 = Simple or adequate
3 = Complex or more than adequate
V154: Land transport 1 = Humans only
Variable #154 coded by Murdock and Provost (1973). 2 = Pack animals
3 = Draft animals
4 = Animal-drawn vehicles
5 = Automotive vehicles
Variables used to measure Division of Labor
V151: Agriculture 1 = None
Variable #151 coded by Murdock and Provost (1973). 2 = 10% of food supply
3 = 10%; secondary
4 = primary; not intensive
5 = primary; intensive
V153: Technological specialization 5 1 = No pottery, loom weaving, metalwork
Variable #153 coded by Murdock and Provost (1973). 2 = One of pottery, loom weaving, or metalwork
3 = Smiths, weavers, and potters
V232: Intensity of cultivation 1 = No agriculture
Variable #232 coded by Murdock (1967, 159). 2 = Casual agriculture, incidental to other
3 = Extensive or shirting agriculture
4 = Horticulture
5 = Intensive agriculture
6 = Intensive irrigated agriculture
270: Class stratification 1 = Absence among freemen
Variable #270 first coded by Murdock (1967, 165-166). 2 = Wealth distinctions
3 = Elite (based on control of land or other
resources)
4 = Dual(hereditary aristocracy)
5 = Complex (social classes)
5 Technological specialization is coded in SCCS as 1 = None, 2 = Pottery only, 3 = Loom weaving only, 4 = Metalwork
only, 5 = Smiths, weavers, potters.
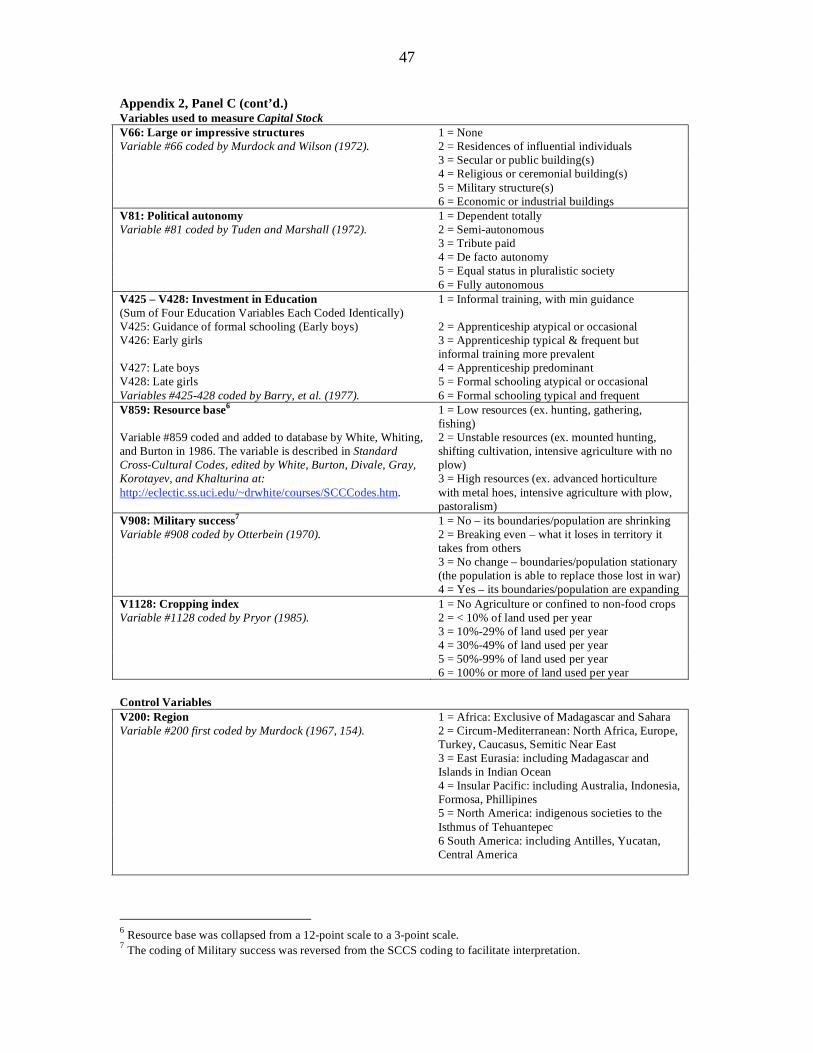
47
Appendix 2, Panel C (cont’d.) Variables used to measure Capital Stock
V66: Large or impressive structures 1 = None
Variable #66 coded by Murdock and Wilson (1972). 2 = Residences of influential individuals
3 = Secular or public building(s)
4 = Religious or ceremonial building(s)
5 = Military structure(s)
6 = Economic or industrial buildings
V81: Political autonomy 1 = Dependent totally
Variable #81 coded by Tuden and Marshall (1972). 2 = Semi-autonomous
3 = Tribute paid
4 = De facto autonomy
5 = Equal status in pluralistic society
6 = Fully autonomous
V425 – V428: Investment in Education
(Sum of Four Education Variables Each Coded Identically)
1 = Informal training, with min guidance
V425: Guidance of formal schooling (Early boys) 2 = Apprenticeship atypical or occasional
V426: Early girls 3 = Apprenticeship typical & frequent but
informal training more prevalent
V427: Late boys 4 = Apprenticeship predominant
V428: Late girls 5 = Formal schooling atypical or occasional
Variables #425-428 coded by Barry, et al. (1977). 6 = Formal schooling typical and frequent
V859: Resource base6 1 = Low resources (ex. hunting, gathering,
fishing)
Variable #859 coded and added to database by White, Whiting,
and Burton in 1986. The variable is described in Standard
Cross-Cultural Codes, edited by White, Burton, Divale, Gray,
2 = Unstable resources (ex. mounted hunting,
shifting cultivation, intensive agriculture with no
plow)
Korotayev, and Khalturina at:
http://eclectic.ss.uci.edu/~drwhite/courses/SCCCodes.htm.
3 = High resources (ex. advanced horticulture
with metal hoes, intensive agriculture with plow,
pastoralism)
V908: Military success7 1 = No – its boundaries/population are shrinking
Variable #908 coded by Otterbein (1970). 2 = Breaking even – what it loses in territory it
takes from others
3 = No change – boundaries/population stationary
(the population is able to replace those lost in war)
4 = Yes – its boundaries/population are expanding
V1128: Cropping index 1 = No Agriculture or confined to non-food crops
Variable #1128 coded by Pryor (1985). 2 = < 10% of land used per year
3 = 10%-29% of land used per year
4 = 30%-49% of land used per year
5 = 50%-99% of land used per year
6 = 100% or more of land used per year
Control Variables
V200: Region 1 = Africa: Exclusive of Madagascar and Sahara
Variable #200 first coded by Murdock (1967, 154). 2 = Circum-Mediterranean: North Africa, Europe,
Turkey, Caucasus, Semitic Near East
3 = East Eurasia: including Madagascar and
Islands in Indian Ocean
4 = Insular Pacific: including Australia, Indonesia,
Formosa, Phillipines
5 = North America: indigenous societies to the
Isthmus of Tehuantepec
6 South America: including Antilles, Yucatan,
Central America
6 Resource base was collapsed from a 12-point scale to a 3-point scale.
7 The coding of Military success was reversed from the SCCS coding to facilitate interpretation.
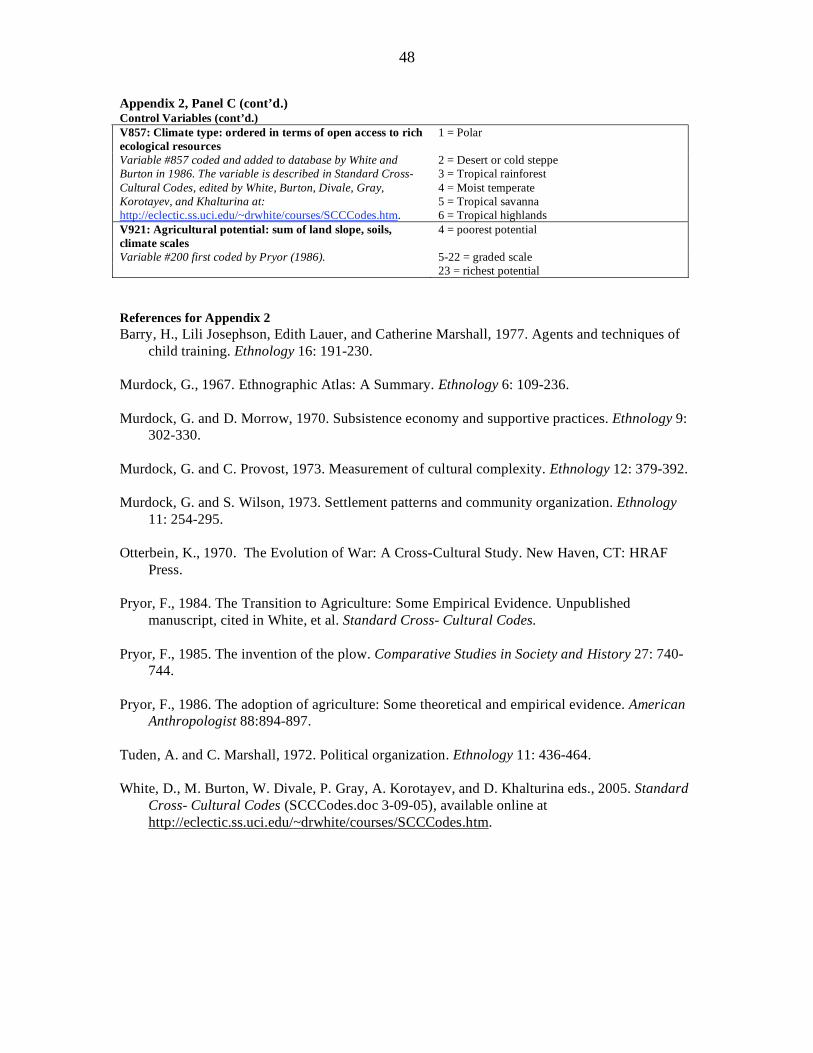
48
Appendix 2, Panel C (cont’d.)
Control Variables (cont’d.)
V857: Climate type: ordered in terms of open access to rich
ecological resources
1 = Polar
Variable #857 coded and added to database by White and 2 = Desert or cold steppe
Burton in 1986. The variable is described in Standard Cross- 3 = Tropical rainforest
Cultural Codes, edited by White, Burton, Divale, Gray, 4 = Moist temperate
Korotayev, and Khalturina at: 5 = Tropical savanna
http://eclectic.ss.uci.edu/~drwhite/courses/SCCCodes.htm. 6 = Tropical highlands
V921: Agricultural potential: sum of land slope, soils,
climate scales
4 = poorest potential
Variable #200 first coded by Pryor (1986). 5-22 = graded scale
23 = richest potential
References for Appendix 2
Barry, H., Lili Josephson, Edith Lauer, and Catherine Marshall, 1977. Agents and techniques of
child training. Ethnology 16: 191-230.
Murdock, G., 1967. Ethnographic Atlas: A Summary. Ethnology 6: 109-236.
Murdock, G. and D. Morrow, 1970. Subsistence economy and supportive practices. Ethnology 9:
302-330.
Murdock, G. and C. Provost, 1973. Measurement of cultural complexity. Ethnology 12: 379-392.
Murdock, G. and S. Wilson, 1973. Settlement patterns and community organization. Ethnology
11: 254-295.
Otterbein, K., 1970. The Evolution of War: A Cross-Cultural Study. New Haven, CT: HRAF
Press.
Pryor, F., 1984. The Transition to Agriculture: Some Empirical Evidence. Unpublished
manuscript, cited in White, et al. Standard Cross- Cultural Codes.
Pryor, F., 1985. The invention of the plow. Comparative Studies in Society and History 27: 740-
744.
Pryor, F., 1986. The adoption of agriculture: Some theoretical and empirical evidence. American
Anthropologist 88:894-897.
Tuden, A. and C. Marshall, 1972. Political organization. Ethnology 11: 436-464.
White, D., M. Burton, W. Divale, P. Gray, A. Korotayev, and D. Khalturina eds., 2005. Standard
Cross- Cultural Codes (SCCCodes.doc 3-09-05), available online at
http://eclectic.ss.uci.edu/~drwhite/courses/SCCCodes.htm.


![Comentario [LT1]: La Vida Impersonal](https://img.pdfslide.net/doc/110x75/62c1361f4d924e145d23539b/comentario-lt1-la-vida-impersonal.jpg)