Embed Size (px)
Citation preview
Transactional Event Profiling in a Best Effort
HTMMatthew Gaudet
Supervisor: José Nelson Amaral (University of Alberta)
Collaborators: Amy Wang (IBM Toronto), Peng Wu (IBM TJ Watson)
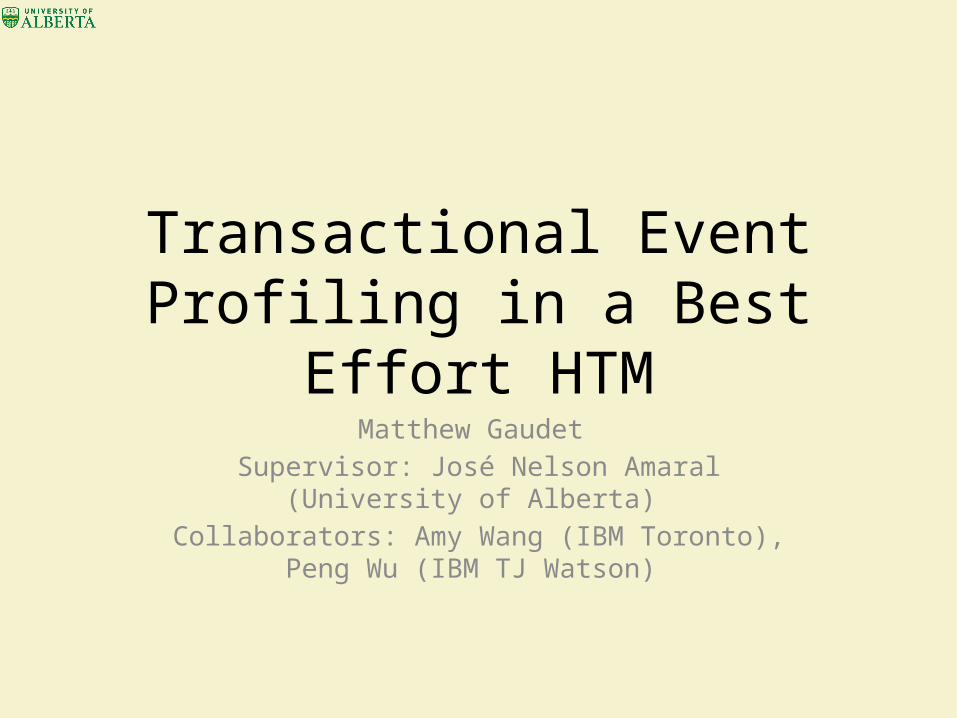
The Story.
Transactions Aborts Serializations
1042 200 10
1000 Aborts 1000 Aborts
1 abort / second 1000 aborts / second
We need a pair of:
X-Ray Specs
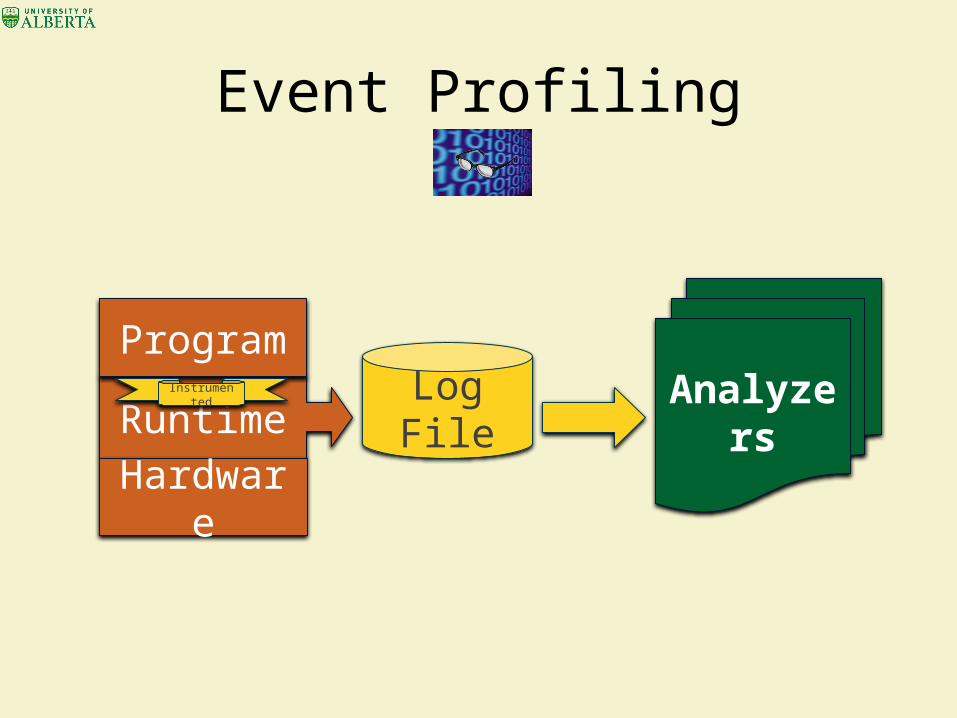
Event Profiling
AnalyzersRuntime
Hardware
Program
Log FileInstrumented
AnalyzersLimited only by the power of your
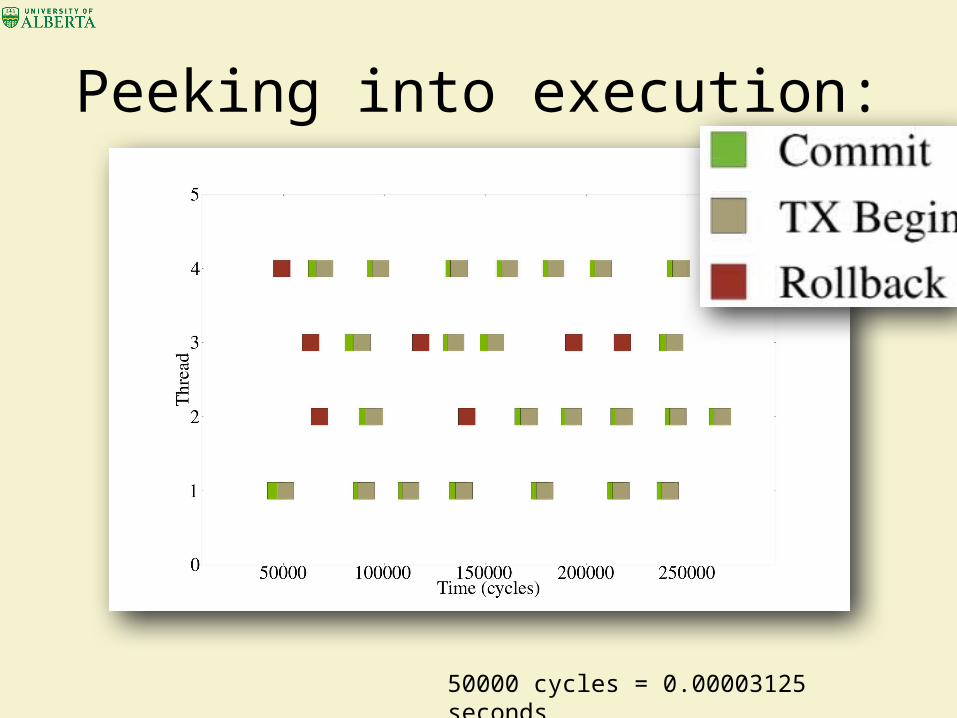
Peeking into execution:
50000 cycles = 0.00003125 seconds
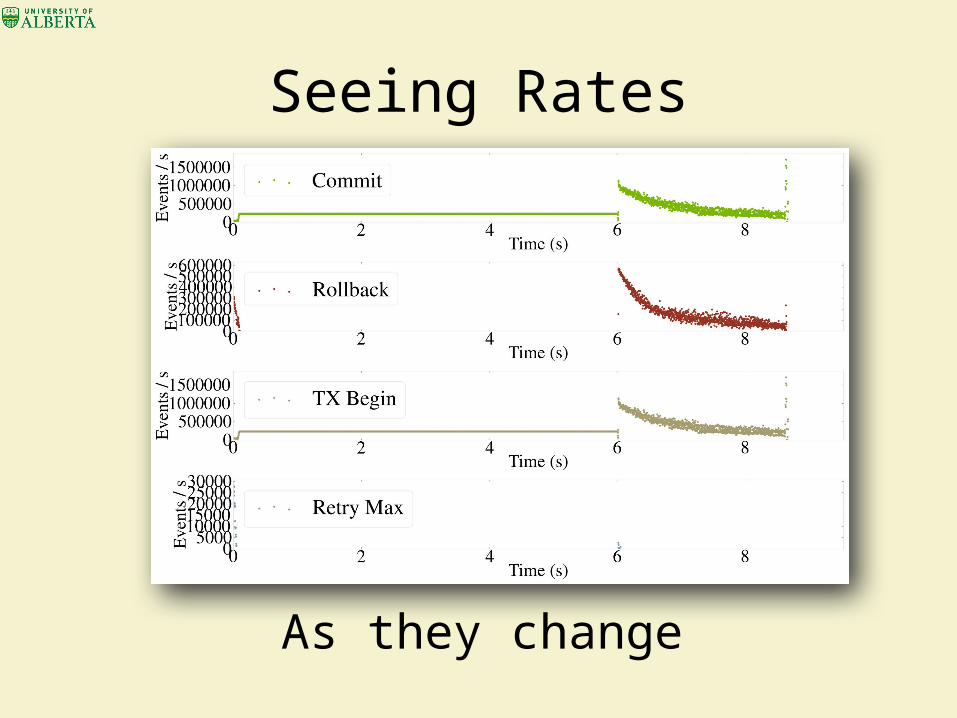
Seeing Rates
As they change
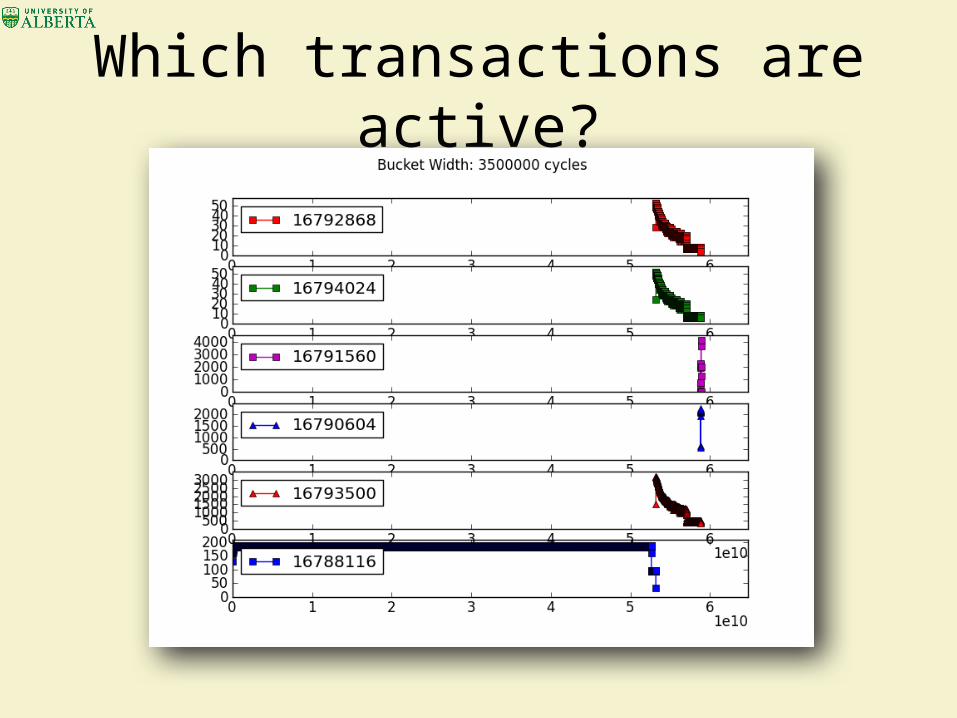
Which transactions are active?
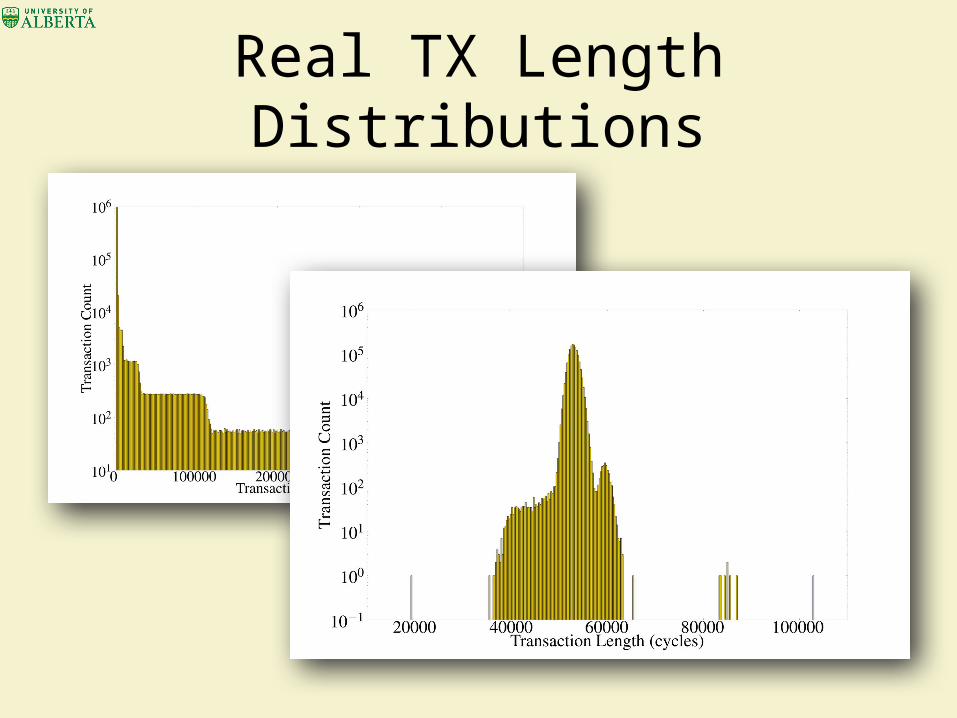
Real TX Length Distributions
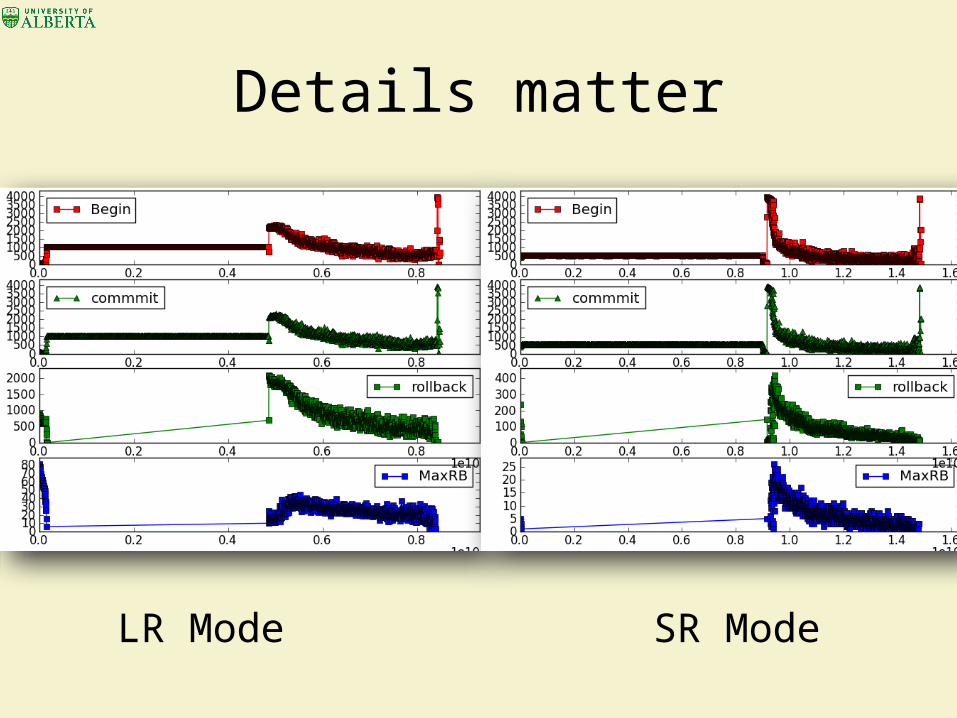
Details matter
LR Mode
SR Mode
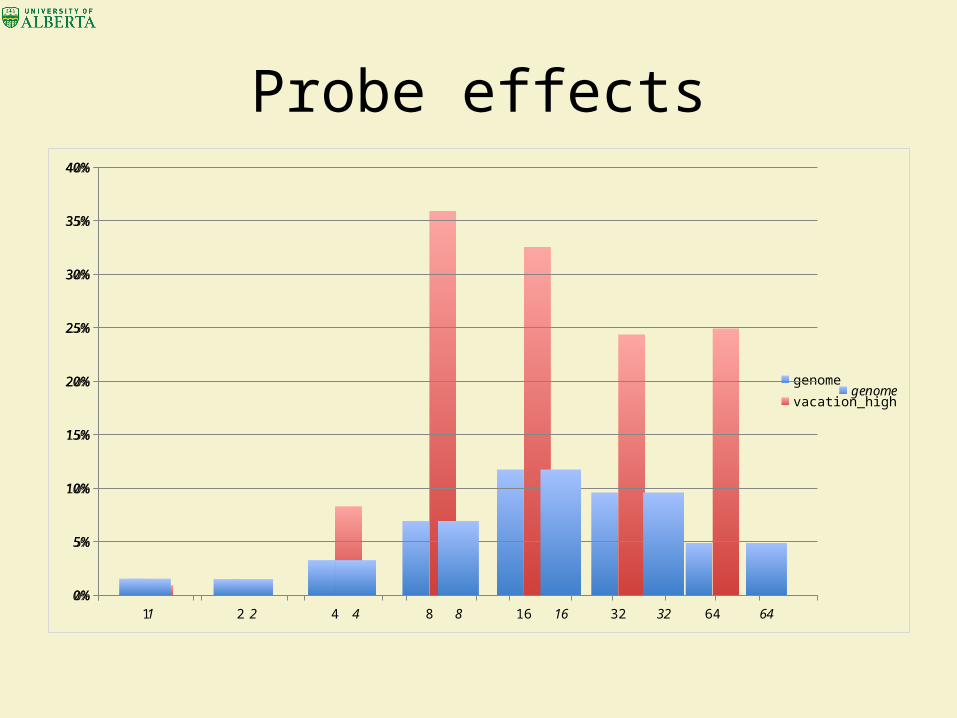
Probe effects
1 2 4 8 16 32 640%
5%
10%
15%
20%
25%
30%
35%
40%
genomevacation_high
1 2 4 8 16 32 640%
5%
10%
15%
20%
25%
30%
35%
40%
genome
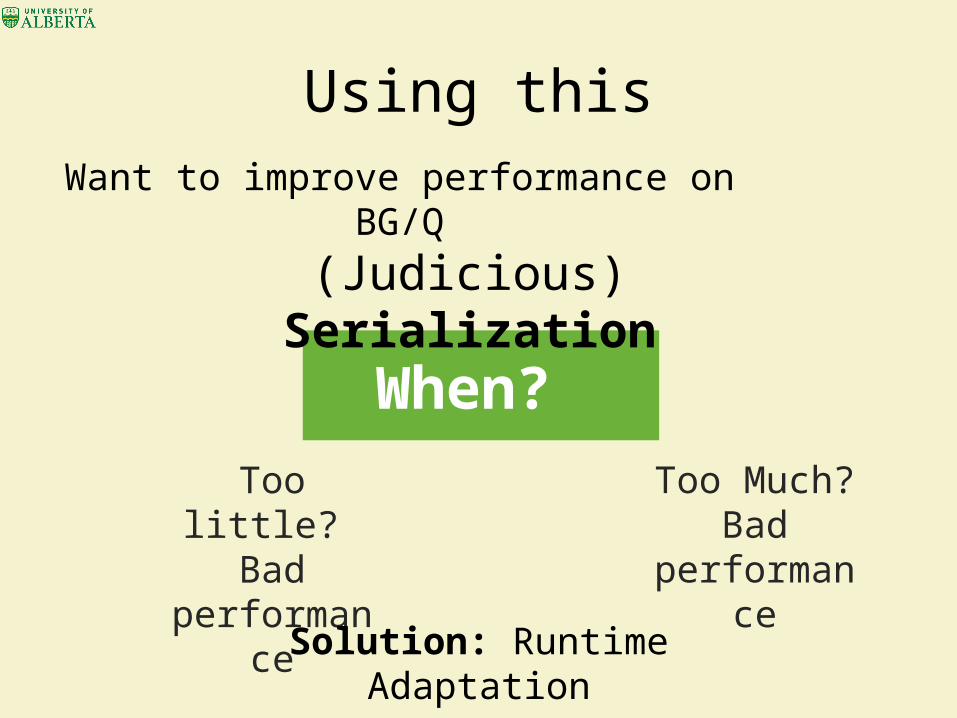
Using this
When? Too little?
Bad performance
Too Much? Bad
performance
Want to improve performance on BG/Q
(Judicious) Serialization
Solution: Runtime Adaptation
Understanding What’s going on?
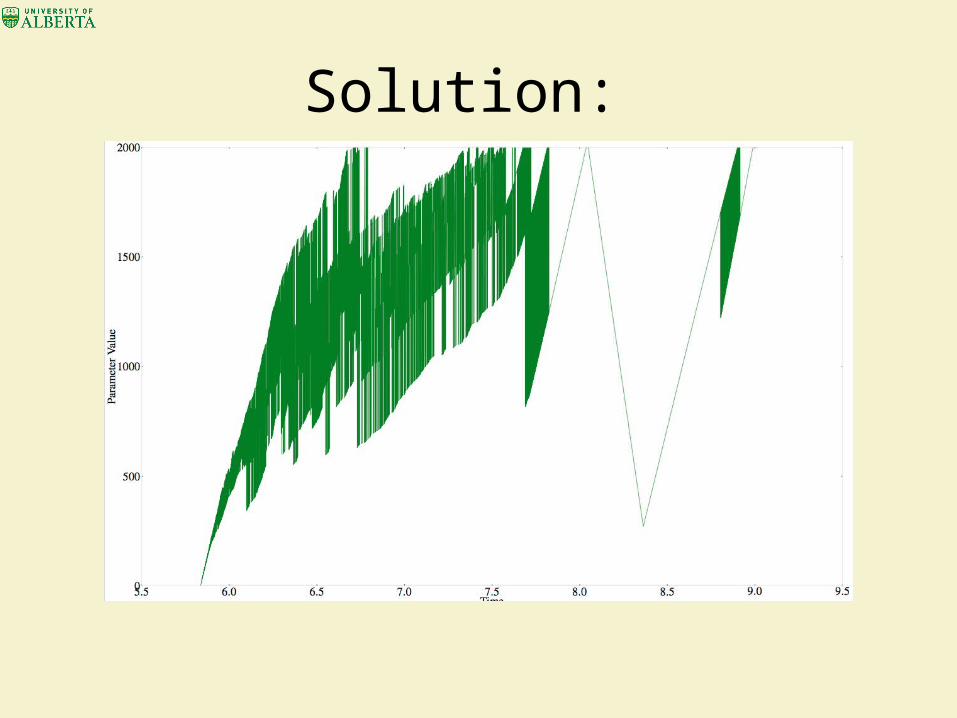
Solution:
Future Work
• The ability to zoom and explore log files, like Visualizing Transactions
• Support for longer, larger programs: In memory compression, partial log-dumps.
Conclusion
1. Event Logging provides a useful view of transactional execution


![Gaudet Family Genealogyarslanmb.org/gaudet/Descendants-Miscellaneous.pdf2 za11132. John Valery GAUDET (male) B. 24 Nov 1854 @ St. James P., Louisiana [25828, 25870, 25964] za11133](https://img.pdfslide.net/doc/110x75/606e469b2cbd3837d827ef46/gaudet-family-2-za11132-john-valery-gaudet-male-b-24-nov-1854-st-james-p.jpg)


![Gaudet Family Genealogy - arslanmb.orgarslanmb.org/gaudet/Descendants-2.pdf · Gaudet Family Genealogy Descendants of Denis Gaudet [#2] & Martine Gaut(h)ier Generations 1-10 Mark](https://img.pdfslide.net/doc/110x75/5b588aa37f8b9a655d8c2a3a/gaudet-family-genealogy-gaudet-family-genealogy-descendants-of-denis-gaudet.jpg)