Embed Size (px)
Citation preview
TRANSACTIONS OF SOCIETY OF ACTUARIES 1967 VOL. 19 PT. 1 NO. 55
T H E E F F E C T OF I N T E R E S T ON P E N S I O N C O N T R I B U T I O N S
WARREN R. ADAMS
I. INTRODUCTION
I N DISCUSSIONS of pension plan costs the actuary often needs to de-
scribe the effect on contributions of a variation in the interest rate. The rule of thumb that an increase of ¼ of 1 per cent in the interest
rate will result in a 6 per cent reduction in contributions is believed to be widely used by actuaries and others. That this "rule" is not applicable to a]l situations is obvious considering that under pay-as-you-go funding interest has no effect on contributions.
The importance of interest is referred to in a general way in many texts and papers on the subject of pensions. McGill has stated: " In a typical p l a n . . , a variation of one fourth of 1 per cent in the interest assumption can be expected to produce a differential of 6 or 7 per cent in the overall valuation of liabillties. '' 'a Crabbe and Poyser have suggested that, on a money-purchase plan, an increase in the rate of interest from 3 to 3¼ per cent would result in a 7¼ per cent reduction in the contributions required to purchase the same benefit. 2 Hamilton and Bronson have demonstrated the effect of variations in several assumptions, including the interest rate, on a level premium to retirement age for entry ages 25 and 45. 3 The Study Notes contain a brief reference to the impact of the interest rate on pension fund costs and include the following illustrations: 4
31% Factor as 4% Factor as Age Function Percentage of Percentage of
3½% Factor 3½% Factor
0 Individual Level Cost--payable to age 65 92 .9% 86.3% 0 Deferred Annu i ty -commenc ing at age 65 94.7 89.6 0. Life Annuity 98.4 96.9
Sot:Rcz.--Tke Pension Actuary's Handbook (Turnover Scale T-l; see Appendix A).
1 Dan Mays McGill, Fundamentals of Private Pensions (Homewood: Irwin & Sons, 1964), p. 208.
i R. J. w. Crabbe and C. A. Poyser, Pensions and Widows' and Orphans' Funds (Cambridge: Cambridge University Press, 1953) p. 40.
s James A. Hamilton and Dorrance C. Bronson, Pensions (New York: McGraw- Hill Book Co., Inc., 1958) p. 270.
"Valuation Assumptions and Budgeting Methods," Society of Actuaries Study Notes, Part 9E, 2-2-66, p. 16.
170

THE EFFECT OF INTEREST ON PENSION CONTRIBUTIONS 171
II . PUP.POSE
This paper will at tempt (1) to establish an index of interest variation for the more commonly used actuarial cost methods assuming certain population models, (2) to indicate how the index is affected by altering the models, and (3) to check on the acceptability of the rule of thumb.
I I I . MODELS AND TERMINOLOGY, NOTATION, AND GENERAL-
CONCEPT TEPMINOLOGY AND MODELS
Illustrations appearing in Tables 1 and 2 are based on mature and immature population models used by Trowbridge: Contributions and funds at interest rates of 3~ and 4½ per cent for both models are shown in Appendix B. Trowbridge has shown these values assuming 2½ per cent.
The actuarial cost terminology follows the recommendations of the Committee on Pension and Profit-sharing Terminology. Trowbridge's funding class terminology is inc]uded to facilitate reference to his paper.
NOTATION
The following notation has been used to describe the calculations ap- pearing in Tables 1, 2, 3, and 4.
~I, = Index of effect on contributions of ¼ per cent increase in interest for actuarial cost method k over first r plan years.
kC~ = Pension contribution in year t for actuarial cost method k with interest at rate j .
Bt = Annual retirement benefits paid at beginning of year t. kF~ = Pension fund at beginning of year t (before contributions or bene-
fits then due) for actuarial cost method k and interest at rate j .
d ; = J 1-1- j "
~o = Subscript denoting ultimate level of benefits, contributions, funds, and index of effect.
GENERAL CONCEPT
The ratio of total contributions based on interest at 4½ per cent to total contributions based on 3½ per cent is used to determine the index of effect. The general concept can be expressed symbolically as
,c°, .°,,
kI, = 0 . 2 5 X 1 1 r
~--~ kp0.085
1
l C. L. Trowbrldge, "Fundamentals of Pension Funding," TSA, IV, 17.
(I)
172 THE EFFECT OF INTEREST ON PENSION CONTRIBUTIONS
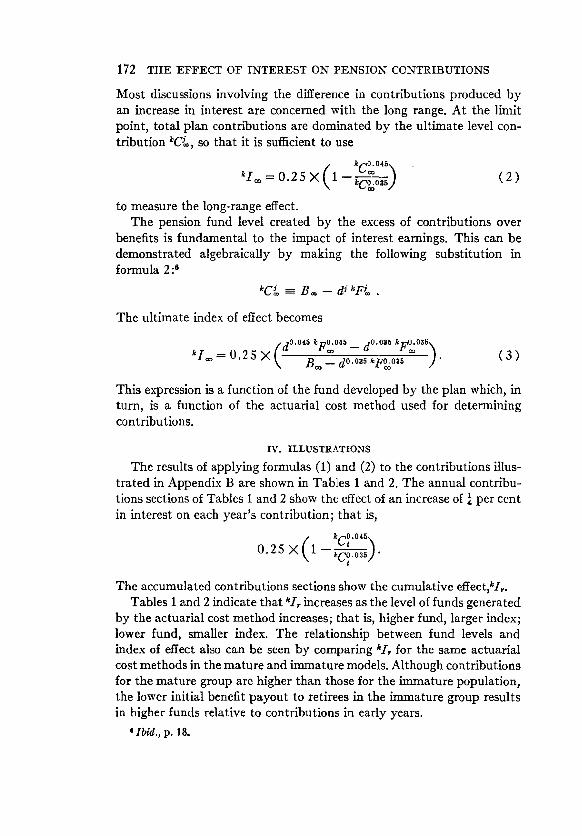
Most discussions involving the difference in contributions produced by an increase in interest are concerned with the long range. At the ]irnit point, total plan contributions are dominated by the ultimate level con- tribution kC~, so that it is sufficient to use
kI~ = 0.25 X ( 1 kC~°4~'~ ) ( 2 )
to measure the long-range effect. The pension fund level created by the excess of contributions over
benefits is fundamental to the impact of interest earnings. This can be demonstrated algebraically by making the following substitution in formula 2 :e
kC~ =--- B® -- d~" kF~ .
The ultimate index of effect becomes
0.045 k 0.045 0.085 k 0.08~
kI~ = 0 . 2 5 X \ Boo - d °'°35 kF°d°a5 / " (3)
This expression is a function of the fund developed by the plan which, in turn, is a function of the actuarial cost method used for determining contributions.
IV. I L L U S T R A T I O N S
The results of applying formulas (1) and (2) to the contributions illus- trated in Appendix B are shown in Tables 1 and 2. The annual contribu- tions sections of Tables 1 and 2 show the effect of an increase of ~ per cent in interest on each year's contribution; that is,
kC0.045, 0.25 X 1 ~ / .
The accumulated contributions sections show the cumulative effect,kit. Tables 1 and 2 indicate that kI, increases as the level of funds generated
by the actuarial cost method increases; that is, higher fund, larger index; lower fund, smaller index. The relationship between fund levels and index of effect also can be seen by comparing kit for the same actuarial cost methods in the mature and immature models. Although contributions for the mature group are higher than those for the immature population, the lower initial benefit payout to retirees in the immature group results in higher funds relative to contributions in early years.
e Ib/d., p. 18.

TABLE 1
INDEX OF EFFECT ON CONTRIBUTIONS MATURE POPULATION
CLASS I CLASS II CLASS II I CLASS IV
YZAR Individual
Pay-as- Terminal Accrued Bene- Level Cost-- Aggregate You-Go Funding fit--2 0-Yr. 2 0-Yr. Level Cost
Annual Contributions
I . . . . . . . . .
2 . . . . . . . . .
3 . . . . . . . . .
4 . . . . . . . . .
5 . . . . . . . . .
10 . . . . . . . . . 15 . . . . . . . . . 20 . . . . . . . . . 21 . . . . . . . . . 25 . . . . . . . . . 30 . . . . . . . . . 35 . . . . . . . . . 4 0 . . . . . . . . .
50 . . . . . . . . . Limit . . . . . . .
1 . . . . . . . . .
2 . . . . . . . . .
3 . . . . . . . . .
4 . . . . . . . . .
5 . . . . . . . . .
10 . . . . . . . . . 15 . . . . . . . . . 20 . . . . . . . . . 21 . . . . . . . . . 25 . . . . . . . . . 30 . . . . . . . . . 35 . . . . . . . . . 4 0 . . . . . . . . .
50 . . . . . . . . . Limit . . . . . . .
0 .00% .00 .00 .00 .00 .00 .00 .00 .00 .00 .00 .00 .00 .00
0.00
0 .00% .00 .00 .00 .00 .00 .00 .00 .00 .00 .00 .00 .00 .00
0.00
1.37% 1.75 1.75 1.75 1.75 1.75 1.75 1.75 1.75 1.75 1.75 1.75 1.75 1.75 1.75
1.84% 1.84 1.84 1.84 1.84 1.84 1.84 1.84 4.70 4.70 4.70 4.70 4.70 4.70 4.70
2 .16% 2.16 2.16 2.16 2.16 2.16 2.16 2.16 7.13 7.13 7.13 7.13 7.13 7.13 7.13
Accumulated Contributions
1.37% 1.40 1.43 1.45 1.47 1.54 1.58 1.61 1.62 1.63 1.65 1.66 1.67 1.68 1.75
1.84% 1.84 1.84 1.84 1.84 1.84 1.84 1.84 1.88 2.02 2.18 2.32 2.45 2.67 4.70
2 .16% 2.16 2.16 2.16 2.16 2.16 2.16 2.16 2.21 2.38 2.58 2.76 2.92 3.22 7.13
1.99% 2.03 2.08 2.14 2.19 2.54 3.00 3.56 3.68 4.18 4.81 5.38 5.86 6.52 7.13
1.99% 2.01 2.03 2.05 2.08 2.20 2.34 2.48 2.51 2.62 2.77 2.91 3.05 3.32 7.13

T A B L E 2
INDEX OF EFFECT ON CONTRIBUTIONS
IMMATURE POPULATION
Ci~ss I CLASS II CLASS III CLASS IV
YEn2 Individual Individual Terminal Accrued Bene- Aggregate Level Cost-- Level Cost-- Funding fit--20-Yr. Level Cost
Interest Only 20-Yr.
Annual Contributions
1 . . . . . . . . .
2 . . . . . . . . .
3 . . . . . . . . .
4 . . . . . . . . .
5 . . . . . . . . .
10 . . . . . . . . . 15 . . . . . . . . . 20 . . . . . . . . . 21 . . . . . . . . . 25 . . . . . . . . . 30 . . . . . . . . . 35 . . . . . . . . . 4 0 . . . . . . . . .
50 . . . . . . . . . L imi t . . . . . . .
1 . . . . . . . . .
2 . . . . . . . . .
3 . . . . . . . . .
4 . . . . . . . . .
5 . . . . . . . . .
10 . . . . . . . . . 15 . . . . . . . . . 20 . . . . . . . . . 21 . . . . . . . . . 25 . . . . . . . . . 30 . . . . . . . . . 35 . . . . . . . . . 4 0 . . . . . . . . .
50 . . . . . . . . . L imi t . . . . . .
3 . 0 2 % 3.02 3.02 3.02 3.02 3.02 3.02 3.02 3.02 3.02 3.02 3.02 3.02 3.02 3.02
1.75% 1.75 1.75 1 .75 1.75 1.75 1.75 1.75 1.75 1.75 1.75 1.75 1.75 1.75
3 85% 3.84 3,83 3.82 3.81 3.78 3.77 3 .74 4.73 4 .64 4 .56 4.67 4.73 4.73 4 .70
4 . 1 9 % 4.19 4.19 4 .19 4.19 4.19 4.19 4.19 7.13 7.13 7.13 7.13 7.13 7.13 7.13
3.86% 3.93 4 .00 4.07 4 .14 4.53 4.95 5.39 5.48 5.80 6.16 6.45 6.66 6.92 7.13
Accumulated Contributions
3 . 0 2 % 3.02 3.02 3.02 3.02 3.02 3.02 3.02 3.02 3.02 3.02 3.02 3.02 3.02 3.02
1.75% 1.75 1.75 1.75 1.75 1.75 1.75 1.75 1.75 1.75 1.75 1.75 1.75 1.75
3.85% 3.85 3 .84 3 .84 3.83 3.81 3 .80 3.79 3,81 3 .90 3 .98 4 .04 4 .10 4 .19 4 .70
4 . 1 9 % 4.19 4.19 4 .19 4 .19 4.19 4.19 4.19 4 .24 4.42 4.62 4 .79 4 .94 5.19 7.13
3 . 8 6 % 3.90 3.93 3 .96 3.99 4.15 4.31 4 .46 4 .49 4.61 4.75 4.89 5.01 5.23 7.13
THE EFFECT OF INTEREST ON PENSION CONTRIBUTIONS 175
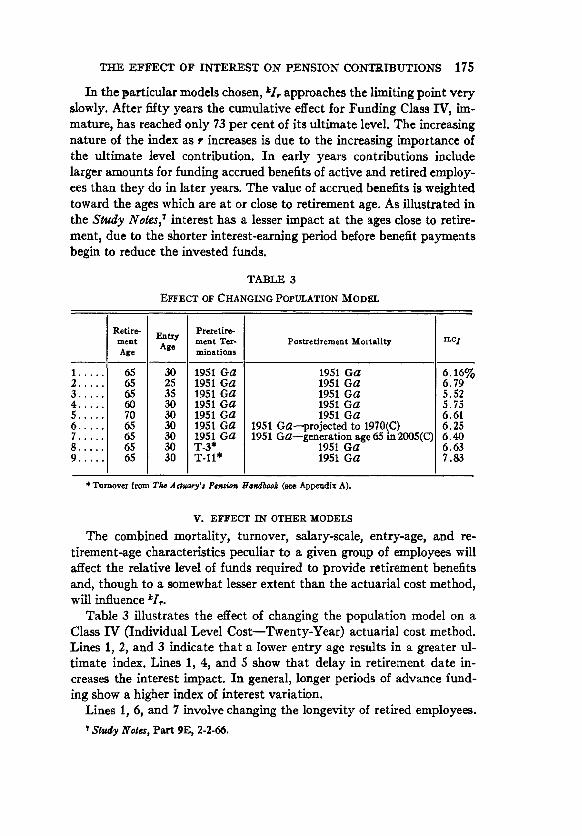
In the particular models chosen, ~I, approaches the limiting point very slowly. After fifty years the cumulative effect for Funding Class IV, im- mature, has reached only 73 per cent of its ultimate level. The increasing nature of the index as r increases is due to the increasing importance of the ultimate level contribution. In early years contributions include larger amounts for funding accrued benefits of active and retired employ- ees than they do in later years. The value of accrued benefits is weighted toward the ages which are at or close to retirement age. As illustrated in the S t u d y Noles , ~ interest has a lesser impact at the ages close to retire- ment, due to the shorter interest-earning period before benefit payments begin to reduce the invested funds.
TABLE 3
EFFECT OF CHANGING POPULATION MODEL
1 . . . . .
2 . . . . .
3 . . . . .
4 . . . . .
5 . . . . .
6 . . . . .
7 . . . . .
8 . . . . .
9 . . . . .
Retire- ment Age
65 65 65 60 70 65 65 65 65
Entry Age
30 25 35 30 30 30 30 30 30
Preretire- ment Ter- minations
1951 Ga 1951 Ga 1951 Ga 1951 Ga 1951 Ga 1951 Ga 1951 Ga T-3* T-11*
Postretirement Mortality
1951 Ga 1951 Ga 1951 Ga 1951 Ga 1951 GG
1951 Ga--projected to 1970(C) 1951 Ga--generation age 65 in 2005(C)
1951 Ga 1951 Ga
I L C ~
6.16~ 6.79 5.52 5.75 6.61 6.25 6.40 6.63 7 . 8 3
* Turnover from The Actuary'$ Petal.or* Handbook (see Appendix A).
V. EFFECT IN OTHER MODELS
The combined mortality, turnover, salary-scale, entry-age, and re- tirement-age characteristics peculiar to a given group of employees will affect the relative level of funds required to provide retirement benefits and, though to a somewhat lesser extent than the actuarial cost method, will influence k/~.
Table 3 illustrates the effect of changing the population model on a Class IV (Individual Level Cost--Twenty-Year) actuarial cost method. Lines 1, 2, and 3 indicate that a lower entry age results in a greater ul- timate index. Lines 1, 4, and 5 show that delay in retirement date in- creases the interest impact. In general, longer periods of advance fund- ing show a higher index of interest variation.
Lines 1, 6, and 7 involve changing the longevity of retired employees.
7 Study Notea, Part 9E, 2-2-66.

176 TEE EFFECT OF INTEREST ON PENSION CONTRIBUTIONS
Lower postretirement mortality rates result in the maintenance of higher retired life funds for a longer period of time leading to greater interest earnings.
The effect of turnover is illustrated in lines 1, 8, and 9. T-3 is low turnover and T-11 high turnover (see Appendix A). The ultimate con- tribution required for a group with a high-turnover characteristic is lower than that for a no-turnover group, since a smaller number of survivors reach retirement date. However, in these examples, ultimate funds generated by the high-turnover group are larger, relative to the ultimate contribution, than those for the low-turnover group due to a greater impact of benefit of survivorship on the accrual of contributions. The result is a larger index of interest variation in the higher-turnover model.
VI. CHOICE OF INTEREST INTERVAL
I t has been assumed in this paper that the index of variation is inde- pendent of the interest interval over which it is measured. Table 4 com-
T A B L E 4
Actuarial 3}-4½ 2½-3½ (1)--(2) Cost Actuarial Cost Method Per Cent Per Cent Class (1) (2) (3)
I . . . . . . . I n d i v i d u a l L e v e l C o s t - - I n t e r e s t O n l y 3 . 0 2 % 3 . 1 9 % - - 0 . 1 7 % II . . . . . . T e r m i n a l F u n d i n g 1 . 7 5 1 . 8 6 - - . 12 III . . . . . A c c r u e d B e n e f i t 4 . 7 0 5 . 0 1 - - .31 I V . . . . . . I n d i v i d u a l L e v e l C o s t - - 2 0 - Y e a r 7 . 1 3 7 . 1 5 - 0 . 0 2
pares kI~ calculated over two different interest intervals. Column 1 is the limit index shown in Tables 1 and 2, and column 2 is based on one- fourth of the interval from 2½ to 3~ per cent. Column 3 indicates that, although the index is not independent of interest rate, the choice of interval is not a critical factor in the range from 2½ to 4½ per cent. Choice of the 3½ to 4½ per cent interval is perhaps more appropriate today con- sidering current interest levels.
VII. CONCLUSION
Based on the population models and actuarial cost methods examined in this paper, the 6 per cent rule of thumb is appropriate only for Class IV and only in the very long range. Even for Class IV the index may be more than or less than 6 per cent, depending on the actual population characteristics. For general use, a 3-5-7 rule of thumb, properly hedged as applying to a particular model, does a better job of approximating the index for actuarial cost methods typically encountered, that is, 3 per cent for Class l--individual Level Cost--lnterest Only; 5 per cent for Class
THE EFFECT OF INTEREST ON PENSION CONTRIBUTIONS 177
H I - - A c c r u e d Benefit; and 7 per cent for Class IV- - Ind iv idua l Level Cos t - -Twenty-Year , or Aggregate Level Cost. The 3-5-7 rule applies only to long-range total contributions. I t does not apply to present value of liabilities, for which the index is between 3 and 4 per cent, or to funds, for which the appropriate indices are about one-half of those for contribu- tions, or to other parameters.
For those interested in the short range, Tables 1 and 2 provide a rough and ready reference. For example, for the thirty-five-year period during which the initial active employee group will completely turn over, a 3-4-5 rule of thumb is indicated. The tables in Appendix B m a y be used to calculate short-range contributions for Individual Level Cost using other than twenty-year amortization of the initial supplemental liability.
ACKNOWLEDGMENT
The author is indebted to C. L. Trowbridge for his helpful suggestions.
APPENDIX A
TURNOVER SCALES
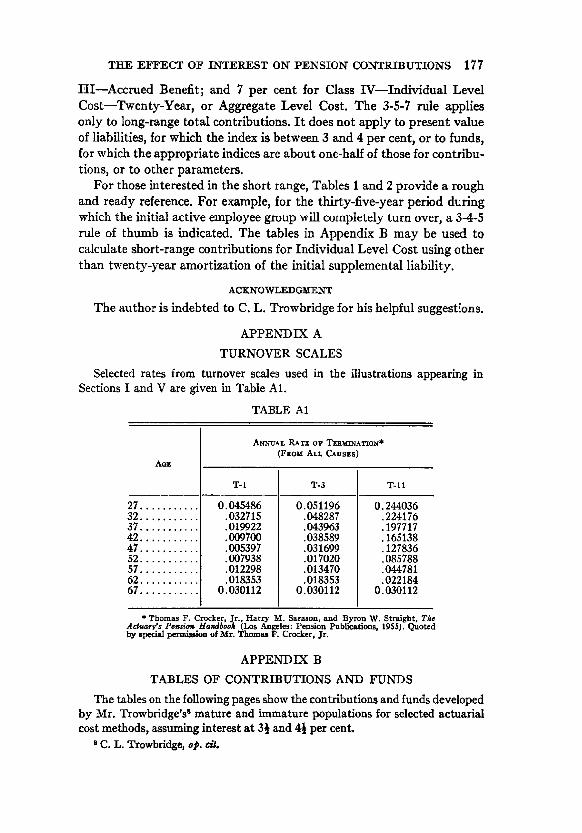
Selected rates from turnover scales used in the illustrations appearing in Sections I and V are given in Table A1.
TABLE A1
ANNUAL RATE OF TERMINATION* (FRo,~ ALL CAuses)
AOE
T-1 T-3 T-I1
27 . . . . . . . . . . . 32 . . . . . . . . . . . 37 . . . . . . . . . . . 42 . . . . . . . . . . . 47 . . . . . . . . . . . 52 . . . . . . . . . . . 57 . . . . . . . . . . . 62 . . . . . . . . . . . 67 . . . . . . . . . . .
0.045486 .032715 .019922 .009700 .005397 .007938 .012298 .018353
0.030112
0•051196 • 048287 • 043963 • 038589 .031699 .017020 •013470 .018353
0•030112
0.244036 •224176 •197717 •165138 •127836 .085788 .044781 •022184
0.030112
* Thomas F• Crocker Jr., Harry M. Sarason and Byron W. Straight, The Act~ry's Pead~ Ha~b~k (Los Angeles: Pension Publications, 1955). Quoted by special permission of Mr. Thomas F. Crocker, Jr.
APPENDIX B
TABLES OF CONTRIBUTIONS AND FUNDS
The tables on the following pages show the contributions and funds developed
by Mr. Trowbridge'# mature and immature populations for selected actuarial
cost methods, assuming interest at 3~ and 4~ per cent.
B C. L. Trowbridge, o~. dJ.
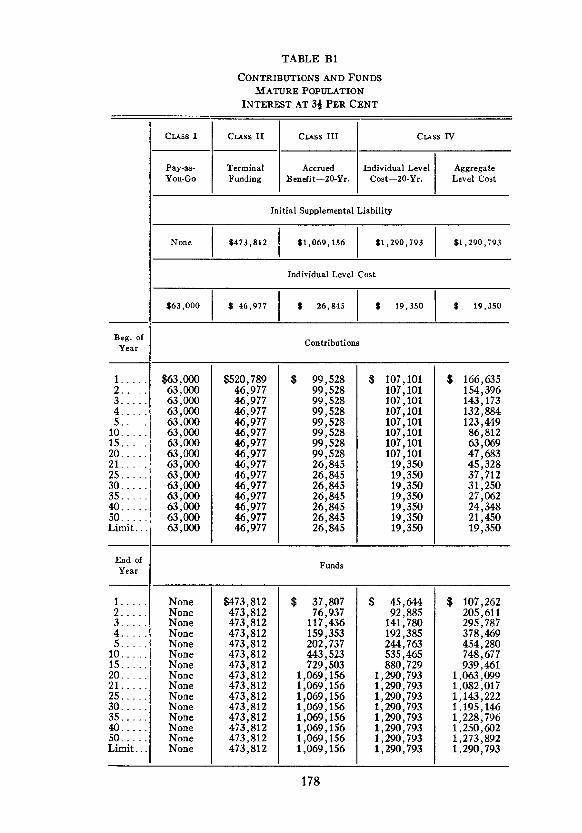
TABLE BI
CONTRIBUTIONS AND FUNDS MATURE POPULATION
INTEREST AT 3~t PER CENT
Cuss I Cuss II Cuss III Cuss IV
Pay-as- Terminal Accrued Individual Level Aggregate You-Go Funding Benefit--20-Yr. Cost--20-Yr. Level Cost
Initial Supplemental Liability
None I $473,812 $1,069,156 I 51,290,793 $1,290,793
Individual Level Cost
$63,000 ] $ 46,977 $ 26,845 I $ 19,350 $ 19,350
Beg. of Contributions Year
$ $ 1 . . . . .
2. 3 . . . .
4. 5.
10 . . . . 15. 20. 21 . . . . 25 . . . . 30 . . . . 35 . . . . 4 0 . . . .
50. Limit. ".
$63,000 63,000 63,000 63,000 63,000 63,000 63,000 63,000 63,000 63,000 63,000 63,000 63,000 63,000 63,000
$520,789 46,977 46,977 46,977 46,977 46,977 46,977 46,977 46,977 46,977 46,977 46,977 46,977 46,977 46,977
99,528 99,528 99,528 99,528 99,528 99,528 99,528 99,528 26,845 26,845 26,845 26,845 26,845 26,845 26,845
E n d o f Y e a r F u n d s
1 . . . . .
2 . . . . .
3 . . . . .
4. 5.
10. .. 15. .. 20. .. 21. .. 25. .. 30. .. 35 . . . . 4 0 . . . .
50.. Limit.•
$ 107,101 107,101 107,101 107,101 107,101 107,101 107,101 107,101 19,350 19,350 19,350 19,350 19,350 19,350 19,350
166,635 154,396 143,173 132,884 123,449 86,812 63,069 47,683 45,328 37,712 31,250 27,062 24,348 21,450 19,350
None None None None None None None None N o n e
None None None None None None
$473,812 473,812 473,812 473,812 473,812 473,812 473,812 473,812 473,812 473,812 473,812 473,812 473,812 473,812 473,812
$ 37,807 76,937
117,436 159,353 202,737 443,523 729,503
1,069,156 1,069,156 1,069,156 1,069,156 1,069,156 1,069,156 1,069,156 1,069,156
$ 45,644 92,885
141,780 192,385 244,763 535,465 880,729
1,290,793 1,290,793 1,290,793 1,290,793 1,290,793 1,290,793 1,290,793 1,290,793
$ 107,262 205,611 295,787 378,469 454,280 748,677 939,461
1,063,099 1,082,017 1,143,222 1,195,146 1,228,796 1,250,602 1,273,892 1,290,793
178

TABLE B2
CONTRIBUTIONS AND FUNDS MATURE POPULATION
INTEREST AT 4} PER CENT
CLASS I CLASS II CLASS I I I CLASS IV
Pay-as- Terminal Accrued Individual Level Aggregate You-Go Funding Benefit--20-Yr. Cost--20-Yr. Level Cost
Initial Supplemental Liability
i $ 956,897 $1,141,857 ] $1,141,857 None $448,529
Individual Level Cost
43,685 t $ 21,794 $ 13,829 [ $ 13,829 $63,000 $
Beg. of Contributions Year
$ 1 . . . . . 2 . . . . . 3 . . . . . 4 . . . . . 5 . . . . .
10 . . . . . 15 . . . . . 20 . . . . . 21 . . . . . 25 . . . . . 30 . . . . . 35 . . . . . 40 . . . . . 50 . . . . . Limit...
$63,000 63,000 63,000 63,000 63,000 63,000 63,000 63,000 63,000 63,000 63,000 63,000 63,000 63,000 63,000
~92,214 ~ , ~ 5 ~ , ~ 5 ~ , ~ 5 ~ , ~ 5 ~ , ~ 5 ~ , ~ 5 ~ , ~ 5 ~ , ~ 5 ~ , ~ 5 ~ , ~ 5 ~ , ~ 5 ~ , ~ 5 ~ , ~ 5 ~ , ~ 5
92,189 92,189 92,189 92,189 92,189 92,189 92,189 92,189 21,794 21,794 21,794 21,794 21,794 21,794 21,794
End of Year Funds
1 . . . . . 2 . . . . . 3 . . . . . 4 . . . . . 5 . . . . .
10 . . . . . 15 . . . . . 20 . . . . . 21 . . . . . 25 . . . . . 30 . . . . . 35 . . . . . 40 . . . . . 50 . . . . . Limit. . .
$ 97,831 97,831 97,831 97,831 97,831 97,831 97,831 97,831 13,829 13,829 13,829 13,829 13,829 13,829 13,829
$ 153,384 141,840 131,251 121,538 112,629 77,990 55,495 40,888 38,649 31,401 25,241 21,240 18,642 15,860 13,829
None None None N o n e None None None None None None N o n e None None None None
$448,529 448,529 448,529 448,529 448,529 448,529 448,529 448,529 448,529 448,529 448,529 448,529 448,529 448,529 448,529
$ 30,502 62,377 95,686
130,494 166,869 374,817 633,959 956,897 956,897 956,897 956,897 956,897 956,897 956,897 956,897
$ 36,398 74,434
114,181 155,717 199,123 447,266 756,497
1,141,857 1,141,857 1,141,857 1,141,857 1,141,857 1,141,857 1,141,857 1,141,857
$ 94,452 181,090 260,562 333,460 400,328 660,299 829,124 938,759 955,557
1,009,955 1,056,190 1,086,215 1,105,713 1,126,597 1,141,857
179

TABLE B3
CONTRIBUTIONS AND FUNDS IMMATURE POPULATION
INTEREST AT 3~ PER CENT
Beg. of Year
1 , , .
2 . . . 3 . . . 4 . . . 5 . . .
10. . . 15. . . 20. . . 21 . . . . 25 . . . . 30 . . . . 35 . . . . 40 . . . . 50 . . . . Limit..
CLASS I CLASS II CrAss III CLASS IV
Individual Terminal Accrued Individual Level Aggregate Level Cost-- Interest Only Funding Benefit--20-Yr. Cost--20-Yr. Level Cost
Initial Supplemental Liability
$ 543,034 None $ 353,$09 $ 543,034 $ 543,034
Ultimate Supplemental Liability
$1,290,793 $ 4 7 3 , 8 1 2 $ 1 , 0 6 9 , 1 5 6 $1,290,793 [ $1,290,793
Initial Individual Level Cost
$ 19,350 None $ 20,461 $ 19,350 [ $ 19,350
Ultimate Individual Level Cost
$ 19,350 $ 46,977 $ 26,845 $ 19,350 J $ 19,350
Contributions
$ 37,713 37,713 37,713 37,713 37,713 37,713 37,713 37,713 37,713 37,713 37,713 37,713 37,713 37,713 37,713
$ 9,395 14,093 17,083 21,353 36,136 39,148 40,850 41,105 41,944 51,675 58,722 46,621 45,565 46,977
44,493 45,354 46,106 46,794 47,380 49,206 50,192 51,046 27,180 27,842 28,131 26,813 26,418 26,676 26,845
$ 56,266 56,266 56,266 56,266 56,266 56,266 56,266 56,266 19,350 19,350 19,350 19,350 19,350 19,350 19,350
$ 80,052 75,000 70,424 66,283 62,514 47,937 38,261 31,773 30,761 27,458 24,605 22,712 21,515 20,263 19,350
180

TABLE B3--Continued
End of
Year
I . . . .
2. 3 .o
4. 5.
10. 15. 20. 21. 25. 30. 35 . . . . 4 0 . . . .
50 . . . . Limit..
CrAss I
IndividuM Level Cost-- Interest Only
Crass I I
Terminal Funding
Cuss III
Accrued Beneflt--20-Yr.
CLASS IV
Individual Level Cost--20-Yr. i
I
Aggregate Level Cost
Funds
$ 39,033 78,564
118,173 157,675 196,715 376,116 518,060 622,546 639,530 697,265 751,149 770,834 763,674 743,878 747,760
$ 8,855 21,578 36,346 54,206
166,389 270,898 342,871 353,576 386,261 428,682 497,389 505,569 476,464 473,812
$ 46,050 93,734
142,561 192,314 242,571 490,871 721,447 936,168 953,227
1,013,061 1,073,136 1,096,106 1,087,475 1,064,885 1,069,156
$ 58,236 117,640 177,820 238,612 299,686 601,386 888,581
1,165,580 1,182,564 1,240,299 1,294,184 1,313,869 1,306,709 1,286,914 1,290,793
$ 82,854 162,509 238,913 312,210 382,327 684,007 907,239
1,065,526 1,090,819 1,175,565 1,252,502 1,287,001 1,289,309 1,279,624 1,290,793
181

TABLE B4
CONTRIBUTIONS AND FUNDS IMMATURE POPULATION
INTEREST AT 41 PER CENT
CLASS I
1 . . . . .
2 . . . . .
3 . . . . .
4 . . . . .
5 . . . . .
10 . . . . . 15 . . . . . 20 . . . . . 21 . . . . . 25 . . . . . 30 . . . . . 35 . . . . . 4 0 . . . . .
50 . . . . . Limit. . .
Individual Level Cost-- Interest Only
CLASS II
Terminal Funding
CLASS III
Accrued Benefit--
20-Yr.
CLASS IV
Individual Level Cost--20-Yr.
Aggregate Level Cost
Initial Supplemental Liability
$ 448,756 None $292,552 I $ 448,756 [ $ 448,756
Ultimate Supplemental Liability
$1.141.857 $448.529 I $956.897 [ $1,141,857 $I,141,857
Initial Individual Level Cost
$ 13,829 None $ 16,114 [ $ 13,829 $ 13,829
Ultimate Individual Level Cost
$ 13,829 $ 43,685 $ 21,794 I $ 13,829 $ 13,829
Beg. of Contributions Year
$ $ 33,154 33,154 33,154 33,154 33,154 33,154 33,154 33,154 33,154 33,154 33,154 33,154 33,154 33,154 33,154
$ 8,737 13,106 15,886 19,857 33,604 36,404 37,987 38,225 39,005 48,054 54,606 43,354 42,372 43,685
37,636 38,385 39,041 39,644 40,157 41,757 42,626 43,403 22,036 22,670 22,996 21,802 21,419 21,633 21,794
$ 46,842 46,842 46,842 46,842 46,842 46,842 46,842 46,842 13,829 13,829 13,829 13,829 13,829 13,829 13,829
67,683 63,212 59,162 55,496 52,159 39,252 30,678 24,922 24,023 21,085 18,543 16,851 15,780 14,655 13,829
182

TABLE B4--Contlnued
CLASS I
Individual Level Cost-- Interest Only
CLASS II
Terminal Funding
CLASS III
Accrued Benefit--
2 O-Yr.
End of Funds Year
X . . . . . .
2 . . . . . .
3 . . . . .
4 . . . . .
5 . . . . .
10 . . . . . 15 . . . . . 20 . . . . . 21 . . . . . 25 . . . . . 5 0 . . . . .
35 . . . . . 4 0 . . . . .
5 0 . . . . .
Limit...
CLASS IV
Individusl Level Cost--20-Yr.
Aggregate Level Cost
$ 34,645 69,972
105,572 141,265 176,702 341,164 472,856 570,893 586,967 642,139 694,999 715,273 708,927 689,682 693,101
$ 8,252 20,125 33,928 50,639
155,994 254,850 323,436 333,673 364,970 405,226 469,974 478,308 451,286 448,529
$ 39,329 80,334
122,553 165,793 209,652 428,229 633,512 827,852 843,871 900,521 958,868 982,395 974,929 953,244 956,897
$ 48,950 99,225
150,446 202,463 254,958 516,942 770,163
1,019,649 1,035,723 1,090,895 1,143,755 1,164,030 1,157,684 1,138,439 1,141,857
$ 70,729 139,090 204,979 268,493 329,515 594,735 793,560 936,160 959,129
1,036,751 1,108,828 1,141,480 1,143,057 1,132,300 1,141,857
183
DISCUSSION OF PRECE D IN G PAPER
B A R N E T N'. B E R I N :
We come much closer to the practical everyday problem of describing "the effect on contributions of a variation in the interest rate" by con- sidering (a) the effect on actual accrued liabilities and on actual current- service costs and (b) the long-range effect as measured in the year-to-year change in expected interest earnings.
The first is capable of an exact answer, based on the latest available data, or at least a good estimate. We could respond to (b) by indicating how actual interest earnings and expected interest earnings act to de- termine yearly interest gains or losses under either the immediate or spread method of recognizing gains or losses and by showing how this result will be affected by a change in the expected interest rate.
The author has raised an interesting question. He responds by re- sorting to ultimate employee distributions which have little application to any one company's experience. I personally feel that the stationary population concept is misleading in pension calculations.
R I C H A R D D A S K A I S :
The 3 per cent rule of thumb (for Class I, Individual Level Cost-- Interest Only) is for use in practical situations. Caution should be exer- cised to make sure that it is properly applicable to any practical situation for which it is used.
The index increases as the ratio of the individual level cost to the un- funded supplemental liability increases. The ratio and the index will increase if there is an increase in the number of employees covered by the plan or, in a plan whose benefits are pay-related, if there is an increase in aggregate pay of the covered employees. In the latter case, if the pay increases were greater than any assumed in the valuation assumptions, the method of adjusting costs for the actuarial losses would affect the results. I t should be noted that, even if no employee receives a pay in- crease but new entrants' pay is greater than the pay of retiring and terminating employees, there is an increase in the aggregate pay of cov- ered employees. The effect of pay increases will be particularly great in a plan integrated with social security by means of a stepped-up benefit rate, where the benefit percentages and breaking point have not been changed with increases in social security benefits and the social security maximum wage base.
Employee contributions produce leverage in the effect on employer
184

DISCUSSION 185
costs of contributory plans. Whatever rule of thumb is applicable must be applied to the total contributions used to provide retirement benefits (i.e., not to the portion of employee contributions which will be used to provide preretirement lump-sum death and termination benefits) in order to approximate the total effect of a change in interest, and this effect must then be related to the employer cost.
Based on the limited sample of the plans with which I have worked, a large proportion of salaried employees' plans has experienced pay and coverage increases, and it is likely that the same will be true of new plans.
DONALD S. GRUBBS, JR.:
Mr. Adams has provided very helpful information to assist in estimat- ing the effect of interest-rate changes without extensive calculations.
One minor problem is his assumption that the effect of an increase of ¼ per cent would be 0.25 times the effect of an increase of 1 per cent. The interpolation should be geometric rather than arithmetical. For example, if increasing the interest rate 1 per cent decreases the contributions by 24 per cent, Mr. Adams would conclude that the reduction for each } per cent reduction is 6 per cent; when a geometric approach is used, the reduc- tion is 6.63 per cent.
1 - - ( 0 . 7 5 ) 1/4 = 0 .0663 .
Mr. Adams shows the effect if both the assumed interest rate and the actual interest rate are changed. If only one of these two is changed, the effect will be significantly different. In his example Mr. Adams shows that, if the assumed interest rate and actual interest rate are 3} per cent under Class IV, the ultimate fund is $1,290,793 and the ultimate employer contribution MU be $19,350, whereas if the assumed and actual interest rates are 4} per cent, the ultimate fund is $1,141,857 and the ultimate contribution is $13,829. But, ff the assumed interest rate is maintained at 3} per cent while the actual interest rate increases to 4} per cent, the ultimate fund will be determined by the assumed interest rate and will be $1,290,793. The ultimate rate of contribution will be the normal cost of $19,350 less the interest gain of $12,908, or $5,442. This would be a reduction of 56.71 per cent, or 15.58 per cent for each } per cent change in interest rate according to Mr. Adams' method, compared to 7.13 per cent shown in Table 2. This is a measurement of the fact that, ff the interest assumption is not increased to agree with investment income received, the cost reduction will be deferred, so that the cost in the earlier years will be higher and the ultimate cost lower than if the assumed interest rate were increased.

186 THE EFFECT OF INTEREST ON PENSION CONTRIBUTIONS
ROBERT F. LINK:
Mr. Adams ' paper appropriately shows that statements about interest effects on pension costs are often oversimplified and overoptimistic. To illustrate additional dimensions of the problem, here is an imaginary conversation between Mr. Smith, president of Amalgamated Washers, and Mr. Johnson, his actuary.
MR. SMITH: What would happen to my pension costs if I could raise the yield on the fund by 1 per cent?
MR. JOHNSON: Do you mean if you could raise it instantly? MR. SMITH: Yes. MR. JOHNSON: You would have an additional amount of 1 per cent of your
fund each year to reduce costs. This reduction would grow each year as your fund grows.
MR. SMITH: Do you mean that my contribution would drop by 1 per cent of the fund starting in the first year?
MR. JOHNSON: Not exactly. We are spreading gains, remember? MR. SMITH: Well, how can I get this 25 per cent reduction that I read about? MR. JoHNsoN: We could reduce costs by changing the interest assumption,
but I would be inclined to be cautious and raise it by only ½ or { per cent. MR. SMITH: Then I would get a reduction of 18 or 19 per cent right away? MR. JOHNSON: Well, taking into account your unfunded liability payments,
you might reduce contributions at the start by, say, 12-14 per cent and, of course, considerably more later on if everything works out.
MR. S~JTH: Oh.
The statements tha t we read about interest and pension costs almost always make---and almost never ment ion- -an assumption. The assump- tion is that actual yield and the assumed yield for funding purposes will be simultaneously changed by the same increment. This, of course, seldom happens. Subject to the limitations that Mr. Adams illustrates, such statements have validity in two frames of reference: first, they reveal the effect of a change in interest assumption if gains are excluded and, second, they may measure reasonably the total effect, over long periods, of a change in actual earnings.
CHARLES L. TROWBRIDGE:
Mr. Adams has done a real service for pension actuaries. M a n y have used the rule of thumb that he quotes, but no one before him has made the effort to substitute demonstrations for impressions. I am personally gratified that he has done so, because his is a first paper from a relatively new FSA and because he has found it useful to use a mathematical model from m y paper of fifteen years ago.
The identi ty of the original maker of this useful rule may well be lost.

DISCUSSION 187
The sources from actuarial literature that Mr. Adams quotes are all relatively recent, and I feel sure that the rule has been around the pension field longer than it has appeared in print. To some extent, at least, one may well have taken from another, or from some pre-World War I I source not clearly identified.
My personal version of this rule (and I have been as guilty as any of using it without a really satisfactory demonstration) has been that a difference of ~ per cent in i means about 6 per cent in contribution). We could call it, then, a I-to-24 rule. To satisfy myself that the rule makes sense, I have used two rationalizations, neither of them satisfactory and both of them related to the number 24.
One of them hinged around the undisputed fact that (1.0025) ~4 -- 1.06, and (I + i + 0.0025)~4/(I + i) ~4 for usual values of i is not much differ- ent. If one had any reason to think that the average time between pay in and pay out of a dollar in a pension fund was 24 years, the rule would seem reasonable. Although 24 in this context does not seem unreasonable, neither do 18 or 36. The rationalization appears to be the rule itself, stated in a different form. Perhaps Mr. Adams can show us, from his interesting tables, that 24 years more or less is correct.
A second rationalization came from the concept of the equation of equilibrium. Suppose that we had a mature pension fund with contribu- tions (C), funds (F), and benefits (B) stabilized at interest rate i such that C + iF = B. Assume also that F/C = N. If F and B are undis- turbed by a change in interest rate &i, then AC is --AiNC. Since the rule tells us that if Ai ---- 0.0025, AC = --0.06C, then N must be 24. This appears to justify the rule if the ultimate fund is typically 24 times the ultimate contribution. Unfortunately, the typical N appears to be sub- stantially higher, and this approach seems to disprove the rule of thumb.
Mr. Adams has now shown how to remove the contradiction, by recognizing that F is not independent of i. His tables tell us that a larger i produces a smaller F as well as a smaller C and that the effect of ~ per cent interest on F is about half its effect on C. Thus, as i increases by 0.0025, F must decrease by about 3 per cent, if, as the rule tells us, C decreases by 6 per cent. F/C = N must therefore increase by about 3 per cent. Putting this all together at i = 0.035,
B Co.o35 1 + 0 . 0 3 5 N '
B Co.o375 1 + 0 . 0 3 7 5 N ( 1 . 0 3 ) '
Co.o~5 = 1 + 0 . 0 3 5 N = 1 - - 0 . 0 6 ,
Co o,5 1 + 0 . 0 3 7 5 N ( 1 . 0 3 )

188 THE EFFECT OF INTEREST ON PENSION CONTRIBUTIONS
and we force out an N of approximately 46, which lies between the N's he illustrates for Class I I I (about 40) and Class IV (about 66). Mr. Adams clearly tells us that the 1-to-24 rule lies between Class I I I and Class IV - - so, in a way, we have arrived at the same place.
CECIL J. NESBITT:
As a means for examining the effect of interest on pension contribu- tions, the author has gone back to the now classical pension-funding models presented by Trowbridge in his paper "Fundamentals of Pension Funding" (TSA, Vol. IV [1952]). He is thereby able to investigate for a number of standard funding methods both the short-range and the long- range effects of changes in the interest assumption. He does this for both the mature and the immature population models and obtains a compre- hensive view of the effect of interest on pension contributions. His in- vestigations lead him to observe that the higher the fund generated by the actuarial cost method, the higher the index of effect on contributions of an increase in interest. As the fund generated is in opposite relation to the ultimate contribution, one might rephrase the observation as "the lower the ultimate contribution, the higher the index," or, again, "the lower the ultimate contribution, the longer the average term of invest- ment of the contribution before it is utilized for pension outgo---hence, the longer the average investment term, the higher the index."
One might argue that the Trowbridge models are oversimplified and unrepresentative. I t is part of their usefulness that they are simple enough to be examined easily both arithmetically and algebraically. Moreover, the lz function of the model may be thought to be based on withdrawal and salary-increase assumptions as well as mortality and therefore may not be unrealistic. In considering these points, I was re- minded of a note entitled "The Effect on Pension Fund Contributions of a Change in the Rate of Interest," by M. T. L. Bizley (JIASS, X [1950], 47). Bizley let 100c(x) be the percentage contribution for entry age x required to support a pension per annum equal to 100k per cent of pen- sionable salary ~r for each year of service, with pension payable from retirement age r, say. Then
/f/ c ( x ) = kDrarr(r - x ) D~s~dy,
where s~ is the salary-scale factor at age y. This may be rearranged as
f° Wy/ffD c (x ) =R D usudy,
DISCUSSION 189
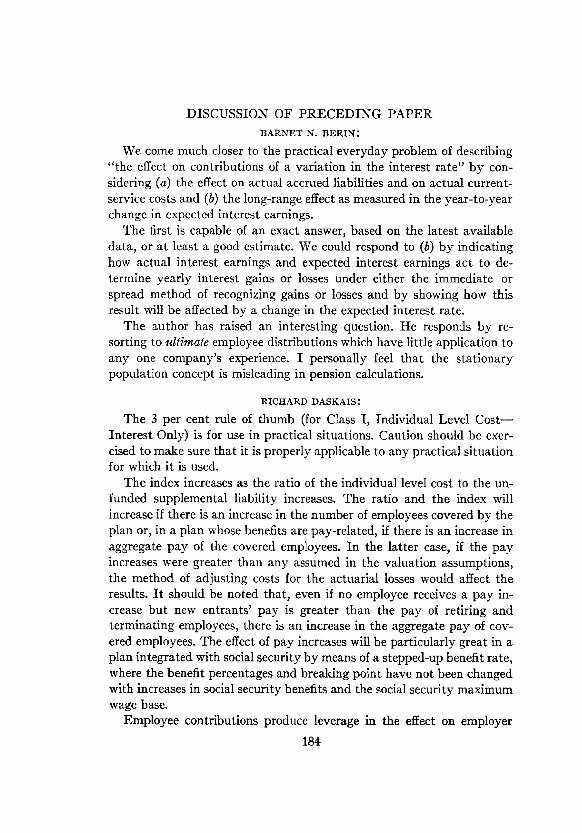
where R does not depend on i, and D~ is based on the mortality for retired lives. On taking logarithms of each side and differentiating, one obtains
[dc (x ) / d i ] / c ( x ) = -- v ( y2 - - y l )
where yx is the weighted average age
and y2 is the weighted average age
From this, one obtains
- - A c ( x ) / c ( x ) "-- v ( y 2 - - y l ) A i .
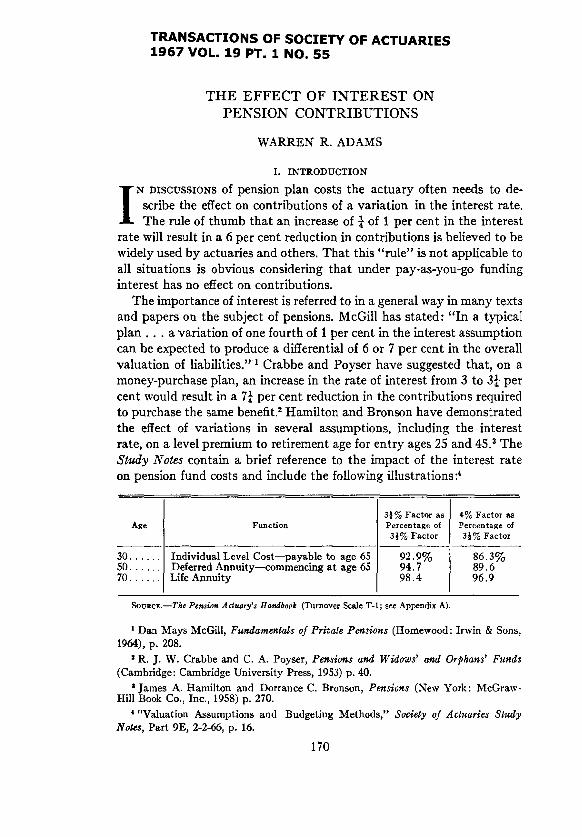
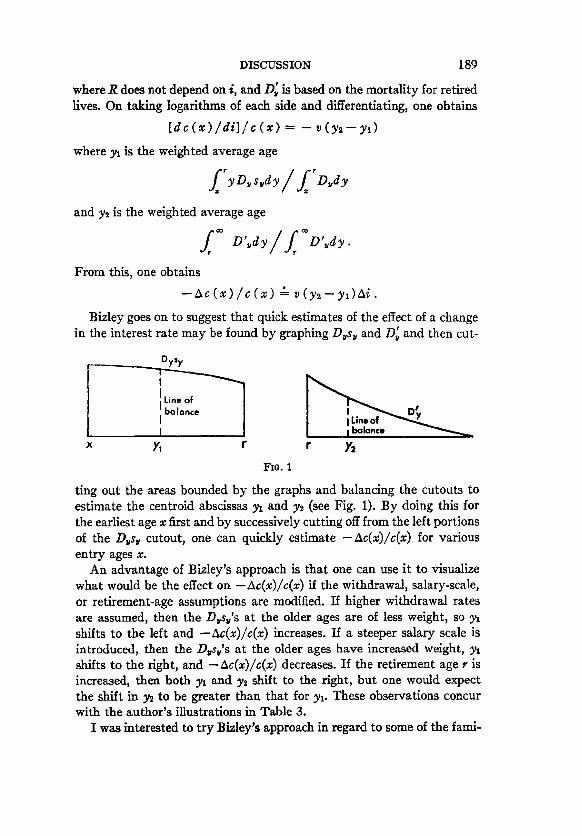
Bizley goes on to suggest that quick estimates of the effect of a change in the interest rate may be found by graphing Dysy and D~ and then cut-
Dysy
Ii Line of I balance
I X Yw r
FIG. 1
ting out the areas bounded by the graphs and balancing the cutouts to estimate the centroid abscissas yl and y~ (see Fig. 1). By doing this for the earliest age x first and by successively cutting off from the left portions of the D~su cutout, one can quickly estimate --Ac(x)/c(x) for various entry ages x.
An advantage of Bizley's approach is that one can use it to visualize what would be the effect on --nc(x)/c(x) if the withdrawal, salary-scale, or retirement-age assumptions are modified. If higher withdrawal rates are assumed, then the D,sy's at the older ages are of less weight, so yl shifts to the left and --Ac(x)/c(x) increases. If a steeper salary scale is introduced, then the Dus,'s at the older ages have increased weight, yx shifts to the right, and --Ac(x)/c(x) decreases. If the retirement age r is increased, then both yl and y, shift to the right, but one would expect the shift in y2 to be greater than that for yl. These observations concur with the author's illustrations in Table 3.
I was interested to t ry Bizley's approach in regard to some of the fami-

190 THE EFFECT OF INTEREST ON PENSION CONTRIBUTIONS
lies of funding methods that have been developed recently by Trowbridge, Taylor, and Cooper and Hickman. In my discussion of Taylor 's paper, "The Generalized Family of Aggregate Cost Methods for Pension Fund- ing" (TSA, Vol. XIX) , I mentioned a modified aggregate cost method with a = 1 / ~ , that is, with contribution at each valuation date equal to the annual payment to amortize the unfunded liabilities over the next n years. If this method is applied to Trowbridge's model plan for a mature population, one finds that the ultimate contribution rate "Coo is given by
"C~ = (1 + i ) , - 1 , N ,
where ZN = la" r--a[5~ is the annual normal cost under initial funding. This may be rewritten as
"C~ = ( 1 + i ) a + " - l A ? ~ .
If one now takes logarithmic derivatives, assuming n is independent of i, and puts the result in differential form, one gets
--A'C=/'C~ "-- v[ y2-- ( a + n - 1) ]Ai ,
where in this case
y , = f ~ y D , d y / f ~ D ~ d y .
If n = y~ -- a + 1, then -A'C~/~C~ "- O, and the modified aggregate cost funding approximates pay-as-you-go funding (the exact n that brings out pay-as-you-go funding is a function of i and would alter the differentiation slightly). If n > y2 -- a 4- 1, then A~C~/"C,= "- v[n -- (y~ -- a 4- 1)]Ai is positive, and an increase in the interest rate increases the contribution level. This can happen in the somewhat heretical situa- tion where "F~ is negative, that is, represents debt, and "C~ is the benefit outgo plus interest on the debt. In other words, contributions would be stabilized at a level higher than pay-as-you-go costs. This indicates the possibility of actuarial cost methods even weaker than those of Class I.
As an application of Bizley's method to Cooper and Hickman's paper on "A Family of Accrued Benefit Actuarial Cost Methods" (TSA, Vol. XIX) , I considered
b(x ) = re(x) .~-~[ ~ = r e ( x ) ( 1 4-i)~1V~/l~,
where re(x) is their pension-purchase density function and b(x) is the an- nual rate of contribution at attained age x. One finds, after logarithmic differentiation, that
- - A b ( x ) / b ( x ) - { v ( y ~ - - x ) - - [ d m ( x ) / d i l / r a ( x ) } A i .

DISCUSSION 191
If re(x) is independent of i, this becomes v(ys -- x)Ai, which measures the effect of an interest-rate increase on the unit single premium at at- tained age x. If re(x) varies as v ~, that is,
/f/ r e ( x ) = v. v~dy ,
then the formula becomes
v ( y s - - y ~ ) A i ,
where
L" /L" y~ = y vvdy v~dy .
If re(x) varies as (1 + i) ~, that is,
/L" m ( x ) = (1 + i ) • (1 + i ) ~ d y ,
then the formula is
v ( y ~ ' + y ~ - - 2 x ) A i ,
where
L /L y'~' = y( t +i)~dy (1+i)~dy.
It should be noted that these formulas measure the effect of interest on the annual rate of contribution at attained age x and not the aggregate effect on the total contribution for the covered group.
The author has provided useful guides for estimating the effect of inter- est on pension contributions and has thereby contributed to our knowl- edge of pension funding.
(AUTHOR'S R.~VIEW OF DISCUSSION)
WARREN R. ADAMS:
I would like to thank Messrs. Berin, Daskais, Grubbs, Link, Trow- bridge, and Nesbitt for their comments and contributions.
Messrs. Berin and Grubbs consider the situation in which actual in- vestment return differs from that assumed in determining plan liabilities and contributions. Messrs. Berin and Daskais raise the point that a stationary population concept does not fit any one group's experience. These and other considerations give rise to the need for properly hedging statements made in discussing the operation of a pension plan. These points were intentionally omitted in the paper to avoid complicating what is intended to be a simple conversational tool.

192 THE"EFFECT OF INTEREST ON PENSION CONTRIBUTIONS
Mr. Crubbs suggests that the interpolation for ~I, should be geometric rather than linear. A geometric index, however, would be impractical since it is difficult to handle mentally in cases where the effect of two or more quarters of 1 per cent is desired. For example, if the geometric index for ¼ of 1 per cent is 0.0663, then the effect of ~ of 1 per cent is 1 -- (1 - - 0 .0663)".
Mr. Link's entertaining imaginary conversation effectively illustrates the difficulties faced bv a conscientious pension actuary in his a t tempt to communicate a complicated answer to a vital question. Within the frame- work of this paper his answer to Mr. Smith's initial question might be, "Based on certain assumptions, in the long run your contributions would be reduced by roughly 20 per cent (or 12 or 28 per cent)." I t is doubtful that Mr. Johnson would want to hear more than this. One might argue that the actuary does not properly perform his function when he waters down an answer to the extent that it loses its relevance and the client is left completely befuddled.
In searching for a rationalization of the 6 per cent rule, Mr. Trowbridge considers the fact that (1.0025) ~4 = 1.06 and argues that this may be reasonable if the average time between pay in and pay out of a dollar in a pension fund is 24 years. Using ultimate funds for i = 0.035 and an ultimate benefit payroll of $63,000, the average time, n, between pay in and pay out can be determined from the relationship
63,000a . -~o .o35 = ~FO£~6.
The index can then be calculated as
F _(1.o35y] k l c o ~ 0 . 2 5 [1 \ T . b - - ~ J J"
These calculations result in n = 15, 24, and 34 and indices of 3.36, 5.15, and 6.97 per cent for Funding Classes I, I I I , IV, respectively. Mr. Trow- bridge's 24 years is generally correct, and his rationalization leads to indices which are close to those derived in the paper. Also, Dr. Nesbitt suggests this as a possible approach to the problem by restating the observation in the paper as "the longer the average investment term, the higher the index."
Mr. Trowbfidge considers an alternate rationalization of the 6 per cent rule which uses the equation of maturi ty
C + d F = B .

kI,o --~
where
DISCUSSION 193
If 0.01k/o, is the reduction in ~C® caused by an increase in i of 0.0025 and k/(0.01kI®) is the reduction in hv=, we can determine ~I® from the rela- tionship
~N(d' -- d) 0.23 (kN) 1 + d ' ~ f ( k g ) X 1 0 0 % - 1 + 0 .038~/ ikN) % '
and
d = i / ( l + i ) , d ' = ( i + 0 . 0 0 2 5 ) / ( 1 + i + 0 . 0 0 2 5 ) .
Using the tables in the Appendix, this results in ~N -- 20, 40, and 68 and indices of 3.02, 4.70, and 7.13 for Funding Classes I, III, IV, respectively. The proposed 3-5-7 rule implies ~N - 17, 37, 72, which are reasonably close to the actual values.
I am especially grateful to Dr. Nesbitt for introducing Mr. Bizley's approach and discussing its application to some of the recently developed families of funding methods. This is a valuable addition to the paper.