Embed Size (px)
Citation preview
Transcription factor profiling reveals molecularchoreography and key regulators of humanretrotransposon expressionXiaoji Suna,b,1, Xuya Wanga,b,1, Zuojian Tanga,b, Mark Grivainisa,b, David Kahlerc, Chi Yunc, Paolo Mitaa,b,2,David Fenyöa,b,2, and Jef D. Boekea,b,2
aInstitute for Systems Genetics, NYU Langone Health, New York, NY 10016; bDepartment of Biochemistry and Molecular Pharmacology, NYU LangoneHealth, New York, NY 10016; and cHigh Throughput Biology Core, NYU Langone Health, New York, NY 10016
Contributed by Jef D. Boeke, May 7, 2018 (sent for review December 28, 2017; reviewed by Cédric Feschotte and Rafael Palacios)
Transposable elements (TEs) represent a substantial fraction of manyeukaryotic genomes, and transcriptional regulation of these factors isimportant to determine TE activities in human cells. However, due tothe repetitive nature of TEs, identifying transcription factor (TF)-binding sites from ChIP-sequencing (ChIP-seq) datasets is challenging.Current algorithms are focused on subtle differences between TEcopies and thus bias the analysis to relatively old and inactive TEs.Here we describe an approach termed “MapRRCon” (mapping repeatreads to a consensus) which allows us to identify proteins binding toTE DNA sequences by mapping ChIP-seq reads to the TE consensussequence after whole-genome alignment. Although this method doesnot assign binding sites to individual insertions in the genome, it pro-vides a landscape of interacting TFs by capturing factors that bind toTEs under various conditions. We applied this method to screen TFs’interactionwith L1 in human cells/tissues using ENCODE ChIP-seq data-sets and identified 178 of the 512 TFs tested as bound to L1 in at leastone biological condition with most of them (138) localized to the pro-moter. Among these L1-binding factors, we focused on Myc and CTCF,as they play important roles in cancer progression and 3D chromatinstructure formation. Furthermore, we explored the transcriptomes ofThe Cancer Genome Atlas breast and ovarian tumor samples in whicha consistent anti-/correlation between L1 and Myc/CTCF expressionwas observed, suggesting that these two factors may play roles inregulating L1 transcription during the development of such tumors.
LINE-1 | Myc | CTCF | ChIP-seq | ENCODE
Much of the human genome is derived from retrotransposons,self-propagating sequences resident within our genome.
Moreover, retrotransposons continually engage in complex host–parasite relationships during evolution (1–5). In the current hu-man genome assembly, about 45% of our total DNA has clear-cuthomology to consensus sequences of retroelements (6–8), whereasother studies suggest the proportion of the human genome derivedfrom repeats is over 75% (7). Three families of retrotransposonsare still highly active today in the human genome: LINE-1 (L1),Alu, and SVA. All these elements require a combination of hostfactors and ORF1 and ORF2 proteins encoded by the L1 elementto retrotranspose into the genome (5); thus, L1 elements representthe only autonomous retroelement in the human genome. Be-cause L1 encodes enzymatic proteins essential for the formation ofnew insertions, studying the cellular regulation of autonomousL1 is critical to better understand the transposons’ impact on thehuman genome and transcriptome.A full-length L1 element is about 6 kb long and consists of a 5′
UTR/promoter, two ORFs (ORF1 and ORF2), and a 3′ UTRcontaining a poly(A) tail. Following transcription by RNA poly-merase II, translation produces ORF1 and ORF2 proteins (ORF1pand ORF2p). ORF1p is required for L1 retrotranspositionand functions as a chaperone protein or an ssRNA-binding pro-tein (reviewed in ref. 9). ORF2p has two recognized enzymaticdomains, an endonuclease domain (10) and a reverse transcriptasedomain (11), and both domains play important roles during the
actual insertion step called “target-primed reverse transcription”(TPRT) (12, 13). Because TPRT happens directly by cleavage andprimer extension of genomic DNA targets, TPRT initiates fromthe 3′ end of the L1 RNA and often fails to reach the 5′ end. As aresult most existing L1 insertions are 5′-truncated and thereforelack a promoter and are transcriptionally inactive.Importantly, the 5′ UTR promoter of L1 has unique features.
In addition to serving as the 5′UTR, this “downstream” sequencecontains the L1 promoter in its entirety. That is, the L1 promoteris unique in that all promoter elements are downstream of thetranscription start site (14–16). Adding further complexity, thepromoter actively promotes transcription of both the sense andantisense strands and thus produces a series of mRNAs that readinto adjacent host DNA (17) and even produces an antisensestrand-encoded “ORF0” protein (17, 18). Because of the uniquearchitecture of its 5′ UTR promoter, L1 brings along its ownpackage of regulatory sequences when it retrotransposes intoa new genomic location. Thus, we expect that all L1 transcrip-tional regulators will bind 5′ regulatory/transcribed sequences.This allows the identification of L1-interacting factors by screeningfor key binders of the 5′ UTR promoter without mapping toindividual L1 copies.
Significance
Retrotransposons replicate through RNA intermediates that arereverse transcribed and inserted at new genomic locations. LINE-1 (L1) elements constitute ∼17% of the human genome, makingthem the most successful retrotransposons in the human ge-nome by mass. The activity of L1s was shown first in thegermline or during early embryogenesis. More recent studiesdemonstrate a wider prevalence of L1 expression in somatic cellsincluding neurons, aging cells, and different types of cancer. Inthis study, we developed the MapRRCon pipeline and performeda comprehensive computational analysis of L1 transcriptionalregulators using ENCODE ChIP-seq datasets. We revealed thebinding of various transcription factors, including Myc and CTCF,to the 5′ UTR promoter of the youngest human L1 family (L1HS)and their potential functional impact on L1HS expression.
Author contributions: X.S., P.M., D.F., and J.D.B. designed research; X.S., X.W., Z.T., D.K.,C.Y., P.M., and D.F. performed research; X.S., X.W., Z.T., M.G., and D.F. contributed newreagents/analytic tools; X.S., X.W., P.M., and J.D.B. analyzed data; and X.S., P.M., andJ.D.B. wrote the paper.
Reviewers: C.F., Cornell University; and R.P., Universidad Nacional Autónoma de Mexico.
The authors declare no conflict of interest.
This open access article is distributed under Creative Commons Attribution-NonCommercial-NoDerivatives License 4.0 (CC BY-NC-ND).1X.S. and X.W. contributed equally to this work.2To whom correspondence may be addressed. Email: [email protected], [email protected], or [email protected].
This article contains supporting information online at www.pnas.org/lookup/suppl/doi:10.1073/pnas.1722565115/-/DCSupplemental.
Published online May 25, 2018.
E5526–E5535 | PNAS | vol. 115 | no. 24 www.pnas.org/cgi/doi/10.1073/pnas.1722565115
Despite the importance of studying the transcriptional regula-tion of L1 and predicting binding sites for transcription factors(TFs) (19), only a few previous studies have identified critical TFsbinding to the L1 5′ UTR promoter. These include YY1 (20, 21),RUNX3 (22), p53 (23, 24), SRY (25), MeCP2, Oct4, Sox2, Nanog,and KLF4 (26–28); all have been demonstrated to regulateL1 transcription in specific human cells types, such as Sp1 andSp3 in rats (29 and reviewed in ref. 30) and Sin3A in mouse EScells (31). Evolutional analysis reveals conservation of TF-bindingsites among human-specific L1s, although the mutation rate of theL1 5′ UTR promoter is higher than that of the L1 ORFs (32),probably due, at least in part, to the enrichment of CpG dinu-cleotides. This suggests that possible core regulatory network/features may exist that control L1 activity in diverse cell types.Because of L1’s ability to induce genome instability and muta-
genic outcomes, its activity is generally suppressed somatically (33,34), probably via extensive cytosine methylation at CpGs (35).However, L1 expression is highly up-regulated in cancer cells, inline with the common observation of global hypomethylation intumors (36, 37). Despite the correlation of L1 activity with cancerprogression observed in most tumor types (37), L1’s role in cancerinitiation and progression remains unclear. In addition, because ofthe variability of different cancer cell lines, it is difficult to de-termine which common factors/pathways drive L1 activity. Thus, acomprehensive picture of the control of L1 expression is needed todefine common or unique regulators in different cell types. Inaddition to cancer cells, human ES cells (hESCs) exhibit a per-missive environment for L1 retrotransposition (38–42). Compari-son of the L1 regulatory network in hESCs and cancer cells mighthelp further identify essential regulators, since cancer cells, whichalso tend to be somewhat “dedifferentiated,” may exploit similarpathways to activate L1 expression.The ENCODE project (encodeproject.org/ENCODE/) (43) has
produced numerous ChIP-sequencing (ChIP-seq) datasets that mapthe genomic locations of TF binding and histone modifications invarious types of tissues and cell lines. In the standard ChIP-seqpipeline, transposable element (TE)-associated reads are dis-carded when aligning at multiple locations and thus cannot be un-ambiguously assigned. For example, previous studies of TF-bindingprofiles for human endogenous retroviruses excluded multiplealigned reads (44). However, those reads are extremely valuable inunderstanding retrotransposon-interacting TFs, and a TE-savvymethod is required to analyze the “junk” repetitive (low mapp-ability) reads from deep-sequencing datasets.Here, we generated an L1-interacting TF/histone mark land-
scape by analyzing the entire human ENCODE ChIP-seq database.We developed a method, “MapRRCon” (mapping repeat reads toa consensus), to specifically identify TFs binding to L1 sequencesand in particular to the L1 5′ UTR promoter. We identified aremarkably long and diverse list of TFs, possibly reflecting a gen-eral opening of L1 chromatin in certain cell types and, conse-quently, promiscuous and nonphysiologic binding of many factorsto the 5′ UTR promoter (45–47). However, we also identified a setof TFs that are activated in many cell types in which L1 is tran-scribed and which are known to interact in other contexts. Amongthe list of identified binding proteins, the oncoprotein Myc was amajor binder in various cell types, and, importantly, Myc RNAlevels were significantly anticorrelated with those of L1 in breast andovarian tumors. Additionally, we observed that CTCF binds to the5′ UTR promoter and 3′ UTR of L1s, colocalizing with Myc andRNA polymerase II. siRNA-knockdown experiments further sup-ported the involvement of both Myc and CTCF in regulatingL1 transcription. This landscape provides a comprehensive resourceof L1 regulators in various cell types and identifies key componentsof the remodeled L1 regulatory network in cancer cells.
ResultsExploring Binding Factors to L1HS Using MapRRCon. To optimizealignment of ChIP-seq reads to L1HS consensus sequence, wedeveloped MapRRCon, which aligns ChIP-seq datasets to a pre-determined unmasked reference genome and extracts information
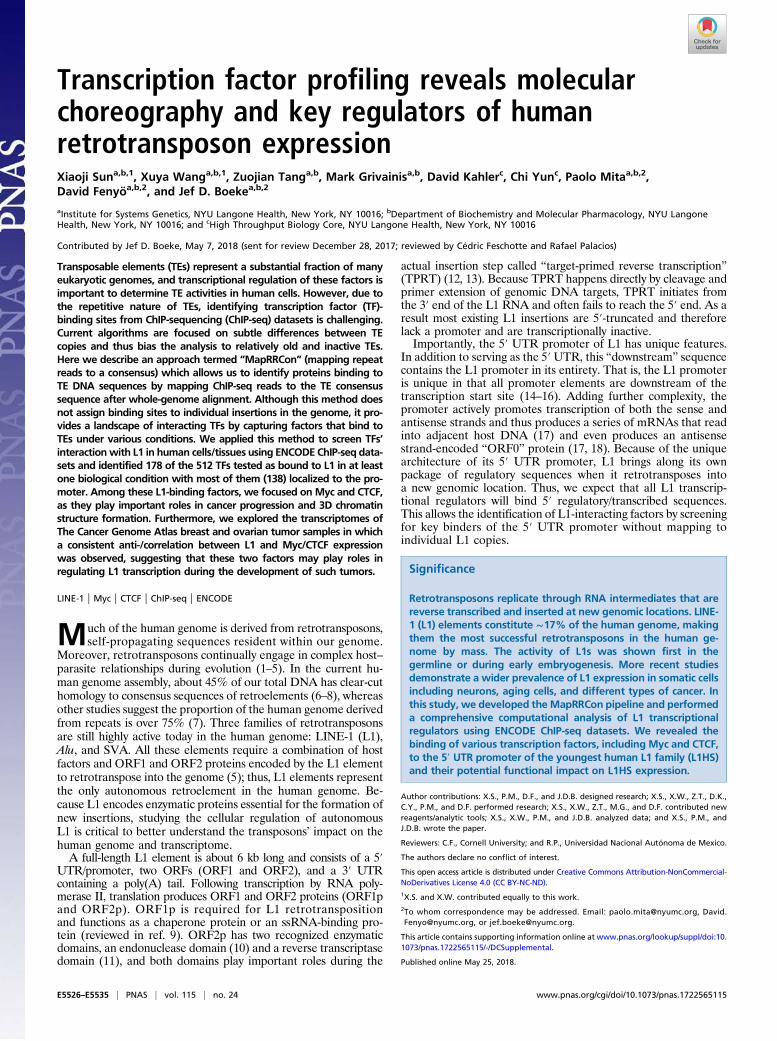
of the target binding at repetitive elements. In this study we spe-cifically focused on factors binding to human L1 sequences. We firstaligned ChIP-seq data to the human reference sequence hg38containing annotated L1HS locations. This step not only assignsuniquely mapped reads to their genomic locations but also ran-domly distributes reads with multiple genomic hits. In the case ofthe youngest human LINE-1 subfamily (L1HS) there are 1,620 an-notated sites in the reference genome, and most of the reads, beingrepetitive, are not uniquely mapped. The reads mapping to these1,620 sites are extracted based on their genomic locations (uniqueor randomly assigned by the alignment algorithm) and filtered toeliminate possible contamination by other L1 subfamilies or similarsequences. We removed reads with the following features: morethan three mismatches, any indels, or partial alignments (softclipping) (boxes with red lines in Fig. 1A). After extracting andfiltering, these L1 reads were subsequently mapped to theL1HS consensus sequence to generate a coverage profile. Foreach TF, we generate two coverage profiles from both the Inputand ChIP datasets and performed median-based normalization(Fig. 1A). ChIP-seq peaks within the L1HS consensus sequence arecalled using a signal-processing algorithm developed in-house, and atrue peak is defined as being present in the normalized data (Fig. 1B).This peak-finding method was benchmarked against manualpeak-picking and was highly accurate and robust in detectingpeaks from short-sequence datasets (SI Appendix, Fig. S1).
5’UTR
Align ChIP-seq reads to hg38
L1
ChIP
INPUT
Filter reads
Extract reads that map to annotated L1HSs
Normalization& Peak calling
Remap reads to L1HS
ChIP
INPUT
A
B
IntensityBackground
Summit
Sig
nal
Width
5’UTR ORF1 ORF2 3’UTR
Fig. 1. The pipeline of MapRRCon. (A) In this pipeline, ChIP-seq data arefirst aligned to the human reference sequence hg38. Both unique reads(filled gray boxes) and multiply aligned reads (hollow gray boxes) are thenextracted and mapped to the 1,620 annotated L1HS sites based on theirgenome coordinates. We exclude reads with partial alignment (soft clip-ping), more than three mismatches, or any indels (boxes with red lines).Filtered reads are subsequently mapped to the L1HS consensus sequence toobtain compiled reads. Finally, we generate coverage profiles for both ChIPand Input data and then perform median-based normalization (Methods).The normalized data are used for peak calling. (B) We developed a peak-calling algorithm that is suitable for short sequences such as L1s. Peaks aredetected by applying a smoothing filter and finding positions where thesmoothed signal has maxima. The peaks are filtered using two thresholds onthe original signal: signal intensity (blue line) minus background intensity(dotted gray line) larger than 1 and an rmsd ratio between signal andbackground larger than 1.3. The width of the peak (red line) is defined bythe location where the signal drops to 25% of its maximum.
Sun et al. PNAS | vol. 115 | no. 24 | E5527
BIOPH
YSICSAND
COMPU
TATIONALBIOLO
GY
PNASPL
US
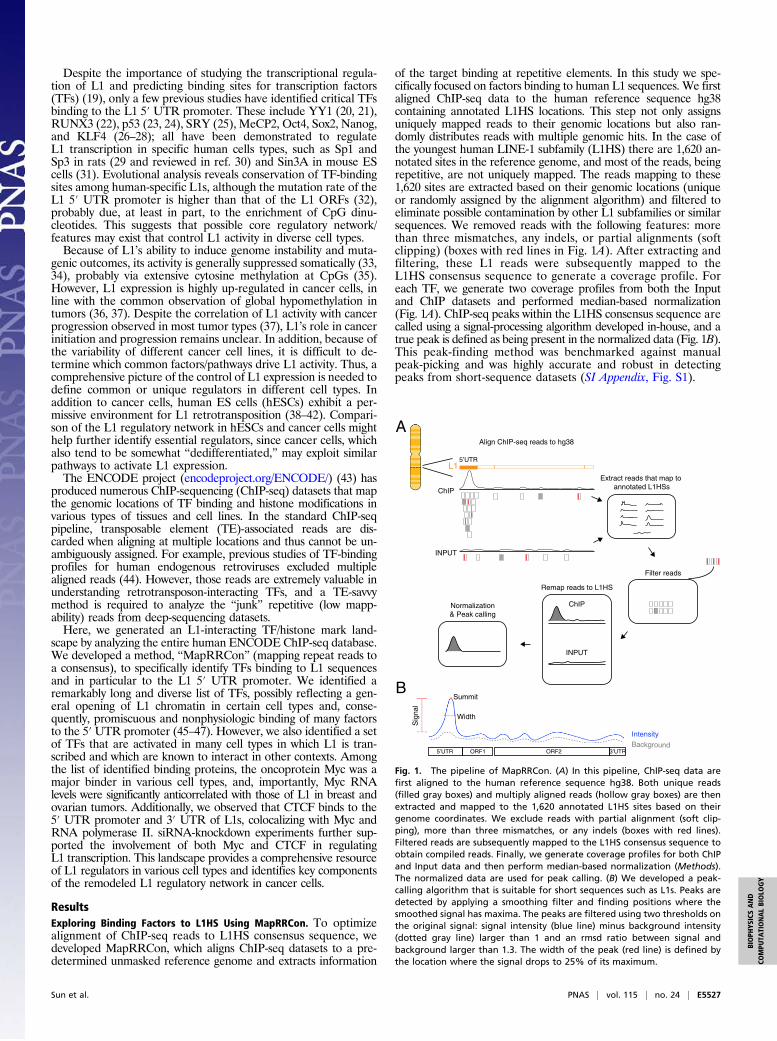
In Silico Screening of TF Factors That Interact with LINE-1 UsingMapRRCon. Using MapRRCon, we screened the entire humanENCODE database for factors that interact with L1 and iden-tified dozens of TFs and chromatin marks that associate with theL1 sequences (Fig. 2). Naturally, the binding patterns obtainedreflect binding to an unknown subset of element copies, since thesequences are present at multiple genomic locations. Thus, animportant limitation of our study is that we are unable to stateexactly which genomic L1 copies are bound. Nevertheless, thisanalysis provides a wealth of other types of information. Wescreened 512 TFs in 118 biosamples spanning the entire humanENCODE ChIP-seq database for TFs as of November 2017.Remarkably, 165 of these TFs (32% of the TFs tested) showedclear evidence of sequence-specific binding of L1. This should beconsidered a minimum, as many antibodies were tested in alimited number of biosamples, and expansion to other cell lines,tissues, or tumors will likely reveal additional binders. Althoughthe coverage of our analysis is biased toward certain factors thathave been more extensively evaluated using ChIP under variousconditions—while others have limited datasets and some areabsent altogether because no antibody against them exists—these data provide interesting maps of TF and chromatin marklandscapes across the L1 population. The majority of thesebinding profiles map to the 5′ UTR promoter of L1, as is con-sistent with two possible interpretations: (i) these might repre-sent specific transcriptional regulators of L1 or (ii), since L1 ishighly expressed in stem and cancer cell samples, some and per-
haps most of these may represent opportunistic but not necessarilybiologically relevant bindings reflected in ChIP-seq studies (45–47). We also identified 26 TFs that do not bind to the 5′ UTRpromoter of L1 but, interestingly, showed highly specific peaks inthe coding regions (ORF1 and ORF2) of the L1 sequence. Theidentification of these peaks and factors, which would not havebeen identified in classical reporter assays developed to measureL1 promoter activities (i.e., the L1 5′ UTR promoter driving theexpression of a reporter gene), indicates a strength of MapRRConcompared with these approaches: its agnosticism toward effects onexpression. Among the internal binders, we found five basic leu-cine zipper (bZIP) TFs that bind to the same location on theL1 sequence—the beginning of the ORF2 gene. Interestingly, twoof these bZIPs also bound to the 5′ UTR promoter, suggesting apossible distinct role for internal binding (Fig. 2A). The internalcolocalization can be explained by bZIP-binding motifs sharinghigh similarity with each other and by these TFs often forminghomo- or heterodimers (48) when associated with DNA. There-fore, we cannot rule out the possibility that some of them areindirectly recruited to the DNA via protein–protein interactions.Although it is difficult to interpret the function of the binding ofbZIPs to L1s, our discovery of binding factors from the samefamily showing a set of overlapping peaks suggests that our screenis robust and comprehensive.In general, we found that more TFs bind L1 sequences in hESCs
than in tissues and primary cells. Also, cancer lines in generalshowed high levels of TF binding to L1, consistent with recent
B
CA
Nor
mal
ized
ChI
P S
igna
l
L1HS (bp)
HLF
NFIL3
0
5
10
024
024
012
0123
0 1000 2000 3000 4000 5000 6000
ATF2
CEBPB
CEBPA
Similarity score:
0.97
0.95
0.89
0.89
0.87
1 2 3 4 5 6 7 8 9 101112012
1 2 3 4 5 6 7 8 9101112012
1 2 3 4 5 6 7 8 9101112012
Info
rmat
ion
cont
ent
1 2 3 4 5 6 7 8012
1 2 3 4 5 6 7 8 9 1011121314012
Position0 2000 4000 6000
L1HS (bp)
CEBPBCREB1CTCFGABPAJUNDEGR1ELF1EP300RAD21FOXA1FOXM1GATA3E2F1HDAC2MAXMNTMYCNR2F2POLR2ARESTSIN3AZHX2
5' UTR ORF1 ORF23' UTR
L1HS (bp)
Pea
k D
ensi
ty
0 1000 2000 3000 4000 5000 6000
0.0000
0.0005
0.0010
0.0015
0.0020
0.0025
0.0030
AllH1−hESCA549GM12878HepG2K562HeLa−S3MCF−7HCT116IMR−90
D peakno peakno data
n oisse r pxe 1L
HCT116
IMR−90
HepG2
A549
K562
HeLa−S3
H1−hESC
GM12878
MCF−7
RN
F2
ZB
TB
33R
CO
R1
JUN
MA
ZS
P1
T AF
1T
CF
12C
HD
1C
RE
B1
ZN
F274
RF
X5
NF
E2L2
BH
LHE
40A T
F3
BA
CH
1S
RF
SIN
3AU
SF
1T
CF
7L2G
TF
2F1
EZ
H2
MA
FK
KD
M1A
YY
1E
GR
1P
OLR
2AC
EB
PB
CT
CF
MA
XE
LF1
HD
AC
2R
ES
TR
AD
21M
YC
JUN
DE
P300
GA
BPA
Fig. 2. Landscape of L1-interacting TFs. (A) We identified a group of TFs (bZIPs) enriched at the beginning of ORF2. Blue lines show the ChIP profiles of eachTF in HepG2 cells, and the vertical red bar indicates the location of known motifs; logos are shown on the Right. (B) Peak enrichment of each cell line is madeby combining all the TF peaks called from each dataset of that cell line, and the distribution is generated using the kernel function. (C) All the binding TFs inMCF-7 cells are plotted along the L1HS DNA sequence. Red bars indicate a peak location that has been identified repeatedly for multiple TFs in our analysis;black bars indicate unique peak locations for a specific TF. (D) Heatmap of selected TFs in nine commonly used ENCODE cell lines. The cell lines are sorted basedon their relative L1 expression level from RNA-seq, and the color indicates whether each TF has binding peaks in the L1 promoter. The TFs are ordered bycalculating the Euclidean distance and are hierarchically clustered using Ward’s method. It is clear that TF binding to the 5′ UTR promoter is not highlycorrelated with the L1 expression level.
E5528 | www.pnas.org/cgi/doi/10.1073/pnas.1722565115 Sun et al.
reports showing very widespread expression of ORF1p in cancercells and tumors (37, 49). However, we did observe considerablevariation in TF binding among the cancer lines screened, sug-gesting substantial binding heterogeneity (SI Appendix, Fig. S2Aand Dataset S1).We found that 83.6% (138 TFs; 27% of the screened TFs) of
the TFs that bind L1 sequences (165 TFs; 32.2% of the screenedTFs) bind the L1 5′UTR promoter in at least one biosample. Wenext examined the distribution of all TFs in each cell line andfound that the binding was highly clustered within a promotersubregion around position 450 in the 5′ UTR promoter of theL1HS consensus sequence; this enrichment was even stronger inH1 hESCs than in other cell lines (Fig. 2B). The clustering ofTFs at the L1 5′ UTR promoter could also be observed whenaligning binding peaks of individual TFs; for example, in MCF-7 cells the peaks around position 450 could be seen for nearly allthe TFs that bound L1, although peaks for those TFs also existedin other regions (Fig. 2C). This finding is consistent with previousresearch showing that nucleotide positions 390–526 of the L1 5′UTR promoter are critical for effective L1 transcription (16).Among the commonly used ENCODE cell lines, a few (MCF-7,
K562, HepG2, and H1-hESCs) showed TF enrichment at the L15′ UTR promoter compared with the other cell lines (Fig. 2D).We first hypothesized that this may reflect the open chromatinstate at the L1 5′ UTR promoter in these cell lines that allowedhigher accessibility for TFs. To test this hypothesis, we quantifiedL1 expression levels in a few of the ENCODE cell lines that hadthe highest amount of ChIP-seq data, using ENCODE RNA-sequencing (RNA-seq) datasets and ranking them based onL1 expression (Fig. 2D). L1 expression did not correlate with thenumber of TFs bound to its 5′UTR promoter; for instance, MCF-7 cells showed the highest L1 expression among these cell lines buthad a low number of TF peaks compared with H1-hESCs, K562,and HepG2 cells; GM12878 cells also exhibited less TF bindingalthough L1 expression was high (Fig. 2D and SI Appendix, Fig.S3A). By comparing the binding profiles with the individual TFgenes’ expression, we excluded the possibility that the TF bindingon L1 was driven by the expression level of the TF under con-sideration (SI Appendix, Fig. S3B).
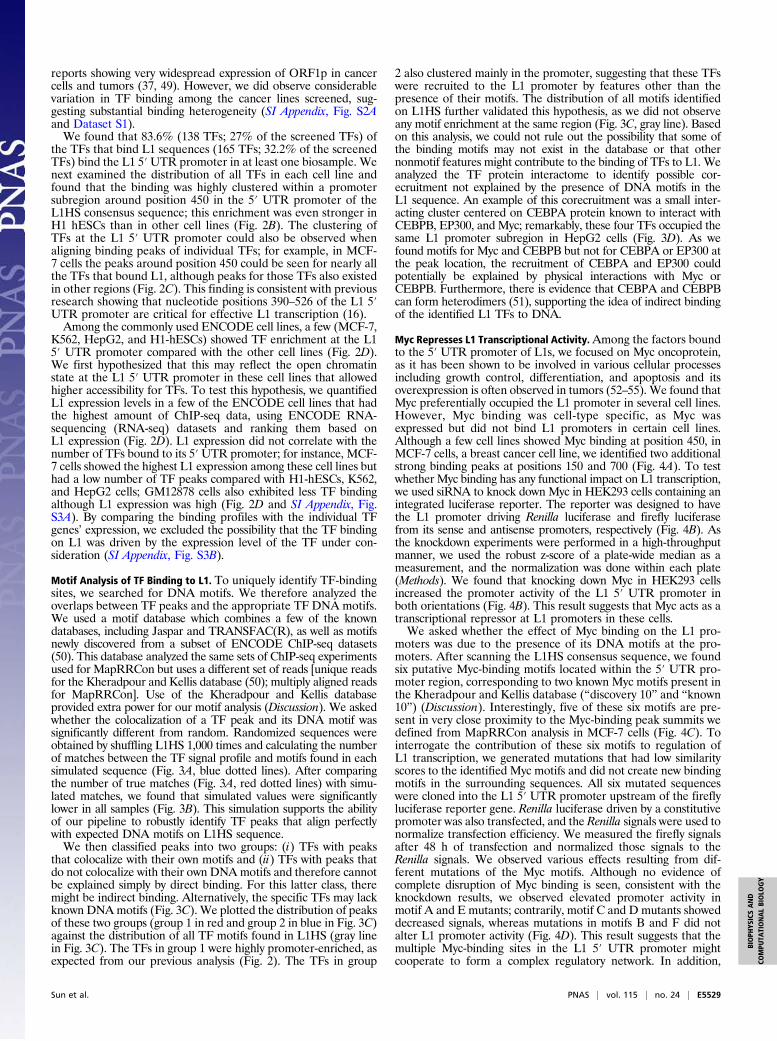
Motif Analysis of TF Binding to L1. To uniquely identify TF-bindingsites, we searched for DNA motifs. We therefore analyzed theoverlaps between TF peaks and the appropriate TF DNA motifs.We used a motif database which combines a few of the knowndatabases, including Jaspar and TRANSFAC(R), as well as motifsnewly discovered from a subset of ENCODE ChIP-seq datasets(50). This database analyzed the same sets of ChIP-seq experimentsused for MapRRCon but uses a different set of reads [unique readsfor the Kheradpour and Kellis database (50); multiply aligned readsfor MapRRCon]. Use of the Kheradpour and Kellis databaseprovided extra power for our motif analysis (Discussion). We askedwhether the colocalization of a TF peak and its DNA motif wassignificantly different from random. Randomized sequences wereobtained by shuffling L1HS 1,000 times and calculating the numberof matches between the TF signal profile and motifs found in eachsimulated sequence (Fig. 3A, blue dotted lines). After comparingthe number of true matches (Fig. 3A, red dotted lines) with simu-lated matches, we found that simulated values were significantlylower in all samples (Fig. 3B). This simulation supports the abilityof our pipeline to robustly identify TF peaks that align perfectlywith expected DNA motifs on L1HS sequence.We then classified peaks into two groups: (i) TFs with peaks
that colocalize with their own motifs and (ii) TFs with peaks thatdo not colocalize with their own DNAmotifs and therefore cannotbe explained simply by direct binding. For this latter class, theremight be indirect binding. Alternatively, the specific TFs may lackknown DNAmotifs (Fig. 3C). We plotted the distribution of peaksof these two groups (group 1 in red and group 2 in blue in Fig. 3C)against the distribution of all TF motifs found in L1HS (gray linein Fig. 3C). The TFs in group 1 were highly promoter-enriched, asexpected from our previous analysis (Fig. 2). The TFs in group
2 also clustered mainly in the promoter, suggesting that these TFswere recruited to the L1 promoter by features other than thepresence of their motifs. The distribution of all motifs identifiedon L1HS further validated this hypothesis, as we did not observeany motif enrichment at the same region (Fig. 3C, gray line). Basedon this analysis, we could not rule out the possibility that some ofthe binding motifs may not exist in the database or that othernonmotif features might contribute to the binding of TFs to L1. Weanalyzed the TF protein interactome to identify possible cor-ecruitment not explained by the presence of DNA motifs in theL1 sequence. An example of this corecruitment was a small inter-acting cluster centered on CEBPA protein known to interact withCEBPB, EP300, and Myc; remarkably, these four TFs occupied thesame L1 promoter subregion in HepG2 cells (Fig. 3D). As wefound motifs for Myc and CEBPB but not for CEBPA or EP300 atthe peak location, the recruitment of CEBPA and EP300 couldpotentially be explained by physical interactions with Myc orCEBPB. Furthermore, there is evidence that CEBPA and CEBPBcan form heterodimers (51), supporting the idea of indirect bindingof the identified L1 TFs to DNA.
Myc Represses L1 Transcriptional Activity.Among the factors boundto the 5′ UTR promoter of L1s, we focused on Myc oncoprotein,as it has been shown to be involved in various cellular processesincluding growth control, differentiation, and apoptosis and itsoverexpression is often observed in tumors (52–55). We found thatMyc preferentially occupied the L1 promoter in several cell lines.However, Myc binding was cell-type specific, as Myc wasexpressed but did not bind L1 promoters in certain cell lines.Although a few cell lines showed Myc binding at position 450, inMCF-7 cells, a breast cancer cell line, we identified two additionalstrong binding peaks at positions 150 and 700 (Fig. 4A). To testwhether Myc binding has any functional impact on L1 transcription,we used siRNA to knock down Myc in HEK293 cells containing anintegrated luciferase reporter. The reporter was designed to havethe L1 promoter driving Renilla luciferase and firefly luciferasefrom its sense and antisense promoters, respectively (Fig. 4B). Asthe knockdown experiments were performed in a high-throughputmanner, we used the robust z-score of a plate-wide median as ameasurement, and the normalization was done within each plate(Methods). We found that knocking down Myc in HEK293 cellsincreased the promoter activity of the L1 5′ UTR promoter inboth orientations (Fig. 4B). This result suggests that Myc acts as atranscriptional repressor at L1 promoters in these cells.We asked whether the effect of Myc binding on the L1 pro-
moters was due to the presence of its DNA motifs at the pro-moters. After scanning the L1HS consensus sequence, we foundsix putative Myc-binding motifs located within the 5′ UTR pro-moter region, corresponding to two known Myc motifs present inthe Kheradpour and Kellis database (“discovery 10” and “known10”) (Discussion). Interestingly, five of these six motifs are pre-sent in very close proximity to the Myc-binding peak summits wedefined from MapRRCon analysis in MCF-7 cells (Fig. 4C). Tointerrogate the contribution of these six motifs to regulation ofL1 transcription, we generated mutations that had low similarityscores to the identified Myc motifs and did not create new bindingmotifs in the surrounding sequences. All six mutated sequenceswere cloned into the L1 5′ UTR promoter upstream of the fireflyluciferase reporter gene. Renilla luciferase driven by a constitutivepromoter was also transfected, and the Renilla signals were used tonormalize transfection efficiency. We measured the firefly signalsafter 48 h of transfection and normalized those signals to theRenilla signals. We observed various effects resulting from dif-ferent mutations of the Myc motifs. Although no evidence ofcomplete disruption of Myc binding is seen, consistent with theknockdown results, we observed elevated promoter activity inmotif A and E mutants; contrarily, motif C and D mutants showeddecreased signals, whereas mutations in motifs B and F did notalter L1 promoter activity (Fig. 4D). This result suggests that themultiple Myc-binding sites in the L1 5′ UTR promoter mightcooperate to form a complex regulatory network. In addition,
Sun et al. PNAS | vol. 115 | no. 24 | E5529
BIOPH
YSICSAND
COMPU
TATIONALBIOLO
GY
PNASPL
US
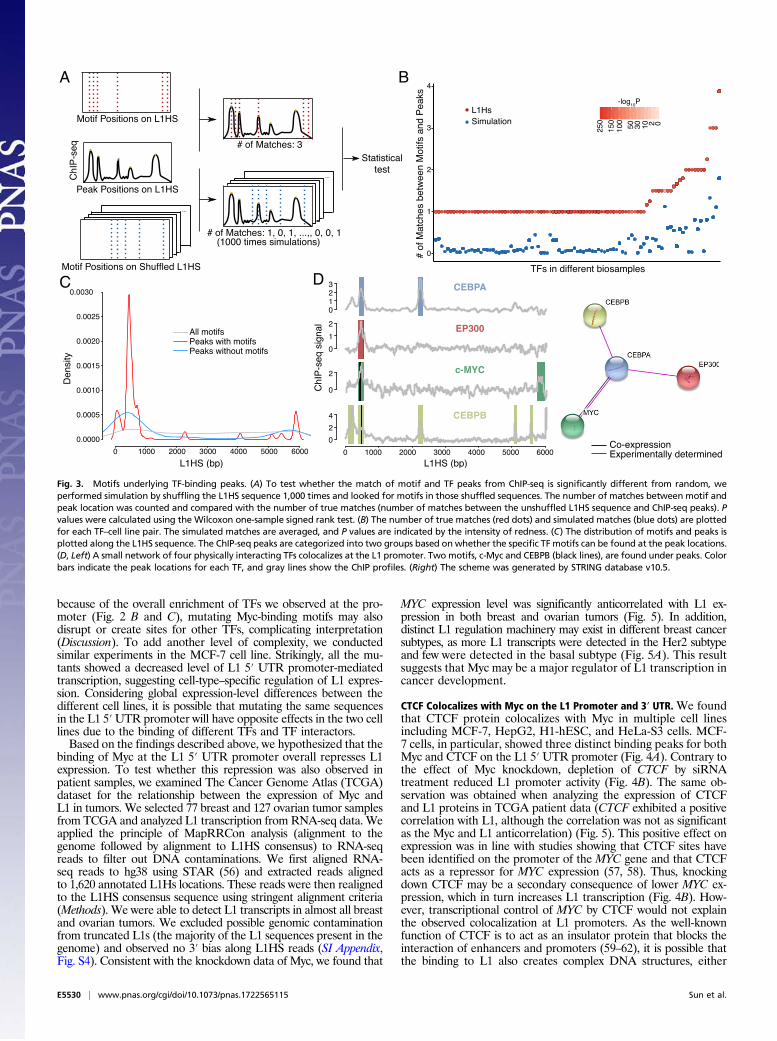
because of the overall enrichment of TFs we observed at the pro-moter (Fig. 2 B and C), mutating Myc-binding motifs may alsodisrupt or create sites for other TFs, complicating interpretation(Discussion). To add another level of complexity, we conductedsimilar experiments in the MCF-7 cell line. Strikingly, all the mu-tants showed a decreased level of L1 5′ UTR promoter-mediatedtranscription, suggesting cell-type–specific regulation of L1 expres-sion. Considering global expression-level differences between thedifferent cell lines, it is possible that mutating the same sequencesin the L1 5′UTR promoter will have opposite effects in the two celllines due to the binding of different TFs and TF interactors.Based on the findings described above, we hypothesized that the
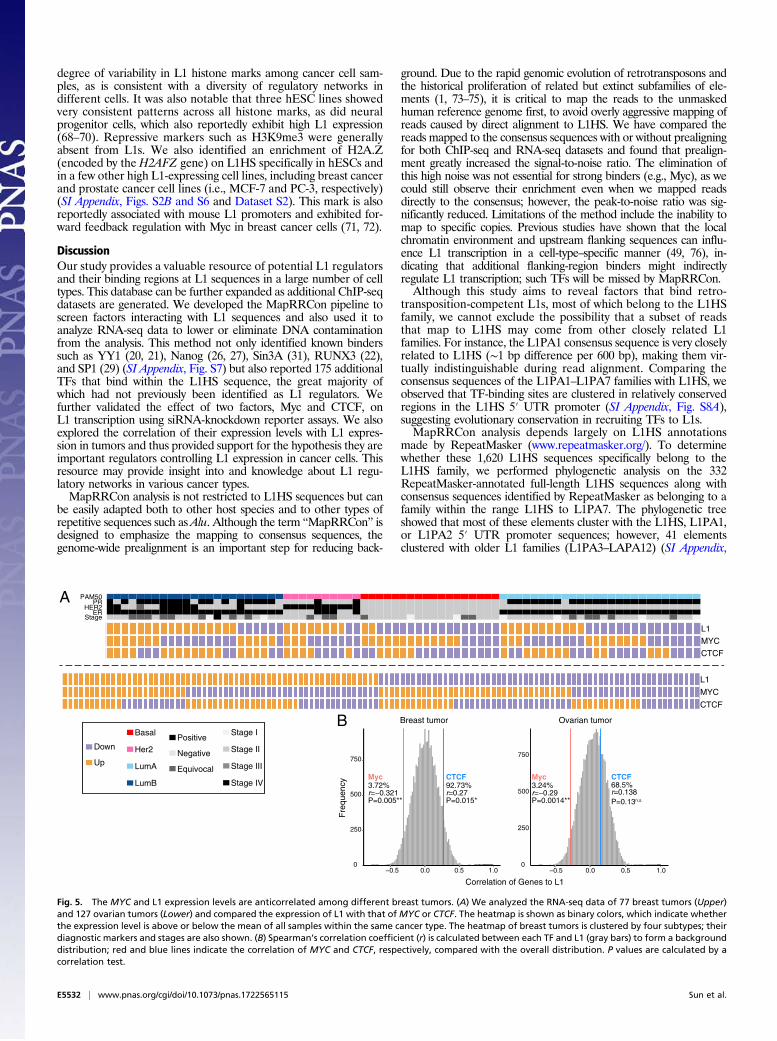
binding of Myc at the L1 5′ UTR promoter overall represses L1expression. To test whether this repression was also observed inpatient samples, we examined The Cancer Genome Atlas (TCGA)dataset for the relationship between the expression of Myc andL1 in tumors. We selected 77 breast and 127 ovarian tumor samplesfrom TCGA and analyzed L1 transcription from RNA-seq data. Weapplied the principle of MapRRCon analysis (alignment to thegenome followed by alignment to L1HS consensus) to RNA-seqreads to filter out DNA contaminations. We first aligned RNA-seq reads to hg38 using STAR (56) and extracted reads alignedto 1,620 annotated L1Hs locations. These reads were then realignedto the L1HS consensus sequence using stringent alignment criteria(Methods). We were able to detect L1 transcripts in almost all breastand ovarian tumors. We excluded possible genomic contaminationfrom truncated L1s (the majority of the L1 sequences present in thegenome) and observed no 3′ bias along L1HS reads (SI Appendix,Fig. S4). Consistent with the knockdown data of Myc, we found that
MYC expression level was significantly anticorrelated with L1 ex-pression in both breast and ovarian tumors (Fig. 5). In addition,distinct L1 regulation machinery may exist in different breast cancersubtypes, as more L1 transcripts were detected in the Her2 subtypeand few were detected in the basal subtype (Fig. 5A). This resultsuggests that Myc may be a major regulator of L1 transcription incancer development.
CTCF Colocalizes with Myc on the L1 Promoter and 3′ UTR. We foundthat CTCF protein colocalizes with Myc in multiple cell linesincluding MCF-7, HepG2, H1-hESC, and HeLa-S3 cells. MCF-7 cells, in particular, showed three distinct binding peaks for bothMyc and CTCF on the L1 5′UTR promoter (Fig. 4A). Contrary tothe effect of Myc knockdown, depletion of CTCF by siRNAtreatment reduced L1 promoter activity (Fig. 4B). The same ob-servation was obtained when analyzing the expression of CTCFand L1 proteins in TCGA patient data (CTCF exhibited a positivecorrelation with L1, although the correlation was not as significantas the Myc and L1 anticorrelation) (Fig. 5). This positive effect onexpression was in line with studies showing that CTCF sites havebeen identified on the promoter of the MYC gene and that CTCFacts as a repressor for MYC expression (57, 58). Thus, knockingdown CTCF may be a secondary consequence of lower MYC ex-pression, which in turn increases L1 transcription (Fig. 4B). How-ever, transcriptional control of MYC by CTCF would not explainthe observed colocalization at L1 promoters. As the well-knownfunction of CTCF is to act as an insulator protein that blocks theinteraction of enhancers and promoters (59–62), it is possible thatthe binding to L1 also creates complex DNA structures, either
A B
C D
Fig. 3. Motifs underlying TF-binding peaks. (A) To test whether the match of motif and TF peaks from ChIP-seq is significantly different from random, weperformed simulation by shuffling the L1HS sequence 1,000 times and looked for motifs in those shuffled sequences. The number of matches between motif andpeak location was counted and compared with the number of true matches (number of matches between the unshuffled L1HS sequence and ChIP-seq peaks). Pvalues were calculated using the Wilcoxon one-sample signed rank test. (B) The number of true matches (red dots) and simulated matches (blue dots) are plottedfor each TF–cell line pair. The simulated matches are averaged, and P values are indicated by the intensity of redness. (C) The distribution of motifs and peaks isplotted along the L1HS sequence. The ChIP-seq peaks are categorized into two groups based on whether the specific TF motifs can be found at the peak locations.(D, Left) A small network of four physically interacting TFs colocalizes at the L1 promoter. Two motifs, c-Myc and CEBPB (black lines), are found under peaks. Colorbars indicate the peak locations for each TF, and gray lines show the ChIP profiles. (Right) The scheme was generated by STRING database v10.5.
E5530 | www.pnas.org/cgi/doi/10.1073/pnas.1722565115 Sun et al.
inter- or intramolecularly. Indeed, a previous study analyzing to-pologically associated domains (TADs) showed that MCF-7 TADboundaries are enriched for several oncoproteins, including Myc(63). This is consistent with our observations about the specific re-cruitment of CTCF and Myc on L1 and suggests a possible func-tional interaction between Myc and CTCF. In addition, Cohesinsubunit Rad21, a protein subunit that works together with CTCF (64,65) to assist long-range interactions, was also found at the L1 pro-moter with CTCF in multiple cell lines (SI Appendix, Fig. S5A), andCohesin subunit Rad21 overexpression in tumor cells has previouslybeen shown to be associated with increased L1 expression (66).CTCF bound not only to the 5′ UTR of L1 but also to the L1
3′ UTR (the same recruitment profile was observed for Myc).This observation made us hypothesize that CTCF may mediateintermolecular (anchoring two L1 copies by binding their 5′UTR promoters) or intramolecular (anchoring the 5′ UTRpromoter and 3′ UTR of the same L1) interactions. A previousstudy (67) showed that gene loops enhanced transcriptional di-rectionality at bidirectional promoters by physically bringing to-gether promoter and terminator and allowing RNA polymerase
to reload onto promoters efficiently after finishing the previousround of transcription. Although the current resolution of Hi-Cdata is insufficient to detect L1 intramolecular interactions, theformation of gene loops of L1 was consistent with the two fol-lowing observations: (i) RNA polymerase colocalized with CTCFat both the L1 promoter and the 3′UTR (SI Appendix, Fig. S5B),and (ii) knocking down Ssu72, a factor critical for gene-loopformation (67), decreases the level of L1 transcription to asimilar degree as knockdown of CTCF (SI Appendix, Fig. S5C).This finding may suggest a mechanism of L1 transcription incancer cells, but more studies are necessary to address it better.
MapRRCon Analysis of Histone Marks of L1HS. We also testedMapRRCon in analyzing ChIP-seq datasets of histone marks. Afteranalyzing 14 histone marks in 115 biosamples, we noticed that afew active transcription/open chromatin histone marks (H3K9ac,H3K27ac, H3K4me2, H3K4me3, and H3K4me1) were more rep-resented among our sample cohort, with a slight enrichment inimmortalized cells and stem cells, which had higher L1 expressionthan tissue and primary cell samples. However, we observed a high
A B CD
E F
0 200 400 600 800Firefly
L1 5’UTR
Mutants
Rep
orte
r si
gnal
(fo
ld c
hang
e)
HEK293T MCF-7
0
1
2
3
0
1
2
3
**
*
* **** ***
*
A FB C D E A FB C D E
DC
A
ChI
P
Myc CTCF
MC
F-7
MCF-7 HepG2 H1-hESC Hela-S3
K562 GM12878 A549
−2
−1
0
1
2
3
0 1000 2000 3000 4000 5000 6000−2
−1
0
1
2
3
-20
40
-10
0
10
20
30
-10
15
-5
0
5
10
0 1000 2000 3000 4000 5000 6000
L1HS (bp)
BL1 5’UTR RenillaFirefly
Firefly Renilla
siMycsiCTCFsiScramble
−1
0
1
2
3
4
*
*
* *
Rob
ust z
-sco
re
ChI
P
L1HS (bp)
Myc
CTCF
0.900
0.925
0.950
0.975
1.000
Similarity Score
disc10 known10
0 200 400 600 800 1000
0
10
20
30
40
Fig. 4. c-Myc and CTCF colocalize at the L1 5′ UTR to regulate L1 promoter activity. (A) The coverage of c-Myc and CTCF ChIP-seq signals is plotted along L1HSin seven cell lines. The four cell lines in the upper plots show binding peaks for both TFs, whereas the three cell lines in the lower plots do not. (B, Upper) Thediagram illustrates the reporter construct, which is a L1 promoter sequence attached to a luciferase reporter at both ends. Wavy lines indicate sense andantisense transcripts. Renilla luciferase measures the forward promoter activity, and firefly luciferase measures the reverse promoter activity. (Lower) Theluciferase signal is normalized to the plate median (Methods) for each knockdown. *P > 0.01, **P > 0.001, ***P ≤ 0.001. (C) The ChIP-seq signal of c-Myc andCTCF is plotted on the L1HS along with the locations of sequences that are highly similar to their identified motifs. The similarity is indicated by color gradient;the sequences that are similar to c-Myc discovery motif 10 (disc10) and known motif 10 (known10) are marked (see text). (D) L1 5′ UTR promoter activities indifferent c-Myc motif mutants measured by reporter assay. (Upper) The reporter construct in which a L1 5′ UTR promoter drives firefly luciferase is shown. Theletters A–F indicate the six motifs we identified in the L1 5′ UTR promoter and the locations of their matched sequences. (Lower) The bar graph shows the foldchange of reporter signals normalized to wild type (dotted line). *P < 0.05, **P ≤ 0.05, ***P ≤ 0.001.
Sun et al. PNAS | vol. 115 | no. 24 | E5531
BIOPH
YSICSAND
COMPU
TATIONALBIOLO
GY
PNASPL
US
degree of variability in L1 histone marks among cancer cell sam-ples, as is consistent with a diversity of regulatory networks indifferent cells. It was also notable that three hESC lines showedvery consistent patterns across all histone marks, as did neuralprogenitor cells, which also reportedly exhibit high L1 expression(68–70). Repressive markers such as H3K9me3 were generallyabsent from L1s. We also identified an enrichment of H2A.Z(encoded by the H2AFZ gene) on L1HS specifically in hESCs andin a few other high L1-expressing cell lines, including breast cancerand prostate cancer cell lines (i.e., MCF-7 and PC-3, respectively)(SI Appendix, Figs. S2B and S6 and Dataset S2). This mark is alsoreportedly associated with mouse L1 promoters and exhibited for-ward feedback regulation with Myc in breast cancer cells (71, 72).
DiscussionOur study provides a valuable resource of potential L1 regulatorsand their binding regions at L1 sequences in a large number of celltypes. This database can be further expanded as additional ChIP-seqdatasets are generated. We developed the MapRRCon pipeline toscreen factors interacting with L1 sequences and also used it toanalyze RNA-seq data to lower or eliminate DNA contaminationfrom the analysis. This method not only identified known binderssuch as YY1 (20, 21), Nanog (26, 27), Sin3A (31), RUNX3 (22),and SP1 (29) (SI Appendix, Fig. S7) but also reported 175 additionalTFs that bind within the L1HS sequence, the great majority ofwhich had not previously been identified as L1 regulators. Wefurther validated the effect of two factors, Myc and CTCF, onL1 transcription using siRNA-knockdown reporter assays. We alsoexplored the correlation of their expression levels with L1 expres-sion in tumors and thus provided support for the hypothesis they areimportant regulators controlling L1 expression in cancer cells. Thisresource may provide insight into and knowledge about L1 regu-latory networks in various cancer types.MapRRCon analysis is not restricted to L1HS sequences but can
be easily adapted both to other host species and to other types ofrepetitive sequences such asAlu. Although the term “MapRRCon” isdesigned to emphasize the mapping to consensus sequences, thegenome-wide prealignment is an important step for reducing back-
ground. Due to the rapid genomic evolution of retrotransposons andthe historical proliferation of related but extinct subfamilies of ele-ments (1, 73–75), it is critical to map the reads to the unmaskedhuman reference genome first, to avoid overly aggressive mapping ofreads caused by direct alignment to L1HS. We have compared thereads mapped to the consensus sequences with or without prealigningfor both ChIP-seq and RNA-seq datasets and found that prealign-ment greatly increased the signal-to-noise ratio. The elimination ofthis high noise was not essential for strong binders (e.g., Myc), as wecould still observe their enrichment even when we mapped readsdirectly to the consensus; however, the peak-to-noise ratio was sig-nificantly reduced. Limitations of the method include the inability tomap to specific copies. Previous studies have shown that the localchromatin environment and upstream flanking sequences can influ-ence L1 transcription in a cell-type–specific manner (49, 76), in-dicating that additional flanking-region binders might indirectlyregulate L1 transcription; such TFs will be missed by MapRRCon.Although this study aims to reveal factors that bind retro-
transposition-competent L1s, most of which belong to the L1HSfamily, we cannot exclude the possibility that a subset of readsthat map to L1HS may come from other closely related L1families. For instance, the L1PA1 consensus sequence is very closelyrelated to L1HS (∼1 bp difference per 600 bp), making them vir-tually indistinguishable during read alignment. Comparing theconsensus sequences of the L1PA1–L1PA7 families with L1HS, weobserved that TF-binding sites are clustered in relatively conservedregions in the L1HS 5′ UTR promoter (SI Appendix, Fig. S8A),suggesting evolutionary conservation in recruiting TFs to L1s.MapRRCon analysis depends largely on L1HS annotations
made by RepeatMasker (www.repeatmasker.org/). To determinewhether these 1,620 L1HS sequences specifically belong to theL1HS family, we performed phylogenetic analysis on the 332RepeatMasker-annotated full-length L1HS sequences along withconsensus sequences identified by RepeatMasker as belonging to afamily within the range L1HS to L1PA7. The phylogenetic treeshowed that most of these elements cluster with the L1HS, L1PA1,or L1PA2 5′ UTR promoter sequences; however, 41 elementsclustered with older L1 families (L1PA3–LAPA12) (SI Appendix,
B
CTCF92.73%r=0.27P=0.015*
Myc3.72%r=−0.321P=0.005**
0
250
500
750
−0.5 0.0 0.5 1.0
Fre
quen
cy
CTCF68.5%r=0.138P=0.13n.s.
Myc3.24%r=−0.29P=0.0014**
0
250
500
750
−0.5 0.0 0.5 1.0
Correlation of Genes to L1
Breast tumor Ovarian tumor
CTCF
MYC
L1
AStage
ERHER2
PRPAM50
CTCF
MYC
L1
Basal
Her2
LumA
LumB
Positive
Negative
Equivocal
Stage I
Stage II
Stage III
Stage IV
Down
Up
Fig. 5. The MYC and L1 expression levels are anticorrelated among different breast tumors. (A) We analyzed the RNA-seq data of 77 breast tumors (Upper)and 127 ovarian tumors (Lower) and compared the expression of L1 with that ofMYC or CTCF. The heatmap is shown as binary colors, which indicate whetherthe expression level is above or below the mean of all samples within the same cancer type. The heatmap of breast tumors is clustered by four subtypes; theirdiagnostic markers and stages are also shown. (B) Spearman’s correlation coefficient (r) is calculated between each TF and L1 (gray bars) to form a backgrounddistribution; red and blue lines indicate the correlation of MYC and CTCF, respectively, compared with the overall distribution. P values are calculated by acorrelation test.
E5532 | www.pnas.org/cgi/doi/10.1073/pnas.1722565115 Sun et al.
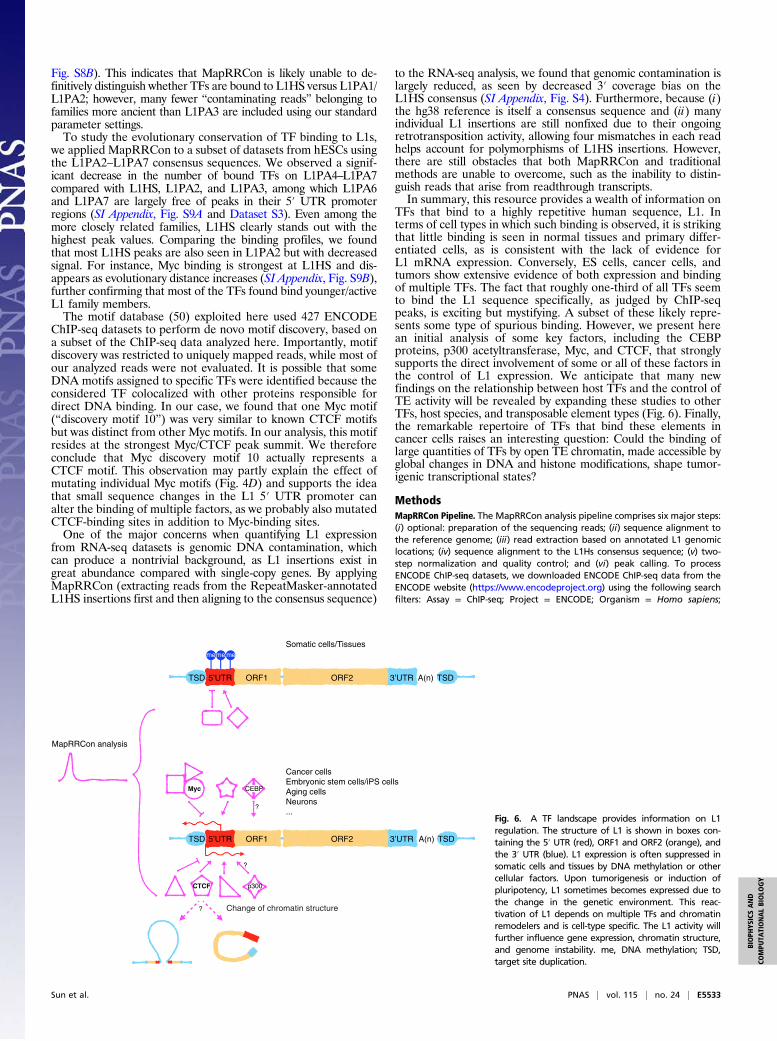
Fig. S8B). This indicates that MapRRCon is likely unable to de-finitively distinguish whether TFs are bound to L1HS versus L1PA1/L1PA2; however, many fewer “contaminating reads” belonging tofamilies more ancient than L1PA3 are included using our standardparameter settings.To study the evolutionary conservation of TF binding to L1s,
we applied MapRRCon to a subset of datasets from hESCs usingthe L1PA2–L1PA7 consensus sequences. We observed a signif-icant decrease in the number of bound TFs on L1PA4–L1PA7compared with L1HS, L1PA2, and L1PA3, among which L1PA6and L1PA7 are largely free of peaks in their 5′ UTR promoterregions (SI Appendix, Fig. S9A and Dataset S3). Even among themore closely related families, L1HS clearly stands out with thehighest peak values. Comparing the binding profiles, we foundthat most L1HS peaks are also seen in L1PA2 but with decreasedsignal. For instance, Myc binding is strongest at L1HS and dis-appears as evolutionary distance increases (SI Appendix, Fig. S9B),further confirming that most of the TFs found bind younger/activeL1 family members.The motif database (50) exploited here used 427 ENCODE
ChIP-seq datasets to perform de novo motif discovery, based ona subset of the ChIP-seq data analyzed here. Importantly, motifdiscovery was restricted to uniquely mapped reads, while most ofour analyzed reads were not evaluated. It is possible that someDNA motifs assigned to specific TFs were identified because theconsidered TF colocalized with other proteins responsible fordirect DNA binding. In our case, we found that one Myc motif(“discovery motif 10”) was very similar to known CTCF motifsbut was distinct from other Myc motifs. In our analysis, this motifresides at the strongest Myc/CTCF peak summit. We thereforeconclude that Myc discovery motif 10 actually represents aCTCF motif. This observation may partly explain the effect ofmutating individual Myc motifs (Fig. 4D) and supports the ideathat small sequence changes in the L1 5′ UTR promoter canalter the binding of multiple factors, as we probably also mutatedCTCF-binding sites in addition to Myc-binding sites.One of the major concerns when quantifying L1 expression
from RNA-seq datasets is genomic DNA contamination, whichcan produce a nontrivial background, as L1 insertions exist ingreat abundance compared with single-copy genes. By applyingMapRRCon (extracting reads from the RepeatMasker-annotatedL1HS insertions first and then aligning to the consensus sequence)
to the RNA-seq analysis, we found that genomic contamination islargely reduced, as seen by decreased 3′ coverage bias on theL1HS consensus (SI Appendix, Fig. S4). Furthermore, because (i)the hg38 reference is itself a consensus sequence and (ii) manyindividual L1 insertions are still nonfixed due to their ongoingretrotransposition activity, allowing four mismatches in each readhelps account for polymorphisms of L1HS insertions. However,there are still obstacles that both MapRRCon and traditionalmethods are unable to overcome, such as the inability to distin-guish reads that arise from readthrough transcripts.In summary, this resource provides a wealth of information on
TFs that bind to a highly repetitive human sequence, L1. Interms of cell types in which such binding is observed, it is strikingthat little binding is seen in normal tissues and primary differ-entiated cells, as is consistent with the lack of evidence forL1 mRNA expression. Conversely, ES cells, cancer cells, andtumors show extensive evidence of both expression and bindingof multiple TFs. The fact that roughly one-third of all TFs seemto bind the L1 sequence specifically, as judged by ChIP-seqpeaks, is exciting but mystifying. A subset of these likely repre-sents some type of spurious binding. However, we present herean initial analysis of some key factors, including the CEBPproteins, p300 acetyltransferase, Myc, and CTCF, that stronglysupports the direct involvement of some or all of these factors inthe control of L1 expression. We anticipate that many newfindings on the relationship between host TFs and the control ofTE activity will be revealed by expanding these studies to otherTFs, host species, and transposable element types (Fig. 6). Finally,the remarkable repertoire of TFs that bind these elements incancer cells raises an interesting question: Could the binding oflarge quantities of TFs by open TE chromatin, made accessible byglobal changes in DNA and histone modifications, shape tumor-igenic transcriptional states?
MethodsMapRRCon Pipeline. The MapRRCon analysis pipeline comprises six major steps:(i) optional: preparation of the sequencing reads; (ii) sequence alignment tothe reference genome; (iii) read extraction based on annotated L1 genomiclocations; (iv) sequence alignment to the L1Hs consensus sequence; (v) two-step normalization and quality control; and (vi) peak calling. To processENCODE ChIP-seq datasets, we downloaded ENCODE ChIP-seq data from theENCODE website (https://www.encodeproject.org) using the following searchfilters: Assay = ChIP-seq; Project = ENCODE; Organism = Homo sapiens;
MapRRCon analysis
5’UTRTSD ORF1 ORF2 3’UTR A(n) TSD
5’UTRTSD ORF1 ORF2 3’UTR A(n) TSD
meme me
Somatic cells/Tissues
Cancer cellsEmbryonic stem cells/iPS cellsAging cellsNeurons...
CTCF
Myc CEBP
p300
?
?
? Change of chromatin structure
Fig. 6. A TF landscape provides information on L1regulation. The structure of L1 is shown in boxes con-taining the 5′ UTR (red), ORF1 and ORF2 (orange), andthe 3′ UTR (blue). L1 expression is often suppressed insomatic cells and tissues by DNA methylation or othercellular factors. Upon tumorigenesis or induction ofpluripotency, L1 sometimes becomes expressed due tothe change in the genetic environment. This reac-tivation of L1 depends on multiple TFs and chromatinremodelers and is cell-type specific. The L1 activity willfurther influence gene expression, chromatin structure,and genome instability. me, DNA methylation; TSD,target site duplication.
Sun et al. PNAS | vol. 115 | no. 24 | E5533
BIOPH
YSICSAND
COMPU
TATIONALBIOLO
GY
PNASPL
US
Available data = fastq/bam. For any experiment, if unfiltered BAM files(aligned reads) were available, we used them directly in step 3; otherwise,we used FASTQ files (raw reads) and started from step 1. We matchedChIP and Input datasets based on experiment accession numbers andremoved ChIP data that did not have associated Input data. After map-ping the extracted reads to L1HS, we excluded datasets that had noL1 reads and also removed locations that had coverages less than 10 foreach generated profile.
i) Low-quality base pairs and adaptor sequences of single-end orpaired-end reads are trimmed using Trimmomatic (77). This step isoptional in the pipeline, as quality controls are also performed insteps 3 and 5.
ii) The processed reads are aligned to the hg38/GRCh38 (December 2013)human reference genome assembly using BWA-MEM (78); the align-ment options followed the ENCODE standard ChIP-seq analysis pipeline.
iii) Reads aligned to 1,620 RepeatMasker-annotated L1HS sites are extract-ed using an in-house–developed Java script. Meanwhile, reads contain-ing the following features are filtered out: (i) more than threemismatches if the read length is shorter than 50 bp or more than fourmismatches if the read length is longer than 50 bp; (ii) reads that con-tain insertions or deletions; and (iii) reads that contain soft clipping(partial match). Importantly, this step is not limited to annotated L1HSlocations; it is also able to take any genomic intervals (in UCSC.bed fileformat) and extract reads that belong to the input regions. In addition,we also provide an option to specify the number of allowed mismatchesto fit more diverse purposes.
iv) Extracted reads are aligned to the L1 consensus sequence using BWA-MEM with default parameter setting. The coverage distribution of thealigned reads at each position of the L1 consensus sequence is gener-ated using BEDTools (79) genomecov with option −d.
v) Two-step normalization is performed using an in-house–developed Rscript. The read coverage at each position was first normalized by thenumber of reads mappable to the reference genome (this number canbe obtained in the output file of step iii) and then is normalized againstthe measured background (Input DNA). The median coverage of all basepositions on the L1 consensus sequence in the ChIP sample is calculated.The same division is also performed for the Input sample, followed bysubtraction of the Input sample from the ChIP sample at each position.We also excluded positions that have coverage less than 10 in the ChIPor Input distribution.
vi) ChIP-seq peaks within the L1 consensus sequence are called using an in-house–developed signal-processing algorithm (provided as a Python script),and a true peak is defined as present in the normalized data. The signalbackground was estimated by calculating the rmsd of the signal in a slidingwindow (width = ±80 bp) across L1Hs, and the rmsd of the backgroundwas estimated from the distribution of rmsds by finding the rmsd wherethe distribution dips to 20% of its maximum (i.e., disregarding large rmsdvalues that correspond to peaks for the background estimation). To findpeaks, the signal is smoothed using a smoothing filter (Hanning filter withwidth = ±80 bp) and differentiated to find local maxima, i.e., where thederivative of the smoothed signal is zero and the second derivative isnegative. The peaks are filtered using two thresholds on the original un-smoothed signal: signal minus background intensity larger than 1 and anrmsd ratio between signal and background larger than 1.3. The algorithmis insensitive to the choice of width of smoothing filter and the width ofwindow for rmsd calculations within a range of 40–120 bp. Informationabout the peaks, including peak location, height above background, width(defined as where the signal drops to 25% of its maximum), and signal-to-noise ratio, is extracted from the original signal ratio.
RNA-Seq Analysis. BAM files of 77 breast tumor and 127 ovarian tumorsamples were downloaded from the Genomic Data Commons Data Portal(https://portal.gdc.cancer.gov/), which had been aligned to hg38 using aTCGA-harmonized pipeline. Reads mapped to 1,620 RepeatMasker-annotatedL1HS regions were extracted from the BAM files. Reads containing the follow-ing features were filtered out: secondary alignments, clipping alignments, indels,or more than four mismatches. BAM files containing the L1 reads subset wereconverted to FASTQ files using SAMtools (80). Converted FASTQ files weresubsequently aligned to the L1HS consensus sequence using STAR (56). Weused the same parameter settings for this realignment step as for theTCGA-harmonized pipeline. Read counts of L1HS were then generatedusing HTSeq-count. We calculated fragments per kilobase of transcript permillion mapped reads (FPKM) values and performed samplewise normali-zation. For the cell line RNA-seq data, FASTQ files from ENCODE were first
aligned to hg38 with the TCGA-harmonized pipeline, and then the pro-cedure described above was followed.
Motif Analysis. The Position Weight Matrix (PWM) of each TF was down-loaded from Motif Browser (compbio.mit.edu/encode-motifs/) (50). Themotif similarity score was calculated by the following steps: (i) the weightsof each position in the target sequence were extracted from the PWM; (ii)we summed up the extracted weights at each position and divided the valueby the maximum of summed weights. We considered sequences that have asimilarity score ≥0.9 as true DNA motifs in our analysis.
Cell Culture and Stable Cell Lines. The luciferase 293T-REx reporter cell line andHEK293T andMCF-7 cells weremaintained in DMEM supplementedwith 10%FBS and 4 mM L-glutamine. The luciferase 293T-REx reporter cell line stablyexpresses the 5′ UTR of L1rp (L1 element in retinitis pigmentosa) flanked byRenilla luciferase in the forward orientation and firefly luciferase in theantisense orientation. The construction of the luciferase 293T-REx reportercell line was previously described in ref. 81, and the MCF-7 cell line was agenerous gift from Benjamin G. Neel at NYU Langone Health, New York. TheHEK293T cell line used was reported previously (82). The luciferase 293T-RExreporter cell line was used in the siRNA experiments; HEK293T and MCF-7 cellswere used in the motif-mutant reporter assay.
Motif Mutant Constructs. We identified six putative Myc-binding regions inthe L1 5′ UTR promoter sequence according to their high similarity score (>0.9)to Myc motifs. To disrupt the motifs, we shuffled each of the six sequencestogether with its 5-bp flanking regions to maintain the same nucleotidecomposition. Among the mutated sequences generated for each region, weselected the one that had the lowest similarity score and proceeded with ex-perimental validation. The wild-type reporter was generated by inserting aDNA fragment containing the L1rp 5′ UTR promoter driving firefly luciferase inthe forward direction. The mutant L1 5′ UTR promoter sequences (plus 40-bphomology arms) were synthesized using the BioXp 3200 System (SGI-DNA) andligated into the pcDNA5/FRT (Thermo Fisher Scientific) between the KpnI andBstXI restriction sites using Gibson Assembly master mix (New England Biolabs).The Renilla construct (transfection control) was generated by cloning theRenilla sequence into the pCEP4 mammalian expression vector (Thermo FisherScientific) under the CMV promoter at the HindIII site.
Luciferase Reporter Assay. HEK293T cells (0.075 million) and MCF-7 cells(0.004 million) were plated in each well of a 96-well plate. The next day thesecells were cotransfectedwith the Renilla construct andwith each of the reporterconstructs using FuGENE HD transfection reagent (Promega) according to themanufacturer’s recommendations. Replicates were done within the same plate.Forty-eight hours after transfection, we lysed the cells and measured the lu-ciferase activity with the Dual-Glo system (Promega). Firefly signal was firstnormalized to the Renilla signal within a well and then to the wild-type well.
Knockdown Experiments. The luciferase 293T-REx reporter cell line was usedfor the knockdown experiments. We plated 2,500 cells in each well of a 384-well plate; at the same time, cells were transfected with siRNA control orsiRNA against specific proteins (Life Technologies). DharmaFECT transfectionreagent (0.1 μL per well) (Dharmacon) was used for siRNA transfection.Forty-eight hours after knockdown, the firefly and Renilla luciferase activi-ties were measured with the Dual-Glo system. This experiment was designedin a format ideal for a whole-genome siRNA knockdown screen, and therobust z-score of the values in each well was calculated.
Data Access. All ChIP-seq and cell line RNA-seq datasets are available on theENCODE website (https://www.encodeproject.org) (43). All the RNA-seq data-sets of breast and ovarian tumors are available on the Genomic Data Com-mons Data Portal (https://portal.gdc.cancer.gov/). The MapRRCon analyzedresults on L1HS and closely related elements are freely available to access andvisualize via a web tool (maprrcon.org). The lists of TF/histone mark peakswere uploaded as Datasets S1–S3. In-house scripts related to MapRRConpipeline step 3, 5, 6 can be downloaded from the MapRRCon website.
ACKNOWLEDGMENTS. We thank the High-Performance Computing Facilityand the cluster at the Institute for Systems Genetics at NYU Langone Healthfor bioinformatics support, Matt Maurano for advice on high-performancecomputing, Carmine Fedele and Benjamin Neel for sharing the MCF7 cell lineand advice on cell culture, and Molly Hammell and Jason D. Fernandesfor helpful discussions on the challenges of mapping repetitive DNA reads.This work was supported by NIH Grants P50GM107632 and P01AG051449 (toJ.D.B. and D.F.).
E5534 | www.pnas.org/cgi/doi/10.1073/pnas.1722565115 Sun et al.
1. Boissinot S, Chevret P, Furano AV (2000) L1 (LINE-1) retrotransposon evolution andamplification in recent human history. Mol Biol Evol 17:915–928.
2. Kazazian HH, Jr (2004) Mobile elements: Drivers of genome evolution. Science 303:1626–1632.
3. St Laurent G, 3rd, Hammell N, McCaffrey TA (2010) A LINE-1 component to humanaging: Do LINE elements exact a longevity cost for evolutionary advantage? MechAgeing Dev 131:299–305.
4. Huang CRL, Burns KH, Boeke JD (2012) Active transposition in genomes. Annu RevGenet 46:651–675.
5. Ostertag EM, Kazazian HH, Jr (2003) Biology of mammalian L1 retrotransposons.Annu Rev Genet 35:501–538.
6. Jurka J, et al. (2005) Repbase update, a database of eukaryotic repetitive elements.Cytogenet Genome Res 110:462–467.
7. de Koning APJ, Gu W, Castoe TA, Batzer MA, Pollock DD (2011) Repetitive elementsmay comprise over two-thirds of the human genome. PLoS Genet 7:e1002384.
8. Pheasant M, Mattick JS (2007) Raising the estimate of functional human sequences.Genome Res 17:1245–1253.
9. Martin SL (2010) Nucleic acid chaperone properties of ORF1p from the non-LTR ret-rotransposon, LINE-1. RNA Biol 7:706–711.
10. Feng Q, Moran JV, Kazazian HH, Jr, Boeke JD (1996) Human L1 retrotransposon en-codes a conserved endonuclease required for retrotransposition. Cell 87:905–916.
11. Mathias SL, Scott AF, Kazazian HH, Jr, Boeke JD, Gabriel A (1991) Reverse transcrip-tase encoded by a human transposable element. Science 254:1808–1810.
12. Luan DD, Korman MH, Jakubczak JL, Eickbush TH (1993) Reverse transcription ofR2Bm RNA is primed by a nick at the chromosomal target site: A mechanism for non-LTR retrotransposition. Cell 72:595–605.
13. Cost GJ, Feng Q, Jacquier A, Boeke JD (2002) Human L1 element target-primed re-verse transcription in vitro. EMBO J 21:5899–5910.
14. Swergold GD (1990) Identification, characterization, and cell specificity of a humanLINE-1 promoter. Mol Cell Biol 10:6718–6729.
15. Minakami R, et al. (1992) Identification of an internal cis-element essential for the human L1transcription and a nuclear factor(s) binding to the element. Nucleic Acids Res 20:3139–3145.
16. Alexandrova EA, et al. (2012) Sense transcripts originated from an internal part of thehuman retrotransposon LINE-1 5′ UTR. Gene 511:46–53.
17. Speek M (2001) Antisense promoter of human L1 retrotransposon drives transcriptionof adjacent cellular genes. Mol Cell Biol 21:1973–1985.
18. Denli AM, et al. (2015) Primate-specific ORF0 contributes to retrotransposon-mediated diversity. Cell 163:583–593.
19. Thornburg BG, Gotea V, Makałowski W (2006) Transposable elements as a significantsource of transcription regulating signals. Gene 365:104–110.
20. Athanikar JN, Badge RM, Moran JV (2004) A YY1-binding site is required for accuratehuman LINE-1 transcription initiation. Nucleic Acids Res 32:3846–3855.
21. Becker KG, Swergold GD, Ozato K, Thayer RE (1993) Binding of the ubiquitous nucleartranscription factor YY1 to a cis regulatory sequence in the human LINE-1 transpos-able element. Hum Mol Genet 2:1697–1702.
22. Yang N, Zhang L, Zhang Y, Kazazian HH, Jr (2003) An important role for RUNX3 inhuman L1 transcription and retrotransposition. Nucleic Acids Res 31:4929–4940.
23. Wylie A, et al. (2016) p53 genes function to restrain mobile elements. Genes Dev 30:64–77.24. Harris CR, et al. (2009) p53 responsive elements in human retrotransposons.
Oncogene 28:3857–3865.25. Tchénio T, Casella JF, Heidmann T (2000) Members of the SRY family regulate the
human LINE retrotransposons. Nucleic Acids Res 28:411–415.26. Grow EJ, et al. (2015) Intrinsic retroviral reactivation in human preimplantation em-
bryos and pluripotent cells. Nature 522:221–225.27. Wang J, et al. (2014) Primate-specific endogenous retrovirus-driven transcription
defines naive-like stem cells. Nature 516:405–409.28. Kunarso G, et al. (2010) Transposable elements have rewired the core regulatory
network of human embryonic stem cells. Nat Genet 42:631–634.29. Fedorov AV, Lukyanov DV, Podgornaya OI (2006) Identification of the proteins specifi-
cally binding to the rat LINE1 promoter. Biochem Biophys Res Commun 340:553–559.30. Mita P, Boeke JD (2016) How retrotransposons shape genome regulation. Curr Opin
Genet Dev 37:90–100.31. de la Rica L, et al. (2016) TET-dependent regulation of retrotransposable elements in
mouse embryonic stem cells. Genome Biol 17:234.32. Lee J, Mun S, Meyer TJ, Han K (2012) High levels of sequence diversity in the 5′ UTRs
of human-specific L1 elements. Comp Funct Genomics 2012:129416.33. Sigurdsson MI, Smith AV, Bjornsson HT, Jonsson JJ (2012) The distribution of a
germline methylation marker suggests a regional mechanism of LINE-1 silencing bythe piRNA-PIWI system. BMC Genet 13:31.
34. Kinomoto M, et al. (2007) All APOBEC3 family proteins differentially inhibit LINE-1 retrotransposition. Nucleic Acids Res 35:2955–2964.
35. Yoder JA, Walsh CP, Bestor TH (1997) Cytosine methylation and the ecology of in-tragenomic parasites. Trends Genet 13:335–340.
36. Ashktorab H, et al. (2014) DNA methylome profiling identifies novel methylatedgenes in African American patients with colorectal neoplasia. Epigenetics 9:503–512.
37. Rodi�c N, et al. (2014) Long interspersed element-1 protein expression is a hallmark ofmany human cancers. Am J Pathol 184:1280–1286.
38. Kano H, et al. (2009) L1 retrotransposition occurs mainly in embryogenesis and createssomatic mosaicism. Genes Dev 23:1303–1312.
39. van den Hurk JAJM, et al. (2007) L1 retrotransposition can occur early in humanembryonic development. Hum Mol Genet 16:1587–1592.
40. Brouha B, et al. (2002) Evidence consistent with human L1 retrotransposition in ma-ternal meiosis I. Am J Hum Genet 71:327–336.
41. Smith ZD, et al. (2012) A unique regulatory phase of DNA methylation in the earlymammalian embryo. Nature 484:339–344.
42. Blaschke K, et al. (2013) Vitamin C induces Tet-dependent DNA demethylation and ablastocyst-like state in ES cells. Nature 500:222–226.
43. ENCODE Project Consortium (2012) An integrated encyclopedia of DNA elements inthe human genome. Nature 489:57–74.
44. Ito J, et al. (2017) Systematic identification and characterization of regulatory ele-ments derived from human endogenous retroviruses. PLoS Genet 13:e1006883.
45. Jain D, Baldi S, Zabel A, Straub T, Becker PB (2015) Active promoters give rise to falsepositive ‘Phantom Peaks’ in ChIP-seq experiments. Nucleic Acids Res 43:6959–6968.
46. Park D, Lee Y, Bhupindersingh G, Iyer VR (2013) Widespread misinterpretable ChIP-seq bias in yeast. PLoS One 8:e83506.
47. Teytelman L, Thurtle DM, Rine J, van Oudenaarden A (2013) Highly expressed loci arevulnerable to misleading ChIP localization of multiple unrelated proteins. Proc NatlAcad Sci USA 110:18602–18607.
48. Acharya A, Rishi V, Moll J, Vinson C (2006) Experimental identification of homo-dimerizing B-ZIP families in Homo sapiens. J Struct Biol 155:130–139.
49. Philippe C, et al. (2016) Activation of individual L1 retrotransposon instances is re-stricted to cell-type dependent permissive loci. eLife 5:166.
50. Kheradpour P, Kellis M (2014) Systematic discovery and characterization of regulatorymotifs in ENCODE TF binding experiments. Nucleic Acids Res 42:2976–2987.
51. Jakobsen JS, et al. (2013) Temporal mapping of CEBPA and CEBPB binding during liverregeneration reveals dynamic occupancy and specific regulatory codes for homeo-static and cell cycle gene batteries. Genome Res 23:592–603.
52. Gabay M, Li Y, Felsher DW (2014) MYC activation is a hallmark of cancer initiation andmaintenance. Cold Spring Harb Perspect Med 4:a014241.
53. Meyer N, Penn LZ (2008) Reflecting on 25 years with MYC. Nat Rev Cancer 8:976–990.54. Morrish F, Isern N, Sadilek M, Jeffrey M, Hockenbery DM (2009) c-Myc activates multiple
metabolic networks to generate substrates for cell-cycle entry. Oncogene 28:2485–2491.55. Miller DM, Thomas SD, Islam A, Muench D, Sedoris K (2012) c-Myc and cancer me-
tabolism. Clin Cancer Res 18:5546–5553.56. Dobin A, et al. (2013) STAR: Ultrafast universal RNA-seq aligner. Bioinformatics 29:15–21.57. Filippova GN, et al. (1996) An exceptionally conserved transcriptional repressor, CTCF,
employs different combinations of zinc fingers to bind diverged promoter sequencesof avian and mammalian c-myc oncogenes. Mol Cell Biol 16:2802–2813.
58. Klenova EM, et al. (1993) CTCF, a conserved nuclear factor required for optimaltranscriptional activity of the chicken c-myc gene, is an 11-Zn-finger protein differ-entially expressed in multiple forms. Mol Cell Biol 13:7612–7624.
59. Ling JQ, et al. (2006) CTCF mediates interchromosomal colocalization between Igf2/H19 and Wsb1/Nf1. Science 312:269–272.
60. Cuddapah S, et al. (2009) Global analysis of the insulator binding protein CTCF in chromatinbarrier regions reveals demarcation of active and repressive domains.Genome Res 19:24–32.
61. Dixon JR, et al. (2012) Topological domains in mammalian genomes identified byanalysis of chromatin interactions. Nature 485:376–380.
62. Kim S, Yu N-K, Kaang B-K (2015) CTCF as a multifunctional protein in genome reg-ulation and gene expression. Exp Mol Med 47:e166.
63. Barutcu AR, et al. (2015) Chromatin interaction analysis reveals changes in small chromosomeand telomere clustering between epithelial and breast cancer cells. Genome Biol 16:214.
64. Wendt KS, et al. (2008) Cohesin mediates transcriptional insulation by CCCTC-bindingfactor. Nature 451:796–801.
65. Parelho V, et al. (2008) Cohesins functionally associate with CTCF on mammalianchromosome arms. Cell 132:422–433.
66. Xu H, et al. (2014) Cohesin Rad21mediates loss of heterozygosity and is upregulated viaWntpromoting transcriptional dysregulation in gastrointestinal tumors. Cell Rep 9:1781–1797.
67. Tan-Wong SM, et al. (2012) Gene loops enhance transcriptional directionality. Science338:671–675.
68. Muotri AR, et al. (2010) L1 retrotransposition in neurons is modulated by MeCP2.Nature 468:443–446.
69. Macia A, et al. (2017) Engineered LINE-1 retrotransposition in nondividing humanneurons. Genome Res 27:335–348.
70. Erwin JA, Marchetto MC, Gage FH (2014) Mobile DNA elements in the generation ofdiversity and complexity in the brain. Nat Rev Neurosci 15:497–506.
71. Rangasamy D (2010) Histone variant H2A.Z can serve as a new target for breast cancertherapy. Curr Med Chem 17:3155–3161.
72. Rangasamy D (2013) Distinctive patterns of epigenetic marks are associated withpromoter regions of mouse LINE-1 and LTR retrotransposons. Mob DNA 4:27.
73. Cordaux R, Batzer MA (2009) The impact of retrotransposons on human genomeevolution. Nat Rev Genet 10:691–703.
74. Deininger PL, Moran JV, Batzer MA, Kazazian HH, Jr (2003) Mobile elements andmammalian genome evolution. Curr Opin Genet Dev 13:651–658.
75. Boissinot S, Furano AV (2001) Adaptive evolution in LINE-1 retrotransposons.Mol BiolEvol 18:2186–2194.
76. Lavie L, Maldener E, Brouha B, Meese EU, Mayer J (2004) The human L1 promoter:Variable transcription initiation sites and a major impact of upstream flanking se-quence on promoter activity. Genome Res 14:2253–2260.
77. Bolger AM, Lohse M, Usadel B (2014) Trimmomatic: A flexible trimmer for Illuminasequence data. Bioinformatics 30:2114–2120.
78. Li H, Durbin R (2010) Fast and accurate long-read alignment with Burrows-Wheelertransform. Bioinformatics 26:589–595.
79. Quinlan AR, Hall IM (2010) BEDTools: A flexible suite of utilities for comparing ge-nomic features. Bioinformatics 26:841–842.
80. Li H, et al. (2009) The Sequence Alignment/Map format and SAMtools. Bioinformatics25:2078–2079.
81. Mita P, et al. (2016) URI regulates KAP1 phosphorylation and transcriptional re-pression via PP2A phosphatase in prostate cancer cells. J Biol Chem 291:25516–25528.
82. Dai L, Taylor MS, O’Donnell KA, Boeke JD (2012) Poly(A) binding protein C1 is essential forefficient L1 retrotransposition and affects L1 RNP formation. Mol Cell Biol 32:4323–4336.
Sun et al. PNAS | vol. 115 | no. 24 | E5535
BIOPH
YSICSAND
COMPU
TATIONALBIOLO
GY
PNASPL
US