Embed Size (px)
Citation preview

Transcriptional Coordination of the Metabolic Networkin Arabidopsis1[W][OA]
Hairong Wei2, Staffan Persson2, Tapan Mehta, Vinodh Srinivasasainagendra, Lang Chen, Grier P. Page,Chris Somerville, and Ann Loraine*
Department of Biostatistics (H.W., T.M., V.S., L.C., G.P.P., A.L.) and Department of Genetics (A.L.),University of Alabama, Birmingham, Alabama 35294; Department of Plant Biology, Carnegie Institution,Stanford, California 94305 (S.P., C.S.); and Department of Biological Sciences, Stanford University,Stanford, California 94305 (C.S.)
Patterns of coexpression can reveal networks of functionally related genes and provide deeper understanding of processesrequiring multiple gene products. We performed an analysis of coexpression networks for 1,330 genes from the AraCycdatabase of metabolic pathways in Arabidopsis (Arabidopsis thaliana). We found that genes associated with the same metabolicpathway are, on average, more highly coexpressed than genes from different pathways. Positively coexpressed genes withinthe same pathway tend to cluster close together in the pathway structure, while negatively correlated genes typically occupymore distant positions. The distribution of coexpression links per gene is highly skewed, with a small but significant number ofgenes having numerous coexpression partners but most having fewer than 10. Genes with multiple connections (hubs) tend tobe single-copy genes, while genes with multiple paralogs are coexpressed with fewer genes, on average, than single-copygenes, suggesting that the network expands through gene duplication, followed by weakening of coexpression links involvingduplicate nodes. Using a network-analysis algorithm based on coexpression with multiple pathway members (pathway-levelcoexpression), we identified and prioritized novel candidate pathway members, regulators, and cross pathway transcriptionalcontrol points for over 140 metabolic pathways. To facilitate exploration and analysis of the results, we provide a Web site(http://www.transvar.org/at_coexpress/analysis/web) listing analyzed pathways with links to regression and pathway-levelcoexpression results. These methods and results will aid in the prioritization of candidates for genetic analysis of metabolismin plants and contribute to the improvement of functional annotation of the Arabidopsis genome.
The advent of whole-system approaches, such asDNA chips and metabolomics, have created new op-portunities for studying how metabolic pathways arecoordinated to meet cellular demands (Sweetlove andFernie, 2005). Connectivity in the yeast (Saccharomycescerevisiae) metabolic network has been explored usinggene coexpression data and structural informationabout the pathways; these studies have revealed fun-damental insights into the general properties of met-abolic gene networks in eukaryotes (DeRisi et al., 1997;Ihmels et al., 2004b). One early result was that func-tionally related genes are often coexpressed, and thisobservation has provided strong motivation for theadoption of expression microarrays in biological re-
search (DeRisi et al., 1997). In addition, it has beenshown that many genes encoding metabolic enzymesform modules of coexpression and that coexpressedgenes occupy nonrandom positions with respect tothe pathway structure (Ihmels et al., 2004a, 2004b). Anumber of methods based on integration of gene ex-pression data with other data types have been devel-oped, allowing identification of undiscovered modules(Stuart et al., 2003) as well as control elements andtranscription factors that regulate their expression(Pilpel et al., 2001). Other important results from thestudy of biological networks include observations thatlethality correlates with high connectivity in the pro-tein interaction and coexpression networks in yeast(Jeong et al., 2001; Carlson et al., 2006), while for mam-malian protein interaction networks, the lethality/connectivity correlation is less pronounced (Gandhiet al., 2006). For both network types, connectivity dis-tributions are highly uneven and are well describedby power functions of the form f ; k2a, where f is thefrequency of nodes having k connections. Althoughthe goodness of fit of power law functions is some-times controversial, it is clear that most biologicalnetworks include a small but significant number ofnodes (e.g. genes or proteins) that have a large numberof connections, but most nodes have very few (forreview, see Albert, 2005). Until recently, the bulk ofresearch done on coexpression networks and metabo-lism has focused primarily on analysis of data from
1 This work was supported by the National Science Foundation(grant no. 0217651), the U.S. Department of Energy (grant no. DE–FG02–03ER20133), and a Swedish Research Council Fellowship(grant no. 623–2004–4254 to S.P.).
2 These authors contributed equally to the paper.* Corresponding author; e-mail [email protected]; fax 205–975–
2540.The author responsible for distribution of materials integral to the
findings presented in this article in accordance with the policydescribed in the Instructions for Authors (www.plantphysiol.org) is:Ann Loraine ([email protected]).
[W] The online version of this article contains Web-only data.[OA] Open Access articles can be viewed online without a sub-
scription.www.plantphysiol.org/cgi/doi/10.1104/pp.106.080358
762 Plant Physiology, October 2006, Vol. 142, pp. 762–774, www.plantphysiol.org � 2006 American Society of Plant Biologists
Dow
nloaded from https://academ
ic.oup.com/plphys/article/142/2/762/6106444 by guest on 26 D
ecember 2021

yeast. However, the accumulation of genomic andmetabolic information for more complex eukaryotes,most notably the model dicot Arabidopsis (Arabidopsisthaliana), now allows for analogous studies in higherplants (Minorsky, 2003; Gutierrez et al., 2005).
AraCyc (http://Arabidopsis.org/tools/aracyc/) isa database and visualization system for metabolicpathways in Arabidopsis developed by The Arabi-dopsis Information Resource (TAIR). The first versionof the AraCyc database was based on the MetaCyccompendium of known biochemical pathways andoutput from the Pathologic software, which uses key-word matching to assign gene products to individualpathway steps recorded in MetaCyc. Since then, AraCychas undergone continuous improvement throughmanual editing and literature-based curation (Muelleret al., 2003). However, approximately 40% of thebiochemical reactions in AraCyc have no gene anno-tation, while many others have multiple gene annota-tions. Because the pathways are based primarily onshared sequence similarity with enzymes from otherorganisms, it is likely that many annotations willrequire validation from other sources. In this article,we explore the idea that it may be possible to deepenthe annotation of plant metabolic pathways by usingcoexpression patterns deduced from publicly avail-able DNA microarray datasets to infer functional re-lationships among genes.
In previous work, we described a method that usescoexpression relationships inferred from regressionanalysis of DNA microarray data to identify newplayers in biological pathways (Persson et al., 2005).Using this method, we analyzed quality-screenedAffymetrix ATH1 microarray experiments and identi-fied sets of genes that are highly coexpressed with oneor more cellulose synthase (CESA) genes in Arabidop-sis. The general utility of the approach was demon-strated through mutant analyses of candidate genes:Two genes coexpressed with CESA genes implicatedin secondary cell wall formation exhibited cell wall-related phenotypes. Here we further develop the coex-pression approach and apply it to metabolic pathwaysin Arabidopsis. Using the AraCyc database as a start-ing point, we conducted large-scale coexpression anal-yses for 1,330 genes encoding metabolic enzymes inArabidopsis and generated metabolic networks basedon the transcriptional relationships between genes. Bycomparing the AraCyc view of Arabidopsis metabo-lism with gene expression data, we propose a richerand more detailed picture of metabolic pathways inArabidopsis and introduce a wealth of candidates forgenetic and biochemical analysis.
RESULTS
Genes Belonging to the Same Pathway Are Coexpressed
We used publicly available data from 486 quality-screened ATH1 array hybridizations to analyze coex-
pression patterns for metabolic pathway genes inArabidopsis. The ATH1 expression microarray fromAffymetrix contains over 22,000 probe sets that hy-bridize to one or more Arabidopsis genes (Redmanet al., 2004). Using probe set annotations from Affy-metrix, we identified 1,330 nonpromiscuous, nonre-dundant probe sets that each measure a single genefrom the AraCyc database of metabolic pathways. Wethen performed large-scale linear regression analysisof expression values between these 1,330 probe setsand all other probe sets on the array using the meth-odology developed previously (Persson et al., 2005).Each regression analysis generates three values usefulfor evaluating coexpression relationships: a slope pa-rameter that indicates the direction (positive or nega-tive) of coexpression, and p and R-squared (r2) valuesthat indicate the strength of the coexpression relation-ship. The r2 value, also known as the coefficient ofdetermination, is the square of the Pearson’s correla-tion coefficient (r) and is the fraction of variance in onevariable that can be explained by variation in the other(Rodgers and Nicewander, 1988). Thus, r2 values thatare closer to 1 indicate higher correlation and a stron-ger linear relationship between compared variables.The p value quantifies the confidence in the correla-tion; it is the probability that the observed value for r2
could have been obtained by chance under the nullhypothesis that the two variables being compared arenot linearly related. Figure 1 describes the relationshipsbetween p and r2 values obtained in our study andpresents illustrative examples of gene pairs that arehighly or weakly coexpressed in positive or negative
Figure 1. Coexpression p and r2 values for genes from the AraCycdatabase of metabolic pathways. A, Logarithm (base 10) of regression pvalues plotted against corresponding r2 values obtained from regressingexpression values for 1,330 AraCyc genes against all genes on theATH1 expression microarray. B to D, Example plots showing positive(D) and negative (B) linear relationships between normalized expres-sion values (log base 2) for weakly (C) and strongly (B and D)coexpressed genes.
Transcriptional Coordination of the Metabolic Network
Plant Physiol. Vol. 142, 2006 763
Dow
nloaded from https://academ
ic.oup.com/plphys/article/142/2/762/6106444 by guest on 26 D
ecember 2021

directions. As shown in Figure 1A, a strong relation-ship exists between p and r2 values in our data set;however, because of the greater range among p values,we decided to use primarily the p values to assesscoexpression between genes.
It is generally expected that gene products that areregulated at the level of mRNA abundance and thatcollaborate in a shared function or pathway are likelyto be coexpressed. To assess whether this was the casewith Arabidopsis metabolic pathways, we comparedr2 and p values obtained from linear regressions per-formed between genes annotated as belonging to thesame or different metabolic pathways in AraCyc. Ingeneral, the population of within-pathway compari-sons contained a higher proportion of high-confidence(low p and high r2) results than did comparisonsinvolving genes from different pathways (Table I).Thus, we found that genes annotated as belonging tothe same pathway tend to be more tightly coexpressedthan genes from different metabolic pathways, a resultthat is consistent with results obtained from simi-lar studies in yeast (Ihmels et al., 2004b). Interestingly,we also found that the relative proportion of high-confidence coexpression relationships is also higheramong positively coexpressed genes than among neg-atively coexpressed genes.
Core Metabolic Pathways Display Tighter Level
of Transcriptional Coordination
To investigate whether coexpression levels of geneswithin pathways vary from one pathway to another,we used a random sampling approach to identifypathways that contained above-average numbers ofcoexpressed gene pairs. For each gene, we created alist of all other genes represented on the ATH1 arrayand ordered the list by increasing p (or, equivalently,decreasing r2) values. In this scheme, genes withinhighly coexpressed pathways should appear near thetop of each other’s coexpression lists and have small
ranks. Moreover, the average of their mutual ranksshould be unusually small when compared to samplesof genes selected at random without regard to theirpathway affiliation. To test this, we selected 10,000random samples of size N for each pathway having Ngenes, computed the average rank for each sample,and then compared the distribution of average ranksfrom the samples to the actual average rank obtainedfor each pathway. The frequency with which we ob-served average ranks as small or smaller than theactual observed values thus provided an empiricallydetermined, within-pathway coexpression p value foreach pathway.
Table II presents the most tightly coregulated path-ways according to this analysis. These tightly coex-pressed pathways were enriched in core metabolicpathways such as glycolysis, tricarboxylic acid (TCA)cycle, and the pentose phosphate pathway, whichproduce precursors for many other pathways. Bycontrast, pathways involved in noncore or peripheralbiochemical pathways were coexpressed to a lesserdegree. A full list of the pathways we analyzed, withlinks to Web pages for individual genes, pathways,probe sets, and plain-text spreadsheets of regres-sion results, is available at http://www.transvar.org/at_coexpress/analysis/web.
Inferring Coexpressed Genes for Metabolic Pathways
We have shown that pathways are enriched forcoexpressed genes, a result that is consistent with thecommonly held view that genes involved in relatedfunctions are expressed in a coordinate fashion. Pre-viously, we used this aspect of transcriptional regula-tion to identify new members of cellulose biosynthesispathways. Using large-scale coexpression results for agroup of known CESA genes, we identified candidategenes outside the group that were coexpressed withsome or all group members. In this earlier analysis, weobserved that although genes in cellulose biosynthesispathways typically appear near the top of each other’scoexpression lists, often there are many more genesthat have a higher ranking in terms of coexpressionthan the other group members. We found that this wasalso the case for the AraCyc coexpression data set. Wefound that individual pathway genes are typically co-expressed with tens or sometimes hundreds of geneseven at relatively stringent p or r2 value coexpressioncutoffs and that often these nonpathway genes out-rank other members of the pathway in terms of co-expression (Fig. 2).
Previously, we narrowed the field of candidategenes for genetic analyses based on the number ofCESA bait genes with which the candidates werecoexpressed. That is, we chose candidate genes thatwere tightly coexpressed with as many bait genes aspossible. Here, we present a more general version ofthis approach that uses both the coexpression set sizeand p values to select and rank candidates (Fig. 3A).The method computes a network structure in which
Table I. Gene pairs in the same pathway contain a higherproportion of high-confidence coexpression results
Each row reports the percentage of regression results within eachcolumn’s category having the p values indicated in the first column. Thefinal row reports the number of pairs (N) considered in each category.The table counts each gene pair once and excludes promiscuous probesets that match more than one gene.
2Log (p)
Within
Pathway,
Positive
Slope
Across
Pathway,
Positive
Slope
Within
Pathway,
Negative
Slope
Across
Pathway,
Negative
Slope
.200 0.8% 0.05% 0 0120–200 1.4% 0.53% 0 0.0009%80–120 2.9% 1.2% 0.28% 0.11%60–80 2.8% 1.5% 1.2% 0.53%40–60 5.8% 3.5% 3.3% 2.3%,40 86% 93% 95% 97%N (100%5) 4,033 426,724 3,226 434,388
Wei et al.
764 Plant Physiol. Vol. 142, 2006
Dow
nloaded from https://academ
ic.oup.com/plphys/article/142/2/762/6106444 by guest on 26 D
ecember 2021

genes are considered linked when their linear regres-sion p and r2 values meet a user-defined threshold. Itthen identifies genes within the network that are linkedwith multiple members of a given pathway; using graphanalysis terminology, this is equivalent to finding geneswhose neighborhood of connected genes include mul-tiple genes in the pathway. Next, it ranks these candi-date genes based on the number of connected pathwaygenes (within-pathway neighborhood size) and resolvesties using the product of regression p values betweencoexpressed gene bait and candidate genes.
Note that analyzing the network structure in thisway does not require that the pathway membersthemselves be coexpressed (linked) with each other,although this is often the case. In fact, this is a potentialstrength of the approach in that it can exploit potentialredundancies in the system. For example, two iso-zymes that perform the same pathway step may notnecessarily be coexpressed with each other, but theycould each require coexpression with a third gene thatsupplies necessary functionality. Depending on thestrength of coexpression, the approach would identifythis third gene or any other genes that are connectedwith multiple genes within the same pathway group.In recognition that this approach is based on coex-pression with multiple pathway members, not justsingle genes, we have termed this approach pathway-level coexpression (PLC) analysis.
We used PLC analysis to survey coexpression rela-tionships for 205 AraCyc pathways, using coexpres-
sion p value cutoffs ranging from 1e-40 to 1e-200.Figure 3B summarizes the number of genes identifiedas being connected to one or more pathway membersat different p value cutoffs. A coexpression p value of1E-80 or better and pathway neighborhoods of two ormore pathway genes produces 4,022 candidates con-nected with 144 pathways. Interestingly, we identifiedmore than 100 genes (using p value cutoff 1E-80) thatare coexpressed with pathway neighborhoods con-taining 15 or more genes. These PLC-identified geneswere from two of the most highly coexpressed path-ways: chlorophyll biosynthesis and the Calvin cycle.
Table II. Most highly coexpressed pathways
Pathways with unusually high levels of coexpression (empirically determined pathway p value , 0.0001)and at least five coexpression links (edges) between genes are listed. The column labeled Genes gives thenumber of genes per pathway included in the coexpression analysis. The column labeled Edges lists thenumber of coexpression links in the within-pathway coexpression network, using coexpression cutoff1E-80. C is the clustering coefficient for the coexpression network; larger values for C indicate a higher degreeof connectivity (Watts and Strogatz, 1998). Super-pathway designations are from AraCyc: PME, Generation ofprecursor metabolites and energy; B, biosynthesis; D/U/A, degradation/utilization/assimilation.
Pathway Genes Edges C Super Pathway
Photosynthesis, light reaction 10 40 0.923 PMECarotenoid biosynthesis 10 22 0.754 BGly degradation I 8 10 0.604 D/U/AtRNA charging pathway 44 102 0.412 BCalvin cycle 36 93 0.399 D/U/APhotorespiration 29 42 0.318 PMEChlorophyll biosynthesis 49 105 0.298 BGluconeogenesis 55 82 0.288 BFru degradation (anaerobic) 57 57 0.266 D/U/AGlycolysis I 59 57 0.257 PMESorbitol fermentation 59 57 0.257 PMEGlycolysis IV 59 57 0.257 PMEAcetate fermentation 60 57 0.252 PMEDe novo biosynthesis of purine nucleotides II 29 22 0.22 BStarch biosynthesis 19 7 0.211 BFatty acid biosynthesis—initial steps 30 13 0.156 BDe novo biosynthesis of purine nucleotides I 46 32 0.151 BTCA cycle—aerobic respiration 42 11 0.111 PMEAcetyl-CoA assimilation 28 6 0.107 PMEColanic acid building blocks biosynthesis 53 12 0.066 B
Figure 2. Relative proportions of high-confidence coexpression links.Each column reports the relative numbers of coexpression pairs with pvalues indicated on the x axis, where the paired genes are both in thesame AraCyc pathway (I), both are in different AraCyc pathways (N), oronly one is in an AraCyc pathway (O).
Transcriptional Coordination of the Metabolic Network
Plant Physiol. Vol. 142, 2006 765
Dow
nloaded from https://academ
ic.oup.com/plphys/article/142/2/762/6106444 by guest on 26 D
ecember 2021

For the Calvin cycle pathway, the highest-rankingPLC-identified gene candidates included several pu-tative chloroplast proteins, including four of unknownfunction and several more with predicted functionsrelated to electron transport and photosynthesis, suchas iron binding and ferrochelatase activity. The high-est-ranking PLC result for the chlorophyll biosynthesispathway is GUN4 (AT3G59400), a well-studied regulatorof chlorophyll biosynthesis and a key player in plastid-to-nuclear signal transduction (Larkin et al., 2003).
Further manual and computational inspection ofPLC-identified candidate genes reveals many morethat appear to be good candidates for biologicallymeaningful coordinate expression. The flavonoid bio-synthesis pathway (PWY1F-FLAVSYN), one of thebest-studied pathways in plant secondary metabolism,
provides a representative example (Winkel-Shirley,2001). Table III lists top-ranking genes linked with flavo-noid biosynthesis according to PLC. Five of these arealready associated with the pathway, a consequence ofwithin-pathway coexpression relationships. Three othershave gene ontology (GO) annotations linking them toflavonoid biosynthesis. One of these, At5g17050, was re-cently identified as a flavonoid 3-O-glucosyltransferase,which influences the flow of metabolites through theflavonoid pathway (Tohge et al., 2005).
The Trp biosynthesis pathway provides another illus-tration of how coexpression analysis can lead to newhypotheses regarding gene function. Two genes inthe pathway are coexpressed with At3g26830 (PAD3),which encodes a cytochrome p450 monoxygenase andwas recently shown to catalyze the final step in thecamalexin biosynthesis pathway (Zhou et al., 1999;Schuhegger et al., 2006; note that the version of AraCycwe used predates the latter finding and assigns thePAD3 gene product to the first step of the pathway).Camalexin is the major phytoalexin compound pro-duced in Arabidopsis and plays a role in defenseagainst several pathogens (for review, see Glazebrook,2005). As it is synthesized from precursors derivedfrom Trp, it is not surprising that we have detected acoexpression relationship between these two path-ways (Glawischnig et al., 2004). However, we alsofound that the two Trp biosynthesis pathway genescoexpressed with PAD3 are also coexpressed withtwo other genes of unknown function (At2g38860 andAt3g46110), which are themselves coexpressed withPAD3. These two genes occupy positions 62 and 137(out of 22,000) in the sorted list of coexpression resultsfor PAD3, suggesting that they may play a role inlinking camalexin and Trp biosynthesis pathways inArabidopsis.
Using GO Annotations to Evaluate PLC-IdentifiedCandidate Genes
As described above, PLC analysis ranks candidategenes first by the number of coexpressed partnersfrom the bait pathway and second by the p values ofthe coexpression relationships. Further selection ofcandidate genes is possible using annotations derivedfrom independent sources unrelated to coexpressiondata, such as functional information inferred fromsequence homology or curated from the literature. Forthis study, we used GO annotations as a convenientsummary of known and predicted functional infor-mation for Arabidopsis gene products (Harris et al.,2004). None of the annotations from GO are (thus far)based on large-scale coexpression analysis.
The GO is a structured vocabulary of terms that thatorganizes knowledge of gene products according totheir molecular function, biological role, or cellularlocalization. GO annotations are associations betweenterms and gene products, and each GO annotation istagged with an evidence code indicating the annota-tion source. The GO annotations can aid the evaluation
Figure 3. Coexpression network analysis. A, Schematic showing PLCanalysis for identifying functionally relevant candidate genes outside afunctional grouping (e.g. a metabolic pathway) using their connectionsto genes within the group. Bait genes that are members of the samefunctional group (rectangular area) are connected via coexpressionrelationships (dotted lines) to genes not currently annotated as belong-ing to the group. Some of the genes outside the group are connected tomore than one group member and are selected as candidates for furtheranalysis. B, Numbers of coexpressed genes selected under differentcoexpression p value cutoffs (ranging from 1E-40 to 1E-120) or requir-ing increasingly large numbers of coexpression partners within apathway (2–15). No gene pair is counted more than once per column.
Wei et al.
766 Plant Physiol. Vol. 142, 2006
Dow
nloaded from https://academ
ic.oup.com/plphys/article/142/2/762/6106444 by guest on 26 D
ecember 2021

of PLC analysis results in two ways: First, they candirect attention to particular classes of coexpressedgenes, such as transcription factors or protein kinases,and second, they can allow further prioritization ofcandidate genes based on the similarity of annotationswith bait genes from the target pathway. We found thatterms appearing frequently among annotations associ-ated with the bait genes also appear frequently amongthe genes identified in the PLC analysis.
For flavonoid biosynthesis, the term chloroplast isone of the most abundantly used terms for genes withinthe pathway as well as for the pool of candidate genesidentified by PLC analysis (Supplemental Table S1).This annotation derives from electronic annotation by
TargetP, a program that uses N-terminal sequence infor-mation to predict subcellular localization (Emanuelssonet al., 2000). Although the chloroplast assignment maynot be correct given that flavonoid biosynthesis isthought to be associated with the endoplasmic reticulum,it is notable that TargetP assigned the same localizationto genes both within the pathway and to coexpressedgenes inferred by the PLC method. In addition, 14 PLC-identified genes are annotated with the term transcrip-tion factor activity, suggesting a potential role in theregulation of the pathway.
The GO also includes terms indicating that the pro-cess, function, or cellular localization of the annotatedgene product is currently unknown. We found that a
Table III. Genes coexpressed with the flavonoid biosynthesis pathway
Top-ranking genes identified by PLC analysis using p value , 1e-80 are shown with GO annotations. Asterisks indicate genes that are alreadyannotated as members of the flavonoid biosynthesis pathway. The number of coexpressed flavonoid biosynthesis genes is indicated in parenthesesin the column labeled Gene ID.
Rank Gene ID Annotations (GO ID and Term)
1 AT5G08640 (5) GO:0008372:cellular component unknownGO:0005554:molecular function unknownGO:0000004:biological process unknown
2 AT5G17050 (5) GO:0016757:transferase activity, transferring glycosyl groupsGO:0008194:UDP-glycosyltransferase activityGO:0008152:metabolismGO:0016999:antibiotic metabolismGO:0009507:chloroplast
3* AT3G51240 (4) GO:0009813:flavonoid biosynthesisGO:0008372:cellular component unknownGO:0045486:naringenin 3-dioxygenase activity
4* AT5G05270 (4) GO:0005554:molecular function unknownGO:0009813:flavonoid biosynthesisGO:0008372:cellular component unknown
5* AT5G13930 (4) GO:0009715:chalcone biosynthesisGO:0009705:vacuolar membrane (sensu Magnoliophyta)GO:0016210:naringenin-chalcone synthase activityGO:0005783:endoplasmic reticulumGO:0009813:flavonoid biosynthesis
6* AT3G55120 (4) GO:0045430:chalcone isomerase activityGO:0005783:endoplasmic reticulumGO:0009813:flavonoid biosynthesisGO:0009705:vacuolar membrane (sensu Magnoliophyta)GO:0009411:response to UVGO:0042406:extrinsic to endoplasmic reticulum membrane
7* AT1G65060 (4) GO:0009698:phenylpropanoid metabolismGO:0009411:response to UVGO:0016207:4-coumarate-CoA ligase activityGO:0008372:cellular component unknown
8 AT1G01280 (3) GO:0004497:monooxygenase activityGO:0019825:oxygen bindingGO:0005509:calcium ion bindingGO:0006118:electron transportGO:0012505:endomembrane system
9 AT4G20420 (3) GO:0000004:biological process unknownGO:0005554:molecular function unknownGO:0012505:endomembrane system
10 AT3G11980 (3) GO:0009507:chloroplastGO:0009522:PSIGO:0016628:oxidoreductase activity, acting on the CH-CH group of donors,
NAD or NADP as acceptorGO:0009556:microsporogenesis
Transcriptional Coordination of the Metabolic Network
Plant Physiol. Vol. 142, 2006 767
Dow
nloaded from https://academ
ic.oup.com/plphys/article/142/2/762/6106444 by guest on 26 D
ecember 2021

large number of candidate genes identified throughPLC analysis are annotated with the unknown func-tion GO terms including 1,205 for biological processunknown; 1,021 for molecular function unknown; and32 for cellular component unknown out of a total of4,022 PCL-identified genes. If coexpression patternscan imply functional information, then large-scalecoexpression analysis as described here has the po-tential to contribute to functional annotation of Arabi-dopsis gene products.
Distance-Dependent Distribution of CoexpressedMetabolic Genes
Manual inspection of the coexpression relationshipsbetween genes in the same pathway reveals that thedistribution of connections between pathway genesappears nonrandom with respect to pathway structureand reaction order. As an example, Figure 4A shows aschematic view of positively coexpressed genes fromthe glycolysis pathway. Subsets of genes in the path-way form three groups of coexpressed genes, one ofwhich involves nearly every pathway step. Othergroups involve genes that catalyze adjacent or nearbyreaction steps, which may reflect a general trend. Toinvestigate this possibility, we plotted the number ofpathway steps that separate coexpressed gene pairsfor pathways containing at least six pathway steps (fora list of these pathways, see Supplemental Table S2).Figure 4B summarizes the results; positive coexpres-sion typically involved genes associated with adjacentpathway steps. Negative coexpression, on the otherhand, more often involved genes separated by two tothree pathway steps.
Topological Features of the Metabolic Network
To explore the topology of the metabolic network,we examined the distribution of linked nodes (genes)in networks based on coexpression relationships (Fig.5, A and B). We found that the distribution of links pernode in the coexpression network of metabolic genesin Arabidopsis is highly skewed, with most geneshaving a small number of connections and a small butsignificant number having many connections (Fig. 5C).For example, at coexpression p value cutoff 1E-80, over70% and 95% of linked nodes in the positive andnegative AraCyc coexpression networks are connectedto 10 or fewer genes/nodes. At this same p valuethreshold, both positively and negatively connectedgenes formed large networks of interconnectedgenes, but many genes (over half) lacked coexpression
Figure 4. Transcriptional organization of metabolic pathway genes. A,Connectivity in the glycolysis pathway based on coexpression p valuethreshold 10280. Lines connect groups of coexpressed genes. Onlygenes with nonpromiscuous probe sets are shown. B, Distribution ofconnections for pathways with six or more pathway steps and at least
two coexpressed pathway genes. The x axis shows distance in pathwaysteps. Genes catalyzing the same step are counted as zero pathwaysteps, genes catalyzing adjacent steps are counted as one pathway step,and so on. The y axis gives the number of coexpression links for positive(dark) and negative (lighter) coexpression relationships. Pathways in-cluded in the analysis are listed in Supplemental Table S2.
Wei et al.
768 Plant Physiol. Vol. 142, 2006
Dow
nloaded from https://academ
ic.oup.com/plphys/article/142/2/762/6106444 by guest on 26 D
ecember 2021
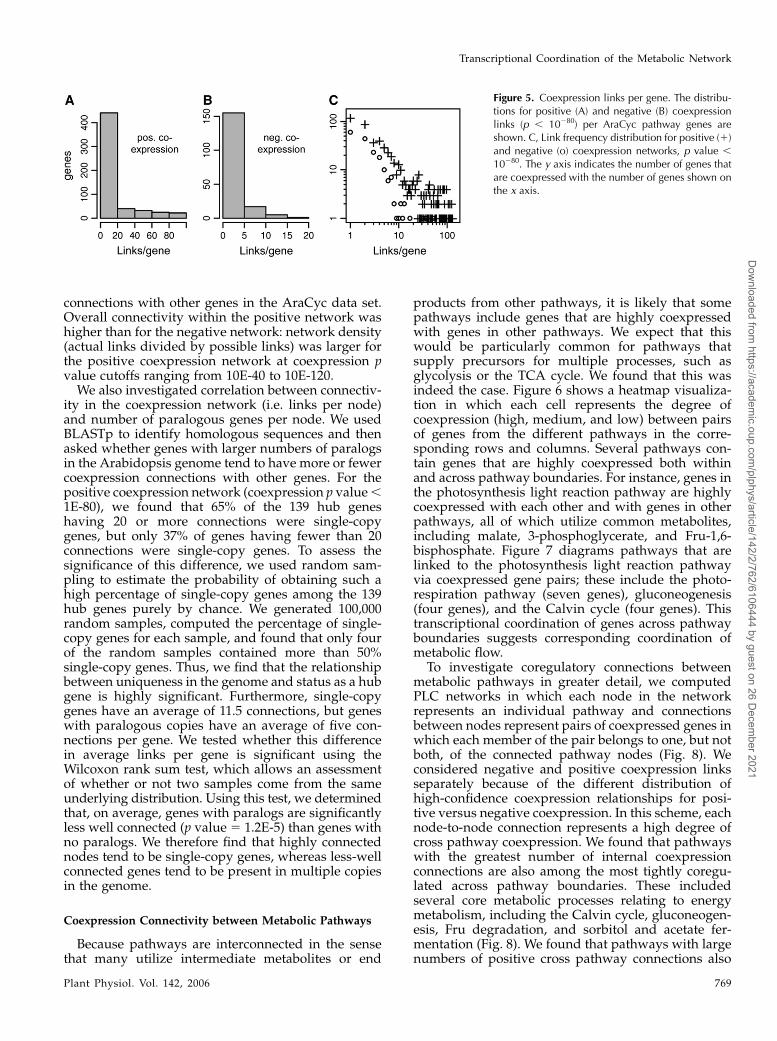
connections with other genes in the AraCyc data set.Overall connectivity within the positive network washigher than for the negative network: network density(actual links divided by possible links) was larger forthe positive coexpression network at coexpression pvalue cutoffs ranging from 10E-40 to 10E-120.
We also investigated correlation between connectiv-ity in the coexpression network (i.e. links per node)and number of paralogous genes per node. We usedBLASTp to identify homologous sequences and thenasked whether genes with larger numbers of paralogsin the Arabidopsis genome tend to have more or fewercoexpression connections with other genes. For thepositive coexpression network (coexpression p value ,1E-80), we found that 65% of the 139 hub geneshaving 20 or more connections were single-copygenes, but only 37% of genes having fewer than 20connections were single-copy genes. To assess thesignificance of this difference, we used random sam-pling to estimate the probability of obtaining such ahigh percentage of single-copy genes among the 139hub genes purely by chance. We generated 100,000random samples, computed the percentage of single-copy genes for each sample, and found that only fourof the random samples contained more than 50%single-copy genes. Thus, we find that the relationshipbetween uniqueness in the genome and status as a hubgene is highly significant. Furthermore, single-copygenes have an average of 11.5 connections, but geneswith paralogous copies have an average of five con-nections per gene. We tested whether this differencein average links per gene is significant using theWilcoxon rank sum test, which allows an assessmentof whether or not two samples come from the sameunderlying distribution. Using this test, we determinedthat, on average, genes with paralogs are significantlyless well connected (p value 5 1.2E-5) than genes withno paralogs. We therefore find that highly connectednodes tend to be single-copy genes, whereas less-wellconnected genes tend to be present in multiple copiesin the genome.
Coexpression Connectivity between Metabolic Pathways
Because pathways are interconnected in the sensethat many utilize intermediate metabolites or end
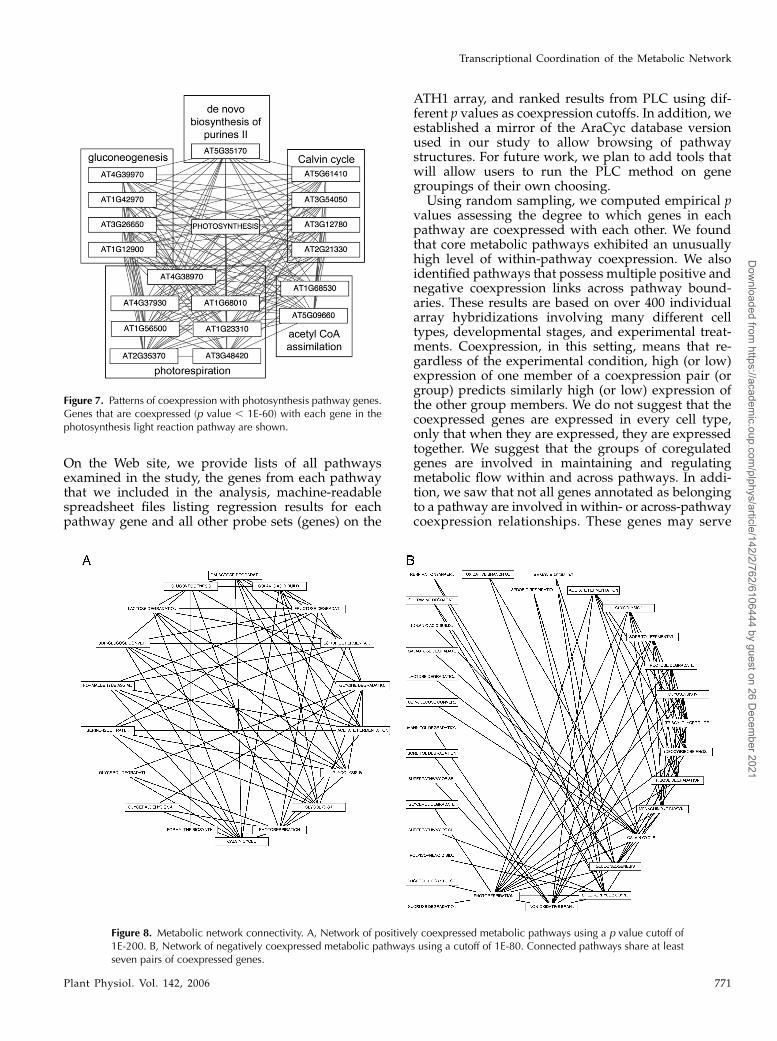
products from other pathways, it is likely that somepathways include genes that are highly coexpressedwith genes in other pathways. We expect that thiswould be particularly common for pathways thatsupply precursors for multiple processes, such asglycolysis or the TCA cycle. We found that this wasindeed the case. Figure 6 shows a heatmap visualiza-tion in which each cell represents the degree ofcoexpression (high, medium, and low) between pairsof genes from the different pathways in the corre-sponding rows and columns. Several pathways con-tain genes that are highly coexpressed both withinand across pathway boundaries. For instance, genes inthe photosynthesis light reaction pathway are highlycoexpressed with each other and with genes in otherpathways, all of which utilize common metabolites,including malate, 3-phosphoglycerate, and Fru-1,6-bisphosphate. Figure 7 diagrams pathways that arelinked to the photosynthesis light reaction pathwayvia coexpressed gene pairs; these include the photo-respiration pathway (seven genes), gluconeogenesis(four genes), and the Calvin cycle (four genes). Thistranscriptional coordination of genes across pathwayboundaries suggests corresponding coordination ofmetabolic flow.
To investigate coregulatory connections betweenmetabolic pathways in greater detail, we computedPLC networks in which each node in the networkrepresents an individual pathway and connectionsbetween nodes represent pairs of coexpressed genes inwhich each member of the pair belongs to one, but notboth, of the connected pathway nodes (Fig. 8). Weconsidered negative and positive coexpression linksseparately because of the different distribution ofhigh-confidence coexpression relationships for posi-tive versus negative coexpression. In this scheme, eachnode-to-node connection represents a high degree ofcross pathway coexpression. We found that pathwayswith the greatest number of internal coexpressionconnections are also among the most tightly coregu-lated across pathway boundaries. These includedseveral core metabolic processes relating to energymetabolism, including the Calvin cycle, gluconeogen-esis, Fru degradation, and sorbitol and acetate fer-mentation (Fig. 8). We found that pathways with largenumbers of positive cross pathway connections also
Figure 5. Coexpression links per gene. The distribu-tions for positive (A) and negative (B) coexpressionlinks (p , 10280) per AraCyc pathway genes areshown. C, Link frequency distribution for positive (1)and negative (o) coexpression networks, p value ,
10280. The y axis indicates the number of genes thatare coexpressed with the number of genes shown onthe x axis.
Transcriptional Coordination of the Metabolic Network
Plant Physiol. Vol. 142, 2006 769
Dow
nloaded from https://academ
ic.oup.com/plphys/article/142/2/762/6106444 by guest on 26 D
ecember 2021

possess large numbers of negative cross pathwaycoexpression links (compare Fig. 8, A and B).
DISCUSSION
Using linear regression p and r2 values to identifyand rank coexpression relationships, we showed that,on average, genes involved in the same metabolicpathway are coexpressed to a greater degree thangenes involved in different pathways. However, mostgenes in the AraCyc data set are coexpressed with tensto hundreds of genes, only a small number of whichare annotated as belonging to the same pathway orpathways. If understanding a pathway of interest isthe main analytical focus, then a method of narrowingthe field of candidates is required. To facilitate thistype of analysis, we developed a PLC analysis ap-proach that identifies and ranks candidate genes basedon coexpression with groups of pathway genes and
the relative strength (p and/or r2 values) of thesecoexpression relationships (Fig. 3A).
We used an earlier version of the PLC analysis toidentify novel genes involved in cellulose biosynthesisin Arabidopsis (Persson et al., 2005) and here demon-strate a larger-scale application to metabolic pathwaysin Arabidopsis. Using the method, we identified 4,022coexpression partners for 144 pathways using a rela-tively stringent threshold for coexpression. A largeproportion of these PLC-identified genes lack GOprocess, molecular function, or cellular componentannotations. Information we have provided regardingtheir coexpression patterns with pathway genes fromthe AraCyc database provides new insight into theirbiological roles by linking these genes to biochemicalpathways. Experimental investigation of the coex-pressed genes’ biological roles is beyond the scope ofthis current work; however, we have made the resultsavailable at our Web site to facilitate exploration andanalysis by groups interested in individual pathways.
Figure 6. Within- and across-pathway coexpression patterns. Coexpression relationships are viewed as a grayscale heatmapbetween a subset of pathways listed in Table I. Cells are shaded according to the negative logarithm (base 10) of coexpression pvalues between genes from corresponding rows and columns. Coexpression p values less than or equal to 102100 are shown usingthe darkest shade. When rows and columns represent the same gene but intersect off the diagonal (due to shared genes acrosspathways), the corresponding cells are colored using the lightest shade. A version labeled with gene identifiers and pathwaynames is available as Supplemental Figure S1. Pathway designations and annotations are from AraCyc 2.1.
Wei et al.
770 Plant Physiol. Vol. 142, 2006
Dow
nloaded from https://academ
ic.oup.com/plphys/article/142/2/762/6106444 by guest on 26 D
ecember 2021
On the Web site, we provide lists of all pathwaysexamined in the study, the genes from each pathwaythat we included in the analysis, machine-readablespreadsheet files listing regression results for eachpathway gene and all other probe sets (genes) on the
ATH1 array, and ranked results from PLC using dif-ferent p values as coexpression cutoffs. In addition, weestablished a mirror of the AraCyc database versionused in our study to allow browsing of pathwaystructures. For future work, we plan to add tools thatwill allow users to run the PLC method on genegroupings of their own choosing.
Using random sampling, we computed empirical pvalues assessing the degree to which genes in eachpathway are coexpressed with each other. We foundthat core metabolic pathways exhibited an unusuallyhigh level of within-pathway coexpression. We alsoidentified pathways that possess multiple positive andnegative coexpression links across pathway bound-aries. These results are based on over 400 individualarray hybridizations involving many different celltypes, developmental stages, and experimental treat-ments. Coexpression, in this setting, means that re-gardless of the experimental condition, high (or low)expression of one member of a coexpression pair (orgroup) predicts similarly high (or low) expression ofthe other group members. We do not suggest that thecoexpressed genes are expressed in every cell type,only that when they are expressed, they are expressedtogether. We suggest that the groups of coregulatedgenes are involved in maintaining and regulatingmetabolic flow within and across pathways. In addi-tion, we saw that not all genes annotated as belongingto a pathway are involved in within- or across-pathwaycoexpression relationships. These genes may serve
Figure 7. Patterns of coexpression with photosynthesis pathway genes.Genes that are coexpressed (p value , 1E-60) with each gene in thephotosynthesis light reaction pathway are shown.
Figure 8. Metabolic network connectivity. A, Network of positively coexpressed metabolic pathways using a p value cutoff of1E-200. B, Network of negatively coexpressed metabolic pathways using a cutoff of 1E-80. Connected pathways share at leastseven pairs of coexpressed genes.
Transcriptional Coordination of the Metabolic Network
Plant Physiol. Vol. 142, 2006 771
Dow
nloaded from https://academ
ic.oup.com/plphys/article/142/2/762/6106444 by guest on 26 D
ecember 2021

specialized functions that are not apparent when hun-dreds of experiments are considered. Alternatively, someof these genes may be incorrectly assigned in AraCyc,possibly reflecting the computational origins forAraCyc pathway annotations.
We found that the distribution of positive andnegative coexpression relationships is highly skewed;the majority of genes have few links but a small butsignificant number of genes are very well connected.Similarly skewed distributions have been observed ina number of different biological networks, and it hasbeen proposed that these networks arise in an incre-mental fashion via two mechanisms: duplication ofcomponents of the existing network and random mu-tation (for review, see Albert, 2005). Both models fitwell with what is known about how genomes changeover time; new sequences are created from preexistingsequences via duplicative mechanisms that affect re-gions of many different sizes, and duplicate sequencesdrift apart through random mutation. In our setting,wholesale duplication of preexisting genes, includingboth coding and transcriptional control regions, wouldincrease the complexity and size of the coexpressionnetwork in that each gene duplication event wouldadd a new node that would connect to the parent nodeand all its coexpression partners. Unless the presenceof both duplicates with identical expression confers aselective advantage, we would expect that over time,the two genes would drift apart with respect to theirrelative patterns of coexpression. There should be noselective pressure blocking this drift as long as allessential coexpression relationships with either thesource gene or its copy are maintained. Our observa-tion that less well-connected nodes are represented bymultiple copies in the Arabidopsis genome supportsthis scenario: We found that genes with one or moreparalogs (as detected by blast analysis) are signifi-cantly less well connected than single-copy genes thathave no within-genome homologs.
We found that the majority of highly connected (20or more expression links) were single-copy genes. Inyeast, single-copy genes exhibit a higher proportion oflethal or reduced-fitness phenotypes than do geneswith duplicates (Gu et al., 2003). Similarly, well-connected genes in networks based on protein inter-actions and/or coexpression are also more likely toexhibit severe phenotypes (Albert et al., 2000; Jeonget al., 2001). It is well known that many genes do notexhibit easily recognized phenotypes, possibly due tofunctional redundancy or some form of genetic buff-ering (Cutler and McCourt, 2005). Indeed, we havefound that for many pathways, only a subset of thegenes annotated as belonging to the pathway exhibitcoexpression relationships across a large number of con-ditions, suggesting that these genes may be the mostimportant players in their respective pathways. Takentogether, these results suggest that well-connectedgenes in Arabidopsis are also likely to be the mostpromising targets for genetic analysis of metabolicpathways.
An earlier study from Wille et al. (2004) used micro-array expression data to examine transcriptional coor-dination between plastid, mitochondrial, and cytosolicisoprenoid pathways in plants (Wille et al., 2004). Thestudy measured transcriptional coordination using 118ATH1 arrays and focused on 19 genes in the plastidpathway, 16 genes in the cytosolic pathway, and fivegenes in the mitochondrial pathway. However, theirapproach used joint correlation to build the network,whereas ours has used simple linear regression. De-spite this difference, we find some interesting similar-ities in the results. For example, similar to Wille et al.(2004) we found that several genes in the Arabidopsisisopentenyl diphosphate biosynthesis pathway (chlo-roplast non-mevalonate pathway) are highly coex-pressed. In addition, Wille et al. (2004) observed jointregulation of many consecutive and closely positionedgenes, which is similar to our finding that genesoccupying nearby positions in a pathway tend to becoexpressed.
We believe that the results and methods presentedhere can aid scientists in choosing candidate genes forgenetic analysis based on their position in the coex-pression network. We recommend that researchersseeking to characterize any group of functionally re-lated genes perform group- or PLC analysis to identifykey players within and outside the group wheneverthere is good reason to expect that membership in thegroup will imply coexpression. As demonstrated here,the abundance of microarray expression data forArabidopsis now available makes this analysis bothfeasible and productive. Furthermore, the results fromcoexpression analysis could help to improve annota-tion of the Arabidopsis genome. Indeed, we proposethat lists of high-confidence coexpression partnerscould be added to gene-level Web pages at sites suchas TAIR, providing a new dimension of functionalannotation for the Arabidopsis genome.
MATERIALS AND METHODS
Data Files
AraCyc data are from version 2.1 of the database as available in August,
2005. Data were obtained from TAIR (www.arabidopsis.org) as a flat file dump
that listed accessions for 221 different pathways associated with 1,612 genes.
Affymetrix ATH1 GeneChip probe set and target gene information are from
an annotations data file downloaded from the Affymetrix Web site in August,
2005 and dated June 20, 2005. GO annotations are from a file downloaded from
TAIR’s ftp site September, 2005. Copies of all primary data files are available
upon request.
Mapping Gene Identifiers onto Probe Set IDs
To map genes onto probe sets and vice versa, we cross-referenced gene
identifiers from the AraCyc database flat file against the AGI and Represen-
tative Public ID fields in the Affymetrix ATH1 probe set annotations file. This
mapping produced a list of 1,488 probe sets. We purged redundant and
promiscuous probe sets, i.e. genes mapped to multiple probe sets and probe
sets recognizing more than one gene, to create a list of 1,330 AraCyc-associated
probe sets. In a few cases, an AraCyc gene identifier was not represented on
the ATH1 array. Visualization of a randomly selected subset of these using the
Integrated Genome Browser, which shows the location of ATH1 probe sets
Wei et al.
772 Plant Physiol. Vol. 142, 2006
Dow
nloaded from https://academ
ic.oup.com/plphys/article/142/2/762/6106444 by guest on 26 D
ecember 2021

alongside Arabidopsis (Arabidopsis thaliana) genome version 5 gene annota-
tions, revealed that these genes are not interrogated on the ATH1 array, most
likely because they appeared in the public databases after the ATH1 array
entered production. The Integrated Genome Browser is available at http://
www.affymetrix.com/support/developer/tools/download_igb.affx. A list
of all pathways, probe sets, and gene identifiers is available at http://www.
transvar.org/at_coexpress/analysis/web.
Array Processing and Regression Analysis
We obtained 553 CEL files for Affymetrix ATH1 array experiments from
the Nottingham Arabidopsis Stock Center AffyWatch subscription service. A
number of the files obtained were duplicates; after removing these, we
processed the remaining CEL files using the robust multichip average algo-
rithm implementation in Bioconductor (Gentleman et al., 2004). Using the
deleted residuals quality control method implemented in the HDBStat!
software (Trivedi et al., 2005) and described in detail in Persson et al. (2005),
we identified low-quality arrays (Kolmogorov-Smirnov D . 0.15) and re-
moved these from consideration, leaving a total of 486 high-quality array
experiments. Linear regression between the 1,330 AraCyc genes and all ATH1
probe sets was then performed as described previously in Persson et al. (2005),
using the following procedure.
For each probe set (gene) associated with AraCyc, use simple linear re-
gression to compare its vector of N expression values Æx1; ::xNæ with matching
expression vectors corresponding to other genes represented on the same
array design (Daniel, 2004). For each pairwise comparison of gene X and Y,
compute a fitted regression line yi 5 b01b1xi1ei where xi and yi are expression
values for gene X and Y on array i; bo and b1 are the intercept and slope; ei
is random error or deviation of yi from the fitted value; b15ðN +Ni51 xiyi2
ð+Ni51 xiÞð+N
i51 xiÞ=N +Ni51 x2
i 2ð+Ni51 xiÞ2Þ and b05y2b1x. The arithmetic means
of xi (x) and yi (y) are +Ni51 xi=N and +N
i51 yi=N, respectively. A p value for
a simple linear regression expresses the probability that the slope b1 of the
regression line is equal to zero. In other words, if y varies randomly with x,
and vice versa, then the slope of the regression line computed between them
will be equal to zero. To compute the probability p that b1 5 0 for each
regression given the data, we use an F test for simple linear regression. For
each regression, F5ðN22Þ3 +Ni51ðyi2yÞ=+N
i51ðyi2yÞ2, where y5ð+Ni51 yi1
b1ðxi2xÞ=NÞ, N is the number of arrays (CEL files) or points used in the
regression, and y is the arithmetic mean of the fitted values for y from
the regression. The probability (p value) of b1 5 0 is the area under the F
distribution curve to the right of test statistics F. For each regression, the
coefficient of determination r2512 +Ni51ðyi2yÞ=+N
i ðyi2yÞ2, which is also
the square of Pearson’s correlation coefficient, was calculated (Rodgers
and Nicewander, 1988). To perform the linear regressions and compute the
F statistic, p values, and r2 we used software written in Java and R (http://
www.r-project.org). The Java software used a statistical programming library
from Visual Numerics Inc. Copies of the code are available upon request.
The regression results for all metabolic genes included in the study are
available as tab-delimited files from http://www.transvar.org/at_coexpress/
analysis/web.
Computing Empirical p Values forWithin-Pathway Coexpression
For each AraCyc-associated probe set, we sorted its regression results by
increasing p value and computed the average of the mutual ranks for each
pathway probe set in the sorted lists of the other pathway probe sets. We used
random sampling of probe sets to compute an empirical distribution of
average ranks: for each pathway with M probe sets, we selected a random
sample of size M from the 1,330 AraCyc probe sets in the study and computed
its average rank. We repeated the sampling procedure 10,000 times for each M
to develop an empirical distribution of average ranks for pathways including
M genes. The average rank for each pathway was then compared to the
empirical distribution of average ranks for a pathway of that size to estimate
the p value for within-pathway coexpression. The heatmaps showing within-
and across-pathway coexpression patterns were generated using matrix2png
(Pavlidis and Noble, 2003).
PLC Analysis
Pathway- or group-level coexpression identifies and ranks genes based on
their coexpression with a group of genes, such as a metabolic pathway. The
procedure operates as follows: Select a subset of functionally related bait
genes, B 5 {g1, g2, .., gM} (e.g. all the members of a metabolic pathway) from the
larger set G of all genes gi and gj represented on an expression microarray, e.g.
ATH1. For every pairwise comparison between gi and gj, where one or both are
in B, perform linear regression between gi and gj, yielding p value pij and
coefficient of determination rij2. Use the set of p and r2 values obtained from the
pairwise regressions to construct an undirected graph, where an edge eij
connects gi and gj whenever pij , pt and rij2 . rt
2 for user-defined thresholds
pt and rt2. Any two genes gi and gj that share an edge (link) in the resulting
network graph are considered to be coexpressed. Using the coexpression
network graph, identify every candidate gene ci where ci is coexpressed with
two or more bait genes. Define Bi 5 {g1, g2, .., gK} as the set of K . 1 bait genes
coexpressed with candidate gene ci and P 5 {pi1, pi2, .., piK} as the set of p values
associated with coexpressed gene pairs {(ci, g1), (ci, g2),..,(ci, gK)}. To prioritize
candidates for manual analysis, order the list of candidate genes by the
relative sizes of their bait gene sets jBij, such that if jBij. jBjj for ci and cj, then ci
is listed before cj. When jBij 5 jBjj, list ci first whenever the product of its
coexpression p values (pp) with members of Bi is smaller than for cj, where (pp)
for ci isQK
j51 pij .
Paralog Identification
We used BLASTp to search the 1,330 Aracyc pathway genes used in the
study against a database of Arabidopsis protein sequences obtained from
TAIR. We considered hits as paralogs when the query and subject shared
greater than 70% amino acid sequence identity across 90% or more of both
sequences.
Analyzing Pathway and Coexpression Networks
Networks of coexpressed genes were assembled from pairwise linear
regression results comparing AraCyc metabolic pathway genes to each other.
We analyzed a number of different networks, which varied by different linear
regression p and r2 value thresholds used to define coexpression. Depending
on the analysis, pathways were considered connected when they shared at
least pairs of coexpressed genes, where neither member of a pair was in both
pathways and Np varied from two to seven, depending on the analysis.
Coexpression networks were analyzed using the networkx Python toolkit for
computing on graphs (https://networkx.lanl.gov/) and visualized using the
Cytoscape network visualization software program (Shannon et al., 2003).
Supplemental Data
The following materials are available in the online version of this article.
Supplemental Table S1. GO terms for the flavonoid biosynthesis pathway
and genes identified using the PLC algorithm.
Supplemental Table S2. List of pathways analyzed in Figure 4B.
Supplemental Figure S1. Fully labeled heatmap showing coexpression
patterns within and across pathways.
ACKNOWLEDGMENTS
The authors thank Sue Rhee, Peifen Zhang, and the TAIR AraCyc group
for providing AraCyc database files and for thoughtful comments on the
study. We also thank Alistair Fernie for comments on the manuscript.
Received March 22, 2006; accepted August 2, 2006; published August 18, 2006.
LITERATURE CITED
Albert R (2005) Scale-free networks in cell biology. J Cell Sci 118: 4947–4957
Albert R, Jeong H, Barabasi AL (2000) Error and attack tolerance of
complex networks. Nature 406: 378–382
Carlson MR, Zhang B, Fang Z, Mischel PS, Horvath S, Nelson SF (2006)
Gene connectivity, function, and sequence conservation: predictions
from modular yeast co-expression networks. BMC Genomics 7: 40
Cutler S, McCourt P (2005) Dude, where’s my phenotype? Dealing with
redundancy in signaling networks. Plant Physiol 138: 558–559
Transcriptional Coordination of the Metabolic Network
Plant Physiol. Vol. 142, 2006 773
Dow
nloaded from https://academ
ic.oup.com/plphys/article/142/2/762/6106444 by guest on 26 D
ecember 2021

Daniel WW (2004) Biostatistics: A Foundation for Analysis in the Health
Sciences, Ed 8. Wiley, New York
DeRisi JL, Iyer VR, Brown PO (1997) Exploring the metabolic and genetic
control of gene expression on a genomic scale. Science 278: 680–686
Emanuelsson O, Nielsen H, Brunak S, von Heijne G (2000) Predicting
subcellular localization of proteins based on their N-terminal amino
acid sequence. J Mol Biol 300: 1005–1016
Gandhi TK, Zhong J, Mathivanan S, Karthick L, Chandrika KN, Mohan
SS, Sharma S, Pinkert S, Nagaraju S, Periaswamy B, et al (2006)
Analysis of the human protein interactome and comparison with yeast,
worm and fly interaction datasets. Nat Genet 38: 285–293
Gentleman RC, Carey VJ, Bates DM, Bolstad B, Dettling M, Dudoit S,
Ellis B, Gautier L, Ge Y, Gentry J, et al (2004) Bioconductor: open
software development for computational biology and bioinformatics.
Genome Biol 5: R80
Glawischnig E, Hansen BG, Olsen CE, Halkier BA (2004) Camalexin is
synthesized from indole-3-acetaldoxime, a key branching point between
primary and secondary metabolism in Arabidopsis. Proc Natl Acad Sci
USA 101: 8245–8250
Glazebrook J (2005) Contrasting mechanisms of defense against biotrophic
and necrotrophic pathogens. Annu Rev Phytopathol 43: 205–227
Gu Z, Steinmetz LM, Gu X, Scharfe C, Davis RW, Li WH (2003) Role of
duplicate genes in genetic robustness against null mutations. Nature
421: 63–66
Gutierrez RA, Shasha DE, Coruzzi GM (2005) Systems biology for the
virtual plant. Plant Physiol 138: 550–554
Harris MA, Clark J, Ireland A, Lomax J, Ashburner M, Foulger R, Eilbeck
K, Lewis S, Marshall B, Mungall C, et al (2004) The gene ontology (GO)
database and informatics resource. Nucleic Acids Res 32: D258–D261
Ihmels J, Bergmann S, Barkai N (2004a) Defining transcription modules
using large-scale gene expression data. Bioinformatics 20: 1993–2003
Ihmels J, Levy R, Barkai N (2004b) Principles of transcriptional control
in the metabolic network of Saccharomyces cerevisiae. Nat Biotechnol
22: 86–92
Jeong H, Mason SP, Barabasi AL, Oltvai ZN (2001) Lethality and centrality
in protein networks. Nature 411: 41–42
Larkin RM, Alonso JM, Ecker JR, Chory J (2003) GUN4, a regulator of
chlorophyll synthesis and intracellular signaling. Science 299: 902–906
Minorsky PV (2003) Frontiers of plant cell biology: signals and pathways,
system-based approaches 22nd Symposium in Plant Biology (University
of California-Riverside). Plant Physiol 132: 428–435
Mueller LA, Zhang P, Rhee SY (2003) AraCyc: a biochemical pathway
database for Arabidopsis. Plant Physiol 132: 453–460
Pavlidis P, Noble WS (2003) Matrix2png: a utility for visualizing matrix
data. Bioinformatics 19: 295–296
Persson S, Wei H, Milne J, Page GP, Somerville CR (2005) Identification of
genes required for cellulose synthesis by regression analysis of public
microarray data sets. Proc Natl Acad Sci USA 102: 8633–8638
Pilpel Y, Sudarsanam P, Church GM (2001) Identifying regulatory net-
works by combinatorial analysis of promoter elements. Nat Genet 29:
153–159
Redman JC, Haas BJ, Tanimoto G, Town CD (2004) Development and
evaluation of an Arabidopsis whole genome Affymetrix probe array.
Plant J 38: 545–561
Rodgers JL, Nicewander WA (1988) Thirteen ways to look at the correlation
coefficient. Am Stat 42: 59–66
Schuhegger R, Nafisi M, Mansourova M, Petersen BL, Olsen CE,
Svatos A, Halkier BA, Glawischnig E (2006) CYP71B15 (PAD3) cat-
alyzes the final step in camalexin biosynthesis. Plant Physiol 141:
1248–1254
Shannon P, Markiel A, Ozier O, Baliga NS, Wang JT, Ramage D, Amin N,
Schwikowski B, Ideker T (2003) Cytoscape: a software environment for
integrated models of biomolecular interaction networks. Genome Res
13: 2498–2504
Stuart JM, Segal E, Koller D, Kim SK (2003) A gene-coexpression network
for global discovery of conserved genetic modules. Science 302: 249–255
Sweetlove LJ, Fernie AR (2005) Regulation of metabolic networks: under-
standing metabolic complexity in the systems biology era. New Phytol
168: 9–24
Tohge T, Nishiyama Y, Hirai MY, Yano M, Nakajima J, Awazuhara M,
Inoue E, Takahashi H, Goodenowe DB, Kitayama M, et al (2005)
Functional genomics by integrated analysis of metabolome and tran-
scriptome of Arabidopsis plants over-expressing an MYB transcription
factor. Plant J 42: 218–235
Trivedi P, Edwards JW, Wang J, Gadbury GL, Srinivasasainagendra V,
Zakharkin SO, Kim K, Mehta T, Brand JP, Patki A, et al (2005)
HDBStat!: a platform-independent software suite for statistical analysis
of high dimensional biology data. BMC Bioinformatics 6: 86
Watts DJ, Strogatz SH (1998) Collective dynamics of ‘‘small-world’’ net-
works. Nature 393: 440–442
Wille A, Zimmermann P, Vranova E, Furholz A, Laule O, Bleuler S,
Hennig L, Prelic A, von Rohr P, Thiele L, et al (2004) Sparse graphical
Gaussian modeling of the isoprenoid gene network in Arabidopsis
thaliana. Genome Biol 5: R92
Winkel-Shirley B (2001) Flavonoid biosynthesis: a colorful model for
genetics, biochemistry, cell biology, and biotechnology. Plant Physiol
126: 485–493
Zhou N, Tootle TL, Glazebrook J (1999) Arabidopsis PAD3, a gene
required for camalexin biosynthesis, encodes a putative cytochrome
P450 monooxygenase. Plant Cell 11: 2419–2428
Wei et al.
774 Plant Physiol. Vol. 142, 2006
Dow
nloaded from https://academ
ic.oup.com/plphys/article/142/2/762/6106444 by guest on 26 D
ecember 2021


![Research articleComposite functional module inference ... · such as the transcriptional regulation networks, protein-protein interaction networks and metabolic networks [1-10]. However,](https://img.pdfslide.net/doc/110x75/5fbdbe97a290540c7879fb2c/research-articlecomposite-functional-module-inference-such-as-the-transcriptional.jpg)