Embed Size (px)
Citation preview

TRANSCRIPTIONAL REGULATION OF
GENE NETWORKS
THOMAS R. BURKARD
DOCTORAL THESIS
Graz, University of Technology
Institute for Genomics and Bioinformatics
Petersgasse 14, 8010 Graz
and
Vienna, Research Institute of Molecular Pathology
Eisenhaber Group
Dr. Bohrgasse 7, 1030 Vienna
Vienna, May 2007
Page I
Abstract
Background: cDNA microarray studies result in a huge amount of expression data. The
main focus lies often on revealing new components which end in long lists without
understanding the global networks described by them. This doctoral thesis asks to which
extent theoretical analyses can reveal gene networks, molecular mechanisms and new
hypotheses in microarray expression data. For this purpose, gene expression profiles were
generated using microarrays and a cell model for fat cell development.
Results: A novel adipogenic atlas was constructed using microarray expression data of fat
cell development. In total, 659 gene products were subjected to de novo annotation and
extensive literature curation. The resulting gene networks delineate phenotypic observations,
such as clonal expansion, up-rounding of the cells and fat accumulation. Based on this global
analysis, seven targets were selected for experimental follow up studies. Further, 26
transcription factors are suggested by promoter analysis to regulate co-expressed genes. 27
of 36 investigated pathways are preferentially controlled at rate-limiting enzymes on the
transcriptional level. Additionally, the first set of 391 universal proteins that are known to be
rate-determining was selected. This dataset was hand-curated from >15,000 PubMed
abstracts and contains 126 rate-limiting proteins from curated databases with increased
reliability. Two thirds of the rate-determining enzymes are oxidoreductases or transferases.
The rate-limiting enzymes are dispersed throughout the metabolic network with the
exception of citrate cycle. The knockout of the rate-limiting adipose triglyceride lipase
responds in transcriptional down-regulation of the whole oxidative phosphorylation and
specific control of many rate-limiting enzymes in brown fat tissue. Finally, it was shown that
selective transcriptional regulation of rate-limiting enzymes is a widely applied mechanism
for the control of metabolic networks.
Conclusion: This thesis demonstrates that large-scale transcription profiling in combination
with sophisticated bioinformatics analyses can provide not only a list of novel players in a
particular setting, but also a global view on biological processes and molecular networks.
Page II
Publications
This thesis is based on the following publications as well as upon unpublished observations.
Papers:
Hackl* H, Burkard* TR, Sturn A, Rubio R, Schleiffer A, Tian S, Quackenbush J, Eisenhaber
F and Trajanoski Z (*contributed equally): Molecular processes during fat cell
development revealed by gene expression profiling and functional annotation. Genome
Biol. 2005; 6(13):R108
Burkard T, Trajanoski Z, Novatchkova M, Hackl H, Eisenhaber F: Identification of New
Targets Using Expression Profiles. In: Antiangiogenic Cancer Therapy, Editors:
Abbruzzese JL, Davis DW, Herbst RS; CRC Press (in press)
Hartler J, Thallinger GG, Stocker G, Sturn A, Burkard TR, Körner E, Scheucher A, Rader R,
Schmidt A, Mechtler K, Trajanoski Z: MASPECTRAS: a platform for management and
analysis of proteomic LC-MS/MS data. BMC Bioinformatics. (submitted)
Conference proceedings and poster presentations:
Hartler, J.; Thallinger, G.; Stocker, G.; Sturn, A.; Burkard, T.; Körner, E.; Mechtler, K.;
Trajanoski, Z.: Management and Analysis of Proteomics LC-MS/MS Data. Fourth
International Symposium of the Austrian Proteomics Platform. (2007), Seefeld in Tirol,
Austria
Hackl, H.; Burkard, T.; Sturn, A.; Rubio, R.; Schleiffer, A.; Tian, S.; Quackenbush, J.;
Eisenhaber, F.; Trajanoski, Z.: Molecular processes during fat cell development revealed
Page III
by large scale expression analysis and functional annotation. 1st Symposium on Lipid and
Membrane Biology. (2006), page. 12 – 12
Hartler, J.; Thallinger, G.; Stocker, G.; Sturn, A.; Burkard, T.; Körner, E.; Fuchs, T.;
Mechtler, K.; Trajanoski, Z.: MASPECTRAS:Web-based System for Storage, Retrieval,
Quantification and Analysis of Proteomic LC MS/MS Data. Third International
Symposium of the Austrian Proteomics Platform. (2006), Seefeld in Tirol
Hartler, J.; Thallinger, G.; Sturn, A.; Burkard, T.; Körner, E.; Fuchs, T.; Mechtler, K.;
Trajanoski, Z.: MASPECTRAS: Web-basiertes Datenbanksystem zur Verwaltung von
Proteomik-Daten. Österreichische Akademie der Wissenschaften (2005)
Hackl, H.; Burkard, T.; Paar, C.; Fiedler, R.; Sturn, A.; Stocker, G.; Rubio, R.; Schleiffer, A.;
Quackenbush, J.; Eisenhaber, F.; Trajanoski, Z.: Large Scale Expression Profiling and
Functional Annotation of Adipocyte Differentiation. Keystone Symposia: Molecular
Control of Adipogenesis and Obesity. (2004), S. 193 - 193
Hackl, H.; Burkard, T.; Paar, C.; Fiedler, R.; Sturn, A.; Stocker, G.; Rubio, R.;
Quackenbush, J.; Schleiffer, A.; Eisenhaber, F.; Trajanoski, Z.: Large Scale Expression
Profiling and Functional Annotation of Adipocyte Differentiation. -First Internatrional
Symposium of the Austrian Proteomics Platform. (2004), Seefeld, Austra
Hartler, J.; Thallinger, G.; Stocker, G.; Sturn, A.; Burkard, T.; Körner, E.; Fuchs, T.;
Mechtler, K.; Trajanoski, Z.: MASPECTRAS:Web-based System for Storage, Retrieval,
and Analysis of Proteomic LC MS/MS Data. HUPO 4th Annual World Congress. (2004)
Munich
Hackl, H.; Burkard, T.; Rubio, R.; Quackenbush, J.; Trajanoski, Z.: Gene expression
analysis during adipocyte differentiation. High-Level Scientific Conferences: Molecular
Mechanisms in Metabolic Diseases. (2003), S. 9 – 9

Page IV
Index of contents
Abstract ..................................................................................................................................... I
Publications..............................................................................................................................II
Index of contents .................................................................................................................... IV
1. Introduction...................................................................................................................... 1
1.1. Fat cell differentiation............................................................................................. 1
3T3-L1 cell line – A model system to investigate adipogenesis...................................... 2
The complex process of adipogenesis is incompletely understood.............................. 2
Adipogenesis is primarily regulated at the transcriptional level .................................. 2
Expression profiling of 3T3-L1 differentiation to adipocytes...................................... 4
Identification of the molecular role of the gene products ................................................ 5
Gene networks are the basis for testing new hypothesis in fat cell development ............ 8
1.2. Transcriptional control of metabolic fluxes............................................................ 9
2. Results............................................................................................................................ 12
2.1. Fat cell development............................................................................................. 12
Annotation of expressed sequence tags is the basis for the comprehensive analysis of
expression profiles ......................................................................................................... 13
The valid expression data is relevant for in vivo applications ....................................... 16
Biological functions can be assigned to dominant co-expression patterns .................... 18
A global molecular atlas describes complex changes during adipogenesis ................... 20
Clonal expansion is reflected in adipogenic gene networks....................................... 21
Target identification powered by the global adipogenic atlas........................................ 24
Enzymatic networks are regulated in an ordered manner .............................................. 28
2.2. Transcriptional regulation of rate-limiting steps .................................................. 29
Page V
An accurate set of 126 rate-determining enzymes from curated databases ................... 30
Comprehensive collection of known rate-limiting enzymes using PubMed.................. 31
Molecular functions associated with rate-limitation ...................................................... 31
Key loci are dispersed in the metabolic network ........................................................... 34
Disturbance of the enzymatic network by knocking out a single rate-limiting enzyme 35
Transcriptional regulation of rate-limiting enzymes during differentiation................... 37
3. Discussion ...................................................................................................................... 39
3.1. Fat cell development............................................................................................. 41
3.2. Rate-limitation ...................................................................................................... 43
4. Methods.......................................................................................................................... 48
4.1. Fat cell development............................................................................................. 48
EST mapping to genes and proteins............................................................................... 48
De novo annotation of the mapped proteins................................................................... 48
Construction of an EST annotation database ................................................................. 49
4.2. Transcriptional regulation of rate-limiting enzymes ............................................ 50
Compiling an accurate and comprehensive list of rate-limiting proteins....................... 50
Functional analysis of rate-limiting proteins.................................................................. 50
Position of rate-limiting proteins in the enzymatic network .......................................... 51
ATGL knockout network analysis ................................................................................. 51
Transcriptional regulation of rate-limiting proteins during differentiation.................... 51
5. Bibliography................................................................................................................... 52
6. Glossary ......................................................................................................................... 65
7. Acknowledgment ........................................................................................................... 69
8. Appendix A – Rate-limiting genes in mouse ................................................................. 70
9. Appendix B - Publications ............................................................................................. 81

Page 1
1. Introduction
cDNA microarray studies result in a large amount of expression data. Long lists of genes,
which are regulated in a specific process, are often published without any in-depth analysis
of the regulated features. In contrast, this work asks, to which extent gene networks
describing molecular processes can be revealed with expression profiling. Therefore, this
doctoral thesis investigates microarray data of fat cell differentiation with a broad spectrum
of analytic tools with the aim to delineate all aspects of the complex adipogenic
transcriptional scenario. In follow-up studies, the thesis explores the question if general
transcriptional control mechanisms of metabolic pathways exist. In the next chapters, the
biological system of fat cell differentiation and the methods used to address the objectives of
this thesis are introduced.
1.1. Fat cell differentiation
Obesity, the excess deposition of adipose tissue, is an epidemic health risk. Over one billion
adults worldwide suffer from overweight, with more than 300 million clinical cases [1].
Therefore, this field attracts considerable attention in the scientific community.
Pharmaceutical companies and noncommercial institutes are spending great efforts in
elucidating novel molecular mechanism of fat cell development and medical treatment. The
cause for obesity prevalence in industrial and developing countries are diverse and range
from psychosocial imbalance over wrong nutrition behavior to genetic malfunctions. Two
main mechanisms for weight gain have been identified on the physiological level: On the
one hand, deregulation of the metabolism leads to raised incorporation of fat in mature
adipose tissue. On the other hand, development of new fat cells, known as adipogenesis,
increases the number of storage depots. Fat cell development as one fundament of obesity is
addressed in this study by analyzing microarray expression data of 3T3-L1 differentiation
(see also appendix B-1, [2]), which is an over 30 years investigated in vitro model system of
fat cell development.
Page 2
3T3-L1 cell line – A model system to investigate adipogenesis
In the early 60ies, the mammalian 3T3 cell line, isolated from disaggregated mouse
embryos, has become a useful tool for investigating growth control and oncogenic viruses
[3]. In resting cultures of these cells the incorporation of lipid droplets was frequently
observed. In the year 1974, the 3T3-L1 sub-cell line was cloned based on the tendency to
differentiate to adipose cells and to accumulate fat [4]. Since then the 3T3-L1 preadipocyte
cells were extensively studied and evolved to a well established adipogenic model system.
The complex process of adipogenesis is incompletely understood
To identify new components involved in fat cell development, several studies have used
early Affymetrix technologies [5-11] or filter-based expression technologies [12] in the past.
Those outdated platforms may have missed many genes important for the development of a
fat cell. The problem of a potentially incomplete coverage of the developmental
transcriptome by early chip technology has been demonstrated in a expressed sequence tag
(EST) project. For the embryonic system, the EST project revealed a significant fraction of
embryonic factors not represented in the collections of genes previously available [13]. The
advantage of the modern chip design resulted in an expanded number of differentially
expressed genes in the present study. Furthermore, in contrast to previous studies [6-11,14],
the focus was mainly directed towards understanding the global mechanism of adipogenesis
and less towards the discovery of individual genes for further functional analysis.
Adipogenesis is primarily regulated at the transcriptional level
Fat cell differentiation is induced in 3T3-L1 cells after exposure to an appropriate adipogenic
cocktail containing dexamethasone, isobutylmethylxanthine, insulin, biotin and fetal bovine
serum. Thereupon, 3T3-L1 confluent preadipocytes differentiate into mature adipocytes [15].
Chronic treatment with hyperphysiological concentrations of insulin accelerates the speed
and efficiency of the adipose conversion in 3T3-L1 cell lines [16,17]. Two mechanisms are
suggested for the need of this high insulin concentration: first, the involvement of cell
Page 3
surface receptors for type I insulin-like growth factor have lower affinity for insulin and
second, insulin shows a high degradation in the culture medium [18]. Newly synthesized
fatty acids are the major part of accumulated triglycerides [16]. Therefore, the accumulation
of lipids is inhibited if the medium contains no biotin, even in the presence of exogenous
lipids and elevated cellular LPL activity [19]. The phosphodiesterase inhibitor
isobutylmetyhlxanthin stimulates the conversion to adipocytes, which suggests a role for
cyclic nucleotides in the control of differentiation [20]. The glucocorticoid dexamethasone
also induces the adipocyte differentiation efficiently.
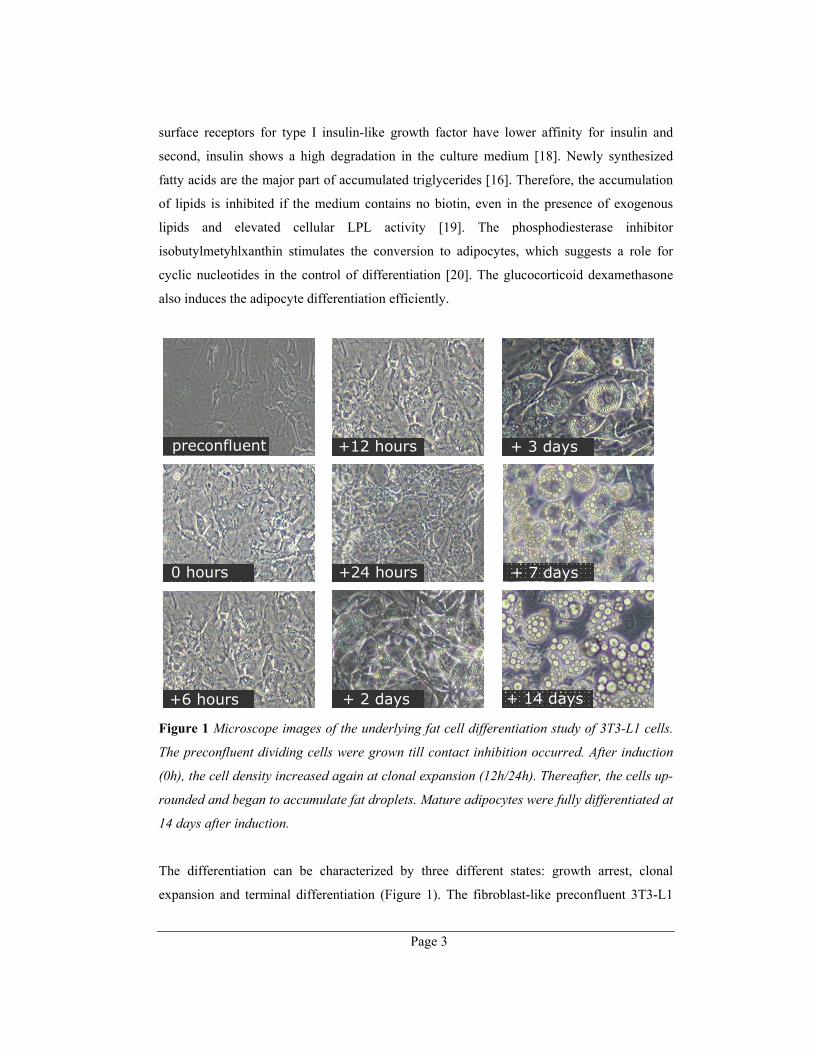
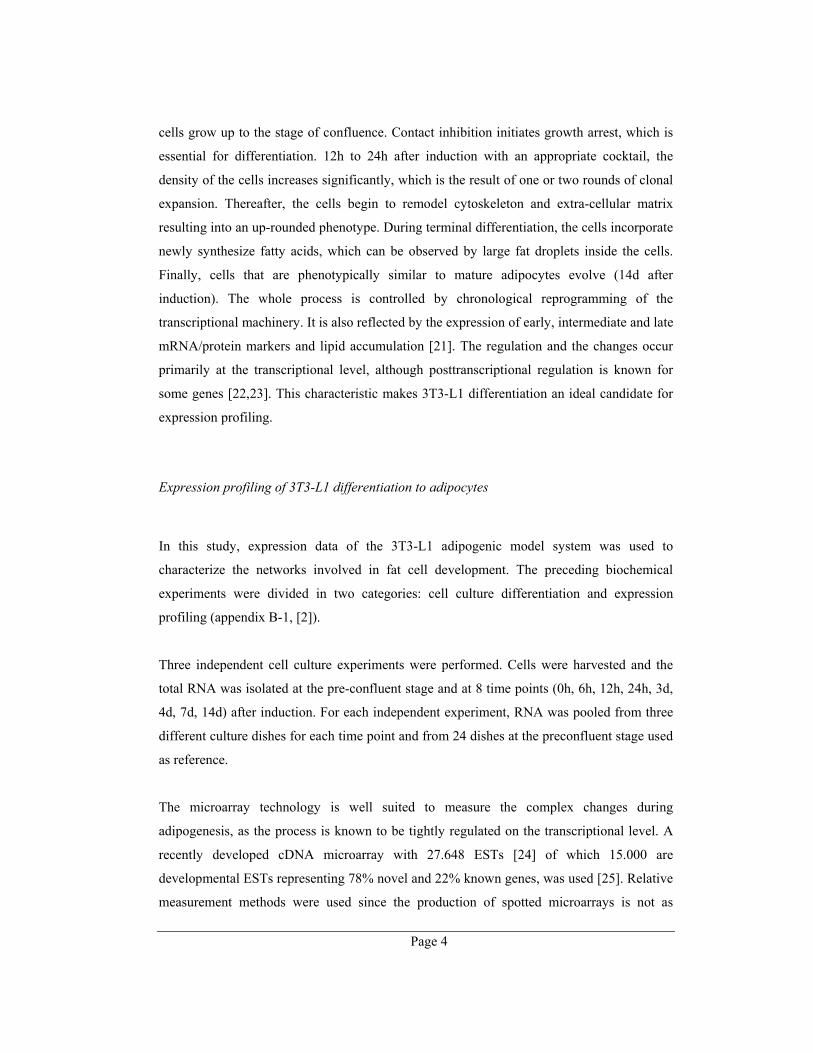
Figure 1 Microscope images of the underlying fat cell differentiation study of 3T3-L1 cells.
The preconfluent dividing cells were grown till contact inhibition occurred. After induction
(0h), the cell density increased again at clonal expansion (12h/24h). Thereafter, the cells up-
rounded and began to accumulate fat droplets. Mature adipocytes were fully differentiated at
14 days after induction.
The differentiation can be characterized by three different states: growth arrest, clonal
expansion and terminal differentiation (Figure 1). The fibroblast-like preconfluent 3T3-L1
+12 hours
+24 hours
+ 2 days + 14 days
+ 7 days
+ 3 days
+6 hours
0 hours
preconfluent
Page 4
cells grow up to the stage of confluence. Contact inhibition initiates growth arrest, which is
essential for differentiation. 12h to 24h after induction with an appropriate cocktail, the
density of the cells increases significantly, which is the result of one or two rounds of clonal
expansion. Thereafter, the cells begin to remodel cytoskeleton and extra-cellular matrix
resulting into an up-rounded phenotype. During terminal differentiation, the cells incorporate
newly synthesize fatty acids, which can be observed by large fat droplets inside the cells.
Finally, cells that are phenotypically similar to mature adipocytes evolve (14d after
induction). The whole process is controlled by chronological reprogramming of the
transcriptional machinery. It is also reflected by the expression of early, intermediate and late
mRNA/protein markers and lipid accumulation [21]. The regulation and the changes occur
primarily at the transcriptional level, although posttranscriptional regulation is known for
some genes [22,23]. This characteristic makes 3T3-L1 differentiation an ideal candidate for
expression profiling.
Expression profiling of 3T3-L1 differentiation to adipocytes
In this study, expression data of the 3T3-L1 adipogenic model system was used to
characterize the networks involved in fat cell development. The preceding biochemical
experiments were divided in two categories: cell culture differentiation and expression
profiling (appendix B-1, [2]).
Three independent cell culture experiments were performed. Cells were harvested and the
total RNA was isolated at the pre-confluent stage and at 8 time points (0h, 6h, 12h, 24h, 3d,
4d, 7d, 14d) after induction. For each independent experiment, RNA was pooled from three
different culture dishes for each time point and from 24 dishes at the preconfluent stage used
as reference.
The microarray technology is well suited to measure the complex changes during
adipogenesis, as the process is known to be tightly regulated on the transcriptional level. A
recently developed cDNA microarray with 27.648 ESTs [24] of which 15.000 are
developmental ESTs representing 78% novel and 22% known genes, was used [25]. Relative
measurement methods were used since the production of spotted microarrays is not as

Page 5
accurate as in situ synthesized chips. Therefore, hybridization of Cy3/Cy5 labeled sample
and reference was needed. During direct Cy3/Cy5 labeling, the two fluorescents incorporate
with a different rate. To resolve this issue, amino-allyl modified nucleotides were
incorporated in the first reverse transcription step followed by a coupling of the dyes to the
reactive amino groups of the cDNA [26]. The remaining persistent dye-bias was addressed
by the dye-swapping technique. For a comprehensive review of expression profiling consult
appendix B-2.
Identification of the molecular role of the gene products1
Essentially, the basic element of expression data has a composite structure: On the one hand,
it comprises a vector of n real numbers describing the expression status for n
conditions/experiments/time points. On the other hand, a sequence tag is associated with the
vector of expression values. Without the knowledge of the identity of the gene represented
by the expressed sequence tag and the biological function of the respective gene,
interpretation of the expression data in terms of biological mechanisms and processes is
impossible. It should be noted that protein function requires a hierarchical description with
molecular function, cellular function and phenotypic function [27].
The first step in EST chip analysis is to allocate all spotted ESTs to their corresponding
genes if available. With the knowledge of complete genomes, sequence comparisons can
identify genes from sufficiently long sequence tags. For instance, rounds of Megablast
searches [28] against various nucleotide databases of decreasing trust-levels (in the order of
RefSeq [29,30], FANTOM [31], UniGene [32], nr GenBank, and TIGR Mouse Gene Index
[33] or other organism-specific databases) can be applied initially. For nucleic sequences
that could not be assigned, the routine should be repeated with blastn [34] and finally against
the genome of the whole organism. Long stretches (>100) of non-specific nucleotides have
to be excluded. For the genes obtained, the respective gene product can be retrieved: This is
either a protein sequence if the expressed RNA is translated to a protein or a functional RNA
species (microRNA, etc.).
1 Adapted from appendix B-2 for a better understanding of the main body
Page 6
The molecular and cellular role of novel protein targets derived from an expression study is
of special interest. A first insight of the processes involved can be obtained from Gene
Ontology (GO) terms [35]. With GenPept/RefSeq accession numbers, GO numbers for
molecular function, biological process, and cellular component can be derived from the gene
ontology database (Gene Ontology Consortium). If considered in context with the expression
cluster identity, it is possible to observe groups of co-regulated proteins, which are part of a
unique process or share a molecular function. Such groups of genes can be visualized with
Genesis [36].
Detailed de novo function prediction for the target proteins can reveal new aspects of their
molecular and cellular function. This analysis step is especially important for sequences that
entered the databases after large-scale sequencing efforts and that have remained
experimentally uncharacterized. Furthermore, it is not possible to determine how the
functional annotation of any given protein has been acquired in public databases. Thus, the
possibility of chains of misannotation arises, a process termed 'error percolation' [37]. To
address those aspects, a large variety of different sequence analysis tools are commonly
applied. Full-length close homology is one established method of inferring functions for
novel proteins [34].
In-depth protein sequence analysis follows a three-step procedure. This approach is based on
the assumption that proteins consist of linear sequence modules that have their own
structural and functional characteristics. The function of the whole protein is a superposition
of the segments’ functions. The sequence modules can represent globular domains or non-
globular segments such as fibrillar segments with secondary structure, transmembrane
helical segments or polar, flexible regions without inherent structural preferences.
The first step involves the detection of the non-globular part of the protein sequence, which
houses many membrane-embedded segments, localization and posttranslational
modifications sequence signals. Typically, non-globular segments are characterized by some
type of amino acid compositional bias. Therefore, the principle procedure is to begin with
analyses of compositional biases. They are found as low complexity regions with SEG [38]
and compositional biased stretches with SAPS [39], XNU, Cast [40] and GlobPlot 1.2 [41].
N-terminal localization signals can be studied with SignalP [42] and Sigcleave [43], the C-
Page 7
terminal PTS1 signal for peroxisomal targeting via the PEX5 mechanism is checked for with
the predictor of Neuberger et al. [44-46]. A number of quite accurate predictors test the
capacity of the query protein for lipid posttranslational modifications such as GPI lipid
anchors [47-49], myristoyl [50] or prenyl (farnesyl or geranylgeranyl) [51] anchors.
Membrane-embedded regions are recognized via the occurrence of strongly hydrophobic
stretches. Standard predictors such as HMMTOP [52], TOPPRED, DAS-TMfilter [53] and
SAPS [39] find transmembrane helical regions. Generally, several transmembrane
recognition methods should map to the same position to obtain reliable predictions.
Secondary structure prediction methods (COILS [54], SSCP [55,56], Predator [57]) can
generate information about structure elements in non-globular parts of proteins.
The second step involves comparisons of the query sequence with libraries of known
domains. Since domain definitions of even the same domain type do slightly differ among
authors, it is necessary to compare the query sequence with all available definitions. Known
sequence domains of the repositories Pfam and SMART [58] are characterized by hidden
Markov models (HMM), which can be searched with a sequence using HMMER both in a
global and local search mode. Further domain prediction method and databases are RPS-
BLAST (CDD) [59], IMPALA [60] and PROSITE [61].
The third, the last step involves analysis of query protein segments (at least 50 amino acid
residues long) that are not covered by hits produced by any of the prediction tools for non-
globular regions and known domains. Most likely, these sequence segments represent not yet
characterized globular domains. It is necessary to collect protein sequence segments that are
significantly similar to the respective part of the query. This can be done with tools from the
BLAST/PSI-BLAST suite [62-64], HMMsearch or SAM [65,66]. There are several
strategies to collect as complete as possible sequence families; for example, each identified
homologous protein can be resubmitted to an additional PSI-BLAST in an attempt to find
more homologues. Through multiple alignments of the conserved residue stretches, sequence
analysis of the found proteins and extensive literature search, a new functional domain can
be characterized.
Finally, the different sequence-analytic findings for the various query segments need to be
synthesized for a description of the function of the whole protein. Overlaps of predicted

Page 8
features have to be resolved by assessing significances of hits, the amino acid compositional
status of the respective segment and expected false-positive prediction rates of algorithms.
With the entirety of sequence-analytic methods, some functional conclusion, at least in very
general terms, is possible for most sequences. All these academic prediction tools for de
novo sequence prediction are integrated in the user-friendly ANNOTATOR/NAVIGATOR
environment, a novel protein sequence analysis system, which is in development at the IMP
Bioinformatics group.
Gene networks are the basis for testing new hypothesis in fat cell development
In this thesis, genes of the 780 strongest transcriptionally regulated expressed sequence tags
(ESTs) during adipogenesis and the corresponding protein products passed through in-depth
computational analysis. As a result, a comprehensive molecular atlas of fat cell development
was created. With its aid, it is possible to dive into the wealth of detailed gene networks of
the underlying processes and use the in-depth view to test new hypothesis. Comparison to in
vivo expression of adipose tissue revealed the importance of the study also for medical
applications.
Several hypotheses were investigated using the global adipogenic atlas. Phenotypic changes
were shown to be traceable in the expression networks. The hot topic, if co-expression
corresponds to co-regulation, was investigated by prediction of all transcription factor
binding sites. Finally, exhaustive analysis of enzymatic networks during adipogenesis
uncovered two major control principles of metabolic circuits on the transcriptional level:
1. Whole pathways can be switched on or off by expressing each member similarly
2. Alternatively, rate-limiting enzymes, which control the flux through a pathway, can
be regulated specifically
Page 9
In this doctoral thesis, it is shown that careful de novo annotation and in-depth computational
analysis of expression data can result in the construction of a detailed gene map reflecting
the underlying molecular processes. This global atlas can be successfully used to test up-
coming hypothesis and to find new candidate genes for further research. In case of
adipogenesis, phenotypic changes such as clonal expansion, extra-cellular matrix remodeling
and cytoskeleton reorganization can be elucidated on the basis of the gene network. With this
comprehensive approach, we show that key loci of transcriptional regulation are often
enzymes that control the rate-limiting steps of metabolic pathways.
1.2. Transcriptional control of metabolic fluxes
A tight regulation of the metabolic fluxes through cells is necessary to maintain their healthy
and viable state. Deregulation can lead to severe health problems of an organism. An
obvious example is the disturbance of the energy balance between intake and expenditure,
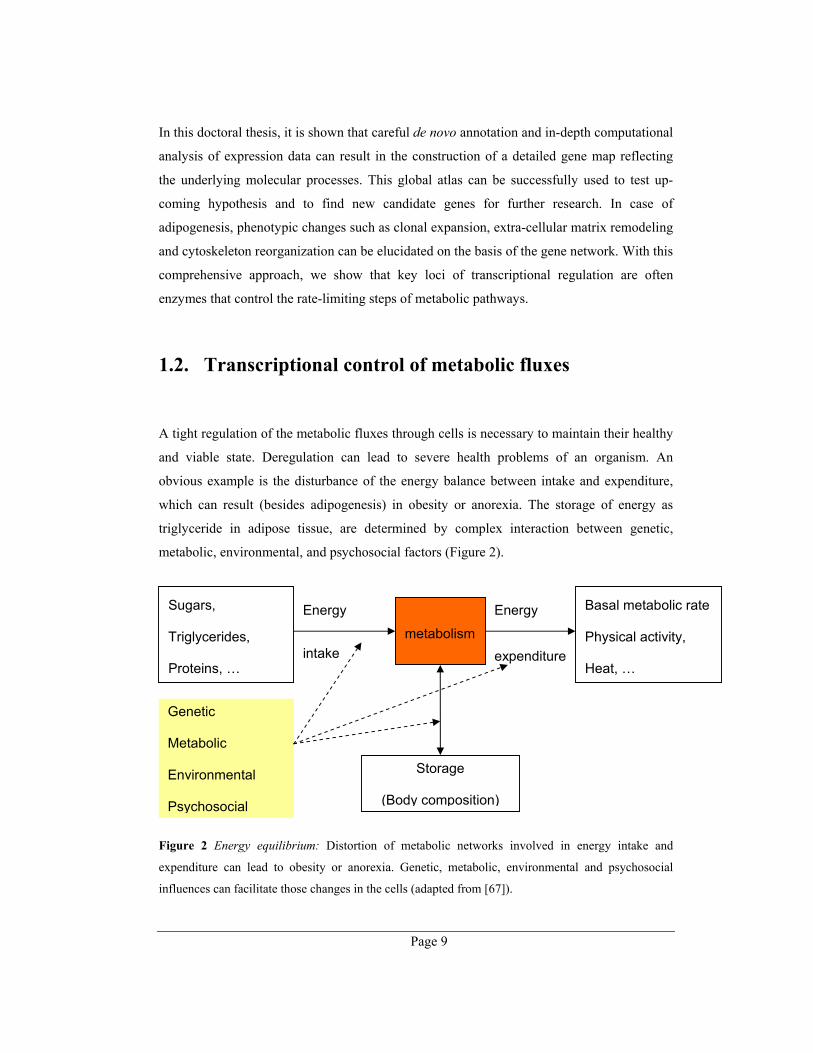
which can result (besides adipogenesis) in obesity or anorexia. The storage of energy as
triglyceride in adipose tissue, are determined by complex interaction between genetic,
metabolic, environmental, and psychosocial factors (Figure 2).
Figure 2 Energy equilibrium: Distortion of metabolic networks involved in energy intake and
expenditure can lead to obesity or anorexia. Genetic, metabolic, environmental and psychosocial
influences can facilitate those changes in the cells (adapted from [67]).
Energy
intake
Energy
expenditure
metabolism
Storage
(Body composition)
Sugars,
Triglycerides,
Proteins, …
Basal metabolic rate
Physical activity,
Heat, …
Genetic
Metabolic
Environmental
Psychosocial
Page 10
On the genetic tier, two mechanisms of transcriptional control became evident by in-depth
analysis of the global gene networks during fat cell development [2]. On the one hand, all
enzymes of a whole pathway shared similar mRNA regulation. An outstanding example was
the synchronous expression of the cholesterol pathway. On the other hand specific key
points, mainly the rate-limiting enzymes, of a pathway, were regulated, which might dictate
metabolic fluxes to its remaining pathway members. 27 out of 36 pathways were identified
to be regulated transcriptionally at the rate-determining enzyme during adipogenesis. The
later finding raised the question, if this might be a general principle.
Previously, it was argued that the control of metabolic pathways only at one rate—
determining step is unlikely. Since the total amount of the proteins within a cell occupies 15-
35% of the cell volume, which is the maximum compatible with cell function, it might be
evolutionary preferable to minimize protein levels by controlling pathways as a whole [68]
and not only at one key locus. Nevertheless, strong transcriptional regulation of rate-limiting
enzymes was shown in the special case of fat cell development. The control of the key steps
within the pathway might be more energy efficient than synthesizing many enzymes of a
pathway and the response to stimuli during differentiation might be faster. Resulting from
this special case, a more general importance of transcriptional key step regulation was
addressed.
With the objective to proof the concept of transcriptional control of rate-determining
enzymes in developmental processes, all available definitions of the term rate-limiting were
revisited. Blackman was the first to describe the phenomenon of rate-limitation in biology.
He wrote in the year 1905 - "When a process is conditioned as to its rapidity by a number of
separate factors, the rate of the process is limited by the pace of the slowest factor“. The
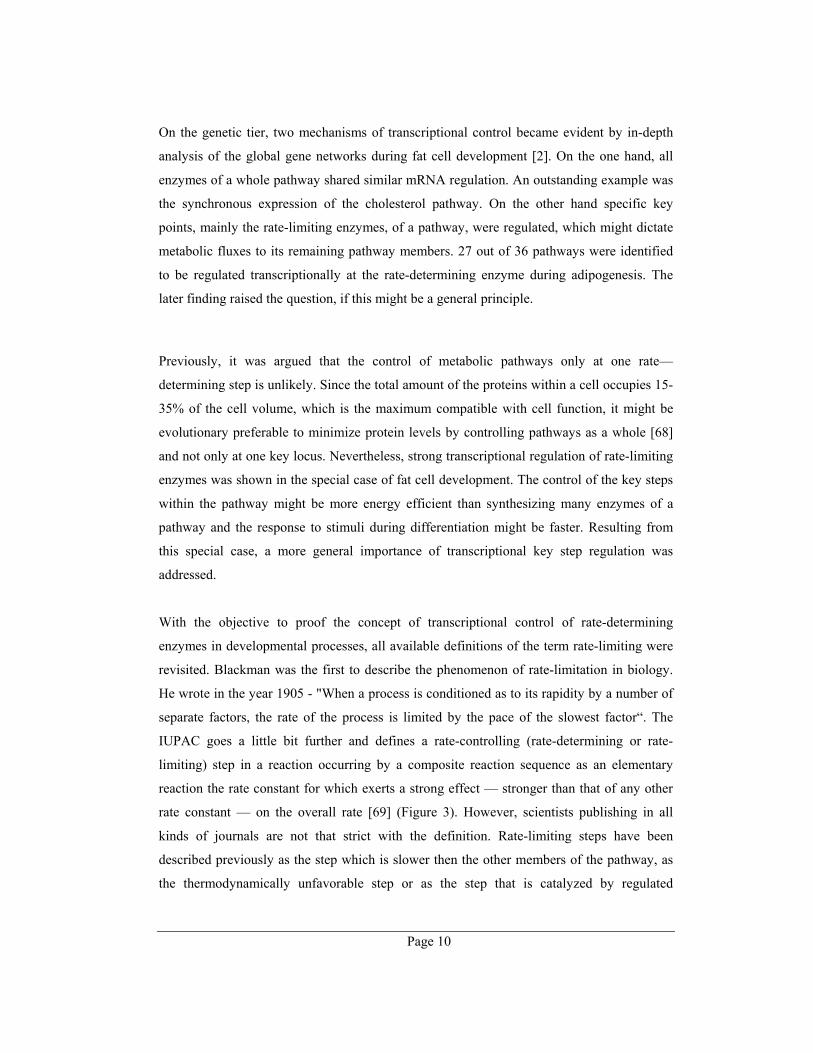
IUPAC goes a little bit further and defines a rate-controlling (rate-determining or rate-
limiting) step in a reaction occurring by a composite reaction sequence as an elementary
reaction the rate constant for which exerts a strong effect — stronger than that of any other
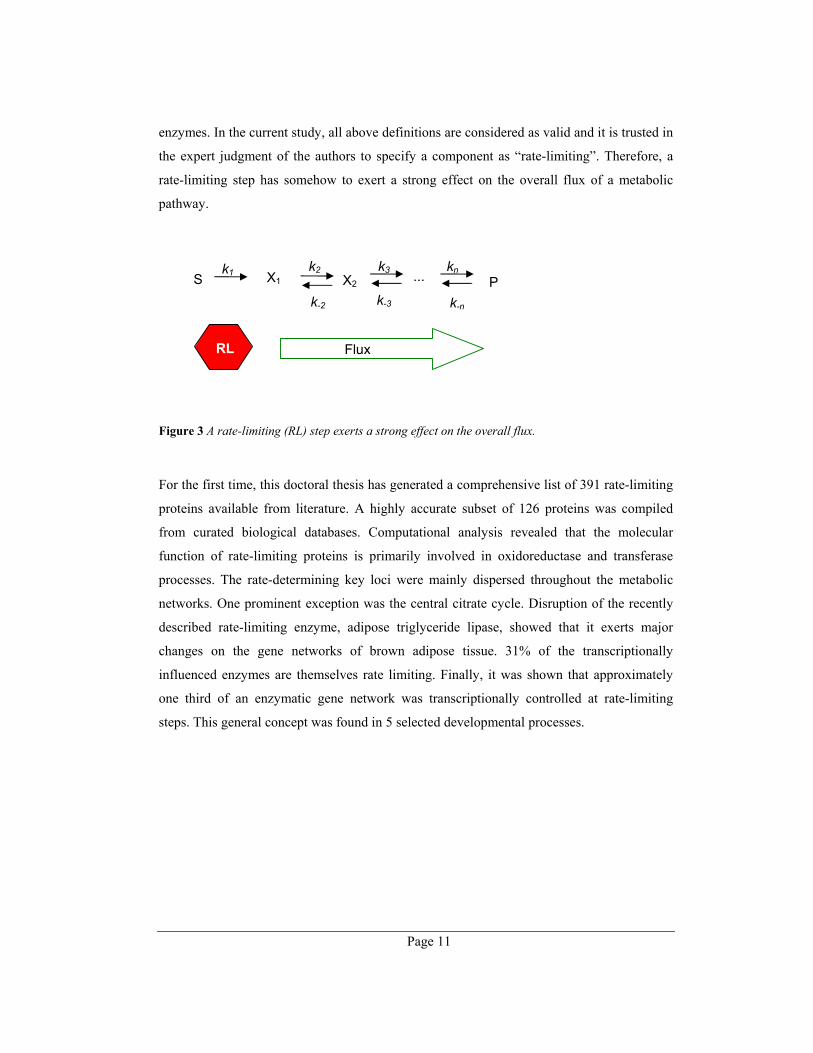
rate constant — on the overall rate [69] (Figure 3). However, scientists publishing in all
kinds of journals are not that strict with the definition. Rate-limiting steps have been
described previously as the step which is slower then the other members of the pathway, as
the thermodynamically unfavorable step or as the step that is catalyzed by regulated
Page 11
enzymes. In the current study, all above definitions are considered as valid and it is trusted in
the expert judgment of the authors to specify a component as “rate-limiting”. Therefore, a
rate-limiting step has somehow to exert a strong effect on the overall flux of a metabolic
pathway.
Figure 3 A rate-limiting (RL) step exerts a strong effect on the overall flux.
For the first time, this doctoral thesis has generated a comprehensive list of 391 rate-limiting
proteins available from literature. A highly accurate subset of 126 proteins was compiled
from curated biological databases. Computational analysis revealed that the molecular
function of rate-limiting proteins is primarily involved in oxidoreductase and transferase
processes. The rate-determining key loci were mainly dispersed throughout the metabolic
networks. One prominent exception was the central citrate cycle. Disruption of the recently
described rate-limiting enzyme, adipose triglyceride lipase, showed that it exerts major
changes on the gene networks of brown adipose tissue. 31% of the transcriptionally
influenced enzymes are themselves rate limiting. Finally, it was shown that approximately
one third of an enzymatic gene network was transcriptionally controlled at rate-limiting
steps. This general concept was found in 5 selected developmental processes.
k1 k2 k3 kn
k-2 k-3 k-n
...S X1 X2 P
RL Flux
Page 12
2. Results
2.1. Fat cell development
The following chapter gives a review of the results, which are achieved in the main part of
the doctoral thesis. It is attempted to reflect parts of the data from a slightly different point of
view than in the available publication (see Appendix B-1, [2]). Contrary to the publication
[2], this chapter presents in part new, yet not well documented aspects of the data. The
approach tries by no means to reproduce the data again comprehensively. For an exhaustive
view consult the publication in the appendix B-1 [2] and the additional material at the web-
site http://genome.tugraz.at/fatcell.
The basis for understanding large scale data is the precise description of the proteins
involved in the process of interest. Therefore, the chapter starts with mapping and de novo
annotation results for the whole microarray of this study. The expression data is shown to be
measured correctly and compared to tissue specific and other differentiation expression data.
While the publication emphasizes the significant new impact of this data compared to other
chip studies, this chapter focuses on the in vivo relevance of the underlying study for medical
research. Further, large scale expression data is of extreme complex nature, which makes it
necessary to focus on specific pattern identified by clustering procedures. These time profiles
are assigned to corresponding biological functions. The simplified biological patterns are the
perfect basis to extend the complexity again by investigating each gene product of the cluster
extensively. This results in a comprehensive global molecular atlas describing the processes
of adipogenesis. The detailed knowledge of the complex network allows the finding of
substantial coherences like the preferential transcriptional regulation of rate-limiting genes.
The global view highlights especially interesting research targets for in-depth analysis and
medical treatment. Finally, two mechanism of regulating the enzymatic network on the
transcriptional level are identified.
Page 13
Annotation of expressed sequence tags is the basis for the comprehensive
analysis of expression profiles
The basic requirement of large scale in-depth analysis is the comprehensive knowledge of
the players involved in a study. Therefore, a mousechip database was constructed. This
database is a small lightweight information retrieval platform for the in-house expressed
sequence tag (EST) mouse chip of the Institute for Genomics and Bioinformatics (IGB,
University of Technology, Graz). The resource provides EST mapping information and
access to de novo sequence annotation and third party information of 22,850 proteins, which
are associated with the ESTs. The relational database is implemented in PostgreSQL
(www.postgresql.org). The database management system (DBMS) is implemented in Perl.
The web-based retrieval front-end can be accessed through
http://mendel.imp.ac.at/IGBmousechip/index.xhtml.
27,645 spots of the IGB mousechip were represented by 23,311 expressed sequence tags,
which contain no long stretches of low complexity regions. In total 22,850 (91%) protein
sequences were assigned to the corresponding ESTs of the mouse microarray. The reliability
of the used homology search methods Megablast (with parameters: w=70; p=95),
discontinuous Megablast (with parameters: w=11; p=95) and blastx/blastn (with parameter:
E-value<1e-9) and the accuracy of the nucleotide databases RefSeq, FANTOM, Ensembl,
EnsemblTranscript, UniGene, Trest, Entrez and the protein database IPI varied strongly.
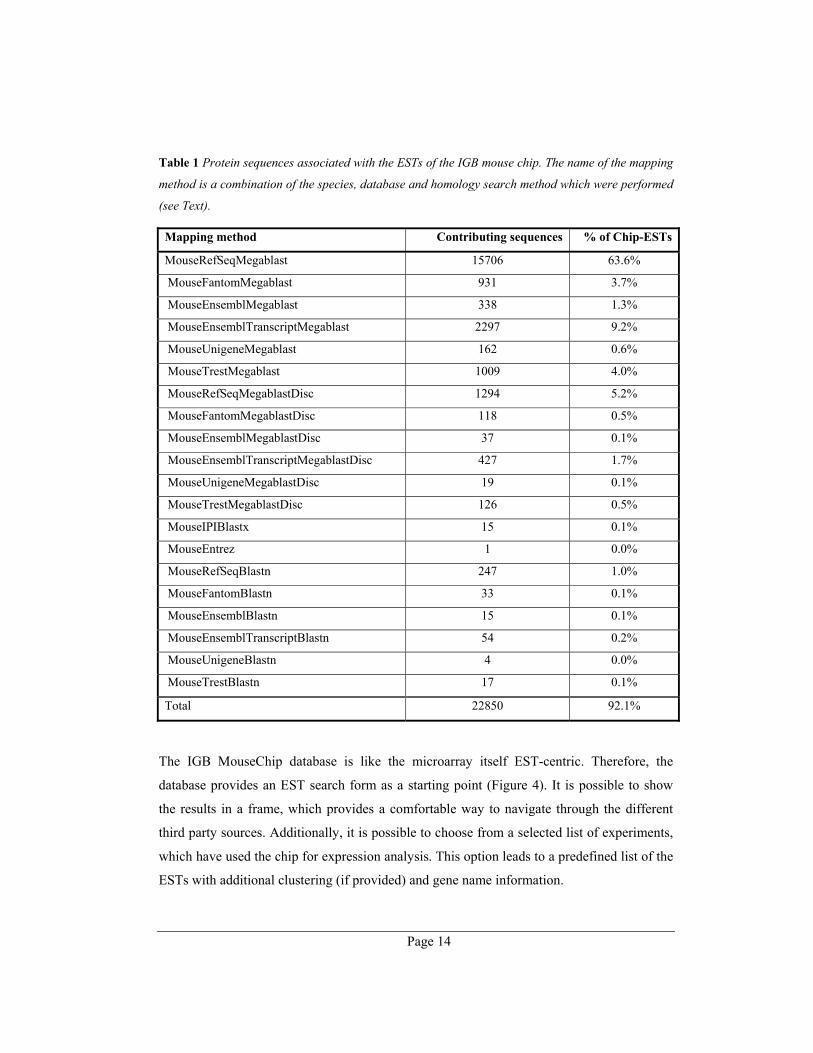
Table 1 lists the number of contributing sequences in decreasing reliability of the method -
database combination. More than two third of the mapped proteins (15,705) were, therefore,
of the most trusted level.
Page 14
Table 1 Protein sequences associated with the ESTs of the IGB mouse chip. The name of the mapping
method is a combination of the species, database and homology search method which were performed
(see Text).
Mapping method Contributing sequences % of Chip-ESTs
MouseRefSeqMegablast 15706 63.6%
MouseFantomMegablast 931 3.7%
MouseEnsemblMegablast 338 1.3%
MouseEnsemblTranscriptMegablast 2297 9.2%
MouseUnigeneMegablast 162 0.6%
MouseTrestMegablast 1009 4.0%
MouseRefSeqMegablastDisc 1294 5.2%
MouseFantomMegablastDisc 118 0.5%
MouseEnsemblMegablastDisc 37 0.1%
MouseEnsemblTranscriptMegablastDisc 427 1.7%
MouseUnigeneMegablastDisc 19 0.1%
MouseTrestMegablastDisc 126 0.5%
MouseIPIBlastx 15 0.1%
MouseEntrez 1 0.0%
MouseRefSeqBlastn 247 1.0%
MouseFantomBlastn 33 0.1%
MouseEnsemblBlastn 15 0.1%
MouseEnsemblTranscriptBlastn 54 0.2%
MouseUnigeneBlastn 4 0.0%
MouseTrestBlastn 17 0.1%
Total 22850 92.1%
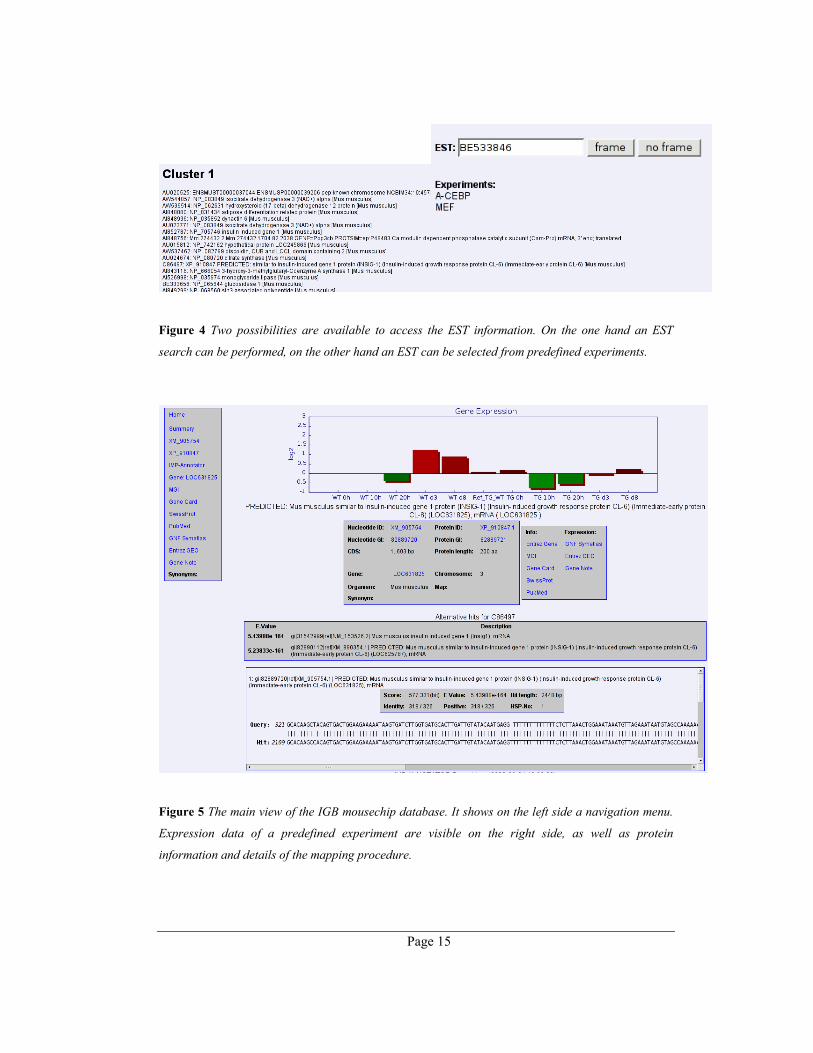
The IGB MouseChip database is like the microarray itself EST-centric. Therefore, the
database provides an EST search form as a starting point (Figure 4). It is possible to show
the results in a frame, which provides a comfortable way to navigate through the different
third party sources. Additionally, it is possible to choose from a selected list of experiments,
which have used the chip for expression analysis. This option leads to a predefined list of the
ESTs with additional clustering (if provided) and gene name information.
Page 15
Figure 4 Two possibilities are available to access the EST information. On the one hand an EST
search can be performed, on the other hand an EST can be selected from predefined experiments.
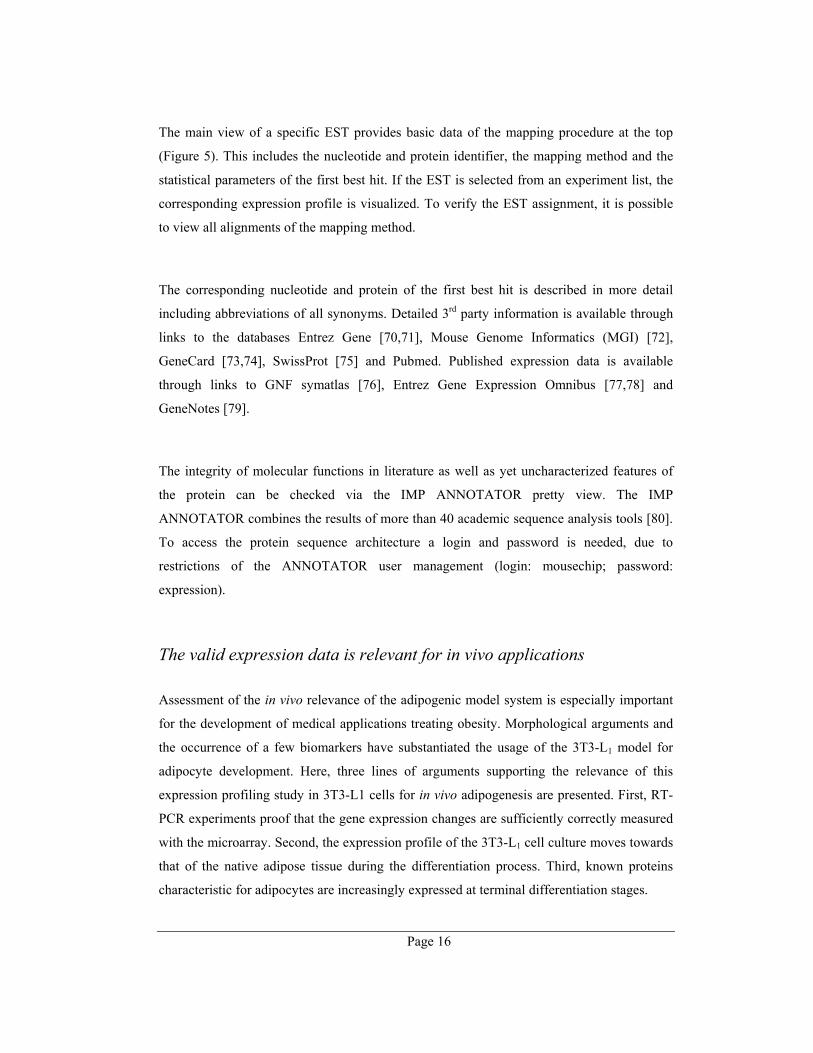
Figure 5 The main view of the IGB mousechip database. It shows on the left side a navigation menu.
Expression data of a predefined experiment are visible on the right side, as well as protein
information and details of the mapping procedure.
Page 16
The main view of a specific EST provides basic data of the mapping procedure at the top
(Figure 5). This includes the nucleotide and protein identifier, the mapping method and the
statistical parameters of the first best hit. If the EST is selected from an experiment list, the
corresponding expression profile is visualized. To verify the EST assignment, it is possible
to view all alignments of the mapping method.
The corresponding nucleotide and protein of the first best hit is described in more detail
including abbreviations of all synonyms. Detailed 3rd party information is available through
links to the databases Entrez Gene [70,71], Mouse Genome Informatics (MGI) [72],
GeneCard [73,74], SwissProt [75] and Pubmed. Published expression data is available
through links to GNF symatlas [76], Entrez Gene Expression Omnibus [77,78] and
GeneNotes [79].
The integrity of molecular functions in literature as well as yet uncharacterized features of
the protein can be checked via the IMP ANNOTATOR pretty view. The IMP
ANNOTATOR combines the results of more than 40 academic sequence analysis tools [80].
To access the protein sequence architecture a login and password is needed, due to
restrictions of the ANNOTATOR user management (login: mousechip; password:
expression).
The valid expression data is relevant for in vivo applications
Assessment of the in vivo relevance of the adipogenic model system is especially important
for the development of medical applications treating obesity. Morphological arguments and
the occurrence of a few biomarkers have substantiated the usage of the 3T3-L1 model for
adipocyte development. Here, three lines of arguments supporting the relevance of this
expression profiling study in 3T3-L1 cells for in vivo adipogenesis are presented. First, RT-
PCR experiments proof that the gene expression changes are sufficiently correctly measured
with the microarray. Second, the expression profile of the 3T3-L1 cell culture moves towards
that of the native adipose tissue during the differentiation process. Third, known proteins
characteristic for adipocytes are increasingly expressed at terminal differentiation stages.

Page 17
The validity of the microarray data was tested with quantitative RT-PCR as an alternative
method. Results showed a high correlation the RT-PCR assays and the microarray (r=0.93
for 7 genes at different time points). Statistical analyses of the independent chip experiments
showed that the reproducibility of the generated data is very high. The Pearson correlation
coefficient between the replicates was between 0.73 and 0.97 at different time points. The
mean coefficient of variation across all genes at each time point was between 0.11 and 0.27.
The comparison between the adipogenesis experiment and the gene atlas V2 mouse data for
adipose tissue [81] showed that the consistence of the two datasets increases with the
differentiation state (http://genome.tugraz.at/fatcell/tissues/tissues.html). Among the 382
transcriptionally modulated genes common in both datasets, 67% were regulated in the same
direction at time point zero (confluent pre-adipocyte cell culture). The similarity declined
during the clonal expansion (55%), which was marked by regulation of cell division genes.
At the final stage of differentiation, the correlation increased up to 72%. If the Gene Atlas
expression data was restricted to strongly regulated genes (at least 2- and 4-fold change
respectively), the consistency in mature adipocytes rises up to 82% (135 genes) and 93% (42
genes). Out of all 60 tissues in the Gene Atlas V2 mouse, the adipose tissue described the
differentiated state of the 3T3-L1 cells best. Brown fat tissue was the second best hit to the
differentiated adipocytes (69% of the 382 genes), followed by adrenal gland (66%), kidney
(65%) and heart (64%) and the worst correlation had embryo day 8.5 (32%). Interestingly,
the similarity with the expression profile at the time points of clonal expansion did not
depend much on tissue type (between 45% and 55% of all 382 genes).
For a group of 153 genes, comparison to a previous adipocyte model expression profiling
experiment from Soukas et al. [82] was possible. The same up- or down-regulation was
found for 72% to 89% (depending on time point) of all genes. Highest identity was found for
the stage terminally differentiated 3T3-L1 cells, where the profile was less dependent on the
exact extraction time. If the comparison was restricted to expression values, which were
highly regulated in both experiments (at least two-fold change), the coincidence in every
time point was higher than 90%. Comparison to further studies [6,9,83] showed that 326
genes were not shown previously to be regulated. This suggests that the current picture of fat
cell development is far from complete.
Page 18
A number of known genes for adipocyte function in vivo with a possible role in the
pathogenesis of obesity and insulin resistance were highly expressed during the present
study. Adipose triglyceride lipase, a patatin domain-containing triglyceride lipase that
catalyzes the initial step in triglyceride hydrolysis [84], was increasingly up-regulated
towards the terminal differentiation phase (up to ~20 fold). Another example was Visfatin,
which is identical to the pre-B cell colony-enhancing factor (PBEF), a 52 kD cytokine, and
has enzymatic and signaling function in adipocytes [85-87]. Mest (mesoderm-specific
transcript)/ Peg1 (paternally expressed gene 1) was up-regulated in late differentiation and
apparently constitutes a positive regulator of adipocyte size [88]. Kruppel-like factor 5 was
expressed in early stages of adipocyte differentiation (it is induced by C/EBPß and δ and, in
turn activates the PPARγ2 promoter) and down-regulated at the terminal adipocyte
differentiation after 48h [89]. Several further markers are discussed below.
It is concluded that the expression profiles are measured significantly accurate with chip
analysis. RT-PCR and comparison between replicates validate the expression data, which is
substantiated by comparison to previous expression studies of fat cell differentiation. Even
though, this study shares with those experiment many similar regulated genes, several
hundreds of yet unidentified ESTs are revealed with the current study. Furthermore, the
endpoint correspondence to adipose tissue and the resemblance of the expression profiles
with many known in vivo biomarkers fosters the accuracy of the data. The latter two
observations support the notion that the 3T3-L1 model system is also relevant for in vivo.
Biological functions can be assigned to dominant co-expression patterns
A generally accepted procedure is to reduce the intrinsic complexity of large scale
expression studies by finding few common co-expression patterns. The present study of fat
cell development yielded 1,327,104 data points (48 chips x 27.648 spots). After
normalization and averaging over the replicates 14,368 ESTs with signals at all time points
were detected. 780 genes with a complete profile over all time points showed dramatic
transcriptional regulation (more than 2 fold up- or down-regulated in at least 4 time points).
The expression profiles were parsimoniously clustered into 12 temporally distinct patterns,
each containing between 23 and 143 genes (for figures see appendix B-1, [2]). Genes in 4
Page 19
clusters were mostly up-regulated, and genes in 8 clusters were mostly down-regulated
during adipogenesis.
The large number of transcriptionally modulated genes and the intricate cluster structure of
even only the most extremely regulated genes suggested that the regulation of adipogenesis
might be more complex than previously assumed [82]. To understand the major molecular
process associated with each cluster, the genes were categorized by scanning the genes and
assigning gene ontology (GO) terms for molecular function, cellular component, and
biological process.
Reentry into the cell cycle of growth arrested preadipocytes is known as the clonal expansion
phase and considered to be a requisite for terminal differentiation in 3T3-L1 adipocytes [90].
Genes in cluster 5 and 8 showed a steady down-regulation through the whole differentiation
process and sharp up-regulation at 12h/24h. Typically, these genes in cluster 5 were
annotated as cell cycle involved and proteins encoded by them reside in the nucleus.
Genes grouped in cluster 2 were highly expressed from 6h (onset of clonal expansion) to 3d
(beginning appearance of adipocyte morphology) but only modestly expressed at the
terminal adipocyte differentiation stage. They often carry GO terms indicating signaling
molecules. Key transcription factors SREBP1c and PPARγ were highly expressed at the late
time points when lipid droplets and rounding of cells, the typical adipocyte phenotype,
appear (3d, 7d, 14d; cluster 6 and 9). As a tendency, the expression of known marker genes
of the differentiated adipocyte was increased in parallel with these factors. These included
genes from clusters 3, 6 and 9, which are targets of either of these factors such as lipoprotein
lipase (LPL), c-Cbl-associated proteins (CAP), stearoyl-CoA desaturase 1 (SCD1), carnitine
palmitoyltransferase II (CPT II), Acyl-CoA oxidase. Other genes in cluster 6 were known
players in lipid metabolism and mitochondrial fatty acid metabolism. Genes in clusters 4 and
7 were also increasingly expressed towards the terminal differentiation stage, although from
different starting values. Cluster 4 could be associated with cholesterol biosynthesis and
cluster 7 was related to the extra-cellular space or matrix as indicated by GO terms.
Contrary, cytoskeleton proteins were mainly down-regulated in cluster 10. Cluster 1, 11 and
12 had no obvious common molecular function.

Page 20
The overwhelming amount of expression data was reduced to a dozen manageable
expression patterns, which correspond to specific biological functions. This is the point,
where many expression studies stop their analysis and publish long lists of genes.
Unfortunately, the real value of a detailed global view was missed in those studies.
The following result sections focus around two objectives: First, arguments are presented
that the observed expression profile is accurate and relevant for the development of
adipocytes in vivo. Second, it is attempted to understand the full complex nature of the
molecular processes underlying adipogenesis by the analysis of function of proteins involved
as revealed by this expression profiling study. For this purpose, each protein was subjected
to in-depth sequence analytic procedures and the structure and function was annotated on a
sequence segment/domain-wise basis as indicated previously. If possible, the targets were
mapped onto known pathways, possible cellular roles and sub-cellular location.
A global molecular atlas describes complex changes during adipogenesis
The valid and in vivo relevant expression data was simplified to 12 time patterns, which were
assigned to major biological functions. These understandable features were the basis for a
new gain of complexity by reconsidering all cluster members including their known
molecular context. Of the 780 ESTs differentially expressed during adipogenesis, it was
possible to derive 659 protein sequences that were all subjected to in-depth sequence analytic
procedures. The protein sequences were annotated de novo using more than 40 academic
prediction tools integrated in the ANNOTATOR sequence analysis system [80]. The
structure and function was annotated on a sequence segment/domain-wise basis (see
database above). After extensive literature search and curation using the sequence
architecture, 345 gene products were mapped onto known pathways, possible cellular roles
and sub-cellular localizations. This molecular atlas of fat cell development provides the first
global view of the underlying biomolecular networks and represents a unique resource for
deriving testable hypotheses for future studies on individual genes. Gene networks of cell
cycle, metabolism, signal transduction, extra-cellular matrix changes and cytoskeleton
remodeling are available in several figures. A detailed assembly drawing and comprehensive
discussion is delineated in the appendix B-1 [2].
Page 21
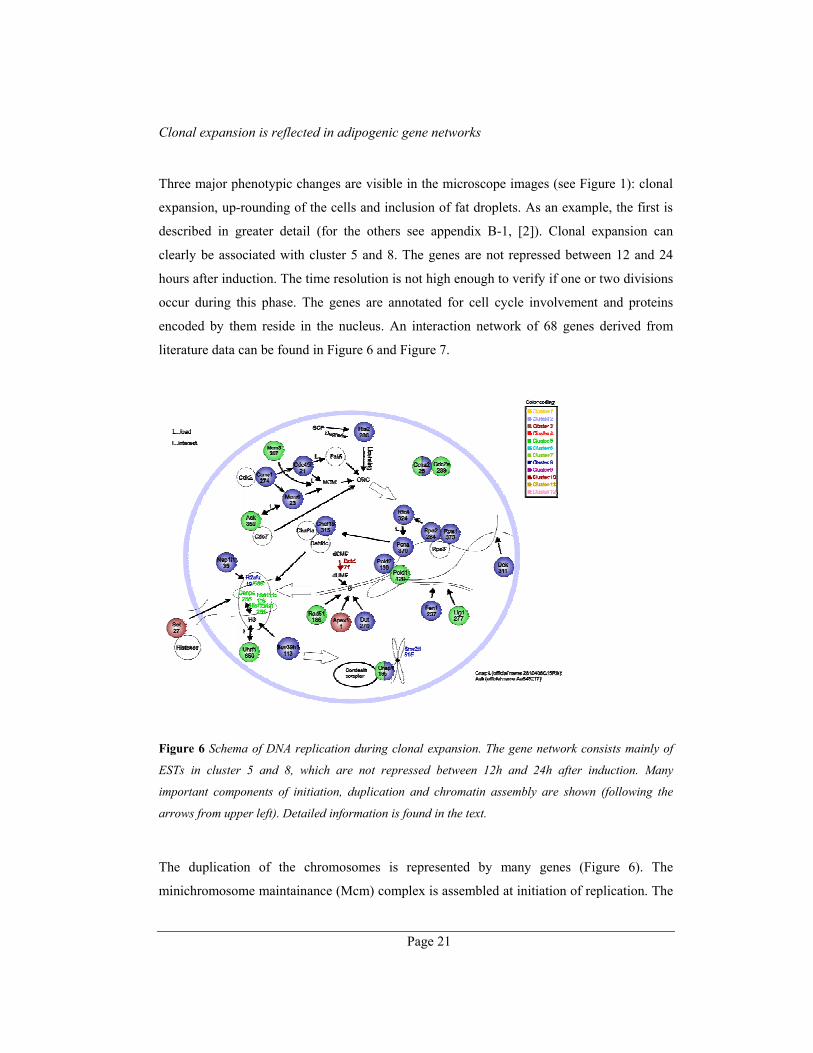
Clonal expansion is reflected in adipogenic gene networks
Three major phenotypic changes are visible in the microscope images (see Figure 1): clonal
expansion, up-rounding of the cells and inclusion of fat droplets. As an example, the first is
described in greater detail (for the others see appendix B-1, [2]). Clonal expansion can
clearly be associated with cluster 5 and 8. The genes are not repressed between 12 and 24
hours after induction. The time resolution is not high enough to verify if one or two divisions
occur during this phase. The genes are annotated for cell cycle involvement and proteins
encoded by them reside in the nucleus. An interaction network of 68 genes derived from
literature data can be found in Figure 6 and Figure 7.
Figure 6 Schema of DNA replication during clonal expansion. The gene network consists mainly of
ESTs in cluster 5 and 8, which are not repressed between 12h and 24h after induction. Many
important components of initiation, duplication and chromatin assembly are shown (following the
arrows from upper left). Detailed information is found in the text.
The duplication of the chromosomes is represented by many genes (Figure 6). The
minichromosome maintainance (Mcm) complex is assembled at initiation of replication. The
Page 22
heterogenic complex of Mcm4/6/7 acts as helicase while Mcm2/3/5 most likely regulates its
activity [91]. Retroviral integration site 2 (Ris2 now Cdt1) is involved in binding of the
MCM to the origin recognition complex and licenses one single replication of the
chromosome [92]. The replication protein A (RPA) complex (Rpa1, Rpa2) stabilizes ssDNA
at the replication fork and facilitates nascent strand synthesis by the replicative DNA
polymerase [93]. The proliferating cell nuclear antigen (Pcna), is loaded by replication factor
C (Rfc4) in the presence of RPA. Pcna promotes a switch to processive synthesis by DNA
polymerase [94]. The lagging strand is synthesized from the Okazaki fragments by the flap
structure specific endonuclease 1 (Fen1) and ligated by ligase I, DNA, ATP-dependent
(Lig1) [95,96]. The mammalian recombinase Rad51 plays important roles in homologous
recombination and DNA repair [97]. Deoxyuridine triphosphatase (Dut) and
apurinic/apyrimidinic endonuclease 1 (Apex1) are further components, which participate in
higher fidelity of replication and repair. Finally, components of DNA packaging are not
repressed between 12h and 24h after induction. Several members of the histone family
(Hist1h1c, Hist1h4m, H2afz) are part of the nucleosomes. Histone 3 is substituted by
centromere autoantigen A (Cenpa). This crucial event is needed to recruit several factors of
the kinetochore [98]. Finally, ubiquitine-like, containing PHD and RING finger domains, 1
(Uhrf1, also known as Np95) and suppressor of variegation 3-9 homolog 1 (Suv39h1)
introduce essential post-translational modifications into the histones.
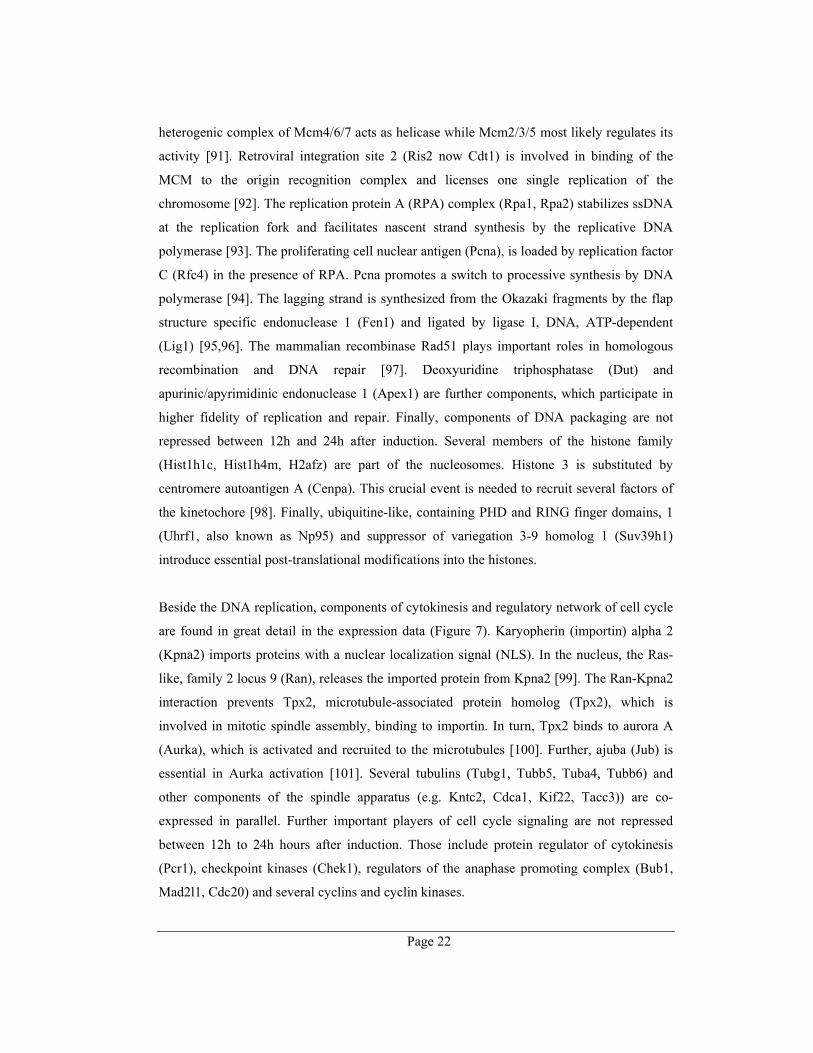
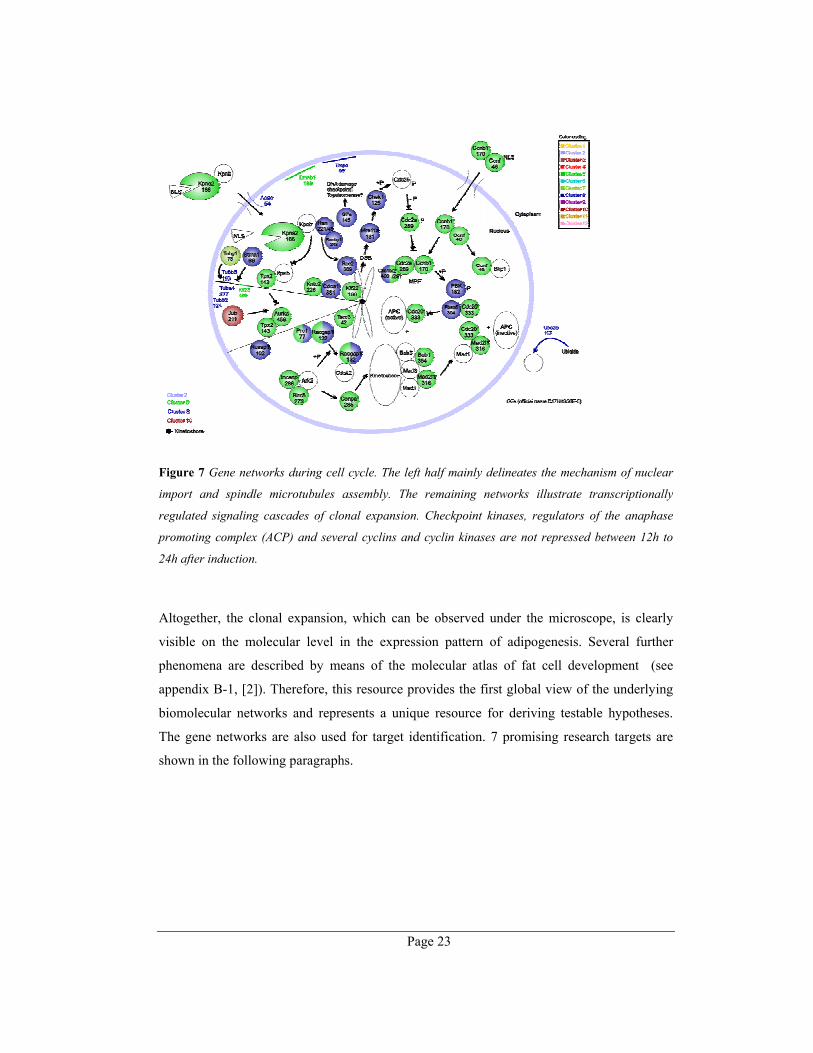
Beside the DNA replication, components of cytokinesis and regulatory network of cell cycle
are found in great detail in the expression data (Figure 7). Karyopherin (importin) alpha 2
(Kpna2) imports proteins with a nuclear localization signal (NLS). In the nucleus, the Ras-
like, family 2 locus 9 (Ran), releases the imported protein from Kpna2 [99]. The Ran-Kpna2
interaction prevents Tpx2, microtubule-associated protein homolog (Tpx2), which is
involved in mitotic spindle assembly, binding to importin. In turn, Tpx2 binds to aurora A
(Aurka), which is activated and recruited to the microtubules [100]. Further, ajuba (Jub) is
essential in Aurka activation [101]. Several tubulins (Tubg1, Tubb5, Tuba4, Tubb6) and
other components of the spindle apparatus (e.g. Kntc2, Cdca1, Kif22, Tacc3)) are co-
expressed in parallel. Further important players of cell cycle signaling are not repressed
between 12h to 24h hours after induction. Those include protein regulator of cytokinesis
(Pcr1), checkpoint kinases (Chek1), regulators of the anaphase promoting complex (Bub1,
Mad2l1, Cdc20) and several cyclins and cyclin kinases.
Page 23
Figure 7 Gene networks during cell cycle. The left half mainly delineates the mechanism of nuclear
import and spindle microtubules assembly. The remaining networks illustrate transcriptionally
regulated signaling cascades of clonal expansion. Checkpoint kinases, regulators of the anaphase
promoting complex (ACP) and several cyclins and cyclin kinases are not repressed between 12h to
24h after induction.
Altogether, the clonal expansion, which can be observed under the microscope, is clearly
visible on the molecular level in the expression pattern of adipogenesis. Several further
phenomena are described by means of the molecular atlas of fat cell development (see
appendix B-1, [2]). Therefore, this resource provides the first global view of the underlying
biomolecular networks and represents a unique resource for deriving testable hypotheses.
The gene networks are also used for target identification. 7 promising research targets are
shown in the following paragraphs.
Page 24
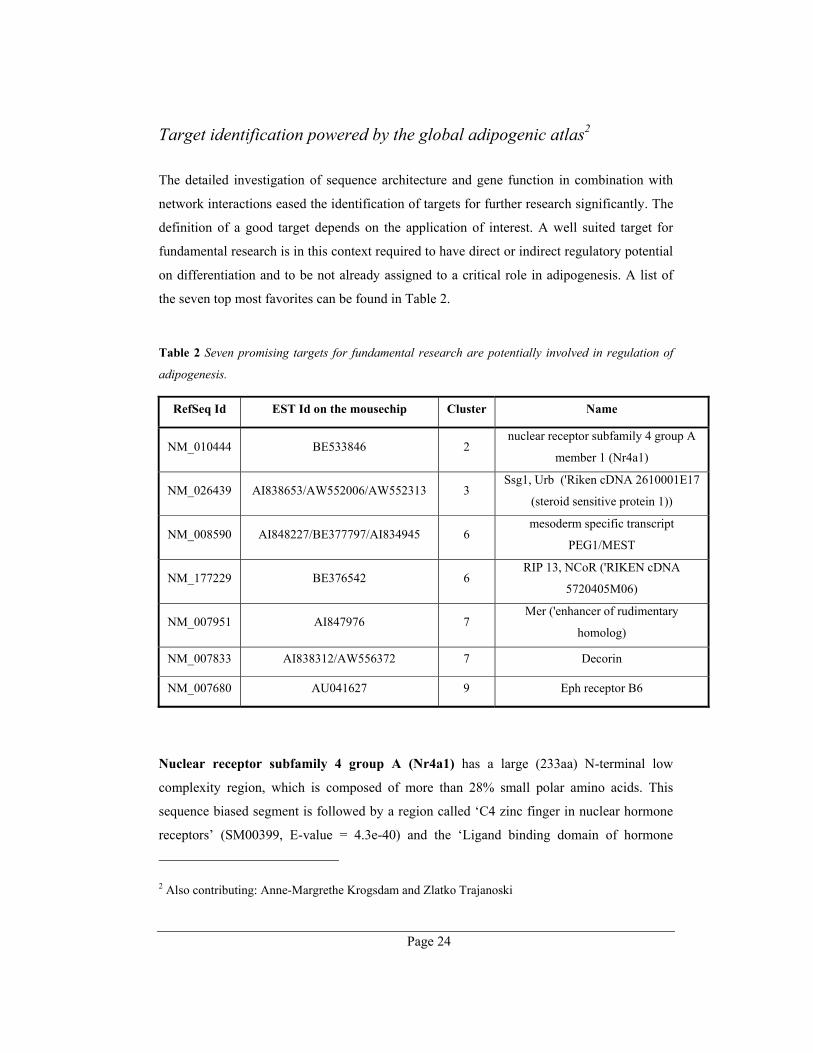
Target identification powered by the global adipogenic atlas2
The detailed investigation of sequence architecture and gene function in combination with
network interactions eased the identification of targets for further research significantly. The
definition of a good target depends on the application of interest. A well suited target for
fundamental research is in this context required to have direct or indirect regulatory potential
on differentiation and to be not already assigned to a critical role in adipogenesis. A list of
the seven top most favorites can be found in Table 2.
Table 2 Seven promising targets for fundamental research are potentially involved in regulation of
adipogenesis.
RefSeq Id EST Id on the mousechip Cluster Name
NM_010444 BE533846 2 nuclear receptor subfamily 4 group A
member 1 (Nr4a1)
NM_026439 AI838653/AW552006/AW552313 3 Ssg1, Urb ('Riken cDNA 2610001E17
(steroid sensitive protein 1))
NM_008590 AI848227/BE377797/AI834945 6 mesoderm specific transcript
PEG1/MEST
NM_177229 BE376542 6 RIP 13, NCoR ('RIKEN cDNA
5720405M06)
NM_007951 AI847976 7 Mer ('enhancer of rudimentary
homolog)
NM_007833 AI838312/AW556372 7 Decorin
NM_007680 AU041627 9 Eph receptor B6
Nuclear receptor subfamily 4 group A (Nr4a1) has a large (233aa) N-terminal low
complexity region, which is composed of more than 28% small polar amino acids. This
sequence biased segment is followed by a region called ‘C4 zinc finger in nuclear hormone
receptors’ (SM00399, E-value = 4.3e-40) and the ‘Ligand binding domain of hormone
2 Also contributing: Anne-Margrethe Krogsdam and Zlatko Trajanoski
Page 25
receptors’ (SM00430, E-value = 8.4e-34). The polar region might be responsible for putative
dimerization, while the zinc finger recognizes and binds specific DNA motifs. The ligand
binding domain has the capability to bind yet unknown effectors. This orphan nuclear
receptor is up-regulated during the whole differentiation but markedly before and after clonal
expansion. Nr4a1 has been implicated in cell proliferation, differentiation, and apoptosis
[102]. Nr4a1 was experimentally investigated in further detail. It was shown that the
transcription factor is important for very early differentiation. On the contrary, artificially
prolonged expression (transduction) abrogates adipogenesis, which depends on the DNA
binding feature3.
The so called “Coiled-coil domain containing 80 (Ccdc80)“ gene encodes a protein known
as ‘steroid sensitive protein 1’. Ccdc80 is predicted to be an extra-cellular protein due to its
N-terminal signal peptide. Interestingly, there is no coiled-coil predicted with the
ANNOTATOR. A closer look at the raw results shows that the region between 554 to 587
amino acids has some potential to be a coiled-coil segment. However, the coiled-coil motif
of the hydrophilic segment is a putative false prediction due to the absence of heptad
periodicity, which is addressed with the COIL parameters (window length 21, the 1995
matrix-based profile and down-weighting for polar residues [103]).
The protein contains three internal repeats (IR1, IR2, IR3) with approximately 200 amino
acids and an amino acid composition similar to common globular domains. In the multiple
alignment of the repeats, a distinct pattern is visible. Therefore, the segments (100-300; 570-
770, 749-949) were applied to a fan like PSI-BLAST familysearch with an E-value cut-off of
0.005. 43 hits (all from first PSI-BLAST) were found.
All three internal repeats (IR) of the original protein can be found with following E-values:
IR1 (1e-104); IR2 (5e-06); IR3 (9e-05). The ortholog proteins of Homo sapiens
(NP_840058.1) and Gallus gallus (BAC54279.1) can be found too with almost the same E-
values for the three internal repeats as in Mus musculus. Furthermore, many Sushi-repeat
containing proteins of various species are found, as well as many hypothetical proteins. Very
interesting is also the hit to ZP_00127997.1 (COG1530: Ribonuclease G and E;
3 Anne-Magrethe Krogsdam personal communication
Page 26
Pseudomonas syringae pv syringae B728a; from 298 to 425; E=4e-07). Therefore, it was
investigated if a ribonuclease activity can be assigned to the internal repeats.
Unfortunately, there are several hints that this segment has no ribonuclease activity and RNA
binding domain.
1. The COG1530 domain (RNase G and E) matches to amino acids 17-135 of the
pseudomonas protein but the IRs of the steroid sensitive protein 1 matches to amino
acids 298-425 of the pseudomonas protein.
2. In a NCBI-BLAST search with the ribonuclease of the Pseudomonas species,
homology to other ribonucleases is restricted to the first 135 amino acids (N-
terminal). The C-terminal region is only homolog to two hypothetical proteins
(NP_744544 and ZP_00087).
3. There is no fold similarity (bioinfo.pl) to any ribonuclease.
A multiple alignment was constructed from the family search results. A distinct pattern is
observed but nevertheless all bacterial species (NP_762334.1, NP_800493.1,
ZP_00004514.1, NP_744544.1, ZP_00127997.1, ZP_00087571.1 and ZP_00050117.1) align
not so well as the eukaryote species. A HMM model was constructed out of this multiple
alignment, which found all proteins of the initial family, but no further candidates.
The IR1 of Mus musculus, the IR2 (E=1e-05) of the ortholog Gallus gallus protein
(BAC54279.1) and the consensus sequence of the HMM model were submitted to the
structure meta-sever bioinfo.pl. The pdbblast of all four sequences give no significant hits.
The internal repeats and the consensus sequence have all structural similarity to the SCOP
c47.1 (Structural Classification of Proteins) under supervision of 3djury (IR1 Mm.: 201aa,
3djury score: 68.25, 1jfua; IR2 Gg.:155aa, 3djury score: 69.2, 1qmv_A; HMM consensus:
151aa, 3djury score: 88.88, 1qmv_A). SCOP c47.1 stands for the superfamily of
Thioredoxin-like fold.
Ccdc80 is repressed during clonal expansion and highly up-regulated in terminal
differentiation. Previously, it was suggested that it may have a unique function in the
regulation of body weight and energy metabolism [104].

Page 27
Mesoderm specific transcript (Mest) has a predicted signal peptide for extra-cellular
localization and a globular domain of alpha/beta hydrolase fold (PF00561, 4e-11). A special
biological role is indicated with the RPS-BLAST hit ‘Soluble epoxide hydrolase [Lipid
transport and metabolism]’ (KOG4178, E-value = 7.0e-92). Mest is strongly up-regulated
during fat cell differentiation except at 6h and 12h after induction. The gene is widely
expressed during development [105]. The imprinted Mest gene is induced in adult tissue
only from the paternal allele [106]. It is markedly enhanced in white adipose tissue of mice
with diet-induced and genetically caused obesity and appears to enlarge adipocytes and
could be a novel marker of the size of adipocytes. Ectopic expression of Mest in 3T3-L1
cells causes increased gene expression of adipose markers such as PPARgamma,
CCAAT/enhancer binding protein (C/EBP)alpha [107].
Nuclear receptor co-repressor 1 is a very long protein with many low complexity regions
and coiled-coil segments. Two “SANT SWI3, ADA2, N-CoR and TFIIIB'' DNA-binding
domains’ (SM00717, E-value = 1e-16 to 1e-10) are predicted, which had sequence specific
binding sites. It seems from the protein architecture that the protein is mainly involved in
protein-protein and protein-DNA interaction. Ncor1 is up-regulated after clonal expansion,
which indicates an important role for fat cell maturation.
Enhancer of rudimentary homolog (Mer) consists only of the highly conserved domain
with same name as the protein. The function is unknown. Mer is very strongly up-regulated
throughout differentiation. It is proposed that Mer is a cell type-specific transcriptional
repressor, probably interfering with HNF1-dependent gene regulation via DCoH/PCD [108].
Decorin (Dcn) is an extra-cellular protein composed mainly of leucin rich repeats (LRR).
LRRs fold into a horseshoe like shape and act as protein-protein interaction structures. Dcn
is very strongly up-regulated during adipogenesis. It is proposed that decorin is a bidentate
ligand attached to two parallel neighboring collagen molecules in the fibril, helping to
stabilize fibrils and orient fibrillogenesis [109]. Beside the structural role, the protein core
can bind TGF-beta [110]. It is shown that interaction between decorin and TGF-beta play an
important role in myogenesis [111] and that decorin reverses the repressive effect of
autocrine-produced TGF-beta on mouse macrophage activation [112]. All this observations
Page 28
result in the assumption that the interaction between TGF-beta and decorin plays an
important role also in adipogenesis [67].
Eph receptor B6 (Ephb6) contains an N-terminal signal peptide and is located with one
transmembrane helix in the membrane. The extra-cellular N-terminal region contains an
‘Ephrin receptor ligand binding domain’ (SM00615, E-value = 7*e-104) followed by a low
complexity region rich in small amino acids and two ‘Fibronectin type 3 domain’ (SM00060,
E-value = 1e-6 to 1e-12). Therefore, the extra-cellular part of the receptor is composed of
protein-protein interaction features. Intracellularly, the sequence is consisting of a ‘Tyrosine
kinase, catalytic domain’ (SM00219, E-value = 1.1e-74) and a ‘Sterile alpha motif’
(SM00454, E-value = 2.9e-20). The kinase of Eph6 is an inactive pseudo kinase domain
since it lacks all three important catalytic residues [113]. Sterile alpha motif is a protein
interaction domain. Even without an active kinase domain, EphB6 can pass on signaling
stimuli [114,115]. Because both receptors and ligands are membrane-bound, a direct cell–
cell contact is necessary for ligand binding and activation of the signaling cascades. As a
unique feature, bidirectional signaling is initialized in both the receptor and the ligand-
bearing cell [116].
Enzymatic networks are regulated in an ordered manner
It can be hypothesized that enzymatic networks undergo a specific regulation on the
transcriptional level to react efficiently to environmental or genetic changes. Two
mechanisms can be proposed:
1. Co-regulation of whole pathways/pathway segments
2. Ordered regulation of specific points, while the rest is unaffected
It was tried to evaluate both hypothesis with the molecular atlas of fat cell development.
Transcriptional co-regulation of a whole pathway/pathway segment was identified in the
case of cholesterol anabolism. 11 out of 14 enzymes of the cholesterol pathway share similar
expression profiles after isopentenylpyrophosphate synthesis. All enzymes except 7-
dehydrocholesterol reductase (Dhcr7) group together in the hierarchical cluster 4 (see
Page 29
appendix B-1, [2]). Nevertheless, the profile of Dhcr7 is very similar to cluster 4. Analysis of
the promoters shows that the co-expression of the cholesterol genes corresponds also to the
regulatory features of the 3’-UTR. Transcription factor binding sites for SREBP-1 (SRE and
E-box motifs [117]) is represented in significantly more genes in cluster 4 than all other
clusters (p-value of Fisher exact test 0.0484, Table 3). Similarly, a putative SREBP-1
regulatory region is significantly more frequent in the promoters of the genes in cluster 4
compared to all unique sequences in the PromoSer database (p-value < 0.0289; PromoSer
contains 22549 promoters of 12493 unique sequences).
The mechanism of co-regulation is only identified for cholesterol anabolism, which leaves
the lion’s share of enzymes unassigned. The enzymes are dispersed over the whole cellular
metabolism. This raises the question, if those regulated points share some common feature in
the network. Therefore, the transcriptionally regulated genes were analyzed if they obey
common criteria in the 36 different metabolic pathways observed in the expression profiles
(appendix B-1, Table 1, [2]). Within each pathway, it was asked whether these
transcriptionally regulated genes occupy key positions, i.e., a position at the pathway start,
which is the typical rate-limiting step where the amount of enzyme is critical [118], or at
some other point of regulation. With the adipogenic atlas it is found that such key positions
are occupied by transcriptionally regulated targets in 27 pathways (for detail see appendix B-
1, Table 1, [2]).
2.2. Transcriptional regulation of rate-limiting steps
In the previous chapter of fat cell differentiation, it was shown that, through a scrutiny of
expression profile and all involved components, testable hypothesis can be derived. The
hypothesis of preferred transcriptional regulation of rate-limiting step as an efficient way to
influence metabolism was proven by the case of fat cell differentiation. In this chapter, the
hypothesis is raised on a more general tier.

Page 30
An accurate set of 126 rate-determining enzymes from curated databases
Rate-limiting enzymes are described in many protein and gene databases. Three established
databases in biology are selected for rate-limiting data retrieval. Online Mendelian
Inheritance in Man (OMIM) of the Johns Hopkins University is a catalogue of genes and
genetic disorders with links to literature references, sequence records, maps, and related
databases. OMIM originates from the print edition MIM, which was founded more than 40
years ago and matured to an excellent knowledgebase with more than 17,300 entries [119].
This resource is selected as a highly reliable and significant disease database. The
investigation of the data revealed 55 proteins, which are known to play part in rate-
limitation. Since the transcriptional expression of rate-limiting proteins is the research focus,
the gene-centric GeneCard is selected as second repository, which is aimed at providing
concise and integrated biomedical information from many different online databases [73,74].
The advantage of combining several different resources in GeneCard provides an addition of
25 rate-limiting genes. The last repository of choice is the BRaunschweig ENzyme Database
(BRENDA) since most known rate-determining processes are involved in metabolism. The
primary literature based knowledgebase characterizes more than 83,000 different enzymes
(4,200 EC numbers) from 9,800 different organisms with valuable information about
metabolites, activators/inhibitors, kinetic parameters, literature and many more [120,121].
Further 46 enzymes are identified within the specialized hand-curated enzyme resource.
Thus, 126 highly reliable rate-limiting proteins are revealed within the three major biological
databases. It is unlikely that further investigations of gene/protein based databases will lead
to an additional huge amount of rate-determining proteins due to the tactical choice of the
databases and the interwoven nature of the major biological online databases.
Table 3 Cumulative contribution of curated databases to the amount of rate-limiting (RL) enzymes.
The +-sign indicates the additional number of rate-limiting enzymes.
Database Number of RL enzymes/isoforms
OMIM 55
GeneCard +25
Brenda +46
Total 126
Page 31
Comprehensive collection of known rate-limiting enzymes using PubMed
A small selection of 126 highly reliable rate-determining proteins is available through gene
and protein databases. Screening of 1000 recently published PubMed entries with the key
word “rate-limiting” quickly reveals that this protein collection is far from complete. A set,
which is as comprehensive as possible, is needed for a global examination of the
transcriptional regulation of key points within the metabolism. Therefore, more than 15,000
abstracts, which are available through NCBI PubMed, are reviewed for proteins, which are
rate-limiting for metabolic pathways and cellular processes. Synonyms are combined mainly
with the Entrez Gene database. 391 mammalian genes are defined in literature to be rate-
limiting for a larger process. Additional 42 splice variants are known for those genes. The
gene table of all 391 rate-limiting genes of Mus musculus can be found in appendix A. This
set contain also the highly reliable set of 126 proteins, which were found in curated
databases.
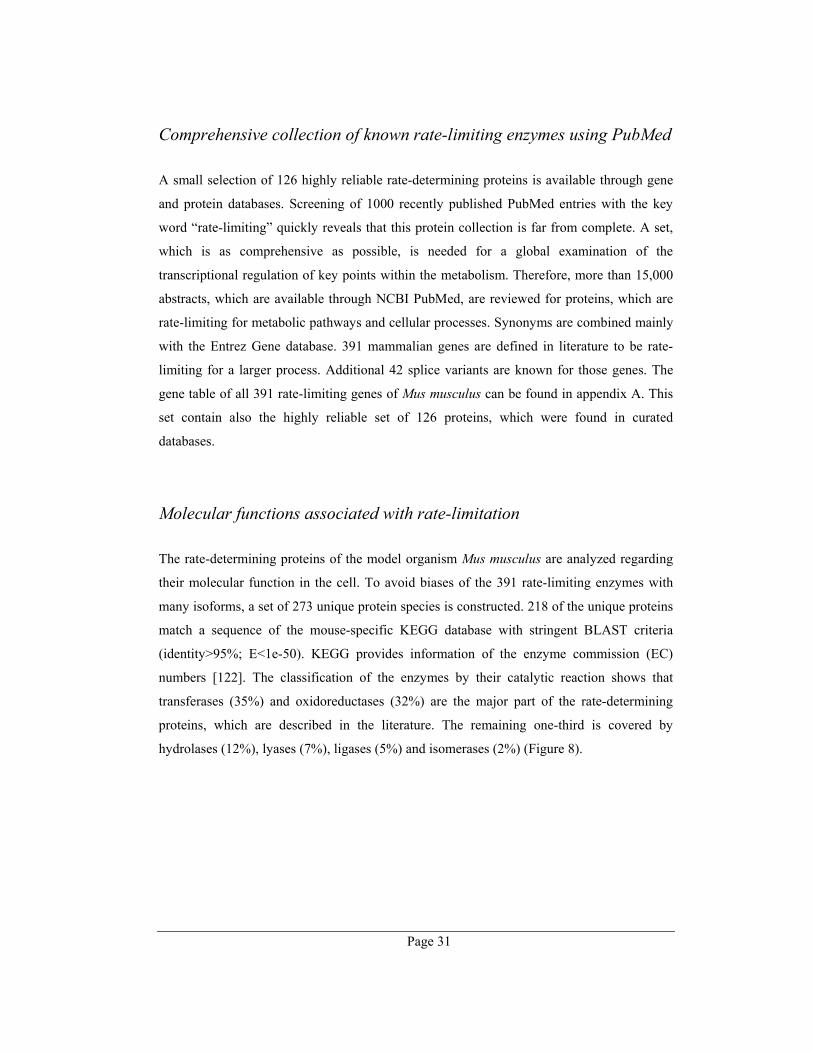
Molecular functions associated with rate-limitation
The rate-determining proteins of the model organism Mus musculus are analyzed regarding
their molecular function in the cell. To avoid biases of the 391 rate-limiting enzymes with
many isoforms, a set of 273 unique protein species is constructed. 218 of the unique proteins
match a sequence of the mouse-specific KEGG database with stringent BLAST criteria
(identity>95%; E<1e-50). KEGG provides information of the enzyme commission (EC)
numbers [122]. The classification of the enzymes by their catalytic reaction shows that
transferases (35%) and oxidoreductases (32%) are the major part of the rate-determining
proteins, which are described in the literature. The remaining one-third is covered by
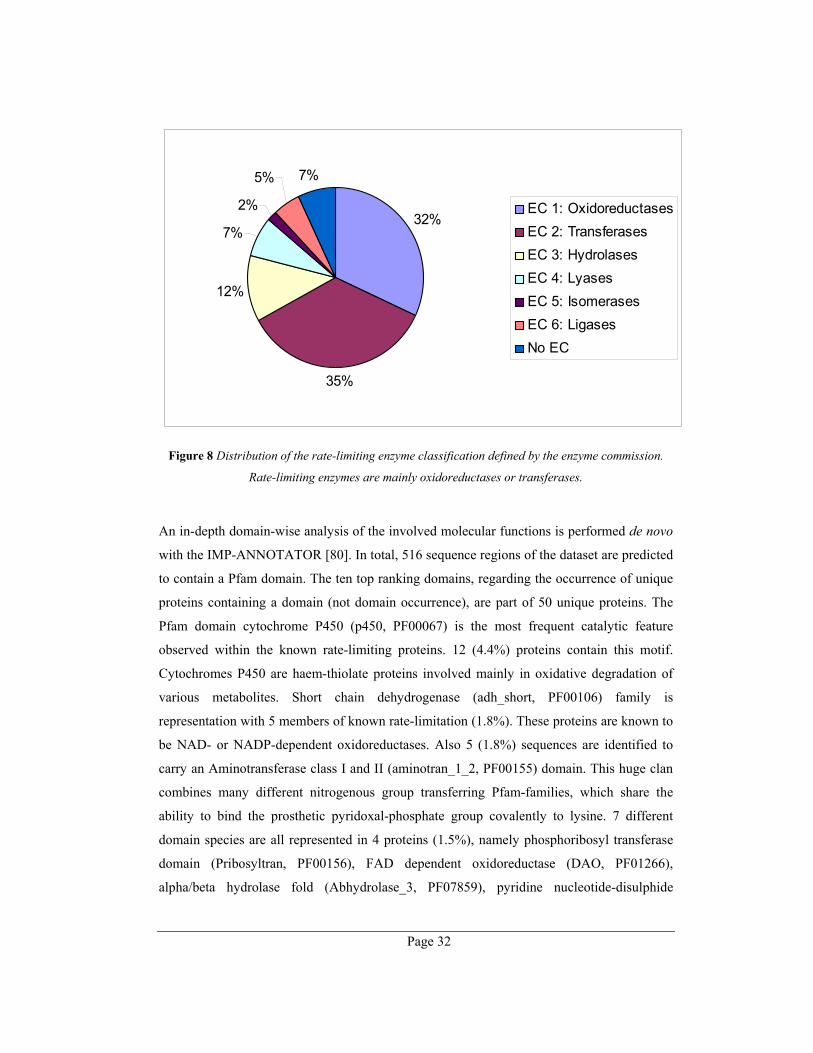
hydrolases (12%), lyases (7%), ligases (5%) and isomerases (2%) (Figure 8).
Page 32
32%
35%
12%
7%
2%
5% 7%
EC 1: OxidoreductasesEC 2: TransferasesEC 3: HydrolasesEC 4: LyasesEC 5: IsomerasesEC 6: LigasesNo EC
Figure 8 Distribution of the rate-limiting enzyme classification defined by the enzyme commission.
Rate-limiting enzymes are mainly oxidoreductases or transferases.
An in-depth domain-wise analysis of the involved molecular functions is performed de novo
with the IMP-ANNOTATOR [80]. In total, 516 sequence regions of the dataset are predicted
to contain a Pfam domain. The ten top ranking domains, regarding the occurrence of unique
proteins containing a domain (not domain occurrence), are part of 50 unique proteins. The
Pfam domain cytochrome P450 (p450, PF00067) is the most frequent catalytic feature
observed within the known rate-limiting proteins. 12 (4.4%) proteins contain this motif.
Cytochromes P450 are haem-thiolate proteins involved mainly in oxidative degradation of
various metabolites. Short chain dehydrogenase (adh_short, PF00106) family is
representation with 5 members of known rate-limitation (1.8%). These proteins are known to
be NAD- or NADP-dependent oxidoreductases. Also 5 (1.8%) sequences are identified to
carry an Aminotransferase class I and II (aminotran_1_2, PF00155) domain. This huge clan
combines many different nitrogenous group transferring Pfam-families, which share the
ability to bind the prosthetic pyridoxal-phosphate group covalently to lysine. 7 different
domain species are all represented in 4 proteins (1.5%), namely phosphoribosyl transferase
domain (Pribosyltran, PF00156), FAD dependent oxidoreductase (DAO, PF01266),
alpha/beta hydrolase fold (Abhydrolase_3, PF07859), pyridine nucleotide-disulphide
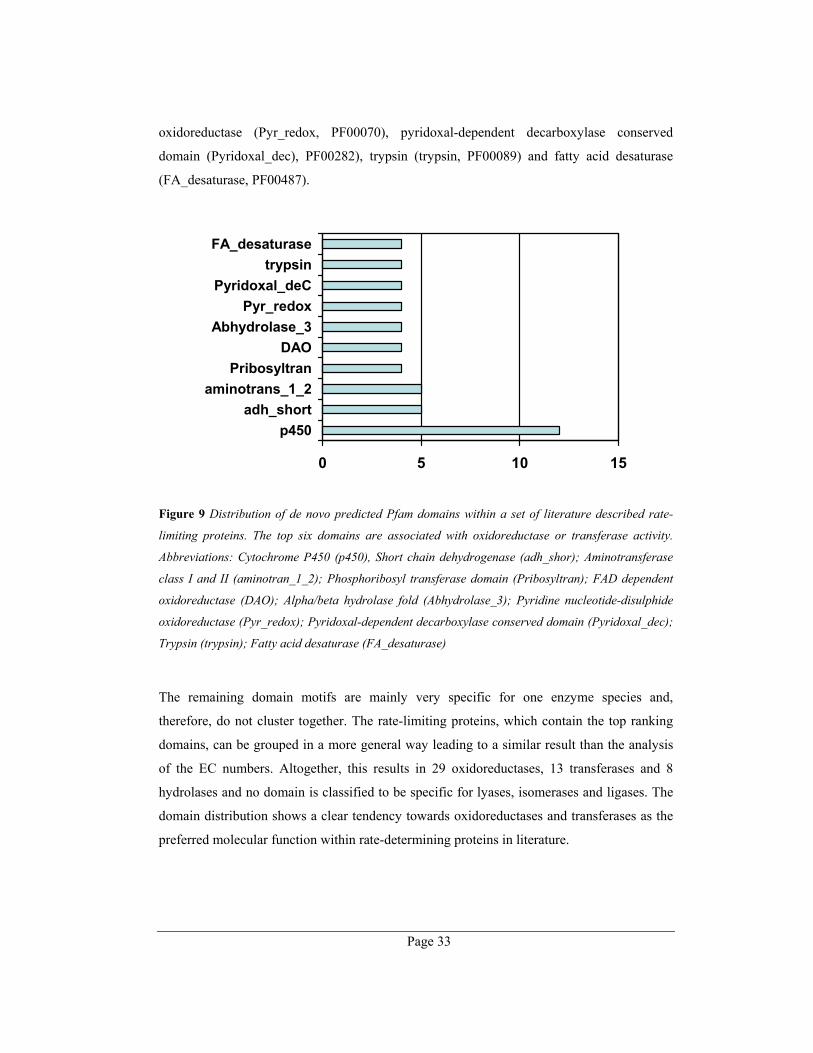
Page 33
oxidoreductase (Pyr_redox, PF00070), pyridoxal-dependent decarboxylase conserved
domain (Pyridoxal_dec), PF00282), trypsin (trypsin, PF00089) and fatty acid desaturase
(FA_desaturase, PF00487).
0 5 10 15
p450adh_short
aminotrans_1_2Pribosyltran
DAOAbhydrolase_3
Pyr_redoxPyridoxal_deC
trypsinFA_desaturase
Figure 9 Distribution of de novo predicted Pfam domains within a set of literature described rate-
limiting proteins. The top six domains are associated with oxidoreductase or transferase activity.
Abbreviations: Cytochrome P450 (p450), Short chain dehydrogenase (adh_shor); Aminotransferase
class I and II (aminotran_1_2); Phosphoribosyl transferase domain (Pribosyltran); FAD dependent
oxidoreductase (DAO); Alpha/beta hydrolase fold (Abhydrolase_3); Pyridine nucleotide-disulphide
oxidoreductase (Pyr_redox); Pyridoxal-dependent decarboxylase conserved domain (Pyridoxal_dec);
Trypsin (trypsin); Fatty acid desaturase (FA_desaturase)
The remaining domain motifs are mainly very specific for one enzyme species and,
therefore, do not cluster together. The rate-limiting proteins, which contain the top ranking
domains, can be grouped in a more general way leading to a similar result than the analysis
of the EC numbers. Altogether, this results in 29 oxidoreductases, 13 transferases and 8
hydrolases and no domain is classified to be specific for lyases, isomerases and ligases. The
domain distribution shows a clear tendency towards oxidoreductases and transferases as the
preferred molecular function within rate-determining proteins in literature.
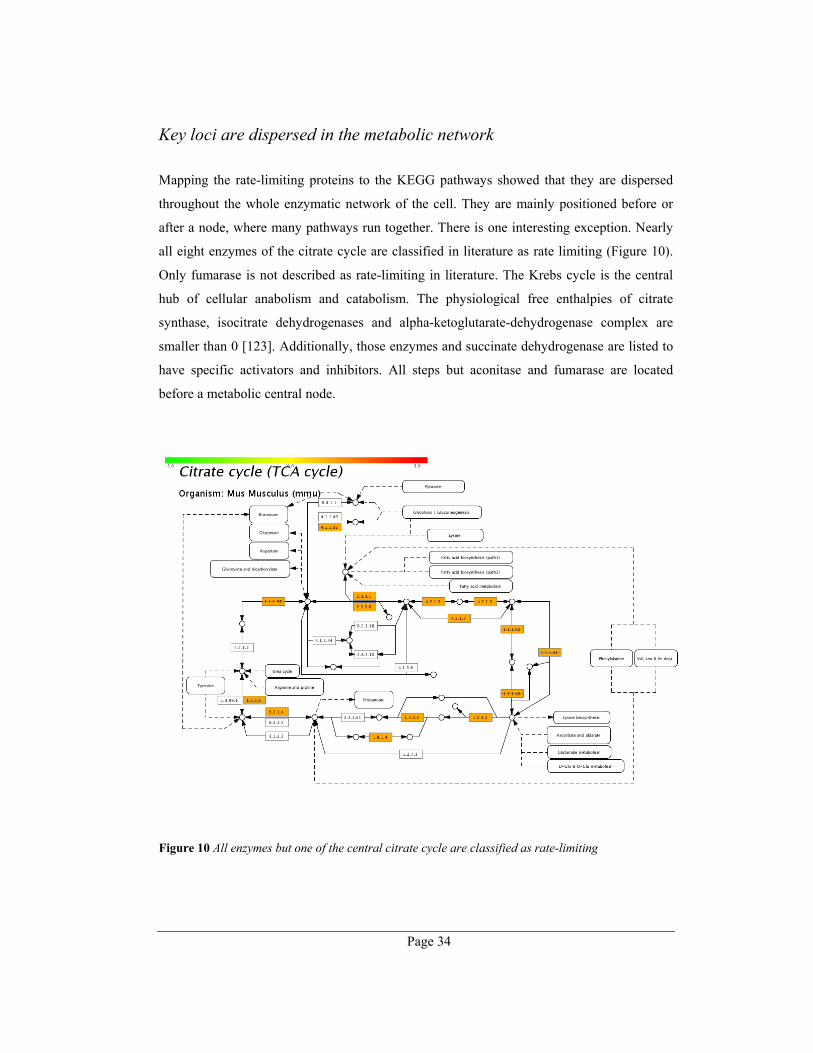
Page 34
Key loci are dispersed in the metabolic network
Mapping the rate-limiting proteins to the KEGG pathways showed that they are dispersed
throughout the whole enzymatic network of the cell. They are mainly positioned before or
after a node, where many pathways run together. There is one interesting exception. Nearly
all eight enzymes of the citrate cycle are classified in literature as rate limiting (Figure 10).
Only fumarase is not described as rate-limiting in literature. The Krebs cycle is the central
hub of cellular anabolism and catabolism. The physiological free enthalpies of citrate
synthase, isocitrate dehydrogenases and alpha-ketoglutarate-dehydrogenase complex are
smaller than 0 [123]. Additionally, those enzymes and succinate dehydrogenase are listed to
have specific activators and inhibitors. All steps but aconitase and fumarase are located
before a metabolic central node.
Figure 10 All enzymes but one of the central citrate cycle are classified as rate-limiting

Page 35
Disturbance of the enzymatic network by knocking out a single rate-limiting enzyme
Adipose triglyceride lipase (ATGL) is a putative rate-limiting enzyme in the catabolism of
fat depots [124]. Disturbances after knocking out a single metabolic rate-limiting factor
(ATGL-/- mouse) were analyzed by means of microarray expression data4. Relative
expression of knockout and wild-type situation was measured in 6 tissues/organs. Significant
response to the ATGL-/- knockout was observed in brown adipose tissue (1110 ESTs) and
cardiac muscle (382 ESTs) with at least 2-fold up- or down-regulation compared to wild
type. Interestingly, it had nearly no effect on white adipose tissue (96 ESTs), liver (28 ESTs),
kidney (5 ESTs) and smooth muscle (58 ESTs).
Brown adipose tissue (BAT) responded to the knockout of the rate-limiting enzyme most
vigorously. The reason might be that triglyceride (TG) is the most important substrate for
BAT, which is used in thermogenesis. The absence of ATGL diminishes or cancels totally
the TG utilization in those cells. Therefore, the fat burning is completely down-regulated.
Rate-limiting enzymes of fatty acid degradation (acyl-CoA dehydrogenases (Acad)), many
citrate cycle enzymes and components of all electron transport and oxidative
phosphorylation complexes have significant lower expression levels than in wild type mice.
Contrary, adipose differentiation related protein (Adfp), which is responsible of lipid droplet
formation, is up-regulated. Interestingly, the expression of fatty acid synthase (Fasn) is also
stimulated. Steaoryl-CoA seems to be the predominant de novo fatty acid, since the post-
processing stearoyl-CoA desaturase 1 (Scd1) and ELOVL family member 6, elongation of
long chain fatty acids (Elovl6) are lower expressed than in wild type mice. Only desaturation
by Scd2 might be an exception.
4 Data provided by Montserrat Pinent Armengol, Hubert Hackl and Juliane Strauss (IGB, TU Graz)
(publication in preparation)
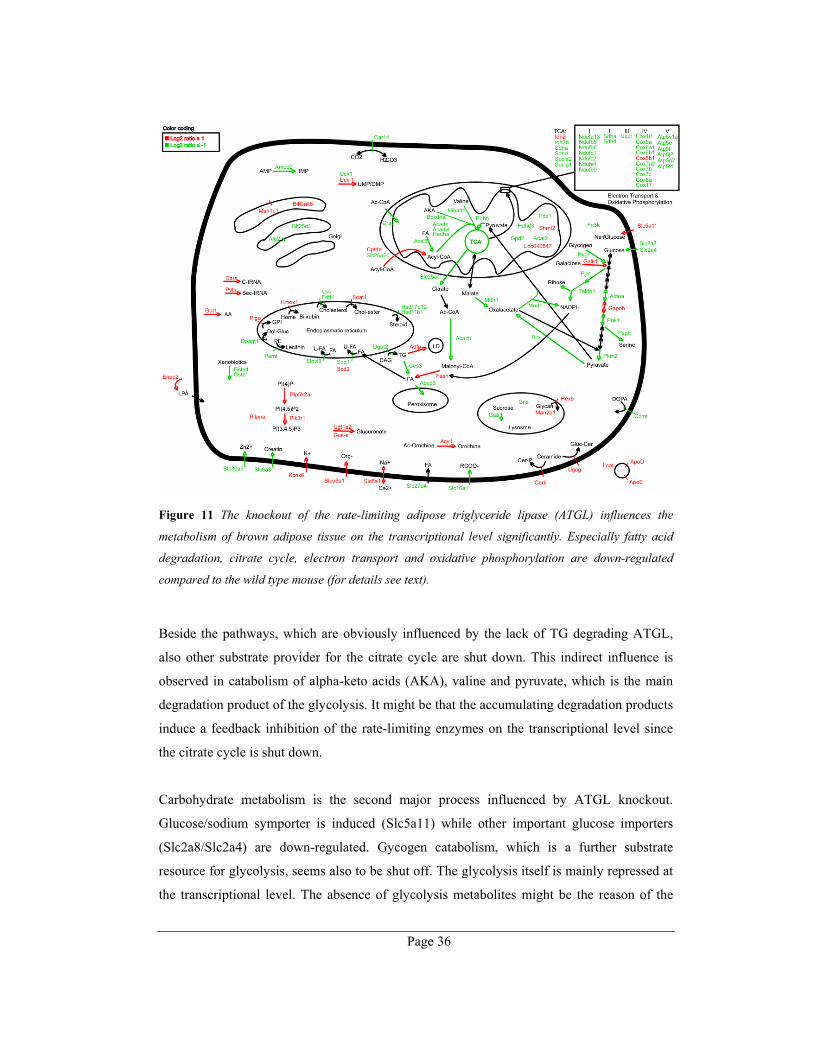
Page 36
Figure 11 The knockout of the rate-limiting adipose triglyceride lipase (ATGL) influences the
metabolism of brown adipose tissue on the transcriptional level significantly. Especially fatty acid
degradation, citrate cycle, electron transport and oxidative phosphorylation are down-regulated
compared to the wild type mouse (for details see text).
Beside the pathways, which are obviously influenced by the lack of TG degrading ATGL,
also other substrate provider for the citrate cycle are shut down. This indirect influence is
observed in catabolism of alpha-keto acids (AKA), valine and pyruvate, which is the main
degradation product of the glycolysis. It might be that the accumulating degradation products
induce a feedback inhibition of the rate-limiting enzymes on the transcriptional level since
the citrate cycle is shut down.
Carbohydrate metabolism is the second major process influenced by ATGL knockout.
Glucose/sodium symporter is induced (Slc5a11) while other important glucose importers
(Slc2a8/Slc2a4) are down-regulated. Gycogen catabolism, which is a further substrate
resource for glycolysis, seems also to be shut off. The glycolysis itself is mainly repressed at
the transcriptional level. The absence of glycolysis metabolites might be the reason of the
Page 37
down-regulation of pathways, which use the intermediates for anabolism like serine
synthesis and the anaplerotic5 oxalacetate production. Further the pentose phosphate shunt is
repressed at different levels, which might turn of ribose and NADPH synthesis. The second
possibility of NADPH supply through the enzyme called “malic enzyme, supernatant”
(Mod1) shares the same repression. Beside those major changes, a noticeable number of
transporters are transcriptionally influence. Additional components of cholesterol shuttling
lipoproteins (ApoD, ApoE, Lcat) are up-regulated.
Altogether, the knockout of the rate-limiting ATGL enzyme exerts changes mainly on
degradation as well as on energy supply and thermogenesis. Few pathways, which are not
involved in those processes, are also influenced in different directions. As observed in the
transcriptional regulation of enzyme networks during fat cell differentiation, pathway
changes seem to be achieved in one of two ways. Either all pathway components are
regulated simultaneously (e.g. electron transport) or, preferentially, individual rate-limiting
steps are modified (e.g. fatty acid degradation). 31 rate-limiting metabolic proteins are
differential regulated, which is 31% of the enzymes (98). If the co-expressed pathway of
electron transport and oxidative phosphorylation is subtracted, the amount of strongly
regulated enzymes rises to 39% (29 of 74).
Transcriptional regulation of rate-limiting enzymes during differentiation
Several expression profiling studies, which investigate differentiation processes, are
analyzed with regard to the transcriptional regulation of rate-limiting enzymes. Fat cell
differentiation from 3T3-L1 [2] and MEF cell lines (unpublished data) were performed with
a cDNA microarray at 8 different time points. Significantly regulated genes were in at least 4
time points 2-fold up or down-regulated compared to the reference. 3T3-L1 contains 83
metabolic proteins in the KEGG database. 41% of those proteins were identified as rate-
limiting. MEF differentiation yielded 147 enzymes in the metabolic part of KEGG, which
contained 43 rate-limiting enzymes. Development of skeletal muscle was analyzed by
5 replenish intermediates of the citrate cycle
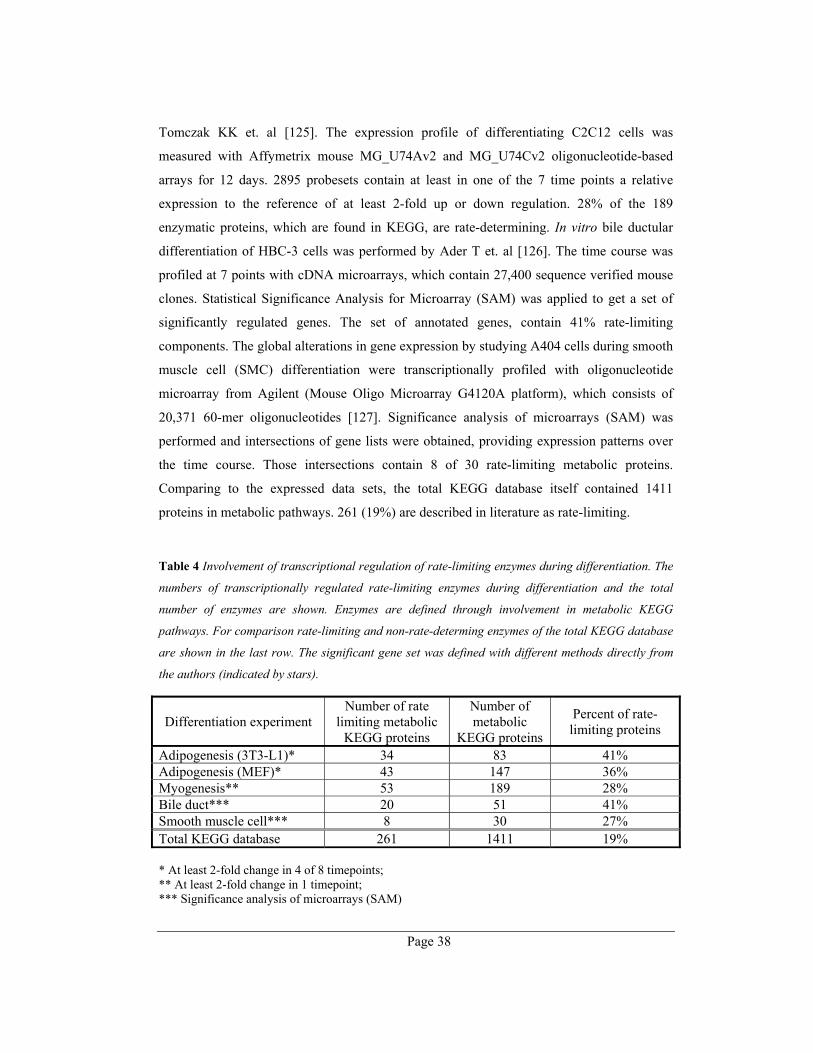
Page 38
Tomczak KK et. al [125]. The expression profile of differentiating C2C12 cells was
measured with Affymetrix mouse MG_U74Av2 and MG_U74Cv2 oligonucleotide-based
arrays for 12 days. 2895 probesets contain at least in one of the 7 time points a relative
expression to the reference of at least 2-fold up or down regulation. 28% of the 189
enzymatic proteins, which are found in KEGG, are rate-determining. In vitro bile ductular
differentiation of HBC-3 cells was performed by Ader T et. al [126]. The time course was
profiled at 7 points with cDNA microarrays, which contain 27,400 sequence verified mouse
clones. Statistical Significance Analysis for Microarray (SAM) was applied to get a set of
significantly regulated genes. The set of annotated genes, contain 41% rate-limiting
components. The global alterations in gene expression by studying A404 cells during smooth
muscle cell (SMC) differentiation were transcriptionally profiled with oligonucleotide
microarray from Agilent (Mouse Oligo Microarray G4120A platform), which consists of
20,371 60-mer oligonucleotides [127]. Significance analysis of microarrays (SAM) was
performed and intersections of gene lists were obtained, providing expression patterns over
the time course. Those intersections contain 8 of 30 rate-limiting metabolic proteins.
Comparing to the expressed data sets, the total KEGG database itself contained 1411
proteins in metabolic pathways. 261 (19%) are described in literature as rate-limiting.
Table 4 Involvement of transcriptional regulation of rate-limiting enzymes during differentiation. The
numbers of transcriptionally regulated rate-limiting enzymes during differentiation and the total
number of enzymes are shown. Enzymes are defined through involvement in metabolic KEGG
pathways. For comparison rate-limiting and non-rate-determing enzymes of the total KEGG database
are shown in the last row. The significant gene set was defined with different methods directly from
the authors (indicated by stars).
Differentiation experiment Number of rate
limiting metabolic KEGG proteins
Number of metabolic
KEGG proteins
Percent of rate-limiting proteins
Adipogenesis (3T3-L1)* 34 83 41% Adipogenesis (MEF)* 43 147 36% Myogenesis** 53 189 28% Bile duct*** 20 51 41% Smooth muscle cell*** 8 30 27% Total KEGG database 261 1411 19% * At least 2-fold change in 4 of 8 timepoints; ** At least 2-fold change in 1 timepoint; *** Significance analysis of microarrays (SAM)
Page 39
3. Discussion
This thesis explores the question to which extent gene expression profiles can reveal
molecular functions. Comprehensive bioinformatics analyses of microarray data from a cell
model of fat cell development resulted in three novel biological insights. First, the analyses
have resulted in comprehensive gene networks of fat cell differentiation for the first time.
Second, the annotated adipogenic atlas puts many important biological processes in a
common context and extends the view of previous microarray analyses in fat cells [6-
11,128]. Third, continuative analysis of the gene networks revealed the preferential
transcriptional regulation of rate-limiting enzymes as a mechanism to control the
metabolism. This evaluation confirmed for five independently developmental processes that
approximately one third of strongly transcriptionally regulated enzymes could be categorizes
as rate limiting. These surveys were only possible after an extensive list of rate-limiting
proteins was compiled from curated databases and literature. As no comparable effort has
been previously reported, this selection is a very valuable contribution to the field of
proteomics as it will allow set-consideration in a qualitatively new way. The three main
achievements are discussed in the following.
First, in-depth analyses of expression profiles resulted in complex networks describing
molecular processes after. Initially, a first glance into the wealth of the microarray data is
possible by assigning GO terms to co-expression patterns. This strong simplification
associated gene groups with cell cycle, extra-cellular matrix alteration, cytoskeleton
remodeling and cholesterol biosynthesis. Nevertheless, more than 40 percent of the ESTs
remained unassigned. Although the number of protein sequences to which a GO term can be
matched is steadily increasing, specific and detailed annotation is only possible with in-depth
bioinformatics analyses based on segment and domain predictions. Hence, de novo
functional annotation of ESTs using integrated prediction tools and subsequent curation of
the results based on the available literature is not only necessary to complete the annotation
process, but also to reveal the actual biological processes and gene networks. Altogether, 345
gene products were mapped on known pathways, molecular processes and sub-cellular
localizations. This molecular atlas of fat cell development provides the first global view of
the underlying biomolecular networks.
Page 40
Second, the novel adipogenic atlas enhances the understanding of fat cell differentiation
significantly. On the one hand, 326 of the 780 ESTs were not shared with previous studies
[6,9,129], suggesting that the comprehensive picture of this process is far from complete.
On the other hand, a true novelity lies in the global view of the gene networks. The
connected nature of the resource can be used to derive new hypothesis and test upcoming
ones. Several phenotypic changes of adipose differentiation are particularly well
characterized by the expression data. For example, clonal expansion, a prerequisite for
terminal differentiation, is correlated with a network of 68 transcriptionally regulated gene
products. Furthermore, a global view of the gene networks suggests that the reduced
replenishment of the cytoskeleton with building blocks, the strong transcriptional up-
regulation of modulating proteins and extra-cellular remodeling act in concert and cause the
morphological up-rounding during adipogenesis. Most cytoskeleton gene products are co-
expressed (cluster 10) and might have a common transcriptional regulatory mechanism
(Appendix B-1, [2]). While most identified gene products are located at endpoints of
regulation cascades and typically contribute highly abundant transcripts, this work could also
identify complex changes of signal transduction and transcription factors with a role in
adipogenesis (Appendix B-1, [2]).
Third, preferential control of rate-limiting enzymes and the synchronous regulation of whole
pathway segments are two general principles, which regulate the metabolic networks on the
transcriptional level. On the one hand, a whole pathway can be co-regulated, which is
exemplified by SREBP mediated regulating of the cholesterol synthesis in case of fat cell
differentiation (Appendix B-1, [2]). A further example is the shut down of oxidative
phosphorylation and electron transport in the gene networks of brown adipose tissue as a
response to knockout of adipose triglyceride lipase. On the other hand, 27 of 36 investigated
pathways are preferentially transcriptionally regulated at rate-limiting steps in the context of
adipogenesis. To investigate the generality of this observation, a comprehensive list of 391
rate-limiting proteins was compiled for the first time. It is supposed that the number of
known rate-limiting proteins is far from complete, which is supported by the recent finding
of the rate-limiting adipose triglyceride lipase. Nevertheless, it is shown in five different
developmental processes that approximately one third of the significantly regulated genes are
rate-determining.
Page 41
Concluding, in-depth bioinformatics analysis can reveal a wealth of information in
microarray expression data. In case of adipogenesis a novel molecular atlas, which
contributes significantly to a better understanding of fat cell differentiation, is constructed
using de novo annotation and extensive literature curation. The global view delineates many
phenotypic changes and can be used to derive new testable hypothesis. This work determines
co-regulation of whole pathway segments and preferential transcriptional regulation of rate-
limiting enzymes as important mechanisms to control metabolism on the transcriptional tier.
3.1. Fat cell development
In addition to the previous section and the publication, the comparison to biomarkers and
GNF SymAtlas suggests that the 3T3-L1 cell line and the gene networks are relevant for in
vivo systems. This observation makes the global adipogenic atlas also a valuable resource for
pharmaceutical industry to find promising medical targets and to estimate influences on the
adipogenic networks. For fundamental research, seven promising candidate genes are
proposed for further molecular investigation in the wet laboratories. Furthermore, analysis of
predicted transcription factors regulating common features of the gene networks are of major
concern for follow up studies. Finally, the annotation of the ESTs resulted in a convenient
information retrieval system, which can help upcoming expression experiments to analyze
the huge amount of chip data more efficiently. The importance of this work for future studies
is reviewed in the following.
First, semi-quantitative comparison of the white adipose tissue (GNF SymAtlas) and the
profile of known in vivo markers support the notion that the 3T3-L1 model system shows
many features which are also found in in vivo adipogenesis. Many of the expression profiling
results resemble the time course of expression changes during adipocyte development in vivo
and, therefore, numerous transcriptionally regulated targets found in this study for the first
time are potential candidates with important biological functions for medical application and
in vivo fat cell differentiation. Without doubt, the error margin of microarray-based
expression profiling is considerable and, typically, leads to semi-quantitative evaluation of
expression ratios. But the observation of transcriptional regulation gains additional
Page 42
significance when the known or predicted function of protein targets and their involvement
in specific pathways make sense in the context of adipocyte development.
Second, several targets can be proposed as promising subjects for further fundamental
research. Seven candidate genes are selected by examining the position in the gene networks
and the sequence architecture. One success story is the investigation of the Nuclear receptor
subfamily 4 group A (Nr4a1, formerly Nur77). Biologists at the Institute for Genomics and
Bioinformatics (IGB) could confirm experimentally that the orphan receptor is indeed
important for very early differentiation and its prolonged expression abrogates adipogenesis.
This function of Nr4a1 was shown to depend on the DNA binding feature. Additionally,
several other candidate genes that were not detected in the expression study are proposed by
promoter analysis (appendix B-1, [2]) to be important for regulation of fat cell development.
Possibly the differential expression of those targets was not identified because microarray
technology was not sensitive enough for the low abundant factors [130]. However, 26
binding motifs of transcription factors are recognized as over-represented in a cluster
potentially implicated in the regulation of co-expressed genes. One experimentally proven
example for a functional transcription factor binding site is SREBP-1 in Cluster 4 [131].
Surprisingly, binding sites for other known key regulators for adipogenesis, PPAR and
C/EBP are not significantly overrepresented in any of the promoters of the co-expressed
genes. This demonstrates either that much more sophisticated methods must be developed, or
that there are many cases where the current methods fail as they cannot consider biologically
important aspects like chromatin structure at the recognition site.
Third, the EST annotation of the in-house Mus musculus chip of the Institute for Genomics
and Bioinformatics (IGB, TUGraz) performed in the course of this work was stored in a
relational database. This database helps to analyze upcoming expression studies more
efficiently. The only requested input parameter for information retrieval is the EST accession
number of interest. Mapping of the EST to nucleotides and proteins are presented upon query
submission. One of the most important features is availability of the full mapping results.
This is crucial, since the first best hit, which is sorted by the E-value, is sometimes not the
correct hit. A short look at the Megablast sequence alignments is often enough to verify the
mapping results.
Page 43
In addition, the annotation database links RefSeq proteins with the most important 3rd party
resources that give insight on the cellular function. Furthermore, all gene synonyms are
linked to NCBI PubMed, which allows a fast screening of the important literature.
Expression data of different sources are also well connected to the RefSeq entries. It is also
possible to show the own expression profile in the user interface. Finally, for each protein a
de novo sequence analysis is available through an integrated frame to the IMP
ANNOTATOR suite. This feature needs authentification (username: mousechip; password:
expression). The pretty view provides user friendly sequence architecture information, which
is the result of over 40 academic sequence analysis algorithms. For proteins already
described in literature, knowledge of the protein architecture can verify or extend the
molecular function annotation. For proteins of unknown function it is possible to predict
their molecular roles.
In summary, several target genes are proposed by directly investigating the gene networks
and by indirect analysis of transcription factor binding motifs. Due to the correspondence of
many expression profiles to in vivo observations, the data might also be a well suited
resource for pharmaceutical target identification. Finally in the case of further expression
experiment, the annotated ESTs stored in IGB mousechip database might save much time,
since many bioinformatics analysis are pre-computed and accessed very fast. Especially, in
the case of large datasets it helps to focus on the relevant biological insights, which are
hidden in the expression data.
3.2. Rate-limitation
In addition to the first exhaustive list of 391 rate-determining enzymes from literature, a
highly reliable subset from three different curated databases was constructed. Rate-limiting
enzymes are found to act in biochemical processes mainly as oxidoreductases and
transferases. Most of them are scattered in the metabolic networks. Rate-limiting enzymes
and whole pathway segments are also transcriptionally regulated in response to the
disruption of the gene networks by knocking out a rate-limiting enzyme. Furthermore, this

Page 44
doctoral thesis shows that specific points of the metabolic network are regulated selectively
during development.
First, 391 rate-limiting and hand-curated proteins are selected from more than 15,000
PubMed abstracts. Even though the exhaustive collection covers a broad band of the
metabolic networks, it is likely that even more yet unknown key players exist. This became
evident as the rate-determining adipose triglyceride lipase (ATGL) was discovered recently.
Furthermore, the IUPAC definition of rate-limitation has been interpreted quite freely by
scientists in daily usage. Hence, a subset of 126 proteins with improved reliability is
constructed from three well established and curated databases. The advantage of using
curated-databases is that the information is scrutinized several times from experienced
scientist. OMIM, GeneCard and BRENDA were selected as primary resources. Therefore,
the expertise incorporated in the retrieved set ranges from medical over gene-centric to
enzyme specific information. Together the exhaustive and the reliable selection unfolds its
true power depending on the context of the research.
Second, the molecular function of rate-limiting enzymes was found linked to
oxidoreductases and transferases activity in two thirds of the studied proteins. A set of 273
rate-limiting proteins, which are not biased by a huge amount of isoforms, was subjected to
in-depth analysis aiming at consolidation of the working definition of rate-limitation. KEGG
and the enzyme nomenclature were used to classify the proteins. Approximately, one third of
the enzymes are oxidoreductases and another third are transferases. The smallest portion is
occupied by isomerases, which are mainly involved in reversible reactions. Cytochrome
p450, NAD(P)H dependent short chain dehydrogenase and aminotransferase domains are the
three domains most commonly found in the rate-limiting proteins. Those de novo sequence
analytic observations confirm the conclusion of the KEGG analysis. To summarize, this
work shows that the most suitable definition of a rate-limiting enzyme needs to include
proteins, which are observed to be thermodynamically unfavorable, subjected to regulation
or occupying the slowest step of a reaction. Their preferred molecular function in the cell is
an oxidoreductase or transferase reaction. Maybe, the combination of the comprehensive
selection of rate-limiting proteins with kinetic parameters will allow a more common and
precise definition at a later date.
Page 45
Third, mapping the set of 391 rate-limiting proteins on the enzymatic network shows that
most of the enzymes are scattered. Often enzymes are found in vicinity to nodes, where
many pathways come together. Therefore, they can influence the direction of the metabolic
flux. One interesting exception is the citrate cycle. All components but one enzyme are
described in literature in some context as rate-limiting. This mirrors the central role of the
citrate cycle for the cell and reflects the tight regulation of most of its steps.
Fourth, knocking out one single rate-limiting factor can have significant effects on the
transcriptional expression of the enzymatic network. Adipose triglyceride lipase ATGL-/-
mutants influence the gene expression of brown adipose tissue (BAT) and cardiac muscle
heavily, while there is nearly no change in white adipose tissue, kidney, liver. It seems that
triglyceride degradation is not a crucial pathway of those compartments under tested
conditions. However for BAT, triglyceride degradation is important for thermogenesis and
energy production. The absence of ATGL dramatically down-regulates the citrate cycle, all
parts of oxidative phosphorylation and electron transport. The observed effects might result
from the absence of substrates. Interestingly, also other energy supplying pathways such as
glycolysis are shut off. Since the BAT is not encapsulated by other tissues, it might be
important that many transporter and lipoproteins are differentially regulated. Probably, this is
a mechanism to allocate the excessive metabolites to other tissues. Additionally, the
phenotypic observations of defective cold adaptation and fat accumulation in different
tissues can be explained by means of the gene networks. Fat accumulates since the
triglyceride and fatty acid metabolism is transcriptionally shut off at rate-limiting enzymes.
Up-regulated transporting systems might distribute the excess fat in the whole body, which
finally leads to cardiac dysfunction and premature death. In addition, large parts of oxidative
phosphorylation are down-regulated in ATGL absence. This prohibits the build up of an H+
gradient needed by uncoupling proteins to produce heat. Whereas lacking this function, the
brown adipose tissue is not able to respond to cold environments.
Finally, this doctoral thesis shows that metabolic networks can be transcriptionally regulated
at rate-limiting enzymes. Previously, it was argued that it is unlikely that a single protein
regulates a whole pathway. The total amount of the proteins within a cell occupies 15-35%
of the cell volume, which is the maximum compatible with cell function. Therefore it was
Page 46
stated, that it is evolutionary preferable to minimize the pathway fluxes for minimal total
protein level [132]. In the present study, it is dealt with expression levels of genes and not
directly with protein levels. Hence, it cannot be totally excluded that post-transcriptional
events prevent translation to the active genes but it is assumed that transcriptional levels in
some way reflect the protein amount. Further, it also seems that the amount of enzymes is
negligible in comparison to the huge amount of structural proteins during development.
Especially during differentiation, it might be evolutionary preferable to react punctual and
fast to stimuli. In the presence of heavy protein synthesis for matrix remodeling, this goal
can be best achieved by maintaining the lion’s share of the enzymatic networks, and by
transcriptionally regulating only hotspots.
In-depth analysis of metabolic networks, which are involved in fat cell differentiation and
the effects of ATGL deficiency, exposed that two mechanisms of transcriptional regulation
coexist. On the one hand, whole pathway segments can be co-regulated (e.g. cholesterol
metabolism, oxidative phosphorylation). On the other hand, rate-determining enzymes are
selectively regulated. First this principle was observed in the case of adipogenesis. 27
metabolic pathways out of 36 were regulated at key points mainly the rate-limiting steps.
Knocking out the rate-limiting protein ATGL resulted itself in transcriptional regulation of
31 rate-limiting metabolic enzymes (31%). If the co-expressed pathway of electron transport
and oxidative phosphorylation is subtracted, the amount of strongly regulated enzymes rises
even to 39% (29 of 74). Furthermore, five developmental expression studies were
investigated. The experiments were carried out on different microarray platforms and the set
of significantly relevant genes was determined with different methods. This selection
minimizes biases by technologies and post-processing. Approximately, one third of the
transcriptionally regulated enzymes are assigned to be rate-limiting. Considering that still
unknown rate-limiting enzymes exist, the huge number substantiates, that selective
regulation is an additional mechanism to efficiently control metabolic networks on the
transcriptional level.
In summary, this doctoral thesis provides for the first time an exhaustive and reliable
selection of known rate-limiting proteins. Many oxidoreductases and transferases are found
in this selection. Absence of the rate-determining ATGL results in deregulation of those rate-

Page 47
limiting hot spots in metabolic networks. In addition to regulation of whole pathway, the
selective transcriptional regulation of rate-limiting enzymes is a valid mechanism in the
control of metabolic networks.
Page 48
4. Methods
4.1. Fat cell development
Nearly all methods regarding the fat cell development are available in appendix B-1 [2]. This
include for example: cell culture experiments, labeling and hybridization, data preprocessing,
data normalization, clustering, gene ontology classification, de novo annotation and promoter
analysis. Please consult, therefore, the integral publication of the doctoral thesis.
EST mapping to genes and proteins
For each of the 23,311 expressed sequence tags (EST) (represent 27,645 spots) of the IGB
mousechip, it was attempted to find the corresponding protein sequence. Megablast [133]
searches (word length w=70, percent identity p=95%) against nucleotide databases (in the
succession of RefSeq [134,135], FANTOM [136], Ensemble, UniGene [137] and Trest until
a gene hit was found) were carried out. For the ESTs still remaining without gene
assignment, discontigous megablast (word length w=11, percent identity p=95%) with the
same succession as Megablast was performed. Blastx against the international protein index
(IPI) was conducted with the remaining ESTs. If an EST was still left unassigned, the whole
procedure was repeated with blastn [138]. In addition, a blastn (e-value cutoff e=1-9) search
against the ENSEMBL mouse genome [139] was performed and ESTs with long stretches
(>100 bp) of unspecified nucleotides (N) were excluded.
De novo annotation of the mapped proteins
The protein sequences of the first best hits in the mapping procedure have been annotated de
novo with academic prediction tools that are integrated in the ANNOTATOR, a novel
protein sequence analysis system [140]: Compositional bias (SAPS [141], Xnu, Cast [142]),

Page 49
low complexity regions (SEG [143]), known sequence domains (Pfam [144], SMART [145],
Prosite [146] and Prosite pattern [147] with HMMER (not Pfam), RPS-BLAST [148],
IMPALA [149], PROSITE-Profile [150]), Transmembrane domains (HMMTOP 2.0 [151],
TOPPRED [152], DAS-TMfilter [153], SAPS [154]), secondary structures (impCOIL
written by Frank Eisenhaber following [155], Predator [156], SSCP [157,158]), targeting
signals (SIGCLEAVE [159], SignalP-3.0 [160], PTS1 [161]), posttranslational modifications
(big-PI [162], NMT [163], Prenylation) and a series of small sequence motifs (ELM, Prosite
patterns [164], BioMotif-IMPlibrary), homology searches with NCBI blast [138].
Construction of an EST annotation database
The statistical parameters and the alignment of all ESTs (not only the first best hit) mapped
to the sequences in the different databases were parsed from result files formatted as xml
blast results. Nucleotide genbank XML files were parsed for RefSeq id, definition, gene
identifier, organism, chromosome, chromosome map position, official gene abbreviation,
synonyms, Entrey Gene is, mouse genome informatics id, gene onthology terms, product
name, product information (definition, RefSeq, gi, length) and base pairs of open reading
frame. All parsed information and the IMP annotator uniform resource names (URN) of the
annotated proteins are stored in a relational PostGre database [165] which consists of the
tables: alignment, annotator, est, gb_nucleotide and map_method. Parsing, database
management system and user interface were implemented in the programming language Perl.
The protein annotation data remains in the IMP ANNOTATOR and is linked by a specific
URN.
Page 50
4.2. Transcriptional regulation of rate-limiting enzymes
Compiling an accurate and comprehensive list of rate-limiting proteins
Rate-limiting enzymes of high quality were extracted from the curated database
OMIM[119], the gene-centric hub GeneCard [73,74] and the enzyme database BRENDA
[120,121] with the key word “rate-limiting” and “rate-determining”. For a comprehensive
data set, Pubmed was searched for the key word “rate-limitation”. More than 15,000 entries
were hand-curated on basis of the abstract. The rate limitation was addressed for a pathway
or a macromolecular process. Entries were neglected in which a rate-limiting process of the
enzyme mechanism itself was described. Entrez Gene was used to address the diffuse name
space (synonyms).
Functional analysis of rate-limiting proteins
A set without isoenzymes was constructed to minimize different biases for functional
distribution analysis. The rate-limiting proteins were subjected to blastp with conservative
parameters (e-value = 1e-50, percent identity = 95%) to obtain only the identical protein in
KEGG [122]. The EC distribution was based on the first digit, which corresponds to the six
major enzyme classes. The detailed function analysis was carried out with the IMP
ANNOTATOR suite [80]. Only HMMER (e-value cutoff = 0.01) with the Pfam library was
used [166]. The integrated histogram was remodeled to count only the protein occurrences
and not the Pfam hit incidences.
Page 51
Position of rate-limiting proteins in the enzymatic network
The position in the enzymatic networks was analyzed with PathwayMapper [167] using the
KEGG pathways. The whole set of literature based rate-limiting enzymes was used and
mapped over the the RefSeq IDs.
ATGL knockout network analysis
Normalized gene expression data of a >27,000 EST mouse chip was provided by Montserrat
Pinent Armengol, Hubert Hackl and Juliane Strauss (IGB, TU Graz) (publication in
preparation). At least 2-fold up- or down-regulation compared to the wild type reference was
needed to be considered as significantly regulated. The disturbances of the ATGL knockout
mouse were analyzed with the IGB mousechip database (see above) which stores mapping
information, and links to sequence architecture und valuable 3rd party resources.
Transcriptional regulation of rate-limiting proteins during differentiation
Datasets of significantly regulated genes (defined by the authors of the regarding study) from
different developmental processes were analyzed: Fat cell differentiation (3T3-L1 cell line,
>27,000 EST mouse chip, 2-fold change in at least 4 time points) [2]; Fat cell differentiation
(MEF cell lines, >27,000 EST mouse chip 2-fold change in at least 4 time points)
(unpublished data); Development of skeletal muscle (C2C12, Affymetrix mouse
MG_U74Av2 and MG_U74Cv2 arrays, 2-fold change) [125]; Bile ductular differentiation
(HBC-3; 27,400 EST mouse chip, Significance Analysis for Microarray [126]); Smooth
muscle cell (A404 cells, Agilent G4120A Microarray, Significance analysis of microarrays)
[127]. Only enzymes defined by metabolic KEGG pathways were further considered. The
official gene symbols (one symbol includes all splice variants) were compared to the full
comprehensive rate-limiting list of this study.
Page 52
5. Bibliography
Reference List
1. Guilbert JJ: The world health report 2. Educ Health (Abingdon ) 2003, 16:230.
2. Hackl H, Burkard TR, Sturn A, Rubio R, Schleiffer A, Tian S, Quackenbush J, Eisenhaber F, Trajanoski Z: Molecular processes during fat cell development revealed by gene expression profiling and functional annotation. Genome Biol 2005, 6:R108.
3. TODARO GJ, GREEN H: Quantitative studies of the growth of mouse embryo cells in culture and their development into established lines. J Cell Biol 1963, 17:299-313.
4. GREEN H, Kehinde O: Sublines of Mouse 3T3 Cells That Accumulate Lipid. Cell 1974, 1:113-116.
5. Soukas A, Socci ND, Saatkamp BD, Novelli S, Friedman JM: Distinct transcriptional profiles of adipogenesis in vivo and in vitro. J Biol Chem 2001, 276:34167-34174.
6. Ross SE, Erickson RL, Gerin I, DeRose PM, Bajnok L, Longo KA, Misek DE, Kuick R, Hanash SM, Atkins KB et al.: Microarray analyses during adipogenesis: understanding the effects of Wnt signaling on adipogenesis and the roles of liver X receptor alpha in adipocyte metabolism. Mol Cell Biol 2002, 22:5989-5999.
7. Burton GR, Guan Y, Nagarajan R, McGehee RE: Microarray analysis of gene expression during early adipocyte differentiation. Gene 2002, 293:21-31.
8. Burton GR, McGehee REJ: Identification of candidate genes involved in the regulation of adipocyte differentiation using microarray-based gene expression profiling. Nutrition 2004, 20:109-114.
9. Burton GR, Nagarajan R, Peterson CA, McGehee REJ: Microarray analysis of differentiation-specific gene expression during 3T3-L1 adipogenesis. Gene 2004, 329:167-185.
10. Jessen BA, Stevens GJ: Expression profiling during adipocyte differentiation of 3T3-L1 fibroblasts. Gene 2002, 299:95-100.
Page 53
11. Gerhold DL, Liu F, Jiang G, Li Z, Xu J, Lu M, Sachs JR, Bagchi A, Fridman A, Holder DJ et al.: Gene expression profile of adipocyte differentiation and its regulation by peroxisome proliferator-activated receptor-gamma agonists. Endocrinology 2002, 143:2106-2118.
12. Guo X, Liao K: Analysis of gene expression profile during 3T3-L1 preadipocyte differentiation. Gene 2000, 251:45-53.
13. Ko MS, Kitchen JR, Wang X, Threat TA, Wang X, Hasegawa A, Sun T, Grahovac MJ, Kargul GJ, Lim MK et al.: Large-scale cDNA analysis reveals phased gene expression patterns during preimplantation mouse development. Development 2000, 127:1737-1749.
14. Soukas A, Socci ND, Saatkamp BD, Novelli S, Friedman JM: Distinct transcriptional profiles of adipogenesis in vivo and in vitro. J Biol Chem 2001, 276:34167-34174.
15. Macdougald OA, Lane MD: Transcriptional regulation of gene expression during adipocyte differentiation. Annu Rev Biochem 1995, 64:345-373.
16. Wise LS, GREEN H: Studies of lipoprotein lipase during the adipose conversion of 3T3 cells. Cell 1978, 13:233-242.
17. Hiragun A, Sato M, Mitsui H: Establishment of a clonal cell line that differentiates into adipose cells in vitro. In Vitro 1980, 16:685-693.
18. Rubin CS, Hirsch A, Fung C, Rosen OM: Development of hormone receptors and hormonal responsiveness in vitro. Insulin receptors and insulin sensitivity in the preadipocyte and adipocyte forms of 3T3-L1 cells. J Biol Chem 1978, 253:7570-7578.
19. Kuri-Harcuch W, GREEN H: Adipose conversion of 3T3 cells depends on a serum factor. Proc Natl Acad Sci U S A 1978, 75:6107-6109.
20. Bjorntorp P, Karlsson M, Gustafsson L, Smith U, Sjostrom L, Cigolini M, Storck G, Pettersson P: Quantitation of different cells in the epididymal fat pad of the rat. J Lipid Res 1979, 20:97-106.
21. Gregoire FM, Smas CM, Sul HS: Understanding adipocyte differentiation. Physiol Rev 1998, 78:783-809.
22. Moustaid N, Sul HS: Regulation of expression of the fatty acid synthase gene in 3T3-L1 cells by differentiation and triiodothyronine. J Biol Chem 1991, 266:18550-18554.
23. Wilkison WO, Min HY, Claffey KP, Satterberg BL, Spiegelman BM: Control of the adipsin gene in adipocyte differentiation. Identification of distinct nuclear factors binding to single- and double-stranded DNA. J Biol Chem 1990, 265:477-482.
Page 54
24. Larkin JE, Frank BC, Gaspard RM, Duka I, Gavras H, Quackenbush J: Cardiac transcriptional response to acute and chronic angiotensin II treatments. Physiol Genomics 2004, 18:152-166.
25. Tanaka TS, Jaradat SA, Lim MK, Kargul GJ, Wang X, Grahovac MJ, Pantano S, Sano Y, Piao Y, Nagaraja R et al.: Genome-wide expression profiling of mid-gestation placenta and embryo using a 15,000 mouse developmental cDNA microarray. Proc Natl Acad Sci U S A 2000, 97:9127-9132.
26. Richter A, Schwager C, Hentze S, Ansorge W, Hentze MW, Muckenthaler M: Comparison of fluorescent tag DNA labeling methods used for expression analysis by DNA microarrays. Biotechniques 2002, 33:620-8, 630.
27. Bork P, Dandekar T, Diaz-Lazcoz Y, Eisenhaber F, Huynen M, Yuan Y: Predicting function: from genes to genomes and back. J Mol Biol 1998, 283:707-725.
28. Zhang Z, Schwartz S, Wagner L, Miller W: A greedy algorithm for aligning DNA sequences. J Comput Biol 2000, 7:203-14.
29. Pruitt KD, Katz KS, Sicotte H, Maglott DR: Introducing RefSeq and LocusLink: curated human genome resources at the NCBI. Trends Genet 2000, 16:44-47.
30. Pruitt KD, Tatusova T, Maglott DR: NCBI Reference Sequence (RefSeq): a curated non-redundant sequence database of genomes, transcripts and proteins. Nucleic Acids Res 2005, 33 Database Issue:D501-D504.
31. Okazaki Y, Furuno M, Kasukawa T, Adachi J, Bono H, Kondo S, Nikaido I, Osato N, Saito R, Suzuki H et al.: Analysis of the mouse transcriptome based on functional annotation of 60,770 full-length cDNAs. Nature 2002, 420:563-573.
32. Schuler GD: Pieces of the puzzle: expressed sequence tags and the catalog of human genes. J Mol Med 1997, 75:694-698.
33. Quackenbush J, Liang F, Holt I, Pertea G, Upton J: The TIGR gene indices: reconstruction and representation of expressed gene sequences. Nucleic Acids Res 2000, 28:141-145.
34. Altschul SF, Gish W, Miller W, Myers EW, Lipman DJ: Basic local alignment search tool. J Mol Biol 1990, 215:403-10.
35. Ashburner M, Ball CA, Blake JA, Botstein D, Butler H, Cherry JM, Davis AP, Dolinski K, Dwight SS, Eppig JT et al.: Gene ontology: tool for the unification of biology. The Gene Ontology Consortium. Nat Genet 2000, 25:25-29.
36. Sturn A, Quackenbush J, Trajanoski Z: Genesis: cluster analysis of microarray data. Bioinformatics 2002, 18:207-208.
37. Gilks WR, Audit B, De Angelis D, Tsoka S, Ouzounis CA: Modeling the percolation of annotation errors in a database of protein sequences. Bioinformatics 2002, 18:1641-1649.
Page 55
38. Wootton JC, Federhen S: Analysis of compositionally biased regions in sequence databases. Methods Enzymol 1996, 266:554-71.
39. Brendel V, Bucher P, Nourbakhsh IR, Blaisdell BE, Karlin S: Methods and algorithms for statistical analysis of protein sequences. Proc Natl Acad Sci U S A 1992, 89:2002-6.
40. Promponas VJ, Enright AJ, Tsoka S, Kreil DP, Leroy C, Hamodrakas S, Sander C, Ouzounis CA: CAST: an iterative algorithm for the complexity analysis of sequence tracts. Complexity analysis of sequence tracts. Bioinformatics 2000, 16:915-22.
41. Linding R, Russell RB, Neduva V, Gibson TJ: GlobPlot: Exploring protein sequences for globularity and disorder. Nucleic Acids Res 2003, 31:3701-8.
42. Bendtsen JD, Nielsen H, von Heijne G, Brunak S: Improved prediction of signal peptides: SignalP 3.0. J Mol Biol 2004, 340:783-95.
43. von Heijne G: A new method for predicting signal sequence cleavage sites. Nucleic Acids Res 1986, 14:4683-90.
44. Neuberger G, Kunze M, Eisenhaber F, Berger J, Hartig A, Brocard C: Hidden localization motifs: naturally occurring peroxisomal targeting signals in non-peroxisomal proteins. Genome Biol 2004, 5:R97.
45. Neuberger G, Maurer-Stroh S, Eisenhaber B, Hartig A, Eisenhaber F: Prediction of peroxisomal targeting signal 1 containing proteins from amino acid sequence. J Mol Biol 2003, 328:581-592.
46. Neuberger G, Maurer-Stroh S, Eisenhaber B, Hartig A, Eisenhaber F: Motif refinement of the peroxisomal targeting signal 1 and evaluation of taxon-specific differences. J Mol Biol 2003, 328:567-579.
47. Eisenhaber B, Bork P, Eisenhaber F: Prediction of potential GPI-modification sites in proprotein sequences. J Mol Biol 1999, 292:741-58.
48. Eisenhaber B, Wildpaner M, Schultz CJ, Borner GH, Dupree P, Eisenhaber F: Glycosylphosphatidylinositol lipid anchoring of plant proteins. Sensitive prediction from sequence- and genome-wide studies for Arabidopsis and rice. Plant Physiol 2003, 133:1691-1701.
49. Eisenhaber B, Schneider G, Wildpaner M, Eisenhaber F: A sensitive predictor for potential GPI lipid modification sites in fungal protein sequences and its application to genome-wide studies for Aspergillus nidulans, Candida albicans, Neurospora crassa, Saccharomyces cerevisiae and Schizosaccharomyces pombe. J Mol Biol 2004, 337:243-253.
50. Maurer-Stroh S, Eisenhaber B, Eisenhaber F: N-terminal N-myristoylation of proteins: prediction of substrate proteins from amino acid sequence. J Mol Biol 2002, 317:541-57.
Page 56
51. Maurer-Stroh S, Eisenhaber F: Refinement and prediction of protein prenylation motifs. Genome Biology 2005, 6:R55.
52. Tusnady GE, Simon I: Principles governing amino acid composition of integral membrane proteins: application to topology prediction. J Mol Biol 1998, 283:489-506.
53. Cserzo M, Eisenhaber F, Eisenhaber B, Simon I: On filtering false positive transmembrane protein predictions. Protein Eng 2002, 15:745-52.
54. Lupas A, Van Dyke M, Stock J: Predicting coiled coils from protein sequences. Science 1991, 252:1162-4.
55. Eisenhaber F, Imperiale F, Argos P, Frommel C: Prediction of secondary structural content of proteins from their amino acid composition alone. I. New analytic vector decomposition methods. Proteins 1996, 25:157-68.
56. Eisenhaber F, Frommel C, Argos P: Prediction of secondary structural content of proteins from their amino acid composition alone. II. The paradox with secondary structural class. Proteins 1996, 25:169-79.
57. Frishman D, Argos P: Incorporation of non-local interactions in protein secondary structure prediction from the amino acid sequence. Protein Eng 1996, 9:133-42.
58. Letunic I, Copley RR, Schmidt S, Ciccarelli FD, Doerks T, Schultz J, Ponting CP, Bork P: SMART 4.0: towards genomic data integration. Nucleic Acids Res 2004, 32 Database issue:142-4.
59. Marchler-Bauer A, Panchenko AR, Shoemaker BA, Thiessen PA, Geer LY, Bryant SH: CDD: a database of conserved domain alignments with links to domain three-dimensional structure. Nucleic Acids Res 2002, 30:281-3.
60. Schaffer AA, Wolf YI, Ponting CP, Koonin EV, Aravind L, Altschul SF: IMPALA: matching a protein sequence against a collection of PSI-BLAST-constructed position-specific score matrices. Bioinformatics 1999, 15:1000-11.
61. Sigrist CJ, Cerutti L, Hulo N, Gattiker A, Falquet L, Pagni M, Bairoch A, Bucher P: PROSITE: a documented database using patterns and profiles as motif descriptors. Brief Bioinform 2002, 3:265-74.
62. Schaffer AA, Aravind L, Madden TL, Shavirin S, Spouge JL, Wolf YI, Koonin EV, Altschul SF: Improving the accuracy of PSI-BLAST protein database searches with composition-based statistics and other refinements. Nucleic Acids Res 2001, 29:2994-3005.
63. Altschul SF, Koonin EV: Iterated profile searches with PSI-BLAST--a tool for discovery in protein databases. Trends Biochem Sci 1998, 23:444-447.

Page 57
64. Altschul SF, Madden TL, Schaffer AA, Zhang J, Zhang Z, Miller W, Lipman DJ: Gapped BLAST and PSI-BLAST: a new generation of protein database search programs. Nucleic Acids Res 1997, 25:3389-3402.
65. Wistrand M, Sonnhammer EL: Improved profile HMM performance by assessment of critical algorithmic features in SAM and HMMER. BMC Bioinformatics 2005, 6:99.
66. Wistrand M, Sonnhammer EL: Improving profile HMM discrimination by adapting transition probabilities. J Mol Biol 2004, 338:847-854.
67. Burkard TR: Gene expression analysis of 3T3-L1 cell lines during differentiation. 2003.
68. Brown GC: Total cell protein concentration as an evolutionary constraint on the metabolic control distribution in cells. J Theor Biol 1991, 153:195-203.
69. IUPAC Compendium of Chemical Terminology, Electronic version, http://goldbook.iupac.org/R05140.html. 2007.
70. Maglott D, Ostell J, Pruitt KD, Tatusova T: Entrez Gene: gene-centered information at NCBI. Nucleic Acids Res 2005, 33:D54-D58.
71. Maglott D, Ostell J, Pruitt KD, Tatusova T: Entrez Gene: gene-centered information at NCBI. Nucleic Acids Res 2007, 35:D26-D31.
72. Eppig JT, Bult CJ, Kadin JA, Richardson JE, Blake JA, Anagnostopoulos A, Baldarelli RM, Baya M, Beal JS, Bello SM et al.: The Mouse Genome Database (MGD): from genes to mice--a community resource for mouse biology. Nucleic Acids Res 2005, 33:D471-D475.
73. Rebhan M, Chalifa-Caspi V, Prilusky J, Lancet D: GeneCards: a novel functional genomics compendium with automated data mining and query reformulation support. Bioinformatics 1998, 14:656-664.
74. Rebhan M, Chalifa-Caspi V, Prilusky J, Lancet D: GeneCards: integrating information about genes, proteins and diseases. Trends Genet 1997, 13:163.
75. Bairoch A, Boeckmann B, Ferro S, Gasteiger E: Swiss-Prot: juggling between evolution and stability. Brief Bioinform 2004, 5:39-55.
76. Su AI, Cooke MP, Ching KA, Hakak Y, Walker JR, Wiltshire T, Orth AP, Vega RG, Sapinoso LM, Moqrich A et al.: Large-scale analysis of the human and mouse transcriptomes. Proc Natl Acad Sci U S A 2002, 99:4465-4470.
77. Edgar R, Domrachev M, Lash AE: Gene Expression Omnibus: NCBI gene expression and hybridization array data repository. Nucleic Acids Res 2002, 30:207-210.
Page 58
78. Barrett T, Troup DB, Wilhite SE, Ledoux P, Rudnev D, Evangelista C, Kim IF, Soboleva A, Tomashevsky M, Edgar R: NCBI GEO: mining tens of millions of expression profiles--database and tools update. Nucleic Acids Res 2007, 35:D760-D765.
79. Shmueli O, Horn-Saban S, Chalifa-Caspi V, Shmoish M, Ophir R, Benjamin-Rodrig H, Safran M, Domany E, Lancet D: GeneNote: whole genome expression profiles in normal human tissues. C R Biol 2003, 326:1067-1072.
80. Schneider G, Wildpaner M, Kozlovszky M, Kubina W, Leitner F, Novatchkova M, Schleiffer A, Sun T, Eisenhaber F: The ANNOTATOR software suite [abstract]. [http://www iscb org/ismb2005/demos/15 pdf] 2005,
81. Su AI, Wiltshire T, Batalov S, Lapp H, Ching KA, Block D, Zhang J, Soden R, Hayakawa M, Kreiman G: A gene atlas of the mouse and human protein-encoding transcriptomes. Proc Natl Acad Sci U S A 2004, 101:6062-6067.
82. Soukas A, Socci ND, Saatkamp BD, Novelli S, Friedman JM: Distinct transcriptional profiles of adipogenesis in vivo and in vitro. J Biol Chem 2001, 276:34167-34174.
83. Soukas A, Socci ND, Saatkamp BD, Novelli S, Friedman JM: Distinct transcriptional profiles of adipogenesis in vivo and in vitro. J Biol Chem 2001, 276:34167-34174.
84. Zimmermann R, Strauss JG, Haemmerle G, Schoiswohl G, Birner-Gruenberger R, Riederer M, Lass A, Neuberger G, Eisenhaber F, Hermetter A et al.: Fat mobilization in adipose tissue is promoted by adipose triglyceride lipase. Science 2004, 306:1383-1386.
85. Fukuhara A, Matsuda M, Nishizawa M, Segawa K, Tanaka M, Kishimoto K, Matsuki Y, Murakami M, Ichisaka T, Murakami H: Visfatin: a protein secreted by visceral fat that mimics the effects of insulin. Science 2005, 307:426-430.
86. Kitani T, Okuno S, Fujisawa H: Growth phase-dependent changes in the subcellular localization of pre-B-cell colony-enhancing factor. FEBS Lett 2003, 544:74-78.
87. Revollo JR, Grimm AA, Imai S: The NAD biosynthesis pathway mediated by nicotinamide phosphoribosyltransferase regulates Sir2 activity in mammalian cells. J Biol Chem 2004, 279:50754-50763.
88. Jessen BA, Stevens GJ: Expression profiling during adipocyte differentiation of 3T3-L1 fibroblasts. Gene 2002, 299:95-100.
89. Oishi Y, Manabe I, Tobe K, Tsushima K, Shindo T, Fujiu K, Nishimura G, Maemura K, Yamauchi T, Kubota N et al.: Kruppel-like transcription factor KLF5 is a key regulator of adipocyte differentiation. Cell Metab 2005, 1:27-39.
Page 59
90. Tang QQ, Otto TC, Lane MD: Mitotic clonal expansion: A synchronous process required for adipogenesis. Proc Natl Acad Sci U S A 2003, 100:44-49.
91. Yabuta N, Kajimura N, Mayanagi K, Sato M, Gotow T, Uchiyama Y, Ishimi Y, Nojima H: Mammalian Mcm2/4/6/7 complex forms a toroidal structure. Genes Cells 2003, 8:413-421.
92. Li X, Rosenfeld MG: Transcription: origins of licensing control. Nature 2004, 427:687-688.
93. Vassin VM, Wold MS, Borowiec JA: Replication protein A (RPA) phosphorylation prevents RPA association with replication centers. Mol Cell Biol 2004, 24:1930-1943.
94. Kim HS, Brill SJ: Rfc4 interacts with Rpa1 and is required for both DNA replication and DNA damage checkpoints in Saccharomyces cerevisiae. Mol Cell Biol 2001, 21:3725-3737.
95. Larsen E, Gran C, Saether BE, Seeberg E, Klungland A: Proliferation failure and gamma radiation sensitivity of Fen1 null mutant mice at the blastocyst stage. Mol Cell Biol 2003, 23:5346-5353.
96. Waga S, Bauer G, Stillman B: Reconstitution of complete SV40 DNA replication with purified replication factors. J Biol Chem 1994, 269:10923-10934.
97. Stark JM, Hu P, Pierce AJ, Moynahan ME, Ellis N, Jasin M: ATP hydrolysis by mammalian RAD51 has a key role during homology-directed DNA repair. J Biol Chem 2002, 277:20185-20194.
98. Kunitoku N, Sasayama T, Marumoto T, Zhang D, Honda S, Kobayashi O, Hatakeyama K, Ushio Y, Saya H, Hirota T: CENP-A phosphorylation by Aurora-A in prophase is required for enrichment of Aurora-B at inner centromeres and for kinetochore function. Dev Cell 2003, 5:853-864.
99. Weis K: Regulating access to the genome: nucleocytoplasmic transport throughout the cell cycle. Cell 2003, 112:441-451.
100. Trieselmann N, Armstrong S, Rauw J, Wilde A: Ran modulates spindle assembly by regulating a subset of TPX2 and Kid activities including Aurora A activation. J Cell Sci 2003, 116:4791-4798.
101. Hirota T, Kunitoku N, Sasayama T, Marumoto T, Zhang D, Nitta M, Hatakeyama K, Saya H: Aurora-A and an interacting activator, the LIM protein Ajuba, are required for mitotic commitment in human cells. Cell 2003, 114:585-598.
102. Wansa KD, Harris JM, Muscat GE: The activation function-1 domain of Nur77/NR4A1 mediates trans-activation, cell specificity, and coactivator recruitment. J Biol Chem 2002, 277:33001-33011.
Page 60
103. Lupas A: Predicting coiled-coil regions in proteins. Curr Opin Struct Biol 1997, 7:388-393.
104. Aoki K, Sun YJ, Aoki S, Wada K, Wada E: Cloning, expression, and mapping of a gene that is upregulated in adipose tissue of mice deficient in bombesin receptor subtype-3. Biochem Biophys Res Commun 2002, 290:1282-1288.
105. King T, Bland Y, Webb S, Barton S, Brown NA: Expression of Peg1 (Mest) in the developing mouse heart: involvement in trabeculation. Dev Dyn 2002, 225:212-215.
106. Kamei Y, Suganami T, Kohda T, Ishino F, Yasuda K, Miura S, Ezaki O, Ogawa Y: Peg1/Mest in obese adipose tissue is expressed from the paternal allele in an isoform-specific manner. FEBS Lett 2007, 581:91-96.
107. Takahashi M, Kamei Y, Ezaki O: Mest/Peg1 imprinted gene enlarges adipocytes and is a marker of adipocyte size. Am J Physiol Endocrinol Metab 2005, 288:E117-E124.
108. Pogge vS, Senkel S, Ryffel GU: ERH (enhancer of rudimentary homologue), a conserved factor identical between frog and human, is a transcriptional repressor. Biol Chem 2001, 382:1379-1385.
109. Scott JE: Proteodermatan and proteokeratan sulfate (decorin, lumican/fibromodulin) proteins are horseshoe shaped. Implications for their interactions with collagen. Biochemistry 1996, 35:8795-8799.
110. Hildebrand A, Romaris M, Rasmussen LM, Heinegard D, Twardzik DR, Border WA, Ruoslahti E: Interaction of the small interstitial proteoglycans biglycan, decorin and fibromodulin with transforming growth factor beta. Biochem J 1994, 302 ( Pt 2):527-534.
111. Riquelme C, Larrain J, Schonherr E, Henriquez JP, Kresse H, Brandan E: Antisense inhibition of decorin expression in myoblasts decreases cell responsiveness to transforming growth factor beta and accelerates skeletal muscle differentiation. J Biol Chem 2001, 276:3589-3596.
112. Comalada M, Cardo M, Xaus J, Valledor AF, Lloberas J, Ventura F, Celada A: Decorin reverses the repressive effect of autocrine-produced TGF-beta on mouse macrophage activation. J Immunol 2003, 170:4450-4456.
113. Gurniak CB, Berg LJ: A new member of the Eph family of receptors that lacks protein tyrosine kinase activity. Oncogene 1996, 13:777-786.
114. Luo H, Yu G, Tremblay J, Wu J: EphB6-null mutation results in compromised T cell function. J Clin Invest 2004, 114:1762-1773.
115. Boudeau J, Miranda-Saavedra D, Barton GJ, Alessi DR: Emerging roles of pseudokinases. Trends Cell Biol 2006, 16:443-452.
Page 61
116. Hafner C, Schmitz G, Meyer S, Bataille F, Hau P, Langmann T, Dietmaier W, Landthaler M, Vogt T: Differential gene expression of Eph receptors and ephrins in benign human tissues and cancers. Clin Chem 2004, 50:490-499.
117. Kim JB, Spotts GD, Halvorsen YD, Shih HM, Ellenberger T, Towle HC, Spiegelman BM: Dual DNA binding specificity of ADD1/SREBP1 controlled by a single amino acid in the basic helix-loop-helix domain. Mol Cell Biol 1995, 15:2582-2588.
118. Klipp E, Heinrich R, Holzhutter HG: Prediction of temporal gene expression. Metabolic opimization by re-distribution of enzyme activities. Eur J Biochem 2002, 269:5406-5413.
119. McKusick VA: Mendelian Inheritance in Man and Its Online Version, OMIM. Am J Hum Genet 2007, 80:588-604.
120. Schomburg I, Chang A, Schomburg D: BRENDA, enzyme data and metabolic information. Nucleic Acids Res 2002, 30:47-49.
121. Schomburg I, Chang A, Hofmann O, Ebeling C, Ehrentreich F, Schomburg D: BRENDA: a resource for enzyme data and metabolic information. Trends Biochem Sci 2002, 27:54-56.
122. Kanehisa M, Goto S, Hattori M, Aoki-Kinoshita KF, Itoh M, Kawashima S, Katayama T, Araki M, Hirakawa M: From genomics to chemical genomics: new developments in KEGG. Nucleic Acids Res 2006, 34:D354-D357.
123. Voet D, Voet JG: Biochemie. Weinheim (Germany): VHC Verlagsgesellschaft; 1994.
124. Haemmerle G, Lass A, Zimmermann R, Gorkiewicz G, Meyer C, Rozman J, Heldmaier G, Maier R, Theussl C, Eder S et al.: Defective lipolysis and altered energy metabolism in mice lacking adipose triglyceride lipase. Science 2006, 312:734-737.
125. Tomczak KK, Marinescu VD, Ramoni MF, Sanoudou D, Montanaro F, Han M, Kunkel LM, Kohane IS, Beggs AH: Expression profiling and identification of novel genes involved in myogenic differentiation. FASEB J 2004, 18:403-405.
126. Ader T, Norel R, Levoci L, Rogler LE: Transcriptional profiling implicates TGFbeta/BMP and Notch signaling pathways in ductular differentiation of fetal murine hepatoblasts. Mech Dev 2006, 123:177-194.
127. Spin JM, Nallamshetty S, Tabibiazar R, Ashley EA, King JY, Chen M, Tsao PS, Quertermous T: Transcriptional profiling of in vitro smooth muscle cell differentiation identifies specific patterns of gene and pathway activation. Physiol Genomics 2004, 19:292-302.
Page 62
128. Soukas A, Socci ND, Saatkamp BD, Novelli S, Friedman JM: Distinct transcriptional profiles of adipogenesis in vivo and in vitro. J Biol Chem 2001, 276:34167-34174.
129. Soukas A, Socci ND, Saatkamp BD, Novelli S, Friedman JM: Distinct transcriptional profiles of adipogenesis in vivo and in vitro. J Biol Chem 2001, 276:34167-34174.
130. Novatchkova M, Eisenhaber F: Can molecular mechanisms of biological processes be extracted from expression profiles? Case study: endothelial contribution to tumor-induced angiogenesis. Bioessays 2001, 23:1159-1175.
131. Yokoyama C, Wang X, Briggs MR, Admon A, Wu J, Hua X, Goldstein JL, Brown MS: SREBP-1, a basic-helix-loop-helix-leucine zipper protein that controls transcription of the low density lipoprotein receptor gene. Cell 1993, 75:187-197.
132. Brown GC: Total cell protein concentration as an evolutionary constraint on the metabolic control distribution in cells. J Theor Biol 1991, 153:195-203.
133. Zhang Z, Schwartz S, Wagner L, Miller W: A greedy algorithm for aligning DNA sequences. J Comput Biol 2000, 7:203-214.
134. Pruitt KD, Katz KS, Sicotte H, Maglott DR: Introducing RefSeq and LocusLink: curated human genome resources at the NCBI. Trends Genet 2000, 16:44-47.
135. Pruitt KD, Tatusova T, Maglott DR: NCBI Reference Sequence (RefSeq): a curated non-redundant sequence database of genomes, transcripts and proteins. Nucleic Acids Res 2005, 33 Database Issue:D501-D504.
136. Okazaki Y, Furuno M, Kasukawa T, Adachi J, Bono H, Kondo S, Nikaido I, Osato N, Saito R, Suzuki H et al.: Analysis of the mouse transcriptome based on functional annotation of 60,770 full-length cDNAs. Nature 2002, 420:563-573.
137. Schuler GD: Pieces of the puzzle: expressed sequence tags and the catalog of human genes. J Mol Med 1997, 75:694-698.
138. Altschul SF, Gish W, Miller W, Myers EW, Lipman DJ: Basic local alignment search tool. J Mol Biol 1990, 215:403-410.
139. Hubbard T, Barker D, Birney E, Cameron G, Chen Y, Clark L, Cox T, Cuff J, Curwen V, Down T et al.: The Ensembl genome database project. Nucleic Acids Res 2002, 30:38-41.
140. Large Scale Sequence Annotation System, Research Institute of Molecular Pathology (IMP), Bioinformatics Group, Vienna [http://annotator.imp.univie.ac.at/]
Page 63
141. Brendel V, Bucher P, Nourbakhsh IR, Blaisdell BE, Karlin S: Methods and algorithms for statistical analysis of protein sequences. Proc Natl Acad Sci U S A 1992, 89:2002-2006.
142. Promponas VJ, Enright AJ, Tsoka S, Kreil DP, Leroy C, Hamodrakas S, Sander C, Ouzounis CA: CAST: an iterative algorithm for the complexity analysis of sequence tracts. Complexity analysis of sequence tracts. Bioinformatics 2000, 16:915-922.
143. Wootton JC, Federhen S: Analysis of compositionally biased regions in sequence databases. Methods Enzymol 1996, 266:554-571.
144. Sonnhammer EL, Eddy SR, Birney E, Bateman A, Durbin R: Pfam: multiple sequence alignments and HMM-profiles of protein domains. Nucleic Acids Res 1998, 26:320-322.
145. Letunic I, Copley RR, Schmidt S, Ciccarelli FD, Doerks T, Schultz J, Ponting CP, Bork P: SMART 4.0: towards genomic data integration. Nucleic Acids Res 2004, 32:D142-D144.
146. Sigrist CJ, Cerutti L, Hulo N, Gattiker A, Falquet L, Pagni M, Bairoch A, Bucher P: PROSITE: a documented database using patterns and profiles as motif descriptors. Brief Bioinform 2002, 3:265-274.
147. Sigrist CJ, Cerutti L, Hulo N, Gattiker A, Falquet L, Pagni M, Bairoch A, Bucher P: PROSITE: a documented database using patterns and profiles as motif descriptors. Brief Bioinform 2002, 3:265-274.
148. Marchler-Bauer A, Panchenko AR, Shoemaker BA, Thiessen PA, Geer LY, Bryant SH: CDD: a database of conserved domain alignments with links to domain three-dimensional structure. Nucleic Acids Res 2002, 30:281-283.
149. Schaffer AA, Wolf YI, Ponting CP, Koonin EV, Aravind L, Altschul SF: IMPALA: matching a protein sequence against a collection of PSI-BLAST-constructed position-specific score matrices. Bioinformatics 1999, 15:1000-1011.
150. Sigrist CJ, Cerutti L, Hulo N, Gattiker A, Falquet L, Pagni M, Bairoch A, Bucher P: PROSITE: a documented database using patterns and profiles as motif descriptors. Brief Bioinform 2002, 3:265-274.
151. Tusnady GE, Simon I: Principles governing amino acid composition of integral membrane proteins: application to topology prediction. J Mol Biol 1998, 283:489-506.
152. von Heijne G: Membrane protein structure prediction. Hydrophobicity analysis and the positive-inside rule. J Mol Biol 1992, 225:487-494.
153. Cserzo M, Eisenhaber F, Eisenhaber B, Simon I: On filtering false positive transmembrane protein predictions. Protein Eng 2002, 15:745-752.
Page 64
154. Brendel V, Bucher P, Nourbakhsh IR, Blaisdell BE, Karlin S: Methods and algorithms for statistical analysis of protein sequences. Proc Natl Acad Sci U S A 1992, 89:2002-2006.
155. Lupas A, Van Dyke M, Stock J: Predicting coiled coils from protein sequences. Science 1991, 252:1162-1164.
156. Frishman D, Argos P: Incorporation of non-local interactions in protein secondary structure prediction from the amino acid sequence. Protein Eng 1996, 9:133-142.
157. Eisenhaber F, Imperiale F, Argos P, Frommel C: Prediction of secondary structural content of proteins from their amino acid composition alone. I. New analytic vector decomposition methods. Proteins 1996, 25:157-168.
158. Eisenhaber F, Frommel C, Argos P: Prediction of secondary structural content of proteins from their amino acid composition alone. II. The paradox with secondary structural class. Proteins 1996, 25:169-179.
159. von Heijne G: A new method for predicting signal sequence cleavage sites. Nucleic Acids Res 1986, 14:4683-4690.
160. Bendtsen JD, Nielsen H, von Heijne G, Brunak S: Improved prediction of signal peptides: SignalP 3.0. J Mol Biol 2004, 340:783-795.
161. Eisenhaber B, Eisenhaber F, Maurer-Stroh S, Neuberger G: Prediction of sequence signals for lipid post-translational modifications: insights from case studies. Proteomics 2004, 4:1614-1625.
162. Eisenhaber B, Bork P, Eisenhaber F: Prediction of potential GPI-modification sites in proprotein sequences. J Mol Biol 1999, 292:741-758.
163. Maurer-Stroh S, Eisenhaber B, Eisenhaber F: N-terminal N-myristoylation of proteins: prediction of substrate proteins from amino acid sequence. J Mol Biol 2002, 317:541-557.
164. Sigrist CJ, Cerutti L, Hulo N, Gattiker A, Falquet L, Pagni M, Bairoch A, Bucher P: PROSITE: a documented database using patterns and profiles as motif descriptors. Brief Bioinform 2002, 3:265-274.
165. http://www.postgresql.org/. 2007.
166. Sonnhammer EL, Eddy SR, Birney E, Bateman A, Durbin R: Pfam: multiple sequence alignments and HMM-profiles of protein domains. Nucleic Acids Res 1998, 26:320-322.
167. Mlecnik B, Scheideler M, Hackl H, Hartler J, Sanchez-Cabo F, Trajanoski Z: PathwayExplorer: web service for visualizing high-throughput expression data on biological pathways. Nucleic Acids Res 2005, 33:W633-W637.
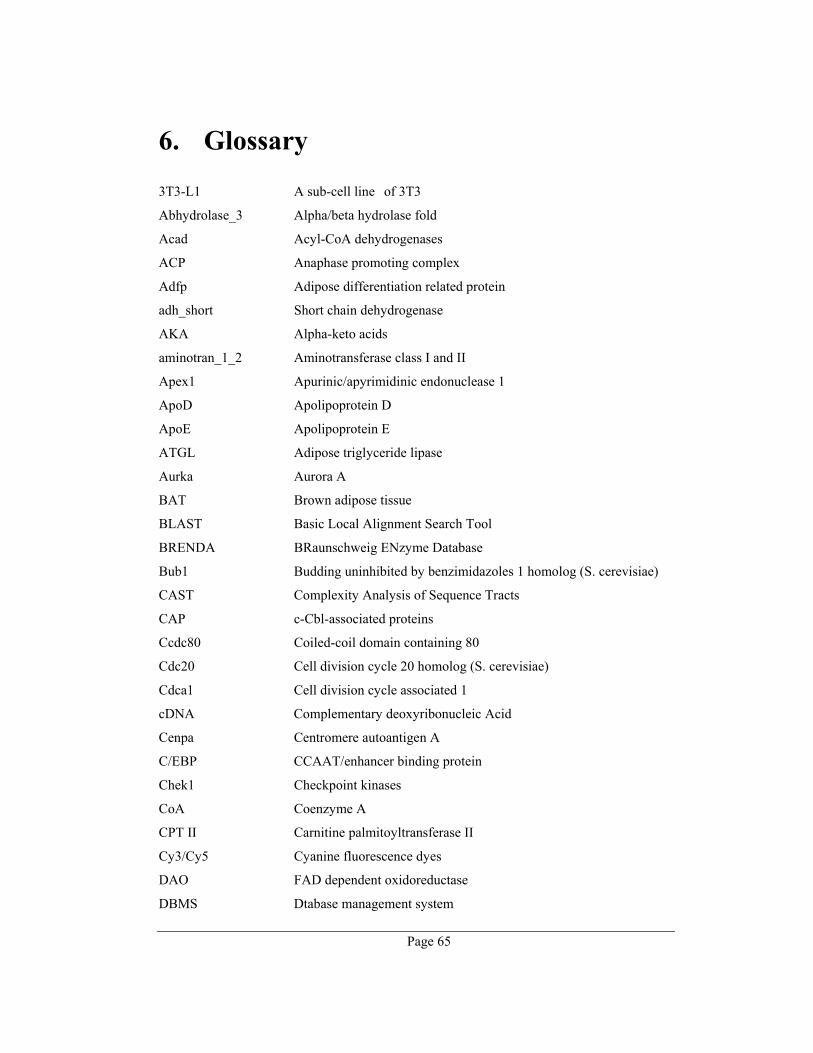
Page 65
6. Glossary
3T3-L1 A sub-cell line of 3T3
Abhydrolase_3 Alpha/beta hydrolase fold
Acad Acyl-CoA dehydrogenases
ACP Anaphase promoting complex
Adfp Adipose differentiation related protein
adh_short Short chain dehydrogenase
AKA Alpha-keto acids
aminotran_1_2 Aminotransferase class I and II
Apex1 Apurinic/apyrimidinic endonuclease 1
ApoD Apolipoprotein D
ApoE Apolipoprotein E
ATGL Adipose triglyceride lipase
Aurka Aurora A
BAT Brown adipose tissue
BLAST Basic Local Alignment Search Tool
BRENDA BRaunschweig ENzyme Database
Bub1 Budding uninhibited by benzimidazoles 1 homolog (S. cerevisiae)
CAST Complexity Analysis of Sequence Tracts
CAP c-Cbl-associated proteins
Ccdc80 Coiled-coil domain containing 80
Cdc20 Cell division cycle 20 homolog (S. cerevisiae)
Cdca1 Cell division cycle associated 1
cDNA Complementary deoxyribonucleic Acid
Cenpa Centromere autoantigen A
C/EBP CCAAT/enhancer binding protein
Chek1 Checkpoint kinases
CoA Coenzyme A
CPT II Carnitine palmitoyltransferase II
Cy3/Cy5 Cyanine fluorescence dyes
DAO FAD dependent oxidoreductase
DBMS Dtabase management system
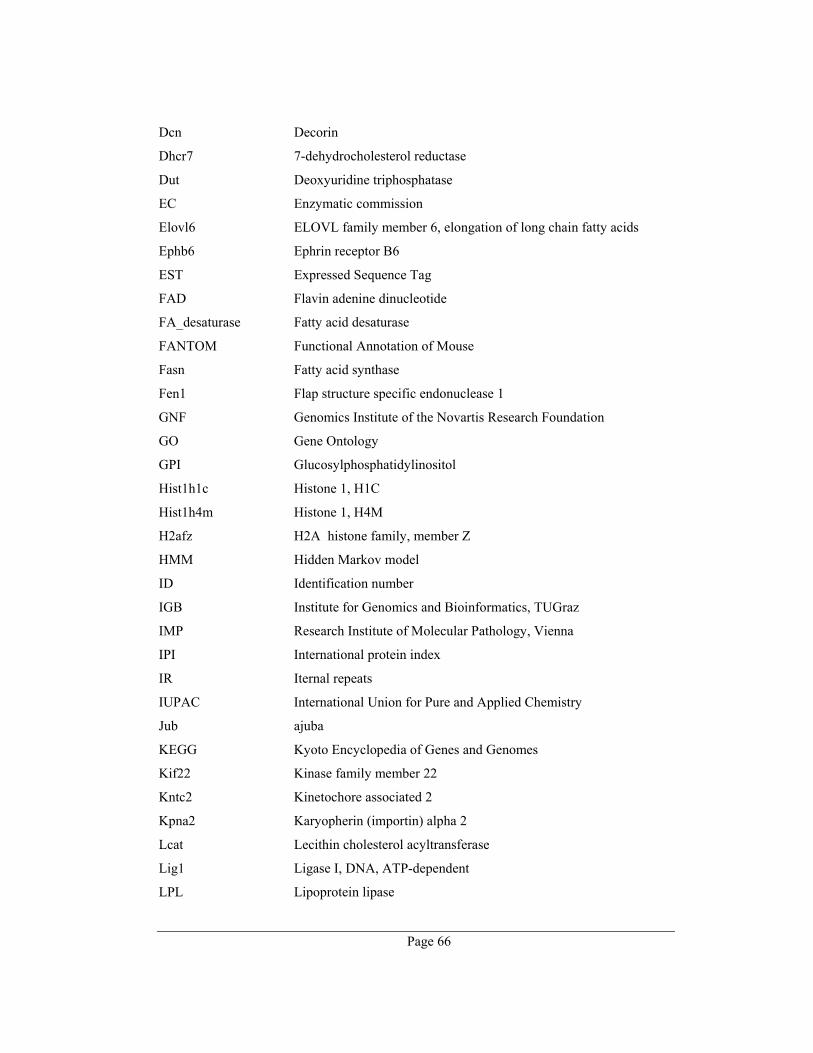
Page 66
Dcn Decorin
Dhcr7 7-dehydrocholesterol reductase
Dut Deoxyuridine triphosphatase
EC Enzymatic commission
Elovl6 ELOVL family member 6, elongation of long chain fatty acids
Ephb6 Ephrin receptor B6
EST Expressed Sequence Tag
FAD Flavin adenine dinucleotide
FA_desaturase Fatty acid desaturase
FANTOM Functional Annotation of Mouse
Fasn Fatty acid synthase
Fen1 Flap structure specific endonuclease 1
GNF Genomics Institute of the Novartis Research Foundation
GO Gene Ontology
GPI Glucosylphosphatidylinositol
Hist1h1c Histone 1, H1C
Hist1h4m Histone 1, H4M
H2afz H2A histone family, member Z
HMM Hidden Markov model
ID Identification number
IGB Institute for Genomics and Bioinformatics, TUGraz
IMP Research Institute of Molecular Pathology, Vienna
IPI International protein index
IR Iternal repeats
IUPAC International Union for Pure and Applied Chemistry
Jub ajuba
KEGG Kyoto Encyclopedia of Genes and Genomes
Kif22 Kinase family member 22
Kntc2 Kinetochore associated 2
Kpna2 Karyopherin (importin) alpha 2
Lcat Lecithin cholesterol acyltransferase
Lig1 Ligase I, DNA, ATP-dependent
LPL Lipoprotein lipase
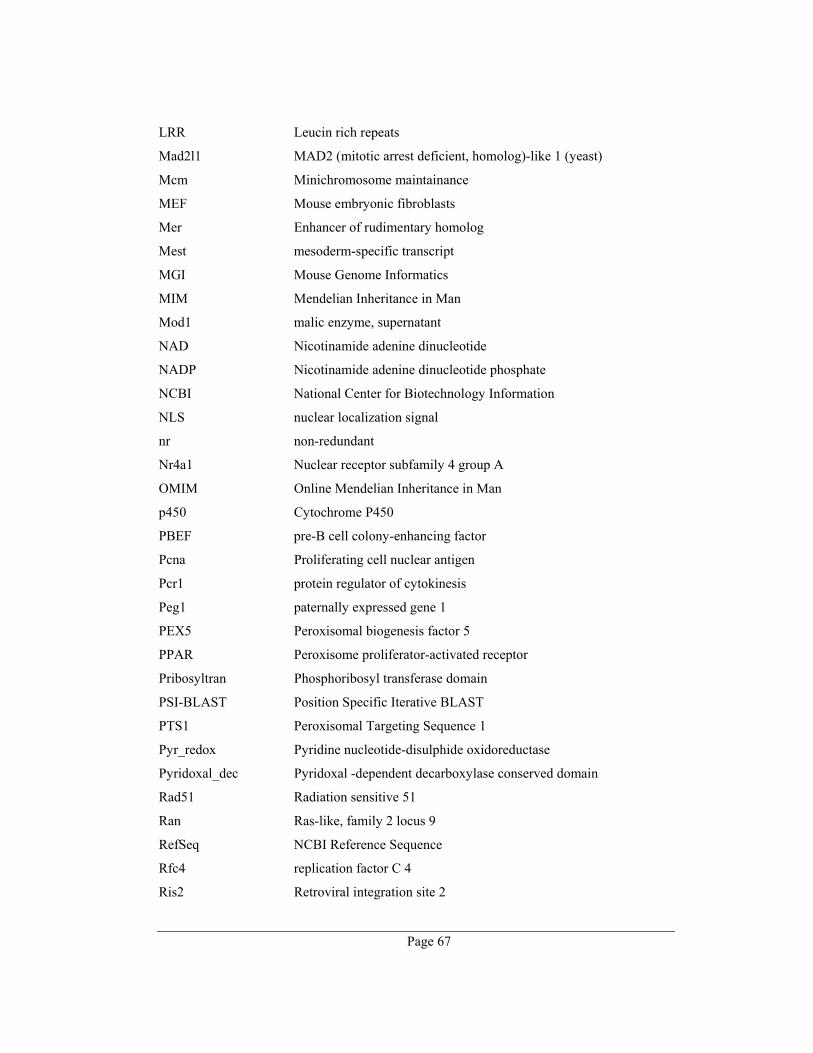
Page 67
LRR Leucin rich repeats
Mad2l1 MAD2 (mitotic arrest deficient, homolog)-like 1 (yeast)
Mcm Minichromosome maintainance
MEF Mouse embryonic fibroblasts
Mer Enhancer of rudimentary homolog
Mest mesoderm-specific transcript
MGI Mouse Genome Informatics
MIM Mendelian Inheritance in Man
Mod1 malic enzyme, supernatant
NAD Nicotinamide adenine dinucleotide
NADP Nicotinamide adenine dinucleotide phosphate
NCBI National Center for Biotechnology Information
NLS nuclear localization signal
nr non-redundant
Nr4a1 Nuclear receptor subfamily 4 group A
OMIM Online Mendelian Inheritance in Man
p450 Cytochrome P450
PBEF pre-B cell colony-enhancing factor
Pcna Proliferating cell nuclear antigen
Pcr1 protein regulator of cytokinesis
Peg1 paternally expressed gene 1
PEX5 Peroxisomal biogenesis factor 5
PPAR Peroxisome proliferator-activated receptor
Pribosyltran Phosphoribosyl transferase domain
PSI-BLAST Position Specific Iterative BLAST
PTS1 Peroxisomal Targeting Sequence 1
Pyr_redox Pyridine nucleotide-disulphide oxidoreductase
Pyridoxal_dec Pyridoxal -dependent decarboxylase conserved domain
Rad51 Radiation sensitive 51
Ran Ras-like, family 2 locus 9
RefSeq NCBI Reference Sequence
Rfc4 replication factor C 4
Ris2 Retroviral integration site 2
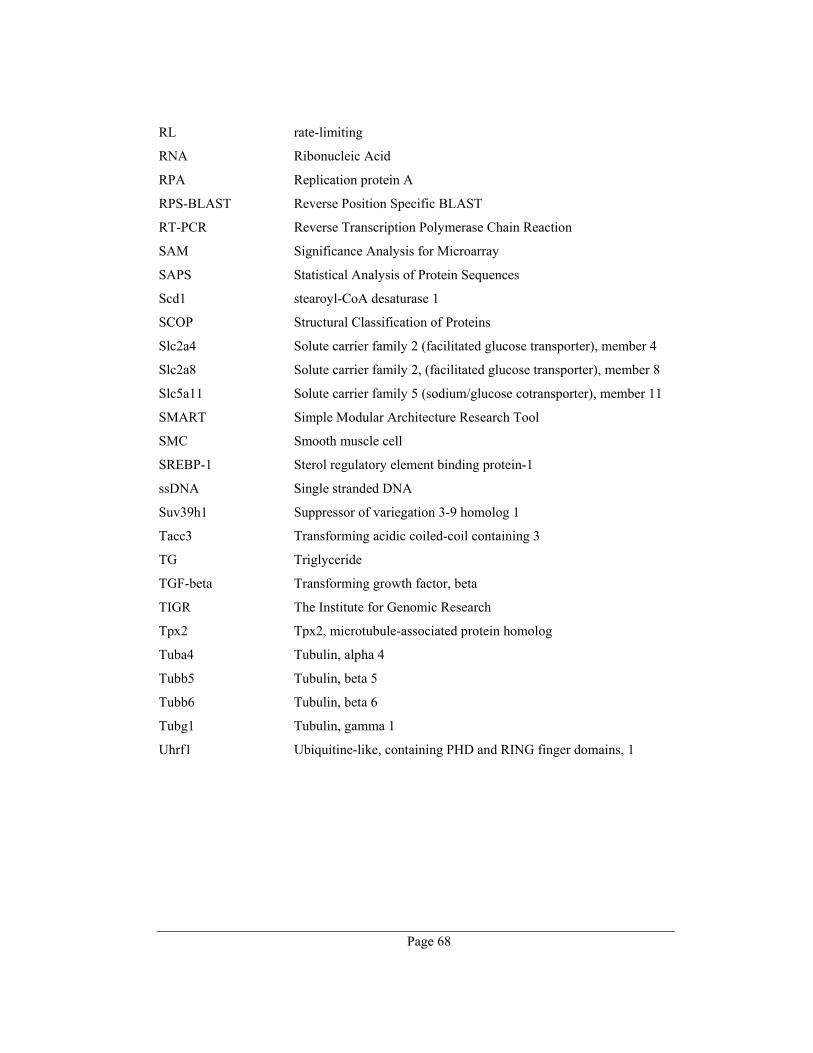
Page 68
RL rate-limiting
RNA Ribonucleic Acid
RPA Replication protein A
RPS-BLAST Reverse Position Specific BLAST
RT-PCR Reverse Transcription Polymerase Chain Reaction
SAM Significance Analysis for Microarray
SAPS Statistical Analysis of Protein Sequences
Scd1 stearoyl-CoA desaturase 1
SCOP Structural Classification of Proteins
Slc2a4 Solute carrier family 2 (facilitated glucose transporter), member 4
Slc2a8 Solute carrier family 2, (facilitated glucose transporter), member 8
Slc5a11 Solute carrier family 5 (sodium/glucose cotransporter), member 11
SMART Simple Modular Architecture Research Tool
SMC Smooth muscle cell
SREBP-1 Sterol regulatory element binding protein-1
ssDNA Single stranded DNA
Suv39h1 Suppressor of variegation 3-9 homolog 1
Tacc3 Transforming acidic coiled-coil containing 3
TG Triglyceride
TGF-beta Transforming growth factor, beta
TIGR The Institute for Genomic Research
Tpx2 Tpx2, microtubule-associated protein homolog
Tuba4 Tubulin, alpha 4
Tubb5 Tubulin, beta 5
Tubb6 Tubulin, beta 6
Tubg1 Tubulin, gamma 1
Uhrf1 Ubiquitine-like, containing PHD and RING finger domains, 1

Page 69
7. Acknowledgment
This work was supported by GENAU: Bioinformatics Integration Network (BIN) and
Genomics of Lipid-Associated Disorders (GOLD), bm:bwk. I would like to express my
deepest gratitude to my mentors, Frank Eisenhaber and Zlatko Trajanoski, for their
encouragement, vision, and belief in me.
Further thanks go to members of the Eisenhaber Group at the IMP Vienna and to the
colleges of the Institute for Genomics and Bioinformatics at the University of Technology
Graz for their fruitful discussions, support and friendship. A special thank is owed to all
those people who have actively contributed to this work in alphabetical order: Hubert Hackl,
Anne-Margarethe Krogsdam, Maria Novatchkova, Montserrat Pinent Armengol, Fátima
Sánchez Cabo, Alexander Schleiffer, Georg Schneider, Juliane Strauss and Alexander Sturn.
Special thanks goes also to Pidder Jansen-Duerr and the colleagues of the national research
network FSP S93, who introduced me to the interesting field of aging and financed part of
my studies.
I am indebted to my parents for their unfailing support, and to my wife, Beatrix, for being
with me and for her love, encouragement and understanding.

Page 70
8. Appendix A – Rate-limiting genes in mouse
The following table lists mouse genes/proteins, which are selected from more than 15,000
Pubmed abstracts. Additional information about reliability (e.g. also found in a curated
curated database), information sources and sequences are stored in a relational database.
Official gene symbols
Nucleotide and protein RefSeq ID
Official gene name
Gch1 NM_008102.2→NP_032128.1 GTP cyclohydrolase 1 Dck NM_007832.3→NP_031858.1 Deoxycytidine kinase Th NM_009377.1→NP_033403.1 tyrosine hydroxylase
Abca1 NM_013454.3→NP_038482.3 ATP-binding cassette, sub-family A (ABC1), member 1
Acaca NM_133360.1→NP_579938.1 acetyl-Coenzyme A carboxylase alpha
Cyp27b1 NM_010009.1→NP_034139.1 cytochrome P450, family 27, subfamily b, polypeptide 1
Ren1 NM_031192.2→NP_112469.1 renin 1 structural Gclc NM_010295.1→NP_034425.1 glutamate-cysteine ligase, catalytic subunit Gclm NM_008129.2→NP_032155.1 glutamate-cysteine ligase , modifier subunit
Cyp11a1 NM_019779.2→NP_062753.2 cytochrome P450, family 11, subfamily a, polypeptide 1
Gsto1 NM_010362.1→NP_034492.1 glutathione S-transferase omega 1 Hmgcr NM_008255.1→NP_032281.1 3-hydroxy-3-methylglutaryl-Coenzyme A reductase Hmox1 NM_010442.1→NP_034572.1 heme oxygenase (decycling) 1 Ptgs1 NM_008969.2→NP_032995.1 Prostaglandin-endoperoxide synthase 1
Cyp19a1 NM_007810.1→NP_031836.1 cytochrome P450, family 19, subfamily a, polypeptide 1
Tyr NM_011661.1→NP_035791.1 Tyrosinase Tpmt NM_016785.1→NP_058065.1 thiopurine methyltransferase Impdh1 NM_011829.2→NP_035959.2 inosine 5'-phosphate dehydrogenase 1
H6pd NM_173371.2→NP_775547.2 hexose-6-phosphate dehydrogenase (glucose 1-dehydrogenase)
Cpt1a NM_013495.1→NP_038523.1 carnitine palmitoyltransferase 1a, liver
Cyp7a1 NM_007824.2→NP_031850.2 cytochrome P450, family 7, subfamily a, polypeptide 1
Trpv6 NM_022413.2→NP_071858.2 transient receptor potential cation channel, subfamily V, member 6
Tph1 NM_009414.2→NP_033440.1 tryptophan hydroxylase 1 Pank1 NM_023792.1→NP_076281.1 pantothenate kinase 1 Cps1 XM_129769.8→XP_129769.6 carbamoyl-phosphate synthetase 1 Star NM_011485.3→NP_035615.2 steroidogenic acute regulatory protein Aanat NM_009591.1→NP_033721.1 arylalkylamine N-acetyltransferase
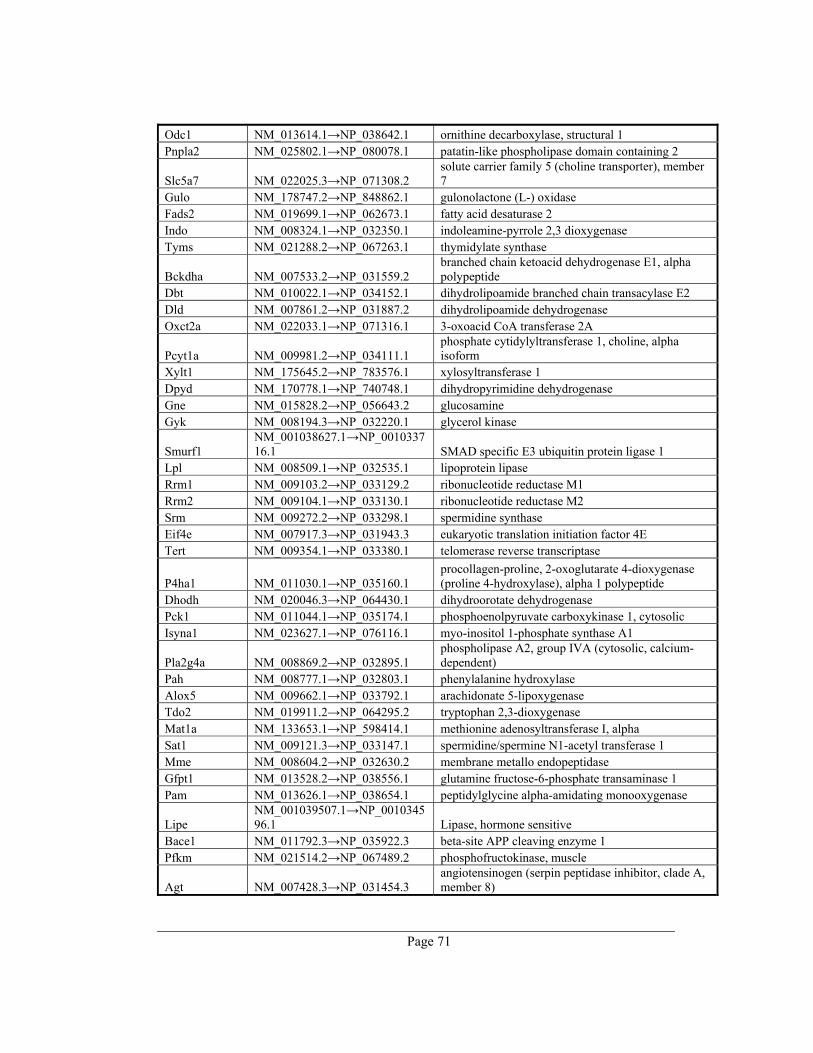
Page 71
Odc1 NM_013614.1→NP_038642.1 ornithine decarboxylase, structural 1 Pnpla2 NM_025802.1→NP_080078.1 patatin-like phospholipase domain containing 2
Slc5a7 NM_022025.3→NP_071308.2 solute carrier family 5 (choline transporter), member 7
Gulo NM_178747.2→NP_848862.1 gulonolactone (L-) oxidase Fads2 NM_019699.1→NP_062673.1 fatty acid desaturase 2 Indo NM_008324.1→NP_032350.1 indoleamine-pyrrole 2,3 dioxygenase Tyms NM_021288.2→NP_067263.1 thymidylate synthase
Bckdha NM_007533.2→NP_031559.2 branched chain ketoacid dehydrogenase E1, alpha polypeptide
Dbt NM_010022.1→NP_034152.1 dihydrolipoamide branched chain transacylase E2 Dld NM_007861.2→NP_031887.2 dihydrolipoamide dehydrogenase Oxct2a NM_022033.1→NP_071316.1 3-oxoacid CoA transferase 2A
Pcyt1a NM_009981.2→NP_034111.1 phosphate cytidylyltransferase 1, choline, alpha isoform
Xylt1 NM_175645.2→NP_783576.1 xylosyltransferase 1 Dpyd NM_170778.1→NP_740748.1 dihydropyrimidine dehydrogenase Gne NM_015828.2→NP_056643.2 glucosamine Gyk NM_008194.3→NP_032220.1 glycerol kinase
Smurf1 NM_001038627.1→NP_001033716.1 SMAD specific E3 ubiquitin protein ligase 1
Lpl NM_008509.1→NP_032535.1 lipoprotein lipase Rrm1 NM_009103.2→NP_033129.2 ribonucleotide reductase M1 Rrm2 NM_009104.1→NP_033130.1 ribonucleotide reductase M2 Srm NM_009272.2→NP_033298.1 spermidine synthase Eif4e NM_007917.3→NP_031943.3 eukaryotic translation initiation factor 4E Tert NM_009354.1→NP_033380.1 telomerase reverse transcriptase
P4ha1 NM_011030.1→NP_035160.1 procollagen-proline, 2-oxoglutarate 4-dioxygenase (proline 4-hydroxylase), alpha 1 polypeptide
Dhodh NM_020046.3→NP_064430.1 dihydroorotate dehydrogenase Pck1 NM_011044.1→NP_035174.1 phosphoenolpyruvate carboxykinase 1, cytosolic Isyna1 NM_023627.1→NP_076116.1 myo-inositol 1-phosphate synthase A1
Pla2g4a NM_008869.2→NP_032895.1 phospholipase A2, group IVA (cytosolic, calcium-dependent)
Pah NM_008777.1→NP_032803.1 phenylalanine hydroxylase Alox5 NM_009662.1→NP_033792.1 arachidonate 5-lipoxygenase Tdo2 NM_019911.2→NP_064295.2 tryptophan 2,3-dioxygenase Mat1a NM_133653.1→NP_598414.1 methionine adenosyltransferase I, alpha Sat1 NM_009121.3→NP_033147.1 spermidine/spermine N1-acetyl transferase 1 Mme NM_008604.2→NP_032630.2 membrane metallo endopeptidase Gfpt1 NM_013528.2→NP_038556.1 glutamine fructose-6-phosphate transaminase 1 Pam NM_013626.1→NP_038654.1 peptidylglycine alpha-amidating monooxygenase
Lipe NM_001039507.1→NP_001034596.1 Lipase, hormone sensitive
Bace1 NM_011792.3→NP_035922.3 beta-site APP cleaving enzyme 1 Pfkm NM_021514.2→NP_067489.2 phosphofructokinase, muscle
Agt NM_007428.3→NP_031454.3 angiotensinogen (serpin peptidase inhibitor, clade A, member 8)
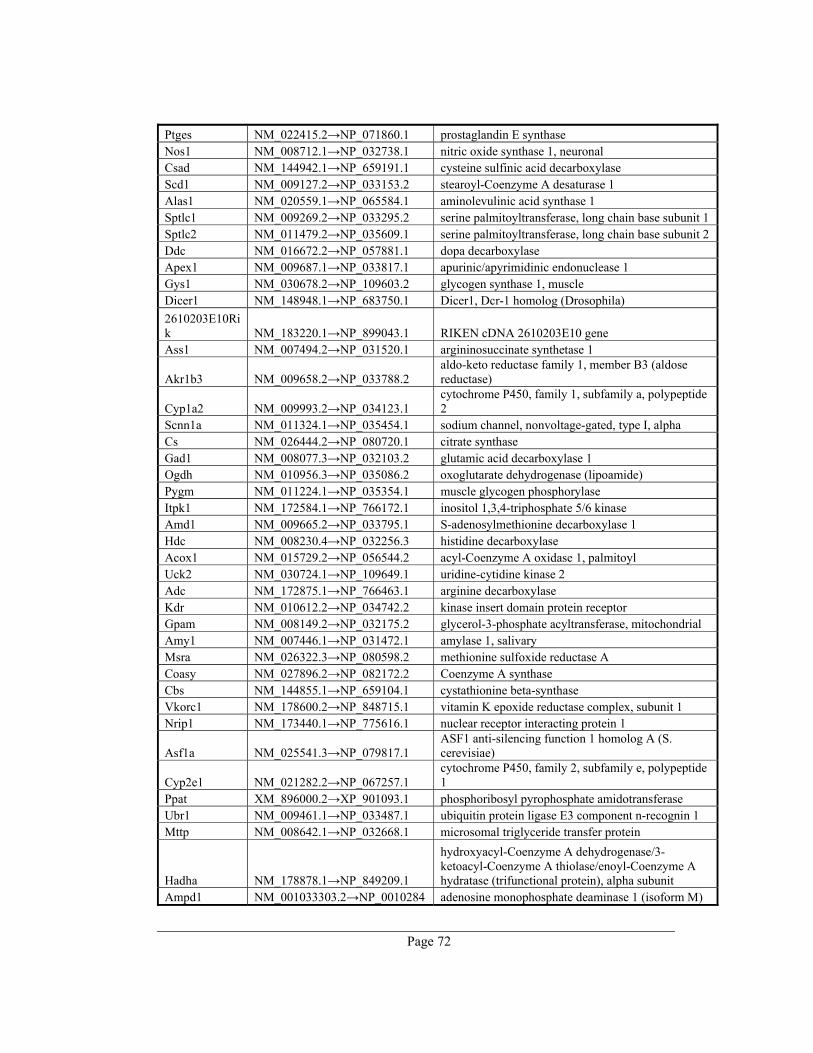
Page 72
Ptges NM_022415.2→NP_071860.1 prostaglandin E synthase Nos1 NM_008712.1→NP_032738.1 nitric oxide synthase 1, neuronal Csad NM_144942.1→NP_659191.1 cysteine sulfinic acid decarboxylase Scd1 NM_009127.2→NP_033153.2 stearoyl-Coenzyme A desaturase 1 Alas1 NM_020559.1→NP_065584.1 aminolevulinic acid synthase 1 Sptlc1 NM_009269.2→NP_033295.2 serine palmitoyltransferase, long chain base subunit 1 Sptlc2 NM_011479.2→NP_035609.1 serine palmitoyltransferase, long chain base subunit 2 Ddc NM_016672.2→NP_057881.1 dopa decarboxylase Apex1 NM_009687.1→NP_033817.1 apurinic/apyrimidinic endonuclease 1 Gys1 NM_030678.2→NP_109603.2 glycogen synthase 1, muscle Dicer1 NM_148948.1→NP_683750.1 Dicer1, Dcr-1 homolog (Drosophila) 2610203E10Rik NM_183220.1→NP_899043.1 RIKEN cDNA 2610203E10 gene Ass1 NM_007494.2→NP_031520.1 argininosuccinate synthetase 1
Akr1b3 NM_009658.2→NP_033788.2 aldo-keto reductase family 1, member B3 (aldose reductase)
Cyp1a2 NM_009993.2→NP_034123.1 cytochrome P450, family 1, subfamily a, polypeptide 2
Scnn1a NM_011324.1→NP_035454.1 sodium channel, nonvoltage-gated, type I, alpha Cs NM_026444.2→NP_080720.1 citrate synthase Gad1 NM_008077.3→NP_032103.2 glutamic acid decarboxylase 1 Ogdh NM_010956.3→NP_035086.2 oxoglutarate dehydrogenase (lipoamide) Pygm NM_011224.1→NP_035354.1 muscle glycogen phosphorylase Itpk1 NM_172584.1→NP_766172.1 inositol 1,3,4-triphosphate 5/6 kinase Amd1 NM_009665.2→NP_033795.1 S-adenosylmethionine decarboxylase 1 Hdc NM_008230.4→NP_032256.3 histidine decarboxylase Acox1 NM_015729.2→NP_056544.2 acyl-Coenzyme A oxidase 1, palmitoyl Uck2 NM_030724.1→NP_109649.1 uridine-cytidine kinase 2 Adc NM_172875.1→NP_766463.1 arginine decarboxylase Kdr NM_010612.2→NP_034742.2 kinase insert domain protein receptor Gpam NM_008149.2→NP_032175.2 glycerol-3-phosphate acyltransferase, mitochondrial Amy1 NM_007446.1→NP_031472.1 amylase 1, salivary Msra NM_026322.3→NP_080598.2 methionine sulfoxide reductase A Coasy NM_027896.2→NP_082172.2 Coenzyme A synthase Cbs NM_144855.1→NP_659104.1 cystathionine beta-synthase Vkorc1 NM_178600.2→NP_848715.1 vitamin K epoxide reductase complex, subunit 1 Nrip1 NM_173440.1→NP_775616.1 nuclear receptor interacting protein 1
Asf1a NM_025541.3→NP_079817.1 ASF1 anti-silencing function 1 homolog A (S. cerevisiae)
Cyp2e1 NM_021282.2→NP_067257.1 cytochrome P450, family 2, subfamily e, polypeptide 1
Ppat XM_896000.2→XP_901093.1 phosphoribosyl pyrophosphate amidotransferase Ubr1 NM_009461.1→NP_033487.1 ubiquitin protein ligase E3 component n-recognin 1 Mttp NM_008642.1→NP_032668.1 microsomal triglyceride transfer protein
Hadha NM_178878.1→NP_849209.1
hydroxyacyl-Coenzyme A dehydrogenase/3-ketoacyl-Coenzyme A thiolase/enoyl-Coenzyme A hydratase (trifunctional protein), alpha subunit
Ampd1 NM_001033303.2→NP_0010284 adenosine monophosphate deaminase 1 (isoform M)
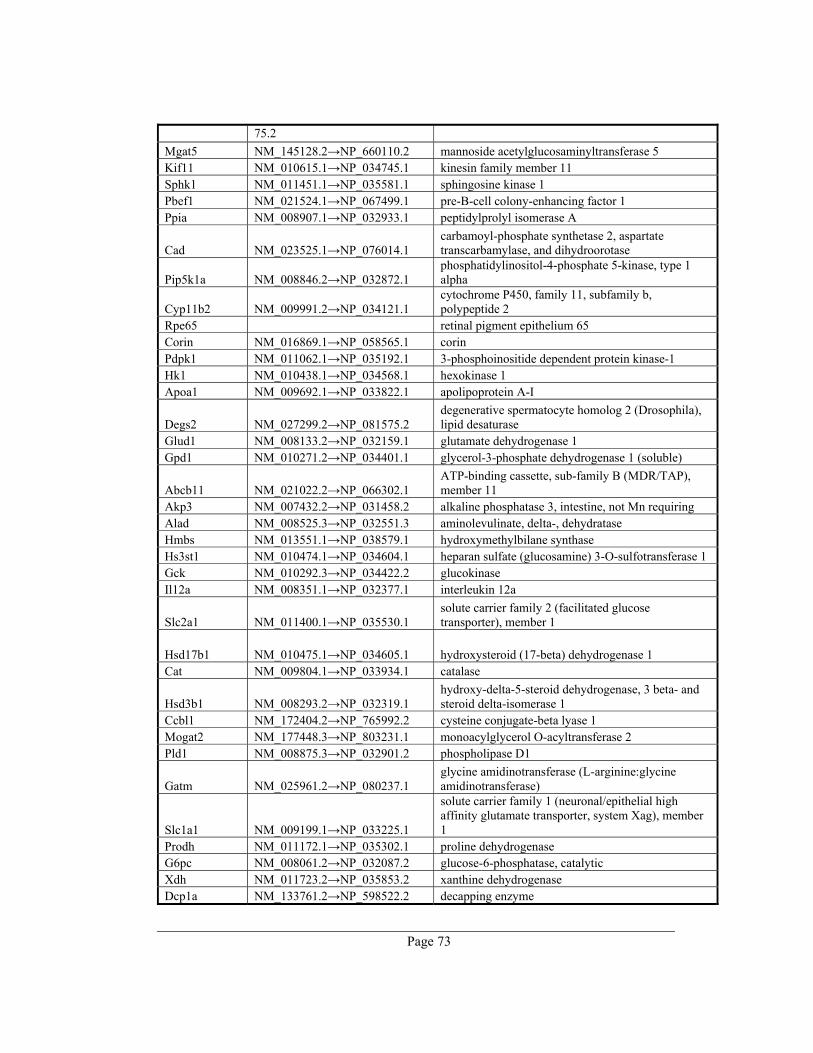
Page 73
75.2 Mgat5 NM_145128.2→NP_660110.2 mannoside acetylglucosaminyltransferase 5 Kif11 NM_010615.1→NP_034745.1 kinesin family member 11 Sphk1 NM_011451.1→NP_035581.1 sphingosine kinase 1 Pbef1 NM_021524.1→NP_067499.1 pre-B-cell colony-enhancing factor 1 Ppia NM_008907.1→NP_032933.1 peptidylprolyl isomerase A
Cad NM_023525.1→NP_076014.1 carbamoyl-phosphate synthetase 2, aspartate transcarbamylase, and dihydroorotase
Pip5k1a NM_008846.2→NP_032872.1 phosphatidylinositol-4-phosphate 5-kinase, type 1 alpha
Cyp11b2 NM_009991.2→NP_034121.1 cytochrome P450, family 11, subfamily b, polypeptide 2
Rpe65 retinal pigment epithelium 65 Corin NM_016869.1→NP_058565.1 corin Pdpk1 NM_011062.1→NP_035192.1 3-phosphoinositide dependent protein kinase-1 Hk1 NM_010438.1→NP_034568.1 hexokinase 1 Apoa1 NM_009692.1→NP_033822.1 apolipoprotein A-I
Degs2 NM_027299.2→NP_081575.2 degenerative spermatocyte homolog 2 (Drosophila), lipid desaturase
Glud1 NM_008133.2→NP_032159.1 glutamate dehydrogenase 1 Gpd1 NM_010271.2→NP_034401.1 glycerol-3-phosphate dehydrogenase 1 (soluble)
Abcb11 NM_021022.2→NP_066302.1 ATP-binding cassette, sub-family B (MDR/TAP), member 11
Akp3 NM_007432.2→NP_031458.2 alkaline phosphatase 3, intestine, not Mn requiring Alad NM_008525.3→NP_032551.3 aminolevulinate, delta-, dehydratase Hmbs NM_013551.1→NP_038579.1 hydroxymethylbilane synthase Hs3st1 NM_010474.1→NP_034604.1 heparan sulfate (glucosamine) 3-O-sulfotransferase 1 Gck NM_010292.3→NP_034422.2 glucokinase Il12a NM_008351.1→NP_032377.1 interleukin 12a
Slc2a1 NM_011400.1→NP_035530.1 solute carrier family 2 (facilitated glucose transporter), member 1
Hsd17b1 NM_010475.1→NP_034605.1 hydroxysteroid (17-beta) dehydrogenase 1 Cat NM_009804.1→NP_033934.1 catalase
Hsd3b1 NM_008293.2→NP_032319.1 hydroxy-delta-5-steroid dehydrogenase, 3 beta- and steroid delta-isomerase 1
Ccbl1 NM_172404.2→NP_765992.2 cysteine conjugate-beta lyase 1 Mogat2 NM_177448.3→NP_803231.1 monoacylglycerol O-acyltransferase 2 Pld1 NM_008875.3→NP_032901.2 phospholipase D1
Gatm NM_025961.2→NP_080237.1 glycine amidinotransferase (L-arginine:glycine amidinotransferase)
Slc1a1 NM_009199.1→NP_033225.1
solute carrier family 1 (neuronal/epithelial high affinity glutamate transporter, system Xag), member 1
Prodh NM_011172.1→NP_035302.1 proline dehydrogenase G6pc NM_008061.2→NP_032087.2 glucose-6-phosphatase, catalytic Xdh NM_011723.2→NP_035853.2 xanthine dehydrogenase Dcp1a NM_133761.2→NP_598522.2 decapping enzyme
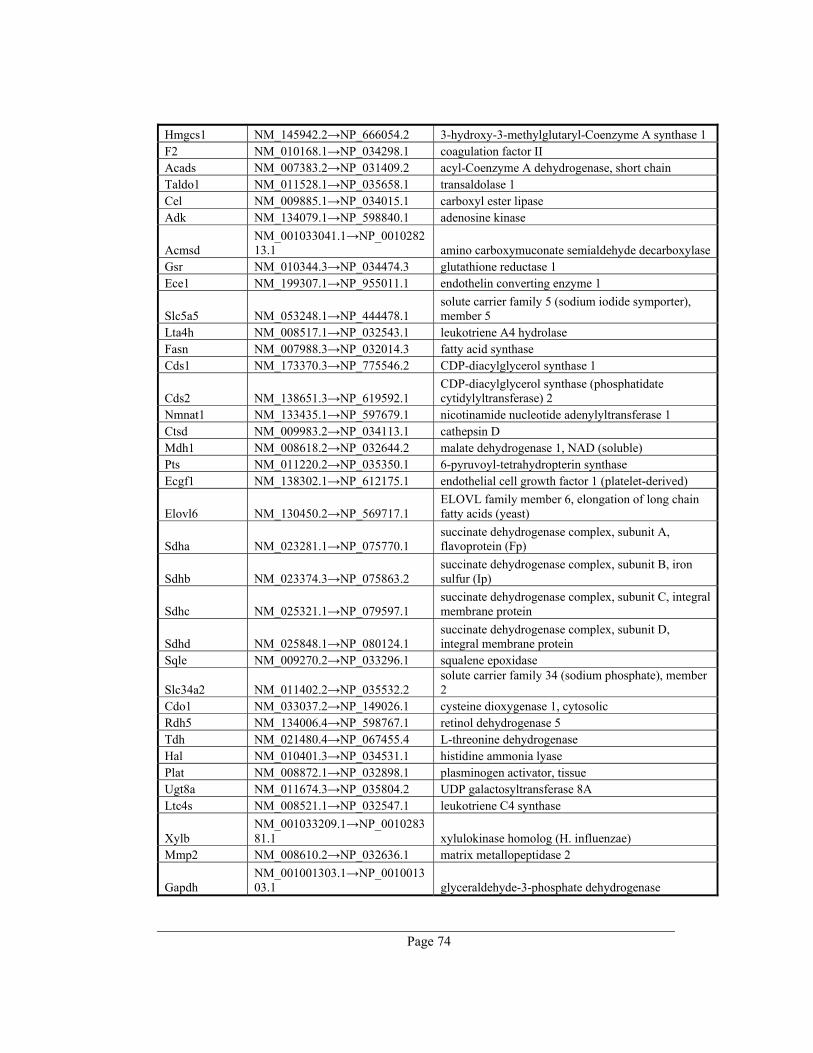
Page 74
Hmgcs1 NM_145942.2→NP_666054.2 3-hydroxy-3-methylglutaryl-Coenzyme A synthase 1 F2 NM_010168.1→NP_034298.1 coagulation factor II Acads NM_007383.2→NP_031409.2 acyl-Coenzyme A dehydrogenase, short chain Taldo1 NM_011528.1→NP_035658.1 transaldolase 1 Cel NM_009885.1→NP_034015.1 carboxyl ester lipase Adk NM_134079.1→NP_598840.1 adenosine kinase
Acmsd NM_001033041.1→NP_001028213.1 amino carboxymuconate semialdehyde decarboxylase
Gsr NM_010344.3→NP_034474.3 glutathione reductase 1 Ece1 NM_199307.1→NP_955011.1 endothelin converting enzyme 1
Slc5a5 NM_053248.1→NP_444478.1 solute carrier family 5 (sodium iodide symporter), member 5
Lta4h NM_008517.1→NP_032543.1 leukotriene A4 hydrolase Fasn NM_007988.3→NP_032014.3 fatty acid synthase Cds1 NM_173370.3→NP_775546.2 CDP-diacylglycerol synthase 1
Cds2 NM_138651.3→NP_619592.1 CDP-diacylglycerol synthase (phosphatidate cytidylyltransferase) 2
Nmnat1 NM_133435.1→NP_597679.1 nicotinamide nucleotide adenylyltransferase 1 Ctsd NM_009983.2→NP_034113.1 cathepsin D Mdh1 NM_008618.2→NP_032644.2 malate dehydrogenase 1, NAD (soluble) Pts NM_011220.2→NP_035350.1 6-pyruvoyl-tetrahydropterin synthase Ecgf1 NM_138302.1→NP_612175.1 endothelial cell growth factor 1 (platelet-derived)
Elovl6 NM_130450.2→NP_569717.1 ELOVL family member 6, elongation of long chain fatty acids (yeast)
Sdha NM_023281.1→NP_075770.1 succinate dehydrogenase complex, subunit A, flavoprotein (Fp)
Sdhb NM_023374.3→NP_075863.2 succinate dehydrogenase complex, subunit B, iron sulfur (Ip)
Sdhc NM_025321.1→NP_079597.1 succinate dehydrogenase complex, subunit C, integral membrane protein
Sdhd NM_025848.1→NP_080124.1 succinate dehydrogenase complex, subunit D, integral membrane protein
Sqle NM_009270.2→NP_033296.1 squalene epoxidase
Slc34a2 NM_011402.2→NP_035532.2 solute carrier family 34 (sodium phosphate), member 2
Cdo1 NM_033037.2→NP_149026.1 cysteine dioxygenase 1, cytosolic Rdh5 NM_134006.4→NP_598767.1 retinol dehydrogenase 5 Tdh NM_021480.4→NP_067455.4 L-threonine dehydrogenase Hal NM_010401.3→NP_034531.1 histidine ammonia lyase Plat NM_008872.1→NP_032898.1 plasminogen activator, tissue Ugt8a NM_011674.3→NP_035804.2 UDP galactosyltransferase 8A Ltc4s NM_008521.1→NP_032547.1 leukotriene C4 synthase
Xylb NM_001033209.1→NP_001028381.1 xylulokinase homolog (H. influenzae)
Mmp2 NM_008610.2→NP_032636.1 matrix metallopeptidase 2
Gapdh NM_001001303.1→NP_001001303.1 glyceraldehyde-3-phosphate dehydrogenase

Page 75
Aass NM_013930.3→NP_038958.2 aminoadipate-semialdehyde synthase Fbp1 NM_019395.1→NP_062268.1 fructose bisphosphatase 1 Pcyt2 NM_024229.2→NP_077191.2 phosphate cytidylyltransferase 2, ethanolamine Idh3b NM_130884.1→NP_570954.1 isocitrate dehydrogenase 3 (NAD+) beta
Ace NM_009598.1→NP_033728.1 angiotensin I converting enzyme (peptidyl-dipeptidase A) 1
Fads1 NM_146094.1→NP_666206.1 fatty acid desaturase 1 Tspo NM_009775.2→NP_033905.2 translocator protein Aqp2 NM_009699.2→NP_033829.2 aquaporin 2
Pgd XM_001003312.1→XP_001003312.1 phosphogluconate dehydrogenase
Papss1 NM_011863.1→NP_035993.1 3'-phosphoadenosine 5'-phosphosulfate synthase 1 Mpg NM_010822.2→NP_034952.1 N-methylpurine-DNA glycosylase Chat NM_009891.1→NP_034021.1 choline acetyltransferase
Rdh8 NM_001030290.1→NP_001025461.1 retinol dehydrogenase 8
Pnpo NM_134021.1→NP_598782.1 pyridoxine 5'-phosphate oxidase Pgs1 NM_133757.1→NP_598518.1 phosphatidylglycerophosphate synthase 1 Mod1 NM_008615.1→NP_032641.1 malic enzyme, supernatant P4hb NM_011032.1→NP_035162.1 prolyl 4-hydroxylase, beta polypeptide Pnmt NM_008890.1→NP_032916.1 phenylethanolamine-N-methyltransferase Ube1x NM_009457.2→NP_033483.1 ubiquitin-activating enzyme E1, Chr X
Elovl5 NM_134255.2→NP_599016.2 ELOVL family member 5, elongation of long chain fatty acids (yeast)
Psph NM_133900.2→NP_598661.1 phosphoserine phosphatase
Apobec1 NM_031159.2→NP_112436.1 apolipoprotein B editing complex 1 Soat2 NM_146064.1→NP_666176.1 sterol O-acyltransferase 2 Srd5a1 NM_175283.3→NP_780492.2 steroid 5 alpha-reductase 1 Acly NM_134037.2→NP_598798.1 ATP citrate lyase Aco2 NM_080633.2→NP_542364.1 aconitase 2, mitochondrial Gaa NM_008064.2→NP_032090.2 glucosidase, alpha, acid Cd79a NM_007655.2→NP_031681.2 CD79A antigen (immunoglobulin-associated alpha) F3 NM_010171.2→NP_034301.2 coagulation factor III Lsr NM_017405.1→NP_059101.1 lipolysis stimulated lipoprotein receptor Mgll NM_011844.3→NP_035974.1 monoglyceride lipase Ide NM_031156.1→NP_112419.1 insulin degrading enzyme Dtymk NM_023136.1→NP_075625.1 deoxythymidylate kinase
Chka NM_001025566.1→NP_001020737.1 choline kinase alpha
Cmah NM_007717.2→NP_031743.2 cytidine monophospho-N-acetylneuraminic acid hydroxylase
Etnk1 XM_908334.2→XP_913427.2 ethanolamine kinase 1 Ak1 NM_021515.1→NP_067490.1 adenylate kinase 1 Ela1 NM_033612.1→NP_291090.1 elastase 1, pancreatic Ucp1 NM_009463.2→NP_033489.1 uncoupling protein 1 (mitochondrial, proton carrier)
Cyp8b1 NM_010012.2→NP_034142.2 cytochrome P450, family 8, subfamily b, polypeptide 1
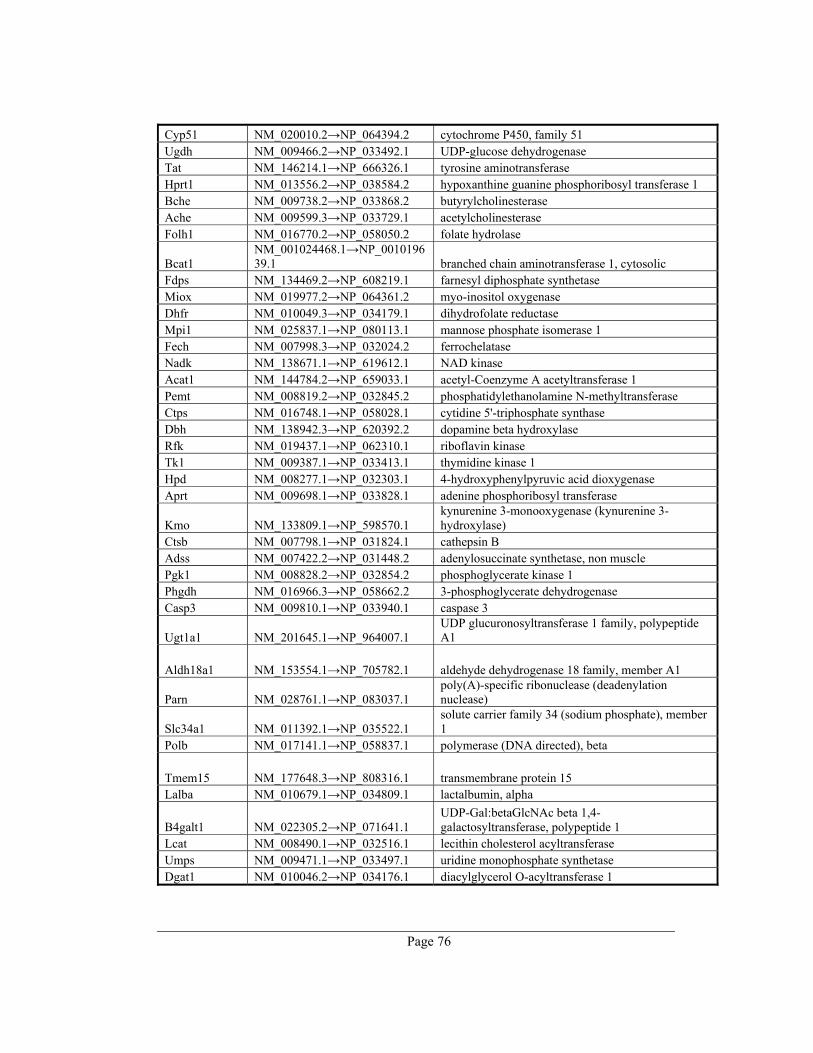
Page 76
Cyp51 NM_020010.2→NP_064394.2 cytochrome P450, family 51 Ugdh NM_009466.2→NP_033492.1 UDP-glucose dehydrogenase Tat NM_146214.1→NP_666326.1 tyrosine aminotransferase Hprt1 NM_013556.2→NP_038584.2 hypoxanthine guanine phosphoribosyl transferase 1 Bche NM_009738.2→NP_033868.2 butyrylcholinesterase Ache NM_009599.3→NP_033729.1 acetylcholinesterase Folh1 NM_016770.2→NP_058050.2 folate hydrolase
Bcat1 NM_001024468.1→NP_001019639.1 branched chain aminotransferase 1, cytosolic
Fdps NM_134469.2→NP_608219.1 farnesyl diphosphate synthetase Miox NM_019977.2→NP_064361.2 myo-inositol oxygenase Dhfr NM_010049.3→NP_034179.1 dihydrofolate reductase Mpi1 NM_025837.1→NP_080113.1 mannose phosphate isomerase 1 Fech NM_007998.3→NP_032024.2 ferrochelatase Nadk NM_138671.1→NP_619612.1 NAD kinase Acat1 NM_144784.2→NP_659033.1 acetyl-Coenzyme A acetyltransferase 1 Pemt NM_008819.2→NP_032845.2 phosphatidylethanolamine N-methyltransferase Ctps NM_016748.1→NP_058028.1 cytidine 5'-triphosphate synthase Dbh NM_138942.3→NP_620392.2 dopamine beta hydroxylase Rfk NM_019437.1→NP_062310.1 riboflavin kinase Tk1 NM_009387.1→NP_033413.1 thymidine kinase 1 Hpd NM_008277.1→NP_032303.1 4-hydroxyphenylpyruvic acid dioxygenase Aprt NM_009698.1→NP_033828.1 adenine phosphoribosyl transferase
Kmo NM_133809.1→NP_598570.1 kynurenine 3-monooxygenase (kynurenine 3-hydroxylase)
Ctsb NM_007798.1→NP_031824.1 cathepsin B Adss NM_007422.2→NP_031448.2 adenylosuccinate synthetase, non muscle Pgk1 NM_008828.2→NP_032854.2 phosphoglycerate kinase 1 Phgdh NM_016966.3→NP_058662.2 3-phosphoglycerate dehydrogenase Casp3 NM_009810.1→NP_033940.1 caspase 3
Ugt1a1 NM_201645.1→NP_964007.1 UDP glucuronosyltransferase 1 family, polypeptide A1
Aldh18a1 NM_153554.1→NP_705782.1 aldehyde dehydrogenase 18 family, member A1
Parn NM_028761.1→NP_083037.1 poly(A)-specific ribonuclease (deadenylation nuclease)
Slc34a1 NM_011392.1→NP_035522.1 solute carrier family 34 (sodium phosphate), member 1
Polb NM_017141.1→NP_058837.1 polymerase (DNA directed), beta
Tmem15 NM_177648.3→NP_808316.1 transmembrane protein 15 Lalba NM_010679.1→NP_034809.1 lactalbumin, alpha
B4galt1 NM_022305.2→NP_071641.1 UDP-Gal:betaGlcNAc beta 1,4- galactosyltransferase, polypeptide 1
Lcat NM_008490.1→NP_032516.1 lecithin cholesterol acyltransferase Umps NM_009471.1→NP_033497.1 uridine monophosphate synthetase Dgat1 NM_010046.2→NP_034176.1 diacylglycerol O-acyltransferase 1
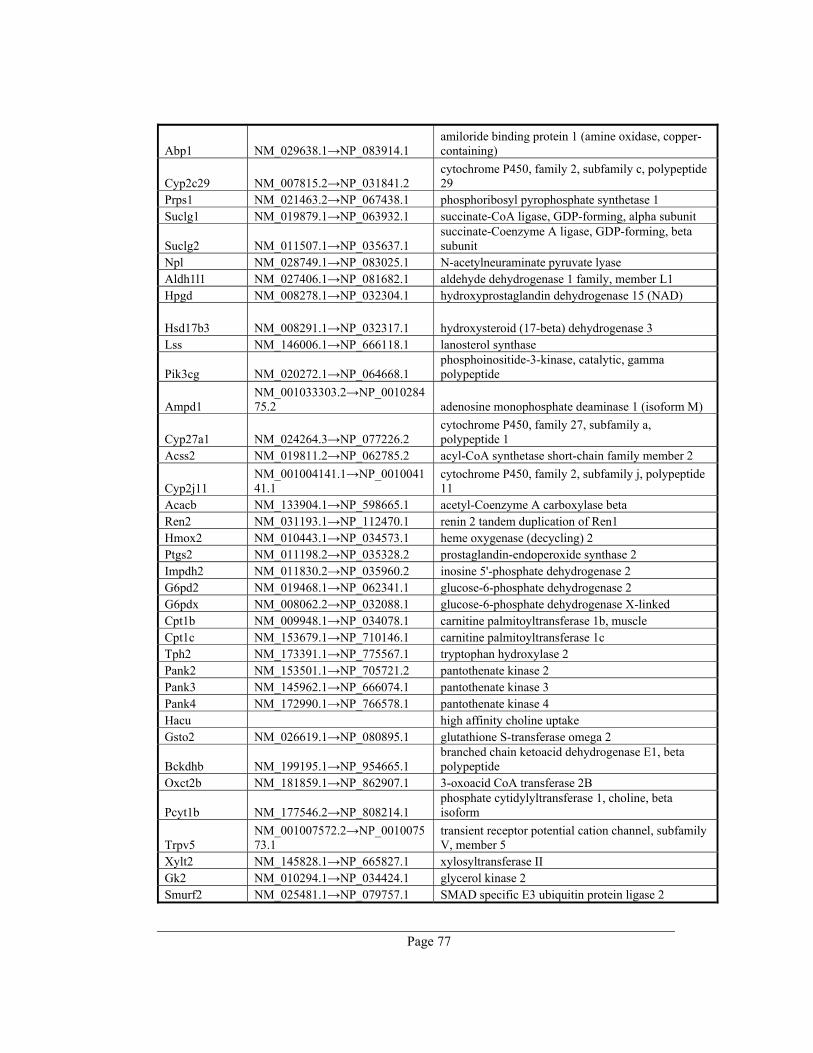
Page 77
Abp1 NM_029638.1→NP_083914.1 amiloride binding protein 1 (amine oxidase, copper-containing)
Cyp2c29 NM_007815.2→NP_031841.2 cytochrome P450, family 2, subfamily c, polypeptide 29
Prps1 NM_021463.2→NP_067438.1 phosphoribosyl pyrophosphate synthetase 1 Suclg1 NM_019879.1→NP_063932.1 succinate-CoA ligase, GDP-forming, alpha subunit
Suclg2 NM_011507.1→NP_035637.1 succinate-Coenzyme A ligase, GDP-forming, beta subunit
Npl NM_028749.1→NP_083025.1 N-acetylneuraminate pyruvate lyase Aldh1l1 NM_027406.1→NP_081682.1 aldehyde dehydrogenase 1 family, member L1 Hpgd NM_008278.1→NP_032304.1 hydroxyprostaglandin dehydrogenase 15 (NAD)
Hsd17b3 NM_008291.1→NP_032317.1 hydroxysteroid (17-beta) dehydrogenase 3 Lss NM_146006.1→NP_666118.1 lanosterol synthase
Pik3cg NM_020272.1→NP_064668.1 phosphoinositide-3-kinase, catalytic, gamma polypeptide
Ampd1 NM_001033303.2→NP_001028475.2 adenosine monophosphate deaminase 1 (isoform M)
Cyp27a1 NM_024264.3→NP_077226.2 cytochrome P450, family 27, subfamily a, polypeptide 1
Acss2 NM_019811.2→NP_062785.2 acyl-CoA synthetase short-chain family member 2
Cyp2j11 NM_001004141.1→NP_001004141.1
cytochrome P450, family 2, subfamily j, polypeptide 11
Acacb NM_133904.1→NP_598665.1 acetyl-Coenzyme A carboxylase beta Ren2 NM_031193.1→NP_112470.1 renin 2 tandem duplication of Ren1 Hmox2 NM_010443.1→NP_034573.1 heme oxygenase (decycling) 2 Ptgs2 NM_011198.2→NP_035328.2 prostaglandin-endoperoxide synthase 2 Impdh2 NM_011830.2→NP_035960.2 inosine 5'-phosphate dehydrogenase 2 G6pd2 NM_019468.1→NP_062341.1 glucose-6-phosphate dehydrogenase 2 G6pdx NM_008062.2→NP_032088.1 glucose-6-phosphate dehydrogenase X-linked Cpt1b NM_009948.1→NP_034078.1 carnitine palmitoyltransferase 1b, muscle Cpt1c NM_153679.1→NP_710146.1 carnitine palmitoyltransferase 1c Tph2 NM_173391.1→NP_775567.1 tryptophan hydroxylase 2 Pank2 NM_153501.1→NP_705721.2 pantothenate kinase 2 Pank3 NM_145962.1→NP_666074.1 pantothenate kinase 3 Pank4 NM_172990.1→NP_766578.1 pantothenate kinase 4 Hacu high affinity choline uptake Gsto2 NM_026619.1→NP_080895.1 glutathione S-transferase omega 2
Bckdhb NM_199195.1→NP_954665.1 branched chain ketoacid dehydrogenase E1, beta polypeptide
Oxct2b NM_181859.1→NP_862907.1 3-oxoacid CoA transferase 2B
Pcyt1b NM_177546.2→NP_808214.1 phosphate cytidylyltransferase 1, choline, beta isoform
Trpv5 NM_001007572.2→NP_001007573.1
transient receptor potential cation channel, subfamily V, member 5
Xylt2 NM_145828.1→NP_665827.1 xylosyltransferase II Gk2 NM_010294.1→NP_034424.1 glycerol kinase 2 Smurf2 NM_025481.1→NP_079757.1 SMAD specific E3 ubiquitin protein ligase 2
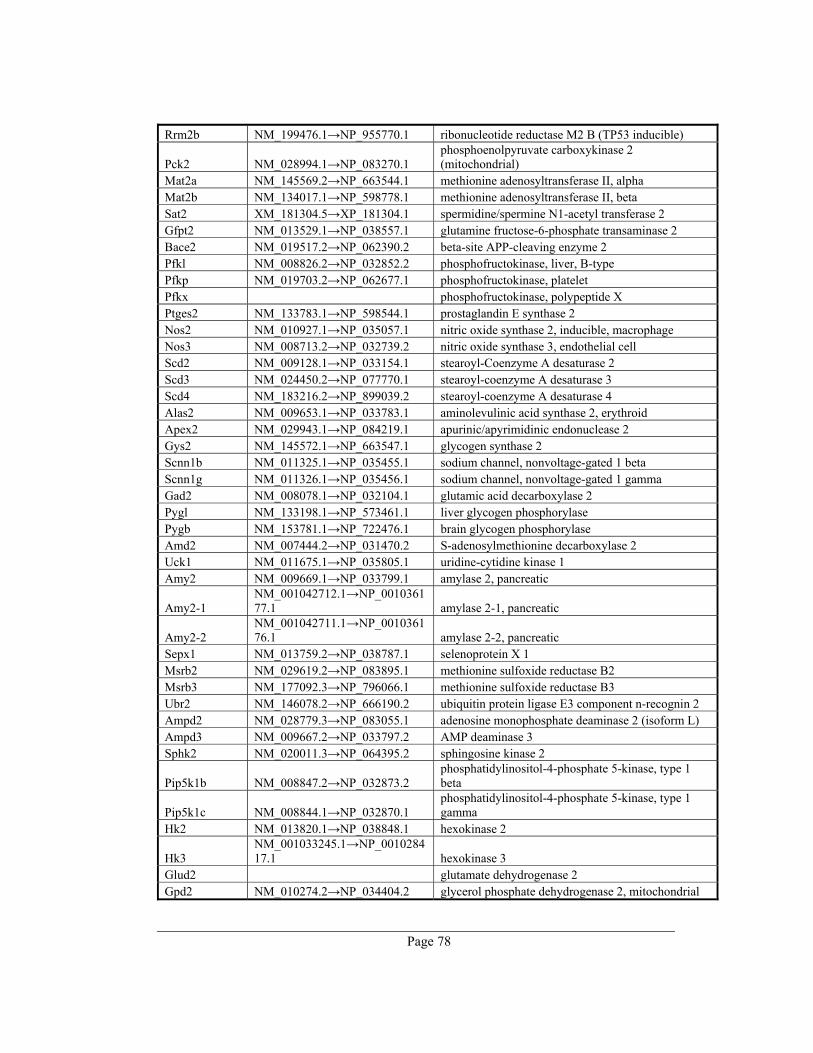
Page 78
Rrm2b NM_199476.1→NP_955770.1 ribonucleotide reductase M2 B (TP53 inducible)
Pck2 NM_028994.1→NP_083270.1 phosphoenolpyruvate carboxykinase 2 (mitochondrial)
Mat2a NM_145569.2→NP_663544.1 methionine adenosyltransferase II, alpha Mat2b NM_134017.1→NP_598778.1 methionine adenosyltransferase II, beta Sat2 XM_181304.5→XP_181304.1 spermidine/spermine N1-acetyl transferase 2 Gfpt2 NM_013529.1→NP_038557.1 glutamine fructose-6-phosphate transaminase 2 Bace2 NM_019517.2→NP_062390.2 beta-site APP-cleaving enzyme 2 Pfkl NM_008826.2→NP_032852.2 phosphofructokinase, liver, B-type Pfkp NM_019703.2→NP_062677.1 phosphofructokinase, platelet Pfkx phosphofructokinase, polypeptide X Ptges2 NM_133783.1→NP_598544.1 prostaglandin E synthase 2 Nos2 NM_010927.1→NP_035057.1 nitric oxide synthase 2, inducible, macrophage Nos3 NM_008713.2→NP_032739.2 nitric oxide synthase 3, endothelial cell Scd2 NM_009128.1→NP_033154.1 stearoyl-Coenzyme A desaturase 2 Scd3 NM_024450.2→NP_077770.1 stearoyl-coenzyme A desaturase 3 Scd4 NM_183216.2→NP_899039.2 stearoyl-coenzyme A desaturase 4 Alas2 NM_009653.1→NP_033783.1 aminolevulinic acid synthase 2, erythroid Apex2 NM_029943.1→NP_084219.1 apurinic/apyrimidinic endonuclease 2 Gys2 NM_145572.1→NP_663547.1 glycogen synthase 2 Scnn1b NM_011325.1→NP_035455.1 sodium channel, nonvoltage-gated 1 beta Scnn1g NM_011326.1→NP_035456.1 sodium channel, nonvoltage-gated 1 gamma Gad2 NM_008078.1→NP_032104.1 glutamic acid decarboxylase 2 Pygl NM_133198.1→NP_573461.1 liver glycogen phosphorylase Pygb NM_153781.1→NP_722476.1 brain glycogen phosphorylase Amd2 NM_007444.2→NP_031470.2 S-adenosylmethionine decarboxylase 2 Uck1 NM_011675.1→NP_035805.1 uridine-cytidine kinase 1 Amy2 NM_009669.1→NP_033799.1 amylase 2, pancreatic
Amy2-1 NM_001042712.1→NP_001036177.1 amylase 2-1, pancreatic
Amy2-2 NM_001042711.1→NP_001036176.1 amylase 2-2, pancreatic
Sepx1 NM_013759.2→NP_038787.1 selenoprotein X 1 Msrb2 NM_029619.2→NP_083895.1 methionine sulfoxide reductase B2 Msrb3 NM_177092.3→NP_796066.1 methionine sulfoxide reductase B3 Ubr2 NM_146078.2→NP_666190.2 ubiquitin protein ligase E3 component n-recognin 2 Ampd2 NM_028779.3→NP_083055.1 adenosine monophosphate deaminase 2 (isoform L) Ampd3 NM_009667.2→NP_033797.2 AMP deaminase 3 Sphk2 NM_020011.3→NP_064395.2 sphingosine kinase 2
Pip5k1b NM_008847.2→NP_032873.2 phosphatidylinositol-4-phosphate 5-kinase, type 1 beta
Pip5k1c NM_008844.1→NP_032870.1 phosphatidylinositol-4-phosphate 5-kinase, type 1 gamma
Hk2 NM_013820.1→NP_038848.1 hexokinase 2
Hk3 NM_001033245.1→NP_001028417.1 hexokinase 3
Glud2 glutamate dehydrogenase 2 Gpd2 NM_010274.2→NP_034404.2 glycerol phosphate dehydrogenase 2, mitochondrial
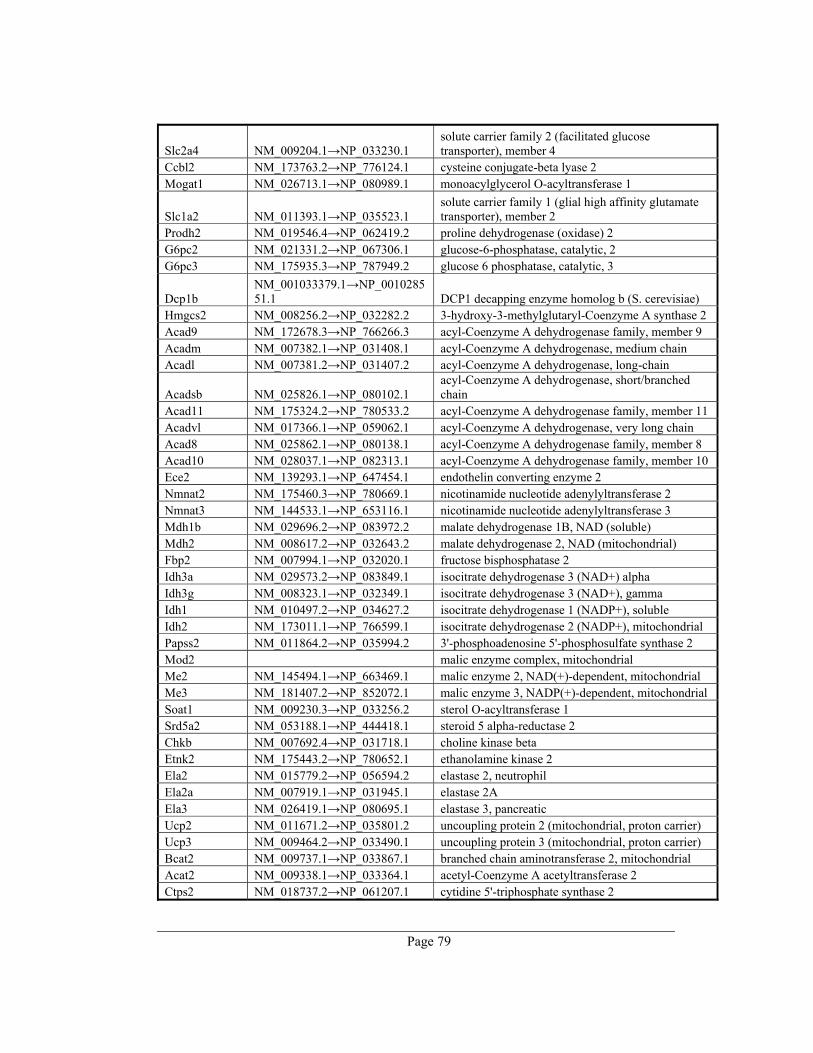
Page 79
Slc2a4 NM_009204.1→NP_033230.1 solute carrier family 2 (facilitated glucose transporter), member 4
Ccbl2 NM_173763.2→NP_776124.1 cysteine conjugate-beta lyase 2 Mogat1 NM_026713.1→NP_080989.1 monoacylglycerol O-acyltransferase 1
Slc1a2 NM_011393.1→NP_035523.1 solute carrier family 1 (glial high affinity glutamate transporter), member 2
Prodh2 NM_019546.4→NP_062419.2 proline dehydrogenase (oxidase) 2 G6pc2 NM_021331.2→NP_067306.1 glucose-6-phosphatase, catalytic, 2 G6pc3 NM_175935.3→NP_787949.2 glucose 6 phosphatase, catalytic, 3
Dcp1b NM_001033379.1→NP_001028551.1 DCP1 decapping enzyme homolog b (S. cerevisiae)
Hmgcs2 NM_008256.2→NP_032282.2 3-hydroxy-3-methylglutaryl-Coenzyme A synthase 2 Acad9 NM_172678.3→NP_766266.3 acyl-Coenzyme A dehydrogenase family, member 9 Acadm NM_007382.1→NP_031408.1 acyl-Coenzyme A dehydrogenase, medium chain Acadl NM_007381.2→NP_031407.2 acyl-Coenzyme A dehydrogenase, long-chain
Acadsb NM_025826.1→NP_080102.1 acyl-Coenzyme A dehydrogenase, short/branched chain
Acad11 NM_175324.2→NP_780533.2 acyl-Coenzyme A dehydrogenase family, member 11 Acadvl NM_017366.1→NP_059062.1 acyl-Coenzyme A dehydrogenase, very long chain Acad8 NM_025862.1→NP_080138.1 acyl-Coenzyme A dehydrogenase family, member 8 Acad10 NM_028037.1→NP_082313.1 acyl-Coenzyme A dehydrogenase family, member 10 Ece2 NM_139293.1→NP_647454.1 endothelin converting enzyme 2 Nmnat2 NM_175460.3→NP_780669.1 nicotinamide nucleotide adenylyltransferase 2 Nmnat3 NM_144533.1→NP_653116.1 nicotinamide nucleotide adenylyltransferase 3 Mdh1b NM_029696.2→NP_083972.2 malate dehydrogenase 1B, NAD (soluble) Mdh2 NM_008617.2→NP_032643.2 malate dehydrogenase 2, NAD (mitochondrial) Fbp2 NM_007994.1→NP_032020.1 fructose bisphosphatase 2 Idh3a NM_029573.2→NP_083849.1 isocitrate dehydrogenase 3 (NAD+) alpha Idh3g NM_008323.1→NP_032349.1 isocitrate dehydrogenase 3 (NAD+), gamma Idh1 NM_010497.2→NP_034627.2 isocitrate dehydrogenase 1 (NADP+), soluble Idh2 NM_173011.1→NP_766599.1 isocitrate dehydrogenase 2 (NADP+), mitochondrial Papss2 NM_011864.2→NP_035994.2 3'-phosphoadenosine 5'-phosphosulfate synthase 2 Mod2 malic enzyme complex, mitochondrial Me2 NM_145494.1→NP_663469.1 malic enzyme 2, NAD(+)-dependent, mitochondrial Me3 NM_181407.2→NP_852072.1 malic enzyme 3, NADP(+)-dependent, mitochondrial Soat1 NM_009230.3→NP_033256.2 sterol O-acyltransferase 1 Srd5a2 NM_053188.1→NP_444418.1 steroid 5 alpha-reductase 2 Chkb NM_007692.4→NP_031718.1 choline kinase beta Etnk2 NM_175443.2→NP_780652.1 ethanolamine kinase 2 Ela2 NM_015779.2→NP_056594.2 elastase 2, neutrophil Ela2a NM_007919.1→NP_031945.1 elastase 2A Ela3 NM_026419.1→NP_080695.1 elastase 3, pancreatic Ucp2 NM_011671.2→NP_035801.2 uncoupling protein 2 (mitochondrial, proton carrier) Ucp3 NM_009464.2→NP_033490.1 uncoupling protein 3 (mitochondrial, proton carrier) Bcat2 NM_009737.1→NP_033867.1 branched chain aminotransferase 2, mitochondrial Acat2 NM_009338.1→NP_033364.1 acetyl-Coenzyme A acetyltransferase 2 Ctps2 NM_018737.2→NP_061207.1 cytidine 5'-triphosphate synthase 2
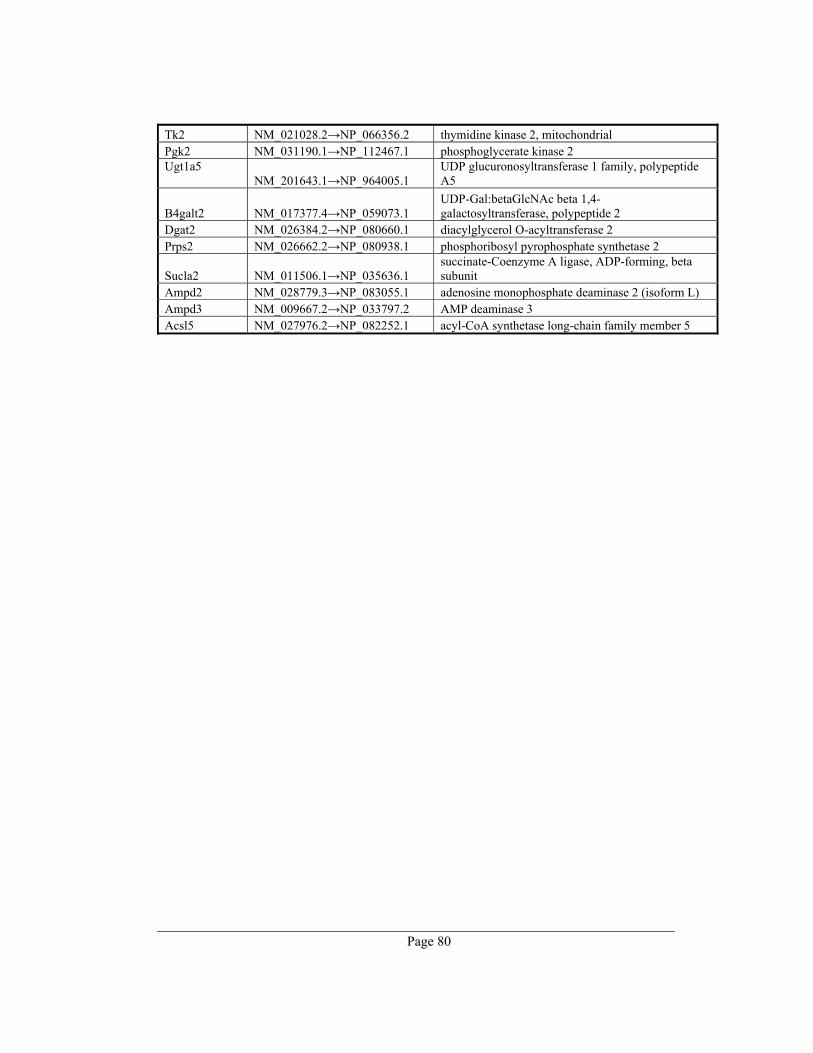
Page 80
Tk2 NM_021028.2→NP_066356.2 thymidine kinase 2, mitochondrial Pgk2 NM_031190.1→NP_112467.1 phosphoglycerate kinase 2 Ugt1a5
NM_201643.1→NP_964005.1 UDP glucuronosyltransferase 1 family, polypeptide A5
B4galt2 NM_017377.4→NP_059073.1 UDP-Gal:betaGlcNAc beta 1,4- galactosyltransferase, polypeptide 2
Dgat2 NM_026384.2→NP_080660.1 diacylglycerol O-acyltransferase 2 Prps2 NM_026662.2→NP_080938.1 phosphoribosyl pyrophosphate synthetase 2
Sucla2 NM_011506.1→NP_035636.1 succinate-Coenzyme A ligase, ADP-forming, beta subunit
Ampd2 NM_028779.3→NP_083055.1 adenosine monophosphate deaminase 2 (isoform L) Ampd3 NM_009667.2→NP_033797.2 AMP deaminase 3 Acsl5 NM_027976.2→NP_082252.1 acyl-CoA synthetase long-chain family member 5

Page 81
9. Appendix B - Publications
1. Hackl* H, Burkard* TR, Sturn A, Rubio R, Schleiffer A, Tian S, Quackenbush J,
Eisenhaber F and Trajanoski Z (*contributed equally): Molecular processes during fat cell
development revealed by gene expression profiling and functional annotation. Genome
Biol. 2005; 6(13):R108
2. Burkard T, Trajanoski Z, Novatchkova M, Hackl H, Eisenhaber F: Identification of New
Targets Using Expression Profiles. In: Antiangiogenic Cancer Therapy, Editors:
Abbruzzese JL, Davis DW, Herbst RS; CRC Press (in press)
3. Hartler J, Thallinger GG, Stocker G, Sturn A, Burkard TR, Körner E, Scheucher A, Rader
R, Schmidt A, Mechtler K, Trajanoski Z: MASPECTRAS: a platform for management
and analysis of proteomic LC-MS/MS data. BMC Bioinformatics. (submitted)
com
ment
reviews
reports
deposited research
refereed researchinteractio
nsinfo
rmatio
n
Open Access2005Hacklet al.Volume 6, Issue 13, Article R108ResearchMolecular processes during fat cell development revealed by gene expression profiling and functional annotationHubert Hackl¤*, Thomas Rainer Burkard¤*†, Alexander Sturn*, Renee Rubio‡, Alexander Schleiffer†, Sun Tian†, John Quackenbush‡, Frank Eisenhaber† and Zlatko Trajanoski*
Addresses: *Institute for Genomics and Bioinformatics and Christian Doppler Laboratory for Genomics and Bioinformatics, Graz University of Technology, Petersgasse 14, 8010 Graz, Austria. †Research Institute of Molecular Pathology, Dr Bohr-Gasse 7, 1030 Vienna, Austria. ‡Dana-Farber Cancer Institute, Department of Biostatistics and Computational Biology, 44 Binney Street, Boston, MA 02115.
¤ These authors contributed equally to this work.
Correspondence: Zlatko Trajanoski. E-mail: [email protected]
© 2005 Hackl et al.; licensee BioMed Central Ltd. This is an open access article distributed under the terms of the Creative Commons Attribution License (http://creativecommons.org/licenses/by/2.0), which permits unrestricted use, distribution, and reproduction in any medium, provided the original work is properly cited.Gene-expression during fat-cell development<p>In-depth bioinformatics analyses of expressed sequence tags found to be differentially expressed during differentiation of 3T3-L1 pre-adipocyte cells were combined with de novo functional annotation and mapping onto known pathways to generate a molecular atlas of fat-cell development.</p>
Abstract
Background: Large-scale transcription profiling of cell models and model organisms can identifynovel molecular components involved in fat cell development. Detailed characterization of thesequences of identified gene products has not been done and global mechanisms have not beeninvestigated. We evaluated the extent to which molecular processes can be revealed by expressionprofiling and functional annotation of genes that are differentially expressed during fat celldevelopment.
Results: Mouse microarrays with more than 27,000 elements were developed, and transcriptionalprofiles of 3T3-L1 cells (pre-adipocyte cells) were monitored during differentiation. In total, 780differentially expressed expressed sequence tags (ESTs) were subjected to in-depth bioinformaticsanalyses. The analysis of 3'-untranslated region sequences from 395 ESTs showed that 71% of thedifferentially expressed genes could be regulated by microRNAs. A molecular atlas of fat celldevelopment was then constructed by de novo functional annotation on a sequence segment/domain-wise basis of 659 protein sequences, and subsequent mapping onto known pathways,possible cellular roles, and subcellular localizations. Key enzymes in 27 out of 36 investigatedmetabolic pathways were regulated at the transcriptional level, typically at the rate-limiting steps inthese pathways. Also, coexpressed genes rarely shared consensus transcription-factor bindingsites, and were typically not clustered in adjacent chromosomal regions, but were instead widelydispersed throughout the genome.
Conclusions: Large-scale transcription profiling in conjunction with sophisticated bioinformaticsanalyses can provide not only a list of novel players in a particular setting but also a global view onbiological processes and molecular networks.
Published: 19 December 2005
Genome Biology 2005, 6:R108 (doi:10.1186/gb-2005-6-13-r108)
Received: 21 July 2005Revised: 23 August 2005Accepted: 8 November 2005
The electronic version of this article is the complete one and can be found online at http://genomebiology.com/2005/6/13/R108
Genome Biology 2005, 6:R108
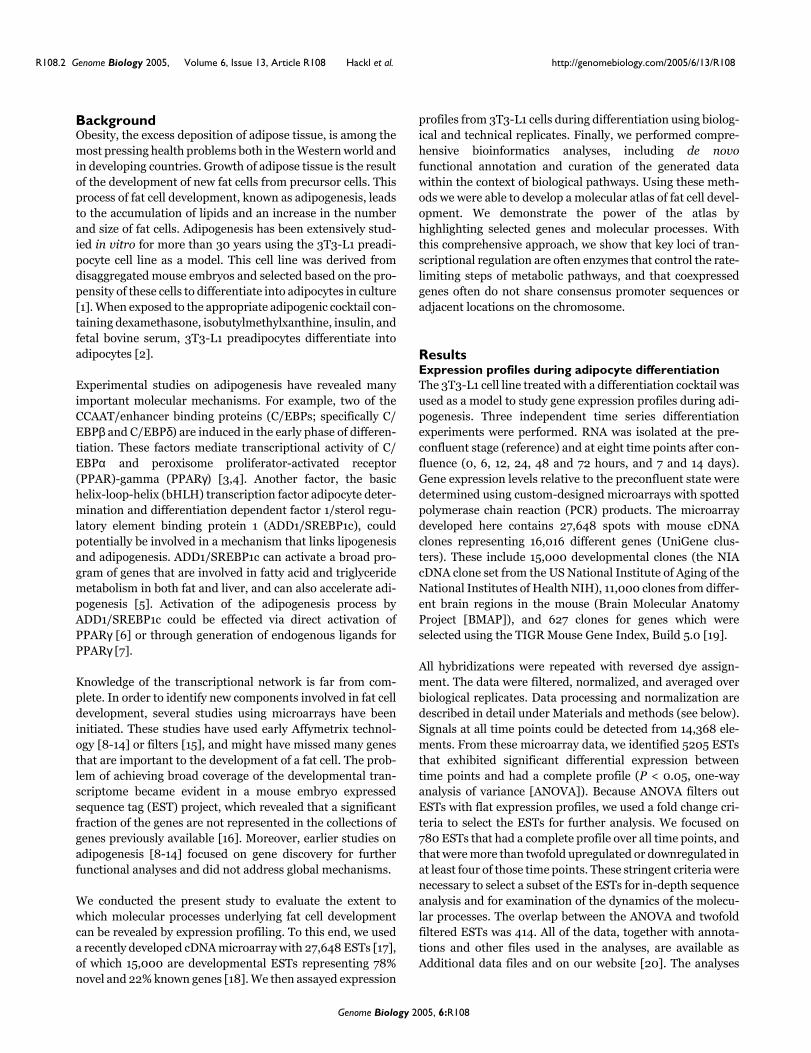
R108.2 Genome Biology 2005, Volume 6, Issue 13, Article R108 Hackl et al. http://genomebiology.com/2005/6/13/R108
BackgroundObesity, the excess deposition of adipose tissue, is among themost pressing health problems both in the Western world andin developing countries. Growth of adipose tissue is the resultof the development of new fat cells from precursor cells. Thisprocess of fat cell development, known as adipogenesis, leadsto the accumulation of lipids and an increase in the numberand size of fat cells. Adipogenesis has been extensively stud-ied in vitro for more than 30 years using the 3T3-L1 preadi-pocyte cell line as a model. This cell line was derived fromdisaggregated mouse embryos and selected based on the pro-pensity of these cells to differentiate into adipocytes in culture[1]. When exposed to the appropriate adipogenic cocktail con-taining dexamethasone, isobutylmethylxanthine, insulin, andfetal bovine serum, 3T3-L1 preadipocytes differentiate intoadipocytes [2].
Experimental studies on adipogenesis have revealed manyimportant molecular mechanisms. For example, two of theCCAAT/enhancer binding proteins (C/EBPs; specifically C/EBPβ and C/EBPδ) are induced in the early phase of differen-tiation. These factors mediate transcriptional activity of C/EBPα and peroxisome proliferator-activated receptor(PPAR)-gamma (PPARγ) [3,4]. Another factor, the basichelix-loop-helix (bHLH) transcription factor adipocyte deter-mination and differentiation dependent factor 1/sterol regu-latory element binding protein 1 (ADD1/SREBP1c), couldpotentially be involved in a mechanism that links lipogenesisand adipogenesis. ADD1/SREBP1c can activate a broad pro-gram of genes that are involved in fatty acid and triglyceridemetabolism in both fat and liver, and can also accelerate adi-pogenesis [5]. Activation of the adipogenesis process byADD1/SREBP1c could be effected via direct activation ofPPARγ [6] or through generation of endogenous ligands forPPARγ [7].
Knowledge of the transcriptional network is far from com-plete. In order to identify new components involved in fat celldevelopment, several studies using microarrays have beeninitiated. These studies have used early Affymetrix technol-ogy [8-14] or filters [15], and might have missed many genesthat are important to the development of a fat cell. The prob-lem of achieving broad coverage of the developmental tran-scriptome became evident in a mouse embryo expressedsequence tag (EST) project, which revealed that a significantfraction of the genes are not represented in the collections ofgenes previously available [16]. Moreover, earlier studies onadipogenesis [8-14] focused on gene discovery for furtherfunctional analyses and did not address global mechanisms.
We conducted the present study to evaluate the extent towhich molecular processes underlying fat cell developmentcan be revealed by expression profiling. To this end, we useda recently developed cDNA microarray with 27,648 ESTs [17],of which 15,000 are developmental ESTs representing 78%novel and 22% known genes [18]. We then assayed expression
profiles from 3T3-L1 cells during differentiation using biolog-ical and technical replicates. Finally, we performed compre-hensive bioinformatics analyses, including de novofunctional annotation and curation of the generated datawithin the context of biological pathways. Using these meth-ods we were able to develop a molecular atlas of fat cell devel-opment. We demonstrate the power of the atlas byhighlighting selected genes and molecular processes. Withthis comprehensive approach, we show that key loci of tran-scriptional regulation are often enzymes that control the rate-limiting steps of metabolic pathways, and that coexpressedgenes often do not share consensus promoter sequences oradjacent locations on the chromosome.
ResultsExpression profiles during adipocyte differentiationThe 3T3-L1 cell line treated with a differentiation cocktail wasused as a model to study gene expression profiles during adi-pogenesis. Three independent time series differentiationexperiments were performed. RNA was isolated at the pre-confluent stage (reference) and at eight time points after con-fluence (0, 6, 12, 24, 48 and 72 hours, and 7 and 14 days).Gene expression levels relative to the preconfluent state weredetermined using custom-designed microarrays with spottedpolymerase chain reaction (PCR) products. The microarraydeveloped here contains 27,648 spots with mouse cDNAclones representing 16,016 different genes (UniGene clus-ters). These include 15,000 developmental clones (the NIAcDNA clone set from the US National Institute of Aging of theNational Institutes of Health NIH), 11,000 clones from differ-ent brain regions in the mouse (Brain Molecular AnatomyProject [BMAP]), and 627 clones for genes which wereselected using the TIGR Mouse Gene Index, Build 5.0 [19].
All hybridizations were repeated with reversed dye assign-ment. The data were filtered, normalized, and averaged overbiological replicates. Data processing and normalization aredescribed in detail under Materials and methods (see below).Signals at all time points could be detected from 14,368 ele-ments. From these microarray data, we identified 5205 ESTsthat exhibited significant differential expression betweentime points and had a complete profile (P < 0.05, one-wayanalysis of variance [ANOVA]). Because ANOVA filters outESTs with flat expression profiles, we used a fold change cri-teria to select the ESTs for further analysis. We focused on780 ESTs that had a complete profile over all time points, andthat were more than twofold upregulated or downregulated inat least four of those time points. These stringent criteria werenecessary to select a subset of the ESTs for in-depth sequenceanalysis and for examination of the dynamics of the molecu-lar processes. The overlap between the ANOVA and twofoldfiltered ESTs was 414. All of the data, together with annota-tions and other files used in the analyses, are available asAdditional data files and on our website [20]. The analyses
Genome Biology 2005, 6:R108

http://genomebiology.com/2005/6/13/R108 Genome Biology 2005, Volume 6, Issue 13, Article R108 Hackl et al. R108.3
com
ment
reviews
reports
refereed researchdepo
sited researchinteractio
nsinfo
rmatio
n
Figure 1 (see legend on next page)
1
2
3
4
5
6
7
8
9
10
11
12
Cluster 2 (64 ESTs)
Cluster 1 (18 ESTs)
Cluster 5 (66 ESTs)
Cluster 6 (46 ESTs)
Cluster 3 (30 ESTs)
Cluster 4 (26 ESTs)
-3.0 1:1 3.0
0h 6h 12h
72h
7d 14d
24h
48h
Cluster 8 (151 ESTs)
Cluster 7 (26 ESTs)
Cluster 11 (26 ESTs)
Cluster 12 (91 ESTs)
Cluster 10 (103 ESTs)
Cluster 9 (132 ESTs)
+3
+2
+1
-1
-2
-3
0
0h 6h 12h 24h+3
+2
+1
-1
-2
-3
0
0h 6h 12h 24h 2d 3d 7d 14d+3
+2
+1
-1
-2
-3
0
0h 6h 12h 24h 2d 3d 7d 14d+3
+2
+1
-1
-2
-3
0
0h 6h 12h 24h 2d 3d 7d 14d+3
+2
+1
-1
-2
-3
0
0h 6h 12h 24h 2d 3d 7d 14d+3
+2
+1
-1
-2
-3
0
0h 6h 12h 24h 2d 3d 7d 14d
+5
+4
+3
+2
+1
0
-1 0h 6h 12h 24h 2d 3d 7d 14d
+3
+2
+1
-1
-2
-3
0
0h 6h 12h 24h 2d 3d
+3
+2
+1
-1
-2
-3
0
0h 6h 12h 24h 2d 3d 7d 14d
+3
+2
+1
-1
-2
-3
0
0h 6h 12h 24h 2d 3d 7d 14d
+3
+2
+1
-1
-2
-3
0
0h 6h 12h 24h 2d 3d 7d 14d
+3
+2
+1
-1
-2
-3
0
0h 12h 24h 2d 3d 7d 14d
Genome Biology 2005, 6:R108
R108.4 Genome Biology 2005, Volume 6, Issue 13, Article R108 Hackl et al. http://genomebiology.com/2005/6/13/R108
described in the following text were conducted in the set of780 ESTs.
Validation of expression dataFour lines of evidence support the quality of our data and itsconsistency with existing knowledge of fat cell biology. First,our array data are consistent with reverse transcriptase (RT)-PCR analysis. We compared the microarray data with quanti-tative RT-PCR for six different genes (Pparg [number 592,cluster 6], Lpl [number 14, cluster 6], Myc [number 224, clus-ter 11], Dcn [number 137, cluster 7], Ccna2 [number 26, clus-ter 5/8], and Klf9 [number 6, cluster 9]) at different timepoints (Additional data file 9 and on our website [20]). A highdegree of correlation was found (r2 = 0.87), confirming thevalidity of the microarray data.
Second, statistical analyses of the independent experimentsshowed that the reproducibility of the generated data is veryhigh. The Pearson correlation coefficient between the repli-cates was between 0.73 and 0.97 at different time points. Themean coefficient of variation across all genes at each timepoint was between 0.11 and 0.27. The row data and the detailsof the statistical analyses can be found in Additional data file10 and on our website [20].
Third, comparison between our data and the Gene Atlas V2mouse data for adipose tissue [21] shows that the consistencyof the two data sets increases with differentiation state (Addi-tional data files 11 and 12, and our on website [20]). There-fore, this analysis supports the relevance of the chosen cellmodel to in vivo adipogenesis. Among the 382 transcription-ally modulated genes common in both data sets, 67% are reg-ulated in the same direction at time point zero (confluent pre-adipocyte cell culture). At the final stage of differentiation, thecorrelation increases up to 72%. If the Gene Atlas expressiondata are restricted to strongly regulated genes (at least two-fold and fourfold change respectively), then the consistencyin mature adipocytes rises to 82% (135 genes) and 93% (42genes), respectively. Out of all 60 tissues in the Gene Atlas V2mouse, the adipose tissue describes the differentiated state ofthe 3T3-L1 cells best. Brown fat tissue is the second bestmatch to the differentiated adipocytes (69% of the 382genes), followed by adrenal gland (66%), kidney (65%), andheart (64%). At each time point in which cell cycle genes werenot repressed (12 hours and 24 hours), all tissues had similarcorrelation to the data set (44-55% for 382 genes).
The fourth line of evidence supporting the quality of our datais that there is clear correspondence between our data and a
previously published data set [8]. For a group of 153 genesshared among the two studies, the same upregulation ordownregulation was found for 72-89% (depending on timepoint) of all genes (see Additional data file 13 and our website[20]). The highest identity (89%) was found for the stage ter-minally differentiated 3T3-L1 cells, for which the profile isless dependent on the precise extraction time. If the compar-ison is restricted to expression values that are strongly regu-lated in both experiments (at least twofold change at day 14,96 ESTs), then the coincidence at every time point is greaterthan 90%. Comparisons with this [8] and two additional datasets [9,12], and the data pre-processing steps are given inAdditional data files 13, 14, 15 and on our website [20]. Notethat, because of the differences in the used microarray plat-forms, availability of the data, normalization methods, andannotations, only 96 genes are shared between all four stud-ies. Of the 780 ESTs monitored in our work, 326 were notdetected in the previous studies [8,9,12]: 106 RefSeqs (withprefix NM), 43 automatically generated RefSeqs (with prefixXM), and 173 ESTs (Additional data file 16).
Correspondence between transcriptional coexpression and gene functionTo examine the relationships between coexpression and genefunctions, we first clustered 780 ESTs that were twofold dif-ferentially expressed into 12 temporally distinct patterns,containing between 23 and 143 ESTs (Figure 1). ESTs in fourof the clusters are mostly upregulated during adipogenesis,whereas genes in the other eight clusters are mostlydownregulated.
We then categorized ESTs with available RefSeq annotationand Gene Ontology (GO) term (486 out of 780) for molecularfunction, cellular component, and biological process (Figure2). Genes in clusters 5 and 8 are downregulated through thewhole differentiation process and upregulated at 12/24hours. Many of the proteins encoded by these genes areinvolved in cell cycle processes and were residing in thenucleus (Figure 2). Re-entry into the cell cycle of growtharrested pre-adipocytes is known as the clonal expansionphase and considered to be a prerequisite for terminal differ-entiation in 3T3-L1 adipocytes [22]. Genes grouped in cluster2 are highly expressed from 6 hours (onset of clonal expan-sion) to 3 days (start of the appearance of adipocyte morphol-ogy) but are only modestly expressed at the terminaladipocyte differentiation stage. These include a number ofgenes that encode signaling molecules. Genes increasinglyexpressed toward the terminal differentiation stage are inclusters 4, 6, and 7, although from different starting values.
Clustering of ESTs found to be differentially expressed during fat cell differentiationFigure 1 (see previous page)Clustering of ESTs found to be differentially expressed during fat cell differentiation. Shown is k-means clustering of 780 ESTs found to be more than twofold upregulated or downregulated at a minimum of four time points during fat cell differentiation. ESTs were grouped into 12 clusters with distinct expression profiles. Relative expression levels (log2 ratios) for EST gene at different time points are shown and color coded according to the legend at the top (left) and expression profile (mean ± standard deviation) for each cluster (right). EST, expressed sequence tag.
Genome Biology 2005, 6:R108
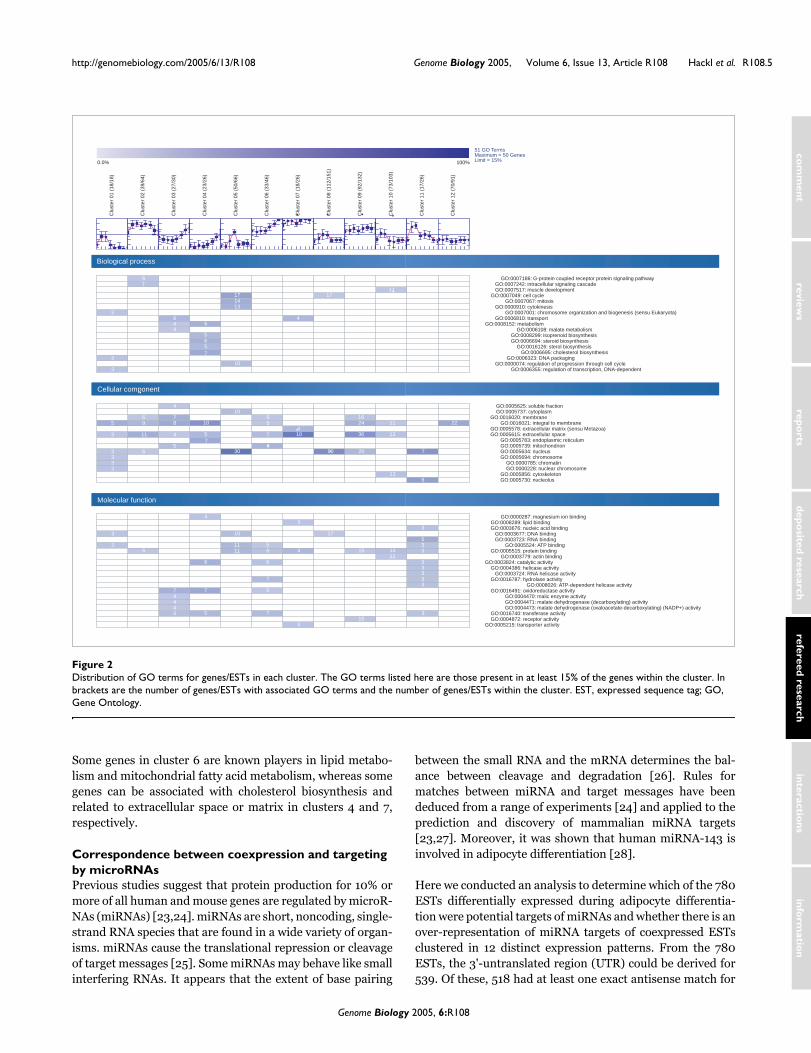
http://genomebiology.com/2005/6/13/R108 Genome Biology 2005, Volume 6, Issue 13, Article R108 Hackl et al. R108.5
com
ment
reviews
reports
refereed researchdepo
sited researchinteractio
nsinfo
rmatio
n
Some genes in cluster 6 are known players in lipid metabo-lism and mitochondrial fatty acid metabolism, whereas somegenes can be associated with cholesterol biosynthesis andrelated to extracellular space or matrix in clusters 4 and 7,respectively.
Correspondence between coexpression and targeting by microRNAsPrevious studies suggest that protein production for 10% ormore of all human and mouse genes are regulated by microR-NAs (miRNAs) [23,24]. miRNAs are short, noncoding, single-strand RNA species that are found in a wide variety of organ-isms. miRNAs cause the translational repression or cleavageof target messages [25]. Some miRNAs may behave like smallinterfering RNAs. It appears that the extent of base pairing
between the small RNA and the mRNA determines the bal-ance between cleavage and degradation [26]. Rules formatches between miRNA and target messages have beendeduced from a range of experiments [24] and applied to theprediction and discovery of mammalian miRNA targets[23,27]. Moreover, it was shown that human miRNA-143 isinvolved in adipocyte differentiation [28].
Here we conducted an analysis to determine which of the 780ESTs differentially expressed during adipocyte differentia-tion were potential targets of miRNAs and whether there is anover-representation of miRNA targets of coexpressed ESTsclustered in 12 distinct expression patterns. From the 780ESTs, the 3'-untranslated region (UTR) could be derived for539. Of these, 518 had at least one exact antisense match for
Distribution of GO terms for genes/ESTs in each clusterFigure 2Distribution of GO terms for genes/ESTs in each cluster. The GO terms listed here are those present in at least 15% of the genes within the cluster. In brackets are the number of genes/ESTs with associated GO terms and the number of genes/ESTs within the cluster. EST, expressed sequence tag; GO, Gene Ontology.
Biological process
Molecular function
Cellular component
Clu
ster
01
(18/
18)
Clu
ster
02
(39/
64)
Clu
ster
03
(27/
30)
Clu
ster
04
(23/
26)
Clu
ster
05
(50/
66)
Clu
ster
06
(33/
46)
Clu
ster
07
(18/
26)
Clu
ster
08
(112
/151
)
Clu
ster
09
(92/
132)
Clu
ster
10
(73/
103)
Clu
ster
11
(17/
26)
Clu
ster
12
(70/
91)
0.0% 100%
51 GO TermsMaximum = 50 GenesLimit = 15%
GO:0007186: G-protein coupled receptor protein signaling pathway GO:0007242: intracellular signaling cascade GO:0007517: muscle development GO:0007049: cell cycle GO:0007067: mitosis GO:0000910: cytokinesis GO:0007001: chromosome organization and biogenesis (sensu Eukaryota) GO:0006810: transportGO:0008152: metabolism GO:0006108: malate metabolism GO:0008299: isoprenoid biosynthesis GO:0006694: steroid biosynthesis GO:0016126: sterol biosynthesis GO:0006695: cholesterol biosynthesis GO:0006323: DNA packaging GO:0000074: regulation of progression through cell cycle GO:0006355: regulation of transcription, DNA-dependent
GO:0005625: soluble fraction GO:0005737: cytoplasmGO:0016020: membrane GO:0016021: integral to membraneGO:0005578: extracellular matrix (sensu Metazoa)GO:0005615: extracellular space GO:0005783: endoplasmic reticulum GO:0005739: mitochondrion GO:0005634: nucleus GO:0005694: chromosome GO:0000785: chromatin GO:0000228: nuclear chromosome GO:0005856: cytoskeleton GO:0005730: nucleolus
GO:0000287: magnesium ion binding GO:0008289: lipid binding GO:0003676: nucleic acid binding GO:0003677: DNA binding GO:0003723: RNA binding GO:0005524: ATP binding GO:0005515: protein binding GO:0003779: actin bindingGO:0003824: catalytic activity GO:0004386: helicase activity GO:0003724: RNA helicase activity GO:0016787: hydrolase activity GO:0008026: ATP-dependent helicase activity GO:0016491: oxidoreductase activity GO:0004470: malic enzyme activity GO:0004471: malate dehydrogenase (decarboxylating) activity GO:0004473: malate dehydrogenase (oxaloacetate-decarboxylating) (NADP+) activity GO:0016740: transferase activity GO:0004872: receptor activityGO:0005215: transporter activity
1117
4
1417
13
10
10
30
10
1111
6
65
57
10
57
4
6
7
5
67
3
3
3644
4
78
4
5
74
44
5
6
3
3
3333
3
569
11
6
55
7
8
410
50
1624
36
20
13
11
13
7
6
22
3
533
33333
1412
15
153
17
3
4
3
7
5
7
6
56
Genome Biology 2005, 6:R108
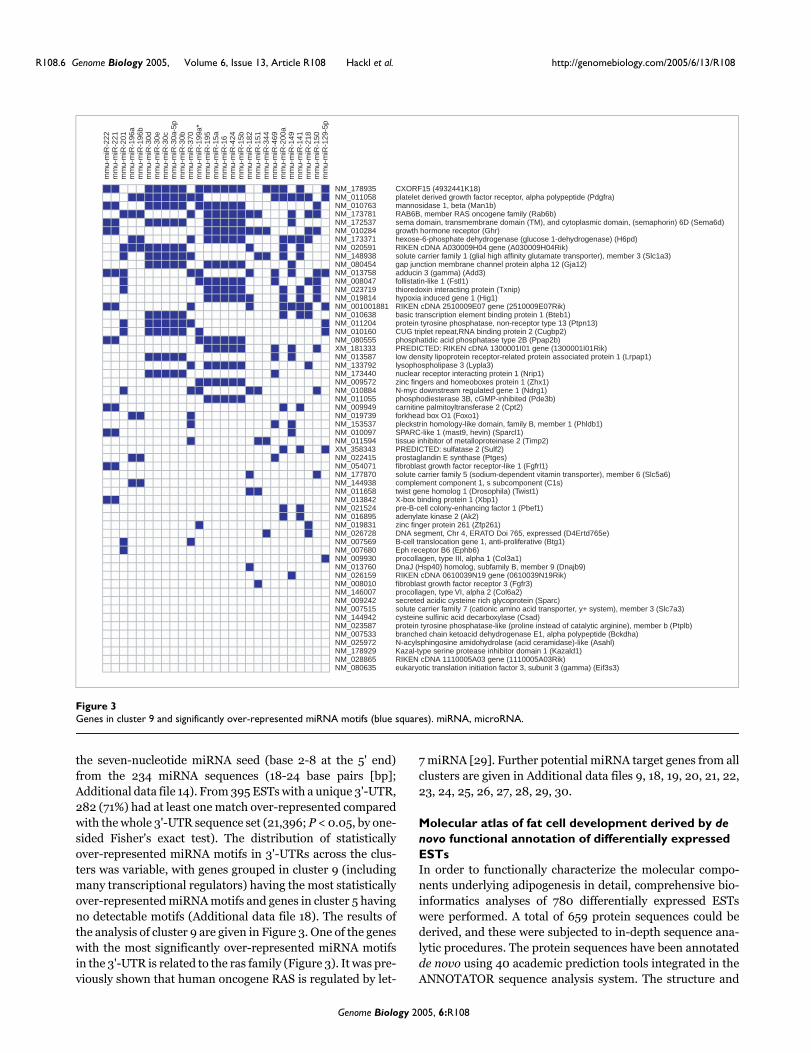
R108.6 Genome Biology 2005, Volume 6, Issue 13, Article R108 Hackl et al. http://genomebiology.com/2005/6/13/R108
the seven-nucleotide miRNA seed (base 2-8 at the 5' end)from the 234 miRNA sequences (18-24 base pairs [bp];Additional data file 14). From 395 ESTs with a unique 3'-UTR,282 (71%) had at least one match over-represented comparedwith the whole 3'-UTR sequence set (21,396; P < 0.05, by one-sided Fisher's exact test). The distribution of statisticallyover-represented miRNA motifs in 3'-UTRs across the clus-ters was variable, with genes grouped in cluster 9 (includingmany transcriptional regulators) having the most statisticallyover-represented miRNA motifs and genes in cluster 5 havingno detectable motifs (Additional data file 18). The results ofthe analysis of cluster 9 are given in Figure 3. One of the geneswith the most significantly over-represented miRNA motifsin the 3'-UTR is related to the ras family (Figure 3). It was pre-viously shown that human oncogene RAS is regulated by let-
7 miRNA [29]. Further potential miRNA target genes from allclusters are given in Additional data files 9, 18, 19, 20, 21, 22,23, 24, 25, 26, 27, 28, 29, 30.
Molecular atlas of fat cell development derived by de novo functional annotation of differentially expressed ESTsIn order to functionally characterize the molecular compo-nents underlying adipogenesis in detail, comprehensive bio-informatics analyses of 780 differentially expressed ESTswere performed. A total of 659 protein sequences could bederived, and these were subjected to in-depth sequence ana-lytic procedures. The protein sequences have been annotatedde novo using 40 academic prediction tools integrated in theANNOTATOR sequence analysis system. The structure and
Genes in cluster 9 and significantly over-represented miRNA motifs (blue squares)Figure 3Genes in cluster 9 and significantly over-represented miRNA motifs (blue squares). miRNA, microRNA.
NM_178935 CXORF15 (4932441K18)NM_011058 platelet derived growth factor receptor, alpha polypeptide (Pdgfra)NM_010763 mannosidase 1, beta (Man1b)NM_173781 RAB6B, member RAS oncogene family (Rab6b)NM_172537 sema domain, transmembrane domain (TM), and cytoplasmic domain, (semaphorin) 6D (Sema6d)NM_010284 growth hormone receptor (Ghr)NM_173371 hexose-6-phosphate dehydrogenase (glucose 1-dehydrogenase) (H6pd)NM_020591 RIKEN cDNA A030009H04 gene (A030009H04Rik)NM_148938 solute carrier family 1 (glial high affinity glutamate transporter), member 3 (Slc1a3)NM_080454 gap junction membrane channel protein alpha 12 (Gja12)NM_013758 adducin 3 (gamma) (Add3)NM_008047 follistatin-like 1 (Fstl1)NM_023719 thioredoxin interacting protein (Txnip)NM_019814 hypoxia induced gene 1 (Hig1)NM_001001881 RIKEN cDNA 2510009E07 gene (2510009E07Rik)NM_010638 basic transcription element binding protein 1 (Bteb1)NM_011204 protein tyrosine phosphatase, non-receptor type 13 (Ptpn13)NM_010160 CUG triplet repeat,RNA binding protein 2 (Cugbp2)NM_080555 phosphatidic acid phosphatase type 2B (Ppap2b)XM_181333 PREDICTED: RIKEN cDNA 1300001I01 gene (1300001I01Rik)NM_013587 low density lipoprotein receptor-related protein associated protein 1 (Lrpap1)NM_133792 lysophospholipase 3 (Lypla3)NM_173440 nuclear receptor interacting protein 1 (Nrip1)NM_009572 zinc fingers and homeoboxes protein 1 (Zhx1)NM_010884 N-myc downstream regulated gene 1 (Ndrg1)NM_011055 phosphodiesterase 3B, cGMP-inhibited (Pde3b)NM_009949 carnitine palmitoyltransferase 2 (Cpt2)NM_019739 forkhead box O1 (Foxo1)NM_153537 pleckstrin homology-like domain, family B, member 1 (Phldb1)NM_010097 SPARC-like 1 (mast9, hevin) (Sparcl1)NM_011594 tissue inhibitor of metalloproteinase 2 (Timp2)XM_358343 PREDICTED: sulfatase 2 (Sulf2)NM_022415 prostaglandin E synthase (Ptges)NM_054071 fibroblast growth factor receptor-like 1 (Fgfrl1)NM_177870 solute carrier family 5 (sodium-dependent vitamin transporter), member 6 (Slc5a6)NM_144938 complement component 1, s subcomponent (C1s)NM_011658 twist gene homolog 1 (Drosophila) (Twist1)NM_013842 X-box binding protein 1 (Xbp1)NM_021524 pre-B-cell colony-enhancing factor 1 (Pbef1)NM_016895 adenylate kinase 2 (Ak2)NM_019831 zinc finger protein 261 (Zfp261)NM_026728 DNA segment, Chr 4, ERATO Doi 765, expressed (D4Ertd765e)NM_007569 B-cell translocation gene 1, anti-proliferative (Btg1)NM_007680 Eph receptor B6 (Ephb6)NM_009930 procollagen, type III, alpha 1 (Col3a1)NM_013760 DnaJ (Hsp40) homolog, subfamily B, member 9 (Dnajb9)NM_026159 RIKEN cDNA 0610039N19 gene (0610039N19Rik)NM_008010 fibroblast growth factor receptor 3 (Fgfr3)NM_146007 procollagen, type VI, alpha 2 (Col6a2)NM_009242 secreted acidic cysteine rich glycoprotein (Sparc)NM_007515 solute carrier family 7 (cationic amino acid transporter, y+ system), member 3 (Slc7a3)NM_144942 cysteine sulfinic acid decarboxylase (Csad)NM_023587 protein tyrosine phosphatase-like (proline instead of catalytic arginine), member b (Ptplb)NM_007533 branched chain ketoacid dehydrogenase E1, alpha polypeptide (Bckdha)NM_025972 N-acylsphingosine amidohydrolase (acid ceramidase)-like (Asahl)NM_178929 Kazal-type serine protease inhibitor domain 1 (Kazald1)NM_028865 RIKEN cDNA 1110005A03 gene (1110005A03Rik)NM_080635 eukaryotic translation initiation factor 3, subunit 3 (gamma) (Eif3s3)
mm
u-m
iR-2
22m
mu-
miR
-221
mm
u-m
iR-2
01m
mu-
miR
-196
am
mu-
miR
-196
bm
mu-
miR
-30d
mm
u-m
iR-3
0em
mu-
miR
-30c
mm
u-m
iR-3
0a-5
pm
mu-
miR
-30b
mm
u-m
iR-3
70m
mu-
miR
-199
a*m
mu-
miR
-195
mm
u-m
iR-1
5am
mu-
miR
-16
mm
u-m
iR-4
24m
mu-
miR
-15b
mm
u-m
iR-1
82m
mu-
miR
-151
mm
u-m
iR-3
44m
mu-
miR
-469
mm
u-m
iR-2
00a
mm
u-m
iR-1
49m
mu-
miR
-141
mm
u-m
iR-2
18m
mu-
miR
-150
mm
u-m
iR-1
29-5
p
Genome Biology 2005, 6:R108
http://genomebiology.com/2005/6/13/R108 Genome Biology 2005, Volume 6, Issue 13, Article R108 Hackl et al. R108.7
com
ment
reviews
reports
refereed researchdepo
sited researchinteractio
nsinfo
rmatio
n
function was annotated on a sequence segment/domain-wisebasis. After extensive literature search and curation using thesequence architecture, 345 gene products were mapped ontoknown pathways, possible cellular roles, and subcellularlocalizations (Figure 4) using the PathwayExplorer web serv-ice [30] as well as manual literature and domain-basedassignment. The results of the sequence analyses and addi-tional information is available in the supplementary materialavailable on our website [20] and Additional data files 6, 7, 8.
This molecular atlas of fat cell development provides the firstglobal view of the underlying biomolecular networks and rep-resents a unique resource for deriving testable hypotheses forfuture studies on individual genes. Below we demonstrate theusefulness of the atlas by highlighting the following: estab-lished regulators of fat cell development, recently discoveredfat cell gene products, and candidate transcription factorsexpressed during adipogenesis. The numbering of the genesis given according to the de novo functional annotation (Addi-tional data file 7).
Established regulators of fat cell developmentKey transcription factors SREBF1 (Srebf1 [number 119, clus-ter 9]) and PPARγ (Pparg [number 592, cluster 6]) werehighly expressed during the late phase of differentiation.PPARγ [31] (Pparg [number 592, cluster 6]) is increasing upto about 15-fold. Srebf1 processing is inhibited by insulin-induced gene 1 (Insig1 [number 62, cluster 3/4]) throughbinding of the SREBP cleavage-activation protein [32,33].Insig1 is regulated by Srebf1 and Pparg at the transcriptionallevel [34] and the expression of known marker genes of thedifferentiated adipocyte was increased in parallel with thesefactors. These include genes from clusters 3, 6, and 9 that aretargets of either of these factors: lipoprotein lipase (Lpl[number 14, cluster 6]), c-Cbl-associated protein (Sorbs1[number 92, cluster 6]), stearoyl-CoA desaturase 1 (Scd1[number 305, cluster 6]), carnitine palmitoyltransferase II(Cpt2 [number 43, cluster 9]), and acyl-CoA dehydrogenase(Acadm [number 153, clusters 6 and 9]).
Recently discovered fat cell gene productsDuring the preparation of the manuscript, a number of fac-tors shown to be important to adipocyte function were identi-fied in vivo. All of these factors, which have a possible role inthe pathogenesis of obesity and insulin resistance, werehighly expressed in the present study. Adipose triglyceridelipase (Pnpla2 [number 157, cluster 6]), a patatin domain-containing triglyceride lipase that catalyzes the initial step intriglyceride hydrolysis [35], was more than 20-fold upregu-lated at the terminal differentiation phase. Another example
is Visfatin, which is identical to the pre-B cell colony-enhanc-ing factor (Pbef [number 327, cluster 9]). This 52 kDacytokine has enzymatic function in adipocytes, exerts insulin-mimetic effects in cultured cells, and lowers plasma glucoselevels in mice by binding to the insulin receptor [36-38]. Theimprinted gene mesoderm-specific transcript (Mest [number17, cluster 6/9]), which appears to enlarge adipocytes andcould be a novel marker of the size of adipocytes [12], isupregulated during the late stage of 3T3-L1 differentiation.
Members of the Krüppel-like factor (Klf) family, also knownas basic transcription element binding proteins, are relevantwithin the context of adipocyte differentiation. Klf2 wasshown to inhibit PPARγ expression and to be a negative regu-lator of adipocyte differentiation [39]; Klf5 [40], Klf6 [41],and Klf15 [42] have been demonstrated to induce adipocytedifferentiation. Whereas Klf9 (Bteb1 [number 6, cluster 9])was upregulated in the intermediate phase in the presentstudy, Klf4 (number 100, cluster 12), which was shown toexert effects on cell proliferation opposing those of Klf5 [43],was downregulated. Another twofold upregulated player isForkhead box O1 (Foxo1 [number 53, cluster 9]), whichmediates effects of insulin on the cell. Activation occursbefore the onset of terminal differentiation, when Foxo1becomes dephosphorylated and localizes to the nucleus[44,45]. The glucocorticoid-induced leucine zipper(Tsc22d3/Gilz [number 173, cluster 2]) functions as a tran-scriptional repressor of PPARγ and can antagonize glucocor-ticoid-induced adipogenesis [46,47]. This is consistent withour observation that Gilz is highly upregulated during thefirst two days, when dexamethasone is present in themedium, and downregulated at the end of differentiation,when PPARγ is highly induced. C/EBP homologous protein10 (Ddit3 [number 498, cluster 3]), another type of transcrip-tional repressor that forms nonfunctional heterodimers withmembers of the C/EBP family, was early induced and thendownregulated. This might be sufficient to restore the tran-scriptional activity of C/EBPβ and C/EBPδ [42]. The tran-scription factor insulinoma-associated 1 (Insm1 [number238, cluster 8]) is associated with differentiation into insulin-positive cells and is expressed during embryo development,where it can bind the PPARγ target Cbl-associated protein(Sorbs1 [number 92, cluster 6]; upregulated after induction)[48,49].
Candidate transcription factors expressed during adipogenesisBecause knowledge of the transcriptional network during adi-pogenesis is far from complete, expression profiles have beengenerated and screened for candidate transcription factors[8,9,12]. Here, we identified a number of transcription factors
Cellular localization of gene productsFigure 4 (see following page)Cellular localization of gene products. Shown are the cellular localizations of gene products involved in (a) metabolism and (b) other biological processes during fat cell differentiation. Gene products are color coded for each of the 12 clusters (key given to the left of the figure). The numbering is given according to the de novo functional annotation (Additional data files 6, 7, 8).
Genome Biology 2005, 6:R108
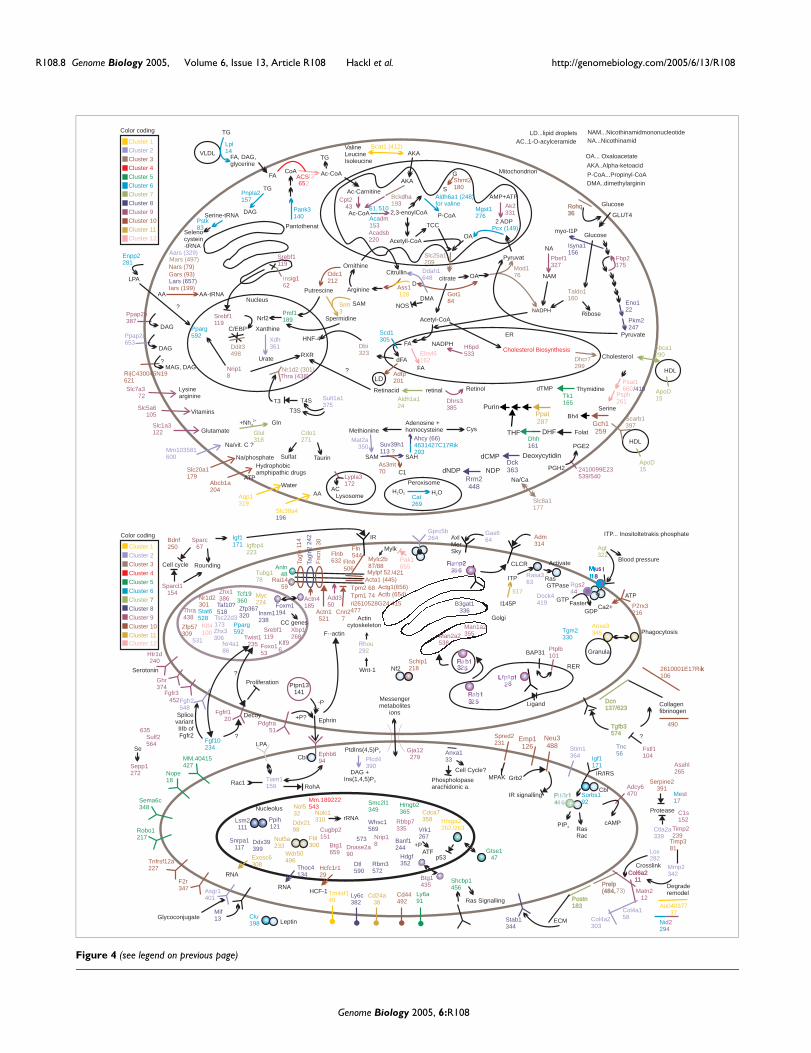
R108.8 Genome Biology 2005, Volume 6, Issue 13, Article R108 Hackl et al. http://genomebiology.com/2005/6/13/R108
Figure 4 (see legend on previous page)
Ins6
ig12
citrate
Acetyl-CoA
NADPH
dFA
retinal
Taldo1160
Glucose
Rohq36Rohq36
Glucose
GLUT4
Retinacid
RXRDhcr7299
HDL
Cholesterol
HDL
ApoD15
ApoD15
Cdo1271
Sulfat Taurin
C/EBP
Ddit3498
Nucleus
Mitochondrion
+Nh42+
Glul318
Gln
Dbi323
HNF-4
?
Scarb1397
Nr1d2 (301)
Slc25a1209
Abca1290
Cholesterol Biosynthesis
Lysinearginine
Slc7a372
VitaminsSlc5a6
105
Slc1a3122 Glutamate
Mm103581600
Na/vit. C ?
Na/phosphate
Slc20a1179 ATP
Hydrophobicamphipathic drugs
Abcb1a204
Water
Aqp1319
Slc38a4196
AASlc8a1177
Nars (79)Gars (93)
AAIars (199)
AA-tRNA
Ribose
Fbp2175
Eno122
Pyruvate
Pkm2247
OA... Oxaloacetate
Pyruvat
OA
Mod176OA
Pcx (149)
AMP+ATP
2 ADP
D
Got184
CitrullinOrnithine
Putrescine
Odc1212
Ass1128
Pmf1189Nrf2
Ac-CoA
Ac-Carnitine
Ac-CoA
2,3-enoylCoA
Acetyll-CoA
TCC
ValineLeucineIsoleucine
AKA..Alpha-ketoacid
AKA
AKA
P-CoA...Propinyl-CoA
P-CoA
Aldh6a1 (248)for valine
Cpt243
Aca15
dm3
Acadsb220
Bcat1 (412)
Pantothenat
Pank3140
CoA
NA...NicothinamidNAM...Nicothinamidmononucleotide
NA
NAM
Pbef1327
Methionine
SAM SAH
Adenosine +homocysteine
C1
Cys
Mat2a350
Ahcy (66)Suv39h1113 ?
As3mt70
Isyna1156
myo-I1P
Mars (497)Aars (329)
Sult1a1375
T4ST3
T3S
DMA
Ddah1648
NOS
DMA..dimethylarginin
VLDL
TG
FA, DAG,glycerine
FA
TG
Lpl14
61,
PeroxisomeH O2 2 H O2Cat
269
Mgst1276
Scd1305
ER
Enpp2281
LPA
Pparg592
Aldh1a124
Retinol
Dhrs3385
G
S
Shmt2180
LD
LD...lipid droplets
Ri|C430045N19621
MAG, DAG?
SAM
Spermidine
Nrip18
Srebf1119
Srebf1119
Lysosome
Lypla3172
AC..1-O-acylceramide
AC
Ppap2b387
DAG
Thra (438)
Serine
/418Psph261
Arginine
510
4631427C17Rik293
NADPHFA
TG
DAG
FA
Elovl6162
?
Gch1259
Bh4Ppat287
Purin
DHFTHFDhfr161
Folat
NDPdNDP
DeoxycytidindCMPDck363
Rrm2448
ThymidinedTMPTk1165
Xanthine
Urate
Cluster 9
Cluster 6
Cluster 10
Cluster 8
Cluster 1
Cluster 11
Cluster 7
Cluster 5
Cluster 2Cluster 3Cluster 4
Color coding
Cluster 12
Xdh361 H6pd
533
Adfp201
Pnpla2157
Srm3
Ak2331
Na/Ca
Bck19
dha3
Serine-tRNA
Selenocystein-tRNA
Pstk83
Ppap2c653
DAG
Psat1660
2410099E23539/540
PGE2
PGH2
Lars (657)
l32
Nucleolus
Snrpa1117
Ddx39399
Nol532
Ddx2198
RNA
Nolc1310 rRNA
Wdr50496 p53
RNA
Mm.189222543
HCF-1
Gja12279
Messengermetabolites
ions
Cluster 9
Ephb694Cbl
Ephrin
Ptpn13141
Pdgfra51
+P?
-P
F--actin
Fgfrl120
Proliferation
Fgf10234
?
Twist1235
?
Htr1d240
Serotonin
Decoy
Cluster 6
Adm314
CLCR
Cluster 10
RER
Golgi
Ligand
Cluster 8
Ghr374
Cluster 1
Emp1126
Neu3488
Grb2
IR signalling
Tm4sf149
Ly6c382
Cd24a38
Cluster 11
Acta1 (445)
IR
Tagl
n224
2
Tagl
n11
4
Fsc
n130
Flna506
Cnn27
Actn1521
Rai1459 Tpm2 68
Mylpf 52
Prelp(484,Prelp(484,
Col6a211
Col6a211
Postn183Postn183
ECM
ATP
P2rx3216
Ca2+
2610001E17Rik106
k
Agt322
Blood pressure
Tgfb3574Tgfb3574
Dcn137/623Dcn137/623
Collagenfibrinogen
Cluster 77
Cluster 5
Cluster 2
Cluster 3
Cluster 4
Matn212
Lox282
Crosslink
Sparc67
Cell cycle Rounding
Igf1171
Fstl1104
?
Sparcl1154
Au04037737
B3gat1336
Ppih121
Lsm2111
Nol5a233
Fbl300
Cd44492
F2r347
Tnfrsf12a227
Robo1217
Sema6c348
Serpine2391
Protease
Hmga2262
Granula
Anxa3345 Phagocytosis
Nope18
Gtse147
Anln48
Ly6a91
Tcf19360
Hmgb2365
MM.40415427
Shcbp1456
Ras Signalling
Anxa133
Phospholopasearachidonic a.
Cell Cycle?
Foxm1194
CC genes
Insm1238
Banf1244
Vrk1267
ATF+P
Zfp367320
Stab1344
Hdgf352
Taf10?518
Rg4
s24
GTP
GDPFaster
Col4a158
Activate
ITP Rasa363 Ras
GTPase
ITP... Inositoltetrakis phosphateAxlMerSky
Gas664
Nr4a186
Tiam1159 RohA
Rac1
LPA
Tsc22d3173
G
G
Gprc5b264
Wnt-1
Actincytoskeleton
Col4a2303
Ctla2a339
Mmp2342
Degraderemodel
Stim1364
PtdIns(4,5)P2
Plcd4390
DAG +Ins(1,4,5)P3
Asgr1401
Glycoconjugate
IR/IRS
PIP3 RasRac
531
Fgfr2548
SplicevariantIIIb ofFgfr2
Me1
st7
CblSorbs192
Igf1171
Clu198 Leptin
Asahl265
Stat6528
Igfbp4223
Tnc56
Tpm1 74
Timp381
Mylc2b87
Klf4100
Schip1218Nf2
Spred2231
MPAK
Bdnf250
Zfp57309
490
Fln544Flnb
632
Myc224
Cdca7358
I145P
Klf96Foxo1
53
Cugbp2151
C1s152
Timp2239
Xbp1268
Sepp1272
Se
Zhx1386
Btg1435
Adcy6470
cAMP
Sulf2564
635
Ptplb101BAP31
Smc2l1349
Whsc1569
573
Dtl590
ri2610528G24 415477
/421/88
/263
Rh29
ou2
Zhx3306
Man1a2355 Tgm2
330
Rbbp7335
Dnase2a90
Mif13
73)
Srebf1119
Pparg592
Nrip18
Nr1d2301
Thra438
Color coding
517
Exosc6308 Thoc4
134Hcfc1r129
Add350
Actn4185
Ni29
d24
Cluster 12
Mylk
Pak1655
Man2a2538
Dock4419
Actg1(656)Actb (654)
Btg1659
Rbm3572
Tubg178
ACS65
452Fgfr3
Genome Biology 2005, 6:R108
http://genomebiology.com/2005/6/13/R108 Genome Biology 2005, Volume 6, Issue 13, Article R108 Hackl et al. R108.9
com
ment
reviews
reports
refereed researchdepo
sited researchinteractio
nsinfo
rmatio
n
the exhibit distinct kinetic profiles during adipocytedifferentiation that were previously not functionally associ-ated with adipogenesis. Two transcription factors wereunique to the present study (Zhx3 and Zfp367), and threemore were confirmed (Zhx1, Twist1 and Tcf19) and annotatedin the pathway context.
We found evidence for a role of the zinc finger and homeoboxprotein 3 (Zhx3 [number 306, cluster 2]). Zhx3 as well as Zincfinger and homeobox protein 1 (Zhx1 [number 386, cluster9]) might attach to nuclear factor Y, which in turn binds manyCCAAT and Y-box elements [50]. We also provide dataregarding the expression of zinc finger protein 367 (Zfp367[number 320, cluster 8]) during adipogenesis. The molecularfunction of Zfp367 is as yet uncharacterized.
Additionally, we provide further experimental evidence andpathway context for candidate transcription factors previ-ously identified in microarray screens [9,12], namely Twist1and Tcf19. The Twist gene homolog 1 (Twist1 [number 235,cluster 9]) was about two- to threefold upregulated at 0 hours,72 hours, 7 days, and 14 days. Twist1 is a reversible inhibitorof muscle differentiation [51]. Heterozygous double mutants(Twist1-/+, Twist2-/+) exhibit loss of subcutaneous adiposetissue and severe fat deficiency in internal organs [52]. Twist1is a downstream target of nuclear factor-κB and can represstranscription of tumor necrosis factor-α, which is a potentrepressor of adipogenesis [52,53]. The differential expressionduring adipogenesis of Tcf19 was also confirmed in thepresent study. Tcf19 is a transcription regulator that isinvolved in cell cycle processes at later stages in cell cycle pro-gression [54]. Expression of other regulators that are involvedin the same process support this observation. Forkhead boxM1 (Foxm1 [number 194, cluster 8]) stimulates the expres-sion of cell cycle genes (for instance the genes encoding cyclinB1 and cyclin B2, and Cdc25B and Cdk1). In addition, TAF10RNA polymerase II, also known as TATA box binding protein-associated factor (Taf10 [number 518, cluster 8]), is involvedin G1/S progression and cyclin E expression [55].
Correspondence between phenotypic changes and gene expressionIn addition to the metabolic networks, the molecular atlasalso provides a bird's eye view of other molecular processes,including signaling, the cell cycle, remodeling of the extracel-lular matrix, and cytoskeletal changes. Changes that occurduring adipogenesis (phenotypically seen as rounding ofdensely packed cells) have aspects in common with other tis-sue differentiation processes such as endothelial angiogenesis(protease, collagen, and noncollagen molecule secretion) [56]and specific features. Here we show that phenotypic changesthat occur in maturing adipocytes are paralleled by expres-sion of the respective genes.
Extracellular matrix remodelingMatrix metalloproteinase-2 (MMP-2 [number 342, cluster2]) was strongly upregulated during the entire process of adi-pocyte differentiation. Matrix metalloproteinase-2 can cleavevarious collagen structures and its inhibition can block adipo-genesis [57]. Tissue inhibitor of metalloproteinase-2 (Timp2[number 239, cluster 9]), a known partner of matrix metallo-proteinase-2, which balances the activity of the proprotease/protease [58], was mainly upregulated. Decreased levels oftissue inhibitor of metalloproteinase-3 (number 81, cluster10; upregulated at 6 hours and repressed after 12 hours) areassociated with obese mice [59]. New collagen structures ofoverexpressed Col6a2 (number 11, cluster 9), Col4a1(number 58, cluster 2) and Col4a2 (number 303, cluster 2)[60] are cross-linked by the lysyl oxidase (Lox [number 282,cluster 2]; upregulated during adipogenesis, which is con-trary to findings reported by Dimaculangan and coworkers[61]). Strongly upregulated decorin (Dcn [number 137/623,cluster 7]) and osteoblast specific factor 2 (Postn/Osf-2[number 183, cluster 7]), as well as proline arginine-rich endleucine-rich repeats (Prelp [number 73/484, cluster 3];upregulated in the final stages of adipogenesis), attach thematrix to the cell. Matrillin-2 (Matn2 [number 12, cluster 9];upregulated during adipogenesis) functions as adaptor fornoncollagen structures [62], as does nidogen 2 (Nid2[number 294, clusters 6 and 9]; increasingly upregulated).Secreted protein acidic and rich in cysteine/osteonectin(SPARC [number 67, cluster 9]; mainly upregulated) andSPARC-like 1 (Sparcl1 [number 154, cluster 9]; upregulatedat 0 hours, 72 hours, 7days, and 14 days) can organize extra-cellular matrix remodeling, inhibit cell cycle progression, andinduce cell rounding in cultured cells [63,64].
Reorganization of the cytoskeletonMost cytoskeletal proteins are coexpressed in cluster 10 (notrepressed from 6 to 12 hours) and might have a common reg-ulatory mechanism. Transcription of actin α (Acta1 [number445, cluster 10]) and actin γ (Actg1 [number 656, cluster 10]),tubulin α (Tuba4 [number 377, cluster 8]), and tubulin β(Tubb5 [number 110, cluster 8]) were found to diminish dur-ing differentiation, which is in agreement with other reports[65]. Myosin light chain 2 (Mylc2b/Mylpf [number 87/88/52/421, cluster 10]), and tropomyosin 1 and 2 (Tpm1/Tpm2[number 74/68, cluster 10]) are members of the mainlyrepressed cluster 10. The downregulated transgelin 1 and 2(Tagln/Tagln2 [number 114/242, cluster 10/8]) as well asfascin homolog 1 (Fscn1 [number 30, cluster 10]) are knownactin-bundling proteins [66,67]. Apparently, their absencedecreases the cross-linking of microfilaments in compact par-allel bundles. Calponin 2 (Cnn2 [number 7, cluster 10]), a reg-ulator of cytokinesis, is downregulated [68]. The insulinreceptor and actin binding proteins filamin α and β (Flna/Flnb [number 506/632, cluster 10]) can selectively inhibit themitogen-activated protein kinase signaling cascade of theinsulin receptor [69]. Finally, the maintenance proteinankycorbin (Rai14 [number 59, cluster 10]) and the cross-
Genome Biology 2005, 6:R108
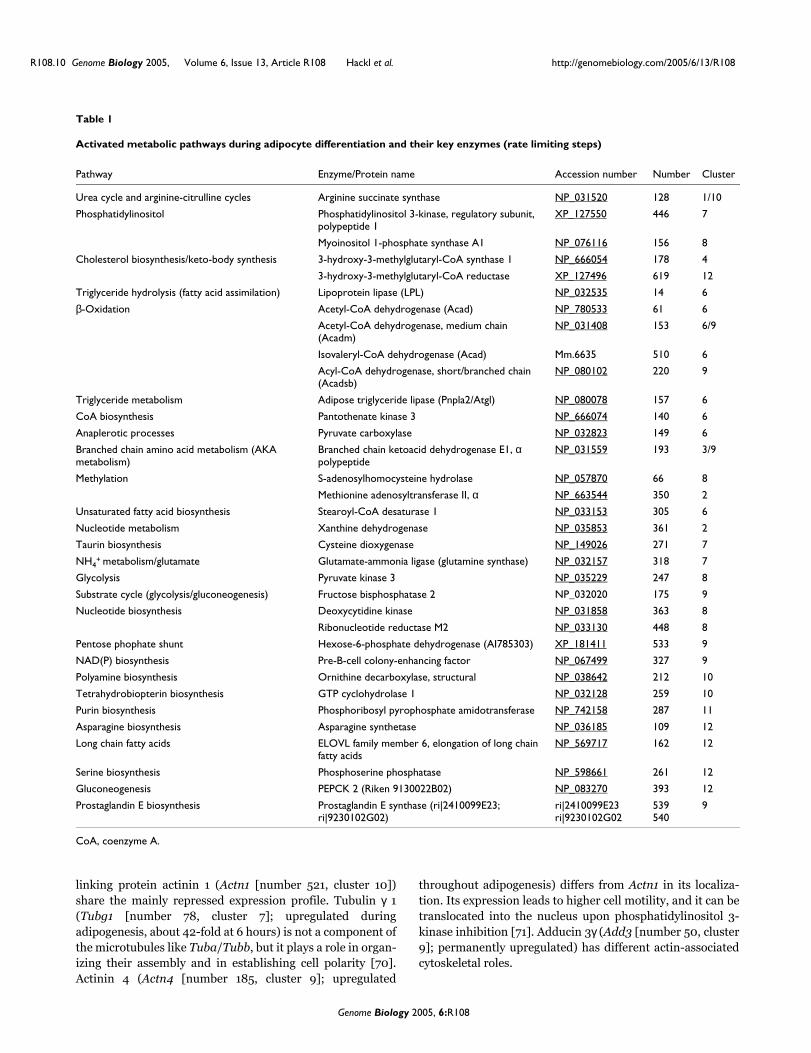
R108.10 Genome Biology 2005, Volume 6, Issue 13, Article R108 Hackl et al. http://genomebiology.com/2005/6/13/R108
linking protein actinin 1 (Actn1 [number 521, cluster 10])share the mainly repressed expression profile. Tubulin γ 1(Tubg1 [number 78, cluster 7]; upregulated duringadipogenesis, about 42-fold at 6 hours) is not a component ofthe microtubules like Tuba/Tubb, but it plays a role in organ-izing their assembly and in establishing cell polarity [70].Actinin 4 (Actn4 [number 185, cluster 9]; upregulated
throughout adipogenesis) differs from Actn1 in its localiza-tion. Its expression leads to higher cell motility, and it can betranslocated into the nucleus upon phosphatidylinositol 3-kinase inhibition [71]. Adducin 3γ (Add3 [number 50, cluster9]; permanently upregulated) has different actin-associatedcytoskeletal roles.
Table 1
Activated metabolic pathways during adipocyte differentiation and their key enzymes (rate limiting steps)
Pathway Enzyme/Protein name Accession number Number Cluster
Urea cycle and arginine-citrulline cycles Arginine succinate synthase NP_031520 128 1/10
Phosphatidylinositol Phosphatidylinositol 3-kinase, regulatory subunit, polypeptide 1
XP_127550 446 7
Myoinositol 1-phosphate synthase A1 NP_076116 156 8
Cholesterol biosynthesis/keto-body synthesis 3-hydroxy-3-methylglutaryl-CoA synthase 1 NP_666054 178 4
3-hydroxy-3-methylglutaryl-CoA reductase XP_127496 619 12
Triglyceride hydrolysis (fatty acid assimilation) Lipoprotein lipase (LPL) NP_032535 14 6
β-Oxidation Acetyl-CoA dehydrogenase (Acad) NP_780533 61 6
Acetyl-CoA dehydrogenase, medium chain (Acadm)
NP_031408 153 6/9
Isovaleryl-CoA dehydrogenase (Acad) Mm.6635 510 6
Acyl-CoA dehydrogenase, short/branched chain (Acadsb)
NP_080102 220 9
Triglyceride metabolism Adipose triglyceride lipase (Pnpla2/Atgl) NP_080078 157 6
CoA biosynthesis Pantothenate kinase 3 NP_666074 140 6
Anaplerotic processes Pyruvate carboxylase NP_032823 149 6
Branched chain amino acid metabolism (AKA metabolism)
Branched chain ketoacid dehydrogenase E1, α polypeptide
NP_031559 193 3/9
Methylation S-adenosylhomocysteine hydrolase NP_057870 66 8
Methionine adenosyltransferase II, α NP_663544 350 2
Unsaturated fatty acid biosynthesis Stearoyl-CoA desaturase 1 NP_033153 305 6
Nucleotide metabolism Xanthine dehydrogenase NP_035853 361 2
Taurin biosynthesis Cysteine dioxygenase NP_149026 271 7
NH4+ metabolism/glutamate Glutamate-ammonia ligase (glutamine synthase) NP_032157 318 7
Glycolysis Pyruvate kinase 3 NP_035229 247 8
Substrate cycle (glycolysis/gluconeogenesis) Fructose bisphosphatase 2 NP_032020 175 9
Nucleotide biosynthesis Deoxycytidine kinase NP_031858 363 8
Ribonucleotide reductase M2 NP_033130 448 8
Pentose phophate shunt Hexose-6-phosphate dehydrogenase (AI785303) XP_181411 533 9
NAD(P) biosynthesis Pre-B-cell colony-enhancing factor NP_067499 327 9
Polyamine biosynthesis Ornithine decarboxylase, structural NP_038642 212 10
Tetrahydrobiopterin biosynthesis GTP cyclohydrolase 1 NP_032128 259 10
Purin biosynthesis Phosphoribosyl pyrophosphate amidotransferase NP_742158 287 11
Asparagine biosynthesis Asparagine synthetase NP_036185 109 12
Long chain fatty acids ELOVL family member 6, elongation of long chain fatty acids
NP_569717 162 12
Serine biosynthesis Phosphoserine phosphatase NP_598661 261 12
Gluconeogenesis PEPCK 2 (Riken 9130022B02) NP_083270 393 12
Prostaglandin E biosynthesis Prostaglandin E synthase (ri|2410099E23; ri|9230102G02)
ri|2410099E23ri|9230102G02
539540
9
CoA, coenzyme A.
Genome Biology 2005, 6:R108

http://genomebiology.com/2005/6/13/R108 Genome Biology 2005, Volume 6, Issue 13, Article R108 Hackl et al. R108.11
com
ment
reviews
reports
refereed researchdepo
sited researchinteractio
nsinfo
rmatio
n
T-lymphoma invasion and metastasis 1 (Tiam1 [number 159,cluster 2]) is a guanine nucleotide exchange factor of thesmall GTPase Rac1, which regulates actin cytoskeleton, mor-phology and adhesion, and antagonizes RhoA signaling[72,73]. Additionally, the putative constitutive active RhoGTPase ras homolog gene family, member U/Wnt1 respon-sive Cdc42 homolog (Rhou/Wrch-1 [number 292, clusters 2and 7]), which has no detectable intrinsic GTPase activity andvery high nucleotide exchange capacity, leads to an pheno-type of mature adipocyte [74,75]. Interplay between Rhouand Tiam1, which might reverse Rhou activity through Rac1signaling [74], could be a mechanism for regulating cell mor-phology in adipogenesis.
In summary, the evidence presented above suggests thatreduced replenishment of the cytoskeleton with buildingblocks and the strong transcriptional upregulation of modu-lating proteins, together with the extracellular remodeling,are responsible for the morphological changes that occur dur-ing differentiation of 3T3-L1 cells.
Regulation of metabolic networks at the transcriptional level via key points of pathwaysWe next used the molecular atlas to derive novel biologicalinsights from the global view of molecular processes. We ana-lyzed transcriptionally regulated genes that are members of36 different metabolic pathways. Within each pathway, weconsidered whether these transcriptionally regulated genesoccupy key positions, such as a position at the pathway start,which is the typical rate-limiting step where the amount ofenzyme is critical [76], or at some other point of regulation.We found that such key positions are occupied by transcrip-tionally regulated targets in 27 pathways (an overview is pro-vided in Table 1). Those pathways that are stronglytranscriptionally regulated at key points are illustrated in Fig-ure 5 at the time points 0, 24 and 48 hours, and 14 days. Foradditional time points and images with more detailedinformation from all investigated pathways, see our website[20] and Additional data files Additional data file 31 andAdditional data file 32.
In the following discussion we present the evidence for tran-scriptional regulation at key points for five selected metabolicpathways. Further information on other pathways can befound in Additional data files 31, 32, 33, 34, 35, 36, 37, 38 andon our website [20].
Biosynthesis of the important lipogenic cofactors CoA and NAD(P)+ are transcriptionally regulated at their key enzymesCoenzyme A (CoA) is the carrier of the fatty acid precursoracetate/malonate [77,78]. Panthotenate kinase 3 (Pank3[number 140, cluster 6]; about eightfold upregulated) isresponsible for the first and rate-limiting step in convertingpanthotenate to CoA [79]. Nicotinamide adeninedinucleotide phosphate (reduced form; NADPH) is necessaryin reductive reactions for fatty acid synthesis. Pre-B-cell col-
ony-enhancing factor (Visfatin/Pbef1 [number 327, cluster9]; strongest upregulated in the last three points of the timecourse in parallel with the emergence of fat droplets) is therate-limiting enzyme in NAD(P)+ biosynthesis [38,80]. Forreduction of NADP+ to NADPH, two major mechanisms areresponsible: the pentose phosphate shunt and the tricarboxy-late transport system. Hexose-6P dehydrogenase (H6pd[number 533, cluster 9]; upregulated throughout adipogene-sis) is the rate limiting enzyme of the pentose phosphateshunt in the endoplasmic reticulum and provides NADPH toits lumen [81]. In the cytosolic pendant in the pentosephosphate shunt, the transaldolase (Taldo1 [number 160,cluster 3]) is repressed at early stages and is about threefoldupregulated at the end of 3T3-L1 differentiation. This expres-sion change appears to switch the shunt between ribose-5-phosphate (for nucleic acid synthesis) and NADPH (for fattyacid production) synthesis at early and late time points,respectively. A similar expression profile is observed for thecytosolic NADP-dependent malic enzyme (Mod1 [number 76,cluster 3]) and the citrate transporter (Slc25a1/Ctp1 [number209, cluster 3]). Both are part of the tricarboxylate transportsystem through the mitochondrial membrane. Transcriptionof the anaplerotic pyruvate carboxylase (Pcx [number 149,cluster 6]; activated by acetyl-CoA) is increasingly upregu-lated up to 16-fold toward the final two time points.
Fatty acid modification and assimilation is transcriptionally regulated at the rate-limiting stepsThe transcriptional expression of stearoyl-CoA desaturase 1(Scd1 [number 305, cluster 6]), which catalyzes the rate-lim-iting reaction of monounsaturated fatty acid synthesis andwhich is an important marker gene of adipogenesis [82,83], isdownregulated at induction but increases up to 60-fold withadvancing adipogenesis. In contrast to previous reports [82],we found that the gene for elongation of long-chain fatty acid(Elovl6 [number 162, cluster 12]) protein, which may be therate-limiting enzyme of long chain elongation to stearate[84], is not overexpressed in differentiated 3T3-L1 cells as inadipose tissue. Elovl6 appears repressed during the entireprocess of adipogenesis in 3T3-L1 cells. Expression of lipo-protein lipase (Lpl [number 14, cluster 6]), the rate-limitingenzyme of extracellular triglyceride-rich lipoprotein hydro-lyzation and triglyceride assimilation [85-87], increases withtime up to 21-fold in differentiated adipocytes.
Transcriptional regulation of triglyceride and fatty acid degradation is performed at key pointsAdipose triglyceride lipase (Pnpla2/Atgl [number 157, cluster6]) executes the initial step in triglyceride metabolism [35].Its expression increases strongly with differentiation progres-sion. Acyl-CoA dehydrogenases (Acadm/Acadsb [number153/220, clusters 6 and 9]) [88], the rate-limiting enzymes ofmedium, short and branched chain β-oxidation, are stronglyupregulated in the final four time points. In contrast, the acyl-CoA dehydrogenase (Acadvl) of very long chain fatty acids isnot in the set of distinctly differentially regulated genes, and
Genome Biology 2005, 6:R108

R108.12 Genome Biology 2005, Volume 6, Issue 13, Article R108 Hackl et al. http://genomebiology.com/2005/6/13/R108
exhibits some upregulation at the final two time points. Thisdifference in expression might shift the enrichment fromshort and medium to long chain fatty acids during adipogen-sis. Branched chain ketoacid dehydrogenase E1 (Bckdha[number 193, clusters 3 and 9]) is the rate-limiting enzyme ofleucine, valine, and isoleucine catabolism and is known to beinhibited by phosphorylation [89]. Its gene shares a similarexpression profile with the Acad genes. The elevated degrada-tion of amino acids allows conversion to fatty acids throughacetyl-CoA.
Several important nucleotide biosynthetic pathway enzymes follow a cell cycle specific expression profile (strongly repressed except between 12 and 24 hours)Phosphoribosylpyrophosphate amidotransferse (Ppat[number 287, cluster 11]) [90] is rate-limiting for purin pro-duction. Deoxycytidine kinase (Dck [number 363, cluster 8])is the rate-limiting enzyme of deoxycytidine (dC),deoxyguanosine (dG) and deoxyadenosine (dA) phosphoryla-
tion [91-93]. Ribonucleotide reductase M2 (Rrm2 [number448, cluster 8]) converts ribonucleotides to desoxyribonucle-otides [94,95]. Additionally, thymidine kinase 1 (Tk1 [number165, cluster 5]) and dihydrofolate reductase (Dhfr [number161, cluster 5/8]) play important roles in dT and purin biosyn-thesis during the cell cycle. In contrast, purin degradation isabout sixfold upregulated between 6 and 72 hours by the rate-limiting xanthine dehydrogenase (Xdh [number 361, cluster2]) [96,97]. These findings are in concordance with those of aprevious study [22], which showed that mitotic clonal expan-sion is a prerequisite for differentiation of 3T3-L1 preadi-pocytes into adipocytes. After induction of differentiation, thegrowth-arrested cells synchronously re-enter the cell cycleand undergo mitotic clonal expansion, as monitored bychanges in cellular DNA content [22]. In accord with thisexperimental evidence, we observed changes in cell cyclegenes, most of which were in clusters 5 and 8 (see our website[20] and Additional data file 37).
Temporal activation of metabolic pathwaysFigure 5Temporal activation of metabolic pathways. Summarized is the activation of metabolic pathways at different time points (0 hours, 24 hours, 3 days, and 14 days) during fat cell differentiation. Color codes are selected according to expression levels of key enzymes in these pathways at distinct time points (red = upregulated; green = downregulated).
0h 24h
3d 14d
Acetyl-CoA NADPH
FA
Glucose
Cholesterol
Nucleus
Mitochondrion
Ribose
Pyruvat
Putrescine
CoA
Polyaminbiosynthesis
CholesterolBiosynthesis
CoABiosynthesis
Beta-Oxidation
Ureacycle
Anapleroticprocess
TCC
Phosphatitylinosidolbiosynthesis
AKAmetabolism
Methyl
Nucleotidemetabolism
Taurinbiosynthesis
Nh4+metabolism
Glyco-lysis
HNK-Epitopbiosynthesis
Nucleotidebiosynthesis
NAD(P)biosynthesis
Tetrahydrobiopterinbiosynthesis
Purinbiosynthesis
Asparaginebiosynthesis
Serinebiosynthesis
Ac-CoA
Substratecycle
Glycero-/Gluconeo-genesis
C1
ation
Golgi
ERCell cycle
NA
Triglyceridehydrolysis
Triglyceridemetabolism
NADPH
Pentosephosphateshunt
FA
FA
Long chainfatty acidbiosynthesis
Unsaturatedfatty acidbiosynthesis
Pentosephosphateshunt
Pyruvate
Log2ratio1
Log2 ratio -1
0.5 L ratio < 1og2 -0.5 <Log2 ratio < 0.5-1< Log2 ratio -0.5
Color coding
Prostaglandin Ebiosynthesis
Acetyl-CoA NADPH
FA
Glucose
Cholesterol
Nucleus
Mitochondrion
Ribose
Pyruvat
Putrescine
CoA
Polyaminbiosynthesis
CholesterolBiosynthesis
CoABiosynthesis
Beta-Oxidation
Ureacycle
Anapleroticprocess
TCC
Phosphatitylinosidolbiosynthesis
AKAmetabolism
Methyl
Nucleotidemetabolism
Taurin
Nh4+metabolism
Glyco-lysis
HNK-Epitopbiosynthesis
Nucleotidebiosynthesis
NAD(P)biosynthesis
Tetrahydrobiopterinbiosynthesis
Purinbiosynthesis
Asparaginebiosynthesis
Serinebiosynthesis
Ac-CoA
Substratecycle
Glycero-/Gluconeo-genesis
C1
ation
Golgi
ERCell cycle
NA
Triglyceridehydrolysis
Triglyceridemetabolism
NADPH
Pentosephosphateshunt
FA
FA
Long chainfatty acidbiosynthesis
Unsaturatedfatty acidbiosynthesis
Pentosephosphateshunt
Pyruvate
Prostaglandin Ebiosynthesis
Acetyl-CoA NADPH
FA
Glucose
Cholesterol
Nucleus
Mitochondrion
Ribose
Pyruvat
Putrescine
CoA
Polyaminbiosynthesis
CholesterolBiosynthesis
CoA
Beta-Oxidation
Ureacycle
Anapleroticprocess
TCC
Phosphatitylinosidolbiosynthesis
AKAmetabolism
Methyl
Nucleotidemetabolism
Taurinbiosynthesis
Nh4+metabolism
Glyco-lysis
HNK-Epitopbiosynthesis
Nucleotidebiosynthesis
NAD(P)biosynthesis
Tetrahydrobiopterinbiosynthesis
Purinbiosynthesis
Asparaginebiosynthesis
Serinebiosynthesis
Ac-CoA
Substratecycle
Glycero-/Gluconeo-genesis
C1
ation
Golgi
ERCell cycle
NA
Triglyceridehydrolysis
Triglyceridemetabolism
NADPH
Pentosephosphateshunt
FA
FA
Long chainfatty acidbiosynthesis
Unsaturatedfatty acidbiosynthesis
Pentosephosphateshunt
Pyruvate
Prostaglandin Ebiosynthesis
Acetyl-CoA NADPH
FA
Glucose
Cholesterol
Nucleus
Mitochondrion
Ribose
Pyruvat
Putrescine
CoA
Polyaminbiosynthesis
CholesterolBiosynthesis
CoABiosynthesis
Beta-Oxidation
Ureacycle
Anapleroticprocess
TCC
Phosphatitylinosidolbiosynthesis
AKAmetabolism
Methyl
Nucleotidemetabolism
Taurinbiosynthesis
Nh4+metabolism
Glyco-lysis
HNK-Epitopbiosynthesis
Nucleotidebiosynthesis
NAD(P)biosynthesis
Tetrahydrobiopterinbiosynthesis
Purinbiosynthesis
Asparaginebiosynthesis
Serinebiosynthesis
Ac-CoA
Substratecycle
Glycero-/Gluconeo-genesis
C1
ation
Golgi
ERCell cycle
NA
Triglyceridehydrolysis
Triglyceridemetabolism
NADPH
Pentosephosphateshunt
FA
FA
Long chainfatty acidbiosynthesis
Unsaturatedfatty acidbiosynthesis
Pentosephosphateshunt
Pyruvate
Prostaglandin Ebiosynthesis
Log2ratio1
Log2 ratio -1
0.5 L ratio < 1og2 -0.5 <Log2 ratio < 0.5-1< Log2 ratio -0.5
Color coding
Log2ratio1
Log2 ratio -1
0.5 L ratio < 1og2 -0.5 <Log2 ratio < 0.5-1< Log2 ratio -0.5
Color codingLog2ratio1
Log2 ratio -1
0.5 L ratio < 1og2 -0.5 <Log2 ratio < 0.5-1< Log2 ratio -0.5
Color coding
Genome Biology 2005, 6:R108
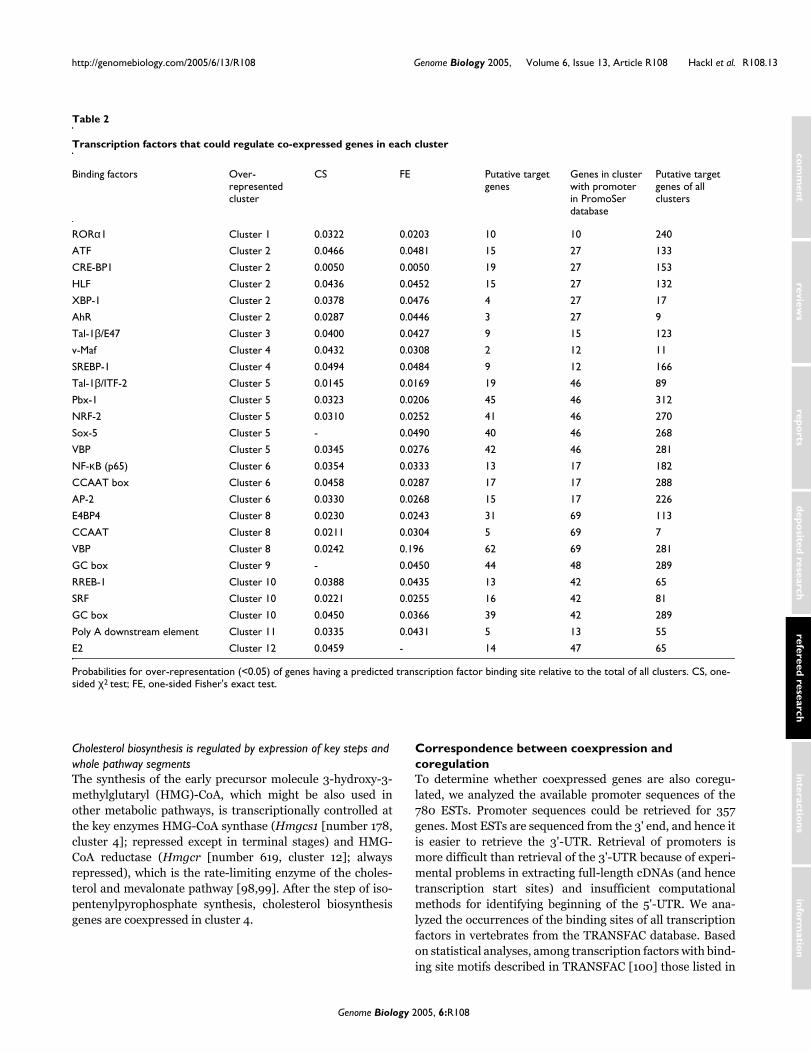
http://genomebiology.com/2005/6/13/R108 Genome Biology 2005, Volume 6, Issue 13, Article R108 Hackl et al. R108.13
com
ment
reviews
reports
refereed researchdepo
sited researchinteractio
nsinfo
rmatio
n
Cholesterol biosynthesis is regulated by expression of key steps and whole pathway segmentsThe synthesis of the early precursor molecule 3-hydroxy-3-methylglutaryl (HMG)-CoA, which might be also used inother metabolic pathways, is transcriptionally controlled atthe key enzymes HMG-CoA synthase (Hmgcs1 [number 178,cluster 4]; repressed except in terminal stages) and HMG-CoA reductase (Hmgcr [number 619, cluster 12]; alwaysrepressed), which is the rate-limiting enzyme of the choles-terol and mevalonate pathway [98,99]. After the step of iso-pentenylpyrophosphate synthesis, cholesterol biosynthesisgenes are coexpressed in cluster 4.
Correspondence between coexpression and coregulationTo determine whether coexpressed genes are also coregu-lated, we analyzed the available promoter sequences of the780 ESTs. Promoter sequences could be retrieved for 357genes. Most ESTs are sequenced from the 3' end, and hence itis easier to retrieve the 3'-UTR. Retrieval of promoters ismore difficult than retrieval of the 3'-UTR because of experi-mental problems in extracting full-length cDNAs (and hencetranscription start sites) and insufficient computationalmethods for identifying beginning of the 5'-UTR. We ana-lyzed the occurrences of the binding sites of all transcriptionfactors in vertebrates from the TRANSFAC database. Basedon statistical analyses, among transcription factors with bind-ing site motifs described in TRANSFAC [100] those listed in
Table 2
Transcription factors that could regulate co-expressed genes in each cluster
Binding factors Over-represented cluster
CS FE Putative target genes
Genes in cluster with promoter in PromoSer database
Putative target genes of all clusters
RORα1 Cluster 1 0.0322 0.0203 10 10 240
ATF Cluster 2 0.0466 0.0481 15 27 133
CRE-BP1 Cluster 2 0.0050 0.0050 19 27 153
HLF Cluster 2 0.0436 0.0452 15 27 132
XBP-1 Cluster 2 0.0378 0.0476 4 27 17
AhR Cluster 2 0.0287 0.0446 3 27 9
Tal-1β/E47 Cluster 3 0.0400 0.0427 9 15 123
v-Maf Cluster 4 0.0432 0.0308 2 12 11
SREBP-1 Cluster 4 0.0494 0.0484 9 12 166
Tal-1β/ITF-2 Cluster 5 0.0145 0.0169 19 46 89
Pbx-1 Cluster 5 0.0323 0.0206 45 46 312
NRF-2 Cluster 5 0.0310 0.0252 41 46 270
Sox-5 Cluster 5 - 0.0490 40 46 268
VBP Cluster 5 0.0345 0.0276 42 46 281
NF-κB (p65) Cluster 6 0.0354 0.0333 13 17 182
CCAAT box Cluster 6 0.0458 0.0287 17 17 288
AP-2 Cluster 6 0.0330 0.0268 15 17 226
E4BP4 Cluster 8 0.0230 0.0243 31 69 113
CCAAT Cluster 8 0.0211 0.0304 5 69 7
VBP Cluster 8 0.0242 0.196 62 69 281
GC box Cluster 9 - 0.0450 44 48 289
RREB-1 Cluster 10 0.0388 0.0435 13 42 65
SRF Cluster 10 0.0221 0.0255 16 42 81
GC box Cluster 10 0.0450 0.0366 39 42 289
Poly A downstream element Cluster 11 0.0335 0.0431 5 13 55
E2 Cluster 12 0.0459 - 14 47 65
Probabilities for over-representation (<0.05) of genes having a predicted transcription factor binding site relative to the total of all clusters. CS, one-sided χ2 test; FE, one-sided Fisher's exact test.
Genome Biology 2005, 6:R108
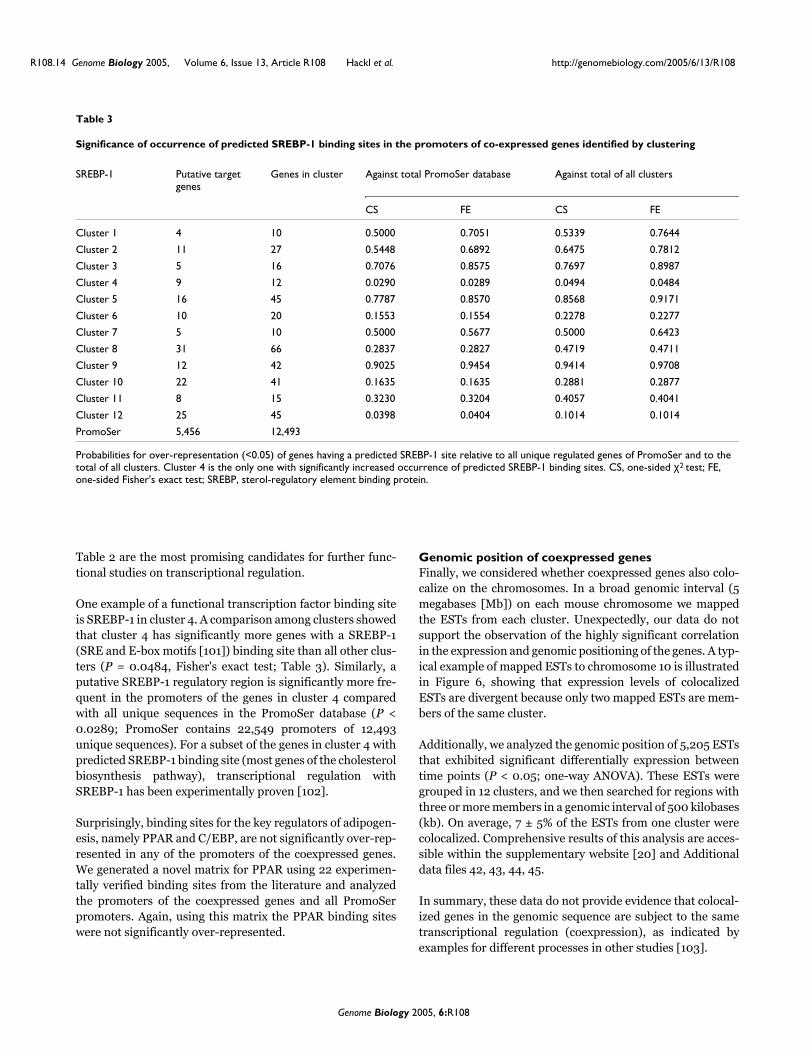
R108.14 Genome Biology 2005, Volume 6, Issue 13, Article R108 Hackl et al. http://genomebiology.com/2005/6/13/R108
Table 2 are the most promising candidates for further func-tional studies on transcriptional regulation.
One example of a functional transcription factor binding siteis SREBP-1 in cluster 4. A comparison among clusters showedthat cluster 4 has significantly more genes with a SREBP-1(SRE and E-box motifs [101]) binding site than all other clus-ters (P = 0.0484, Fisher's exact test; Table 3). Similarly, aputative SREBP-1 regulatory region is significantly more fre-quent in the promoters of the genes in cluster 4 comparedwith all unique sequences in the PromoSer database (P <0.0289; PromoSer contains 22,549 promoters of 12,493unique sequences). For a subset of the genes in cluster 4 withpredicted SREBP-1 binding site (most genes of the cholesterolbiosynthesis pathway), transcriptional regulation withSREBP-1 has been experimentally proven [102].
Surprisingly, binding sites for the key regulators of adipogen-esis, namely PPAR and C/EBP, are not significantly over-rep-resented in any of the promoters of the coexpressed genes.We generated a novel matrix for PPAR using 22 experimen-tally verified binding sites from the literature and analyzedthe promoters of the coexpressed genes and all PromoSerpromoters. Again, using this matrix the PPAR binding siteswere not significantly over-represented.
Genomic position of coexpressed genesFinally, we considered whether coexpressed genes also colo-calize on the chromosomes. In a broad genomic interval (5megabases [Mb]) on each mouse chromosome we mappedthe ESTs from each cluster. Unexpectedly, our data do notsupport the observation of the highly significant correlationin the expression and genomic positioning of the genes. A typ-ical example of mapped ESTs to chromosome 10 is illustratedin Figure 6, showing that expression levels of colocalizedESTs are divergent because only two mapped ESTs are mem-bers of the same cluster.
Additionally, we analyzed the genomic position of 5,205 ESTsthat exhibited significant differentially expression betweentime points (P < 0.05; one-way ANOVA). These ESTs weregrouped in 12 clusters, and we then searched for regions withthree or more members in a genomic interval of 500 kilobases(kb). On average, 7 ± 5% of the ESTs from one cluster werecolocalized. Comprehensive results of this analysis are acces-sible within the supplementary website [20] and Additionaldata files 42, 43, 44, 45.
In summary, these data do not provide evidence that colocal-ized genes in the genomic sequence are subject to the sametranscriptional regulation (coexpression), as indicated byexamples for different processes in other studies [103].
Table 3
Significance of occurrence of predicted SREBP-1 binding sites in the promoters of co-expressed genes identified by clustering
SREBP-1 Putative target genes
Genes in cluster Against total PromoSer database Against total of all clusters
CS FE CS FE
Cluster 1 4 10 0.5000 0.7051 0.5339 0.7644
Cluster 2 11 27 0.5448 0.6892 0.6475 0.7812
Cluster 3 5 16 0.7076 0.8575 0.7697 0.8987
Cluster 4 9 12 0.0290 0.0289 0.0494 0.0484
Cluster 5 16 45 0.7787 0.8570 0.8568 0.9171
Cluster 6 10 20 0.1553 0.1554 0.2278 0.2277
Cluster 7 5 10 0.5000 0.5677 0.5000 0.6423
Cluster 8 31 66 0.2837 0.2827 0.4719 0.4711
Cluster 9 12 42 0.9025 0.9454 0.9414 0.9708
Cluster 10 22 41 0.1635 0.1635 0.2881 0.2877
Cluster 11 8 15 0.3230 0.3204 0.4057 0.4041
Cluster 12 25 45 0.0398 0.0404 0.1014 0.1014
PromoSer 5,456 12,493
Probabilities for over-representation (<0.05) of genes having a predicted SREBP-1 site relative to all unique regulated genes of PromoSer and to the total of all clusters. Cluster 4 is the only one with significantly increased occurrence of predicted SREBP-1 binding sites. CS, one-sided χ2 test; FE, one-sided Fisher's exact test; SREBP, sterol-regulatory element binding protein.
Genome Biology 2005, 6:R108
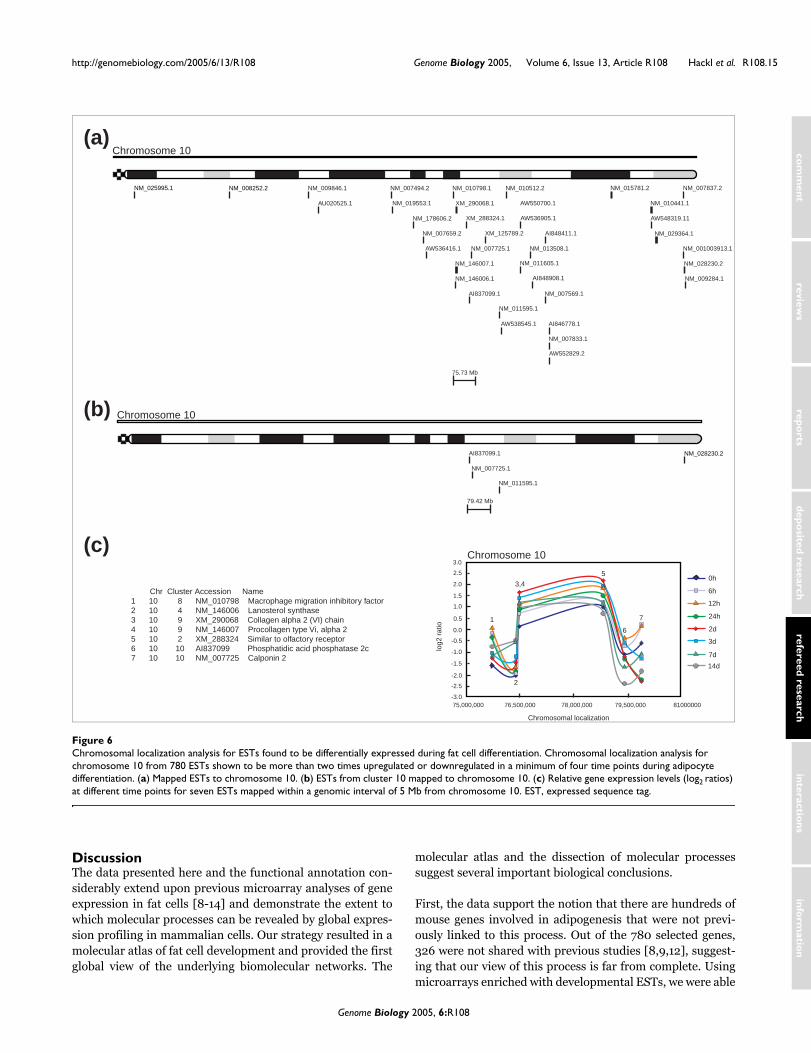
http://genomebiology.com/2005/6/13/R108 Genome Biology 2005, Volume 6, Issue 13, Article R108 Hackl et al. R108.15
com
ment
reviews
reports
refereed researchdepo
sited researchinteractio
nsinfo
rmatio
n
DiscussionThe data presented here and the functional annotation con-siderably extend upon previous microarray analyses of geneexpression in fat cells [8-14] and demonstrate the extent towhich molecular processes can be revealed by global expres-sion profiling in mammalian cells. Our strategy resulted in amolecular atlas of fat cell development and provided the firstglobal view of the underlying biomolecular networks. The
molecular atlas and the dissection of molecular processessuggest several important biological conclusions.
First, the data support the notion that there are hundreds ofmouse genes involved in adipogenesis that were not previ-ously linked to this process. Out of the 780 selected genes,326 were not shared with previous studies [8,9,12], suggest-ing that our view of this process is far from complete. Usingmicroarrays enriched with developmental ESTs, we were able
Chromosomal localization analysis for ESTs found to be differentially expressed during fat cell differentiationFigure 6Chromosomal localization analysis for ESTs found to be differentially expressed during fat cell differentiation. Chromosomal localization analysis for chromosome 10 from 780 ESTs shown to be more than two times upregulated or downregulated in a minimum of four time points during adipocyte differentiation. (a) Mapped ESTs to chromosome 10. (b) ESTs from cluster 10 mapped to chromosome 10. (c) Relative gene expression levels (log2 ratios) at different time points for seven ESTs mapped within a genomic interval of 5 Mb from chromosome 10. EST, expressed sequence tag.
NM_025995.1 NM_008252.2
NM_007659.2
NM_013508.1NM_007725.1AW536416.1
AW536905.1XM_288324.1NM_178606.2
XM_290068.1
AI848411.1XM_125789.2
AW550700.1
NM_010512.2NM_010798.1
NM_146007.1 NM_011605.1
NM_146006.1 AI848908.1
NM_015781.2 NM_007837.2
NM_009284.1
AW548319.11
NM_029364.1
NM_028230.2
NM_001003913.1
NM_010441.1
AW552829.2
79.42 Mb
75.73 Mb
NM_011595.1
NM_028230.2
NM_007725.1
AI837099.1
NM_007833.1
AI846778.1AW538545.1
NM_011595.1
NM_007569.1AI837099.1
NM_019553.1
NM_007494.2
AU020525.1
NM_009846.1
Chr Cluster Accession Name1 10 8 NM_010798 Macrophage migration inhibitory factor2 10 4 NM_146006 Lanosterol synthase3 10 9 XM_290068 Collagen alpha 2 (VI) chain4 10 9 NM_146007 Procollagen type Vi, alpha 25 10 2 XM_288324 Similar to olfactory receptor6 10 10 AI837099 Phosphatidic acid phosphatase 2c7 10 10 NM_007725 Calponin 2
Chromosome 10
Chromosome 10
Chromosome 10
2.5
3.0
2.0
1.5
1.0
0.5
0.0
-0.5
-1.0
-1.5
-2.0
-2.5
-3.075,000,000 76,500,000 78,000,000 79,500,000 81000000
Chromosomal localization
log2
rat
io
0h
6h
12h
24h
2d
3d
7d
14d
1
2
3,4
5
6
7
(a)
(b)
(c)
Genome Biology 2005, 6:R108

R108.16 Genome Biology 2005, Volume 6, Issue 13, Article R108 Hackl et al. http://genomebiology.com/2005/6/13/R108
not only to identify new components of the transcriptionalnetwork but also to map the gene products onto molecularpathways. The molecular atlas we developed is a uniqueresource for deriving testable hypothesis. For example, wehave identified several differentially expressed genes, includ-ing recently discovered gene products (Pnpla2, Pbef1, Mest)and transcription factors not previously detected in microar-ray screens (Zhx3 and Zfp367).
Second, from our global analysis of the potential role of miR-NAs in fat cell differentiation, we were able to predict poten-tial target genes for miRNAs in 71% of the 395 genes with aunique 3'-UTR that were differentially expressed during adi-pocyte differentiation. The distribution of predicted miRNAtargets indicated that one miRNA may regulate many genesand that one gene can be regulated by a number of miRNAs.The function of the potential target genes was diverse andincluded transcription factors, enzymes, transmembraneproteins, and signaling molecules. Genes with the lowestnumber of over-represented miRNA motifs were cell cyclegenes (clusters 5 and 8), whereas genes grouped in cluster 9exhibited the most over-represented miRNA motifs in rela-tion to the matches in the control set of all available 3'-UTRsequences. Genes in cluster 9 exhibited high expression val-ues at time point 0 and may include genes relevant to thetransition from pre-confluent to confluent cells. Genes incluster 9 also represent molecular components that areinvolved in other cell processes, including extracellularmatrix remodeling, transport, metabolism, and fat celldevelopment (for example, Foxo1 [44,45]). Genes in otherclusters exhibited varying percentages of over-representedmiRNA motifs and can be associated with diverse biologicalprocesses (Additional data file 6). As an example of functionalmiRNA targets, we showed that one signaling molecule of theras family is a potential target of miRNAs, which is consistentwith a previous observation in humans, in whom it was shownthat the human RAS oncogene is regulated by the let-7miRNA. This example indicates that the present analysis pro-vides promising candidates ranked according to their signifi-cance of over-representation and the number of differentmiRNAs that might regulate these targets in the specific con-text of adipocyte differentiation. It should be noted that ouranalysis included only known miRNAs, suggesting that thenumber of target sites can be even higher. This striking obser-vation could have implications for post-transcriptional regu-lation of other developmental processes. Microarrays for theanalysis of miRNA expression are becoming available andfuture studies will shed light on the role of miRNAs in thecontext of cell differentiation.
Third, we were also able to characterize the mechanisms andgene products involved in the phenotypic changes of pre-adi-pocytes into mature adipocytes. Although the number ofselected genes in this study was limited, we characterizedgene products for extracellular matrix remodeling andcytoskeletal changes during adipogenesis. Other molecular
components involved in these processes can be identified bymapping the characterized gene products onto curated path-ways [30] and selecting missing candidates for furtherfocused studies. Notably, most of the cytoskeletal proteins arecoexpressed in cluster 10 and might have a common regula-tory mechanism. Further computational and experimentalanalyses are needed to verify this hypothesis.
In addition to new information about fat cell development,our comprehensive analysis has provided new general biolog-ical insights that could only be derived from such a globalanalysis. First, we were able to examine at what points meta-bolic pathways were regulated. The global view of biologicalprocesses and networks derived from expression profilesshowed that the metabolic networks are transcriptionally reg-ulated at key points, usually the rate-limiting steps. This wasthe case in 27 out of the 36 metabolic pathways analyzed inthis study. During the development of mature adipocytesfrom pre-adipocytes, distinct metabolic pathways are acti-vated and deactivated by this molecular control mechanism.For example, at the beginning nucleotide metabolism is acti-vated because the cells undergo clonal expansion and oneround of the cell cycle (see out website [20] and Additionaldata file 37). At the end of development, major metabolicpathways for lipid metabolism are upregulated, including β-cell oxidation and fatty acid synthesis (Figure 5). Cell devel-opment is a dramatic process in which the cell undergoes bio-chemical and morphological changes. In our study signals atevery time point could be detected from more than 14,000ESTs. Thus, regulating metabolic networks at key points rep-resents an energy efficient way to control cellular processes.Metabolic networks might be activated/inactivated in a simi-lar manner in other types of cellular differentiation, such asmyogenesis or osteogenesis. It is intriguing to speculate thatsignaling networks are also transcriptionally regulated at keypoints. However, as opposed to the metabolic networks, it isdifficult to verify this hypothesis because the key points arenot clearly identifiable due to both the interwoven nature andthe partial incompleteness of the signaling pathways.
A second general biological insight derived from our globalanalysis is that we found that many genes were upregulatedby well known transcription factors that nevertheless lackedanything resembling the established upstream promoter con-sensus sites. Over-represented binding sites for key regula-tors such as PPAR and C/EBP were not detectable with theTRANSFAC matrices. Even the use of a matrix based on allcurrently available experimentally validated sequences, suchas PPAR, did not result in a significant hit. Hence, only fewsequences contain this motif in their promoters. These resultsdemonstrate either that much more sophisticated methodsmust be developed or that there are many cases where thecurrent methods do not perform well because other aspectssuch as chromatin determine the recognition site.
Genome Biology 2005, 6:R108
http://genomebiology.com/2005/6/13/R108 Genome Biology 2005, Volume 6, Issue 13, Article R108 Hackl et al. R108.17
com
ment
reviews
reports
refereed researchdepo
sited researchinteractio
nsinfo
rmatio
n
A third general piece of information derived from our globalanalysis is the finding that coexpressed genes in fat cell devel-opment are not clustered in the genome. Previous studiesidentified a number of such cases in a range of organisms,including yeast [104], worms [105], and flies [106]. Thisobservation of significant correlation in the expression andgenomic position of genes was recently reported in the mouse[103]. In the present study we could not identify groups ofgenes with similar expression profiles, for instance within thesame cluster within 5 Mb regions on the chromosomes. Ourresults suggest that such clustering may not be as widespreadas may be presumed by extrapolating from previous studies.However, coexpressed genes could have distant locations andstill be spatially colocalized due to DNA looping and banding,as was recently shown in a microscopy study [107]. A higherorder chromatin structure of the mammalian transcriptomeis an emerging concept [108], and new methods are requiredto examine the correlation between gene activity and spatialpositioning.
The biological insights gained in this study were only possiblewith in-depth bioinformatics analyses based on segment anddomain predictions. Distribution of GO terms permits a firstview of the biological processes, molecular functions, and cel-lular components. However, in our work more than 40% ofthe ESTs could not be assigned to GO terms. Moreover,detailed information about the specific functions cannot beextracted. For example, the GO term 'DNA binding' could bespecified by 'zinc-finger domain binding protein' only by in-depth analyses. Hence, de novo functional annotation of ESTsusing integrated prediction tools and subsequent curation ofthe results based on the available literature is not only neces-sary to complete the annotation process but also to reveal theactual biological processes and metabolic networks. Althoughthe number of protein sequences to which a GO term can beassigned is steadily increasing, specific and detailed annota-tion is only possible with de novo functional annotation.
ConclusionIn the present study we demonstrate that, despite the limita-tions due to mRNA abundance (many thousands of genes arenever transcribed above threshold) and insufficient sensitiv-ity, large-scale gene expression profiling in conjunction withsophisticated bioinformatics analyses can provide not only alist of novel players in a particular setting but also a globalview on biological processes and molecular networks.
Materials and methodscDNA microarraysThe microarray developed here contains 27,648 spots withmouse cDNA clones representing 16,016 different genes (Uni-Gene clusters). These include developmental clones (the 15 KNIA cDNA clone set from National Institute of Aging, USNational Institutes of Health) and the 11 K clones from
different brain regions in the mouse (Brain Molecular Anat-omy Project [BMAP]). Moreover, 627 clones for adipose-related genes were selected using the TIGR Mouse GeneIndex Build 5.0 [19]. These cDNA clones were obtained fromthe IMAGE consortium (Research Genetics, Huntsville, AL,USA). The inserts of the NIA and BMAP clones were sequenceverified (insert size about 1-1.5 kb). All PCR products werepurified using size exclusion vacuum filter plates (Millipore,Billerica, MA, USA) and spotted onto amino-silanated glassslides (UltraGAPS II; Corning, Corning, NY, USA) in a 4 × 12print tip group pattern. As spotting buffer 50% dimethyl sul-foxide was used. Negative controls (genomic DNA, genesfrom Arabidopsis thaliana, and dimethyl sulfoxide) and pos-itive controls (Cot1-DNA and salmon sperm DNA) wereincluded in each of the 48 blocks. Samples were bound to theslides by ultraviolet cross-linking at 200 mJ in a Stratalinker(Stratagene, La Jolla, CA, USA).
Cell culture3T3-L1 cells (American Type Culture Collection number CL-173) were grown in 100 mm diameter dishes in Dulbecco'smodified Eagle's medium supplemented with 10% fetalbovine serum, 100 units/ml penicillin, 100 µg/ml streptomy-cin, and 2 mmol/l L-glutamine in an atmosphere of 5% car-bon dioxide at 37°C. Two days after reaching confluence (day0), cells were induced to differentiate with a two-day incuba-tion of a hormone cocktail [109,110] (100 µmol/l 3-iso-butyl-1-methylxanthine, 0.25 µmol/l dexamethasone, 1 µg/ml insu-lin, 0.16 µmol/l pantothenic acid, and 3.2 µmol/l biotin)added to the standard medium described above. After 48hours (day 2), cells were cultured in the standard medium inthe presence of 1 µg/ml insulin, 0.16 µmol/l pantothenic acid,and 3.2 µmol/l biotin until day 14. Nutrition media werechanged every second day.
Three independent cell culture experiments were performed.Cells were harvested and total RNA was isolated at the pre-confluent stage and at eight time points (0, 6, 12 and 24hours, and 3, 4, 7 and 14 days) with TRIzol reagent(Invitrogen-Life Technologies; Carlsbad, CA, USA) [111]. Foreach independent experiment, RNA was pooled from threedifferent culture dishes for each time point and from 24dishes at the preconfluent stage used as reference. The qualityof the RNA was checked using Agilent 2100 Bioanalyzer RNAassays (Agilent Technologies, Palo Alto, CA, USA) by inspec-tion of the 28S and 18S ribosomal RNA intensity peaks.
Labeling and hybridizationThe labeling and hybridization procedures used were basedon those developed at the Institute for Genomic Research[112] and detailed protocols can be viewed on the supplemen-tary website [20]. Briefly, 20 µg total RNA from each timepoint was reverse transcribed in cDNA and indirectly labeledwith Cy5 and 20 µg RNA from the preconfluent stage (refer-ence) was indirectly labeled with Cy3, respectively. This pro-cedure was repeated with reversed dye assignment. Slides
Genome Biology 2005, 6:R108
R108.18 Genome Biology 2005, Volume 6, Issue 13, Article R108 Hackl et al. http://genomebiology.com/2005/6/13/R108
were prehybridized with 1% bovine serum albumen. Then, 10µg mouse Cot1 DNA and 10 µg poly(A) DNA was added to thelabeled cDNA samples and pair-wise cohybridized onto theslide for 20 hours at 42°C. Following washing, slides werescanned with a GenePix 4000B microarray scanner (AxonInstruments, Sunnyvale, CA, USA) at 10 µm resolution. Iden-tical photo multiplier voltage settings were used in the scan-ning of the corresponding dye-swapped hybridized slides.The resulting TIFF images were analyzed with GenePix Pro4.1 software (Axon Instruments).
Data preprocessing and normalizationData were filtered for low intensity, inhomogeneity, and sat-urated spots. To obtain expression values for the saturatedspots, slides were scanned a second time with lower photom-ultiplier tube settings and reanalyzed. All spots of both chan-nels were background corrected (by subtraction of the localbackground). Different sources of systematic (sample, array,dye, and gene effects) and random errors can be associatedwith microarray experiments [113]. Nonbiological variationmust be removed from the measurement values and the ran-dom error can be minimized by normalization [114,115]. Inthe present study, gene-wise dye swap normalization wasapplied. Genes exhibiting substantial differences in intensityratios between technical replicates were excluded from fur-ther analysis based on a two standard deviation cutoff. Theresulting ratios were log2 transformed and averaged overthree independent experiments. The expression profiles werenot rescaled in order to identify genes with high expressionvalues. All experimental parameters, images, and raw andtransformed data were uploaded to the microarray databaseMARS [116] and submitted via MAGE-ML export to a publicrepository (ArrayExpress [117], accession numbers A-MARS-1 and E-MARS-2). Differentially expressed genes were firstidentified using one-way ANOVA (P < 0.05). They were thensubjected to a more stringent criterion; specifically, we con-sidered only those genes with a complete temporal profilethat were more than twofold upregulated or downregulated ata minimum of four time points. The twofold cutoff for differ-entially expressed genes was estimated by applying the signif-icance analyses of microarrays method [118] to the biologicalreplicates and assuming false discovery rate of 5%. In order tocapture the dynamics of various processes, only ESTs differ-entially expressed in at least half of the time points wereselected. Data preprocessing was performed with ArrayNorm[119].
Real-time RT-PCRMicroarray expression results were confirmed with RT-PCR.cDNA was synthesized from 2.5 µg total RNA in 20 µl usingrandom hexamers and SuperScript III reverse transcriptase(Invitrogen, Carlsbad, CA, USA). The design of LUX™ prim-ers for Pparg, Lpl, Myc, Dec, Ccna2, and Klf9 was done usingthe Invitrogen web service (for sequences, see Additional datafile 9 and our website [20]). Quantitative RT-PCR analysesfor these genes were performed starting with 50 ng reverse
transcribed total RNA, with 0.5× Platinum Quantitative PCRSuperMix-UDG (Invitrogen, Carlsbad, CA, USA), with a ROXreference dye, and with a 200 nmol/l concentration of bothLUX™ labeled sense and antisense primers (Invitrogen,Carlsbad, CA, USA) in a 25 µl reaction on an ABI PRISM 7000sequence detection system (Applied Biosystems, Foster City,CA, USA). To measure PCR efficiency, serial dilutions ofreverse transcribed RNA (0.24 pg to 23.8 ng) were amplified.Ribosomal 18S RNA amplifications were used to account forvariability in the initial quantities of cDNA. The relative quan-tification for any given gene with respect to the calibrator(preconfluent stage) was determined using the ∆∆Ct methodand compared with the normalized ratios resulting frommicroarray experiments.
Clustering and gene ontology classificationCommon unsupervised clustering algorithms [120] were usedfor clustering expression profiling of 780 selected ESTs,according to the log ratios from all time points. Using hierar-chical clustering the boundaries of the clusters were notclearly separable and required arbitrary determination of thebranching point of the tree, whereas the results of the cluster-ing using self-organized maps led to clusters with highlydivergent number of ESTs (between 3 and 242). We havetherefore used the k means algorithm [121] and Euclideandistance. The number of clusters was varied from k = 1 to k =20, and predictive power was analyzed with the figure ofmerit [122]. Subsequently, k = 12 was found to be optimal. Toevaluate the results of the k means clustering, principal com-ponent analysis [123] was applied and exhibited low intrac-luster distances and high intercluster dissimilarities. GOterms and GO numbers for molecular function, biologicalprocess, and cellular components were derived from the GeneOntology database (Gene Ontology Consortium) using theGenPept/RefSeq accession numbers for annotated proteinsencoded by selected genes (ESTs). All cluster analyses andvisualizations were performed using Genesis [124].
De novo annotation of ESTsFor each of the 780 selected EST sequences, we attempted tofind the corresponding protein sequence. Megablast [125]searches (word length w = 70, percentage identity p = 95%)against nucleotide databases (in the succession of RefSeq[126,127], FANTOM [128], UniGene [129], nr GenBank, andTIGR Mouse Gene Index [19] until a gene hit was found) werecarried out. For the ESTs still remaining without gene assign-ment, new Megablast searches were conducted with the larg-est compilation of RefSeq (including the provisional andautomatically generated records [126,127]). If an ESTremained unassigned, then the whole procedure was repeatedwith blastn [130]. In addition, a blastn search against theENSEMBL mouse genome [131] was performed, and ESTswith long stretches (>100 base pairs) of unspecified nucle-otides (N) were excluded.
Genome Biology 2005, 6:R108
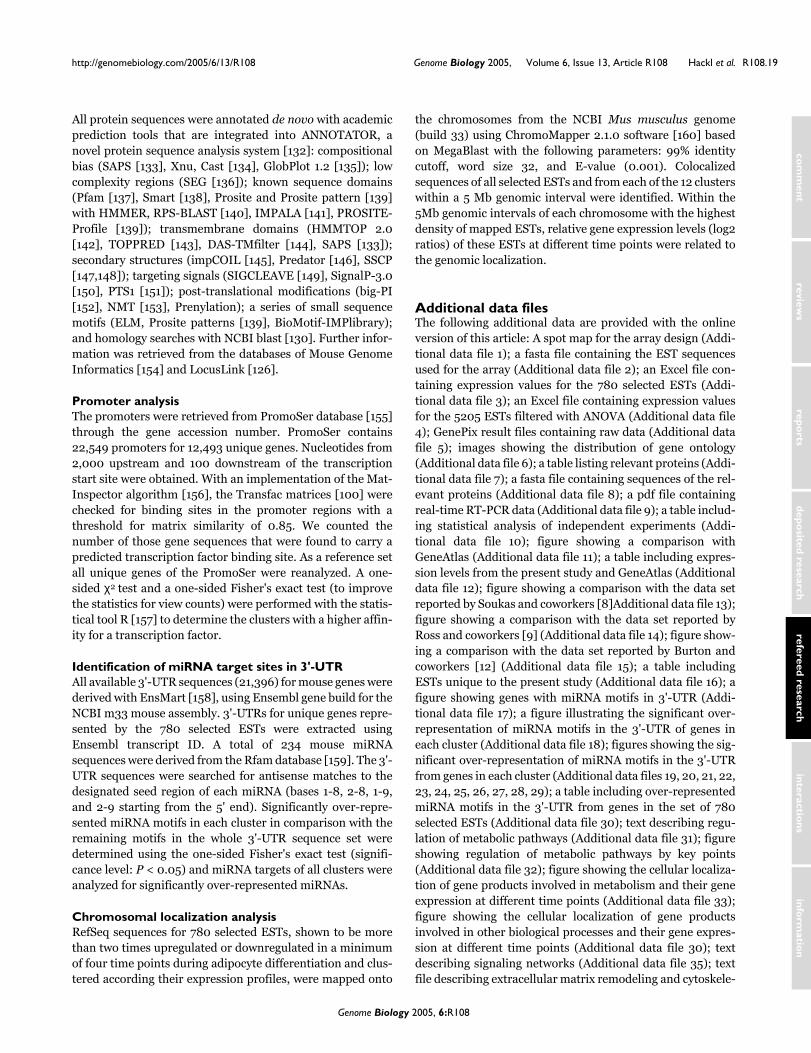
http://genomebiology.com/2005/6/13/R108 Genome Biology 2005, Volume 6, Issue 13, Article R108 Hackl et al. R108.19
com
ment
reviews
reports
refereed researchdepo
sited researchinteractio
nsinfo
rmatio
n
All protein sequences were annotated de novo with academicprediction tools that are integrated into ANNOTATOR, anovel protein sequence analysis system [132]: compositionalbias (SAPS [133], Xnu, Cast [134], GlobPlot 1.2 [135]); lowcomplexity regions (SEG [136]); known sequence domains(Pfam [137], Smart [138], Prosite and Prosite pattern [139]with HMMER, RPS-BLAST [140], IMPALA [141], PROSITE-Profile [139]); transmembrane domains (HMMTOP 2.0[142], TOPPRED [143], DAS-TMfilter [144], SAPS [133]);secondary structures (impCOIL [145], Predator [146], SSCP[147,148]); targeting signals (SIGCLEAVE [149], SignalP-3.0[150], PTS1 [151]); post-translational modifications (big-PI[152], NMT [153], Prenylation); a series of small sequencemotifs (ELM, Prosite patterns [139], BioMotif-IMPlibrary);and homology searches with NCBI blast [130]. Further infor-mation was retrieved from the databases of Mouse GenomeInformatics [154] and LocusLink [126].
Promoter analysisThe promoters were retrieved from PromoSer database [155]through the gene accession number. PromoSer contains22,549 promoters for 12,493 unique genes. Nucleotides from2,000 upstream and 100 downstream of the transcriptionstart site were obtained. With an implementation of the Mat-Inspector algorithm [156], the Transfac matrices [100] werechecked for binding sites in the promoter regions with athreshold for matrix similarity of 0.85. We counted thenumber of those gene sequences that were found to carry apredicted transcription factor binding site. As a reference setall unique genes of the PromoSer were reanalyzed. A one-sided χ2 test and a one-sided Fisher's exact test (to improvethe statistics for view counts) were performed with the statis-tical tool R [157] to determine the clusters with a higher affin-ity for a transcription factor.
Identification of miRNA target sites in 3'-UTRAll available 3'-UTR sequences (21,396) for mouse genes werederived with EnsMart [158], using Ensembl gene build for theNCBI m33 mouse assembly. 3'-UTRs for unique genes repre-sented by the 780 selected ESTs were extracted usingEnsembl transcript ID. A total of 234 mouse miRNAsequences were derived from the Rfam database [159]. The 3'-UTR sequences were searched for antisense matches to thedesignated seed region of each miRNA (bases 1-8, 2-8, 1-9,and 2-9 starting from the 5' end). Significantly over-repre-sented miRNA motifs in each cluster in comparison with theremaining motifs in the whole 3'-UTR sequence set weredetermined using the one-sided Fisher's exact test (signifi-cance level: P < 0.05) and miRNA targets of all clusters wereanalyzed for significantly over-represented miRNAs.
Chromosomal localization analysisRefSeq sequences for 780 selected ESTs, shown to be morethan two times upregulated or downregulated in a minimumof four time points during adipocyte differentiation and clus-tered according their expression profiles, were mapped onto
the chromosomes from the NCBI Mus musculus genome(build 33) using ChromoMapper 2.1.0 software [160] basedon MegaBlast with the following parameters: 99% identitycutoff, word size 32, and E-value (0.001). Colocalizedsequences of all selected ESTs and from each of the 12 clusterswithin a 5 Mb genomic interval were identified. Within the5Mb genomic intervals of each chromosome with the highestdensity of mapped ESTs, relative gene expression levels (log2ratios) of these ESTs at different time points were related tothe genomic localization.
Additional data filesThe following additional data are provided with the onlineversion of this article: A spot map for the array design (Addi-tional data file 1); a fasta file containing the EST sequencesused for the array (Additional data file 2); an Excel file con-taining expression values for the 780 selected ESTs (Addi-tional data file 3); an Excel file containing expression valuesfor the 5205 ESTs filtered with ANOVA (Additional data file4); GenePix result files containing raw data (Additional datafile 5); images showing the distribution of gene ontology(Additional data file 6); a table listing relevant proteins (Addi-tional data file 7); a fasta file containing sequences of the rel-evant proteins (Additional data file 8); a pdf file containingreal-time RT-PCR data (Additional data file 9); a table includ-ing statistical analysis of independent experiments (Addi-tional data file 10); figure showing a comparison withGeneAtlas (Additional data file 11); a table including expres-sion levels from the present study and GeneAtlas (Additionaldata file 12); figure showing a comparison with the data setreported by Soukas and coworkers [8]Additional data file 13);figure showing a comparison with the data set reported byRoss and coworkers [9] (Additional data file 14); figure show-ing a comparison with the data set reported by Burton andcoworkers [12] (Additional data file 15); a table includingESTs unique to the present study (Additional data file 16); afigure showing genes with miRNA motifs in 3'-UTR (Addi-tional data file 17); a figure illustrating the significant over-representation of miRNA motifs in the 3'-UTR of genes ineach cluster (Additional data file 18); figures showing the sig-nificant over-representation of miRNA motifs in the 3'-UTRfrom genes in each cluster (Additional data files 19, 20, 21, 22,23, 24, 25, 26, 27, 28, 29); a table including over-representedmiRNA motifs in the 3'-UTR from genes in the set of 780selected ESTs (Additional data file 30); text describing regu-lation of metabolic pathways (Additional data file 31); figureshowing regulation of metabolic pathways by key points(Additional data file 32); figure showing the cellular localiza-tion of gene products involved in metabolism and their geneexpression at different time points (Additional data file 33);figure showing the cellular localization of gene productsinvolved in other biological processes and their gene expres-sion at different time points (Additional data file 30); textdescribing signaling networks (Additional data file 35); textfile describing extracellular matrix remodeling and cytoskele-
Genome Biology 2005, 6:R108
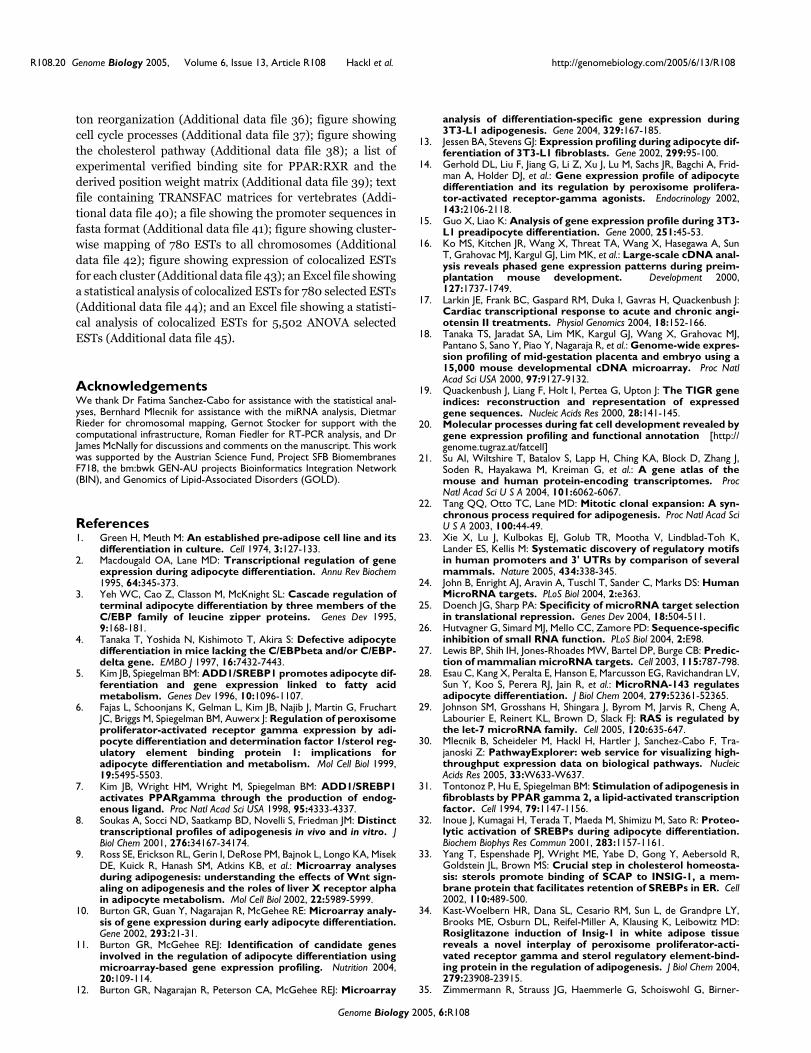
R108.20 Genome Biology 2005, Volume 6, Issue 13, Article R108 Hackl et al. http://genomebiology.com/2005/6/13/R108
ton reorganization (Additional data file 36); figure showingcell cycle processes (Additional data file 37); figure showingthe cholesterol pathway (Additional data file 38); a list ofexperimental verified binding site for PPAR:RXR and thederived position weight matrix (Additional data file 39); textfile containing TRANSFAC matrices for vertebrates (Addi-tional data file 40); a file showing the promoter sequences infasta format (Additional data file 41); figure showing cluster-wise mapping of 780 ESTs to all chromosomes (Additionaldata file 42); figure showing expression of colocalized ESTsfor each cluster (Additional data file 43); an Excel file showinga statistical analysis of colocalized ESTs for 780 selected ESTs(Additional data file 44); and an Excel file showing a statisti-cal analysis of colocalized ESTs for 5,502 ANOVA selectedESTs (Additional data file 45).Additional data file 1A spot map for the array designA spot map for the array designClick here for fileAdditional data file 2A fasta file containing the EST sequences used for the arrayA fasta file containing the EST sequences used for the arrayClick here for fileAdditional data file 3An Excel file containing expression values for the 780 selected ESTs ESTsAn Excel file containing expression values for the 780 selected ESTsClick here for fileAdditional data file 4An Excel file containing expression values for the 5205 ESTs fil-tered with ANOVAAn Excel file containing expression values for the 5205 ESTs fil-tered with ANOVAClick here for fileAdditional data file 5GenePix result files containing raw dataGenePix result files containing raw dataClick here for fileAdditional data file 6Images showing the distribution of gene ontologyImages showing the distribution of gene ontologyClick here for fileAdditional data file 7A table listing relevant proteinsA table listing relevant proteinsClick here for fileAdditional data file 8A fasta file containing sequences of the relevant proteinsA fasta file containing sequences of the relevant proteinsClick here for fileAdditional data file 9A pdf file containing real-time RT-PCR dataA pdf file containing real-time RT-PCR dataClick here for fileAdditional data file 10A table including statistical analysis of independent experimentsA table including statistical analysis of independent experimentsClick here for fileAdditional data file 11A figure showing a comparison with GeneAtlasA figure showing a comparison with GeneAtlasClick here for fileAdditional data file 12A table including expression levels from the present study and GeneAtlasA table including expression levels from the present study and GeneAtlasClick here for fileAdditional data file 13A figure showing a comparison with the data set reported by Soukas and coworkers [8]A figure showing a comparison with the data set reported by Soukas and coworkers [8]Click here for fileAdditional data file 14A figure showing a comparison with the data set reported by Ross and coworkers [9]A figure showing a comparison with the data set reported by Ross and coworkers [9]Click here for fileAdditional data file 15A figure showing a comparison with the data set reported by Burton and coworkers [12]A figure showing a comparison with the data set reported by Burton and coworkers [12]Click here for fileAdditional data file 16A table including ESTs unique to the present studyA table including ESTs unique to the present studyClick here for fileAdditional data file 17A figure showing genes with miRNA motifs in 3'-UTRA figure showing genes with miRNA motifs in 3'-UTRClick here for fileAdditional data file 18A figure illustrating the significant over-representation of miRNA motifs in the 3'-UTR of genes in each clusterA figure illustrating the significant over-representation of miRNA motifs in the 3'-UTR of genes in each clusterClick here for fileAdditional data file 19A figure showing the significant over-representation of miRNA motifs in the 3'-UTR from genes in cluster 1A figure showing the significant over-representation of miRNA motifs in the 3'-UTR from genes in cluster 1Click here for fileAdditional data file 20A figure showing the significant over-representation of miRNA motifs in the 3'-UTR from genes in cluster 2A figure showing the significant over-representation of miRNA motifs in the 3'-UTR from genes in cluster 2Click here for fileAdditional data file 21A figure showing the significant over-representation of miRNA motifs in the 3'-UTR from genes in cluster 3A figure showing the significant over-representation of miRNA motifs in the 3'-UTR from genes in cluster 3Click here for fileAdditional data file 22A figure showing the significant over-representation of miRNA motifs in the 3'-UTR from genes in cluster 4A figure showing the significant over-representation of miRNA motifs in the 3'-UTR from genes in cluster 4Click here for fileAdditional data file 23A figure showing the significant over-representation of miRNA motifs in the 3'-UTR from genes in cluster 6A figure showing the significant over-representation of miRNA motifs in the 3'-UTR from genes in cluster 6Click here for fileAdditional data file 24A figure showing the significant over-representation of miRNA motifs in the 3'-UTR from genes in cluster 7A figure showing the significant over-representation of miRNA motifs in the 3'-UTR from genes in cluster 7Click here for fileAdditional data file 25A figure showing the significant over-representation of miRNA motifs in the 3'-UTR from genes in cluster 8A figure showing the significant over-representation of miRNA motifs in the 3'-UTR from genes in cluster 8Click here for fileAdditional data file 26A figure showing the significant over-representation of miRNA motifs in the 3'-UTR from genes in cluster 9A figure showing the significant over-representation of miRNA motifs in the 3'-UTR from genes in cluster 9Click here for fileAdditional data file 27A figure showing the significant over-representation of miRNA motifs in the 3'-UTR from genes in cluster 10A figure showing the significant over-representation of miRNA motifs in the 3'-UTR from genes in cluster 10Click here for fileAdditional data file 28A figure showing the significant over-representation of miRNA motifs in the 3'-UTR from genes in cluster 11A figure showing the significant over-representation of miRNA motifs in the 3'-UTR from genes in cluster 11Click here for fileAdditional data file 29A figure showing the significant over-representation of miRNA motifs in the 3'-UTR from genes in cluster 12A figure showing the significant over-representation of miRNA motifs in the 3'-UTR from genes in cluster 12Click here for fileAdditional data file 30A table including over-represented miRNA motifs in the 3'-UTR from genes in the set of 780 selected ESTsA table including over-represented miRNA motifs in the 3'-UTR from genes in the set of 780 selected ESTsClick here for fileAdditional data file 31Text describing regulation of metabolic pathwaysText describing regulation of metabolic pathwaysClick here for fileAdditional data file 32A figure showing regulation of metabolic pathways by key pointsA figure showing regulation of metabolic pathways by key pointsClick here for fileAdditional data file 33Figure showing the cellular localization of gene products involved in metabolism and their gene expression at different time pointsFigure showing the cellular localization of gene products involved in metabolism and their gene expression at different time pointsClick here for fileAdditional data file 34Figure showing the cellular localization of gene products involved in other biological processes and their gene expression at different time pointsFigure showing the cellular localization of gene products involved in other biological processes and their gene expression at different time pointsClick here for fileAdditional data file 35Text describing signaling networksText describing signaling networksClick here for fileAdditional data file 36A text file describing extracellular matrix remodeling and cytoskel-eton reorganizationA text file describing extracellular matrix remodeling and cytoskel-eton reorganizationClick here for fileAdditional data file 37A figure showing cell cycle processesA figure showing cell cycle processesClick here for fileAdditional data file 38A figure showing the cholesterol pathwayA figure showing the cholesterol pathwayClick here for fileAdditional data file 39A list of experimental verified binding site for PPAR:RXR and the derived position weight matrixA list of experimental verified binding site for PPAR:RXR and the derived position weight matrixClick here for fileAdditional data file 40Text file containing TRANSFAC matrices for vertebratesText file containing TRANSFAC matrices for vertebratesClick here for fileAdditional data file 41A file showing the promoter sequences in fasta formatA file showing the promoter sequences in fasta formatClick here for fileAdditional data file 42A file showing the promoter sequences in fasta formatA file showing the promoter sequences in fasta formatClick here for fileAdditional data file 43A figure showing clusterwise mapping of 780 ESTs to all chromosomesA figure showing clusterwise mapping of 780 ESTs to all chromosomesClick here for fileAdditional data file 44An Excel file showing a statistical analysis of colocalized ESTs for 780 selected ESTsAn Excel file showing a statistical analysis of colocalized ESTs for 780 selected ESTsClick here for fileAdditional data file 45An Excel file showing a statistical analysis of colocalized ESTs for 5,502 ANOVA selected ESTsAn Excel file showing a statistical analysis of colocalized ESTs for 5,502 ANOVA selected ESTsClick here for file
AcknowledgementsWe thank Dr Fatima Sanchez-Cabo for assistance with the statistical anal-yses, Bernhard Mlecnik for assistance with the miRNA analysis, DietmarRieder for chromosomal mapping, Gernot Stocker for support with thecomputational infrastructure, Roman Fiedler for RT-PCR analysis, and DrJames McNally for discussions and comments on the manuscript. This workwas supported by the Austrian Science Fund, Project SFB BiomembranesF718, the bm:bwk GEN-AU projects Bioinformatics Integration Network(BIN), and Genomics of Lipid-Associated Disorders (GOLD).
References1. Green H, Meuth M: An established pre-adipose cell line and its
differentiation in culture. Cell 1974, 3:127-133.2. Macdougald OA, Lane MD: Transcriptional regulation of gene
expression during adipocyte differentiation. Annu Rev Biochem1995, 64:345-373.
3. Yeh WC, Cao Z, Classon M, McKnight SL: Cascade regulation ofterminal adipocyte differentiation by three members of theC/EBP family of leucine zipper proteins. Genes Dev 1995,9:168-181.
4. Tanaka T, Yoshida N, Kishimoto T, Akira S: Defective adipocytedifferentiation in mice lacking the C/EBPbeta and/or C/EBP-delta gene. EMBO J 1997, 16:7432-7443.
5. Kim JB, Spiegelman BM: ADD1/SREBP1 promotes adipocyte dif-ferentiation and gene expression linked to fatty acidmetabolism. Genes Dev 1996, 10:1096-1107.
6. Fajas L, Schoonjans K, Gelman L, Kim JB, Najib J, Martin G, FruchartJC, Briggs M, Spiegelman BM, Auwerx J: Regulation of peroxisomeproliferator-activated receptor gamma expression by adi-pocyte differentiation and determination factor 1/sterol reg-ulatory element binding protein 1: implications foradipocyte differentiation and metabolism. Mol Cell Biol 1999,19:5495-5503.
7. Kim JB, Wright HM, Wright M, Spiegelman BM: ADD1/SREBP1activates PPARgamma through the production of endog-enous ligand. Proc Natl Acad Sci USA 1998, 95:4333-4337.
8. Soukas A, Socci ND, Saatkamp BD, Novelli S, Friedman JM: Distincttranscriptional profiles of adipogenesis in vivo and in vitro. JBiol Chem 2001, 276:34167-34174.
9. Ross SE, Erickson RL, Gerin I, DeRose PM, Bajnok L, Longo KA, MisekDE, Kuick R, Hanash SM, Atkins KB, et al.: Microarray analysesduring adipogenesis: understanding the effects of Wnt sign-aling on adipogenesis and the roles of liver X receptor alphain adipocyte metabolism. Mol Cell Biol 2002, 22:5989-5999.
10. Burton GR, Guan Y, Nagarajan R, McGehee RE: Microarray analy-sis of gene expression during early adipocyte differentiation.Gene 2002, 293:21-31.
11. Burton GR, McGehee REJ: Identification of candidate genesinvolved in the regulation of adipocyte differentiation usingmicroarray-based gene expression profiling. Nutrition 2004,20:109-114.
12. Burton GR, Nagarajan R, Peterson CA, McGehee REJ: Microarray
analysis of differentiation-specific gene expression during3T3-L1 adipogenesis. Gene 2004, 329:167-185.
13. Jessen BA, Stevens GJ: Expression profiling during adipocyte dif-ferentiation of 3T3-L1 fibroblasts. Gene 2002, 299:95-100.
14. Gerhold DL, Liu F, Jiang G, Li Z, Xu J, Lu M, Sachs JR, Bagchi A, Frid-man A, Holder DJ, et al.: Gene expression profile of adipocytedifferentiation and its regulation by peroxisome prolifera-tor-activated receptor-gamma agonists. Endocrinology 2002,143:2106-2118.
15. Guo X, Liao K: Analysis of gene expression profile during 3T3-L1 preadipocyte differentiation. Gene 2000, 251:45-53.
16. Ko MS, Kitchen JR, Wang X, Threat TA, Wang X, Hasegawa A, SunT, Grahovac MJ, Kargul GJ, Lim MK, et al.: Large-scale cDNA anal-ysis reveals phased gene expression patterns during preim-plantation mouse development. Development 2000,127:1737-1749.
17. Larkin JE, Frank BC, Gaspard RM, Duka I, Gavras H, Quackenbush J:Cardiac transcriptional response to acute and chronic angi-otensin II treatments. Physiol Genomics 2004, 18:152-166.
18. Tanaka TS, Jaradat SA, Lim MK, Kargul GJ, Wang X, Grahovac MJ,Pantano S, Sano Y, Piao Y, Nagaraja R, et al.: Genome-wide expres-sion profiling of mid-gestation placenta and embryo using a15,000 mouse developmental cDNA microarray. Proc NatlAcad Sci USA 2000, 97:9127-9132.
19. Quackenbush J, Liang F, Holt I, Pertea G, Upton J: The TIGR geneindices: reconstruction and representation of expressedgene sequences. Nucleic Acids Res 2000, 28:141-145.
20. Molecular processes during fat cell development revealed bygene expression profiling and functional annotation [http://genome.tugraz.at/fatcell]
21. Su AI, Wiltshire T, Batalov S, Lapp H, Ching KA, Block D, Zhang J,Soden R, Hayakawa M, Kreiman G, et al.: A gene atlas of themouse and human protein-encoding transcriptomes. ProcNatl Acad Sci U S A 2004, 101:6062-6067.
22. Tang QQ, Otto TC, Lane MD: Mitotic clonal expansion: A syn-chronous process required for adipogenesis. Proc Natl Acad SciU S A 2003, 100:44-49.
23. Xie X, Lu J, Kulbokas EJ, Golub TR, Mootha V, Lindblad-Toh K,Lander ES, Kellis M: Systematic discovery of regulatory motifsin human promoters and 3' UTRs by comparison of severalmammals. Nature 2005, 434:338-345.
24. John B, Enright AJ, Aravin A, Tuschl T, Sander C, Marks DS: HumanMicroRNA targets. PLoS Biol 2004, 2:e363.
25. Doench JG, Sharp PA: Specificity of microRNA target selectionin translational repression. Genes Dev 2004, 18:504-511.
26. Hutvagner G, Simard MJ, Mello CC, Zamore PD: Sequence-specificinhibition of small RNA function. PLoS Biol 2004, 2:E98.
27. Lewis BP, Shih IH, Jones-Rhoades MW, Bartel DP, Burge CB: Predic-tion of mammalian microRNA targets. Cell 2003, 115:787-798.
28. Esau C, Kang X, Peralta E, Hanson E, Marcusson EG, Ravichandran LV,Sun Y, Koo S, Perera RJ, Jain R, et al.: MicroRNA-143 regulatesadipocyte differentiation. J Biol Chem 2004, 279:52361-52365.
29. Johnson SM, Grosshans H, Shingara J, Byrom M, Jarvis R, Cheng A,Labourier E, Reinert KL, Brown D, Slack FJ: RAS is regulated bythe let-7 microRNA family. Cell 2005, 120:635-647.
30. Mlecnik B, Scheideler M, Hackl H, Hartler J, Sanchez-Cabo F, Tra-janoski Z: PathwayExplorer: web service for visualizing high-throughput expression data on biological pathways. NucleicAcids Res 2005, 33:W633-W637.
31. Tontonoz P, Hu E, Spiegelman BM: Stimulation of adipogenesis infibroblasts by PPAR gamma 2, a lipid-activated transcriptionfactor. Cell 1994, 79:1147-1156.
32. Inoue J, Kumagai H, Terada T, Maeda M, Shimizu M, Sato R: Proteo-lytic activation of SREBPs during adipocyte differentiation.Biochem Biophys Res Commun 2001, 283:1157-1161.
33. Yang T, Espenshade PJ, Wright ME, Yabe D, Gong Y, Aebersold R,Goldstein JL, Brown MS: Crucial step in cholesterol homeosta-sis: sterols promote binding of SCAP to INSIG-1, a mem-brane protein that facilitates retention of SREBPs in ER. Cell2002, 110:489-500.
34. Kast-Woelbern HR, Dana SL, Cesario RM, Sun L, de Grandpre LY,Brooks ME, Osburn DL, Reifel-Miller A, Klausing K, Leibowitz MD:Rosiglitazone induction of Insig-1 in white adipose tissuereveals a novel interplay of peroxisome proliferator-acti-vated receptor gamma and sterol regulatory element-bind-ing protein in the regulation of adipogenesis. J Biol Chem 2004,279:23908-23915.
35. Zimmermann R, Strauss JG, Haemmerle G, Schoiswohl G, Birner-
Genome Biology 2005, 6:R108
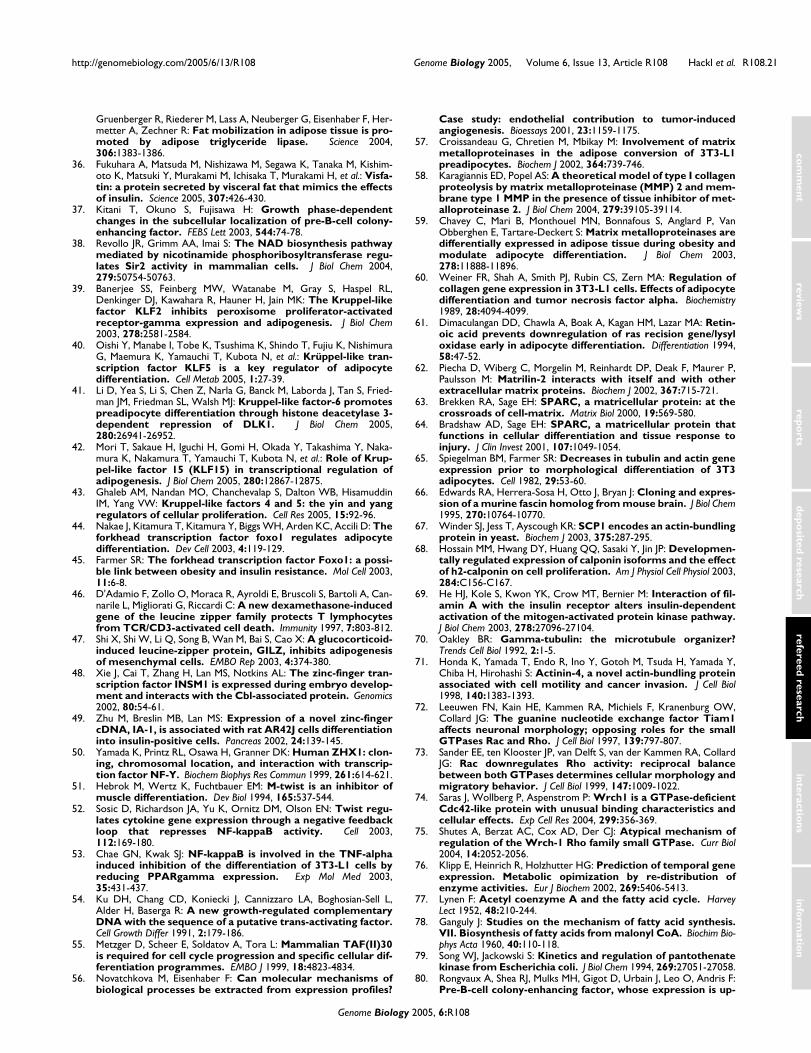
http://genomebiology.com/2005/6/13/R108 Genome Biology 2005, Volume 6, Issue 13, Article R108 Hackl et al. R108.21
com
ment
reviews
reports
refereed researchdepo
sited researchinteractio
nsinfo
rmatio
n
Gruenberger R, Riederer M, Lass A, Neuberger G, Eisenhaber F, Her-metter A, Zechner R: Fat mobilization in adipose tissue is pro-moted by adipose triglyceride lipase. Science 2004,306:1383-1386.
36. Fukuhara A, Matsuda M, Nishizawa M, Segawa K, Tanaka M, Kishim-oto K, Matsuki Y, Murakami M, Ichisaka T, Murakami H, et al.: Visfa-tin: a protein secreted by visceral fat that mimics the effectsof insulin. Science 2005, 307:426-430.
37. Kitani T, Okuno S, Fujisawa H: Growth phase-dependentchanges in the subcellular localization of pre-B-cell colony-enhancing factor. FEBS Lett 2003, 544:74-78.
38. Revollo JR, Grimm AA, Imai S: The NAD biosynthesis pathwaymediated by nicotinamide phosphoribosyltransferase regu-lates Sir2 activity in mammalian cells. J Biol Chem 2004,279:50754-50763.
39. Banerjee SS, Feinberg MW, Watanabe M, Gray S, Haspel RL,Denkinger DJ, Kawahara R, Hauner H, Jain MK: The Kruppel-likefactor KLF2 inhibits peroxisome proliferator-activatedreceptor-gamma expression and adipogenesis. J Biol Chem2003, 278:2581-2584.
40. Oishi Y, Manabe I, Tobe K, Tsushima K, Shindo T, Fujiu K, NishimuraG, Maemura K, Yamauchi T, Kubota N, et al.: Krüppel-like tran-scription factor KLF5 is a key regulator of adipocytedifferentiation. Cell Metab 2005, 1:27-39.
41. Li D, Yea S, Li S, Chen Z, Narla G, Banck M, Laborda J, Tan S, Fried-man JM, Friedman SL, Walsh MJ: Kruppel-like factor-6 promotespreadipocyte differentiation through histone deacetylase 3-dependent repression of DLK1. J Biol Chem 2005,280:26941-26952.
42. Mori T, Sakaue H, Iguchi H, Gomi H, Okada Y, Takashima Y, Naka-mura K, Nakamura T, Yamauchi T, Kubota N, et al.: Role of Krup-pel-like factor 15 (KLF15) in transcriptional regulation ofadipogenesis. J Biol Chem 2005, 280:12867-12875.
43. Ghaleb AM, Nandan MO, Chanchevalap S, Dalton WB, HisamuddinIM, Yang VW: Kruppel-like factors 4 and 5: the yin and yangregulators of cellular proliferation. Cell Res 2005, 15:92-96.
44. Nakae J, Kitamura T, Kitamura Y, Biggs WH, Arden KC, Accili D: Theforkhead transcription factor foxo1 regulates adipocytedifferentiation. Dev Cell 2003, 4:119-129.
45. Farmer SR: The forkhead transcription factor Foxo1: a possi-ble link between obesity and insulin resistance. Mol Cell 2003,11:6-8.
46. D'Adamio F, Zollo O, Moraca R, Ayroldi E, Bruscoli S, Bartoli A, Can-narile L, Migliorati G, Riccardi C: A new dexamethasone-inducedgene of the leucine zipper family protects T lymphocytesfrom TCR/CD3-activated cell death. Immunity 1997, 7:803-812.
47. Shi X, Shi W, Li Q, Song B, Wan M, Bai S, Cao X: A glucocorticoid-induced leucine-zipper protein, GILZ, inhibits adipogenesisof mesenchymal cells. EMBO Rep 2003, 4:374-380.
48. Xie J, Cai T, Zhang H, Lan MS, Notkins AL: The zinc-finger tran-scription factor INSM1 is expressed during embryo develop-ment and interacts with the Cbl-associated protein. Genomics2002, 80:54-61.
49. Zhu M, Breslin MB, Lan MS: Expression of a novel zinc-fingercDNA, IA-1, is associated with rat AR42J cells differentiationinto insulin-positive cells. Pancreas 2002, 24:139-145.
50. Yamada K, Printz RL, Osawa H, Granner DK: Human ZHX1: clon-ing, chromosomal location, and interaction with transcrip-tion factor NF-Y. Biochem Biophys Res Commun 1999, 261:614-621.
51. Hebrok M, Wertz K, Fuchtbauer EM: M-twist is an inhibitor ofmuscle differentiation. Dev Biol 1994, 165:537-544.
52. Sosic D, Richardson JA, Yu K, Ornitz DM, Olson EN: Twist regu-lates cytokine gene expression through a negative feedbackloop that represses NF-kappaB activity. Cell 2003,112:169-180.
53. Chae GN, Kwak SJ: NF-kappaB is involved in the TNF-alphainduced inhibition of the differentiation of 3T3-L1 cells byreducing PPARgamma expression. Exp Mol Med 2003,35:431-437.
54. Ku DH, Chang CD, Koniecki J, Cannizzaro LA, Boghosian-Sell L,Alder H, Baserga R: A new growth-regulated complementaryDNA with the sequence of a putative trans-activating factor.Cell Growth Differ 1991, 2:179-186.
55. Metzger D, Scheer E, Soldatov A, Tora L: Mammalian TAF(II)30is required for cell cycle progression and specific cellular dif-ferentiation programmes. EMBO J 1999, 18:4823-4834.
56. Novatchkova M, Eisenhaber F: Can molecular mechanisms ofbiological processes be extracted from expression profiles?
Case study: endothelial contribution to tumor-inducedangiogenesis. Bioessays 2001, 23:1159-1175.
57. Croissandeau G, Chretien M, Mbikay M: Involvement of matrixmetalloproteinases in the adipose conversion of 3T3-L1preadipocytes. Biochem J 2002, 364:739-746.
58. Karagiannis ED, Popel AS: A theoretical model of type I collagenproteolysis by matrix metalloproteinase (MMP) 2 and mem-brane type 1 MMP in the presence of tissue inhibitor of met-alloproteinase 2. J Biol Chem 2004, 279:39105-39114.
59. Chavey C, Mari B, Monthouel MN, Bonnafous S, Anglard P, VanObberghen E, Tartare-Deckert S: Matrix metalloproteinases aredifferentially expressed in adipose tissue during obesity andmodulate adipocyte differentiation. J Biol Chem 2003,278:11888-11896.
60. Weiner FR, Shah A, Smith PJ, Rubin CS, Zern MA: Regulation ofcollagen gene expression in 3T3-L1 cells. Effects of adipocytedifferentiation and tumor necrosis factor alpha. Biochemistry1989, 28:4094-4099.
61. Dimaculangan DD, Chawla A, Boak A, Kagan HM, Lazar MA: Retin-oic acid prevents downregulation of ras recision gene/lysyloxidase early in adipocyte differentiation. Differentiation 1994,58:47-52.
62. Piecha D, Wiberg C, Morgelin M, Reinhardt DP, Deak F, Maurer P,Paulsson M: Matrilin-2 interacts with itself and with otherextracellular matrix proteins. Biochem J 2002, 367:715-721.
63. Brekken RA, Sage EH: SPARC, a matricellular protein: at thecrossroads of cell-matrix. Matrix Biol 2000, 19:569-580.
64. Bradshaw AD, Sage EH: SPARC, a matricellular protein thatfunctions in cellular differentiation and tissue response toinjury. J Clin Invest 2001, 107:1049-1054.
65. Spiegelman BM, Farmer SR: Decreases in tubulin and actin geneexpression prior to morphological differentiation of 3T3adipocytes. Cell 1982, 29:53-60.
66. Edwards RA, Herrera-Sosa H, Otto J, Bryan J: Cloning and expres-sion of a murine fascin homolog from mouse brain. J Biol Chem1995, 270:10764-10770.
67. Winder SJ, Jess T, Ayscough KR: SCP1 encodes an actin-bundlingprotein in yeast. Biochem J 2003, 375:287-295.
68. Hossain MM, Hwang DY, Huang QQ, Sasaki Y, Jin JP: Developmen-tally regulated expression of calponin isoforms and the effectof h2-calponin on cell proliferation. Am J Physiol Cell Physiol 2003,284:C156-C167.
69. He HJ, Kole S, Kwon YK, Crow MT, Bernier M: Interaction of fil-amin A with the insulin receptor alters insulin-dependentactivation of the mitogen-activated protein kinase pathway.J Biol Chem 2003, 278:27096-27104.
70. Oakley BR: Gamma-tubulin: the microtubule organizer?Trends Cell Biol 1992, 2:1-5.
71. Honda K, Yamada T, Endo R, Ino Y, Gotoh M, Tsuda H, Yamada Y,Chiba H, Hirohashi S: Actinin-4, a novel actin-bundling proteinassociated with cell motility and cancer invasion. J Cell Biol1998, 140:1383-1393.
72. Leeuwen FN, Kain HE, Kammen RA, Michiels F, Kranenburg OW,Collard JG: The guanine nucleotide exchange factor Tiam1affects neuronal morphology; opposing roles for the smallGTPases Rac and Rho. J Cell Biol 1997, 139:797-807.
73. Sander EE, ten Klooster JP, van Delft S, van der Kammen RA, CollardJG: Rac downregulates Rho activity: reciprocal balancebetween both GTPases determines cellular morphology andmigratory behavior. J Cell Biol 1999, 147:1009-1022.
74. Saras J, Wollberg P, Aspenstrom P: Wrch1 is a GTPase-deficientCdc42-like protein with unusual binding characteristics andcellular effects. Exp Cell Res 2004, 299:356-369.
75. Shutes A, Berzat AC, Cox AD, Der CJ: Atypical mechanism ofregulation of the Wrch-1 Rho family small GTPase. Curr Biol2004, 14:2052-2056.
76. Klipp E, Heinrich R, Holzhutter HG: Prediction of temporal geneexpression. Metabolic opimization by re-distribution ofenzyme activities. Eur J Biochem 2002, 269:5406-5413.
77. Lynen F: Acetyl coenzyme A and the fatty acid cycle. HarveyLect 1952, 48:210-244.
78. Ganguly J: Studies on the mechanism of fatty acid synthesis.VII. Biosynthesis of fatty acids from malonyl CoA. Biochim Bio-phys Acta 1960, 40:110-118.
79. Song WJ, Jackowski S: Kinetics and regulation of pantothenatekinase from Escherichia coli. J Biol Chem 1994, 269:27051-27058.
80. Rongvaux A, Shea RJ, Mulks MH, Gigot D, Urbain J, Leo O, Andris F:Pre-B-cell colony-enhancing factor, whose expression is up-
Genome Biology 2005, 6:R108
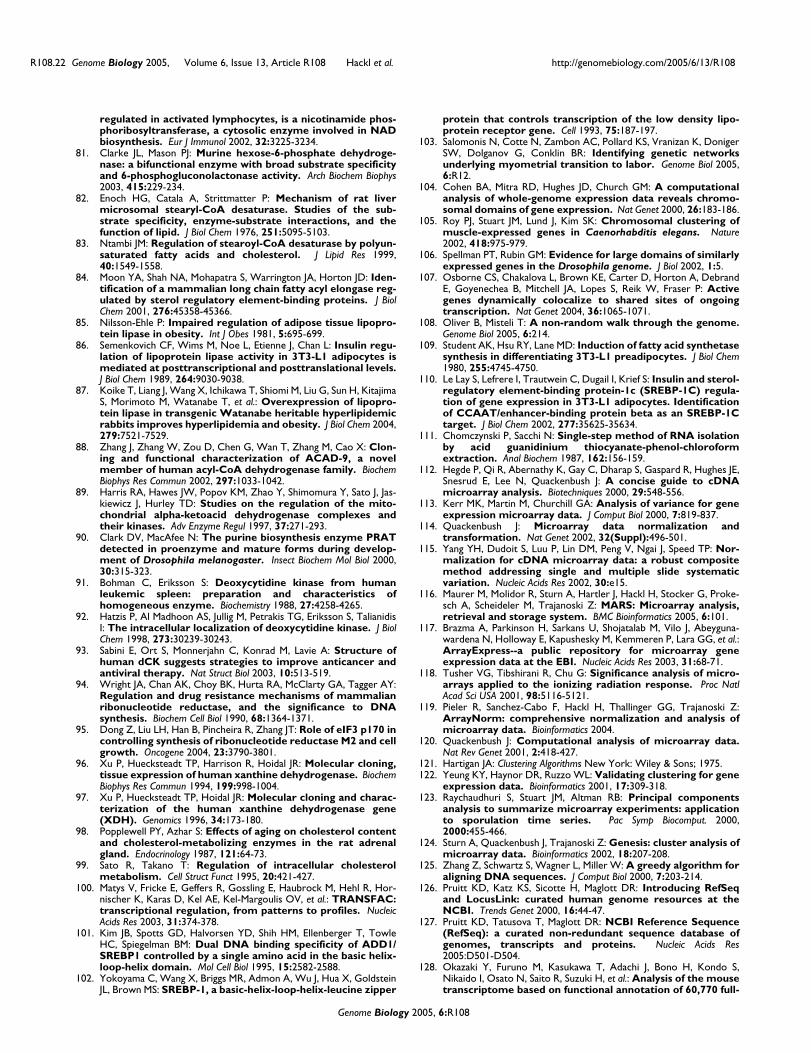
R108.22 Genome Biology 2005, Volume 6, Issue 13, Article R108 Hackl et al. http://genomebiology.com/2005/6/13/R108
regulated in activated lymphocytes, is a nicotinamide phos-phoribosyltransferase, a cytosolic enzyme involved in NADbiosynthesis. Eur J Immunol 2002, 32:3225-3234.
81. Clarke JL, Mason PJ: Murine hexose-6-phosphate dehydroge-nase: a bifunctional enzyme with broad substrate specificityand 6-phosphogluconolactonase activity. Arch Biochem Biophys2003, 415:229-234.
82. Enoch HG, Catala A, Strittmatter P: Mechanism of rat livermicrosomal stearyl-CoA desaturase. Studies of the sub-strate specificity, enzyme-substrate interactions, and thefunction of lipid. J Biol Chem 1976, 251:5095-5103.
83. Ntambi JM: Regulation of stearoyl-CoA desaturase by polyun-saturated fatty acids and cholesterol. J Lipid Res 1999,40:1549-1558.
84. Moon YA, Shah NA, Mohapatra S, Warrington JA, Horton JD: Iden-tification of a mammalian long chain fatty acyl elongase reg-ulated by sterol regulatory element-binding proteins. J BiolChem 2001, 276:45358-45366.
85. Nilsson-Ehle P: Impaired regulation of adipose tissue lipopro-tein lipase in obesity. Int J Obes 1981, 5:695-699.
86. Semenkovich CF, Wims M, Noe L, Etienne J, Chan L: Insulin regu-lation of lipoprotein lipase activity in 3T3-L1 adipocytes ismediated at posttranscriptional and posttranslational levels.J Biol Chem 1989, 264:9030-9038.
87. Koike T, Liang J, Wang X, Ichikawa T, Shiomi M, Liu G, Sun H, KitajimaS, Morimoto M, Watanabe T, et al.: Overexpression of lipopro-tein lipase in transgenic Watanabe heritable hyperlipidemicrabbits improves hyperlipidemia and obesity. J Biol Chem 2004,279:7521-7529.
88. Zhang J, Zhang W, Zou D, Chen G, Wan T, Zhang M, Cao X: Clon-ing and functional characterization of ACAD-9, a novelmember of human acyl-CoA dehydrogenase family. BiochemBiophys Res Commun 2002, 297:1033-1042.
89. Harris RA, Hawes JW, Popov KM, Zhao Y, Shimomura Y, Sato J, Jas-kiewicz J, Hurley TD: Studies on the regulation of the mito-chondrial alpha-ketoacid dehydrogenase complexes andtheir kinases. Adv Enzyme Regul 1997, 37:271-293.
90. Clark DV, MacAfee N: The purine biosynthesis enzyme PRATdetected in proenzyme and mature forms during develop-ment of Drosophila melanogaster. Insect Biochem Mol Biol 2000,30:315-323.
91. Bohman C, Eriksson S: Deoxycytidine kinase from humanleukemic spleen: preparation and characteristics ofhomogeneous enzyme. Biochemistry 1988, 27:4258-4265.
92. Hatzis P, Al Madhoon AS, Jullig M, Petrakis TG, Eriksson S, TalianidisI: The intracellular localization of deoxycytidine kinase. J BiolChem 1998, 273:30239-30243.
93. Sabini E, Ort S, Monnerjahn C, Konrad M, Lavie A: Structure ofhuman dCK suggests strategies to improve anticancer andantiviral therapy. Nat Struct Biol 2003, 10:513-519.
94. Wright JA, Chan AK, Choy BK, Hurta RA, McClarty GA, Tagger AY:Regulation and drug resistance mechanisms of mammalianribonucleotide reductase, and the significance to DNAsynthesis. Biochem Cell Biol 1990, 68:1364-1371.
95. Dong Z, Liu LH, Han B, Pincheira R, Zhang JT: Role of eIF3 p170 incontrolling synthesis of ribonucleotide reductase M2 and cellgrowth. Oncogene 2004, 23:3790-3801.
96. Xu P, Huecksteadt TP, Harrison R, Hoidal JR: Molecular cloning,tissue expression of human xanthine dehydrogenase. BiochemBiophys Res Commun 1994, 199:998-1004.
97. Xu P, Huecksteadt TP, Hoidal JR: Molecular cloning and charac-terization of the human xanthine dehydrogenase gene(XDH). Genomics 1996, 34:173-180.
98. Popplewell PY, Azhar S: Effects of aging on cholesterol contentand cholesterol-metabolizing enzymes in the rat adrenalgland. Endocrinology 1987, 121:64-73.
99. Sato R, Takano T: Regulation of intracellular cholesterolmetabolism. Cell Struct Funct 1995, 20:421-427.
100. Matys V, Fricke E, Geffers R, Gossling E, Haubrock M, Hehl R, Hor-nischer K, Karas D, Kel AE, Kel-Margoulis OV, et al.: TRANSFAC:transcriptional regulation, from patterns to profiles. NucleicAcids Res 2003, 31:374-378.
101. Kim JB, Spotts GD, Halvorsen YD, Shih HM, Ellenberger T, TowleHC, Spiegelman BM: Dual DNA binding specificity of ADD1/SREBP1 controlled by a single amino acid in the basic helix-loop-helix domain. Mol Cell Biol 1995, 15:2582-2588.
102. Yokoyama C, Wang X, Briggs MR, Admon A, Wu J, Hua X, GoldsteinJL, Brown MS: SREBP-1, a basic-helix-loop-helix-leucine zipper
protein that controls transcription of the low density lipo-protein receptor gene. Cell 1993, 75:187-197.
103. Salomonis N, Cotte N, Zambon AC, Pollard KS, Vranizan K, DonigerSW, Dolganov G, Conklin BR: Identifying genetic networksunderlying myometrial transition to labor. Genome Biol 2005,6:R12.
104. Cohen BA, Mitra RD, Hughes JD, Church GM: A computationalanalysis of whole-genome expression data reveals chromo-somal domains of gene expression. Nat Genet 2000, 26:183-186.
105. Roy PJ, Stuart JM, Lund J, Kim SK: Chromosomal clustering ofmuscle-expressed genes in Caenorhabditis elegans. Nature2002, 418:975-979.
106. Spellman PT, Rubin GM: Evidence for large domains of similarlyexpressed genes in the Drosophila genome. J Biol 2002, 1:5.
107. Osborne CS, Chakalova L, Brown KE, Carter D, Horton A, DebrandE, Goyenechea B, Mitchell JA, Lopes S, Reik W, Fraser P: Activegenes dynamically colocalize to shared sites of ongoingtranscription. Nat Genet 2004, 36:1065-1071.
108. Oliver B, Misteli T: A non-random walk through the genome.Genome Biol 2005, 6:214.
109. Student AK, Hsu RY, Lane MD: Induction of fatty acid synthetasesynthesis in differentiating 3T3-L1 preadipocytes. J Biol Chem1980, 255:4745-4750.
110. Le Lay S, Lefrere I, Trautwein C, Dugail I, Krief S: Insulin and sterol-regulatory element-binding protein-1c (SREBP-1C) regula-tion of gene expression in 3T3-L1 adipocytes. Identificationof CCAAT/enhancer-binding protein beta as an SREBP-1Ctarget. J Biol Chem 2002, 277:35625-35634.
111. Chomczynski P, Sacchi N: Single-step method of RNA isolationby acid guanidinium thiocyanate-phenol-chloroformextraction. Anal Biochem 1987, 162:156-159.
112. Hegde P, Qi R, Abernathy K, Gay C, Dharap S, Gaspard R, Hughes JE,Snesrud E, Lee N, Quackenbush J: A concise guide to cDNAmicroarray analysis. Biotechniques 2000, 29:548-556.
113. Kerr MK, Martin M, Churchill GA: Analysis of variance for geneexpression microarray data. J Comput Biol 2000, 7:819-837.
114. Quackenbush J: Microarray data normalization andtransformation. Nat Genet 2002, 32(Suppl):496-501.
115. Yang YH, Dudoit S, Luu P, Lin DM, Peng V, Ngai J, Speed TP: Nor-malization for cDNA microarray data: a robust compositemethod addressing single and multiple slide systematicvariation. Nucleic Acids Res 2002, 30:e15.
116. Maurer M, Molidor R, Sturn A, Hartler J, Hackl H, Stocker G, Proke-sch A, Scheideler M, Trajanoski Z: MARS: Microarray analysis,retrieval and storage system. BMC Bioinformatics 2005, 6:101.
117. Brazma A, Parkinson H, Sarkans U, Shojatalab M, Vilo J, Abeyguna-wardena N, Holloway E, Kapushesky M, Kemmeren P, Lara GG, et al.:ArrayExpress--a public repository for microarray geneexpression data at the EBI. Nucleic Acids Res 2003, 31:68-71.
118. Tusher VG, Tibshirani R, Chu G: Significance analysis of micro-arrays applied to the ionizing radiation response. Proc NatlAcad Sci USA 2001, 98:5116-5121.
119. Pieler R, Sanchez-Cabo F, Hackl H, Thallinger GG, Trajanoski Z:ArrayNorm: comprehensive normalization and analysis ofmicroarray data. Bioinformatics 2004.
120. Quackenbush J: Computational analysis of microarray data.Nat Rev Genet 2001, 2:418-427.
121. Hartigan JA: Clustering Algorithms New York: Wiley & Sons; 1975. 122. Yeung KY, Haynor DR, Ruzzo WL: Validating clustering for gene
expression data. Bioinformatics 2001, 17:309-318.123. Raychaudhuri S, Stuart JM, Altman RB: Principal components
analysis to summarize microarray experiments: applicationto sporulation time series. Pac Symp Biocomput. 2000,2000:455-466.
124. Sturn A, Quackenbush J, Trajanoski Z: Genesis: cluster analysis ofmicroarray data. Bioinformatics 2002, 18:207-208.
125. Zhang Z, Schwartz S, Wagner L, Miller W: A greedy algorithm foraligning DNA sequences. J Comput Biol 2000, 7:203-214.
126. Pruitt KD, Katz KS, Sicotte H, Maglott DR: Introducing RefSeqand LocusLink: curated human genome resources at theNCBI. Trends Genet 2000, 16:44-47.
127. Pruitt KD, Tatusova T, Maglott DR: NCBI Reference Sequence(RefSeq): a curated non-redundant sequence database ofgenomes, transcripts and proteins. Nucleic Acids Res2005:D501-D504.
128. Okazaki Y, Furuno M, Kasukawa T, Adachi J, Bono H, Kondo S,Nikaido I, Osato N, Saito R, Suzuki H, et al.: Analysis of the mousetranscriptome based on functional annotation of 60,770 full-
Genome Biology 2005, 6:R108
http://genomebiology.com/2005/6/13/R108 Genome Biology 2005, Volume 6, Issue 13, Article R108 Hackl et al. R108.23
com
ment
reviews
reports
refereed researchdepo
sited researchinteractio
nsinfo
rmatio
n
length cDNAs. Nature 2002, 420:563-573.129. Schuler GD: Pieces of the puzzle: expressed sequence tags
and the catalog of human genes. J Mol Med 1997, 75:694-698.130. Altschul SF, Gish W, Miller W, Myers EW, Lipman DJ: Basic local
alignment search tool. J Mol Biol 1990, 215:403-410.131. Hubbard T, Barker D, Birney E, Cameron G, Chen Y, Clark L, Cox T,
Cuff J, Curwen V, Down T, et al.: The Ensembl genome databaseproject. Nucleic Acids Res 2002, 30:38-41.
132. Large Scale Sequence Annotation System [http://annotator.imp.univie.ac.at/]
133. Brendel V, Bucher P, Nourbakhsh IR, Blaisdell BE, Karlin S: Methodsand algorithms for statistical analysis of protein sequences.Proc Natl Acad Sci USA 1992, 89:2002-2006.
134. Promponas VJ, Enright AJ, Tsoka S, Kreil DP, Leroy C, HamodrakasS, Sander C, Ouzounis CA: CAST: an iterative algorithm for thecomplexity analysis of sequence tracts. Complexity analysisof sequence tracts. Bioinformatics 2000, 16:915-922.
135. Linding R, Russell RB, Neduva V, Gibson TJ: GlobPlot: Exploringprotein sequences for globularity and disorder. Nucleic AcidsRes 2003, 31:3701-3708.
136. Wootton JC, Federhen S: Analysis of compositionally biasedregions in sequence databases. Methods Enzymol 1996,266:554-571.
137. Sonnhammer EL, Eddy SR, Birney E, Bateman A, Durbin R: Pfam:multiple sequence alignments and HMM-profiles of proteindomains. Nucleic Acids Res 1998, 26:320-322.
138. Letunic I, Copley RR, Schmidt S, Ciccarelli FD, Doerks T, Schultz J,Ponting CP, Bork P: SMART 4.0: towards genomic dataintegration. Nucleic Acids Res 2004, 32:D142-D144.
139. Sigrist CJ, Cerutti L, Hulo N, Gattiker A, Falquet L, Pagni M, BairochA, Bucher P: PROSITE: a documented database using patternsand profiles as motif descriptors. Brief Bioinform 2002,3:265-274.
140. Marchler-Bauer A, Panchenko AR, Shoemaker BA, Thiessen PA, GeerLY, Bryant SH: CDD: a database of conserved domain align-ments with links to domain three-dimensional structure.Nucleic Acids Res 2002, 30:281-283.
141. Schaffer AA, Wolf YI, Ponting CP, Koonin EV, Aravind L, Altschul SF:IMPALA: matching a protein sequence against a collectionof PSI-BLAST-constructed position-specific score matrices.Bioinformatics 1999, 15:1000-1011.
142. Tusnady GE, Simon I: Principles governing amino acid compo-sition of integral membrane proteins: application totopology prediction. J Mol Biol 1998, 283:489-506.
143. von Heijne G: Membrane protein structure prediction. Hydro-phobicity analysis and the positive-inside rule. J Mol Biol 1992,225:487-494.
144. Cserzo M, Eisenhaber F, Eisenhaber B, Simon I: On filtering falsepositive transmembrane protein predictions. Protein Eng 2002,15:745-752.
145. Lupas A, Van Dyke M, Stock J: Predicting coiled coils from pro-tein sequences. Science 1991, 252:1162-1164.
146. Frishman D, Argos P: Incorporation of non-local interactions inprotein secondary structure prediction from the amino acidsequence. Protein Eng 1996, 9:133-142.
147. Eisenhaber F, Imperiale F, Argos P, Frommel C: Prediction of sec-ondary structural content of proteins from their amino acidcomposition alone. I. New analytic vector decompositionmethods. Proteins 1996, 25:157-168.
148. Eisenhaber F, Frommel C, Argos P: Prediction of secondary struc-tural content of proteins from their amino acid compositionalone. II. The paradox with secondary structural class. Pro-teins 1996, 25:169-179.
149. von Heijne G: A new method for predicting signal sequencecleavage sites. Nucleic Acids Res 1986, 14:4683-4690.
150. Bendtsen JD, Nielsen H, von Heijne G, Brunak S: Improved predic-tion of signal peptides: SignalP 3.0. J Mol Biol 2004, 340:783-795.
151. Eisenhaber B, Eisenhaber F, Maurer-Stroh S, Neuberger G: Predic-tion of sequence signals for lipid post-translational modifica-tions: insights from case studies. Proteomics 2004, 4:1614-1625.
152. Eisenhaber B, Bork P, Eisenhaber F: Prediction of potential GPI-modification sites in proprotein sequences. J Mol Biol 1999,292:741-758.
153. Maurer-Stroh S, Eisenhaber B, Eisenhaber F: N-terminal N-myris-toylation of proteins: prediction of substrate proteins fromamino acid sequence. J Mol Biol 2002, 317:541-557.
154. Blake JA, Richardson JE, Bult CJ, Kadin JA, Eppig JT: MGD: theMouse Genome Database. Nucleic Acids Res 2003, 31:193-195.
155. Halees AS, Leyfer D, Weng Z: PromoSer: A large-scale mam-malian promoter and transcription start site identificationservice. Nucleic Acids Res 2003, 31:3554-3559.
156. Quandt K, Frech K, Karas H, Wingender E, Werner T: MatInd andMatInspector: new fast and versatile tools for detection ofconsensus matches in nucleotide sequence data. Nucleic AcidsRes 1995, 23:4878-4884.
157. R Project [http://www.r-project.org]158. Kasprzyk A, Keefe D, Smedley D, London D, Spooner W, Melsopp C,
Hammond M, Rocca-Serra P, Cox T, Birney E: EnsMart: a genericsystem for fast and flexible access to biological data. GenomeRes 2004, 14:160-169.
159. Griffiths-Jones S: The microRNA registry. Nucleic Acids Res 2004,32:D109-D111.
160. ChromoMapper [http://mcluster.tu-graz.ac.at/clustercontrol/modules/ChromoMapper/]
Genome Biology 2005, 6:R108

Identification of new targets using expression profiling Angiogenic Cancer Therapy
Page 1
Identification of New Targets Using Expression
Profiles
Thomas R. Burkard1,2, Zlatko Trajanoski1, Maria Novatchkova2, Hubert Hackl1, Frank
Eisenhaber2*
1Institute for Genomics and Bioinformatics and Christian Doppler Laboratory for Genomics
and Bioinformatics, Graz University of Technology, Petersgasse 14, 8010 Graz, Austria; 2Research Institute of Molecular Pathology, Dr Bohr-Gasse 7, 1030 Vienna, Austria
*correspondence address
Research Institute of Molecular Pathology, Dr Bohr-Gasse 7, 1030 Vienna, Austria, Tel.
+43-1-79730557, E-mail: [email protected]
In: Antiangiogenic Cancer Therapy (in press)
Editors: Abbruzzese JL, Davis DW, Herbst RS
CRC Press

Identification of new targets using expression profiling Angiogenic Cancer Therapy
Page 2
Abstract
When large-scale expression profiling methods were first published about a decade ago, their
introduction into the lab praxis was accompanied with high expectations of getting system-
wide understanding of gene interactions. Although this hope has not yet materialized,
expression profiling tools have become an indispensable part of the methodical arsenal in
biological laboratories. In this review, we describe the experimental variants of gene
expression profiling. The computational methods for post-experimental expression profile
analysis, both for expression value treatment and gene/protein function prediction from
sequence, are considered in detail since they do not receive the necessary attention in many
practical applications. Finally, biologically significant results from expression profiling
studies with special emphasis on angiogenic systems including the identification of new
targets are assessed.
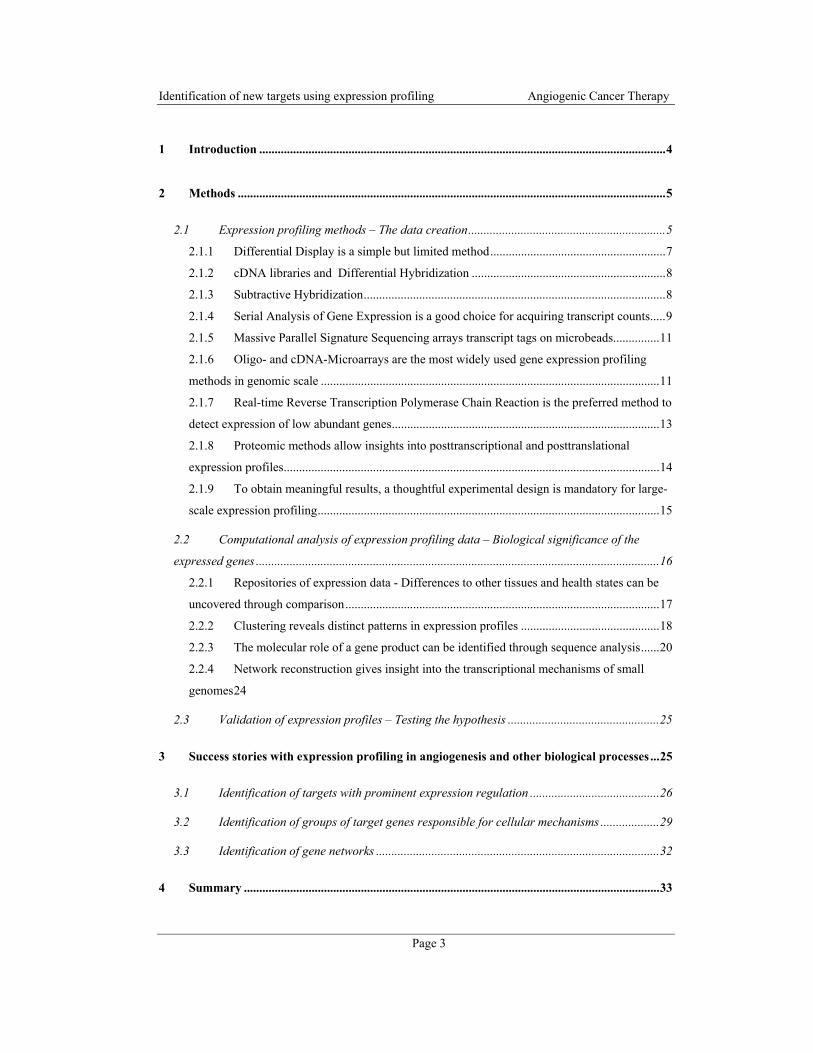
Identification of new targets using expression profiling Angiogenic Cancer Therapy
Page 3
1 Introduction ....................................................................................................................................4
2 Methods ...........................................................................................................................................5
2.1 Expression profiling methods – The data creation................................................................5 2.1.1 Differential Display is a simple but limited method.........................................................7 2.1.2 cDNA libraries and Differential Hybridization ...............................................................8 2.1.3 Subtractive Hybridization..................................................................................................8 2.1.4 Serial Analysis of Gene Expression is a good choice for acquiring transcript counts.....9 2.1.5 Massive Parallel Signature Sequencing arrays transcript tags on microbeads...............11 2.1.6 Oligo- and cDNA-Microarrays are the most widely used gene expression profiling
methods in genomic scale ..............................................................................................................11 2.1.7 Real-time Reverse Transcription Polymerase Chain Reaction is the preferred method to
detect expression of low abundant genes.......................................................................................13 2.1.8 Proteomic methods allow insights into posttranscriptional and posttranslational
expression profiles..........................................................................................................................14 2.1.9 To obtain meaningful results, a thoughtful experimental design is mandatory for large-
scale expression profiling...............................................................................................................15
2.2 Computational analysis of expression profiling data – Biological significance of the
expressed genes ...................................................................................................................................16 2.2.1 Repositories of expression data - Differences to other tissues and health states can be
uncovered through comparison......................................................................................................17 2.2.2 Clustering reveals distinct patterns in expression profiles .............................................18 2.2.3 The molecular role of a gene product can be identified through sequence analysis......20 2.2.4 Network reconstruction gives insight into the transcriptional mechanisms of small
genomes 24
2.3 Validation of expression profiles – Testing the hypothesis .................................................25
3 Success stories with expression profiling in angiogenesis and other biological processes ...25
3.1 Identification of targets with prominent expression regulation ..........................................26
3.2 Identification of groups of target genes responsible for cellular mechanisms ...................29
3.3 Identification of gene networks ............................................................................................32
4 Summary .......................................................................................................................................33
Identification of new targets using expression profiling Angiogenic Cancer Therapy
Page 4
1 Introduction
The end of the 20th century has seen life sciences entering a qualitatively new era of their
development. The major change is connected with progress in research technologies, the
introduction of high-throughput methods for the generation of large amounts of uniform,
quantitative data describing the status and the development of biological systems. This trend
is associated with a new, essential and creative role of computational biology for handling
this data and for interpreting it in terms of biological functions. DNA sequencing was in the
first wave and the complete sequencing of genomes of all major model organisms and
human (beginning with that of H. influencae in 1995) was the major highlight of this
development.
In the late nineties, expression profiling was seen as a continuation of this process with the
promise of simultaneous, large-scale and high-throughput characterization of the
transcriptional status of all genes, especially in contrast to the, at that time, usual single-gene
Northern blot technology. The euphoria that systematic understanding of networks and
pathway interactions is just in reach has vanished due to several reasons. First, high-
throughput expression profiling methods did not reach the necessary level of sensitivity to
monitor simultaneously frequently occurring and low-abundant mRNAs with sufficient
accuracy. The hope of mathematical network modeling has often moved away instead of a
semi-quantitative evaluation of expression data (up to a distinction of only ‘high’ and ‘low’
expression) and the determination of sets of genes that are markedly transcriptionally
regulated. I.e., expression profiling is used just as one type of screen for target identification.
Second, the transcriptional status is only a facet of a complex biological reality that has
many additional regulation mechanisms at the translational, proteome, physiological or
population level. After the euphoria has settled, expression profiling tools have become an
important part of the laboratory repertoire that complements other techniques and
approaches.
Application of expression profiling in the angiogenic context is an especially demanding task
since angiogenesis is a process that involves many cell types, tissues and both local and

Identification of new targets using expression profiling Angiogenic Cancer Therapy
Page 5
organism-level regulation mechanisms. Most often, the focus is on the transcriptional status
of endothelial cells, a material that is not easy to collect from sample organism and where
isolated in vitro culturing substantially influences intracellular processes [1,2].
In the first part of this chapter, we present an overview of experimental methods applicable
for monitoring gene expression profiles as well as a review of computational approaches
used for the analysis and the biological interpretation of the resulting complex data. The
second part of this treatise summarizes achievements of these techniques with an emphasis
on angiogenesis research but also a few other cases that appear especially methodically
significant.
2 Methods
2.1 Expression profiling methods – The data creation
A variety of expression profiling methods are available which take a snapshot of the
currently expressed genes at a given time, state, environment, genetic background and
treatment in one or numerous cells. The older and simpler methods, differential display and
subtractive hybridization, are methods which lack the sensitivity to detect relative
differences in the transcript abundance between two samples. Compared with other
technologies, these two methods belong to the group of low-throughput processes together
with differential hybridization. On the other hand, they have the advantage not to require
specialized equipment and, therefore, can be applied in a standard biological laboratory. The
state of the art for large-scale gene expression profiling is represented by Serial Analysis of
Gene Expression (SAGE) [3], Massive Parallel Signature Sequencing (MPSS) [4], oligo- and
cDNA-microarrays [5,6] and Real Time Polymerase Chain Reaction (RT-PCR). With these
approaches, it is possible to determine the absolute or relative abundance of RNA in a
medium- or high-throughput manner. Any of these methods has their own advantages and
limitations. SAGE and MPSS profit from the possibility to quantify transcript numbers in
absolute terms without prior knowledge of the transcriptome. Oligo- and cDNA-microarray
are the most commonly used technology. Arrays are able to measure the expression level
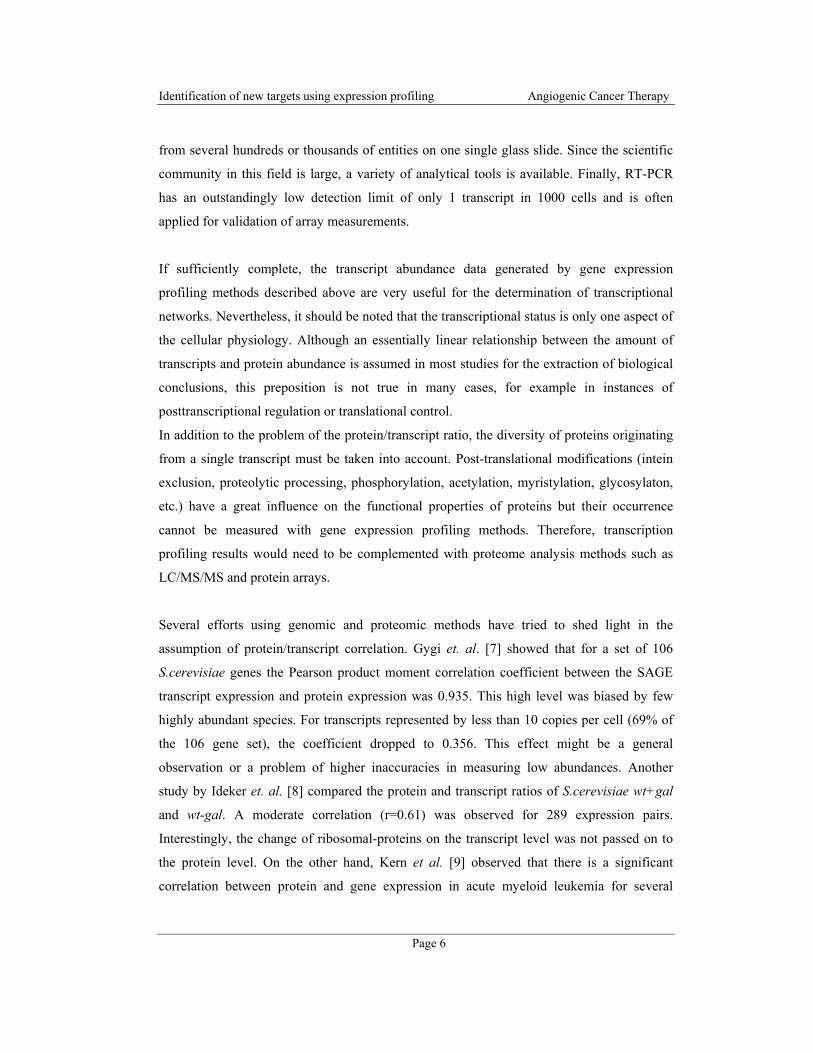
Identification of new targets using expression profiling Angiogenic Cancer Therapy
Page 6
from several hundreds or thousands of entities on one single glass slide. Since the scientific
community in this field is large, a variety of analytical tools is available. Finally, RT-PCR
has an outstandingly low detection limit of only 1 transcript in 1000 cells and is often
applied for validation of array measurements.
If sufficiently complete, the transcript abundance data generated by gene expression
profiling methods described above are very useful for the determination of transcriptional
networks. Nevertheless, it should be noted that the transcriptional status is only one aspect of
the cellular physiology. Although an essentially linear relationship between the amount of
transcripts and protein abundance is assumed in most studies for the extraction of biological
conclusions, this preposition is not true in many cases, for example in instances of
posttranscriptional regulation or translational control.
In addition to the problem of the protein/transcript ratio, the diversity of proteins originating
from a single transcript must be taken into account. Post-translational modifications (intein
exclusion, proteolytic processing, phosphorylation, acetylation, myristylation, glycosylaton,
etc.) have a great influence on the functional properties of proteins but their occurrence
cannot be measured with gene expression profiling methods. Therefore, transcription
profiling results would need to be complemented with proteome analysis methods such as
LC/MS/MS and protein arrays.
Several efforts using genomic and proteomic methods have tried to shed light in the
assumption of protein/transcript correlation. Gygi et. al. [7] showed that for a set of 106
S.cerevisiae genes the Pearson product moment correlation coefficient between the SAGE
transcript expression and protein expression was 0.935. This high level was biased by few
highly abundant species. For transcripts represented by less than 10 copies per cell (69% of
the 106 gene set), the coefficient dropped to 0.356. This effect might be a general
observation or a problem of higher inaccuracies in measuring low abundances. Another
study by Ideker et. al. [8] compared the protein and transcript ratios of S.cerevisiae wt+gal
and wt-gal. A moderate correlation (r=0.61) was observed for 289 expression pairs.
Interestingly, the change of ribosomal-proteins on the transcript level was not passed on to
the protein level. On the other hand, Kern et al. [9] observed that there is a significant
correlation between protein and gene expression in acute myeloid leukemia for several
Identification of new targets using expression profiling Angiogenic Cancer Therapy
Page 7
markers.
For a final conclusion, the accuracy of the quantitative measuring methods of transcripts and
especially of proteins has to improve considerably. The limits of all involved methods have
to be considered exhaustively for an appropriate comparison to avoid influences of all kind
of biases on the comparison. Most likely, a general correlation is not possible and the
proteins have to be divided into two groups of highly transcript-sensitive and -insensitive
ones. The insensitive proteins might be further separated into subgroups depending on
different regulatory mechanisms (e.g. codon bias) probably associated with cellular
localization or functional groups/processes (metabolism, transcription factor, transport, etc.).
The expression level might be an additional but important parameter.
2.1.1 Differential Display is a simple but limited method
Differential display is one of the simplest expression profiling methods. It determines the
abundance of a RNA species through comparison of two probes. Extracted total RNA of the
sample and the control are separately reverse transcribed to cDNA and, thereafter, are
amplified by PCR using arbitrary primers. Control and sample RNA are separated on a
denaturing polyacryl gel by electrophoresis and, after visualization, the discrete bands are
compared side by side. Quantitative differences can be estimated by the intensities of the
bands in the gel. cDNA that is abundant in only one part is extracted, further amplified with
PCR and sequenced [10,11]. The classical differential display uses radioactive nucleotides to
detect mRNAs but this disadvantage can be overcome by fluorescence techniques [12].
A more advanced variation allows a separation of the RNA fraction into smaller ones.
Therefore, the reverse transcription uses an oligo-dT primer with two additional nucleotides.
Due to one more hydrogen bond, primers with G and C are more efficient than those
containing A and T [13,14]. Depending on the nucleotide variations, many different RNA
subjects can be separated.
The advantage of differential display lies in the simplicity by using only standard
procedures. It allows simultaneous determination of up- and down-regulated genes in two or
Identification of new targets using expression profiling Angiogenic Cancer Therapy
Page 8
more samples of about 5-10ng of total RNA. Its main purpose is to identify uncharacterized
and not yet sequenced mRNA species easily. On the other side, the classical differential
display often generates false-negative results during PCR amplification and cloning [15].
The workload can grow considerably with the number of different nucleotide variations in
the primers. Finally, differential display is more or less only a qualitative method.
2.1.2 cDNA libraries and Differential Hybridization
cDNA libraries are constructed from reverse transcribed mRNA of a tissue of interest
typically with oligo-dT primers. The resulting cDNAs are cloned into bacteria and, therefore,
each bacterial colony represents one gene of a tissue [16]. Non-normalized libraries preserve
the relative abundance of the mRNA levels [16]. An expression profile can be determined by
randomly picking out clones and sequencing an expressed sequence tag (EST) of
approximately 300bp. This method is biased towards strongly abundant expressed
transcripts; it is labour intensive and expensive. To identify rare mRNA species, methods to
construct normalized libraries exist, which contains each mRNA species at a similar level
[17].
Differential hybridization relies on the hybridization of cDNA of a tissue of interest to a
cDNA library with fixed colony positions. The cDNA library is transferred to filter
membranes and is treated with alkali to release the cDNA and to denature it. mRNAs of
different tissues of interest are subjected to reverse transcription with radioactive nucleotides
and hybridized to fixed cDNAs on the filters. Comparison of the X-ray films reveals the
relative abundance of a gene in the tissues [18].
2.1.3 Subtractive Hybridization
The principle of this method is based on the fact that single-stranded cDNA (ss-cDNA) can
be separated from double-stranded cDNA (ds-cDNA) with a hydroxylapatite column or the
avidin-biotin method [19]. After reverse transcription, cDNA obtained from the sample
mRNA is hybridized to the mRNA of the control fraction. A part of the sample cDNA finds
no complementary RNA in the control and remains as ss-cDNA, which can be separated by

Identification of new targets using expression profiling Angiogenic Cancer Therapy
Page 9
chromatography with hydroxylapatite columns. To increase the purity, further rounds of
hybridization with control mRNA and chromatography remove the slower hybridizing
sequences. A sample-overrepresented cDNA library is constructed from the ss-cDNA
fraction and specific clones are sequenced. In typical cases of successful application of this
technique, less than 5% of the initial cDNA sequences will be isolated as single-stranded
[20].
Similarly to differential display, this technique is mainly used to identify the abundance of a
mRNA species in one tissue compared to another. It is an inexpensive method, which can be
carried out in a basic molecular biology laboratory. Compared to differential display, it has a
lower rate of false-negatives [15] but determines only the abundance of a mRNA species in
one sample. RNAs with only slight differences in expression are hard to identify (for
reliability, a 5-10-fold difference in abundance is required) [20]. The fact that high abundant
transcripts are easier to hybridize than low abundant ones represents another problem. Due to
the subtractive nature of the procedure, relative expression values cannot be measured.
2.1.4 Serial Analysis of Gene Expression is a good choice for acquiring transcript counts
Serial Analysis of Gene Expression (SAGE) [3] is a method based on sequencing
concatemer clones of 9-10 bp sequence tags instead of whole expressed sequence tag (EST)
libraries. The tags have a unique position within the mRNA species and, typically, contain
enough information to describe the whole mRNA [1]. Many variations of SAGE are now
available that can work with a reduced amount of necessary raw material [21] or that
generate sequence tags with increased length [22].
Shortly, RNA of purified cells is captured by hybridization of the poly-A tail to oligo-T
magnetic beads. Double-stranded cDNA is constructed and cleaved with the endonuclease
NlaIII. The bead-bound part is processed further [21]. In another approach, cDNA with
biotinylated primers is synthesized. The cDNAs are cleaved and attached to streptavidin
beads [3]. The tags are divided in two parts and are ligated each to two types of adaptors.
The adapters contain sites for the restriction enzyme BsmF1, which produces an overhang of
14-base pairs (bp) composed of 10 tag-specific and 4 non-specific bp. The blunt-ended
Identification of new targets using expression profiling Angiogenic Cancer Therapy
Page 10
fragments are pooled and ligated to form di-tags. PCR is used to amplify the resulting di-tags
with primers for the adapters. Finally, the di-tags are released by the restriction enzyme
NlaIII, concatenated, cloned and sequenced. To create a typical library of 100.000 tags,
preparation, screening and sequencing of approximately 3000 concatemer clones is needed
[21]. The frequency distribution is calculated by dividing the count of a tag by the total of
sequenced tags. In the typical case, each 9-10bp long tag entity has enough information to
describe sufficiently a unique transcript in the analyzed cells.
The transcript numbers generated by SAGE are measured effectively in absolute terms and,
thus, are easy to compare to different datasets [23]. It should be noted that sensitivity of
transcript detection and accuracy of transcript occurrence measurements depend greatly on
mRNA abundance in the sample and the number of sequenced tags. For example, there is a
37% chance to miss a transcript that occurs in the sample with the fraction of p=1:100000 in
the mRNA pool if 100000 tags are sequenced [1]. If the transcript is ten times more abundant
(p=1:10000), there is still a 22% chance that the tag is found not more than 7 times or a 14%
chance that the tag occurs at least 15 times. Thus, the systematic measurement error ranges
at least between the 0.7- and 1.5-fold of the final number for rare transcripts. Statistical
estimates show that SAGE yields good quantitative measures of transcript occurrences for
p=1:1000, qualitative estimates (high/low expression) for transcript occurrences with
p=1:10000 and no reliable results for more rare transcripts [1].
SAGE needs no prior knowledge about the expressed transcripts. This is especially
interesting for organisms without a sequenced genome. On the contrary, SAGE is an
expensive and labor-intensive method (a large number of clones must be purified and
sequenced). It is biased as a result of possible sampling and sequencing errors, non-
uniqueness and non-randomness of tag sequences [1,24]. Further, a link to a gene or genomic
entry is needed for each tag in a sequence database. SAGE can results in a different
distribution of expression values than microarray experiments. Therefore, the clustering
methods based on Pearson correlation and Euclidean distance, used in microarray analysis,
are not appropriate for SAGE profiles. Cai et. al considered that Poisson-based distances are
more suitable, which have been incorporated into a clustering algorithm for SAGE analysis
[25].
Identification of new targets using expression profiling Angiogenic Cancer Therapy
Page 11
2.1.5 Massive Parallel Signature Sequencing arrays transcript tags on microbeads
Massive Parallel Signature Sequencing (MPSS) [4] is a combination of arraying sequences
fixed on a bead and sequencing 16-20 bp long signatures. In the first step, transcripts are
cloned on microbeads. Therefore, a complex conjugate mixture of transcripts and 32-
oligomere microbead-specific tags are generated. The number of different tags has to be at
least 100-fold higher than that of the transcript entities. A representative part is subjected to
PCR and hybridized to tag-specific microbeads. Beads with sequences attached are sorted
out with a fluorescence-activated cell sorter (FACS). These microbeads are arrayed in a
fixed position within a flow cell. After cutting the sequence, it is ligated with an initiating
adapter, which contains a type II restriction site for Bbv1. As in SAGE experiments, Bbv1
cuts at a specific distance away from its recognition site with a 4 bp overhang. This overhang
is sequenced by ligating it to an adapter which is specific for one nucleotide at a certain
position. Each microbead is attached to 4 adapters which are specific for the 4bp sequence.
In 16 cycles, phycoerythrin-labeled decoder probes are hybridized to the adapters, scanned
with CCD detectors and washed off. The fluorescent images of the arrayed microbeads allow
reconstructing the sequence. The cycle of Bbv1 cutting, adaptor ligation and decoder
hybridization and imaging is repeated until enough sequence information is achieved.
Analyzing a statistical significant amount of microbeads enables the measurement of the
expression profile of the transcripts.
Similar to SAGE, MPSS requires no prior knowledge of the transcripts. The measured
absolute transcript counts allow direct comparison between experiments. Due to cloning on
the microbeads and parallel sequencing, the workload is lower than in the case of SAGE.
The disadvantage of the technology is the requirement of specialized equipment only
available through Lynx Genetics [23].
2.1.6 Oligo- and cDNA-Microarrays are the most widely used gene expression profiling
methods in genomic scale
Microarray technology [6,5] is the most widely used method to measure gene expression
Identification of new targets using expression profiling Angiogenic Cancer Therapy
Page 12
profiles in a highly parallel manner. All different microarray platforms have in common that
a nucleotide sequence is arrayed on a solid carrier, which is hybridized with a labeled
nucleotide mixture of interest (with a radioactive marker or a fluorescent dye). The
expression of each gene is measured by scanning each spot on the chip. Due to the fact that
the gene position on the carrier is exactly known, the expression can be instantly assigned to
a specific gene.
The fabrication of chips can be generally divided into spotted and in situ synthesized
microarrays. Up to 780.000 oligonucleotides can be in situ synthesized on a single silicon
wafer with photolithographic methods. The production of these high density chips remain in
commercial hands like Affymetrix [5] and NimbleGen [26,27]. Further, an ink-jet system is
developed by Rosetta Inpharmatics, which is licensed by Agilent [28]. These systems avoid
handling of large cDNA and oligo-libraries as in the case of spotting methods. Contrary, the
relative short length of in situ synthesized oligonucleotides (20-25mers) can result in a
reduced selectivity and sensitivity [29]. Advances in this technology by NimbleGen use a
Maskless Array Synteziser (MAS) method, which reduces costs and allow oligonucleotide
lengths up to 70mers combined with higher flexibility in customized chip design [27,26].
Spotted chips [6] are based on arrayed cDNA clones of an expressed sequence tag library or
on pre-synthesized oligonucleotides. Many resources of cDNA libraries, PCR primers and
oligonucleotide (50-70mer) sets of various organisms are reviewed by Lyons [30]. A density
of approximately ~30.000 genes per chip can be reached. Contrary to in situ synthesis, it is
possible to use not yet sequenced clones, which enables the identification of completely
uncharacterized mRNA species [29]. Due to the higher flexibility of spotted elements and
the lower cost than in situ techniques, it is widely used in the academic research field. ESTs
and oligos are printed with high-throughput robots on poly-lysin, amino silanes or amino-
reactive silanes coated glass slide, which have a low inherent fluorescence. The surface
coating enhances hydrophobicity and the adherence of the spotted probes [31]. The arrayed
DNA is typically fixed by ultraviolet irradiation to the chip surface. A variety of currently
available slides and printing systems are summarized by Affara [32]. To minimize the spot
size and to improve the reproducibility the diameter of the pin tip, the hydrophobicity of the
carrier surface, the humidity, the buffer types and the temperature must be optimized [32].
Identification of new targets using expression profiling Angiogenic Cancer Therapy
Page 13
Total RNA is extracted from the samples of interest. The RNA must be purified from
proteins, lipids and carbohydrate, which influence the hybridization negatively. If
insufficient amounts of RNA are available, the signal can be amplified to continue the
experiment with standard labeling and hybridization techniques. Different amplification
methods are reviewed by Livesey [33]. One example of signal amplification consists in
marking the reverse transcribed cDNA with specific tags. These are recognized by antibodies
or proteins that are linked to an enzyme, which breaks down a tyramide-fluorophore dye that
is added to the system. This technique has a 10-100 fold lower detection level with
representative and reproducible results [34]. Sample amplification is divided in linear (T7)
[35] and exponential (PCR) methods. Standardized linear T7 protocols allow amplification
of nanogram quantities but are suffering from the transcript shortening resulting in a 3’ bias
[36,35].
Due to the high reproducibility of in situ syntheses of oligonucleotide chips, it is possible to
compare accurately between chips hybridized only with one sample [29]. In contrast, spotted
microarray techniques are relative methods and need hybridization of Cy3/Cy5 labeled
sample and reference. During direct Cy3/Cy5 labeling, the two fluorescents are incorporated
with a different rate. To resolve this issue, amino-allyl modified nucleotides are incorporated
in the first reverse transcription step followed by a coupling of the dyes to the reactive amino
groups of the cDNA [37]. Nevertheless, some dye-bias is persistent but it can be addressed
by the dye-swapping technique, which is explained below. After labeling, the cDNA is
denatured and hybridized to the chip in specific chambers. Unmatched cDNA is removed
with stringent washing solutions. The last step in the experimental procedure consists of
scanning of the slides in a chip reader. A variety of available scanners is summarized by
Affara [32].
2.1.7 Real-time Reverse Transcription Polymerase Chain Reaction is the preferred
method to detect expression of low abundant genes
Real-time Reverse Transcription Polymerase Chain Reaction (real-time RT-PCR) is a
powerful method to identify the expression profile of low abundant transcripts (100-fold
Identification of new targets using expression profiling Angiogenic Cancer Therapy
Page 14
more sensitive than microarrays). Real-time RT-PCR has a detection range of 0.001 to 100
transcripts per cell [38,39]. Detailed information about the sequences of interest is needed.
For each transcript, two unique primers of 20-24 nucleotides in length with a melting
temperature of 60 ± 2°C, a guanine-cysteine content of 45%-55% and a PCR amplicon
length of 60-150 bp have to be designed. Splice variants can be assessed if the amplicon
reaches over an exon-exon boundary. The polymerase chain reaction (with its cycling
temperature profile for primer annealing, DNA synthesizing and denaturing) is performed in
an optical 384-well plate using a fluorescence dye to monitor the dsDNA synthesis. A large
RT-PCR profiling study measured the expression level of more than 1400 low abundant
transcription factor (known and putative) [38].
2.1.8 Proteomic methods allow insights into posttranscriptional and posttranslational
expression profiles
Transcripts are the blue prints for their corresponding proteins, which are the main players of
cellular processes beside functional RNA. It is widely assumed that gene expression
correlates with the translated products, but to ultimately derive the protein amounts, turn-
over and post-translational modification, quantitative proteomic methods are needed. Due to
the diverse physico-biological properties of proteins and the high dynamic range from one to
millions of copies, it is with the state of the art nearly impossible to determine reliable and
accurate amounts of proteins among others [40,41]. Nevertheless, ambitious technologies
aim at solving these problems. Isotope-coded-affinity-tag (ICAT) uses a combination of
liquid chromatography and mass spectrometry (LC/MS/MS) to measure protein levels
quantitatively in a complex mixture [42]. Therefore, light and heavy ICATs are used as an
internal standard. Relative expression values are obtained by binding the different ICATs to
two different cell states. LC separates the proteins of the combined samples but the isotopes
remain close together. Fragments of the co-eluted isotopes are separated by MS with an 8
Dalton mass difference, which can be used to obtain the relative abundance.
As the different ‘omic’ technologies and the bioinformatic tools for data integration evolve
further, the most powerful approaches will be at the end an appropriate combination of
genomic, transcriptomic, proteomic and metabolomic research which will lead to an

Identification of new targets using expression profiling Angiogenic Cancer Therapy
Page 15
extensive understanding of the globular mechanism of cells and give complex insights into
development and diseases.
2.1.9 To obtain meaningful results, a thoughtful experimental design is mandatory for
large-scale expression profiling
Since large scale expression studies are labor-intensive and costly, a significant time should
be spent for planning the experiments to maximize the informative results and minimize
result bias. Randomization, replications and local control should be considered [43]. If
differences in personnel, equipment, reagents and times, which can leave a signature on the
gene expression profile, cannot be controlled by a good design, randomization and
experiment repetitions are the best way to deal with them. Measurements of only one single
sample do not allow the inference to the general behavior of the population of the respective
biological systems. Therefore, biological (at least two samples for one set of measurements)
and technical (one sample divided among at least two sets of measurement) replicates are
needed [44]. Since biological variations are generally higher in any expression study than the
technical noise, independent biological replicates are strongly preferred to generalize the
results. Local control is used for arranging experimental material in relation to extraneous
sources of variability. For example, if two different sample probes are to be compared (mice,
tissues, …), the groups should be analyzed equally distributed over time to minimize a
possible day-to-day difference (e.g. environmental influences, operator condition), which
could otherwise bias the expression profile, if one group is investigated solely on one day
and the other on a different.
Pooling biological samples might provide a form of “biological averaging” by achieving
more accurate results with fewer measurements. A danger lies in a possible unrecognized
camouflage of an outlier within the pool that cannot be identified but could influence the
expression profile significantly in a wrong way. Therefore, pooling should be avoided,
unless cost issues or material amounts do not allow it [43].
Ruijter et. al [45] investigated pair-wise comparisons of SAGE libraries and concluded that
the most efficient way to set up a SAGE study without knowledge of transcript abundance is
Identification of new targets using expression profiling Angiogenic Cancer Therapy
Page 16
to compile two SAGE libraries of equal size. A major drawback is that SAGE libraries
represent only one experimental measurement lacking information of biological variation
and experimental precision and, therefore, depend on simulations and assumptions of these
parameters.
Two color microarray studies rely on appropriate labeling and hybridization strategies.
Several reviews address these concerns [46,43,47]. Issues regarding the aim of the
experiment, availability of RNA and chips as well as the experimental processes have to be
considered. Two principal comparison routines are available: direct and indirect. If two
samples are hybridized to the same chip, these can be compared directly. In contrast, indirect
comparison between two slides needs a common reference (universal or biological relevant).
Often a combination is the most practical way to go. Single-factor, loop or multifactorial
design has to be chosen to address the biological question correctly [48,49]. For example, if
treated or diseased tissues should be compared to healthy samples, the clear design choice is
to compare all atypical once to a common reference (the healthy). To confront the systematic
color bias of the two fluorescent dyes used in cDNA microarrays, dye-swapping should be
used wherever possible. Therefore, two chips have to be hybridized with vice versa labeled
samples.
2.2 Computational analysis of expression profiling data – Biological significance of the
expressed genes
Designing the experiment and obtaining the expression values is the first part of an
expression profiling study, resulting only in a plain list of differentially expressed
tags/transcripts/proteins under specific conditions. Computational methods can help to
correct the raw expression data from systematic and random bias, to determine the true
expression status of genes, to derive new insights and hypotheses with regard to function of
genes and biomolecular networks, processes and mechanisms. Due to the large scale of
SAGE, MPSS and microarray experiments, these important analyses typically take a
significant if not the largest time of the whole study. Since expression profiling studies are
typically initiated in laboratories without tradition of computational biology research, human
resources (with respect to number and qualification of researchers), time ranges and capital
Identification of new targets using expression profiling Angiogenic Cancer Therapy
Page 17
investments in an appropriate computer and biological software environment dedicated to
this effort are typically grossly underestimated.
Normalization of data minimizes biases of the expression values. There are general statistical
considerations specialized for the different profiling applications [48]. Several tools integrate
different normalization algorithms. ArrayNorm [50] is an academic, freely available, stand-
alone software package; the Bioconductor project [51] is another alternative. Some
normalization functions are also available as part of the Genesis suite [52]. Several public
and commercial expression profile databases are available for sharing the measured profiles
within the community. These function as a central repository to retrieve data for re-analyzes
and comparisons. Clustering algorithms group genes or samples with similar expression
profiles together. Co-expressed genes could share possibly a common regulatory mechanism.
Groups of samples may identify specific cancer types. De novo prediction of functional
domains can identify novel molecular and cellular functions of proteins. Especially for
pharmacological treatment, transmembrane proteins, receptors and enzymes with small
binding pockets are of enhanced interest. Finally, pathway mapping and network re-
construction together with extensive literature enquiry might give an insight into the global
interactions and the molecular atlas of the cell.
2.2.1 Repositories of expression data - Differences to other tissues and health states can
be uncovered through comparison
Expression databases (Table 1) provide access to raw and sometimes also processed versions
of a multitude of measured gene expression profiles. Such deposits allow to reanalyze and
validate experiments as well as to compare data with other related topics. Data sharing in
publicly available databases is, therefore, an important issue that is, especially in microarray
studies, mandatory for submission in some journals. Since experimental design, treatment,
tissue type, normalization and many other factors influence the expression profiles, these
parameters have to be stored together with the measured and normalized data. Minimal
Information About a Microarray Experiment (MIAME) is a standard proposed for describing
chip datasets by the Microarray Gene Expression Data Society to ensure that data can be
easily interpreted and results can be independently verified [53].
Identification of new targets using expression profiling Angiogenic Cancer Therapy
Page 18
An analysis of the expression datasets in the database GEO reveals interesting trends. As
shown in Figure 1, there are two techniques that are most popular in expression profiling – in
situ hybridization microarrays (including Affymetrix chips) and cDNA spotted microarrays.
Whereas the first type of arrays can be applied only in manufacturer-supplied customized
forms, the second is technologically simpler and cheaper to produce and, therefore, the
method of choice for researchers working on more esoteric model organisms then human, rat
or mouse. Figure 2 illustrates that expression profiling is still far from reaching a saturation
phase, the number of new datasets coming into public databases each quarter is still growing.
Comparison of absolute as well as relative expression values can be carried out between
datasets of various sources. Often, it is an extremely difficult task due to differences in
methods, experimental designs and systematic biases. Relative measurements already
implicate comparisons intrinsically. For a ‘counting’ method like SAGE and for in situ
oligo-microarrays, comparison to public data is easy. Such studies can reveal specific marker
genes, differences in mechanisms between healthy and diseased states and show variations
among sample groups (e.g., cancer subtypes). If similar sources are compared, hypotheses
for upcoming new experiments can be derived and, hopefully, an expansion of the present
mechanistic knowledge is achieved.
2.2.2 Clustering reveals distinct patterns in expression profiles
To find similarities and differences between biologically comparable datasets, algorithms
clustering genes with similar expression status are used. Generally, it is possible to group
genes by their co-expressed genes, samples by similar expression profiles or to combine
both. Clusters of co-expressed genes can share similar cellular functions and are likely to be
transcriptionally co-regulated. For example, groups of samples can identify cancer
subclasses by their expression profiles [54,55].
Several public and commercial tools are available on the market that have implemented a
large variety of clustering algorithms and distance measurements (e.g. Genesis [52], TM4
[56]). It should be noted that there are more than 30 papers that offer different mathematical
Identification of new targets using expression profiling Angiogenic Cancer Therapy
Page 19
forms of clustering expression profiles but it is not really clear whether mathematical
sophistication is always good for the application. None of the clustering algorithms can
claim for itself that its special analytical form does reflect aspects of the biological system
better than the others and, therefore, they should be similarly good for the purpose. Even
more, cluster assignments of genes and experiments that change dramatically upon
application of specific clustering algorithms are rather not informative from the biological
point of view. It should also not be forgotten that some datasets contain considerable noise
(error margins of ∼100% are not rare) and clustering of such data can result in artifacts.
Typically, the clustered expression profiles are visualized by coloring them in accordance
with their log2(ratio). This analytical form of the ratio between a sample and a reference
state is used because of its simplicity for interpretation (a two-fold change increases or
decreases the log2(ratio) by one unit). Mostly, repression of the genes in comparison to the
reference is visualized by green (negative log2(ratio)) and over-expressed genes are colored
red (positive log2(ratio)). The higher the expression or repression the brighter the colors are.
Black represents equal amounts.
For measuring the similarity of expression profiles, each gene is characterized by a n-
dimensional vector defining n as the number of samples/experiments. Various distance
metrics (Euclidean distances, correlation distances, semi-metric distances, …) are proposed
to identify a closely related group [57]. The correct choice of the appropriate distance metric
between the vectors is a difficult question and might depend on the data preprocessing (e.g.,
normalization). For SAGE experiments it is shown that Poisson-based distances fit well
[25]. Generally, the observed biological effects should be stable with regard to minor aspects
of the distance metric.
Provided with a distance measurement, supervised and unsupervised clustering methods can
group the genes by their similarities. Unsupervised approaches are used to find co-regulated
genes or related samples. For supervised methods (e.g. supported vector machine), which
can create classifiers to predict some behavior, additional knowledge for some profiles must
be provided like functional classes or healthy and diseased states [58]. Three different
unsupervised methods will be described shortly to give an insight into the mechanism behind
the most important algorithms.
Identification of new targets using expression profiling Angiogenic Cancer Therapy
Page 20
Hierarchical clustering [59], one of the most common unsupervised methods, joins
consecutively the nearest clusters/genes together until all are combined in one large group.
As a result, the clustered genes are placed into a dendrogram that visualizes the closeness of
the transcriptional status among the genes. Single-, complete- and average-linkage clustering
corresponds to joining of growing clusters regarding the minimum, maximum and average
distances between them [57]. Comparing the minimum distances results in loose clusters,
whereas with complete-linkage compact clusters are achieved. It is a drawback of the simple
hierarchical clustering that an incorrect intermediate assignment cannot be reversed and,
thus, the expression vector defining a cluster might no longer represent the genes in it.
K-means clustering [60] is an iterative method which requires the initial knowledge of the
cluster number K. The genes are randomly assigned to the K clusters. Through iterative gene
shuffling between the clusters, the within-cluster dispersion is minimized and the inter-
cluster distances are maximized. It stops if no improvement can be achieved anymore or if a
specified number of iterations is exceeded. The method is computing-intensive but some
early incorrect assignment can be modified at later iterations. A hierarchical ordering of
clusters is not achieved and, therefore, no dendrogram is generated.
Principal component analysis (PCA) [61] reduces the dimensionality of the expression data
through eigenvector calculations and data projection into the space spanned by the most
important eigenvectors. Therefore, redundant properties of the expression profile are filtered
out and major distinct patterning that describes the data separation of genes best might
become clear. PCA results are visualized in the 3D-space with small clouds of data points
that correspond to clustered genes or experiments.
2.2.3 The molecular role of a gene product can be identified through sequence analysis
Essentially, the basic element of expression data has a composite structure: On the one hand,
it comprises a vector of n real numbers describing the expression status for n
conditions/experiments/time points. Quantitative and qualitative methods for analyzing the

Identification of new targets using expression profiling Angiogenic Cancer Therapy
Page 21
real value part of the data have been considered in the previous chapters. On the other hand,
a sequence tag is associated with the vector of expression values. Without the knowledge of
the identity of the gene represented by the expressed sequence tag and the biological
function of the respective gene, interpretation of the expression data in terms of biological
mechanisms and processes is impossible. It should be noted that protein function requires a
hierarchical description with molecular function, cellular function and phenotypic function
[62].
The first step is to allocate the corresponding gene and protein if available. With the
knowledge of complete genomes, sequence comparisons can identify genes from sufficiently
long sequence tags. For instance rounds of Megablast searches [63] against various
nucleotide databases of decreasing trust-levels (in the order of RefSeq [64,65], FANTOM
[66], UniGene [67], nr GenBank, and TIGR Mouse Gene Index [68] or other organism-
specific databases) can be initially applied. If not all nucleic sequences can be assigned, the
routine should be repeated with blastn [69] and finally against the genome of the whole
organism. Long stretches (>100) of non-specific nucleotides have to be excluded. For the
obtained genes, the respective gene product can be retrieved: This is either a protein
sequence if the expressed RNA is translated to a protein or a functional RNA species
(microRNA, …).
The molecular and cellular role of novel protein targets derived from an expression study is
of special interest. A first insight of the processes involved can be obtained from Gene
Ontology (GO) terms [70]. With the GenPept/RefSeq accession numbers, GO numbers for
molecular function, biological process, and cellular component can be derived from the gene
ontology database (Gene Ontology Consortium). If considered in context with the expression
cluster identity, it is possible to observe groups of co-regulated proteins which are part of an
unique process or share a molecular function. Such groups of genes can be visualized with
Genesis [52].
Detailed de novo function prediction for the target proteins can reveal new aspects of their
molecular and cellular function. This analysis step is especially important for sequences that
entered the databases after large-scale sequencing efforts and that have remained
Identification of new targets using expression profiling Angiogenic Cancer Therapy
Page 22
experimentally uncharacterized. A large variety of different sequence analysis tools are
available. Sometimes, a homology search with the blast tool [69] (with low e-value cut-off
<e-10) finds an almost full-length homologue with a described function that can be
transferred to the protein of interest.
In-depth sequence-analytic studies involve a three-step procedure. This approach is based on
the assumption that proteins consist of linear sequence modules that have their own
structural and functional characteristics. The function of the whole protein is a superposition
of the segments’ functions. The sequence modules can represent globular domains or non-
globular segments such as fibrillar segments with secondary structure, transmembrane
helical segments or polar, flexible regions without inherent structural preferences.
The first step involves the detection of the non-globular part of the protein sequence, which
houses many membrane-embedded segments, localization and posttranslational
modifications sequence signals. Typically, non-globular segments are characterized by some
type of amino acid type compositional bias. Therefore, the principle procedure is to begin
with analyses of compositional biases. They are found as low complexity regions with SEG
[71] and compositional biased stretches with SAPS [72], Xnu, Cast [73] and GlobPlot 1.2
[74]. N-terminal localization signals can be studied with SignalP [75] and Sigcleave[76], the
C-terminal PTS1 signal for peroxisomal targeting via the PEX5 mechanism is checked for
with the predictor of Neuberger et al. [77,78,79]. A number of quite accurate predictors test
the capacity of the query protein for lipid posttranslational modifications such as GPI lipid
anchors [80,81,82], myristoyl [83] or prenyl (farnesyl or geranylgeranyl) [84] anchors.
Membrane-embedded regions are recognized via the occurrence of strongly hydrophobic
stretches. Standard predictors such as HMMTOP [85], TOPPRED, DAS-TMfilter [86] and
SAPS [72] find transmembrane helical regions. Generally, several transmembrane prediction
methods should map to the same loci to obtain reliable results. Secondary structure
prediction methods (COILS [87], SSCP [88,89], Predator [90]) can generate information
about secondary structural elements in non-globular parts of proteins.
The second step involves comparisons of the query sequence with libraries of known
domains. Since domain definitions of even the same domain type do slightly differ among

Identification of new targets using expression profiling Angiogenic Cancer Therapy
Page 23
authors, it is necessary to check all available for the given query sequence. Known sequence
domains of the repositories PFAM and SMART [91] are characterized by hidden Markov
models (HMM), which can be searched against a sequence with HMMER both in a global
and local search mode. Further domain prediction method and databases are RPS-BLAST
(CDD) [92], IMPALA [93] and PROSITE [94].
The third, the last step involves analysis of query protein segments (at least 50 amino acid
residues long) that are not covered by hits produced by any of the prediction tools for non-
globular regions and known domains. Most likely, these sequence segments represent not yet
characterized globular domains. It is necessary to collect protein sequence segments that are
significantly similar to the respective part of the query. This can be done with tools from the
BLAST/PSI-BLAST suite [95,96,97], HMMsearch or SAM [98,99]. There are several
strategies to collect as complete as possible sequence families; for example, each identified
homologous protein can be resubmitted to an additional PSI-BLAST in an attempt to find
more homologues. Through multiple alignments of the conserved residue stretches, sequence
analysis of the found proteins and extensive literature search, a new functional domain can
be characterized. Further, prediction of tertiary structure can sometimes help to answer
additional questions (e.g. small pockets for therapeutics). PDBblast can identify the structure
through homology to proteins with known tertiary structure. De novo structure prediction
methods are evolving very fast. An excellent meta-server combining various structural
prediction method can be found at bioinfo.pl [100].
Finally, the different sequence-analytic findings for the various query segments need to be
synthesized for a description of the function of the whole protein. Overlaps of predicted
features have to be resolved by assessing significances of hits, the amino acid compositional
status of the respective segment and expected false-positive prediction rates of algorithms.
With the entirety of the sequence-analytic methods, some functional conclusion at least in
very general terms is possible for most sequences. All these academic prediction tools for de
novo sequence prediction are integrated in the user-friendly ANNOTATOR/NAVIGATOR
environment, a novel protein sequence analysis system which is in development at the IMP
Bioinformatics group. A single experienced researcher can reasonably characterize ∼100
Identification of new targets using expression profiling Angiogenic Cancer Therapy
Page 24
sequence targets per day in this environment.
2.2.4 Network reconstruction gives insight into the transcriptional mechanisms of small
genomes
Expression profiling is, due to the wealth of data, a good source for reconstruction of gene
networks. Generally, these methods determine genes, which affect the activity of other ones.
Genes are represented in the networks as a node and the impact on another gene is shown in
a connective arc. The arcs can receive a label, like up- or down-regulation [101,102].
Networks can describe as diverse conditions as the influence of one gene expression on
another expression [102] or the influence of a deletion mutant on other gene expressions
[101] and even the mention of two genes in the same paper as in literature based networks
[103,104]. The construction of these interactions relies among others on Boolean networks,
Bayesian networks or biological-meaningful decision trees. Further, it is possible to integrate
additional knowledge like transcription factor binding of chromatin-immunoprecipitation
(ChIP) or computational prediction of transcription factor binding [105].
Unfortunately, most of these studies are limited to small genomes and dataset. Especially the
well characterized yeast Saccharomyces cerevisiae is a preferred model system for network
reconstruction. This is no surprise since the accuracy of the genome sequence, the
established methodologies of measuring precise and reproducible expression profiles and the
wealth of other biological data available invite for such analyses. It will take a while until
methods will generate similar biologically reasonable insight for more complex organism.
Several procedures allow prediction of regulatory elements of genes important for the
regulatory network, which is implicated in the expression profile. One way is to cluster the
genes by their expression profile and search for transcription factor binding sites of public
databases (e.g. TRANSFAC) that are specific for a cluster [106]. A different approach is a de
novo prediction of regulatory oligonucleotides based on the genome-wide expression profiles
and the promoter sequences. The web-based tool, Regulatory Element Detection Using
Correlation with Expression (REDUCE), tries to explain the log-ratio of a gene expression
by the number of occurrences of the motif in its promoter. The regression coefficient

Identification of new targets using expression profiling Angiogenic Cancer Therapy
Page 25
associated with the motif occurrence can be directly interpreted as the change in
concentration of the active transcription factor in the nucleus [107].
2.3 Validation of expression profiles – Testing the hypothesis
In large scale expression profiling, there are many sources of errors beginning from wrong
sequencing, tag assignment, arraying, labeling biases, difficulties in managing large clone
sets and datasets, over reagent, color, equipment, personal and day-by-day biases and sample
specific errors. Therefore, an identified novel target gene of a large scale expression study
must always be validated with a second different method to exclude a wrong measurement of
a specific method and to be sure to address the right target. Especially Northern-Blotting and
RT-PCR are the preferred methods to verify DNA microarray expression data [37].
Expression profile analysis-based hypotheses have to be investigated in further follow-up
studies using appropriate techniques such as RNAi, overexpression or knock-out
experiments.
3 Success stories with expression profiling in angiogenesis and other biological
processes
The original idea of using large-scale gene expression profiling for the elucidation of
systembiological properties (for example, gene networks) of cells has found its realization
only in a few studies and these focused mainly on simple model organisms. At the
beginning, the problems with accuracy and reproducibility of large-scale expression
measurements favored two other types of applications, namely (i) the usage of microarrays
for the identification of a handful or even a single target that are most up-regulated in certain
physiological conditions and (ii) the numerical overall comparison of large sets of expression
values between different physiological states for diagnostic purposes (for example, for the
differentiation between cancer development stages). In both cases, even gross errors of
expression values for a limited number of genes do not affect the outcome dramatically.
With the technology improving, the original idea of understanding gene networks has
Identification of new targets using expression profiling Angiogenic Cancer Therapy
Page 26
revived and it has become possible to delineate groups of genes in expression profiles that
are together responsible for certain cellular processes and explain the molecular mechanism
behind physiological phenomena.
The following sections highlight some selected recent expression profiling studies, which
have led to the identification (i) of only a few but critical targets, (ii) of group of transcripts
that are involved in common pathways and processes, and (iii) of genes that could be placed
into a network construct. We put special emphasis on attempts to study expression profiles of
cells/tissues with a role in angiogenic processes but, if appropriate, we will present also other
examples.
3.1 Identification of targets with prominent expression regulation
Roca et al. [108] investigated the mechanisms underlying the inhibition of in vitro and in
vivo angiogenesis during hyperthermia. This treatment often complements radiotherapy or
chemotherapy of cancer [109,110]. First, an inhibition of angiogenesis was observed in in
vitro endothelial cells on a three dimensional preparation, which were exposed to
temperatures 41-45ºC. Culture medium treatment with the angiogenic factor VEGF-A165
could not neutralize this inhibition. The same observation was found in the in vivo chick
embryo chorioallantoic membrane assay. To understand the molecular mechanism, a
microarray experiment was performed. The results showed a marked up-regulation of the
plasminogen activator inhibitor 1 (PAI-1) [108]. PAI-1 is responsible for the extracellular
matrix homeostasis during angiogenesis [111]. Finally, the hypothesis of the PAI-1
involvement was further manifested by the indication that anti-PAI-1 antibodies antagonize
the hypothermia effects on angiogenesis of in vitro and in vivo systems [108]. This study
started with a phenotypic observation in in vitro and in vivo systems. The investigation has
relevance for real therapy. Further, this led to the characterization of the effects at the
transcriptional level with microarrays. The hypothesis of PAI-1 involvement in the process
of angiogenic inhibition during hypothermia evolved from this experiment and it was proven
with additional experiments.
Watanabe et al. [112] searched with cDNA microarrays for VEGF-inducible genes in human
Identification of new targets using expression profiling Angiogenic Cancer Therapy
Page 27
umbilical vein endothelial cells (HUVECs). 97 genes were up-regulated more than two-fold
by VEGF. This group contained 11 uncharacterized products. In their follow-up study, they
concentrated on KIAA1036, which was named vasohibin. The recombinant protein inhibited
VEGF- and FGF2-induced angiogenesis, which indicated that vasohibin secreted into the
extracellular space acts on endothelial cells. Further, this endothelial cell specific transcript
inhibited tumor angiogenesis in vivo in transfected Lewis lung carcinoma cells. Therefore,
the first evidence of a feedback inhibitory factor involved in angiogenesis was found by
large-scale microarray techniques combined with appropriate experiments to prove the
hypothesis.
Tubulogenesis by epithelial cells regulates kidney, lung, and mammary development,
whereas that by endothelial cells regulates vascular development. Albig and Schiemann
[113] studied gene expression differences of endothelial tubulogenesis and of epithelial
tubulogenesis with the microarray technology. The regulator of G protein signaling 4
(RGS4), which was not previously associated with tubulogenesis, was found to be up-
regulated >8-fold in tubulating cells compared to the control samples, thereby implicating
RGS4 as a potential regulator of tubulogenesis.
Zhang et al. [114] wanted to shed light into the molecular mechanism of the phenotypic
observation that antithrombin is transformed to a potent angiogenic inhibitor by limited
proteolysis or mild heating [115]. Treatment of bFGF-induced and control HUVECs with
latent antiangiogenic antithrombin repressed the key proangiogenic heparan sulfate
proteoglycan, perlecan, significantly compared to HUVECs treated with native antithrombin.
This observation made with the cDNA microarray technology was confirmed on the mRNA
and protein level with semi-quantitative reverse transcriptase-polymerase chain reaction
(RT-PCR), Northern blotting, and immunoblotting analyses. Finally, it was shown, that the
exposure to TGF-beta1, another stimulator of perlecan expression, overcomes the inhibitory
effect of antiangiogenic antithrombin [114].
Yuan et al. [116] investigated the role of ephrinB2 and its receptor ephB4, which have to be
localized in the membranes of adjacent cells for interaction, in inflammatory angiogenesis.
cDNA membrane microarray experiments identified a group of 13 up-regulated genes after
Identification of new targets using expression profiling Angiogenic Cancer Therapy
Page 28
ephrinB2 stimulation of HUVEC. Syntenin, which binds syndecan, is a member of this gene
group. Subsequently, RT-PCR and Northern blotting confirmed the increased expression of
syndecan-1. Further experiments showed that ephrin stimulated up-regulation of syndecan-1,
which exhibited in vitro antiangiogenic and in vivo angiogenic effects. Due to the fact that
the enzyme heparanase, which converts soluable syndecan-1 from an inhibitor into a potent
activator of angiogenesis, is expressed in inflammatory environments, controversial effects
were observed [116]. This study emphasizes that the observations of simplified in vitro
studies cannot always be generalized for in vivo systems even if the same expression is
measured. Due to additional, probably unmeasured signals and proteins, further rational
inspiration and literature research can help to identify missing links of the original
expression profiles. This is especially important if only a limited number of genes were
profiled. Therefore, it is critical to keep in mind that a gene expression profile mirrors only a
snapshot of the transcripts at a specific time in a specific environment, which might not be
able to explain effects caused at higher levels of regulations, for example post-translation
modifications. Further, genes that are not arrayed slip through the measurement in the case
of DNA chips.
The Nanog story nicely illustrates the difficulties in proper interpretation of expression data.
Microarray-based studies of expression profiles focused on embryonic stem cells have
generated a long lists of putative important genes involved in the core stem cell properties
[117]. Only a year later, Nanog was identified as a key gene with important roles in
pluripotency and self-renewal of embryonic stem cells [118]. The vast amount of
uncharacterized genes of the original experiment left this protein unrecognized until it was
re-identified with cDNA library screening methods followed by the molecular
characterization of the homeodomain containing transcriptional regulator, which proved to
be a key player of self-renewal [118]. Yet another year later, a microarray study [119]
revealed with hierarchical clustering that Nanog is also highly expressed in carcinoma in situ
(CIS), the common precursor of testicular germ cell tumors, and might play an important
role in malignant behavior. Comparison of the CIS expression profile showed common
patterns with embryonic stem cells supporting the hypothesis of early fetal origin of CIS
cells.
Identification of new targets using expression profiling Angiogenic Cancer Therapy
Page 29
Expression analysis studies that focus only on the handful of top-regulated genes have
received considerable support from large-scale expression profiling and lead to many
research results with biological and medical significance. At the same time, it might be
considered a waste of effort if the rest of the expression profile was not studied with
appropriate scrutiny. Interestingly, most single factor identification experiments in
angiogenesis research didn’t use basic profile analyses methods such as normalization and
clustering. Instead, they concentrated on a single differentially regulated factor and
performed further experiments to verify the hypotheses. A higher success rate in
identification of novel targets and mechanisms might be achieved if the profiles of large
scale expression studies are analyzed rigorously with the goal of deriving hypothesis from
these results. Naturally, this effort is combined with huge work of computational analysis
(both with respect to expression value studies and gene function prediction with sequence-
analytic methods together with literature research). We think that such a hypothesis-driven
strategy might prevent some trial-and-error approaches and, therefore, redirects the sequel
experiments into the right direction reducing time- and resource-consumption of follow-up
studies.
3.2 Identification of groups of target genes responsible for cellular mechanisms
In the consideration of expression studies, quality aspects of sample preparation are often
overlooked. This issue is especially important for angiogenesis-related investigations since
endothelial cells form only single layers on the base membrane in vessels that intimately
penetrate other tissues. The pure extraction of endothelial cell from human tissue samples in
a form useful for expression profiling from in vivo material was first achieved by St. Croix et
al. [2]. As an application, they examined differential gene expression in normal and tumor
endothelial cells (ECs). Purified human ECs were subjected to SAGE profiling (with
sequencing of ca. 100000 tags). On the one hand, 93 pan-endothelial markers were extracted
with similarly high expression in normal and tumor ECs. On the other hand, 33 tags (named
Normal Endothelial Markers; NEM) and 46 tags were identified to be specifically elevated in
normal endothelium and in tumor endothelium respectively. Despite of the methodical
progress, the work of St. Croix et al. left several issues open.
(i) Surprisingly, the second group of 46 tags was called Tumor Endothelial Markers
Identification of new targets using expression profiling Angiogenic Cancer Therapy
Page 30
(TEMs), although the authors could not bring up any biological argument
justifying specificity of the ECs extracted from tumor tissue for the tumor state.
Not surprisingly, an in-depth sequence-analytic study of the TEMs [1] showed
that they are generally highly expressed during angiogenesis of wound healing,
corpus luteum formation, bone restructuring, etc. Thus, the TEMs are in fact
markers of angiogenesis describing common features of the respective cellular
processes.
(ii) Many tags were left without link to genes and many genes missed a functional
characterization. Novatchkova and Eisenhaber [1] carried out a case study of the
identification of molecular mechanism from gene expression profiles. A careful
strategy of tag-to-gene mapping was applied, which led to only nine tags without
a link to a gene. With a variety of different sequence analysis algorithms,
putative non-globular domains and globular domains were assigned to the
protein sequence. This information of the protein architecture together with
homology searches and target-specific scientific literature links led to molecular
and cellular function and mechanistic insights of the involved PEMs and TEMs.
Novatchkova and Eisenhaber found that most TEM targets identified are relatively
downstream of the regulatory cascades leading to angiogenesis. They are involved in more
general features such as extracellular matrix remodeling, migration, adhesion and cell-cell
communication typical for migrating cells in restructuring tissues rather than specific for
angiogenesis initiation and control. Therefore, these genes should be termed more correctly
as angiogenic endothelial markers. Apparently, also the abundance of transcripts is
important. The identification of genes that are mainly endpoints of regulation cascades
mirrors the preferred registration of highly abundant transcripts in the original SAGE study.
Further, it was shown that in vitro endothelial expression studies are very different from in
vivo profiles and, therefore, hardly representative for the in vivo situation.
SP100 interacts with the proangiogenic transcription factor ETS1 and represses thereby the
DNA-binding and transcriptional activity [120,121]. Since SP100 is also expressed in
endothelial cells, Yordy et. al. [122] tested the hypothesis that SP100 alters the ETS1
response in endothelial cells. It was shown that the antiangiogenic interferons IFN-α, IFN-γ
and TNF-γ induce SP100 in endothelial cells. To characterize the negative phenomenological
Identification of new targets using expression profiling Angiogenic Cancer Therapy
Page 31
modulation of SP100 on ETS1 on the molecular level, gene expression profiles were
generated with microarrays. With hierarchical clustering, 1000 expressed sequence tags
(ESTs) were grouped and the complexity was further reduced with a self organizing tree
algorithm. This resulted in 129 ESTs which are reciprocally regulated between the SP100
and ETS1 experiments. Gene ontology terms were assigned. This strategy led to the
conclusion, that only a part of ETS1 regulated genes can be modulated by SP100 but genes
that show reciprocal expression in response to ETS1 and SP100 have anti-migratory or anti-
angiogenic properties.
Nagawaka et al. [123] investigated the influence of hematopoietically expressed homeobox
(HEX), which is transiently up-regulated in endothelial cells during vascular formation in
embryos [124]. Therefore, HUVECs were transfected with the transcription factor HEX and
the effects on the transcriptome were compared relative to not transfected cells with cDNA
microarray. The repression of several important factors including VEGFR-1, VEGFR-1,
TIE-1, TIE-2, and neuropilin-1 was observed. In contrast, mRNA levels of endoglin, ephrin
B2, urokinase-type plasminogen activator, tissue-type plasminogen activator, plasminogen
activator inhibitor-1, TIMP-1, TIMP-2, and TIMP-3 were upregulated >2-fold [123]. This
expression profile mirrors a repression of angiogenesis induced by HEX in an in vitro study
and assigns, thereby, an antiangiogenic role to HEX in this environment.
Angiogenesis is an important process for tumor growth [125]. Nevertheless, it was reported
that tumors can grow without new vessel formation by taking advantage of pre-existing ones
[126]. Hu et al. [127] investigated the transcriptional differences between angiogenic and
nonangiogenic non-small-cell lung cancer with cDNA microarrays. These two
phenomenological characteristics could be distinguished by a group of 62 genes. It was
found that non-angiogenic tumors have more up-regulated genes involved in mitochondrial
metabolism. Thus, intracellular respiration appears more effective in non-angiogenic tumors.
Thijssen et al. [128] followed an interesting approach to profile the important
communication and interaction between tumor and endothelial cells. Therefore, a xenograft
tumor was constructed by inoculation of mice with human tumor cells. Quantitative real time
RT-PCR (qRT-PCR) was used to measure the expression level of 16 angiogenesis-related
Identification of new targets using expression profiling Angiogenic Cancer Therapy
Page 32
genes. To distinguish between the mRNA origins, primers specific for mouse and human
were constructed in low homology regions. bFGF expression was for instance 300-fold
higher in non-tumor cells. The real power of this method was shown by monitoring the
changes in the two compartments in response to different antitumor treatments.
The combination of vascular endothelial growth factor (VEGF) and hepatocyte growth factor
(HGF) induces a more robust angiogenesis than by each factor alone [129]. Gerritsen et. al.
[130] investigated the underlying mechanisms of this additive affect by measuring the
response of VEGF and HGF as well as the combination of both with Affymetrix microarrys.
Relative log ratios were obtained by comparing the induced profile with the basal one. Only
a small fraction of the enhanced genes were up-regulated in both datasets after VEGF or
HGF stimulation. The synergistic interaction differentially regulated twice as many genes as
for each growth factor alone, including many totally different genes. This study emphasizes
the importance to investigate not only the response of a single factor but also the synergistic
combination of two or more to identify the important targets for an efficient anti-angiogenic
cancer therapy.
3.3 Identification of gene networks
The reconstruction of gene networks from expression profiles is the ultimate goal; although,
it remains a matter of the future with respect to angiogenesis. In this section, we describe a
few examples that highlight the principal possibilities. It should be noted that most network
reconstruction studies were carried out on yeast and other model organisms with small gene
numbers. Even under these conditions, the level of system understanding and the biological
significance of results remain limited.
Ideker et al. [8] investigated the galactose utilization in yeast by an integrated approach of
genomic and proteomic data. Therefore, the genome sequence and the identity genes,
proteins and other players in pathways were known at the beginning and an initial qualitative
(topology) model of the galactose related part of the network could be constructed a priori.
The authors introduced several perturbations in yeast cultures and recorded the genomic and
proteomic response. Analysis of the expression profiles allowed improving the model of the
Identification of new targets using expression profiling Angiogenic Cancer Therapy
Page 33
network. This process of perturbation and integration of its resulting influences into the
model was iteratively repeated. This approach led to a number of refinements of the
galactose utilization model with regard to network interactions and new regulators.
Basso et al. [131] claim to have reconstructed a genetic network from large scale expression
profiles in the mammalian cells. For a substantial range of absolute expression, a large set of
336 human B cell phenotypes were profiled with microarrays and an algorithm for the
reconstruction of accurate cellular networks (ARACN) was applied. The network indicates a
topology of few highly connected hubs and a high number of less connected nodes with a
hierarchical control mechanism, which is already known for phylogenetically earlier
organisms [131,132]. Further the gene named BYSL was biochemically identified to be part
of the proto-oncogene MYC network, which might have important cellular roles. The
interpretation approach might be especially interesting for investigation of tumor subtype
differentiation [131].
Gao et al. [105] analyzed transcription networks by combining genome-wide expression data
of ~750 expression pattern and the genome-wide promoter occupancies for 113 transcription
factors. Surprisingly, roughly the half of the transcription factor targets, which were
predicted by the ChIP analysis, was not regulated by them. Therefore, the regulatory
coupling strength was calculated between all transcription factors and genes, which might
enhance the specificity of target predictions. The importance of coupling was further
manifested by enrichment of specific Gene Ontology categories and significant change in
mRNA expression of transcription factor deletion mutants in the coupled test group
compared the bound transcription factor but un-coupled group. This study highlights that
binding of a transcription factor is not sufficient to predict the regulation of the gene.
4 Summary
This review has considered both experimental and computational biology methodologies
used for gene expression profiling as well as applications of these techniques to
angiogenesis. Although the expectations from expression profiling techniques within the

Identification of new targets using expression profiling Angiogenic Cancer Therapy
Page 34
scientific community were initially high (especially with respect to the system-wide view
and analysis), the additional insight produced by the respective research efforts are limited
and our understanding of molecular processes remains fragmentary. Nobody has ever
calculated the costs that were funneled into expression profiling in general and for
angiogenesis and tumor analysis specifically and analyzed possible outcomes of alternative
investment scenarios. It is widely accepted that expression profiling methods have become
an indispensable part of the arsenal of modern research methods. In carefully selected cases,
these techniques will generate the decisive data.
We think that, for some applications, currently gene expression profiling methods might be
simply insufficiently mature. We expect their considerable technical sophistication in
coming years with emerging solutions for improving accuracy, reproducibility, sensitivity
and reduced requirements in sample size. Single cell expression profiling will certainly
become a standard. In addition to technical improvements for expression measuring, the
consequent application of available computational biology approaches (for the post-
experimental treatment of data) can extract more value from available expression profiles
already now. Normalization and clustering of expression vectors should become a standard
as well as sequence-based function prediction for insufficiently characterized genes and their
protein products. Most studies have not invested enough for these purposes and the
respective principal investigators should be encouraged to look after appropriate
collaborations.
Finally, expression profiling should be viewed in context of cellular hierarchies and the
different methods that generate information about them. For proper biological interpretation,
it will be important to integrate genome sequence data, gene and protein functional
annotation, gene expression profiles and protein occurrence data from proteomics
experiments.
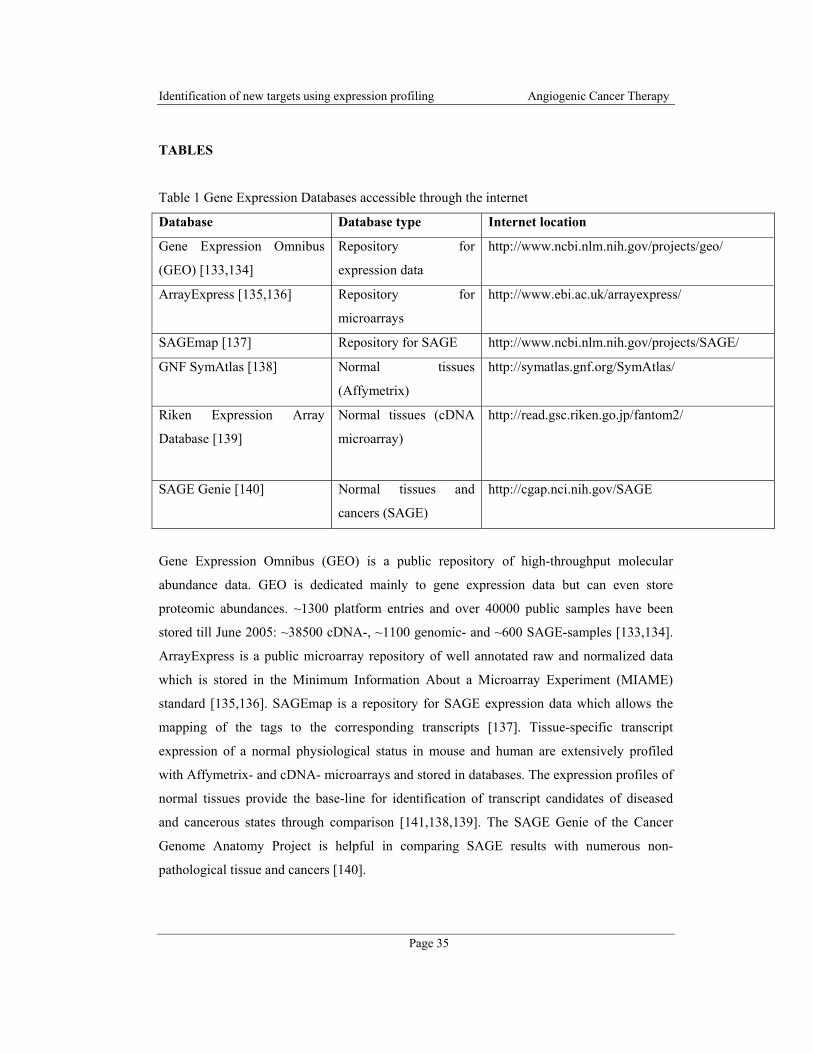
Identification of new targets using expression profiling Angiogenic Cancer Therapy
Page 35
TABLES
Table 1 Gene Expression Databases accessible through the internet
Database Database type Internet location
Gene Expression Omnibus
(GEO) [133,134]
Repository for
expression data
http://www.ncbi.nlm.nih.gov/projects/geo/
ArrayExpress [135,136] Repository for
microarrays
http://www.ebi.ac.uk/arrayexpress/
SAGEmap [137] Repository for SAGE http://www.ncbi.nlm.nih.gov/projects/SAGE/
GNF SymAtlas [138] Normal tissues
(Affymetrix)
http://symatlas.gnf.org/SymAtlas/
Riken Expression Array
Database [139]
Normal tissues (cDNA
microarray)
http://read.gsc.riken.go.jp/fantom2/
SAGE Genie [140] Normal tissues and
cancers (SAGE)
http://cgap.nci.nih.gov/SAGE
Gene Expression Omnibus (GEO) is a public repository of high-throughput molecular
abundance data. GEO is dedicated mainly to gene expression data but can even store
proteomic abundances. ~1300 platform entries and over 40000 public samples have been
stored till June 2005: ~38500 cDNA-, ~1100 genomic- and ~600 SAGE-samples [133,134].
ArrayExpress is a public microarray repository of well annotated raw and normalized data
which is stored in the Minimum Information About a Microarray Experiment (MIAME)
standard [135,136]. SAGEmap is a repository for SAGE expression data which allows the
mapping of the tags to the corresponding transcripts [137]. Tissue-specific transcript
expression of a normal physiological status in mouse and human are extensively profiled
with Affymetrix- and cDNA- microarrays and stored in databases. The expression profiles of
normal tissues provide the base-line for identification of transcript candidates of diseased
and cancerous states through comparison [141,138,139]. The SAGE Genie of the Cancer
Genome Anatomy Project is helpful in comparing SAGE results with numerous non-
pathological tissue and cancers [140].
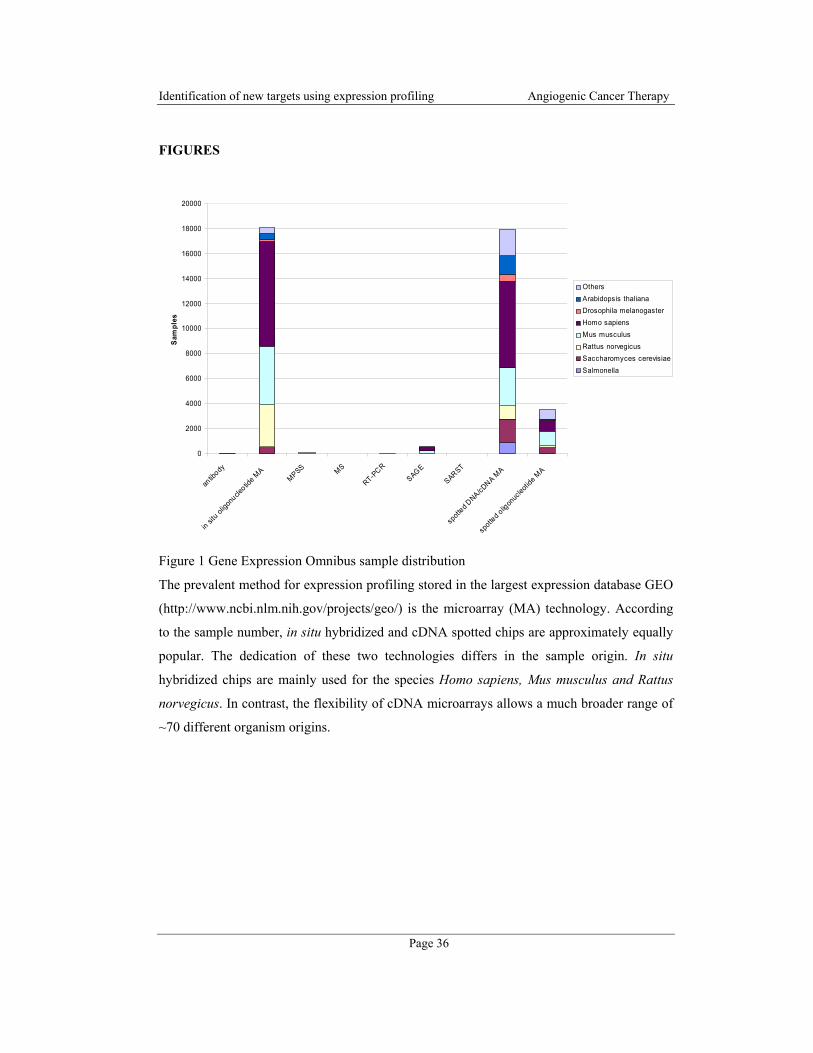
Identification of new targets using expression profiling Angiogenic Cancer Therapy
Page 36
FIGURES
0
2000
4000
6000
8000
10000
12000
14000
16000
18000
20000
antib
ody
in sit
u olig
onucle
otide M
AMPSS MS
RT-PCR
SAGE
SARST
spott
ed DNA/cD
NA MA
spott
ed olig
onuc
leotid
e MA
Sam
ples
OthersArabidopsis thalianaDrosophila melanogasterHomo sapiensMus musculusRattus norvegicusSaccharomyces cerevisiaeSalmonella
Figure 1 Gene Expression Omnibus sample distribution
The prevalent method for expression profiling stored in the largest expression database GEO
(http://www.ncbi.nlm.nih.gov/projects/geo/) is the microarray (MA) technology. According
to the sample number, in situ hybridized and cDNA spotted chips are approximately equally
popular. The dedication of these two technologies differs in the sample origin. In situ
hybridized chips are mainly used for the species Homo sapiens, Mus musculus and Rattus
norvegicus. In contrast, the flexibility of cDNA microarrays allows a much broader range of
~70 different organism origins.
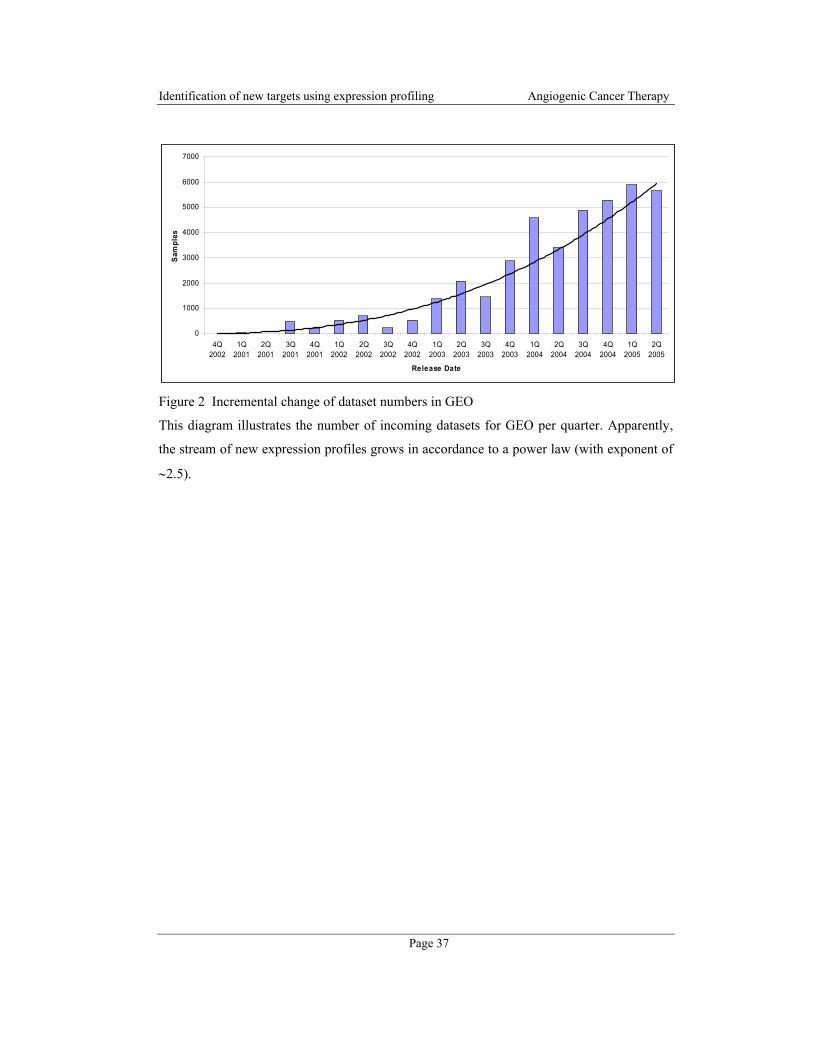
Identification of new targets using expression profiling Angiogenic Cancer Therapy
Page 37
0
1000
2000
3000
4000
5000
6000
7000
4Q2002
1Q2001
2Q2001
3Q2001
4Q2001
1Q2002
2Q2002
3Q2002
4Q2002
1Q2003
2Q2003
3Q2003
4Q2003
1Q2004
2Q2004
3Q2004
4Q2004
1Q2005
2Q2005
Release Date
Sam
ples
Figure 2 Incremental change of dataset numbers in GEO
This diagram illustrates the number of incoming datasets for GEO per quarter. Apparently,
the stream of new expression profiles grows in accordance to a power law (with exponent of
∼2.5).

Identification of new targets using expression profiling Angiogenic Cancer Therapy
Page 38
Reference List
1. Novatchkova, M. and Eisenhaber, F., Can molecular mechanisms of biological
processes be extracted from expression profiles? Case study: endothelial
contribution to tumor-induced angiogenesis, Bioessays, 23, 1159, 2001
2. St Croix, B.et. al, Genes expressed in human tumor endothelium, Science, 289,
1197, 2000
3. Velculescu, V.E.et. al, Serial analysis of gene expression, Science, 270, 484, 1995
4. Brenner, S.et. al, Gene expression analysis by massively parallel signature
sequencing (MPSS) on microbead arrays, Nat. Biotechnol., 18, 630, 2000
5. Lipshutz, R.J.et. al, Using oligonucleotide probe arrays to access genetic diversity,
Biotechniques, 19, 442, 1995
6. Schena, M.et. al, Quantitative monitoring of gene expression patterns with a
complementary DNA microarray, Science, 270, 467, 1995
7. Gygi, S.P.et. al, Correlation between protein and mRNA abundance in yeast, Mol.
Cell Biol., 19, 1720, 1999
8. Ideker, T.et. al, Integrated genomic and proteomic analyses of a systematically
perturbed metabolic network, Science, 292, 929, 2001
9. Kern, W.et. al, Correlation of protein expression and gene expression in acute
leukemia, Cytometry B Clin. Cytom., 55, 29, 2003
10. Liang, P. and Pardee, A.B., Differential display of eukaryotic messenger RNA by
means of the polymerase chain reaction, Science, 257, 967, 1992
11. Welsh, J.et. al, Arbitrarily primed PCR fingerprinting of RNA, Nucleic Acids Res,
20, 4965, 1992
Identification of new targets using expression profiling Angiogenic Cancer Therapy
Page 39
12. Ito, T.et. al, Fluorescent differential display: arbitrarily primed RT-PCR
fingerprinting on an automated DNA sequencer, FEBS Lett, 351, 231, 1994
13. Liang, P.et. al, Differential display using one-base anchored oligo-dT primers,
Nucleic Acids Res, 22, 5763, 1994
14. Mou, L.et. al, Improvements to the differential display method for gene analysis,
Biochem Biophys Res Commun, 199, 564, 1994
15. Carulli, J.P.et. al, High throughput analysis of differential gene expression, J Cell
Biochem Suppl, 30-31, 286, 1998
16. Sim, G.K.et. al, Use of a cDNA library for studies on evolution and developmental
expression of the chorion multigene families, Cell, 18, 1303, 1979
17. Patanjali, S.R., Parimoo, S., and Weissman, S.M., Construction of a uniform-
abundance (normalized) cDNA library, Proc Natl Acad Sci U S A, 88, 1943, 1991
18. Gergen, J.P., Stern, R.H., and Wensink, P.C., Filter replicas and permanent
collections of recombinant DNA plasmids, Nucleic Acids Res, 7, 2115, 1979
19. Sive, H.L. and St John, T., A simple subtractive hybridization technique employing
photoactivatable biotin and phenol extraction, Nucleic Acids Res, 16, 10937, 1988
20. Byers, R.J.et. al, Subtractive hybridization--genetic takeaways and the search for
meaning, Int. J. Exp. Pathol., 81, 391, 2000
21. Velculescu, V.E., Vogelstein, B., and Kinzler, K.W., Analysing uncharted
transcriptomes with SAGE, Trends Genet, 16, 423, 2000
22. Saha, S.et. al, Using the transcriptome to annotate the genome, Nat. Biotechnol., 20,
508, 2002
23. Pollock, J.D., Gene expression profiling: methodological challenges, results, and
prospects for addiction research, Chem Phys Lipids, 121, 241, 2002
24. Tuteja, R. and Tuteja, N., Serial analysis of gene expression (SAGE): unraveling the
Identification of new targets using expression profiling Angiogenic Cancer Therapy
Page 40
bioinformatics tools, Bioessays, 26, 916, 2004
25. Cai, L.et. al, Clustering analysis of SAGE data using a Poisson approach, Genome
Biol, 5, R51, 2004
26. Singh-Gasson, S.et. al, Maskless fabrication of light-directed oligonucleotide
microarrays using a digital micromirror array, Nat. Biotechnol., 17, 974, 1999
27. Nuwaysir, E.F.et. al, Gene expression analysis using oligonucleotide arrays
produced by maskless photolithography, Genome Res., 12, 1749, 2002
28. Shoemaker, D.D.et. al, Experimental annotation of the human genome using
microarray technology, Nature, 409, 922, 2001
29. Schulze, A. and Downward, J., Navigating gene expression using microarrays--a
technology review, Nat. Cell Biol., 3, E190, 2001
30. Lyons, P., Advances in spotted microarray resources for expression profiling, Brief.
Funct. Genomic. Proteomic., 2, 21, 2003
31. Duggan, D.J.et. al, Expression profiling using cDNA microarrays, Nat. Genet., 21,
10, 1999
32. Affara, N.A., Resource and hardware options for microarray-based experimentation,
Brief Funct Genomic Proteomic, 2, 7, 2003
33. Livesey, F.J., Strategies for microarray analysis of limiting amounts of RNA, Brief.
Funct. Genomic. Proteomic., 2, 31, 2003
34. Karsten, S.L.et. al, An evaluation of tyramide signal amplification and archived
fixed and frozen tissue in microarray gene expression analysis, Nucleic Acids Res.,
30, E4, 2002
35. Eberwine, J.et. al, Analysis of gene expression in single live neurons, Proc. Natl.
Acad. Sci. U. S. A, 89, 3010, 1992
36. Baugh, L.R.et. al, Quantitative analysis of mRNA amplification by in vitro
Identification of new targets using expression profiling Angiogenic Cancer Therapy
Page 41
transcription, Nucleic Acids Res., 29, E29, 2001
37. Richter, A.et. al, Comparison of fluorescent tag DNA labeling methods used for
expression analysis by DNA microarrays, Biotechniques, 33, 620, 2002
38. Czechowski, T.et. al, Real-time RT-PCR profiling of over 1400 Arabidopsis
transcription factors: unprecedented sensitivity reveals novel root- and shoot-specific
genes, Plant J, 38, 366, 2004
39. Horak, C.E. and Snyder, M., Global analysis of gene expression in yeast, Funct.
Integr. Genomics, 2, 171, 2002
40. Zhang, H., Yan, W., and Aebersold, R., Chemical probes and tandem mass
spectrometry: a strategy for the quantitative analysis of proteomes and
subproteomes, Curr. Opin. Chem. Biol., 8, 66, 2004
41. Linscheid, M.W., Quantitative proteomics, Anal. Bioanal. Chem., 381, 64, 2005
42. Gygi, S.P.et. al, Quantitative analysis of complex protein mixtures using isotope-
coded affinity tags, Nat. Biotechnol., 17, 994, 1999
43. Bolstad, B.M.et. al, Experimental design and low-level analysis of microarray data,
Int. Rev. Neurobiol., 60, 25, 2004
44. Churchill, G.A., Fundamentals of experimental design for cDNA microarrays, Nat.
Genet., 32 Suppl, 490, 2002
45. Ruijter, J.M., Van Kampen, A.H., and Baas, F., Statistical evaluation of SAGE
libraries: consequences for experimental design, Physiol Genomics, 11, 37, 2002
46. Armstrong, N.J. and van de Wiel, M.A., Microarray data analysis: from hypotheses
to conclusions using gene expression data, Cell Oncol., 26, 279, 2004
47. Yang, Y.H. and Speed, T., Design issues for cDNA microarray experiments, Nat.
Rev. Genet., 3, 579, 2002
48. Quackenbush, J., Microarray data normalization and transformation, Nat. Genet., 32
Identification of new targets using expression profiling Angiogenic Cancer Therapy
Page 42
Suppl, 496, 2002
49. Yang, I.V.et. al, Within the fold: assessing differential expression measures and
reproducibility in microarray assays, Genome Biol., 3, research0062, 2002
50. Pieler, R.et. al, ArrayNorm: comprehensive normalization and analysis of
microarray data, Bioinformatics., 20, 1971, 2004
51. Gentleman, R.C.et. al, Bioconductor: open software development for computational
biology and bioinformatics, Genome Biol., 5, R80, 2004
52. Sturn, A., Quackenbush, J., and Trajanoski, Z., Genesis: cluster analysis of
microarray data, Bioinformatics., 18, 207, 2002
53. Brazma, A.et. al, Minimum information about a microarray experiment (MIAME)-
toward standards for microarray data, Nat. Genet., 29, 365, 2001
54. Wessels, L.F.et. al, A protocol for building and evaluating predictors of disease state
based on microarray data, Bioinformatics., 2005
55. 't Veer, L.J.et. al, Expression profiling predicts outcome in breast cancer, Breast
Cancer Res., 5, 57, 2003
56. Saeed, A.I.et. al, TM4: a free, open-source system for microarray data management
and analysis, Biotechniques, 34, 374, 2003
57. Quackenbush, J., Computational analysis of microarray data, Nat. Rev. Genet., 2,
418, 2001
58. Brazma, A. and Vilo, J., Gene expression data analysis, FEBS Lett., 480, 17, 2000
59. Eisen, M.B.et. al, Cluster analysis and display of genome-wide expression patterns,
Proc. Natl. Acad. Sci. U. S. A, 95, 14863, 1998
60. Tavazoie, S.et. al, Systematic determination of genetic network architecture, Nat.
Genet., 22, 281, 1999
Identification of new targets using expression profiling Angiogenic Cancer Therapy
Page 43
61. Raychaudhuri, S., Stuart, J.M., and Altman, R.B., Principal components analysis to
summarize microarray experiments: application to sporulation time series, Pac.
Symp. Biocomput., 455, 2000
62. Bork, P.et. al, Predicting function: from genes to genomes and back, J. Mol. Biol.,
283, 707, 1998
63. Zhang, Z.et. al, A greedy algorithm for aligning DNA sequences, J Comput Biol, 7,
203, 2000
64. Pruitt, K.D.et. al, Introducing RefSeq and LocusLink: curated human genome
resources at the NCBI, Trends Genet, 16, 44, 2000
65. Pruitt, K.D., Tatusova, T., and Maglott, D.R., NCBI Reference Sequence (RefSeq): a
curated non-redundant sequence database of genomes, transcripts and proteins,
Nucleic Acids Res, 33 Database Issue, D501, 2005
66. Okazaki, Y.et. al, Analysis of the mouse transcriptome based on functional
annotation of 60,770 full-length cDNAs, Nature, 420, 563, 2002
67. Schuler, G.D., Pieces of the puzzle: expressed sequence tags and the catalog of
human genes, J Mol Med, 75, 694, 1997
68. Quackenbush, J.et. al, The TIGR gene indices: reconstruction and representation of
expressed gene sequences, Nucleic Acids Res, 28, 141, 2000
69. Altschul, S.F.et. al, Basic local alignment search tool, J Mol Biol, 215, 403, 1990
70. Ashburner, M.et. al, Gene ontology: tool for the unification of biology. The Gene
Ontology Consortium, Nat. Genet., 25, 25, 2000
71. Wootton, J.C. and Federhen, S., Analysis of compositionally biased regions in
sequence databases, Methods Enzymol, 266, 554, 1996
72. Brendel, V.et. al, Methods and algorithms for statistical analysis of protein
sequences, Proc Natl Acad Sci U S A, 89, 2002, 1992
Identification of new targets using expression profiling Angiogenic Cancer Therapy
Page 44
73. Promponas, V.J.et. al, CAST: an iterative algorithm for the complexity analysis of
sequence tracts. Complexity analysis of sequence tracts, Bioinformatics, 16, 915,
2000
74. Linding, R.et. al, GlobPlot: Exploring protein sequences for globularity and disorder,
Nucleic Acids Res, 31, 3701, 2003
75. Bendtsen, J.D.et. al, Improved prediction of signal peptides: SignalP 3.0, J Mol Biol,
340, 783, 2004
76. von Heijne, G., A new method for predicting signal sequence cleavage sites, Nucleic
Acids Res, 14, 4683, 1986
77. Neuberger, G.et. al, Hidden localization motifs: naturally occurring peroxisomal
targeting signals in non-peroxisomal proteins, Genome Biol., 5, R97, 2004
78. Neuberger, G.et. al, Prediction of peroxisomal targeting signal 1 containing proteins
from amino acid sequence, J. Mol. Biol., 328, 581, 2003
79. Neuberger, G.et. al, Motif refinement of the peroxisomal targeting signal 1 and
evaluation of taxon-specific differences, J. Mol. Biol., 328, 567, 2003
80. Eisenhaber, B., Bork, P., and Eisenhaber, F., Prediction of potential GPI-
modification sites in proprotein sequences, J Mol Biol, 292, 741, 1999
81. Eisenhaber, B.et. al, Glycosylphosphatidylinositol lipid anchoring of plant proteins.
Sensitive prediction from sequence- and genome-wide studies for Arabidopsis and
rice, Plant Physiol, 133, 1691, 2003
82. Eisenhaber, B.et. al, A sensitive predictor for potential GPI lipid modification sites
in fungal protein sequences and its application to genome-wide studies for
Aspergillus nidulans, Candida albicans, Neurospora crassa, Saccharomyces
cerevisiae and Schizosaccharomyces pombe, J. Mol. Biol., 337, 243, 2004
83. Maurer-Stroh, S., Eisenhaber, B., and Eisenhaber, F., N-terminal N-myristoylation
of proteins: prediction of substrate proteins from amino acid sequence, J Mol Biol,
Identification of new targets using expression profiling Angiogenic Cancer Therapy
Page 45
317, 541, 2002
84. Maurer-Stroh, S. and Eisenhaber, F., Refinement and prediction of protein
prenylation motifs, Genome Biology, 6, R55, 2005
85. Tusnady, G.E. and Simon, I., Principles governing amino acid composition of
integral membrane proteins: application to topology prediction, J Mol Biol, 283, 489,
1998
86. Cserzo, M.et. al, On filtering false positive transmembrane protein predictions,
Protein Eng, 15, 745, 2002
87. Lupas, A., Van Dyke, M., and Stock, J., Predicting coiled coils from protein
sequences, Science, 252, 1162, 1991
88. Eisenhaber, F.et. al, Prediction of secondary structural content of proteins from their
amino acid composition alone. I. New analytic vector decomposition methods,
Proteins, 25, 157, 1996
89. Eisenhaber, F., Frommel, C., and Argos, P., Prediction of secondary structural
content of proteins from their amino acid composition alone. II. The paradox with
secondary structural class, Proteins, 25, 169, 1996
90. Frishman, D. and Argos, P., Incorporation of non-local interactions in protein
secondary structure prediction from the amino acid sequence, Protein Eng, 9, 133,
1996
91. Letunic, I.et. al, SMART 4.0: towards genomic data integration, Nucleic Acids Res,
32 Database issue, 142, 2004
92. Marchler-Bauer, A.et. al, CDD: a database of conserved domain alignments with
links to domain three-dimensional structure, Nucleic Acids Res, 30, 281, 2002
93. Schaffer, A.A.et. al, IMPALA: matching a protein sequence against a collection of
PSI-BLAST-constructed position-specific score matrices, Bioinformatics, 15, 1000,
1999

Identification of new targets using expression profiling Angiogenic Cancer Therapy
Page 46
94. Sigrist, C.J.et. al, PROSITE: a documented database using patterns and profiles as
motif descriptors, Brief Bioinform, 3, 265, 2002
95. Schaffer, A.A.et. al, Improving the accuracy of PSI-BLAST protein database
searches with composition-based statistics and other refinements, Nucleic Acids
Res., 29, 2994, 2001
96. Altschul, S.F. and Koonin, E.V., Iterated profile searches with PSI-BLAST--a tool
for discovery in protein databases, Trends Biochem. Sci., 23, 444, 1998
97. Altschul, S.F.et. al, Gapped BLAST and PSI-BLAST: a new generation of protein
database search programs, Nucleic Acids Res., 25, 3389, 1997
98. Wistrand, M. and Sonnhammer, E.L., Improved profile HMM performance by
assessment of critical algorithmic features in SAM and HMMER, BMC.
Bioinformatics., 6, 99, 2005
99. Wistrand, M. and Sonnhammer, E.L., Improving profile HMM discrimination by
adapting transition probabilities, J. Mol. Biol., 338, 847, 2004
100. Ginalski, K.et. al, 3D-Jury: a simple approach to improve protein structure
predictions, Bioinformatics, 19, 1015, 2003
101. Rung, J.et. al, Building and analysing genome-wide gene disruption networks,
Bioinformatics, 18 Suppl 2, 202, 2002
102. Soinov, L.A., Krestyaninova, M.A., and Brazma, A., Towards reconstruction of gene
networks from expression data by supervised learning, Genome Biol, 4, R6, 2003
103. Jenssen, T.K.et. al, A literature network of human genes for high-throughput
analysis of gene expression, Nat. Genet., 28, 21, 2001
104. Stapley, B.J. and Benoit, G., Biobibliometrics: information retrieval and
visualization from co-occurrences of gene names in Medline abstracts, Pac. Symp.
Biocomput., 529, 2000

Identification of new targets using expression profiling Angiogenic Cancer Therapy
Page 47
105. Gao, F., Foat, B.C., and Bussemaker, H.J., Defining transcriptional networks
through integrative modeling of mRNA expression and transcription factor binding
data, BMC. Bioinformatics., 5, 31, 2004
106. Matys, V.et. al, TRANSFAC: transcriptional regulation, from patterns to profiles,
Nucleic Acids Res., 31, 374, 2003
107. Roven, C. and Bussemaker, H.J., REDUCE: An online tool for inferring cis-
regulatory elements and transcriptional module activities from microarray data,
Nucleic Acids Res., 31, 3487, 2003
108. Roca, C.et. al, Hyperthermia inhibits angiogenesis by a plasminogen activator
inhibitor 1-dependent mechanism, Cancer Res., 63, 1500, 2003
109. Overgaard, J.et. al, Randomised trial of hyperthermia as adjuvant to radiotherapy for
recurrent or metastatic malignant melanoma. European Society for Hyperthermic
Oncology, Lancet, 345, 540, 1995
110. Falk, M.H. and Issels, R.D., Hyperthermia in oncology, Int. J. Hyperthermia, 17, 1,
2001
111. Johnsen, M.et. al, Cancer invasion and tissue remodeling: common themes in
proteolytic matrix degradation, Curr. Opin. Cell Biol., 10, 667, 1998
112. Watanabe, K.et. al, Vasohibin as an endothelium-derived negative feedback
regulator of angiogenesis, J. Clin. Invest, 114, 898, 2004
113. Albig, A.R. and Schiemann, W.P., Identification and characterization of regulator of
G protein signaling 4 (RGS4) as a novel inhibitor of tubulogenesis: RGS4 inhibits
mitogen-activated protein kinases and vascular endothelial growth factor signaling,
Mol. Biol. Cell, 16, 609, 2005
114. Zhang, W.et. al, Antiangiogenic antithrombin down-regulates the expression of the
proangiogenic heparan sulfate proteoglycan, perlecan, in endothelial cells, Blood,
103, 1185, 2004
Identification of new targets using expression profiling Angiogenic Cancer Therapy
Page 48
115. O'Reilly, M.S.et. al, Antiangiogenic activity of the cleaved conformation of the
serpin antithrombin, Science, 285, 1926, 1999
116. Yuan, K.et. al, Syndecan-1 up-regulated by ephrinB2/EphB4 plays dual roles in
inflammatory angiogenesis, Blood, 104, 1025, 2004
117. Ramalho-Santos, M.et. al, "Stemness": transcriptional profiling of embryonic and
adult stem cells, Science, 298, 597, 2002
118. Chambers, I.et. al, Functional expression cloning of Nanog, a pluripotency
sustaining factor in embryonic stem cells, Cell, 113, 643, 2003
119. Almstrup, K.et. al, Embryonic stem cell-like features of testicular carcinoma in situ
revealed by genome-wide gene expression profiling, Cancer Res, 64, 4736, 2004
120. Vandenbunder, B.et. al, Complementary patterns of expression of c-ets 1, c-myb and
c-myc in the blood-forming system of the chick embryo, Development, 107, 265,
1989
121. Yordy, J.S.et. al, SP100 expression modulates ETS1 transcriptional activity and
inhibits cell invasion, Oncogene, 23, 6654, 2004
122. Yordy, J.S.et. al, SP100 inhibits ETS1 activity in primary endothelial cells,
Oncogene, 24, 916, 2005
123. Nakagawa, T.et. al, HEX acts as a negative regulator of angiogenesis by modulating
the expression of angiogenesis-related gene in endothelial cells in vitro, Arterioscler.
Thromb. Vasc. Biol., 23, 231, 2003
124. Thomas, P.Q., Brown, A., and Beddington, R.S., Hex: a homeobox gene revealing
peri-implantation asymmetry in the mouse embryo and an early transient marker of
endothelial cell precursors, Development, 125, 85, 1998
125. Folkman, J., Angiogenesis in cancer, vascular, rheumatoid and other disease, Nat.
Med., 1, 27, 1995
Identification of new targets using expression profiling Angiogenic Cancer Therapy
Page 49
126. Pezzella, F.et. al, Non-small-cell lung carcinoma tumor growth without
morphological evidence of neo-angiogenesis, Am. J. Pathol., 151, 1417, 1997
127. Hu, J.et. al, Gene expression signature for angiogenic and nonangiogenic non-small-
cell lung cancer, Oncogene, 24, 1212, 2005
128. Thijssen, V.L.et. al, Angiogenesis gene expression profiling in xenograft models to
study cellular interactions, Exp. Cell Res., 299, 286, 2004
129. Xin, X.et. al, Hepatocyte growth factor enhances vascular endothelial growth factor-
induced angiogenesis in vitro and in vivo, Am. J. Pathol., 158, 1111, 2001
130. Gerritsen, M.E.et. al, Using gene expression profiling to identify the molecular basis
of the synergistic actions of hepatocyte growth factor and vascular endothelial
growth factor in human endothelial cells, Br J Pharmacol, 140, 595, 2003
131. Basso, K.et. al, Reverse engineering of regulatory networks in human B cells, Nat.
Genet., 37, 382, 2005
132. Jeong, H.et. al, The large-scale organization of metabolic networks, Nature, 407,
651, 2000
133. Barrett, T.et. al, NCBI GEO: mining millions of expression profiles--database and
tools, Nucleic Acids Res., 33, D562, 2005
134. Edgar, R., Domrachev, M., and Lash, A.E., Gene Expression Omnibus: NCBI gene
expression and hybridization array data repository, Nucleic Acids Res., 30, 207, 2002
135. Parkinson, H.et. al, ArrayExpress--a public repository for microarray gene
expression data at the EBI, Nucleic Acids Res., 33, D553, 2005
136. Brazma, A.et. al, ArrayExpress--a public repository for microarray gene expression
data at the EBI, Nucleic Acids Res., 31, 68, 2003
137. Lash, A.E.et. al, SAGEmap: a public gene expression resource, Genome Res., 10,
1051, 2000
Identification of new targets using expression profiling Angiogenic Cancer Therapy
Page 50
138. Su, A.I.et. al, Large-scale analysis of the human and mouse transcriptomes, Proc.
Natl. Acad. Sci. U. S. A, 99, 4465, 2002
139. Bono, H.et. al, Systematic expression profiling of the mouse transcriptome using
RIKEN cDNA microarrays, Genome Res., 13, 1318, 2003
140. Liang, P., SAGE Genie: a suite with panoramic view of gene expression, Proc. Natl.
Acad. Sci. U. S. A, 99, 11547, 2002
141. Shyamsundar, R.et. al, A DNA microarray survey of gene expression in normal
human tissues, Genome Biol., 6, R22, 2005
Page 1 of 28
MASPECTRAS: a platform for management and analysis of
proteomics LC-MS/MS data
Jürgen Hartler*§, Gerhard G. Thallinger*, Gernot Stocker*, Alexander Sturn*, Thomas R. Burkard*,
Erik Körner†, Robert Rader*, Andreas Schmidt#, Karl Mechtler‡, and Zlatko Trajanoski*
*Institute for Genomics and Bioinformatics and Christian-Doppler Laboratory for Genomics and
Bioinformatics, Graz University of Technology, Petersgasse 14, 8010 Graz, Austria.
§Austrian Research Centers Gmbh –ARC, eHealth Systems, Reininghausstrasse 13/1, 8020 Graz,
Austria
†FH Joanneum, Kapfenberg, Werk-VI-Sraße 46, 8605 Kapfenberg, Austria.
‡Research Institute for Molecular Pathology, Dr. Bohr-Gasse 7, 1030 Vienna, Austria.
# Christian Doppler Laboratory for Proteome Analysis, Dr. Bohr-Gasse 3, 1030 Vienna, Austria
Correspondence: Zlatko Trajanoski
Institute for Genomics and Bioinformatics
Graz University of Technology
Phone: +43 316 873 5332
Fax: +43 316 873 5340
E-mail: [email protected]

Page 2 of 28
Abstract
We have developed MAss SPECTRometry Analysis System (MASPECTRAS), a platform for
management and analysis of proteomics LC-MS/MS data. MASPECTRAS is based on the Proteome
Experimental Data Repository (PEDRo) relational database scheme and follows the guidelines of the
Proteomics Standards Initiative (PSI). Analysis modules include: 1) import and parsing of the results
form the search engines SEQUEST, Mascot, Spectrum Mill, X! Tandem, and OMSSA; 2) peptide
validation, 3) clustering of proteins based on Markov Clustering and multiple alignments; and 4)
quantification using the Automated Statistical Analysis of Protein Abundance Ratios algorithm
(ASAPRatio). The system provides customizable data retrieval and visualization tools, as well as
export to PRoteomics IDEntifications public repository (PRIDE). MASPECTRAS is freely available
at http://genome.tugraz.at/MASPECTRAS.
Page 3 of 28
BACKGROUND
The advancement of genomic technologies – including microarray, proteomic and metabolic
approaches – have led to a rapid increase in the number, size and rate at which genomic datasets are
generated. Managing and extracting valuable information from such datasets requires the use of data
management platforms and computational approaches. In contrast to genome sequencing projects,
there is a need to store much more complex ancillary data than would be necessary for genome
sequences. Particularly the need to clearly describe an experiment and report the variables necessary
for data analysis became a new challenge for the laboratories. Furthermore, the vast quantity of data
associated with a single experiment can become problematic at the point of publishing and
disseminating results. Fortunately, the communities have recognized and tackled the problem through
the development of standards for the capturing and sharing of experimental data. The microarray
community arranged to define the critical information necessary to effectively analyze a microarray
experiment and developed the Minimal Information About a Microarray Experiment (MIAME)[1] .
Subsequently, MIAME was adopted by scientific journals as a prerequisite for publications and
several software platforms supporting MIAME were developed [2,3] .
The principles underlying MIAME have reasoned beyond the microarray community. The Proteomics
Standard Initiative (PSI) [4] aims to define standards for data representation in proteomics analogues
to that of MIAME and developed Minimum Information About a Proteomics Experiment
(MIAPE) [5]. An implementation independent approach for defining the data structure of a Proteomics
Experiment Data repository (PEDRo) [6] was developed using unified modeling language (UML) and
a PSI compliant public repository was set up [7]. Hence, given the defined standards and available
public repositories proteomics laboratories computational systems can now be developed to support
proteomics laboratories and enhance data dissemination.
To meet the needs for high-throughput MS laboratories several tools and platforms covering various
parts of the analytical pipeline were recently developed including the Trans Proteomics Pipeline [8],

Page 4 of 28
The Global Proteome Machine [9], VEMS [10,11], CPAS [12], CHOMPER [13], ProDB [14],
PROTEIOS [15], GAPP [16], PeptideAtlas [17], EPIR [18], STEM [19], and TOPP [20] (see table 1
for a comparison of the features). However, to the best of our knowledge there is currently no
academic or commercial data management platform supporting MIAPE and enabling PRoteomics
IDEntifications database (PRIDE) export. Moreover, it became evident that several search engines
should be used to validate proteomics results [21]. Hence, a system enabling comparison of the results
generated by the different search engines would be of great benefit. Additionally, integration of
algorithms for peptide validation, protein clustering and protein quantification into a single analytical
pipeline would considerably facilitate analyses of the experimental data.
We have therefore developed the MAss SPECTRometry Analysis System (MASPECTRAS), a
web-based platform for management and analysis of proteomics liquid chromatography tandem mass
spectrometry (LC-MS/MS) data supporting MIAPE. MASPECTRAS was developed using state-of-
the-art software technology and enables data import from five common search engines. Analytical
modules are provided along with visualization tools and PRIDE export as well as a module for
distributing intensive calculations to a computing cluster.
Page 5 of 28
ANALYSIS PIPELINE
MASPECTRAS extends the PEDRo relational database scheme and follows the guidelines of the PSI.
It accepts the native file formats from SEQUEST [22], Mascot [23], Spectrum Mill [24], X! Tandem
[25], and OMSSA [26]. The core of MASPECTRAS is formed by the MASPECTRAS analysis
platform (Figure 1). The platform encompasses modules for the import and parsing data generated by
the above mentioned search engines, peptide validation, protein clustering, protein quantification, and
a set of visualization tools for post-processing and verification of the data, as well as PRIDE export.
Import and Parsing Data from Search Engines
There are several commercial and academic search engines for proteomics data. Based on known
protein sequences stored in a database, these search engines perform in silico protein digestion to
calculate theoretical spectra for the resulting peptides and compare them to the obtained ones. Based
on the similarity of the two spectra, a probability score is assigned. The results (score, peptide
sequence, etc.) are stored in a single or in multiple files, and often only an identification string for the
protein is stored whereas the original sequence is discarded. However, the search engines are storing
different identification strings for the proteins (e.g. X! Tandem: gi|231300|pdb|8GPB|; Spectrum Mill:
231300). Moreover, several databases are not using common identifiers (eg. National Center for
Biotechnology Information non redundant (NCBI nr): gi|6323680; Mass Spectrometry protein
sequence DataBase (MSDB) [27]: S39004). In order to compare the search results from different
search engines additional information from the corresponding sequence databases is needed. The
format of the accession string has to be known to retrieve the protein sequence and additional required
information from the sequence database, like protein description, or the organism the protein belongs
to. The only common basis within the different databases used by the search algorithms is the
sequence information. In order to make results of different algorithms comparable and to find the
corresponding proteins in the different result files the sequence information is taken as unique
identification criteria.
Page 6 of 28
We have developed parsers for the widely used search engines SEQUEST, Mascot, Spectrum Mill,
X! Tandem, and OMSSA. MASPECTRAS manages the sequence databases used while searching with
different modules internally. Any database available in FASTA format [28] can be uploaded to
MASPECTRAS. Parsing rules are user definable and therefore easily adaptable to different types of
sequence databases. When results of a search engine are imported into MASPECTRAS, the system
first tries to determine whether the same accession string for the same database version exists. If that is
not the case, the original sequence information is retrieved from the corresponding sequence database.
Subsequently the system tries to match the sequence against the sequences already stored in the
database. If an entry with the same sequence information but a different accession string is found, the
new accession string is associated with the unique identifier of the already stored sequence. Otherwise
a new unique identifier is created and the sequence is stored with the appropriate accession strings.
Peptide Validation
SEQUEST and Mascot provide custom probability scores. MASPECTRAS provides a probability
score on its own for SEQUEST and Mascot which is based on the algorithm of PeptideProphet [22].
Data re-scoring adds a further layer, which improves the specificity of the highly sensitive SEQUEST
and Mascot database searches. This procedure could be applied to other database search algorithms as
well and can additionally offer a remap of the results from different database search algorithms onto
one single probability scale [21]. The statistical model incorporates a linear discriminant score based
on the database search scores (for SEQUEST: XCorr, dCn, Sp rank, and mass difference) as well as
the tryptic termini and missed cleavages [22]. After scoring the data has to pass a user definable filter,
which depends on the search programs specific score to discard the most unlikely data.
Protein Clustering
In peptide fragmentation fingerprinting (PFF) peptides are identified by search engines, which have to
be mapped to proteins. A single peptide often corresponds to a group of proteins. Therefore, PFF
identifies protein groups, each protein owning similar peptides. A grouped protein view represents the
result more concisely and proteins with a small number of identified peptides can be recognized easier
Page 7 of 28
in complex samples. The protein grouping implemented in MASPECTRAS is based on Markov
clustering [29] using Basic Local Alignment Search Tool (BLAST) [30] and multiple alignments. A
file in FASTA format is assembled containing all sequences to be clustered. Each sequence is then
compared against each other. The all-against-all sequence similarities generated by this analysis are
parsed and stored in an upper triangular matrix. This matrix represents sequence similarities as a
connection graph. Nodes of the graph represent proteins, and edges represent sequence similarity that
connects such proteins. A weight is assigned to each edge by taking the average pair wise –log10 of the
BLAST E-value. These weights are transformed into probabilities associated with a transition from
one protein to another within this graph. This matrix is parsed through iterative round of matrix
multiplication and inflation until there is little or no net change in the matrix. The final matrix is then
interpreted as the protein clustering and the number of the corresponding cluster is stored for every
protein hit. The visualization of the protein grouping of a single search is performed by the integrated
Jalview Alignment Editor [31]. If proteins from different searches are the same the two corresponding
protein groups are combined into one protein group at the time the searches are compared.
Protein Quantification
For quantification of peptides the ASAPRatio algorithm described in [32] has been integrated and
applied: To determine a peak area a single ion chromatogram is reconstructed for a given m/z range by
summation of ion intensities. This chromatogram is then smoothed tenfold by repeated application of
the Savitzky - Golay smooth filtering method [33]. For each isotopic peak center and width are
determined. The peak width is primarily calculated by using the standard ASAPRatio algorithm and
for further peak evaluation a new algorithm for recognizing peaks with saddle-points has been
implemented. With this algorithm a valley (a local minimum of the smoothed signal) is recognized to
be part of the peak and added to the area. The calculated peak area is determined as the average of the
smoothed and the unsmoothed peak. From this value background noise is subtracted, which is
estimated from the average signal amplitude of the peak's neighborhood (50 chromatogram value pairs
above and below the respective peak's borders). The peak error is estimated as the difference of the
smoothed and the unsmoothed peak. A calculated peak area is accepted in case the calculated peak
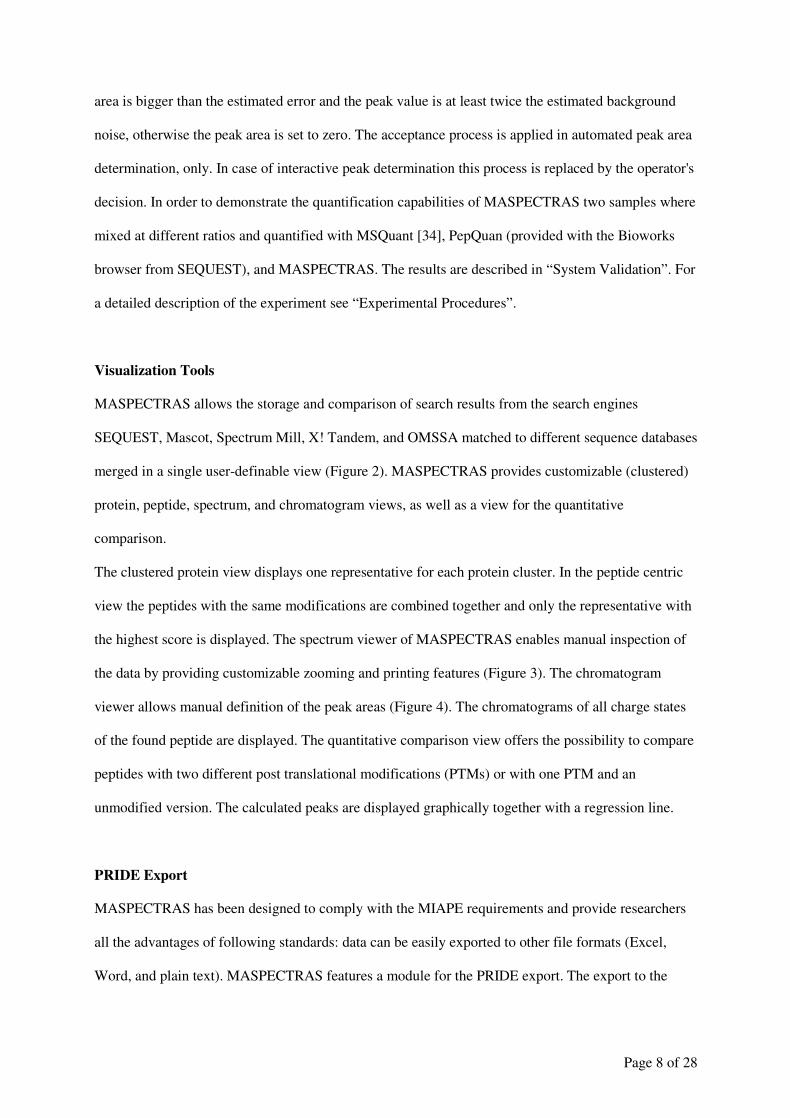
Page 8 of 28
area is bigger than the estimated error and the peak value is at least twice the estimated background
noise, otherwise the peak area is set to zero. The acceptance process is applied in automated peak area
determination, only. In case of interactive peak determination this process is replaced by the operator's
decision. In order to demonstrate the quantification capabilities of MASPECTRAS two samples where
mixed at different ratios and quantified with MSQuant [34], PepQuan (provided with the Bioworks
browser from SEQUEST), and MASPECTRAS. The results are described in “System Validation”. For
a detailed description of the experiment see “Experimental Procedures”.
Visualization Tools
MASPECTRAS allows the storage and comparison of search results from the search engines
SEQUEST, Mascot, Spectrum Mill, X! Tandem, and OMSSA matched to different sequence databases
merged in a single user-definable view (Figure 2). MASPECTRAS provides customizable (clustered)
protein, peptide, spectrum, and chromatogram views, as well as a view for the quantitative
comparison.
The clustered protein view displays one representative for each protein cluster. In the peptide centric
view the peptides with the same modifications are combined together and only the representative with
the highest score is displayed. The spectrum viewer of MASPECTRAS enables manual inspection of
the data by providing customizable zooming and printing features (Figure 3). The chromatogram
viewer allows manual definition of the peak areas (Figure 4). The chromatograms of all charge states
of the found peptide are displayed. The quantitative comparison view offers the possibility to compare
peptides with two different post translational modifications (PTMs) or with one PTM and an
unmodified version. The calculated peaks are displayed graphically together with a regression line.
PRIDE Export
MASPECTRAS has been designed to comply with the MIAPE requirements and provide researchers
all the advantages of following standards: data can be easily exported to other file formats (Excel,
Word, and plain text). MASPECTRAS features a module for the PRIDE export. The export to the

Page 9 of 28
PRIDE XML format is possible directly from the protein and peptide views and the resulting file can
be submitted to PRIDE.
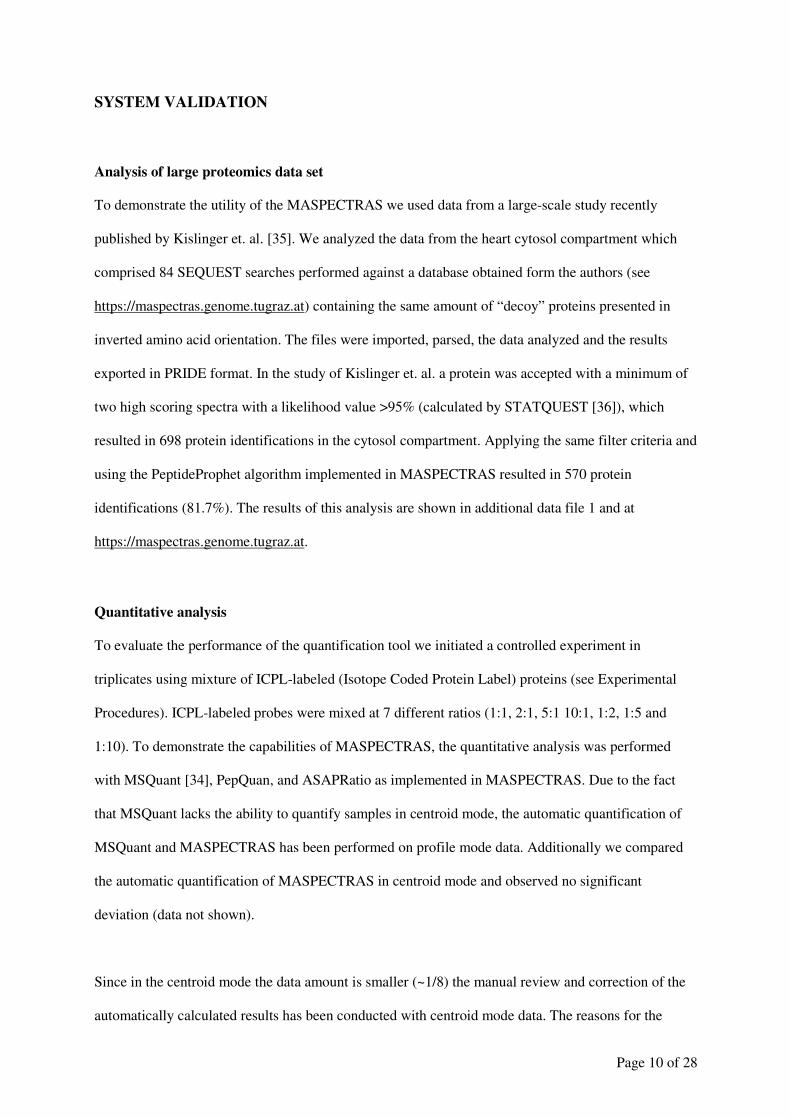
Page 10 of 28
SYSTEM VALIDATION
Analysis of large proteomics data set
To demonstrate the utility of the MASPECTRAS we used data from a large-scale study recently
published by Kislinger et. al. [35]. We analyzed the data from the heart cytosol compartment which
comprised 84 SEQUEST searches performed against a database obtained form the authors (see
https://maspectras.genome.tugraz.at) containing the same amount of “decoy” proteins presented in
inverted amino acid orientation. The files were imported, parsed, the data analyzed and the results
exported in PRIDE format. In the study of Kislinger et. al. a protein was accepted with a minimum of
two high scoring spectra with a likelihood value >95% (calculated by STATQUEST [36]), which
resulted in 698 protein identifications in the cytosol compartment. Applying the same filter criteria and
using the PeptideProphet algorithm implemented in MASPECTRAS resulted in 570 protein
identifications (81.7%). The results of this analysis are shown in additional data file 1 and at
https://maspectras.genome.tugraz.at.
Quantitative analysis
To evaluate the performance of the quantification tool we initiated a controlled experiment in
triplicates using mixture of ICPL-labeled (Isotope Coded Protein Label) proteins (see Experimental
Procedures). ICPL-labeled probes were mixed at 7 different ratios (1:1, 2:1, 5:1 10:1, 1:2, 1:5 and
1:10). To demonstrate the capabilities of MASPECTRAS, the quantitative analysis was performed
with MSQuant [34], PepQuan, and ASAPRatio as implemented in MASPECTRAS. Due to the fact
that MSQuant lacks the ability to quantify samples in centroid mode, the automatic quantification of
MSQuant and MASPECTRAS has been performed on profile mode data. Additionally we compared
the automatic quantification of MASPECTRAS in centroid mode and observed no significant
deviation (data not shown).
Since in the centroid mode the data amount is smaller (~1/8) the manual review and correction of the
automatically calculated results has been conducted with centroid mode data. The reasons for the

Page 11 of 28
manual correction are: (i) there are additional peaks in a chromatogram in the m/z neighborhood; (ii)
the found peptides are not in the main peak but in neighboring smaller peak. A ratio between each
found light and heavily labeled peptide has been calculated, and from those ratios the mean value, the
standard deviation, the relative error, and a regression line has been calculated as well (with the
integrated PTM quantitative comparison tool described in the “Visualization tools” section). A filter
for outlier removal has been applied to the automatically calculated ratios. For the manual evaluation,
these automatically removed peptides were checked manually and the misquantification due to the
above mentioned reasons could be corrected. Therefore the number of manually accepted peptides
could be higher than the automatically accepted ones. The performance of the quantification with
ASAPRatio integrated in MASPECTRAS was superior compared to both, MSQuant and PepQuan.
Furthermore, for all ratios the relative error calculated was considerably lower than the relative error
obtained with MSQuant and PepQuan (see table 2 and for more detailed information additional data
file 2 for a direct comparison between MSQuant, PepQuan, and MASPECTRAS).
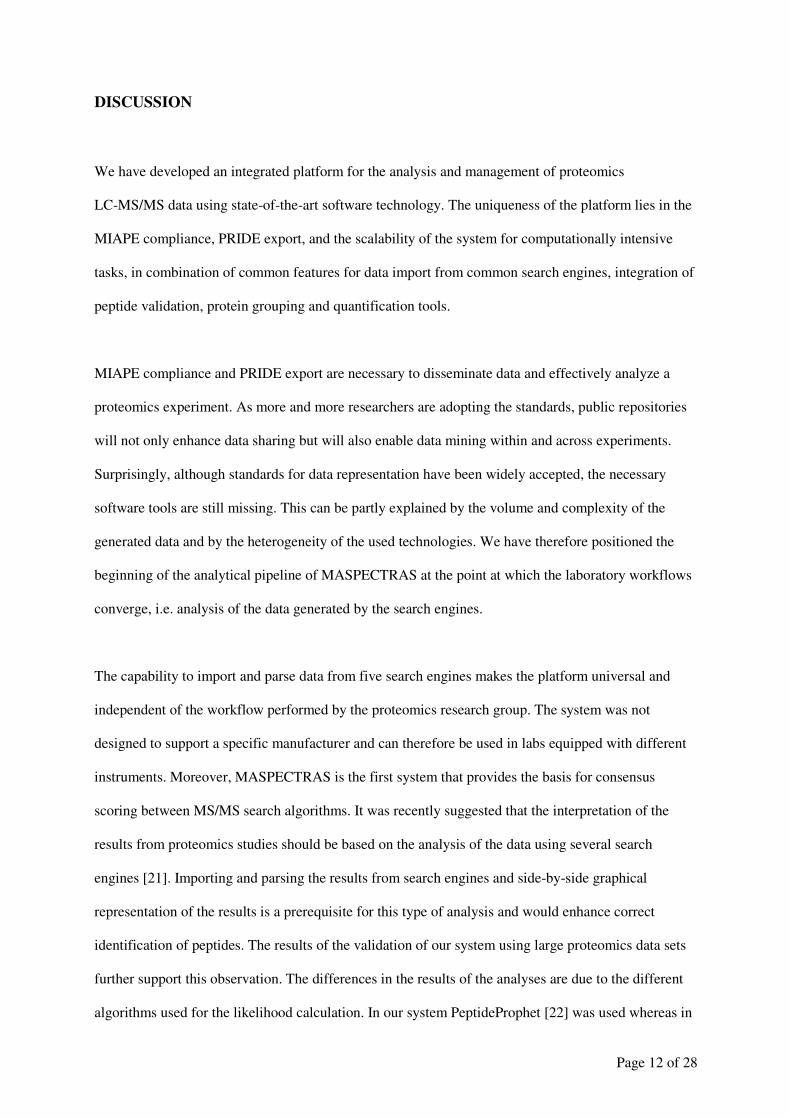
Page 12 of 28
DISCUSSION
We have developed an integrated platform for the analysis and management of proteomics
LC-MS/MS data using state-of-the-art software technology. The uniqueness of the platform lies in the
MIAPE compliance, PRIDE export, and the scalability of the system for computationally intensive
tasks, in combination of common features for data import from common search engines, integration of
peptide validation, protein grouping and quantification tools.
MIAPE compliance and PRIDE export are necessary to disseminate data and effectively analyze a
proteomics experiment. As more and more researchers are adopting the standards, public repositories
will not only enhance data sharing but will also enable data mining within and across experiments.
Surprisingly, although standards for data representation have been widely accepted, the necessary
software tools are still missing. This can be partly explained by the volume and complexity of the
generated data and by the heterogeneity of the used technologies. We have therefore positioned the
beginning of the analytical pipeline of MASPECTRAS at the point at which the laboratory workflows
converge, i.e. analysis of the data generated by the search engines.
The capability to import and parse data from five search engines makes the platform universal and
independent of the workflow performed by the proteomics research group. The system was not
designed to support a specific manufacturer and can therefore be used in labs equipped with different
instruments. Moreover, MASPECTRAS is the first system that provides the basis for consensus
scoring between MS/MS search algorithms. It was recently suggested that the interpretation of the
results from proteomics studies should be based on the analysis of the data using several search
engines [21]. Importing and parsing the results from search engines and side-by-side graphical
representation of the results is a prerequisite for this type of analysis and would enhance correct
identification of peptides. The results of the validation of our system using large proteomics data sets
further support this observation. The differences in the results of the analyses are due to the different
algorithms used for the likelihood calculation. In our system PeptideProphet [22] was used whereas in
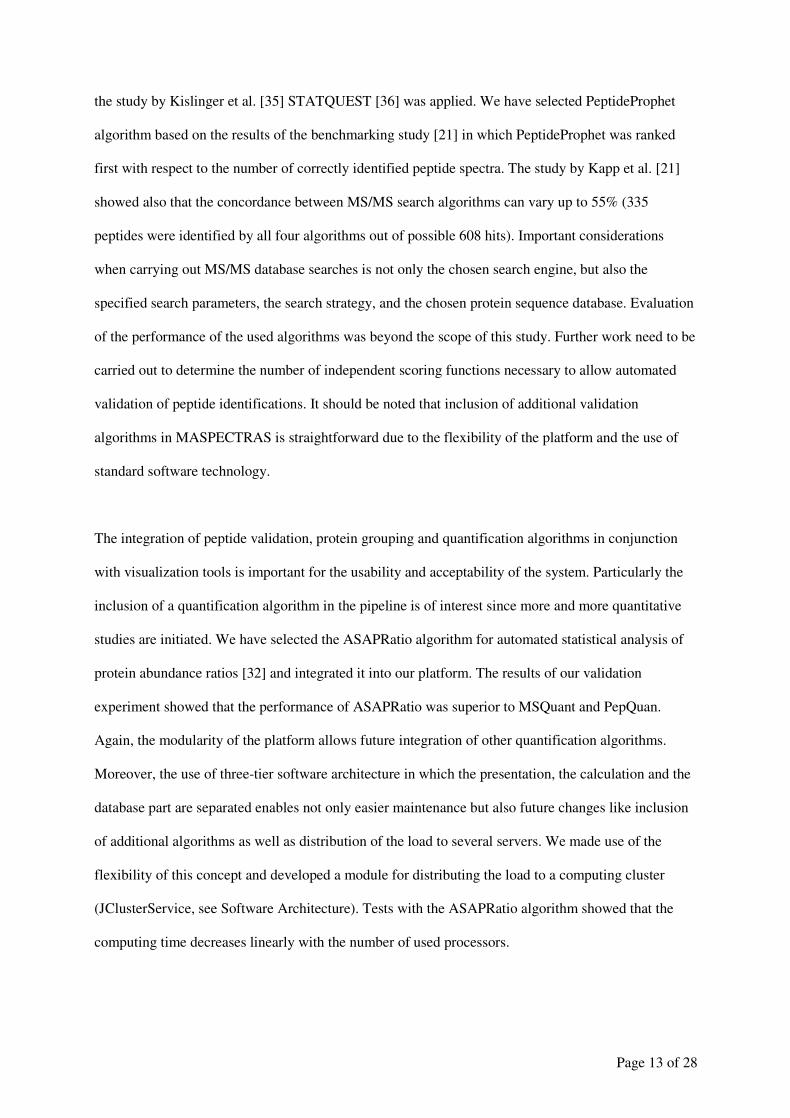
Page 13 of 28
the study by Kislinger et al. [35] STATQUEST [36] was applied. We have selected PeptideProphet
algorithm based on the results of the benchmarking study [21] in which PeptideProphet was ranked
first with respect to the number of correctly identified peptide spectra. The study by Kapp et al. [21]
showed also that the concordance between MS/MS search algorithms can vary up to 55% (335
peptides were identified by all four algorithms out of possible 608 hits). Important considerations
when carrying out MS/MS database searches is not only the chosen search engine, but also the
specified search parameters, the search strategy, and the chosen protein sequence database. Evaluation
of the performance of the used algorithms was beyond the scope of this study. Further work need to be
carried out to determine the number of independent scoring functions necessary to allow automated
validation of peptide identifications. It should be noted that inclusion of additional validation
algorithms in MASPECTRAS is straightforward due to the flexibility of the platform and the use of
standard software technology.
The integration of peptide validation, protein grouping and quantification algorithms in conjunction
with visualization tools is important for the usability and acceptability of the system. Particularly the
inclusion of a quantification algorithm in the pipeline is of interest since more and more quantitative
studies are initiated. We have selected the ASAPRatio algorithm for automated statistical analysis of
protein abundance ratios [32] and integrated it into our platform. The results of our validation
experiment showed that the performance of ASAPRatio was superior to MSQuant and PepQuan.
Again, the modularity of the platform allows future integration of other quantification algorithms.
Moreover, the use of three-tier software architecture in which the presentation, the calculation and the
database part are separated enables not only easier maintenance but also future changes like inclusion
of additional algorithms as well as distribution of the load to several servers. We made use of the
flexibility of this concept and developed a module for distributing the load to a computing cluster
(JClusterService, see Software Architecture). Tests with the ASAPRatio algorithm showed that the
computing time decreases linearly with the number of used processors.

Page 14 of 28
In summary, given the unique features and the flexibility due to the use of standard software
technology, our platform represents significant advance and could be of great interest to the
proteomics community.

Page 15 of 28
SOFTWARE ARCHITECTURE
The application is based on a three-tier architecture, which is separated into presentation-, middle-,
and database layer. Each tier can run on an individual machine without affecting the other tiers. This
makes every component easily exchangeable. A relational database (MySQL, PostgreSQL or Oracle)
forms the database layer. MASPECTRAS follows and extends the PEDRo database scheme [6]
(additional data file 3) to suit the guidelines of PSI [4]. The business layer consists of a Java 2
Enterprise Edition (J2EE) compliant application which is deployed to the open source application
server JBoss [37]. Access to the data is provided by a user-friendly web-interface using Java Servlets
and Java Server Pages [38] via the Struts framework [39]. Computational or disk space intensive tasks
can be distributed to a separate server or to a computing cluster by using the in-house developed
JClusterService interface. This web service based programming interface uses the Simple Object
Access Protocol (SOAP) [40] to transfer data for the task execution between calculation server and
MASPECTRAS server. The tasks can be executed on dedicated computation nodes and therefore do
not slow down the MASPECTRAS web interface. This remote process execution system is used as a
backend for the protein grouping analysis, for the mass quantification and for the management of the
sequence databases and their sequence retrieval during import.
The current implementation of MASPECTRAS allows the comparison of search results from
SEQUEST, Mascot, Spectrum Mill, X! Tandem [25], and OMSSA [26]. The following file formats
are supported: SEQUEST: ZIP-compressed file of the *.dta, *.out and SEQUEST.params files;
Mascot: *.dat; Spectrum Mill: ZIP-compressed file of the results folder including all subfolders; X!
Tandem: the generated *.xml; OMSSA: the generated *.xml with included spectra and search params;
Raw data: XCalibur raw format (*.raw) version 1.3, mzXML [41] and mzData [42] format. The data
can be imported into MASPECTRAS database asynchronously in batch mode, without interfering
with the analysis of already uploaded data. The spectrum viewer applet and the diagrams are
implemented with the aid of JFreeChart [43] and Cewolf [44] graphics programming frameworks. The
whole system is secured by a user management system which has the ability to manage the access
rights for projects and offers data sharing and multiple user access roles in a multi-user environment.

Page 16 of 28
EXPERIMENTAL PROCEDURES
In order to demonstrate the capabilities of MASPECTRAS the following experiments were performed.
Materials
Proteins were purchased from Sigma as lyophyllized, dry powder. Solvents (HPLC grade) and
chemicals (highest available grade) were purchased from Sigma, TFA (trifluoroacetic acid) was from
Pierce. The ICPL (isotope coded protein label) chemicals kit was from Serva Electrophoresis this kit
contained reduction solution with TCEP (Tris (2-carboxy-ethyl) phosphine hydrochloride), cysteine
blocking solution with IAA (Iodoacetamide), stop solutions I and II and the labeling reagent nicotinic
acid N-hydroxysuccinimide ester as light (6 12C in the nicotinic acid) and heavy (6x 13 C) form as
solutions. Trypsin was purchased from Sigma at proteomics grade.
ICPL labeling of proteins
Proteins bovine serum albumin [GenBank:AAA51411.1], human apotransferrin [ref:NP_001054.1]
and rabbit phosphorylase b [PDB:8GPB] were dissolved with TEAB (Tetraammoniumbicarbonate)
buffer (125 mM, pH 7.8) in three vials to a final concentration of 5 mg/ml each. A 40 µl aliquot was
used for reduction of disulfide bonds between cysteine sidechains and blocking of free cysteines. For
reduction of disulfide bonds 4 µl of reduction solution were added to the aliquot and the reaction was
carried out for 35 min at 60 °C. After cooling samples to room temperature, 4 µl of cysteine blocking
solution were added and the samples were sat in a dark cupboard for 35 min. To remove excess of
blocking reagent 4 µl of stop solution I were added and samples were put on a shaker for 20 minutes.
Protein aliquots were split to two samples which contained 20 µl each. First row of samples was
labeled with the 12C isotope by adding 3 µl of the nicotinic acid solution which contained the light
reagent. Second row was labeled with the heavy reagent and labeling reaction was carried out for 2 h
and 30 min while shaking at room temperature.
Page 17 of 28
Proteolytic digest of Proteins
Protein solutions were diluted using 50 mM NH4HCO3 solution to a final volume of 90 µl. 10 µl of a
fresh prepared trypsin solution (2.5 µg/µl) were added and the proteolysis was carried out at 37 °C
over night in an incubator. The reaction was stopped by adding 10 µl of 10% TFA. The peptide
solutions were diluted with 0.1 % TFA to give 1 nM final concentration. From these stock solutions
samples for MS/MS analysis which contained defined ratios of heavy and light were made up by
mixing the solutions of light and heavy labeled peptides.
HPLC and mass spectrometry
To separate peptide mixtures prior to MS analysis, nanoRP-HPLC was applied on the Ultimate 2 Dual
Gradient HPLC system (Dionex, buffer A: 5% ACN, 0.1% TFA, buffer B: 80% ACN, 0.1% TFA) on
a PepMap separation column (Dionex, C18, 150 mm x 75 µm x 3 µm, 300 A). 500 fMol of each
mixture was separated three times using the same trapping and separation column to reduce the
quantification error which comes from HPLC and mass spectrometry. A gradient from 0% B to 50% B
in 48 min was applied for the separation; peptides were detected at 214 and 280 nm in the UV
detector. The exit of the HPLC was online coupled to the electrospray source of the LTQ mass
spectrometer (Thermo Electron). Samples were analyzed in centroid mode first to test digest and
labeling quality. For the quantitative analysis the LTQ was operated in enhanced profile mode for
survey scans to gain higher mass accuracy. Samples were mass spectrometrically analyzed using a top
one method, in which the most abundant signal of the MS survey scan was fragmented in the
subsequent MS/MS event in the ion trap. Although with this method a lower number of MS/MS
spectra were acquired, the increased number of MS scans leads to a better determination of the eluting
peaks and therefore provides improved quantification of peptides.
Data analysis was done with the Mascot Daemon [23] (Matrix Science), BioWorks 3.2 [22] (Thermo
Electron) software packages using an in house database. To demonstrate the merging of results from
all of the mentioned search engines the ICPL labeled probes at an ratio of 1:1 were searched with
Spectrum Mill A.03.02 (Agilent Technologies) [24], X! Tandem [25] (The Global Proteome Machine

Page 18 of 28
Organization) version 2006.04.01, and OMSSA 1.1.0 [26] (NCBI) The results were uploaded to
MASPECTRAS and quantified automatically.
Page 19 of 28
AUTHORS’ CONTRIBUTIONS
JH designed the current version of MASPECTRAS. He was responsible for the implementation of the
database, the development the presentation and many parts of the business logic. GS, AS1, TRB and
EK implemented most of the parts of the analysis pipeline. GS developed the JClusterService and the
services provided for MASPECTRAS. TRB integrated the PeptideProphet, AS1 the protein clustering
pipeline, and EK the peptide quantification and the chromatogram viewer. RR implemented the
PRIDE data export. AS2 and KM conducted the proteomics experiments. JH and AS2 analyzed the
biological data. KM and GGT contributed to conception and design. ZT was responsible for the
overall conception and project coordination. All authors gave final approval of the version to be
published.
ACKNOWLEDGEMENTS
The authors thank the staff of the protein chemistriy facility at the Research Institute of Molecular
Pathology Vienna, Sandra Morandell and Stefan Ascher, Biocenter Medical University Innsbruck,
Manfred Kollroser, Institute of Forensic Medicine, Medical University of Graz, Gerald
Rechberger, Institute of Molecular Biosciences, University of Graz, Andreas Scheucher, and Thomas
Fuchs for valuable comments and contributions. We want to thank Andrew Emili and Vincent Fong
from the Donnelly Centre for Cellular and Biomolecular Research (CCBR), University of Toronto for
providing the data for our study. This work is supported by the Austrian Federal Ministry of
Education, Science and Culture GEN-AU projects “Bioinformatics Integration Network II” (BIN) and
“Austrian Proteomics Platform II” (APP). Jürgen Hartler was supported by a grant of the Austrian
Academy of Sciences (OEAW).
Page 20 of 28
REFERENCES
Reference List
1. Brazma A, Hingamp P, Quackenbush J, Sherlock G, Spellman P, Stoeckert C, Aach J, Ansorge W, Ball CA, Causton HC et al.: Minimum information about a microarray experiment
(MIAME)-toward standards for microarray data. Nat Genet 2001, 29:365-371.
2. Maurer M, Molidor R, Sturn A, Hartler J, Hackl H, Stocker G, Prokesch A, Scheideler M, Trajanoski Z: MARS: microarray analysis, retrieval, and storage system. BMC
Bioinformatics 2005, 6:101.
3. Saal LH, Troein C, Vallon-Christersson J, Gruvberger S, Borg A, Peterson C: BioArray
Software Environment (BASE): a platform for comprehensive management and analysis
of microarray data. Genome Biol 2002, 3:SOFTWARE0003.
4. Orchard S, Hermjakob H, Apweiler R: The proteomics standards initiative. Proteomics 2003, 3:1374-1376.
5. Orchard S, Hermjakob H, Julian RKJ, Runte K, Sherman D, Wojcik J, Zhu W, Apweiler R: Common interchange standards for proteomics data: Public availability of tools and schema. Proteomics 2004, 4:490-491.
6. Taylor CF, Paton NW, Garwood KL, Kirby PD, Stead DA, Yin Z, Deutsch EW, Selway L, Walker J, Riba-Garcia I et al.: A systematic approach to modeling, capturing, and
disseminating proteomics experimental data. Nat Biotechnol 2003, 21:247-254.
7. Martens L, Hermjakob H, Jones P, Adamski M, Taylor C, States D, Gevaert K, Vandekerckhove J, Apweiler R: PRIDE: The proteomics identifications database (vol. 5, Issue 13, pp. 3537-
3545). Proteomics 2005, 5:4046.
8. Keller A, Eng J, Zhang N, Li XJ, Aebersold R: A uniform proteomics MS/MS analysis
platform utilizing open XML file formats. Mol Sys Biology 2005, 4100024:E1-E8.
9. Craig R, Cortens JP, Beavis RC: Open source system for analyzing, validating, and storing
protein identification data. J Proteome Res 2004, 3:1234-1242.
10. Matthiesen R, Trelle MB, Hojrup P, Bunkenborg J, Jensen ON: VEMS 3.0: algorithms and
computational tools for tandem mass spectrometry based identification of post-translational modifications in proteins. J Proteome Res 2005, 4:2338-2347.
11. Matthiesen R, Bunkenborg J, Stensballe A, Jensen ON, Welinder KG, Bauw G: Database-
independent, database-dependent, and extended interpretation of peptide mass spectra in VEMS V20. Proteomics 2004, 4:2583-2593.
12. Rauch A, Bellew M, Eng J, Fitzgibbon M, Holzman T, Hussey P, Igra M, Maclean B, Lin CW, Detter A et al.: Computational Proteomics Analysis System (CPAS): an extensible, open-
source analytic system for evaluating and publishing proteomic data and high throughput biological experiments. J Proteome Res 2006, 5:112-121.
13. Eddes JS, Kapp EA, Frecklington DF, Connolly LM, Layton MJ, Moritz RL, Simpson RJ: CHOMPER: a bioinformatic tool for rapid validation of tandem mass spectrometry search results associated with high-throughput proteomic strategies. Proteomics 2002, 2:1097-1103.
Page 21 of 28
14. Wilke A, Ruckert C, Bartels D, Dondrup M, Goesmann A, Huser AT, Kespohl S, Linke B, Mahne M, McHardy A et al.: Bioinformatics support for high-throughput proteomics. J
Biotechnol 2003, 106:147-156.
15. Garden P, Alm R, Hakkinen J: PROTEIOS: an open source proteomics initiative. Bioinformatics 2005, 21:2085-2087.
16. Shadforth I, Xu W, Crowther D, Bessant C: GAPP: a fully automated software for the
confident identification of human peptides from tandem mass spectra. J Proteome Res 2006, 5:2849-2852.
17. Desiere F, Deutsch EW, King NL, Nesvizhskii AI, Mallick P, Eng J, Chen S, Eddes J, Loevenich SN, Aebersold R: The PeptideAtlas project. Nucleic Acids Res 2006, 34:D655-D658.
18. Kristensen DB, Brond JC, Nielsen PA, Andersen JR, Sorensen OT, Jorgensen V, Budin K, Matthiesen J, Veno P, Jespersen HM et al.: Experimental Peptide Identification Repository
(EPIR): an integrated peptide-centric platform for validation and mining of tandem mass
spectrometry data. Mol Cell Proteomics 2004, 3:1023-1038.
19. Shinkawa T, Taoka M, Yamauchi Y, Ichimura T, Kaji H, Takahashi N, Isobe T: STEM: a
software tool for large-scale proteomic data analyses. J Proteome Res 2005, 4:1826-1831.
20. Kohlbacher O, Reinert K, Gropl C, Lange E, Pfeifer N, Schulz-Trieglaff O, Sturm M: TOPP--
the OpenMS proteomics pipeline. Bioinformatics 2007, 23:e191-e197.
21. Kapp EA, Schutz F, Connolly LM, Chakel JA, Meza JE, Miller CA, Fenyo D, Eng JK, Adkins JN, Omenn GS et al.: An evaluation, comparison, and accurate benchmarking of several
publicly available MS/MS search algorithms: sensitivity and specificity analysis. Proteomics 2005, 5:3475-3490.
22. Keller A, Nesvizhskii AI, Kolker E, Aebersold R: Empirical statistical model to estimate the
accuracy of peptide identifications made by MS/MS and database search. Anal Chem 2002, 74:5383-5392.
23. Perkins DN, Pappin DJ, Creasy DM, Cottrell JS: Probability-based protein identification by
searching sequence databases using mass spectrometry data. Electrophoresis 1999, 20:3551-3567.
24. Agilent Technologies [http://cagchem.cos.agilent.com]
25. Craig R, Beavis RC: TANDEM: matching proteins with tandem mass spectra. Bioinformatics 2004, 20:1466-1467.
26. Geer LY, Markey SP, Kowalak JA, Wagner L, Xu M, Maynard DM, Yang X, Shi W, Bryant SH: Open mass spectrometry search algorithm. J Proteome Res 2004, 3:958-964.
27. MSDB [http://csc-fserve.hh.med.ic.ac.uk/msdb.html]
28. Pearson WR, Lipman DJ: Improved tools for biological sequence comparison. Proc Natl
Acad Sci U S A 1988, 85:2444-2448.
29. Enright AJ, Van Dongen S, Ouzounis CA: An efficient algorithm for large-scale detection of
protein families. Nucleic Acids Res 2002, 30:1575-1584.
Page 22 of 28
30. Thompson JD, Higgins DG, Gibson TJ: CLUSTAL W: improving the sensitivity of
progressive multiple sequence alignment through sequence weighting, position-specific gap
penalties and weight matrix choice. Nucleic Acids Res 1994, 22:4673-4680.
31. Clamp M, Cuff J, Searle SM, Barton GJ: The Jalview Java alignment editor. Bioinformatics 2004, 20:426-427.
32. Li XJ, Zhang H, Ranish JA, Aebersold R: Automated statistical analysis of protein
abundance ratios from data generated by stable-isotope dilution and tandem mass
spectrometry. Anal Chem 2003, 75:6648-6657.
33. Press WH, Teukolsky SA, Vetterling WT, Flannery BP: Numerical recipes in C: the art of
scientific computing. Cambridge Press: New York; 1997.
34. MSQuant [http://msquant.sourceforge.net/]
35. Kislinger T, Cox B, Kannan A, Chung C, Hu P, Ignatchenko A, Scott MS, Gramolini AO, Morris Q, Hallett MT et al.: Global survey of organ and organelle protein expression in
mouse: combined proteomic and transcriptomic profiling. Cell 2006, 125:173-186.
36. Kislinger T, Rahman K, Radulovic D, Cox B, Rossant J, Emili A: PRISM, a generic large
scale proteomic investigation strategy for mammals. Mol Cell Proteomics 2003, 2:96-106.
37. JBoss.com: The Professional Open Source Company [http://www.jboss.org]
38. Hall M., Brown L.: Core Servlets and Java Server Pages: Core Technologies. A Sun Microsystems Press/Prentice Hall PTR Book; 2003.
39. Struts [http://struts.apache.org/]
40. SOAP [http://www.w3.org/TR/soap/]
41. Pedrioli PG, Eng JK, Hubley R, Vogelzang M, Deutsch EW, Raught B, Pratt B, Nilsson E, Angeletti RH, Apweiler R et al.: A common open representation of mass spectrometry data
and its application to proteomics research. Nat Biotechnol 2004, 22:1459-1466.
42. Orchard S, Hermjakob H, Taylor CF, Potthast F, Jones P, Zhu W, Julian RK, Jr., Apweiler R: Further steps in standardisation. Report of the second annual Proteomics Standards Initiative Spring Workshop (Siena, Italy 17-20th April 2005). Proteomics 2005, 5:3552-3555.
43. JFreeChart [http://www.jfree.org/jfreechart/]
44. Cewolf [http://cewolf.sourceforge.net]
Page 23 of 28
FIGURE LEGENDS
Figure 1
Schematic overview of the analysis pipeline of MASPECTRAS. Search results from SEQUEST,
Mascot, Spectrum Mill, X! Tandem, and OMSSA are imported and parsed. In the next steps peptides
are validated using PeptideProphet [22] and the corresponding proteins clustered using ClustalW [30].
Then the peptides are quantified using the ASAPRatio algorithm [32], the results stored in the
database and exported to the public repository PRIDE [7].
Figure 2
Combined view of the results from the search engines. The combined result view shows the
comparison from 5 different search engines (SEQUEST, Mascot, Spectrum Mill, X! Tandem, and
OMSSA) for bovine serum albumin (see experimental procedures for details). The line on the top lists
the search results displayed in color. Sequence segments found only in one of the searches have the
corresponding color whereas sequence segments found in multiple searches are colored red. The
possible peptide modifications are shown under the protein sequence box. Three types of peptide
modifications were defined: ICPL-light (K%), ICPL-heavy (K*), and oxidized methionine (MX$). X!
Tandem generates additional modifications at the N-terminus (N-term@, N-term&, and N-term”). X!
Tandem does not provide the possibility to search variable modification states on one amino acid.
Therefore, for the X! Tandem search a fixed modification at K(+105.02) and a variable modification
(K§+6.02) has been applied. In the last table the peptides are listed and only one representative for the
peptide at this modification state is shown.
Figure 3
Spectrum viewer of MASPECTRAS. The spectrum viewer offers the selection of different ion
series, the change to other peptide hits, zooming- and printing possibilities.

Page 24 of 28
Figure 4
Chromatogram viewer for the quantification. The raw data is filtered with the m/z of the peptide
found. The calculated chromatogram and the chromatograms of the neighborhood are displayed in the
first view. The second view shows the selected chromatogram (the yellow colored one in the first
view). Additional peaks can be added and stored peaks (colored red) can be removed. The manually
selected peaks are displayed in green. The chromatogram viewer allows changing the m/z step-size,
the number of displayed neighborhood chromatograms, and the charge state.
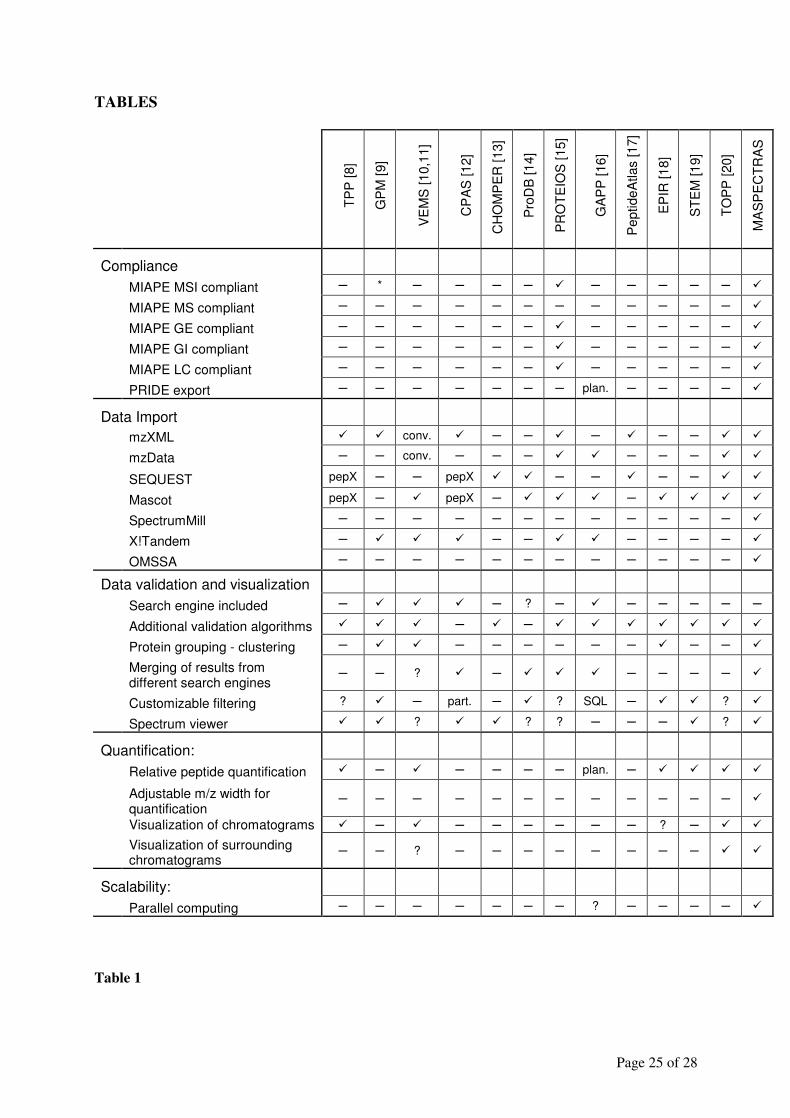
Page 25 of 28
TABLES
T
PP
[8]
G
PM
[9]
V
EM
S [1
0,1
1]
C
PA
S [
12]
CH
OM
PE
R [
13]
P
roD
B [1
4]
P
RO
TE
IOS
[15]
G
AP
P [
16]
P
eptide
Atlas [17]
E
PIR
[1
8]
S
TE
M [1
9]
T
OP
P [
20]
M
AS
PE
CT
RA
S
Compliance
MIAPE MSI compliant ─ * ─ ─ ─ ─ � ─ ─ ─ ─ ─ �
MIAPE MS compliant ─ ─ ─ ─ ─ ─ ─ ─ ─ ─ ─ ─ �
MIAPE GE compliant ─ ─ ─ ─ ─ ─ � ─ ─ ─ ─ ─ �
MIAPE GI compliant ─ ─ ─ ─ ─ ─ � ─ ─ ─ ─ ─ �
MIAPE LC compliant ─ ─ ─ ─ ─ ─ � ─ ─ ─ ─ ─ �
PRIDE export ─ ─ ─ ─ ─ ─ ─ plan. ─ ─ ─ ─ �
Data Import
mzXML � � conv. � ─ ─ � ─ � ─ ─ � �
mzData ─ ─ conv. ─ ─ ─ � � ─ ─ ─ � �
SEQUEST pepX ─ ─ pepX � � ─ ─ � ─ ─ � �
Mascot pepX ─ � pepX ─ � � � ─ � � � �
SpectrumMill ─ ─ ─ ─ ─ ─ ─ ─ ─ ─ ─ ─ �
X!Tandem ─ � � � ─ ─ � � ─ ─ ─ ─ �
OMSSA ─ ─ ─ ─ ─ ─ ─ ─ ─ ─ ─ ─ �
Data validation and visualization
Search engine included ─ � � � ─ ? ─ � ─ ─ ─ ─ ─
Additional validation algorithms � � � ─ � ─ � � � � � � �
Protein grouping - clustering ─ � � ─ ─ ─ ─ ─ ─ � ─ ─ �
Merging of results from different search engines
─ ─ ? � ─ � � � ─ ─ ─ ─ �
Customizable filtering ? � ─ part. ─ � ? SQL ─ � � ? �
Spectrum viewer � � ? � � ? ? ─ ─ ─ � ? �
Quantification:
Relative peptide quantification � ─ � ─ ─ ─ ─ plan. ─ � � � �
Adjustable m/z width for quantification
─ ─ ─ ─ ─ ─ ─ ─ ─ ─ ─ ─ �
Visualization of chromatograms � ─ � ─ ─ ─ ─ ─ ─ ? ─ � �
Visualization of surrounding chromatograms
─ ─ ? ─ ─ ─ ─ ─ ─ ─ ─ � �
Scalability:
Parallel computing ─ ─ ─ ─ ─ ─ ─ ? ─ ─ ─ ─ �
Table 1
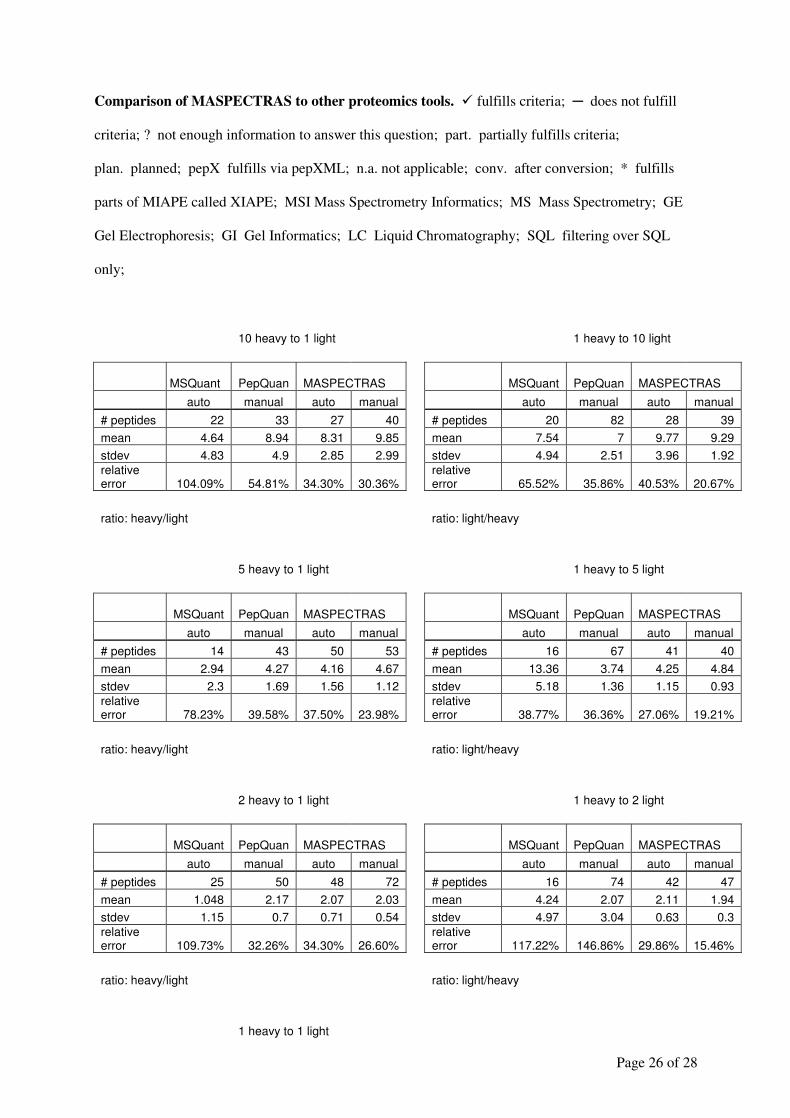
Page 26 of 28
Comparison of MASPECTRAS to other proteomics tools. � fulfills criteria; ─ does not fulfill
criteria; ? not enough information to answer this question; part. partially fulfills criteria;
plan. planned; pepX fulfills via pepXML; n.a. not applicable; conv. after conversion; * fulfills
parts of MIAPE called XIAPE; MSI Mass Spectrometry Informatics; MS Mass Spectrometry; GE
Gel Electrophoresis; GI Gel Informatics; LC Liquid Chromatography; SQL filtering over SQL
only;
10 heavy to 1 light 1 heavy to 10 light
MSQuant PepQuan MASPECTRAS MSQuant PepQuan
MASPECTRAS
auto manual auto manual auto manual auto manual
# peptides 22 33 27 40 # peptides 20 82 28 39
mean 4.64 8.94 8.31 9.85 mean 7.54 7 9.77 9.29
stdev 4.83 4.9 2.85 2.99 stdev 4.94 2.51 3.96 1.92
relative error 104.09% 54.81% 34.30% 30.36%
relative error 65.52% 35.86% 40.53% 20.67%
ratio: heavy/light ratio: light/heavy
5 heavy to 1 light 1 heavy to 5 light
MSQuant PepQuan MASPECTRAS MSQuant PepQuan
MASPECTRAS
auto manual auto manual auto manual auto manual
# peptides 14 43 50 53 # peptides 16 67 41 40
mean 2.94 4.27 4.16 4.67 mean 13.36 3.74 4.25 4.84
stdev 2.3 1.69 1.56 1.12 stdev 5.18 1.36 1.15 0.93
relative error 78.23% 39.58% 37.50% 23.98%
relative error 38.77% 36.36% 27.06% 19.21%
ratio: heavy/light ratio: light/heavy
2 heavy to 1 light 1 heavy to 2 light
MSQuant PepQuan MASPECTRAS MSQuant PepQuan
MASPECTRAS
auto manual auto manual auto manual auto manual
# peptides 25 50 48 72 # peptides 16 74 42 47
mean 1.048 2.17 2.07 2.03 mean 4.24 2.07 2.11 1.94
stdev 1.15 0.7 0.71 0.54 stdev 4.97 3.04 0.63 0.3
relative error 109.73% 32.26% 34.30% 26.60%
relative error 117.22% 146.86% 29.86% 15.46%
ratio: heavy/light ratio: light/heavy
1 heavy to 1 light
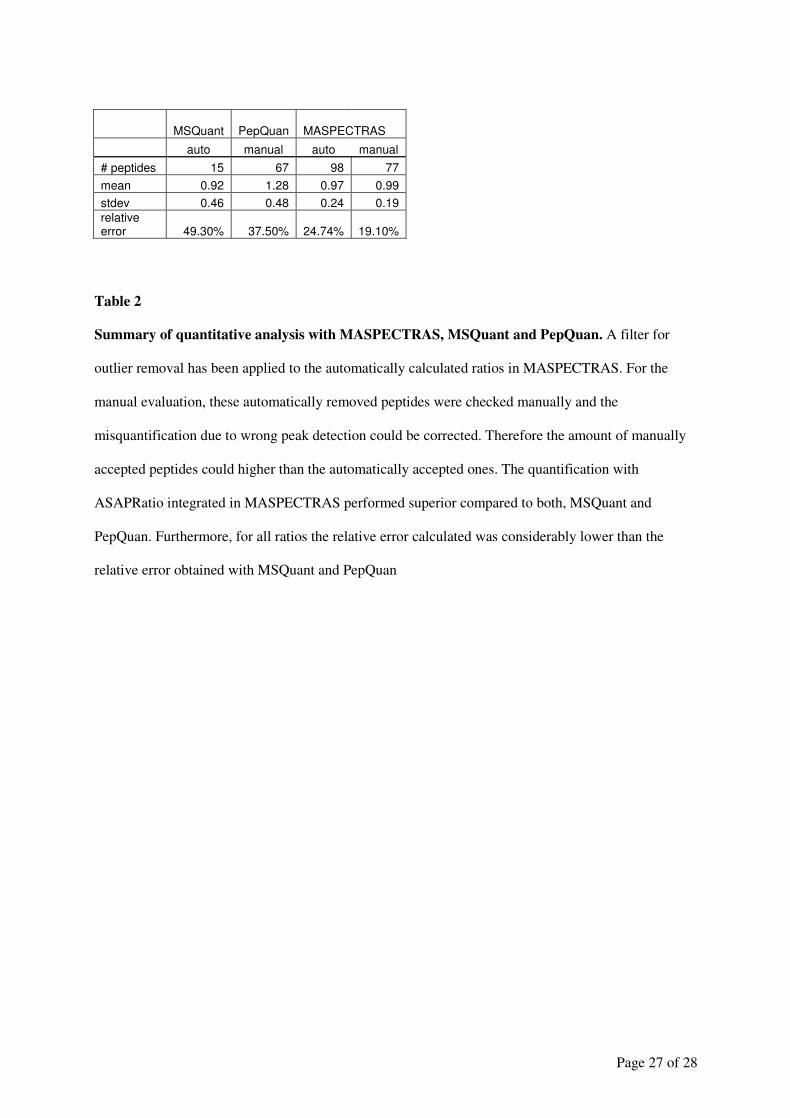
Page 27 of 28
MSQuant PepQuan MASPECTRAS
auto manual auto manual
# peptides 15 67 98 77
mean 0.92 1.28 0.97 0.99
stdev 0.46 0.48 0.24 0.19
relative error 49.30% 37.50% 24.74% 19.10%
Table 2
Summary of quantitative analysis with MASPECTRAS, MSQuant and PepQuan. A filter for
outlier removal has been applied to the automatically calculated ratios in MASPECTRAS. For the
manual evaluation, these automatically removed peptides were checked manually and the
misquantification due to wrong peak detection could be corrected. Therefore the amount of manually
accepted peptides could higher than the automatically accepted ones. The quantification with
ASAPRatio integrated in MASPECTRAS performed superior compared to both, MSQuant and
PepQuan. Furthermore, for all ratios the relative error calculated was considerably lower than the
relative error obtained with MSQuant and PepQuan

Page 28 of 28
ADDITIONAL DATA FILES
The following additional data files are included with the online version of this article: the evaluation of
the heart cytosol data for the study by Kislinger et al. (additional data file 1); quantification results and
comparision with MSquant and PepQuan (additional data file 2); and a tiff image of the database
scheme of MASPECTRAS (additional data file 3). The original data files are downloadable directly at
the MASPECTRAS application at https://maspectras.genome.tugraz.at.
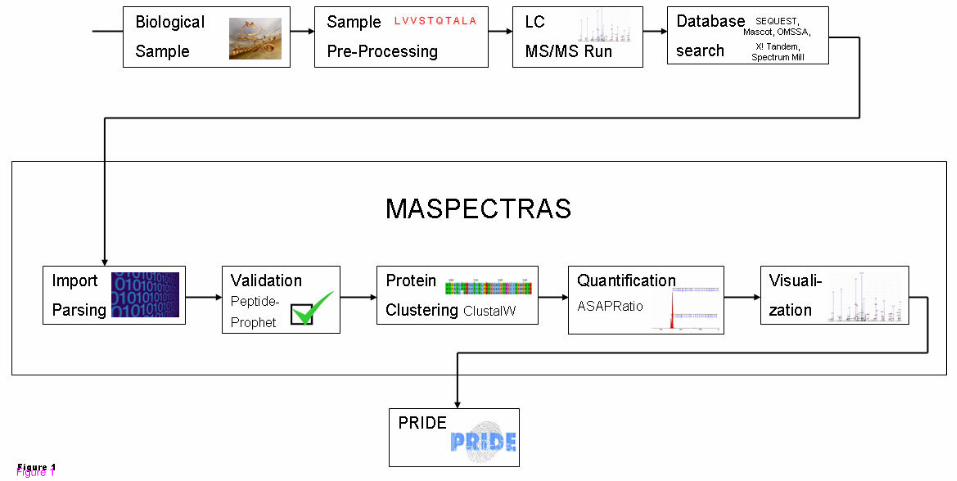
Figure 1
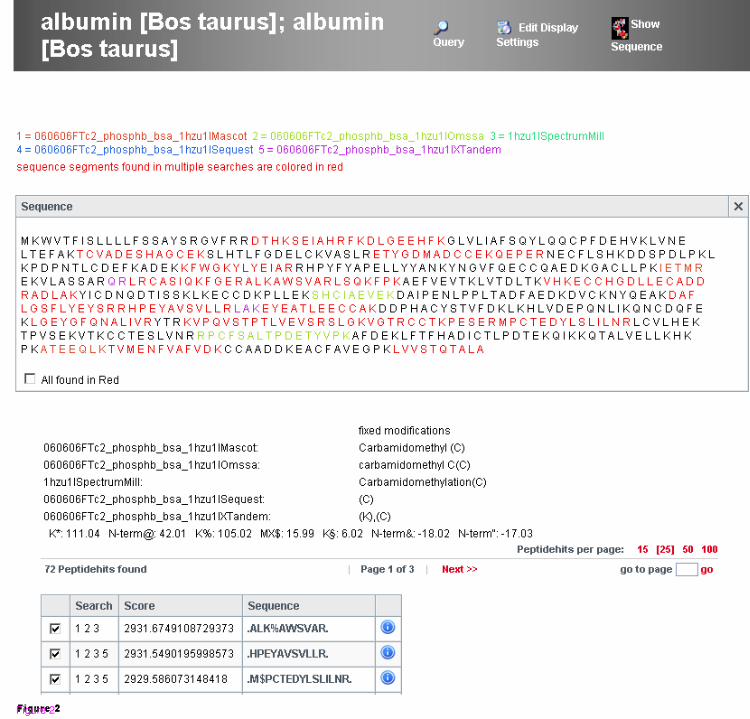
Figure 2
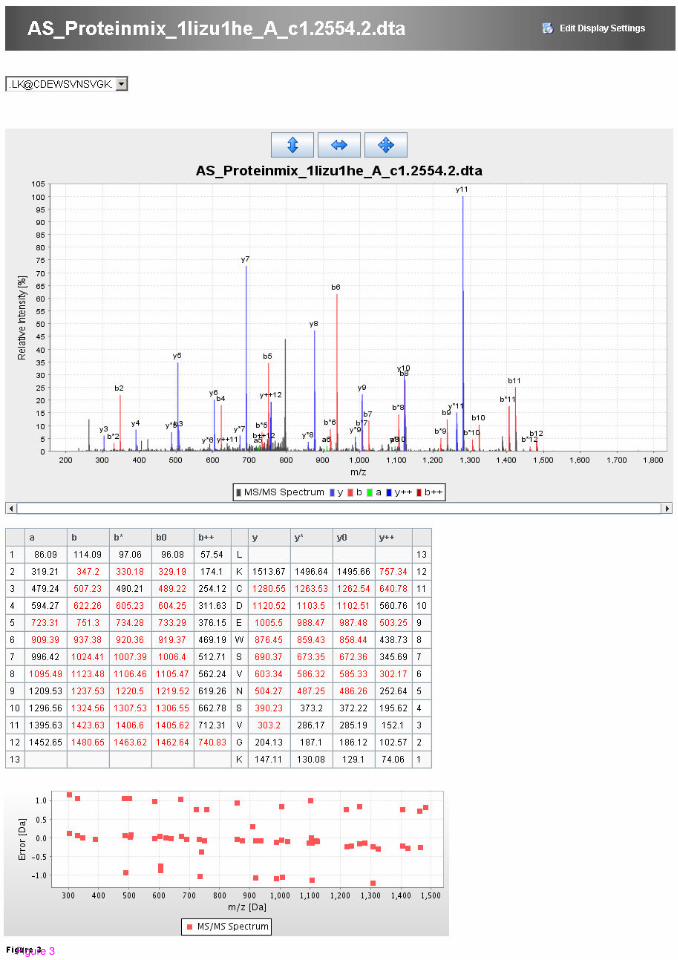
Figure 3

Figure 4

Additional files provided with this submission:
Additional file 1: adddata1.txt, 27Khttp://www.biomedcentral.com/imedia/9498783881405709/supp1.txtAdditional file 2: adddata2.zip, 357Khttp://www.biomedcentral.com/imedia/7722822914057092/supp2.zipAdditional file 3: adddata3.tif, 1010Khttp://www.biomedcentral.com/imedia/1479938682140570/supp3.tiff