Embed Size (px)
Citation preview
Transfer and Debt Burden Transfer and Debt Burden as a measure of as a measure of
vulnerabilityvulnerability
How bad is the situationHow bad is the situation
Kevin JacobyKevin Jacoby
14 June 201314 June 2013
Overview Overview
Excess burden of cost recovery? ExplainedExcess burden of cost recovery? Explained Non-revenue waterNon-revenue water Debt collectionDebt collection Net debt owed for water servicesNet debt owed for water services IMPORTANT NOTESIMPORTANT NOTES
Excess burden of cost Excess burden of cost recovery recovery
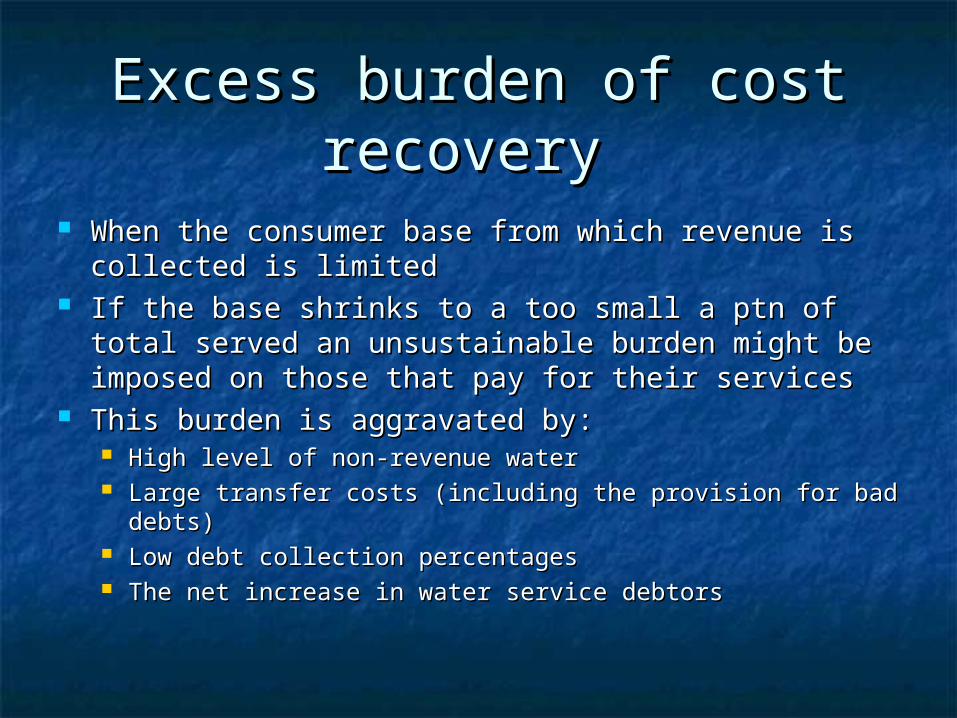
When the consumer base from which revenue is When the consumer base from which revenue is collected is limitedcollected is limited
If the base shrinks to a too small a ptn of total If the base shrinks to a too small a ptn of total served an unsustainable burden might be served an unsustainable burden might be imposed on those that pay for their servicesimposed on those that pay for their services
This burden is aggravated by:This burden is aggravated by: High level of non-revenue waterHigh level of non-revenue water Large transfer costs (including the provision for bad Large transfer costs (including the provision for bad
debts)debts) Low debt collection percentagesLow debt collection percentages The net increase in water service debtorsThe net increase in water service debtors
Non-revenue water (NRW)Non-revenue water (NRW)
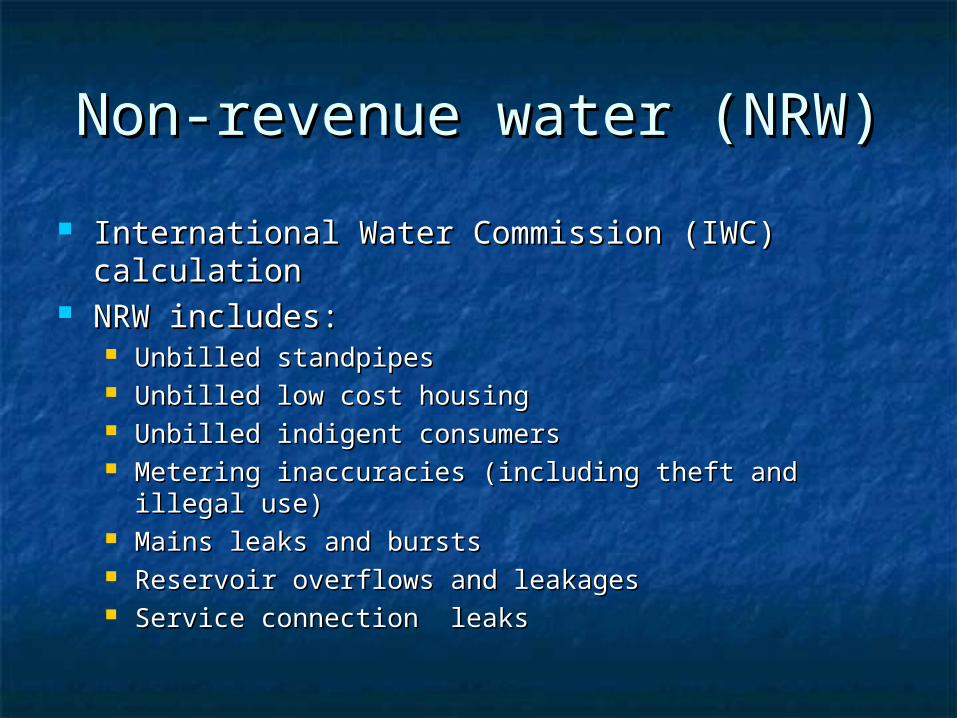
International Water Commission (IWC) calculationInternational Water Commission (IWC) calculation NRW includes:NRW includes:
Unbilled standpipesUnbilled standpipes Unbilled low cost housingUnbilled low cost housing Unbilled indigent consumersUnbilled indigent consumers Metering inaccuracies (including theft and illegal use)Metering inaccuracies (including theft and illegal use) Mains leaks and burstsMains leaks and bursts Reservoir overflows and leakagesReservoir overflows and leakages Service connection leaksService connection leaks
Free Water Free Water
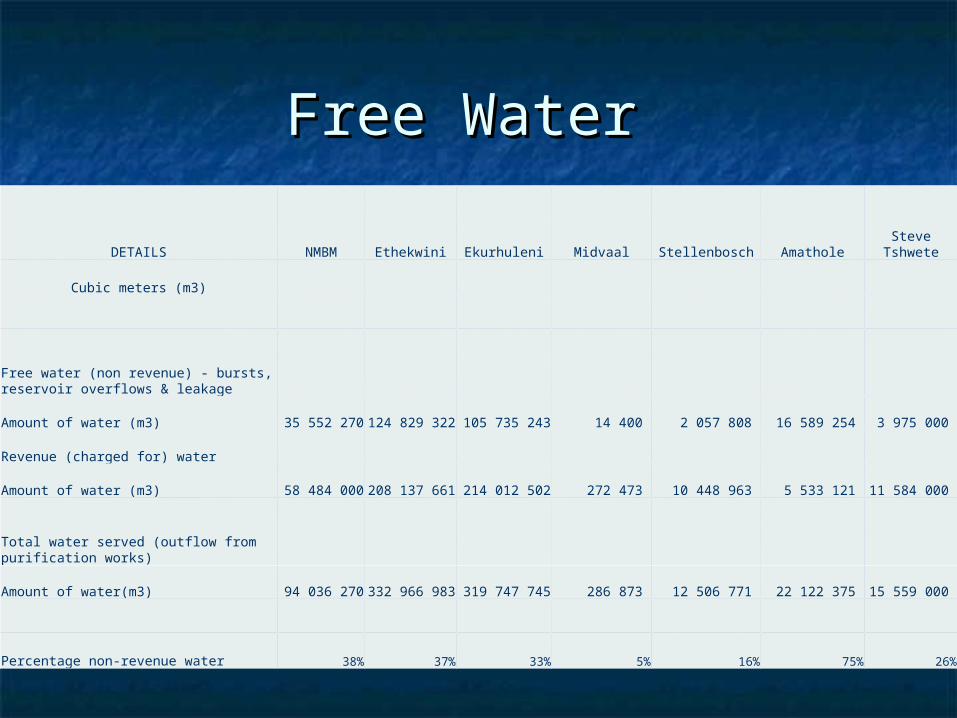
DETAILS NMBM Ethekwini Ekurhuleni Midvaal Stellenbosch AmatholeSteve
Tshwete
Cubic meters (m3)
Free water (non revenue) - bursts, reservoir overflows & leakage
Amount of water (m3) 35 552 270 124 829 322 105 735 243 14 400 2 057 808 16 589 254 3 975 000
Revenue (charged for) water
Amount of water (m3) 58 484 000 208 137 661 214 012 502 272 473 10 448 963 5 533 121 11 584 000
Total water served (outflow from purification works)
Amount of water(m3) 94 036 270 332 966 983 319 747 745 286 873 12 506 771 22 122 375 15 559 000
Percentage non-revenue water 38% 37% 33% 5% 16% 75% 26%
Free Water Free Water
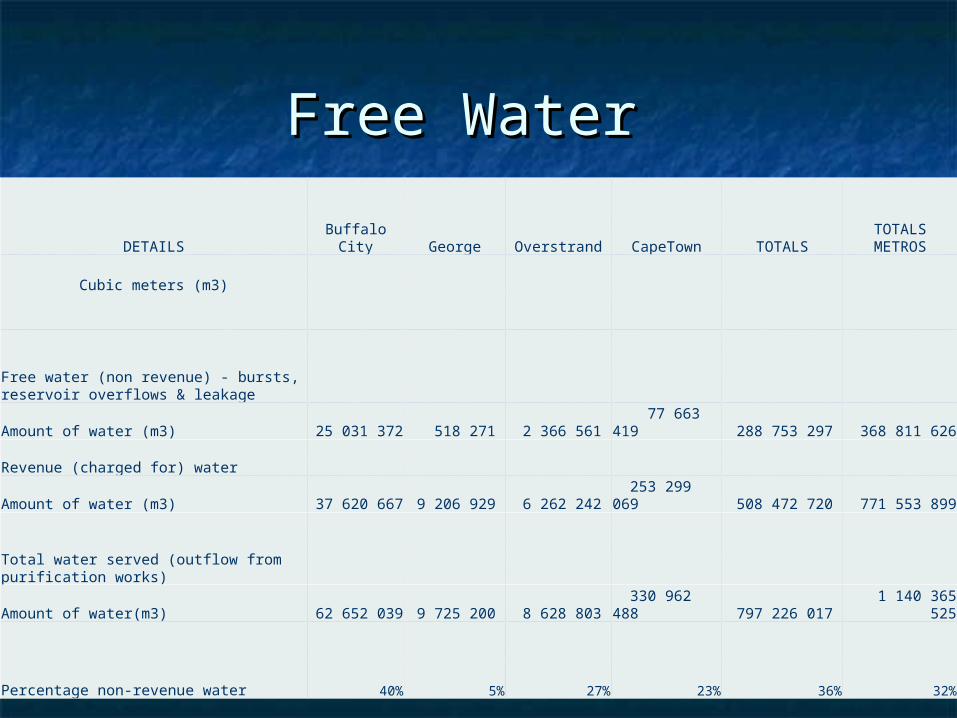
DETAILS Buffalo City George Overstrand CapeTown TOTALSTOTALS METROS
Cubic meters (m3)
Free water (non revenue) - bursts, reservoir overflows & leakage
Amount of water (m3) 25 031 372 518 271 2 366 561 77 663 419 288 753 297 368 811 626
Revenue (charged for) water
Amount of water (m3) 37 620 667 9 206 929 6 262 242 253 299 069 508 472 720 771 553 899
Total water served (outflow from purification works)
Amount of water(m3) 62 652 039 9 725 200 8 628 803 330 962 488 797 226 017 1 140 365 525
Percentage non-revenue water 40% 5% 27% 23% 36% 32%
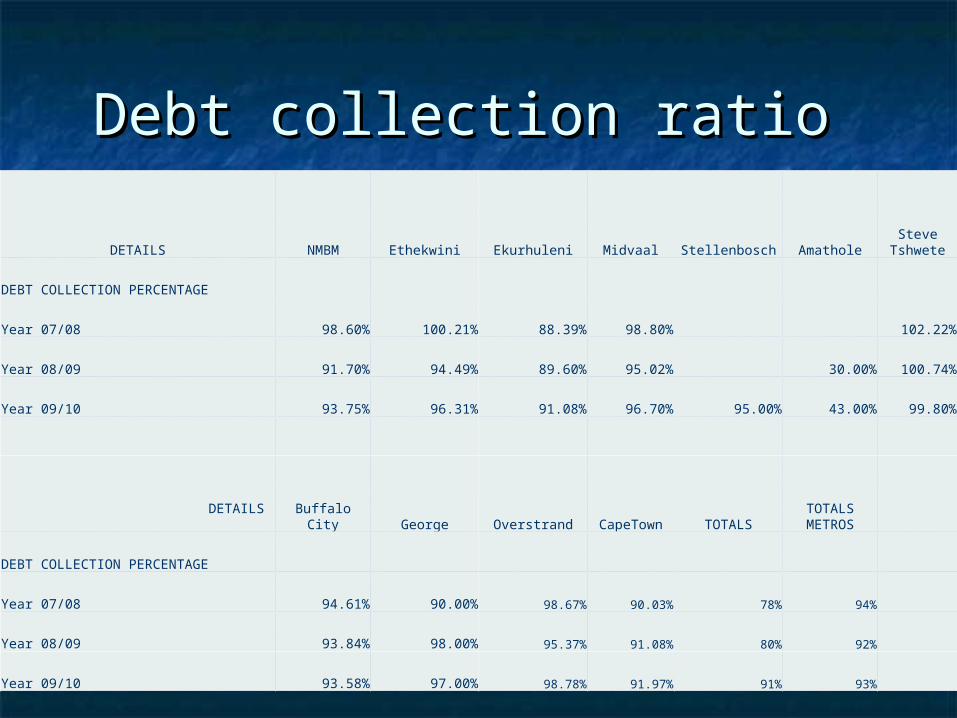
Debt collection ratio Debt collection ratio
DETAILS NMBM Ethekwini Ekurhuleni Midvaal Stellenbosch AmatholeSteve
Tshwete
DEBT COLLECTION PERCENTAGE
Year 07/08 98.60% 100.21% 88.39% 98.80% 102.22%
Year 08/09 91.70% 94.49% 89.60% 95.02% 30.00% 100.74%
Year 09/10 93.75% 96.31% 91.08% 96.70% 95.00% 43.00% 99.80%
DETAILSBuffalo City George Overstrand CapeTown TOTALS
TOTALS METROS
DEBT COLLECTION PERCENTAGE
Year 07/08 94.61% 90.00% 98.67% 90.03% 78% 94%
Year 08/09 93.84% 98.00% 95.37% 91.08% 80% 92%
Year 09/10 93.58% 97.00% 98.78% 91.97% 91% 93%
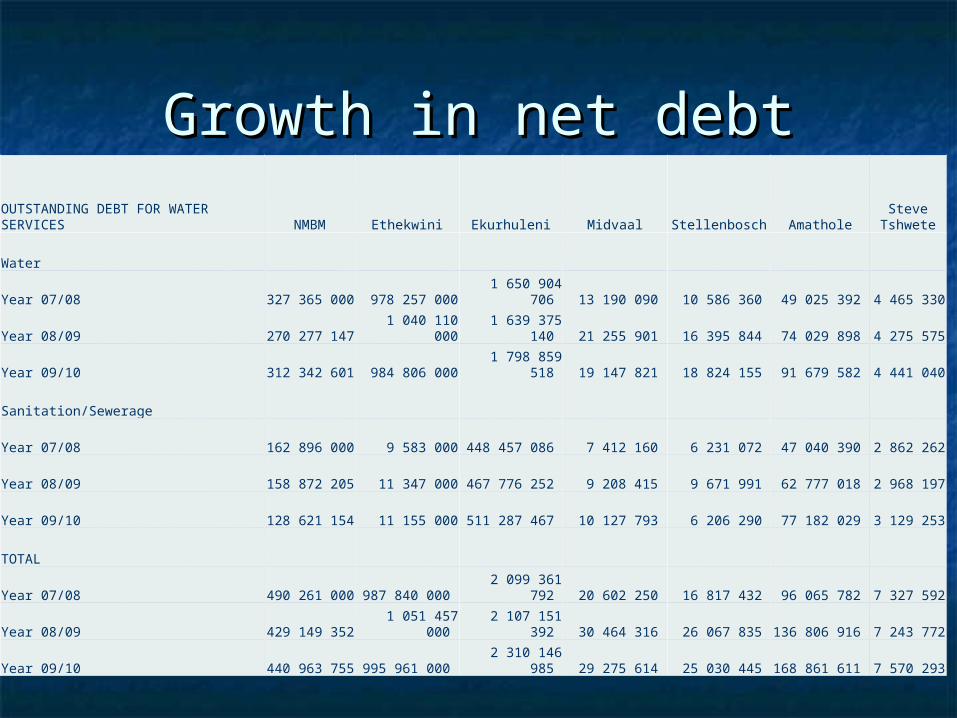
Growth in net debtGrowth in net debtOUTSTANDING DEBT FOR WATER SERVICES NMBM Ethekwini Ekurhuleni Midvaal Stellenbosch Amathole
Steve Tshwete
Water
Year 07/08 327 365 000 978 257 000 1 650 904 706 13 190 090 10 586 360 49 025 392 4 465 330
Year 08/09 270 277 147 1 040 110 000 1 639 375 140 21 255 901 16 395 844 74 029 898 4 275 575
Year 09/10 312 342 601 984 806 000 1 798 859 518 19 147 821 18 824 155 91 679 582 4 441 040
Sanitation/Sewerage
Year 07/08 162 896 000 9 583 000 448 457 086 7 412 160 6 231 072 47 040 390 2 862 262
Year 08/09 158 872 205 11 347 000 467 776 252 9 208 415 9 671 991 62 777 018 2 968 197
Year 09/10 128 621 154 11 155 000 511 287 467 10 127 793 6 206 290 77 182 029 3 129 253
TOTAL
Year 07/08 490 261 000 987 840 000 2 099 361 792 20 602 250 16 817 432 96 065 782 7 327 592
Year 08/09 429 149 352 1 051 457 000 2 107 151 392 30 464 316 26 067 835 136 806 916 7 243 772
Year 09/10 440 963 755 995 961 000 2 310 146 985 29 275 614 25 030 445 168 861 611 7 570 293
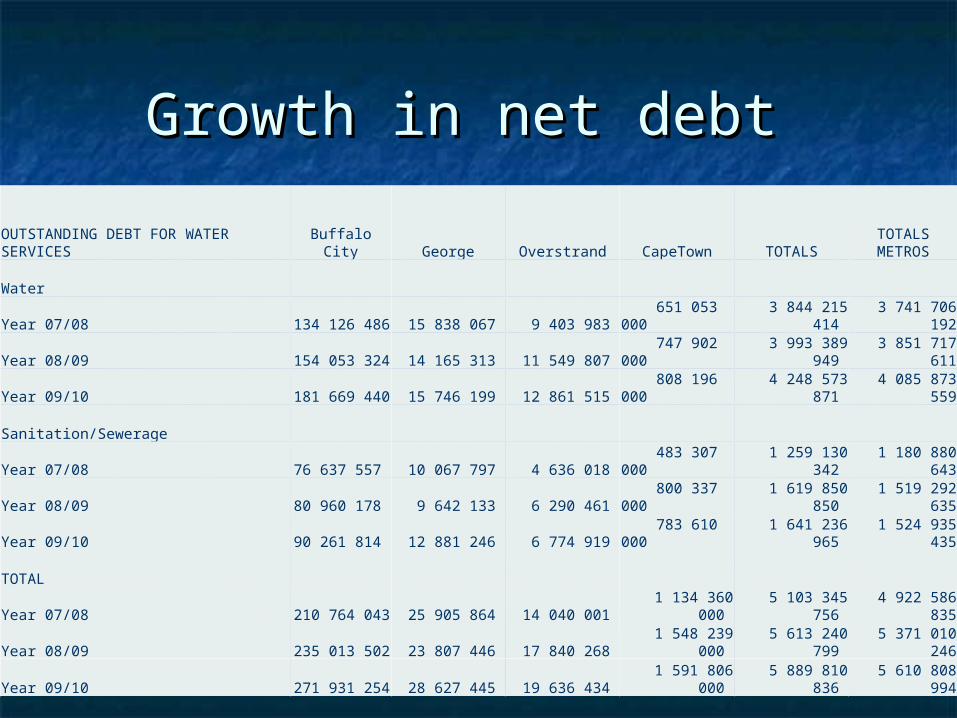
Growth in net debt Growth in net debt
OUTSTANDING DEBT FOR WATER SERVICES Buffalo City George Overstrand CapeTown TOTALS
TOTALS METROS
Water
Year 07/08 134 126 486 15 838 067 9 403 983 651 053 000 3 844 215 414
3 741 706 192
Year 08/09 154 053 324 14 165 313 11 549 807 747 902 000 3 993 389 949
3 851 717 611
Year 09/10 181 669 440 15 746 199 12 861 515 808 196 000 4 248 573 871
4 085 873 559
Sanitation/Sewerage
Year 07/08 76 637 557 10 067 797 4 636 018 483 307 000 1 259 130 342
1 180 880 643
Year 08/09 80 960 178 9 642 133 6 290 461 800 337 000 1 619 850 850
1 519 292 635
Year 09/10 90 261 814 12 881 246 6 774 919 783 610 000 1 641 236 965
1 524 935 435
TOTAL
Year 07/08 210 764 043 25 905 864 14 040 001 1 134 360 000 5 103 345 756 4 922 586
835
Year 08/09 235 013 502 23 807 446 17 840 268 1 548 239 000 5 613 240 799 5 371 010
246
Year 09/10 271 931 254 28 627 445 19 636 434 1 591 806 000 5 889 810 836 5 610 808
994
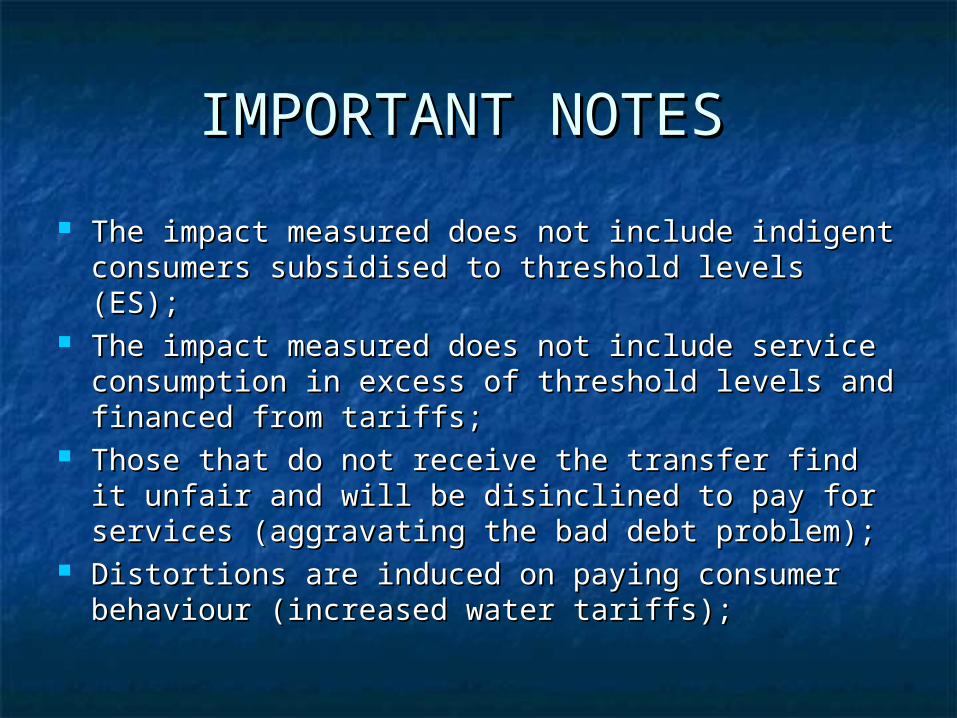
IMPORTANT NOTES IMPORTANT NOTES
The impact measured does not include indigent The impact measured does not include indigent consumers subsidised to threshold levels (ES);consumers subsidised to threshold levels (ES);
The impact measured does not include service The impact measured does not include service consumption in excess of threshold levels and consumption in excess of threshold levels and financed from tariffs;financed from tariffs;
Those that do not receive the transfer find it Those that do not receive the transfer find it unfair and will be disinclined to pay for services unfair and will be disinclined to pay for services (aggravating the bad debt problem);(aggravating the bad debt problem);
Distortions are induced on paying consumer Distortions are induced on paying consumer behaviour (increased water tariffs);behaviour (increased water tariffs);
IMPORTANT NOTESIMPORTANT NOTES
Increasing water tariffs is a feasible and Increasing water tariffs is a feasible and meritorious funding source for transfers on up to meritorious funding source for transfers on up to some limit;some limit;
Beyond this limit the water service tariff burden Beyond this limit the water service tariff burden might be excessive;might be excessive;
Distortion effects will undermine the long run Distortion effects will undermine the long run economic welfare of the whole community and economic welfare of the whole community and the tariffs are viewed as unfair/inequitable by the tariffs are viewed as unfair/inequitable by those on whom it is leviedthose on whom it is levied
The EndThe End
Thank youThank you
Comments/questions?Comments/questions?