Embed Size (px)
Citation preview

Kamakura Corporation 2800 Woodlawn Drive
Suite 138 Honolulu, Hawaii 96822 United States of America Telephone 1-808-539-3847 Facsimile 1-808-539-3748 www.kamakuraco.com
.Original version, June 1999 Current version, January 2002
TRANSFER PRICING SYSTEMS DESIGN:
BUILDING CLARITY IN THE RESPONSIBILITY FOR AND MEASUREMENT OF RISK
Donald R. van Deventer
Introduction The subject of transfer pricing represents one of the greatest differences in asset and liability management practice between large banks internationally. In the United States and Australia, the so-called "matched maturity transfer pricing system" is accepted as an absolute necessity for the successful management of a large financial institution. In Japan, by way of contrast, the first bank to use multiple rate transfer pricing adopted a very simple system more than 20 years after Bank of America initiated a much more sophisticated system in 1973. The beginning of this section presents a selective history of the transfer pricing discipline in the United States. We follow with a detailed description of the state of the art in transfer pricing, with examples of its practical use, in the remainder of the paper. Bank of America, 1973-1979 Asset and liability management has advanced in bursts of energy that usually follow a period of extremely high interest rates in the U.S. market. In the early 1970s, the entire home mortgage market in the United States was made up of fixed rate loans. The floating rate mortgage had yet to be introduced. Interest rates were beginning to be deregulated, and the first futures contracts (on U.S. Treasury bills) had not yet been launched. In this environment, a rise in market interest rates created a double crisis at banks with a large amount of retail business: consumer deposits flowed into unregulated instruments like Treasury bills or newly introduced money market funds, and the banks suffered from negative spreads on their large portfolios of fixed rate loans. A spike in interest rates beginning in 1969 triggered a serious reexamination of financial management practice at the largest bank in the United States (at the time), the Bank of America. A team of executives that included C. Baumhefner, Leland Prussia, and William "Mack" Terry recognized that changing interest rates were making it impossible for existing management
1
"accounting" systems to correct allocate profitability among the bank's business units and to set responsibility for managing interest rate risk. Until that time, the bank had been using a single internal transfer pricing rate that was applied to the difference between assets and liabilities in each business unit to allocate some form of interest expense or interest income in a way that the units' assets and liabilities were equal. The liabilities of such a system are outlined in great detail in other sections of this book. Given the sharp changes in rates that were beginning to look normal in the United States, senior management at the Bank of America came to the conclusion that the existing system at the bank was dangerous from an interest rate risk point of view and made proper strategic decision making impossible. Strategic decision making was handicapped because the single rate transfer pricing system made it impossible to know the true risk-adjusted profitability of each business unit and line of business. The numbers reported by the existing system mixed results due to business judgment ("skill") and results due to interest rate mismatches ("luck," which could be either good or bad). Although the bank had a very sizable accounting function, the responsibility for designing the new transfer pricing system was given to the brilliant young head of the Financial Analysis and Planning Department of the bank, Mack Terry. This division of labor at the bank was a beginning of a trend in U.S. banks that resulted in the total separation of the preparation of official financial reports, a routine and repetitive task that required a high degree of precision and a low level of imagination, from management information (not managerial "accounting") on how and why the bank was making its money. Mack Terry, who reported directly to Chief Financial Officer Lee Prussia, took on the new task with such vigor that most knowledgeable bankers of that era acknowledge Mack Terry as the father of the new discipline of "matched maturity transfer pricing." Mack Terry and the bank were faced by constraints that continue to plague large banks today: o The bank was unable to get timely information from loan and deposit mainframe
computer application systems regarding the origination, maturity, payment schedules, and maturities of existing assets and liabilities
o The bank had neither the time nor the financial resources to develop a new
transfer pricing system on a main frame computer. Personal computers, needless to say, were not yet available as management tools. The danger of future rate changes and incorrect strategic decisions was so great that bank management decided to make a number of crude but relatively accurate assumptions in order to get a "quick and dirty" answer to the bank's financial information needs. The fundamental principle developed by the Financial Analysis and Planning Department was the "matched maturity" principle. A three year fixed rate loan to finance the purchase of an automobile would be charged a three year fixed rate. A thirty year fixed rate mortgage loan would be charged the cost of fixed rate 30-year money. At other U.S. banks, it was more common to use the bank's average cost of funds or its marginal cost of new three month certificates of deposit. The average cost of funds method had obvious flaws, particularly in a rising rate environment, and it
2

ultimately contributed to the effective bankruptcy of Franklin National Bank and many U.S. savings and loan associations. The Financial Analysis and Planning ("FAP") Department team agreed that the bank's "marginal cost of funds" represented the correct yield curve to use for determining these matched maturity transfer pricing rates. The bankers recognized that the bank had the capability to raise small amounts of money at lower rates but that the true "marginal" cost of funds to the bank was the rate that would be paid on a large amount, say $100 million, in the open market. This choice was adopted without much controversy, at least compared to the controversy of the "matched maturity" concept itself. One of the first tasks of the FAP team was to estimate how the internal profitability of each unit would change if this new system were adopted. It was quickly determined that there would be massive "reallocations" of profit and that many line managers would be very upset with the reallocation of profit away from their units. In spite of the controversy that management knew would occur, management decided that better strategic decision making was much more important than avoiding the short run displeasure of half of the management team (the other half were the ones who received increased profit allocations). Once a firm decision was made to go ahead with the new system, implementation decisions had to be dealt with in great detail. The systems "queue" was so long at the bank that it was impossible to keep track of transfer pricing rates on a loan by loan or deposit by deposit basis. The first unit of measurement, then, was to be the "portfolio" consisting of otherwise identical loans which differed only in maturity and rate, not in credit risk or other terms. In addition, the bank (to its great embarrassment) did not have good enough data on either its own loans or its historical cost of funds to reconstruct what historical transfer pricing rates would have been for the older loans and deposits making up most of the bank's balance sheet. Estimates would have to do. These estimates were at the heart of the largest of many internal political controversies about the matched maturity transfer pricing system. Much of the fixed rate real estate portfolio was already "under water"--losing money--by the time the transfer pricing system was undergoing revision. If the current marginal cost of funds were applied at the start of the transfer pricing system to the mortgage portfolio, the profitability of the portfolio would have been essentially zero or negative. On the other hand, Mack Terry and his team recognized that in reality this interest rate risk had gone unhedged and that the bank had lost its interest rate bet. Someone would have to "book" the loss on the older mortgage loans. Ultimately, the bank's asset and liability management committee was assigned a "funding" book that contained all of the interest rate mismatches at the bank. The funding book was the unit that bought and sold all funds transfer priced to business units. At the initiation of the matched maturity system, this funding book was charged the difference between the historical marginal cost of funds that would have been necessary to fund the mortgage portfolio on a matched maturity basis and the current marginal cost of funds. This "dead weight loss" of past management actions was appropriately assignment to senior management itself.
3

Because of the lack of data, the bank's early implementation of the matched maturity system was based on the use of moving average matched maturity cost of funds figures for each portfolio. While this approximation was a crude one, it allowed a speedy implementation that ultimately made the bank's later troubles less severe than they otherwise would have been. Finally, the system was rolled out for implementation with a major educational campaign aimed at convincing lending officers and branch managers of the now well accepted discipline of "spread pricing," pricing all new business at a spread above the marginal cost of matched maturity money. Controversy was expected, and expectations were met. A large number of line managers either failed to understand the system or didn't like it because their reported profits declined. Soon after the announcement of the system, Mack Terry began receiving anonymous "hate mail" in the inter-office mail system from disgruntled line managers. Nonetheless, senior management fully backed the discipline of the new system, and for that the Bank of America receives full credit as the originator of the matched maturity transfer pricing concept. In an ironic footnote, the bank suffered heavily from an interest rate mismatched as interest rates skyrocketed in the 1979-1980 time period. The transfer pricing system made it clear that senior management was to blame since the asset and liability management committee had consciously decided not to hedge most of the interest rate risk embedded in the bank's portfolio. First Interstate, 1982-1987 In the years to follow, a number of banks adopted the matched maturity transfer pricing system. The oral history of U.S. banking often ranks Continental Illinois as the second bank to move to a matched maturity transfer pricing system, not long after the Bank of America implemented the idea. At most banks, however, the idea was still quite new and the early 1980s were largely consumed with recovering from the interest rate-related and credit risk-related problems of the 1979-1981 period. By the mid-1980s, however, banks had recovered enough from these crises to turn back to the task of improving management practices in order to face the more competitive environment that full deregulation of interest rates had created. First Interstate Bancorp, which at the time was the 7th or 8th largest bank holding company in the United States, approached the transfer pricing problem in a manner similar to that of many large banking companies in the mid-1980s. First Interstate's organization was much more complex than Bank of America's since the company operated 13 banks in 9 western states, all of which had separate treasury functions, separate management, separate government regulation, and separate systems. In addition, the bank holding company legal entity First Interstate Bancorp had a number of "non-bank" subsidiaries that required funding at the holding company ("parent") level. Most U.S. bank holding companies consisted of a small parent company whose dominant subsidiary was a lead bank that typically made up 90 percent of the total assets of the company in consolidation. The lead banks were almost always considered a stronger credit risk than the parent companies because of the existence of Federal deposit insurance at the bank level but not the parent level and because of the richness of funding sources available to banks compared to bank holding companies.
4

In the First Interstate case, things were more complex. The lead bank, First Interstate Bank of California, represented only 40 percent of the assets of the holding company and therefore its credit was generally felt by market participants to be weaker than that of the parent. Moreover, the First Interstate Banks did not compare funding needs, and as a result, it was often said that a New York bank could buy overnight funding from one First Interstate Bank and sell it to another First Interstate Bank at a good profit. The transfer pricing system at First Interstate had to cure this problem as well as addressing the correct allocation of profits and interest rate risk as in the Bank of America case. Management took a two-fold approach to the problem. At the holding company level, the corporate treasury unit began "making markets" to all bank and non-bank units within the company. Because First Interstate was much more decentralized than the Bank of America, funds transfers between the holding company and subsidiaries were voluntary transfers of funds, not mandatory, In addition, since each unit was a separate legal entity, a transfer pricing transaction was accompanied by the actual movement of cash from one bank account to another. The holding company transfer pricing system began in early 1984 under the auspices of the holding company's funding department. The department agreed to buy or sell funds at its marginal cost at rates which varied by maturity from 30 days to 10 years. No offers to buy or sell funds were to be refused under this system. The transfer pricing system, since it was voluntary, was received without controversy and actually generated a high degree of enthusiasm among line units. For the first time, the units had a firm "cost of funds" quotation that was guaranteed to be available and which could be used to price new business in line units on a no-interest rate risk basis. Demand from line units was very strong, and the parent company became an active issuer of bonds and commercial paper to support the strong funding demand from both bank and non-bank subsidiaries. Among bank subsidiaries, the "on-demand" transfer pricing system had the effect of equalizing the cost of funds across subsidiary banks. High cost of funds banks immediately found it cheaper to borrow at the lower rates offered by the parent company. Regulatory restrictions kept the parent company from borrowing from subsidiary banks, but there was an equivalent transaction that achieved the same objective. After the transfer pricing system had been in operation for some months, the parent company had acquired a substantial portfolio of certificates of deposit of subsidiary banks. These certificates of deposit could be sold to other banks within the system. By selling individual bank certificates of deposit to other First Interstate banks, the holding company reduced the size of this portfolio and effectively "borrowed" at its marginal cost of funds, the yield it attached to the certificates that it sold. The transfer pricing system at the holding company did have implementation problems of a sort. Generally, rates were set at the beginning of a business day and held constant for the entire day. The parent company soon noticed that borrowings from affiliates, and one subsidiary in particular, would increase when open market rates rose late in the day, allowing subsidiaries to "arbitrage" the parent company treasury staff by borrowing at the lower rate transfer price set earlier in the day. This got to be a big enough problem that rates for all borrowings above $10 million were priced in "real time." Most large banks use a similar "real time" quotation system now for pricing large corporate borrowings. What will surprise many bankers, however, is that "in-house" transactions ultimately also have to be priced in real time in many cases.
5

At the same time that the parent company was implementing this system, the parent company's asset and liability management department and the financial staff of First Interstate Bank of California ("FICAL") began to design a Bank of America-style matched maturity transfer pricing system for FICAL. Personal computer technology at the time did not permit Pcs to be used as the platform, so the company undertook a very ambitious mainframe development effort. After a complex design phase and a development effort that cost close to $10 million and two years of effort, the system was successfully put into to action with considerably less controversy than in the Bank of America case. The biggest practical problem to arise in the FICAL transfer pricing system was a subtle one with significant political and economic implications. During the design phase of the system, the question was raised about how to handle the pre-payment of fixed rate loans in the transfer pricing system. The financial management team at First Interstate dreaded the though of explaining "option-adjusted" transfer pricing rates to line managers and decided to do the following: internal transfer pricing would be done on a "non-prepayable" basis. If the underlying asset were prepaid, then the treasury unit at the center of the transfer pricing system would simply charge a "mark-to-market" prepayment penalty to the line unit, allowing it to extinguish its borrowings at the same time that the asset was prepaid. This decision led to unforeseen consequences. During the latter half of the 1980s and continuing into the 1990s, interest rates have declined in the United States and been accompanied by massive prepayments of fixed rate debt of all kinds. As a result, the FICAL transfer pricing system's reported profits for line units were soon dominated by huge mark-to-market penalties that line managers didn't have control over and generally didn't understand. Bank management quickly moved to a transfer pricing system that allowed for "costless prepayment" by incorporating the cost of a prepayment option in transfer prices. This trend is expected to be typical of most large banks in the United States over the next few years.
6

THE CURRENT STATE OF THE TRANSFER PRICING ART The physical process of implementing a transfer pricing system involves two principal activities: storing the transfer price for the life of the loan or deposit, and efficiently making use of the transfer price once it has been stored. From a systems point of view, the transfer price simply becomes one more field in the record of any individual transaction that is (ideally) maintained in an enterprise-wide data base. For many years, as the Bank of America example indicates, computer systems technology made it very difficult to perform these two tasks easily. With the advent of parallel processing and more powerful personal computers, this once-daunting task has become a day-to-day reality at almost all large banks in the United States over the last 10 years. Almost every vendor of financial information systems or asset and liability management systems in North America now offers some kind of transfer pricing system for a price so reasonable that no bank would be able to duplicate the cost through the in-house development of a similar system. The very best systems store data on a loan-by-loan, deposit-by-deposit basis and offer the user the choice of a number of methods for establishing transfer prices for both interest rate related items and non-interest income and expense. It's safe to say that no major financial institution can claim to be well-managed without having some kind of multiple rate transfer pricing system in place. The remainder of this section deals with the implementation of such a system. Major Issues Every institution which seeks to enhance its transfer pricing system has to deal with a number of strategic issues which can be summarized in the following questions: 1. Measurement of risk Should risk be measured in terms of net income volatility or the volatility of the mark-to-market value of the portfolio involved? 2. Risk limits Given the proper risk measure, how should big should specific risk limits be for each wing of the organization? 3. The transfer pricing book as a separate portfolio Should the transfer pricing book be broken out separately or should it be included in the "all other" category of risks that haven't been assigned to a specific unit other than the asset and liability management committee? 4. Transfer pricing book profit objectives
7

Should the transfer pricing book be a trading type profit center? 5. Transfer pricing book risk limits How big should the risk limits be on the transfer pricing book? 6. Basis risk Who should bear the risk that a pricing index, like the prime rate, doesn't move with perfect correlation relative to market interest rates? How should this risk be measured, and who should bear the risk? 7. Line units: asset portfolio or asset generator? Should line units be given credit for the on-going net interest income from assets generated in the past, or should they only be paid a credit for assets generated in the current period? 8. Credit risk Where should credit risk be housed in the organization? 9. Liquidity risk How do you deal with the situation line unit demands for short term interest rate-based pricing create the need for more short term funding than liquidity considerations will support? 10. Investment securities What should be the transfer pricing rate for investment securities, and what unit should hold the securities? 11. Prepayment and early withdrawal risk Who bears this risk and how is it charged? We will answer each of these questions, based on examples of leading banks and other financial institutions around the world, after discussing briefly the organizational structure that we assume for these discussions. Assumed Organizational Structure We assume the formal organizational structure outlined in Exhibit 1, which breaks the organizational units into the following seven classes: Retail Lending and Insurance Businesses 1. Executive vice president level 2. Individual branch level
8

Other Wholesale Financing Units, Including Leasing 3. Executive vice president level 4. Individual business unit level 5. Holding Company Trading for Its Own Account, If Any 6. Transfer pricing book 7. Asset and liability management committee The rest of the what follows will assume that risk and responsibility are divided among some or all of these seven units. Additional units are ignored in order to simplify the explanation below. Question 1. Measurement of risk Should risk be measured in terms of net income volatility or the volatility of the mark-to-market value of the portfolio involved? This is one of the most difficult questions in risk management, and it is easier to answer by "process of elimination." Before doing so, however, it is useful to characterize the difference in attitudes between how an investment management firm and a bank approach the same risks. Investment managers and bankers Many very large investment management firms have large yen and dollar fixed income portfolios. In the dollar portfolios, the managers can and do purchase the following securities: o U.S. Treasury securities o Eurodollar deposits o Reverse repos o Credit card receivables o Mortgage-backed securities o Collateralized mortgage obligations, with both fixed and floating rates tied to Libor 11th District Cost of Funds Index Prime rate 1, 3, and 5 year constant maturity treasury rate In short, there is nothing that a bank has on its balance sheet that cannot be found on the balance sheet of a large fixed income fund manager in the United States. From the asset side perspective, the fund management firm is a bank. On the liability side, the same is true: liabilities are made of a large number of small retail "deposits" that vary in amount daily at the whim of the depositor. The objective of the fund manager is to invest these deposits in a way most satisfactory to "shareholders," which in this case are identical to depositors. In the investment management world, there are three ways to measure risk:
9

1. Mark-to-market 2. Mark-to-market 3. Mark-to-market In short, it is no exaggeration to point out that net income simulation, often considered the core of the risk management tools for the banking industry, is never considered as a risk management tool in the fund management business. The same is true, to only a slightly lesser extent, with gap analysis. Bankers have been prisoners, in a sense, of the accounting profession's dominance of the banking business over the last few centuries. Consider how differently an investment manager without this prejudice operates: o Risk limit: the fund manager seeks to match the risk of a specific portfolio, often labeled
an "index" like the Lehman Brothers U.S. Treasury index based on all outstanding U.S. Treasury issues
o Communication of risk limit to shareholders: the fund manager clearly communicates the
name of the index by which he measures risk to depositor/shareholders o Performance measurement: good performance is defined as a total return in excess of the
base portfolio or index, without taking risk in excess of that embedded in the index In no case does a measurement of net income come into play. It is a logical argument but a powerful one to observe the following: Investment managers are very smart. If the simulation of the net income of their
portfolios would improve their risk/return performance, they would use net income simulation, they would use it. They don't. Therefore, it is the judgment of a very intelligent class of financial experts that net income simulation per se isn't helpful in their management of risk.
If this is so true, why have bankers as an industry clung so tightly to net income simulation as a risk management tool? There are a number of reasons: a. Management has historically communicated both risk and return to shareholders (and
analysts) in the form of a communication about net income. Bankers Trust and JPMorgan have become so trading oriented that net income forecasts for them lack any usefulness1. It may be time for other banks to begin to move in that direction, but for the time being senior management must communicate with shareholders using both the mark-to-market and the net income vocabulary.
1 A recent American Banker article comparing earnings projections by a large group of analysts with the standard deviation of those projections for the top 20 U.S. banks showed that Bankers Trust and JPMorgan had by far the largest standard deviations, relative to earnings, of the top 20 banks.
10
b. 300 branch managers are compensated on the basis of financial accounting net income of their branches: it is too complex to judge branch performance on a total return on a given portfolio. Net income is easier to understand and administer.
c. Banks have historically had trouble getting market value estimates on large portions of
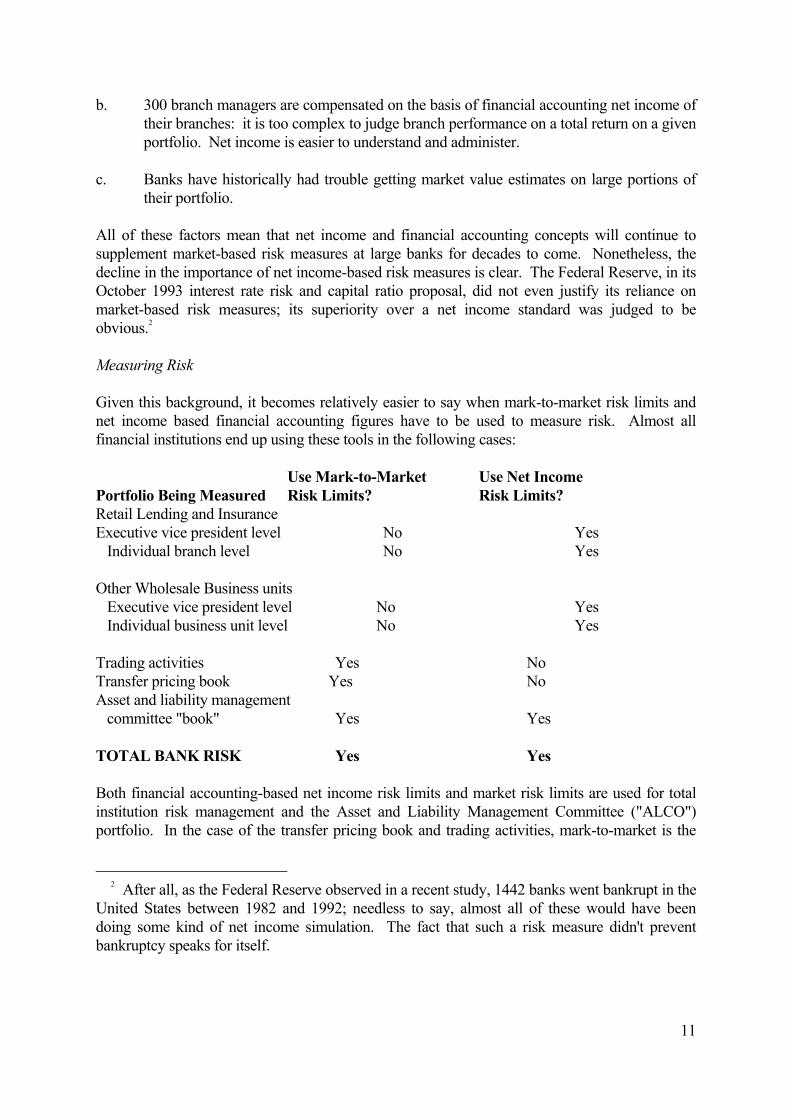
their portfolio. All of these factors mean that net income and financial accounting concepts will continue to supplement market-based risk measures at large banks for decades to come. Nonetheless, the decline in the importance of net income-based risk measures is clear. The Federal Reserve, in its October 1993 interest rate risk and capital ratio proposal, did not even justify its reliance on market-based risk measures; its superiority over a net income standard was judged to be obvious.2 Measuring Risk Given this background, it becomes relatively easier to say when mark-to-market risk limits and net income based financial accounting figures have to be used to measure risk. Almost all financial institutions end up using these tools in the following cases: Use Mark-to-Market Use Net Income Portfolio Being Measured Risk Limits? Risk Limits? Retail Lending and Insurance Executive vice president level No Yes Individual branch level No Yes Other Wholesale Business units Executive vice president level No Yes Individual business unit level No Yes Trading activities Yes No Transfer pricing book Yes No Asset and liability management committee "book" Yes Yes TOTAL BANK RISK Yes Yes Both financial accounting-based net income risk limits and market risk limits are used for total institution risk management and the Asset and Liability Management Committee ("ALCO") portfolio. In the case of the transfer pricing book and trading activities, mark-to-market is the
2 After all, as the Federal Reserve observed in a recent study, 1442 banks went bankrupt in the United States between 1982 and 1992; needless to say, almost all of these would have been doing some kind of net income simulation. The fact that such a risk measure didn't prevent bankruptcy speaks for itself.
11

consensus standard. At the individual business unit and branch level, financial accounting based net income measures are the standard. Transfer pricing is the tool by which a market-based risk management system for the total bank can be translated into practical tools for the management and motivation of a large and diverse organization firmly rooted in financial accounting systems. Question 2. Risk limits Given the proper risk measure, how should big should specific risk limits be for each wing of the organization? This is one of the most difficult questions to answer in risk management, since financial theory provides so little guidance. Concerning the maximum risk limits for the organization as a whole, risk should not be taken to such a degree that the presence of risk lowers shareholder value. For a broad range of risk levels, shareholders are indifferent to risk. For example, one interest rate risk strategy might be to structure cash flows from the organization in such a way that the bank generates cash for shareholders exactly like a sequential investment in three-month Treasury bills, where the investment is rolled over every three months. In this cash, the net income of the bank will risk and fall as rates rise and fall, but the bank's stock price will be very stable, just like the price of a three month treasury bill. The bank can never go bankrupt because its stock price will never be zero, just as a Treasury bill's price can never be zero. An alternative interest rate risk strategy might lead the bank to lock in a fixed level of net income exactly at the level of the coupon on a 30 year Treasury bond; the bank's stock price will be volatile, just like the price of the 30 year Treasury bond, but net income will be stable. The bank will never go bankrupt, since its stock price cannot reach zero just as the price of a 30 year Treasury bond can never be zero. In short, shareholders are indifferent between these two strategies for two reasons: o The bank can never go bankrupt (so there is no chance that bankruptcy costs will be
incurred), and o If the shareholder doesn't like the bank's target risk level, the shareholder can use futures
or swaps to change the level of rate risk in a portfolio that includes his investment in the bank's stock and the right hedge to adopt the shareholder's target risk level
Once the bank moves outside this "safety zone," the bank faces a possibility of going bankrupt, which would cause it to incur bankruptcy costs that shareholders can't hedge. That leads to a situation like that depicted in Exhibit 2, where the stock price of a bank declines once it moves outside of the safety zone. Total bank risk should be set at a level such that the bank will never leave the interest rate risk safety zone. In practice, this means that the bank should set risk limits in such a way that either
12

o The market value of portfolio equity (market value of assets less the market value of liabilities) can never be negative for any level of interest rates, or
o The annual cash flow (for which net income is a proxy) will never be negative for any
level of interest rates3 Various tools are used to achieve these objectives. Sensitivity of the market value of portfolio equity and "value at risk" type calculations are used to quantify the first type of risk limit. Net income simulation is usually used as a proxy for the second type of objective. Setting risk limits for various organizational units Within an organization, risk limits must be set in a consistent way that reflect both the experience and seniority of the individual in question. While it is impossible to generalize the right approach in just a few words, some basic principals can be stated: o The person running the transfer pricing book and a trader on the trading floor should
have similar risk limits if they have similar skills and experience o Most of the risk in a large institution is of such significant size that it should be explicitly
allocated to senior management and explicitly broken out to show that allocation of risk o Risk limits for the transfer pricing book should be large enough to allow for efficient
execution of hedges Question 3. The transfer pricing book as a separate portfolio Should the transfer pricing book be broken out separately or should it be included in the "all other" category of risks that haven't been assigned to a specific unit other than the asset and liability management committee? Many institutions have an attitude toward transfer pricing that is internally inconsistent. Almost all large banks require loan officers to get real time cost of funds quotes for large fixed rate loans over a set limit, say US$ 1 million, to allow the transaction to be hedged in real time. At the same time, some institutions do not isolate the transfer pricing portfolio as a separate identifiable portfolio with a specific manager, which means that fixed rate loans will be made every day that go unhedged because the size of the transaction is less than the US$ 1 million limit. The aggregate amount of these small credits is usually much larger than the amount of fixed rate corporate credits that exceed the US$ 1 million limit. Why require strict match-funding of some transactions but not others?
3 It is more precise to say it will never be negative for a long enough time for the present value of these cash flows over time to be negative.
13

Kamakura Corporation feels strongly that all interest rate risk exposure must be monitored and hedged on a timely basis and that no organization can neglect this task, even with the justification that individual transactions are small: only their aggregate size is relevant. In order to assure this constant monitoring, the transfer pricing book should be managed in the following way: o A manager of the book should be explicitly identified o The hedging of the book should be his primary responsibility o The book should be hedged on a mark-to-market basis rather than a net interest
simulation basis o Risk exposure should be measured daily and reported daily to the relevant senior
manager o The asset and liability management committee should review the risk of the transfer
pricing book at each meeting o There should be formal numerical risk limits on the transfer pricing book o Any violations of these risk limits should be reported in writing to the asset and liability
management committee and prompt corrective action taken o Failure to adhere to risk limits should result in disciplinary action Question 4. Transfer pricing book profit objectives Should the transfer pricing book be a trading type profit center? Every large bank has a trading floor which acts as a profit center. The question above should really be rephrased as follows: does the bank want to have two different sets of people using two different portfolios to achieve trading profits? The obvious answer is no, but there are many good reasons for this answer that are not that obvious. Clearly, the transfer pricing book should not be used as a profit center to avoid the obvious duplication of effort. There are more important issues at stake, however. First, the manager of the transfer pricing book is almost always viewed with suspicion by line unit managers. Borrowers from the book feel rates are too high and lenders to the book feel rates are too low. If large rate risk positions are taken within the book in an attempt to make profits, any resulting gains or losses will reinforce the suspicions of line units. If there are profits, line units will feel they have been "ripped off" by the pricing of transactions with the transfer pricing book. If there are losses, the transfer pricing book manager will be regarded as incompetent. This all downside risk scenario is very common at large banks. To insure the political integrity of the transfer pricing system, we feel that modest risk limits and a non-profit objective is essential.
14

The reason that the transfer pricing book has risk limits that are not zero is the need for good execution: if risk limits were truly zero, the manager of the book would have to micro-hedge every fixed rate loan made by the bank individually, even if the principal amount were very small. Clearly, better execution can be obtained by using a temporary, less precious hedge while accumulating a position that can be efficiently hedged. Non-zero risk limits allow this to take place. Another reason for non-zero risk limits is the reality of early prepayments by customers and therefore the branches which have borrowed from the transfer pricing book to lend to those customers. This complex option-related type of transfer pricing is hard to hedge and the manager will need some leeway in his risk limits to do it well. Finally, the risk of the transfer pricing book may well be in the opposite direction of the interest rate risk in the rest of the bank. In this case, as long as the manager of the book is within his risk limits, there is no reason to hedge from the shareholders' point of view since there is a natural offset within the bank. For all of these reasons, there will be a gain or a loss in the transfer pricing book. In some organizations, a gain is divided among line units and a loss is carried forward until offset by gains in later years. This reinforces the image of the transfer pricing book as an efficient and skillful unit whose main objective is not trading oriented. Question 5. Transfer pricing book risk limits How big should the risk limits be on the transfer pricing book? As mentioned in the answer to question 2, Kamakura Corporation feels that the risk limits imposed on the manager of the transfer pricing book should be explicit numerical limits consist with the limits that the same individual would have if he were on the trading floor trading swaps or government bonds. Specifically, the transfer pricing book should not be the "plug" or "garbage disposal" for all other risks not otherwise assigned, because the mid-level manager of the book does not have the experience or seniority to handle risk of such a large size. All risks not assigned elsewhere should be assigned to the asset and liability management committee, not the transfer pricing book. Question 6. Basis risk Who should bear the risk that a pricing index, like the prime rate, doesn't move with perfect correlation relative to market interest rates? How should this risk be measured, and who should bear the risk? Basis risk, resulting from the choice of pricing indexes like the prime rate, should be born by someone with the authority to change the index (normally a very senior line manager) rather that parties without that authority (like branch managers or the manager of the transfer pricing book). If the senior line manager doesn't want to change or can't change the use of the index, he has the
15
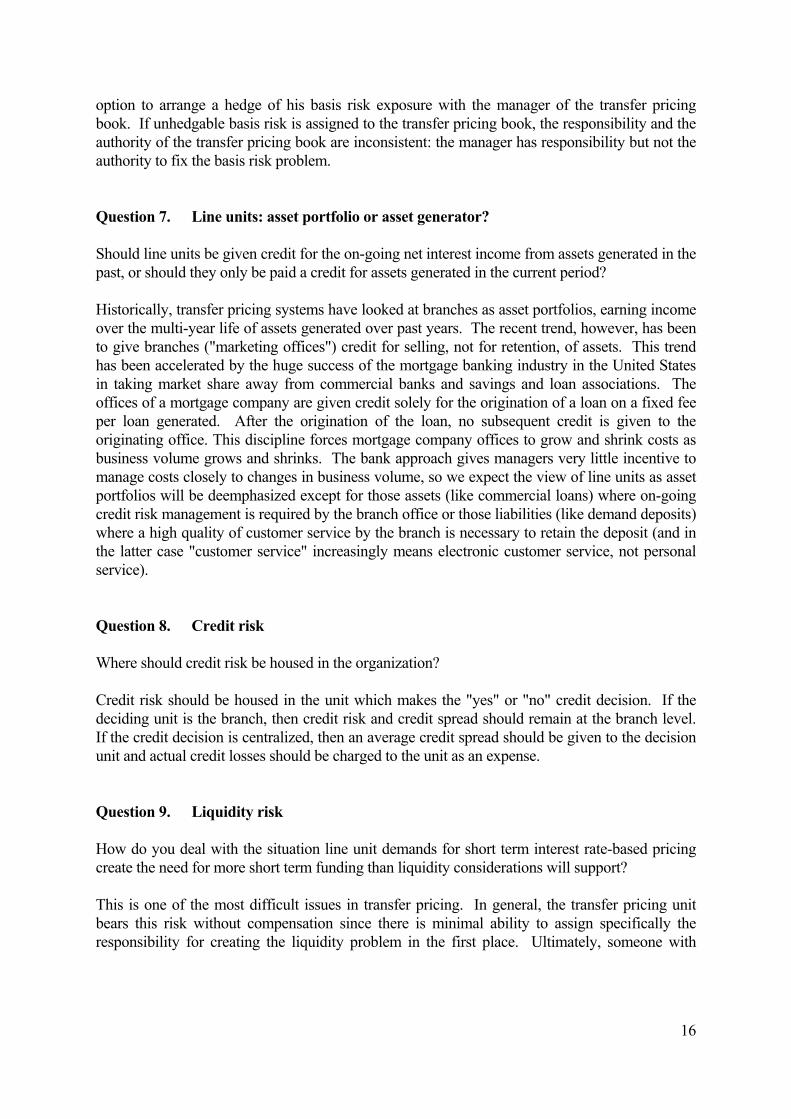
option to arrange a hedge of his basis risk exposure with the manager of the transfer pricing book. If unhedgable basis risk is assigned to the transfer pricing book, the responsibility and the authority of the transfer pricing book are inconsistent: the manager has responsibility but not the authority to fix the basis risk problem. Question 7. Line units: asset portfolio or asset generator? Should line units be given credit for the on-going net interest income from assets generated in the past, or should they only be paid a credit for assets generated in the current period? Historically, transfer pricing systems have looked at branches as asset portfolios, earning income over the multi-year life of assets generated over past years. The recent trend, however, has been to give branches ("marketing offices") credit for selling, not for retention, of assets. This trend has been accelerated by the huge success of the mortgage banking industry in the United States in taking market share away from commercial banks and savings and loan associations. The offices of a mortgage company are given credit solely for the origination of a loan on a fixed fee per loan generated. After the origination of the loan, no subsequent credit is given to the originating office. This discipline forces mortgage company offices to grow and shrink costs as business volume grows and shrinks. The bank approach gives managers very little incentive to manage costs closely to changes in business volume, so we expect the view of line units as asset portfolios will be deemphasized except for those assets (like commercial loans) where on-going credit risk management is required by the branch office or those liabilities (like demand deposits) where a high quality of customer service by the branch is necessary to retain the deposit (and in the latter case "customer service" increasingly means electronic customer service, not personal service). Question 8. Credit risk Where should credit risk be housed in the organization? Credit risk should be housed in the unit which makes the "yes" or "no" credit decision. If the deciding unit is the branch, then credit risk and credit spread should remain at the branch level. If the credit decision is centralized, then an average credit spread should be given to the decision unit and actual credit losses should be charged to the unit as an expense. Question 9. Liquidity risk How do you deal with the situation line unit demands for short term interest rate-based pricing create the need for more short term funding than liquidity considerations will support? This is one of the most difficult issues in transfer pricing. In general, the transfer pricing unit bears this risk without compensation since there is minimal ability to assign specifically the responsibility for creating the liquidity problem in the first place. Ultimately, someone with
16

higher liquidity risk will face a higher marginal cost of funds that can be charged through the transfer pricing system. Question 10. Investment securities What should be the transfer pricing rate for investment securities, and what unit should hold the securities? Securities are held for three purposes: as a source of trading profits, as a substitute for loans when lending is not profitable but deposit gathering is, and as a reserve of liquid assets that provides a source of liquidity when incremental funding is not readily available. In the former role, securities have a pure trading floor role and that is where the responsibility should be housed. In the latter two roles, the asset and liability management committee is ultimately responsible and the securities should be booked into the ALCO portfolio. Securities should earn their true rate. Liabilities will be added at an explicit cost depending on ALCO's strategy for the bank's total risk. Looked at in this way, we don't need to deal with the difficult (but somewhat artificial) issue of whether Treasury securities should be charged the Treasury rate or the bank's marginal cost of funds, the usual transfer pricing policy decision. Question 11. Prepayment and early withdrawal risk Who bears this risk and how is it charged? This simple question hides an enormously complex issue. In theory, there are two ways to charge for the possibility of early prepayment on an asset or early withdrawal of a liability: o Transfer price the asset or liability with funds that assume no early termination, and then
charge a mark-to-market penalty upon prepayment or early withdrawal. o Increase (decrease) the transfer pricing rate to reflect that option value of early
prepayment (withdrawal) and extinguish the transfer pricing transaction without penalty when the asset or liability disappears from the line unit's balance.
Both of these approaches are fine in theory but much different in practice. We feel it is politically impossible to make a mark-to-market penalty approach effective for a simple reason: interest rates in every market move in long trends that can result in many years of steady rate rises or declines. Over this period of years, like the decline in rates during the Reagan administration, there can be a massive amount of prepayments. The mark-to-market penalties associated with these prepayments can be so large that they swamp the net interest income from remaining transactions on the books of the line unit. The result of the large size of these penalties is very serious: they are little understood by line units and their presence can cause the entire transfer pricing system's integrity to be called into question. This has been a problem at many institutions and we strongly recommend that transfer pricing (a) recognize optionality and (b) not charge prepayment or early withdrawal penalties to line units, but instead embed an option premium in the rates charged to fund assets subject to early prepayment.
17

EXAMPLES OF A TRANSFER PRICING SYSTEM IN ACTION Perhaps the best way to illustrate the general principles listed above is to go through a fairly realistic development of a bank's full complex from the day of its founding. We will reflect the transfer pricing position of each of the seven relevant units after each transaction. We denote the amount of assets by positive numbers and liabilities by negative numbers. Transaction 1: Formation of bank with $100 capital and investment in securities Description of the transaction The bank is formed with $100 of capital. The ALCO authorizes the purchase of $100 of 1 year Treasury bills. Status of the bank Branch banking Executive vice president level Individual branch level Other business units Executive vice president level Individual business unit level Trading activities Transfer pricing book Asset and liability management committee 100 1 year treasury bills -100 Shareholders' equity
18
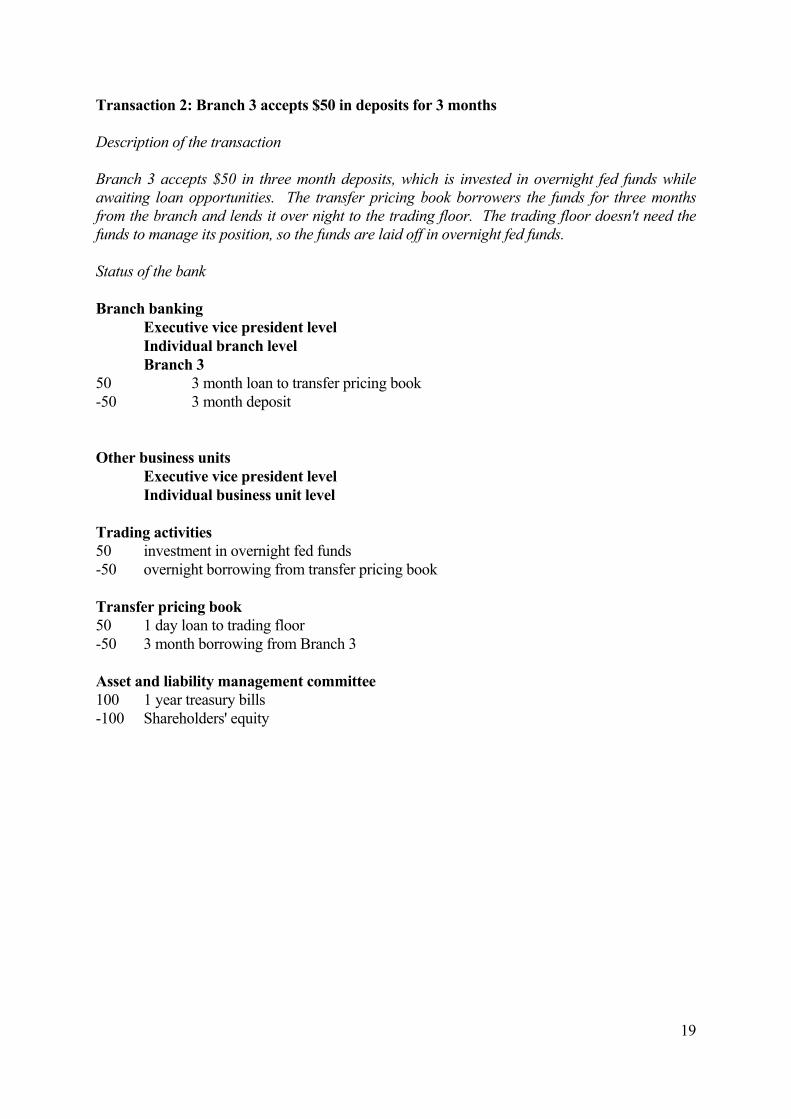
Transaction 2: Branch 3 accepts $50 in deposits for 3 months Description of the transaction Branch 3 accepts $50 in three month deposits, which is invested in overnight fed funds while awaiting loan opportunities. The transfer pricing book borrowers the funds for three months from the branch and lends it over night to the trading floor. The trading floor doesn't need the funds to manage its position, so the funds are laid off in overnight fed funds. Status of the bank Branch banking Executive vice president level Individual branch level Branch 3 50 3 month loan to transfer pricing book -50 3 month deposit Other business units Executive vice president level Individual business unit level Trading activities 50 investment in overnight fed funds -50 overnight borrowing from transfer pricing book Transfer pricing book 50 1 day loan to trading floor -50 3 month borrowing from Branch 3 Asset and liability management committee 100 1 year treasury bills -100 Shareholders' equity
19

Transaction 3: Branch 5 makes 3 year fixed rate car loan for $25 Description of the transaction Branch 5 makes a 3 year fixed rate car loan for $25. The transfer pricing book lends $25 fixed rate for three years to branch 5. This would violate the transfer pricing book risk limits. The transfer pricing book manager decides to partially hedge by issuing $20 million in 2 year fixed rate liabilities through the trading floor, which passes the funds through to the trading book. The other $5 is funded by reducing funds sold to the trading floor, which in turn reduces fed funds sold. Status of the bank Branch banking Executive vice president level Individual branch level Branch 3 50 3 month loan to transfer pricing book -50 3 month deposit Branch 5 25 3 year fixed rate auto loan -25 3 year fixed rate borrowing from transfer pricing book Other business units Executive vice president level Individual business unit level Trading activities 45 investment in overnight fed funds -45 overnight borrowing from transfer pricing book Transfer pricing book 25 3 year fixed rate loan to branch 5 45 1 day loan to trading floor -50 3 month borrowing from Branch 3 -20 2 year fixed borrowing via trading floor Asset and liability management committee 100 1 year treasury bills -100 Shareholders' equity
20
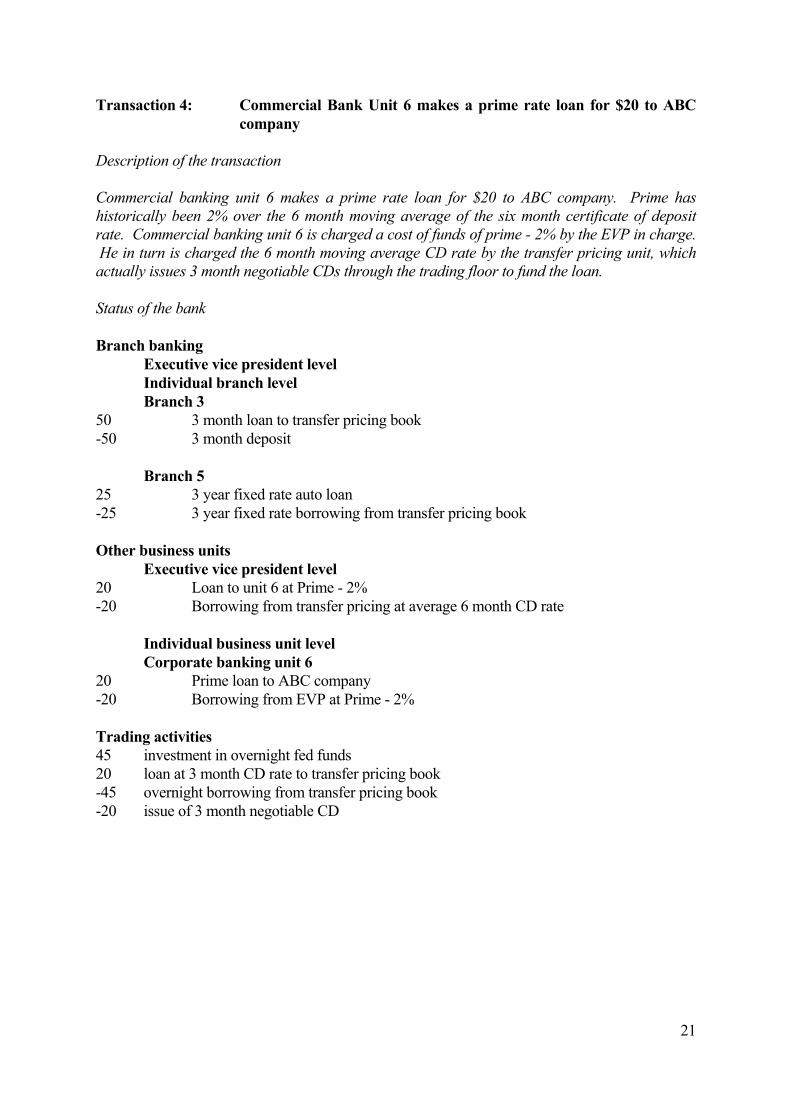
Transaction 4: Commercial Bank Unit 6 makes a prime rate loan for $20 to ABC company
Description of the transaction Commercial banking unit 6 makes a prime rate loan for $20 to ABC company. Prime has historically been 2% over the 6 month moving average of the six month certificate of deposit rate. Commercial banking unit 6 is charged a cost of funds of prime - 2% by the EVP in charge. He in turn is charged the 6 month moving average CD rate by the transfer pricing unit, which actually issues 3 month negotiable CDs through the trading floor to fund the loan. Status of the bank Branch banking Executive vice president level Individual branch level Branch 3 50 3 month loan to transfer pricing book -50 3 month deposit Branch 5 25 3 year fixed rate auto loan -25 3 year fixed rate borrowing from transfer pricing book Other business units Executive vice president level 20 Loan to unit 6 at Prime - 2% -20 Borrowing from transfer pricing at average 6 month CD rate Individual business unit level Corporate banking unit 6 20 Prime loan to ABC company -20 Borrowing from EVP at Prime - 2% Trading activities 45 investment in overnight fed funds 20 loan at 3 month CD rate to transfer pricing book -45 overnight borrowing from transfer pricing book -20 issue of 3 month negotiable CD
21

Transfer pricing book 25 3 year fixed rate loan to branch 5 45 1 day loan to trading floor 20 Loan at average 6 month CD rate to EVP, other business units -50 3 month borrowing from Branch 3 -20 2 year fixed borrowing via trading floor -20 Issued 3 month negotiable CD via trading floor Asset and liability management committee 100 1 year treasury bills -100 Shareholders' equity
22

Transaction 5: ALCO decides rates are going up and sells securities and borrows long term
Description of the transaction ALCO decides rates are going up. It sells $50 million in 1 year Treasury bills and lends the money on a floating rate basis to the transfer pricing book, which in turn passes it through to the trading floor to invest in fed funds. Status of the bank Branch banking Executive vice president level Individual branch level Branch 3 50 3 month loan to transfer pricing book -50 3 month deposit Branch 5 25 3 year fixed rate auto loan -25 3 year fixed rate borrowing from transfer pricing book Other business units Executive vice president level 20 Loan to unit 6 at Prime - 2% -20 Borrowing from transfer pricing at average 6 month CD rate Individual business unit level Corporate banking unit 6 20 Prime loan to ABC company -20 Borrowing from EVP at Prime - 2% Trading activities 95 investment in overnight fed funds 20 loan at 3 month CD rate to transfer pricing book -95 overnight borrowing from transfer pricing book -20 issue of 3 month negotiable CD
23

Transfer pricing book 25 3 year fixed rate loan to branch 5 95 1 day loan to trading floor 20 Loan at average 6 month CD rate to EVP, other business units -50 3 month borrowing from Branch 3 -20 2 year fixed borrowing via trading floor -20 Issued 3 month negotiable CD via trading floor -50 overnight borrowing from ALCO committee Asset and liability management committee 50 1 year treasury bills 50 overnight loan to transfer pricing book -100 Shareholders' equity
24

Transaction 5: ALCO wants to increase bank's ability to benefit from rising rates and borrows $15 million fixed rate for four years from transfer pricing book
Description of the transaction ALCO gives an order to the transfer pricing book manager to issue $15 million in four year fixed rate money on ALCO's behalf. ALCO sells the money back to the transfer pricing book in the form of fed funds, which are passed through to the trading floor. Status of the bank Branch banking Executive vice president level Individual branch level Branch 3 50 3 month loan to transfer pricing book -50 3 month deposit Branch 5 25 3 year fixed rate auto loan -25 3 year fixed rate borrowing from transfer pricing book Other business units Executive vice president level 20 Loan to unit 6 at Prime - 2% -20 Borrowing from transfer pricing at average 6 month CD rate Individual business unit level Corporate banking unit 6 20 Prime loan to ABC company -20 Borrowing from EVP at Prime - 2% Trading activities 110 investment in overnight fed funds 20 loan at 3 month CD rate to transfer pricing book -110 overnight borrowing from transfer pricing book -20 issue of 3 month negotiable CD
25

26
Transfer pricing book 25 3 year fixed rate loan to branch 5 110 1 day loan to trading floor 20 Loan at average 6 month CD rate to EVP, other business units 15 loan at 4 years fixed rate to ALCO -15 4 year fixed rate bond issued by trading floor -50 3 month borrowing from Branch 3 -20 2 year fixed borrowing via trading floor -20 Issued 3 month negotiable CD via trading floor -65 overnight borrowing from ALCO committee Asset and liability management committee 50 1 year treasury bills 65 overnight loan to transfer pricing book -15 4 year fixed rate borrowing from transfer pricing book -100 Shareholders' equity