Embed Size (px)
Citation preview

Transformation of stimulus value signals into motorcommands during simple choiceTodd A. Harea,b,1, Wolfram Schultzc, Colin F. Camerera, John P. O’Dohertya, and Antonio Rangela
aComputation and Neural Systems and Humanities and Social Science Divisions, California Institute of Technology, Pasadena, CA 91125; bLaboratory for Socialand Neural Systems Research, Department of Economics, University of Zurich, 8006 Zurich, Switzerland; and cDepartment of Physiology, Development, andNeuroscience, Cambridge University, Cambridge CB2 1TN, United Kingdom
Edited* by William T. Newsome, Stanford University, Stanford, CA, and approved September 20, 2011 (received for review June 10, 2011)
Decision-making can be broken down into several componentprocesses: assigning values to stimuli under consideration, select-ing an option by comparing those values, and initiating motorresponses to obtain the reward. Although much is known aboutthe neural encoding of stimulus values and motor commands, littleis known about the mechanisms through which stimulus valuesare compared, and the resulting decision is transmitted to motorsystems. We investigated this process using human fMRI in a taskwhere choices were indicated using the left or right hand. Wefound evidence consistent with the hypothesis that value signalsare computed in the ventral medial prefrontal cortex, they arepassed to regions of dorsomedial prefrontal cortex and intra-parietal sulcus, implementing a comparison process, and the outputof the comparator regions modulates activity in motor cortexto implement the choice. These results describe the networkthrough which stimulus values are transformed into actions duringa simple choice task.
dynamic causal modeling | valuation
Implementing a choice necessarily requires taking an action.Consider the problem faced by an individual that has to choose
between two stimuli, one placed on the left and obtained througha left hand movement and one placed on the right and obtainedthrough a right hand movement. Theoretical models and agrowing body of evidence (1–3) suggest that the brain solves thistask by assigning values to the two stimuli, comparing them, andthen activating the necessary motor response to implement thechoice. It follows that, to solve the choice problem, the brainneeds to transform stimulus value signals into motor commands.Over the last decade, we have learned a considerable amount
about the encoding of stimulus value signals at the time ofchoice. Functional MRI (fMRI) studies have found stimulus valuesignals in ventromedial prefrontal cortex (vmPFC) at the timeof decision-making for primary rewards (4–8), monetary gainsand losses (9–14), delayed rewards (15), consumer goods (16, 17),and abstract social rewards (18, 19). Related studies using elec-trophysiological recordings in nonhuman primates have shownthat stimulus values are encoded in the firing rates of individualneurons in the orbitofrontal cortex (20–23). Importantly, thesestudies have shown that these areas encode stimulus value signalsthat are independent of the actual choice made, suggesting thatthey are an input to the choice process, which is outlined in theframework above.The values assigned to each option must be compared to select
the best course of action. Exactly how this comparison occurs inthe brain is an area of active research. One important clue comesfrom computational models of the choice process that haveshown that the drift diffusion model (DDM) (24, 25) and someof its variants (26–29) fit the accuracy and reaction time data ofsimple choice tasks remarkably well. Furthermore, activity re-sembling the output of the DDM has been found in the lateralintraparietal cortex during perceptual decision-making tasks innonhuman primates (30, 31) and the dorsal medial prefrontalcortex (dmPFC) during action selection tasks in humans (32).
Here, we seek to identify the network involved in transformingstimulus values into motor commands using fMRI. Our strategyrelies on the fact that an area involved in the comparison processand linking value computation to action implementation shouldsatisfy the following three properties. First, its blood oxygenlevel-dependent (BOLD) signal should reflect the predictions foraggregate activity derived from neural implementations of theDDM. This property is important, because the DDM has beenshown to fit the psychometric data in this class of tasks extremelywell (24, 25). Second, the region should exhibit increased ef-fective connectivity from areas such as vmPFC that encodestimulus values at the time of choice. This property is important,because the comparator needs to receive the value signals to beable to make choices. Third, the region should exhibit choice-dependent effective connectivity with motor cortex in a way thatpromotes the observed motor responses: it should enhance ac-tivity in the left motor cortex during right actions and activity inthe right motor cortex during left actions. Based on the evidencedescribed above and the well-characterized connectivity betweenthe dmPFC and supplemental motor areas (33–35), we hypoth-esized that dmPFC and intraparietal sulcus (IPS) would satisfythe three properties and thus, provide the link between vmPFCand motor cortex during the transformation of stimulus valuesinto motor commands.Previous studies have looked at individual aspects of the value
transformation network but have never tested for all of thefunctions necessary to move from valuation to action. A recentfMRI study of human decision-making found that IPS activitywas consistent with some of the properties that one would expectfrom a comparator process, including increased connectivity withvmPFC at the time of choice and greater activity for more dif-ficult choices (36), and a previous study by our own group sug-gested that activity in dmPFC might reflect, in part, thecomputations of a comparator process (7). Another study (37)found that activity in vmPFC was stronger in easier trials thanmore difficult decision trials, which is consistent with the hy-pothesis that the vmPFC might be involved in the computationof relative stimulus values. Note that, although these papers areimportant precursors on which we build and their results areconsistent with subsets of the results obtained here, none of themaddress the fundamental goal of fully characterizing the networkinvolved in how value signals are transmitted to putative com-parison regions and ultimately, modulate activity in motor cortexto implement the choice. In particular, none of them has ex-amined the connectivity of the entire network to test the pre-dicted intratrial-, choice-, time-, and direction-specific changes in
Author contributions: T.A.H., W.S., C.F.C., J.P.O., and A.R. designed research; T.A.H. per-formed research; T.A.H. and A.R. analyzed data; and T.A.H., W.S., C.F.C., J.P.O., and A.R.wrote the paper.
The authors declare no conflict of interest.
*This Direct Submission article had a prearranged editor.1To whom correspondence should be addressed. E-mail: [email protected].
This article contains supporting information online at www.pnas.org/lookup/suppl/doi:10.1073/pnas.1109322108/-/DCSupplemental.
18120–18125 | PNAS | November 1, 2011 | vol. 108 | no. 44 www.pnas.org/cgi/doi/10.1073/pnas.1109322108

coupling between each region of the network. Here, we test thesepredictions using dynamic causal modeling (DCM) to examinethe modulation of specific connections at a neuronal timescale(inferred from a hemodynamic deconvolution of the BOLD sig-nal) during the periods of stimulus valuation and action prepa-ration. Consistent with our hypotheses, we found that signalingfrom vmPFC to comparator regions increases at the time ofchoice, and subsequently, signaling from comparator regions tomotor cortex increases during action preparation in a choice-dependent manner.
ResultsWe tested these hypotheses using a paradigm in which, on everytrial, thirsty human subjects were shown pairs of symbols rep-resenting various amounts of different liquid rewards on the leftand right sides of the screen, and later, they pressed either theleft or right thumbs to indicate their choice (Fig. 1A). Afteranother brief delay, the chosen liquid was delivered to the sub-jects inside the scanner on each trial. The task is closely relatedto the tasks used in works by Padoa-Schioppa and Assad to in-vestigate the coding of stimulus value in orbitofrontal cortex withnonhuman primates (20, 21, 38).
Behavioral Results. We estimated the value of each amount ofevery different juice from the behavioral data using the pro-cedure described in Materials and Methods. The psychometriccurve in Fig. 1B shows that these value estimates provide anaccurate account of the choice behavior. A mixed effects logisticregression showed that subjects were highly responsive to therelative value of the two juices (t18 = 8.05, P < 0.001).
Estimation of the Neural DDM. We estimated a simple neuralimplementation of the DDM. The model is important for ouranalyses, because it makes predictions about the level of aggre-gate activity and thus, about the BOLD responses that should beobserved in an area involved in the comparison of stimulus val-ues with action selection. As illustrated in Fig. 2A, the standardDDM assumes that (i) a relative value signal measuring the es-timated relative value in favor of the left stimulus is computeddynamically through a Gaussian Markovian process, with in-dependent and identically distributed noise and a mean slope ofintegration proportional to the underlying true value of the leftminus right items; (ii) the relative value signal starts at zero; and(iii) a choice is made when either the signal crosses the upper
barrier (so that the left option is selected) or the lower barrier(so that the right option is selected). At this level of computa-tional abstraction, the DDM model does not make testablepredictions about the level of activity associated with the com-parator process that can be used to identify an area involved inthese computations using fMRI. To achieve this link, we speci-fied the simplest possible plausible neural implementation of theDDM that matches well with its behavioral predictions (29) (Fig.2B and Materials and Methods).An advantage of this model, which we refer to as neural DDM
(nDDM), is that it is fully characterized by three free parameters(integration slope, inhibition strength, and integration noise).We estimated the values of these parameters that maximized thematch with the group psychometric choice function shown in Fig.2C. We used the model and best-fitting parameters to computethe expected total level of activity in the comparator region foreach trial as a function of the relative values of the left and rightitems as well as whether the best item was chosen. Fig. 2Ddepicts the average predicted level of activity that is used belowto identify regions associated with value comparison and actionselection. This variable measures the total level of predictedactivity generated by both pools of neurons, which is the relevantsignal for identifying the neural comparator using BOLD fMRIas long as the two pools of neurons are spatially intermingled.Previous studies have used difficulty or reaction times as amarker for putative comparator regions (36, 39–41). Fig. 2D andthe analyses discussed below show that, although this assumptionis a good approximation to the predictions of the nDDM, itleaves out useful information. This void can be seen from the factthat the predicted activity levels have different curvature andaverage levels in correct and error trials. As described below andin SI Results, these differences can be exploited to compare therelative fit of the nDDM with difficulty-based regressors.
Stimulus Value Representation.We estimated a parametric generallinear model (GLM) of BOLD activity that allowed us to identifyareas in which activity was correlated with various signals ofinterest. Using this model, we found that activity in vmPFCcorrelated with the sum of the values during the initial screendepicting the two options (P < 0.05, small-volume corrected)(Fig. 3A and Table S1). Post hoc analyses of this area showedthat activity did not differ by stimulus identity [one-way ANOVAfor liquid type: F(3,72) = 0.90, not significant (n.s.)], location(paired t test between left and right values: t(18) = −1.40, n.s.), or
Fig. 1. Experimental design and behavior. (A) Subjects were presented with a choice screen offering two different amounts of two different liquids. Coloredshapes represented the liquid identity. The number of shapes indicated the amount of liquid being offered. Subjects were instructed to make their choicewhile the shapes were on the screen, but they could only indicate their choice with a button press (left or right thumb) when the response prompt appearedafter a variable delay period. The chosen stimulus was delivered after another variable delay period. (B) Percentage of left choices as a function of value ofleft minus value of right stimulus. Error bars represent the SEM across subjects.
Hare et al. PNAS | November 1, 2011 | vol. 108 | no. 44 | 18121
NEU
ROSC
IENCE

choice status (paired t test between chosen and nonchosen value:t(18) = 0.56, n.s.).
Motor Responses.Next, we used the same GLM to identify activityassociated with implementing specific motor responses. Leftmotor cortex (lMC) and right cerebellum were more active forresponses with the right than the left thumb (P < 0.05, corrected)(Fig. S1A and Table S2). Conversely, right motor cortex (rMC)and left cerebellum were more active for responses with the leftthan right thumb (P < 0.05, corrected) (Fig. S1B and Table S2).Post hoc tests showed that lMC and rMC did not meet the cri-teria for encoding of action values (details in SI Results).
Comparator Regions Linking Valuation to Action: First Property. Asdescribed in the Introduction, any comparator region linkingvaluation to action in our experiment should satisfy three keyproperties. Here, we implement the test for the first property,which requires that BOLD responses at the time of stimuluspresentation, when the choice is being made, correlate with thepredicted total activity levels estimated from the nDDM, con-ditional on the relative value (Vbest − Vworse) and the quality ofchoice (best chosen = 0, 1) in each trial (Fig. 2D). We found thatactivity in the dmPFC, left dorsolateral prefrontal cortex(dlPFC), and bilateral IPS correlated with this regressor duringthe period from stimulus onset through execution of the motorresponse (P < 0.05, corrected) (Fig. 3 B and C, Fig. S2, andTable S3).Given the high correlation between the output of our nDDM
and a measure of choice difficulty given by |value left − valueright| (r = −0.930) and previous reports of correlations betweendmPFC, dlPFC, and IPS with choice difficulty (42, 43), we per-formed post hoc Bayesian model selection on each region ofinterest to test whether the predictions from the nDDM or dif-ficulty best explained activity in these regions. Note that, al-though there is a high correlation between the two measures, thenDDM predicts differences in the signal between correct anderror trials that the difficulty measure does not predict. These
differences can be exploited to test for the relative ability of eachmodel to fit aggregate neural activity in areas of interest (addi-tional details in SI Results). We used the exceedance probability(EP; the probability that a given model is more likely than anyother model in the comparison set given the group data) as ourmetric for model comparison (44). The EP of the nDDM modelwas greater than the difficulty model in all four regions (dmPFCEP = 0.99, dlPFC EP = 0.58, lIPS EP = 0.98, and rIPS EP =0.94), indicating that the nDDM provided a better fit to activityin these areas than the difficulty measure, especially in dmPFCand IPS.
Comparator Regions Linking Valuation to Action: Second and ThirdProperties. We next used DCM to investigate if the dmPFC,dlPFC, and IPS also exhibited the two key connectivity proper-ties that an area involved in transforming stimulus values intomotor commands should satisfy: (i) increased input at the timeof choice from the region of vmPFC involved in computingstimulus values, and (ii) choice-dependent effective connectivitywith motor cortex in a way that promotes the observed motor-responses.First, we identified the most likely model using a Bayesian
model selection process (Materials and Methods, SI Materials andMethods, and Tables S4–S10). The best model, depicted in Fig. 4,has reciprocal connections between vmPFC, dmPFC, dlPFC,and bilateral IPS and unidirectional connections from dmPFC,dlPFC, and bilateral IPS to lMC and rMC.Second, after determining the most likely model, we used
Bayesian parameter averaging to estimate the group posteriorprobabilities of each parameter of the best-fitting model. Thereare two types of parameters of interest in the model: fixed con-nection and coupling modulation parameters.The fixed connection parameters measure the coupling be-
tween two areas during the rest periods of the task. There wasa high posterior probability (P > 90%) of fixed positive con-nections between most regions with the exception of vmPFC todlPFC, dmPFC to lIPS, lIPS and rIPS to rMC, rIPS to lIPS, and
Fig. 2. Theoretical results. (A) Sketch ofthe basic DDM model of binary choice.(B) Summary of the neural implementa-tion of the DDM. Red denotes activityencoding the relative value of left. Everyinstant t, this pool of neurons receivesinput (VL − VR) + errorL(t), which is in-tegrated to the previous level of activityaL(t) without leakage. The pool alsoreceives a constant level of inhibitionproportional to the level of activity inthe right pool of neurons [denoted inblue; aR(t)]. The dynamics for the systemencoding the relative value of right areanalogous. (C) Comparison of the psy-chometric choice curve for the group(blue) and the one generated by themodel using the best-fitting parameters(black). (D) Total predicted activity (ar-bitrary units) in the comparator units(given by the sum of the instantaneouslevels of activity in both pools of neu-rons up to the response time) as a func-tion of the relative value of the twoitems and the correctness of the choice.Green, correct; red, incorrect. Error barsdenote SE.
18122 | www.pnas.org/cgi/doi/10.1073/pnas.1109322108 Hare et al.

rMC to lMC (Table S5). There was also significant negativecoupling from lMC to rMC.The coupling modulation parameters measure how the inter-
actions between regions change during specific phases of eachdecision trial. These modulation parameters represent our pri-mary measure of interest in the DCM analysis, because theyprovide a direct test of the two properties of interest of com-parator regions that might link valuation to action.The first set of modulation parameters measures coupling
changes during stimulus presentation, which coincides with theinitial valuation and comparison of the two stimuli. We foundthat the coupling from vmPFC to dmPFC [P(|coupling Δ| > 0)= 0.93] and left IPS [P(|coupling Δ| > 0) = 0.97] and right IPS[P(|coupling Δ| > 0) = 0.95] increased during this phase, whichprovides evidence in favor of the second criterion for these
three areas (Fig. 4B and Table S6). Note that this increase insignaling from vmPFC to dmPFC and IPS was independent ofthe values of the options on each trial. This finding is to beexpected, because the comparison process is necessary at alllevels of value.The second set of modulation parameters measures coupling
changes during the period from stimulus onset to response forleft and right choices separately. These parameters allowed us toestimate the posterior probabilities that the functional couplingstrength depended on the identity of the chosen action, and thus,they help to test if IPS and dmPFC satisfy the third desiredproperty. As described in Fig. 4 C and D and Tables S7 and S8,the functional coupling from dmPFC, dlPFC, and IPS to lMCand rMC was dependent on the choice. When the left action waschosen, there was positive modulation of the connections to rMC
Fig. 3. Valuation and potential comparator regions. (A)Activity in vmPFC correlated with the sum of the stimulusvalues shown on each trial (P < 0.05, small-volume cor-rected). (B and C) Activity in bilateral dmPFC (B) and bi-lateral IPS (C) correlated with the predicted levels ofactivity generated by the nDDM model at P < 0.05, whole-brain corrected.
Fig. 4. Tests of functional coupling using DCM. (A) Diagramof the pattern of fixed connections between the sevenregions in the most likely DCM model. Note that connectionsbetween dlPFC and IPS have been omitted for clarity but canbe seen in Tables S1–S3. (B) Changes in connectivity duringthe stimulus valuation period. (C) Changes in connectivityduring the period between stimulus onset and response intrials where subjects chose the left option. (D) Changes inconnectivity during the period between stimulus onset andresponse in trials where subjects chose the right option.Connections in red indicate significant positive couplingcoefficients, whereas blue indicates significant negativecoefficients. Lines in gray indicate connections with posteriorprobability less than 90%.
Hare et al. PNAS | November 1, 2011 | vol. 108 | no. 44 | 18123
NEU
ROSC
IENCE
from dmPFC [P(|coupling Δ| > 0) = 0.99], dlPFC [P(|couplingΔ| > 0) = 0.96], lIPS [P(|coupling Δ| > 0) = 0.92], and rIPS[P(|coupling Δ| > 0) = 0.97]. However, there was negative mod-ulation of the connection to lMC from dmPFC [P(|couplingΔ| > 0) = 0.97], lIPS [P(|coupling Δ| > 0) = 0.97], and rIPS[P(|coupling Δ| > 0) = 0.93]. In contrast, during the period be-tween stimulus presentation and right option selection, there waspositive modulation of the coupling to lMC from dmPFC [P(|cou-pling Δ| > 0) = 0.99], dlPFC [P(|coupling Δ| > 0) = 98%], lIPS,and rIPS [P(|coupling Δ| > 0) = 0.99, whereas there was neg-ative modulation of the connection to rMC from lIPS [P(|cou-pling Δ| > 0) = 0.96] and rIPS [P(|coupling Δ| > 0) = 0.94].There was no significant modulation in coupling between lMCand rMC at the time of button press (Table S9). Together, theselast findings provide evidence that dmPFC and IPS satisfy thethird hypothesized property of a comparator region that linksvaluation to action.
DiscussionWe have used a strategy to characterize the network involved inthe transformation of stimulus values into a motor responseduring simple choice using fMRI. We found that activity indmPFC and bilateral IPS exhibited three key properties thatareas engaged in value comparison and linking choices to actionsshould satisfy. First, activity in these areas correlated with thepredictions of a neural model of choice that approximates thecomputations of the DDM. This property is an important markerof comparator areas, because the DDM has been shown to fit thepsychometric data from binary choice tasks (including ours) ex-tremely well (24, 25). Second, our DCM analysis showed thatactivity in both areas exhibited increased functional coupling atthe time of decision with the region of vmPFC that encoded bothstimulus values, regardless of the choice that was eventuallymade. This increased coupling at the time of decision is expectedin areas that use these value signals as inputs to the actualcomparison process. Third, dmPFC and IPS exhibited choice-dependent coupling with motor cortex in a way that promotedthe observed motor responses: they increased the connectivitywith left motor cortex during right actions and with right motorcortex during left actions.Our results provide a link between the value-based and per-
ceptual decision literatures. Single-unit studies in nonhumanprimates have found activity in IPS during saccadic dot motiontasks that resembles the output of a DDM comparator process(30, 31, 45, 46). Similar results have been obtained in humanfMRI studies of perceptual decision-making (40, 41). Connec-tions between vmPFC and parietal regions are likely to bepolysynaptic. Therefore, future studies should seek to identifythe intermediate nodes connecting vmPFC and parietal cortex indecision-making. One intriguing possibility is that the dmPFCand IPS might participate in the decision-making process bycomputing decision variables in the action and spatial domains,respectively. Unfortunately, in many paradigms, including ourparadigm, the two types of decision variables are highly corre-lated and thus, are difficult to disentangle.The dmPFC is a natural area to implement a comparison pro-
cess in simple economic choice, because it is heavily inter-connected with both supplementary motor areas and areas ofvmPFC thought to be involved in valuation (33–35). Furthermore,neurons in dmPFC have been shown to reflect several differentdecision variables, making this region ideally qualified to comparedifferent options and promote the best course of action (22).Previous fMRI studies have shown that the dmPFC, dlPFC,
and parietal cortex are more active in more difficult value-baseddecisions (42, 43). Given the high correlation between difficultyand the levels of activity predicted by the nDDM model, ourresults are consistent with these findings. However, we foundthat the nDDM model provides a better fit to activity in dmPFC
and IPS, which is consistent with previous studies that have di-rectly compared measures of difficulty and value differences indmPFC (7).In summary, our results provide evidence that a neural network,
including regions of vmPFC that reflect stimulus value, compar-ator processes in dmPFC and IPS, and action effectors in motorcortex, mediates the transformation of stimulus values into motorcommands at the time of choice. This transformation process is ofcentral importance to decision neuroscience. A critical questionfor future investigations is to what extent the network identifiedhere is at work in a wide class of decisions (encompassing manydifferent stimulus types and effectors) or if, in contrast, the net-work linking stimulus valuation, value comparison, and motoraction is dependent on the parameters of the task.
Materials and MethodsParticipants. Twenty subjects (four females) participated in the experiment(mean age = 23 y, range = 19–35 y). All subjects were right-handed, werehealthy, had normal or corrected to normal vision, had no history of psy-chiatric diagnoses or neurological or metabolic illnesses, and were not tak-ing medications that interfered with the performance of fMRI. One malesubject was excluded from analysis because of irregularities in his pattern ofchoices. The review board of the California Institute of Technology approvedthe study.
Stimuli and Task. Subjects completed a juice decision task in the MRI scanner(SI Materials and Methods). At the beginning of each trial, subjects saw twodifferent flavor amount combinations—one on the left side and one on theright side of the screen (Fig. 1A). Subjects were instructed to make theirchoice while the left and right options were on the screen. After a variabledelay (3–6 s), a response prompt was shown on the screen, and the subjectpressed the right thumb to select the right option or the left thumb to selectthe left option. The chosen liquid was delivered to the subject after anothervariable delay (3–6 s). There were a total of 120 trials across the four func-tional runs. SI Materials and Methods has details of liquid reward valuecalculations.
Neural DDM. The model assumes that choices are made as follows every trial.There are two pools of neurons, which are spatially intermingled and of equalsize, with total instantaneous levels of activity given by aL(t) and aR(t), wheret indicated elapsed time from the appearance of the stimuli. At the begin-ning of the choice process, aL(0) = aR(0) = 0. A choice is made to the res-pective action when the level of activity in either of the two populationssurpasses a prespecified threshold. The evolution equations for each pop-ulation are given by (Eq. 1)
aLðtÞ ¼ maxf0; aLðt − 1Þ− θ∗ aRðt − 1Þ þ d∗ðvL − vRÞ þ ηLðtÞg [1]
and (Eq. 2)
aRðtÞ ¼ maxf0; aRðt − 1Þ− θ∗ aLðt − 1Þ þ d∗ðvR − vLÞ þ ηRðtÞg [2]
where θ measures the strength of the inhibitory activity between the twopools, d measures the sensitivity of the integration process to the underlyingtrue values of the stimuli (denoted by vL and vR), and the last term, η,measures the measures the amplitude (SD) of Gaussian noise. We assumethat the height of the barriers was fixed at ±1. Note that this normalizationis without loss of generality, because the DDM is identified only up to rel-ative values of the parameters. The psychometric curve for the best-fittingset of parameters (d = 0.009 ± 0.005, η = 0 ± 0.035, θ = 0.2) is shown in Fig.2C. Total activity in each trial predicted by the model is referred to asMout. SIMaterials and Methods has model estimation details.
The total activity shown in Fig. 2D was used as a modulator in some of theGLMs of BOLD activity described below to identify areas that might be as-sociated with the comparison process. The logic for using this variable asa marker is described. BOLD activity in any instant in the comparator areashould be proportional to the sum of local neural activity. It follows thataverage bold activity in this area from the time of stimulus onset to the timeof decision should be proportional to the average of instantaneous activi-ties. In the analyses below, we cannot modulate activity with duration equalto the reaction time, because our paradigm does not allow us to measure it.Instead, we model the activity of the comparator with an equal duration inall trials. By the previous arguments, average activity during this time shouldbe proportional to the total level of activity.
18124 | www.pnas.org/cgi/doi/10.1073/pnas.1109322108 Hare et al.
fMRI Data Acquisition and Analysis. Data were acquired with a 3T scanner(Trio; Siemens) using an eight-channel phased array head coil (details in SIMaterials and Methods). We estimated two GLMs with first-order autore-gression for each individual subject (details in SI Materials and Methods). Wethen computed contrasts of interest at the individual level using linearcombinations of the regressors. These contrast coefficients were used in one-sample t tests for second-level group analyses.
We carried out whole-brain corrections for multiple comparisons at thecluster level. Details of the correction for each contrast can be found in TablesS1–S11. Small-volume correction for the vmPFC was conducted within a 10-mm sphere centered on the vmPFC coordinates (x, y, z = −3, 42, −6) from thework by Chib et al. (16).
DCM. We examined the connectivity between stimulus value and motor re-sponse regions on left and right choice trials using DCM (47). The analysis wascarried out in several steps.
First, seven activation time courses were extracted from the functionalmasks in vmPFC, dmPFC, dlPFC, lIPS, rIPS, lMC, and rMC in each subject froma 4-mm sphere centered on the individual subject peak within the group
regions of interest identified by the main GLMs and shown in Fig. 3 and Figs.S1 and Figs. S2.
Second, we specified 20 different models of potential connectivity be-tween the seven areas of interest. A full description of the set of models isprovided in SI Materials and Methods and Tables S5–S10.
Third, we identified the best model using the Bayesian model selectionmethod developed in the work by Stephan et al. (44) (Fig. S3). Briefly, thistechnique treats the models as random variables and computes a distribu-tion of the probabilities for all models under consideration (additionaldetails in SI Materials and Methods).
Fourth, we used Bayesian parameter averaging (details in SI Materials andMethods) (48, 49) to estimate the magnitudes and probabilities of each fixedconnection (often called intrinsic connections) as well as the magnitudes andeffects with which the connections are modulated by different events.
ACKNOWLEDGMENTS. We thank the Betty and Gordon Moore Foundation(C.F.C., J.P.O., and A.R.) for financial support as well as the National ScienceFoundation (A.R.).
1. Rangel A, Hare T (2010) Neural computations associated with goal-directed choice.Curr Opin Neurobiol 20:262–270.
2. Rushworth MF, Mars RB, Summerfield C (2009) General mechanisms for making de-cisions? Curr Opin Neurobiol 19:75–83.
3. Glimcher PW, Rustichini A (2004) Neuroeconomics: The concilience of brain and de-cision. Science 306:447–452.
4. Hare TA, Camerer CF, Rangel A (2009) Self-control in decision-making involvesmodulation of the vmPFC valuation system. Science 324:646–648.
5. Hare TA, O’Doherty J, Camerer CF, Schultz W, Rangel A (2008) Dissociating the role ofthe orbitofrontal cortex and the striatum in the computation of goal values andprediction errors. J Neurosci 28:5623–5630.
6. Plassmann H, O’Doherty J, Rangel A (2007) Orbitofrontal cortex encodes willingnessto pay in everyday economic transactions. J Neurosci 27:9984–9988.
7. Wunderlich K, Rangel A, O’Doherty JP (2009) Neural computations underlying action-based decision making in the human brain. Proc Natl Acad Sci USA 106:17199–17204.
8. Rolls ET, Grabenhorst F, Parris BA (2010) Neural systems underlying decisions aboutaffective odors. J Cogn Neurosci 22:1069–1082.
9. Tom SM, Fox CR, Trepel C, Poldrack RA (2007) The neural basis of loss aversion indecision-making under risk. Science 315:515–518.
10. Hampton AN, Bossaerts P, O’Doherty JP (2006) The role of the ventromedial pre-frontal cortex in abstract state-based inference during decision making in humans. JNeurosci 26:8360–8367.
11. Levy I, Snell J, Nelson AJ, Rustichini A, Glimcher PW (2010) Neural representation ofsubjective value under risk and ambiguity. J Neurophysiol 103:1036–1047.
12. Rolls ET, McCabe C, Redoute J (2008) Expected value, reward outcome, and temporaldifference error representations in a probabilistic decision task. Cereb Cortex 18:652–663.
13. Kahnt T, Heinzle J, Park SQ, Haynes JD (2011) Decoding different roles for vmPFC anddlPFC in multi-attribute decision making. Neuroimage 56:709–715.
14. Blair K, et al. (2006) Choosing the lesser of two evils, the better of two goods:Specifying the roles of ventromedial prefrontal cortex and dorsal anterior cingulatein object choice. J Neurosci 26:11379–11386.
15. Kable JW, Glimcher PW (2007) The neural correlates of subjective value during in-tertemporal choice. Nat Neurosci 10:1625–1633.
16. Chib VS, Rangel A, Shimojo S, O’Doherty JP (2009) Evidence for a common repre-sentation of decision values for dissimilar goods in human ventromedial prefrontalcortex. J Neurosci 29:12315–12320.
17. Knutson B, Rick S, Wimmer GE, Prelec D, Loewenstein G (2007) Neural predictors ofpurchases. Neuron 53:147–156.
18. Hare TA, Camerer CF, Knoepfle DT, Rangel A (2010) Value computations in ventralmedial prefrontal cortex during charitable decision making incorporate input fromregions involved in social cognition. J Neurosci 30:583–590.
19. Smith DV, et al. (2010) Distinct value signals in anterior and posterior ventromedialprefrontal cortex. J Neurosci 30:2490–2495.
20. Padoa-Schioppa C, Assad JA (2008) The representation of economic value in the or-bitofrontal cortex is invariant for changes of menu. Nat Neurosci 11:95–102.
21. Padoa-Schioppa C, Assad JA (2006) Neurons in the orbitofrontal cortex encode eco-nomic value. Nature 441:223–226.
22. Kennerley SW, Dahmubed AF, Lara AH, Wallis JD (2009) Neurons in the frontal lobeencode the value of multiple decision variables. J Cogn Neurosci 21:1162–1178.
23. Wallis JD, Miller EK (2003) Neuronal activity in primate dorsolateral and orbitalprefrontal cortex during performance of a reward preference task. Eur J Neurosci 18:2069–2081.
24. Ratcliff R, McKoon G (2008) The diffusion decision model: Theory and data for two-choice decision tasks. Neural Comput 20:873–922.
25. Smith PL, Ratcliff R (2004) Psychology and neurobiology of simple decisions. TrendsNeurosci 27:161–168.
26. Usher M, McClelland JL (2001) The time course of perceptual choice: The leaky,competing accumulator model. Psychol Rev 108:550–592.
27. Krajbich I, Rangel A (2011) Multialternative drift-diffusion model predicts the re-lationship between visual fixations and choice in value-based decisions. Proc NatlAcad Sci USA 108:13852–13857.
28. Ditterich J (2006) Stochastic models of decisions about motion direction: Behavior andphysiology. Neural Netw 19:981–1012.
29. Bogacz R (2007) Optimal decision-making theories: Linking neurobiology with be-haviour. Trends Cogn Sci 11:118–125.
30. Gold JI, Shadlen MN (2007) The neural basis of decision making. Annu Rev Neurosci30:535–574.
31. Shadlen MN, NewsomeWT (2001) Neural basis of a perceptual decision in the parietalcortex (area LIP) of the rhesus monkey. J Neurophysiol 86:1916–1936.
32. Rowe JB, Hughes L, Nimmo-Smith I (2010) Action selection: A race model for selectedand non-selected actions distinguishes the contribution of premotor and prefrontalareas. Neuroimage 51:888–896.
33. Beckmann M, Johansen-Berg H, Rushworth MF (2009) Connectivity-based parcellationof human cingulate cortex and its relation to functional specialization. J Neurosci 29:1175–1190.
34. Picard N, Strick PL (2001) Imaging the premotor areas. Curr Opin Neurobiol 11:663–672.
35. Strick PL, Dum RP, Picard N (1998) Motor areas on the medial wall of the hemisphere.Novartis Found Symp 218:64–75.
36. Basten U, Biele G, Heekeren HR, Fiebach CJ (2010) How the brain integrates costs andbenefits during decision making. Proc Natl Acad Sci USA 107:21767–21772.
37. Rolls ET, Grabenhorst F, Deco G (2010) Choice, difficulty, and confidence in the brain.Neuroimage 53:694–706.
38. Padoa-Schioppa C (2009) Range-adapting representation of economic value in theorbitofrontal cortex. J Neurosci 29:14004–14014.
39. Heekeren HR, Marrett S, Ungerleider LG (2008) The neural systems that mediatehuman perceptual decision making. Nat Rev Neurosci 9:467–479.
40. Heekeren HR, Marrett S, Bandettini PA, Ungerleider LG (2004) A general mechanismfor perceptual decision-making in the human brain. Nature 431:859–862.
41. Heekeren HR, Marrett S, Ruff DA, Bandettini PA, Ungerleider LG (2006) Involvementof human left dorsolateral prefrontal cortex in perceptual decision making is in-dependent of response modality. Proc Natl Acad Sci USA 103:10023–10028.
42. Venkatraman V, Rosati AG, Taren AA, Huettel SA (2009) Resolving response, decision,and strategic control: Evidence for a functional topography in dorsomedial prefrontalcortex. J Neurosci 29:13158–13164.
43. Pochon JB, Riis J, Sanfey AG, Nystrom LE, Cohen JD (2008) Functional imaging ofdecision conflict. J Neurosci 28:3468–3473.
44. Stephan KE, Penny WD, Daunizeau J, Moran RJ, Friston KJ (2009) Bayesian modelselection for group studies. Neuroimage 46:1004–1017.
45. Huk AC, Shadlen MN (2005) Neural activity in macaque parietal cortex reflects tem-poral integration of visual motion signals during perceptual decision making. JNeurosci 25:10420–10436.
46. Roitman JD, Shadlen MN (2002) Response of neurons in the lateral intraparietal areaduring a combined visual discrimination reaction time task. J Neurosci 22:9475–9489.
47. Marreiros AC, Kiebel SJ, Friston KJ (2008) Dynamic causal modelling for fMRI: A two-state model. Neuroimage 39:269–278.
48. Lee PM (1989) Bayesian Statistics (Oxford University Press, New York).49. Kasess CH, et al. (2010) Multi-subject analyses with dynamic causal modeling. Neu-
roimage 49:3065–3074.
Hare et al. PNAS | November 1, 2011 | vol. 108 | no. 44 | 18125
NEU
ROSC
IENCE

Supporting InformationHare et al. 10.1073/pnas.1109322108SI ResultsTesting for Action Value Coding in Motor Cortex. Activity in bothmotor cortices increased as a function of the reward obtained bythe selected action [i.e., the left motor cortex (lMC) positivelycorrelated with the right value and the right motor cortex (rMC)positively correlated with the left value; P < 0.05, corrected](Table S11).Note, however, that lMC and rMC did not meet the criteria for
the encoding of action values (1, 2), which is defined as a signalthat encodes the value of an action regardless of whether it ischosen. Post hoc tests showed that, when the opposite responsewas chosen, lMC and rMC were not significantly correlated withright [t(18) = 1.21, not significant (n.s.)] or left values (t(18) =−0.09, n.s.), respectively.
Differences Between Neural Drift Diffusion Model Predictions of TotalActivity in Comparator Regions and Difficulty Measures. Althoughthese two measures are highly correlated, there are two importantdifferences between them, which allows us to test which of the twoparametric regressors fits better with the patterns of activity foundin areas like dorsal medial prefrontal cortex (dmPFC) andintraparietal sulcus (IPS).First, our neural drift diffusion model (nDDM) model predicts
greater activity in comparator regions during error than correcttrials (Fig. 2D), whereas the measure of difficulty does not dif-ferentiate between the two trial types. Here, we define an errortrial as one in which the liquid of lower value is chosen. Thisgreater activity in error than correct trials arises as a function ofthe noise and mutual inhibition parameters of the nDDMmodel.Second, the difficulty measure is a simple linear function of the
difference in values, whereas the activity predicted by the nDDMis monotonically related to the difference in values but notperfectly linear (Fig. 2D). This nonlinearity is present even whenconsidering correct and error trials separately.Motivated by these differences, we carried out a post hoc
Bayesian model selection (3) in dmPFC, dorsolateral prefrontalcortex (dlPFC), and IPS to test whether the total activity measurefrom the nDDM or the difficulty measure best explained activityin these regions. We used the exceedance probability (EP; theprobability that a given model is more likely than any othermodel in the comparison set given the group data) as our metricfor model comparison. The EP of the nDDM model was greaterthan the difficulty model in all four regions (dmPFC EP = 0.99,dlPFC EP = 0.58, lIPS EP = 0.98, and rIPS EP = 0.94), in-dicating that the nDDM provided a better fit to activity in theseareas than the difficulty measure, especially in dmPFC and IPS.We ran an additional model comparison to determine whether
the nDDM predictions were a better fit to blood oxygen level-dependent (BOLD) signals in dmPFC and IPS than difficulty,even when the distinction between correct and error trials wasremoved from the parametric regressor. To create this regressor,we assigned the parametric value of all trials as if they werecorrect. The all correct nDDMparametric regressor fit the BOLDsignal better than difficulty (EP > 90%) in all regions of interest.However, the original nDDM regressor is also more likely thanthe all correct nDDM regressor (EP > 90%) in all regions ofinterest, indicating that both the shape of the curve and sepa-ration between correct and error trials are important factors inthe fit to the BOLD signal.There is also a previous body of literature suggesting that activity
in the ventral parts of dmPFC, particularly in the anterior cingulatecortex (ACC), plays a role in resolving response conflict and error
monitoring in a variety of tasks (4, 5). Although our results are notfundamentally incompatible with a role for ACC in error moni-toring or response conflict in other paradigms, neither role is likelyto explain the dmPFC activity in the current study. There areseveral reasons for this finding. First, the area of dmPFC identifiedhere is more dorsal than the areas of ACC that have generallybeen associated with these alternative signals in previous studies.Second, response conflict in our paradigm would be the same asthe choice difficulty measure discussed above. Third, error mon-itoring is also an unlikely function for dmPFC in our experiment,because we see the dmPFC become active well before the re-sponse (potentially an error) has been made.
SI Materials and MethodsAdditional Stimuli and Task Details. Subjects abstained from allliquids for 3 h before the experiment. Before entering the scanner,subjects were asked to consume three saltine crackers to increasetheir level of thirst and were also given one saltine cracker to eatbetween the four functional runs to maintain thirst. Thirst ratingswere obtained before each functional run to confirm that subjectsremained thirsty throughout the task. A different colored shaperepresented each flavor (apple, grape, fruit punch, and water),with the number of shapes on the screen indicating the amount ofliquid (1 = 0.2 mL, 2 = 0.45 mL, or 3 = 0.7 mL). If the subjectfailed to respond within 1.5 s after the response prompt appeared,an option was selected at random. Stimulus presentation, res-ponse recording, and liquid delivery were controlled using Cogent2000 software (Wellcome Department of Imaging Neuroscience).
Liquid Delivery. Electronic syringe pumps located in the scanningcontrol room delivered each liquid to the subject through ∼10 mpolyethylene tubing and a perfusion manifold. The perfusionmanifold allowed four incoming tubes to be connected to oneoutput tube with a minimum of dead space to avoid mixing theliquids. The subjects held the output tube between their lips likea straw while lying in the supine position inside the MRI scanner.Visual stimuli were presented using an overhead mirror andprojection system.
Value of Liquid Rewards. We determined the subjective value ofeach liquid reward option using the individual’s pattern ofchoices. The value of each flavor–amount combination was cal-culated using the equation V= F × A, where V is the value of theoption, F is the frequency with which that flavor was selectedregardless of the amount offered, and A is the amount of liquidoffered. All of the other value signals used in the analysis werederived from this basic calculation. In particular, the stimulivalue (SV) for each trial was equal to the sum of the values forthe available options (left value + right value). Action value left(right) was equal to the left (right) value. Chosen value (CV) wasequal to the value of the chosen option, whereas nonchosenvalue (NCV) was equal to the value of the nonchosen option.
nDDM Estimation Procedure. The nDDM model assumes that thecomparator system contains two identical pools of neurons: oneencoding the relative value signal for left (i.e., value of left minusvalue of right) and one encoding the relative value signal for right(i.e., valueof rightminus valueof left).Themodel alsoassumes thatactivity in eachof thepools commences at a zero level and that eachof them changes after a GaussianMarkovian process similar to theone for theDDM,except that they are not allowed to go below zeroat anypoint during thedecisionprocess. Finally, themodel assumes
Hare et al. www.pnas.org/cgi/content/short/1109322108 1 of 11
that a choice is made in favor of its respective option when one ofthe two pools reaches a prespecified threshold level of activity andthat the two pools dynamically inhibit each other.We calibrated the model to the psychometric group choice data
by simulating the model 5,000 times with different parameter setsand selecting the parameters that maximized the fit between thesimulated and actual choice curves. Maximal fit was evaluatedusing a sum of square deviations criterion, including a weightingterm for each level of jVL − VRj that was inversely proportional toits frequency in the dataset. This calculation was done bysearching among combinations of the following free parameters:mean and SD of the integration slope (d), SD of the Gaussiannoise (η), and inhibition strength (θ). The psychometric curve forthe best-fitting set of parameters (d = 0.009 ± 0.005, η = 0 ±0.035, θ = 0.2) is shown in Fig. 2C. We used the group choicedata, because it leads to less noisy choice curves and therefore,generated more reliable estimates of the parameters of thenDDM.We then used this set of parameters to estimate the dis-
tributions of total activity in both pools of comparator neurons bysimulating the model 5,000 times for each combination of valuedifferences. Total activity is defined to be as the sum of in-stantaneous levels of activity in both pools of neurons fromstimulus onset to choice. Fig. 2D depicts summary statistics forthe resulting distributions for both correct and error trials. Thevalue of total activity in each trial predicted by the model isreferred to as Mout.We note one caveat to applying the nDDM to this dataset.
Ideally, the experiment would have had free reaction times, whichwould have helped us to estimate the nDDM parameters moreprecisely, because the model makes predictions for both theaccuracy and reaction time of choices. Because reaction time dataare not available in our design, we fitted the nDDMusing only thechoice data. The lack of reaction time data likely introduces noisein our parameter estimates for the model and thus, reduces ourability to identify comparator regions using fMRI, but it does notintroduce any systematic biases in our analyses.
Functional MRI Data Acquisition. The functional imaging was con-ducted using a Siemens 3.0 Tesla Trio MRI scanner. We acquiredgradient echo T2*-weighted echoplanar images (EPIs) withBOLD contrast. To optimize functional sensitivity in the orbito-frontal cortex (OFC), we used a tilted acquisition in an obliqueorientation of 30° to the anterior commissure–posterior commis-sure line (6). In addition, we used an eight-channel phased arraycoil that yields a 40% signal increase in signal in the OFC overa standard head coil. Each volume comprised 48 axial slices col-lected in an interleaved-ascending manner. Data were collected infour sessions (209 volumes, ∼11 min). The imaging parameterswere echo time, 30 ms; field of view, 192 mm; in-plane resolutionand slice thickness, 3 mm; repetition time, 3 s. Whole-brain, high-resolution T1-weighted structural scans (1 × 1 × 1 mm) were ac-quired from the 20 subjects and coregistered with their mean EPIimages; they were averaged together to permit anatomical locali-zation of the functional activations at the group level.
Functional MRI Data Preprocessing. Image analysis was performedusing SPM8 (Wellcome Department of Imaging Neuroscience).Images were corrected for slice acquisition time within eachvolume, motion-corrected, spatially normalized to the standardMontreal Neurological Institute EPI template, and spatiallysmoothed using a Gaussian kernel with a full width at one-halfmaximum of 8 mm. Intensity normalization and high-pass tem-poral filtering (using a filter width of 128 s) were also applied tothe data.
General Linear Models. We estimated the following general linearmodel of BOLD responses to identify regions reflecting stimulus
values, action values, and motor responses. This process was donein three steps.First, for each individual, we estimated a general linear model
(GLM) with first-order autoregression and the following nineindicator functions: R1, initial stimulus screen; R2, choice re-sponse period (CR); R3, left button press; R4, right button press;R5, juice delivery; R6–9, presence of each preference rankedjuice (based on each subject’s choices) on the stimulus screen.The stimulus screen, juice delivery, and preference ranked in-dicators were modeled as events with 1-s durations. The CRperiod was modeled as an event with duration equal to theelapsed time between the onset of the choice screen and thebutton press on that trial (5–9.5 s). Left and right button presseswere modeled with durations equal to the reaction time asmeasured by the time elapsed between the appearance of theresponse screen and the button press. In addition to the nineindicator functions, the model included four parametric re-gressors: (i) choice screen × SV, (ii) CR × left V, (iii) CR × rightV, and (iv) juice delivery × CV. The model also included sessionconstants and motion parameters as regressors of no interest.Second, we calculated first-level, single-subject contrasts for
each of the four parametric regressors listed above.Third, we calculated second-level group contrasts using one-
sample t tests on the single-subject contrasts. We carried outwhole-brain corrections for multiple comparisons at the clusterlevel. Details of the correction for each contrast can be found inTables S1–S11. Small-volume correction for the ventromedialprefrontal cortex (vmPFC) was conducted within a 10-mmsphere centered on the vmPFC coordinates (x, y, z = −3, 42, −6)from the work by Chib et al. (7).We estimated a second GLM to identify regions reflecting the
output of our nDDM model. This model included the same in-dicator functions as the first GLM and the following parametricregressors: (i) choice screen × SV, (ii) CR × Mout, and (iii) juicedelivery × CV. All omitted details are as detailed.
Post Hoc Analyses.To determine if stimulus location (left vs. right),choice (chosen vs. nonchosen), or identity (liquid 1–4) affected itsassociation with vmPFC activity, we computed three additionalGLMs. All of these GLMs included the same three indicatorfunctions of (R1) choice screen, (R2) response screen, and (R3)juice delivery. The location model included parametric modu-lators for left V and right V for each indicator function. Thechoice model included parametric modulators for CV and NCVfor each indicator function. There was little correlation betweenleft value and right value (mean r = −0.187) or CV and NCV(mean r = 0.183). The identity model included parametricmodulators for the value of each liquid for each indicatorfunction. Liquid values were set to zero on trials where they werenot offered.First-level, single-subject contrasts were created for the para-
metric modulators left V, right V, chosen V, nonchosen V, andthe value of each liquid at the time of choice screen onset. Thesesingle-subject contrast values were then averaged across allvoxels shown in Fig. 3A and compared using paired t tests.To test whether activity in dmPFC, dlPFC, and Par was more
associated withMout or difficulty (jleft V − right Vj), we estimatedan additional GLM. This GLM was identical to the second GLMexcept that the parametric modulator for Mout from the previousmodel was replaced with jleft V − right Vj.Post Hoc Comparison of Fits for nDDM and Difficulty GLMs. Wecreated functional masks in dmPFC, dlPFC, and left and right Parfrom all voxels in those regions correlating withMout and difficulty(conjunction threshold P < 0.005, uncorrected for each contrast).Next, we reestimated both GLMs using the Bayesian first-levelestimation techniques incorporated into SPM8 and previouslydescribed in detail in the work by Penny et al. (8). Last, we used
Hare et al. www.pnas.org/cgi/content/short/1109322108 2 of 11
a random effects Bayesian model selection procedure to de-termine exceedance probabilities that indicated whether theMoutor difficulty models provided a better fit to the data in each ofthe three regions. A brief description of this method is given inMaterials and Methods on dynamic causal modeling, and addi-tional details can be found in two recent papers (3, 9).
Dynamic Causal Modeling Description. For all 20 models tested, thedriving inputs to all regions were assigned based on the resultsfrom the univariate GLMs and were not mean-centered (i.e., thefixed coupling parameters represent connectivity in the absence oftask stimulation). Those inputs included five inputs: (i) an inputof constant magnitude into vmPFC and dlPFC during stimuluspresentation, (ii) an input to vmPFC during stimulus pre-sentation proportional to the sum of the stimulus values, (iii) aninput into dmPFC, dlPFC, and bilateral IPS of constant magni-tude during the period from stimulus onset to button press forleft choices, (iv) an input into dmPFC, dlPFC, and bilateral IPSof constant unit magnitude during the period from stimulusonset to button press for right choices, and (v) an input ofconstant value into lMC and rMC at the time of response. Pa-rameter estimates for the inputs to each region are shown inTable S10. In addition, all of the models allowed for the fol-lowing event-related changes in coupling strength: (i) the cou-pling from vmPFC to dmPFC, dlPFC, and parietal cortex wasallowed to be influenced by the onset of the stimulus screen(unmodulated), (ii and iii) left and right CR periods were al-lowed to modulate coupling in all existing connections, and (iv)button presses were allowed to modulate self-connections inlMC and rMC. To carry out these analyses, we estimated anadditional GLM that was identical to the first GLM described inMaterials and Methods except that the CR period was separatedinto right and left choice trials, the choice screen was modeledwith an indicator function of 2-s duration, and the indicators foreach preference-ranked juice were omitted.
Bayesian Model Selection for Dynamic Causal Modeling. We identi-fied the best model using the Bayesian model selection methoddeveloped by Stephan et al. (3). Briefly, this technique treats themodels as random variables and computes a distribution of theprobabilities for all models under consideration. The probabili-ties can be used to define a multinomial distribution over modelspace from which the likelihood that a specific model generatedthe data of a randomly selected subject can be estimated. Thisprocedure permits the computation of the exceedance proba-bility for each model in the comparison set, which measures theprobability that each model is the most likely one to be correct.Note that the exceedance probabilities add to one over thecomparison set and thus, generally decrease as the number ofmodels considered increases. We posited 20 different models ofconnectivity involving the seven areas identified above (vmPFC,
dmPFC, dlPFC, lMC, rMC, lIPS, and rIPS) and used a Bayesianmodel selection process to identify the most probable model inthe set (Fig. S3). The set of alternative models is described indetail in Tables S5–S10. We specified a large set of models,because given existing data, we did not have strong priors aboutthe exact pattern of connectivity in the network. The set ofmodels considered included the model depicted in Fig. 4 andmost variations where vmPFC, dlPFC, and IPS are disconnectedfrom sets of one or two other regions, including motor cortex.
Bayesian Parameter Averaging. Here, we present the equationsunderlying the Bayesian parameter averaging method that weused to make inferences about the modulatory dynamic causalmodeling parameters at the group level. As stated in the work byKasess et al. (10) and in other works (11, 12), this proceduretreats the posterior distribution for one subject as the prior forthe next subject. The process continues up to the nth subject,resulting in the following expression (S1):
pðθjy1; . . . ; yNÞ∝ pðθÞ∏N
i¼1pð yijθÞ
∝ pðθjy1Þ∏N
i¼2pðyijθÞ
∝ pðθjy1; . . . ; yN − 1Þ ∏N
i¼Npð yijθÞ
[S1]
Under Gaussian assumptions about the densities, which is thecase in dynamic causal modeling, the procedure can be simplifiedusing a reduced form, where subject-specific conditional param-eter densities are weighted by their precision and summed acrosssubjects (Eq. S2):
μ ¼ Λ− 1XN
i¼1
Λiμi [S2]
and (Eq. S3)
Λ ¼XN
i¼1
Λi [S3]
where μi is the posterior mean of the ith subject and ΛI = Σi−1 is
the inverse posterior covariance or precision matrix. The matrixΛ represents not only the precisions of the model parameters (onthe diagonal) but also the interdependence of the parameters(off-diagonal elements). The incorporation of the within subjectsestimation precision is an advantage of Bayesian parameter av-eraging over frequentist approaches (e.g., one-sample t test) thatdo not include any measure of within subject variance.
1. Lau B, Glimcher PW (2008) Value representations in the primate striatum duringmatching behavior. Neuron 58:451e463.
2. Wunderlich K, Rangel A, O’Doherty JP (2009) Neural computations underlyingaction-based decision making in the human brain. Proc Natl Acad Sci USA 106:17199e17204.
3. Stephan KE, Penny WD, Daunizeau J, Moran RJ, Friston KJ (2009) Bayesian modelselection for group studies. Neuroimage 46:1004e1017.
4. Botvinick MM (2007) Conflict monitoring and decision making: Reconciling twoperspectives on anterior cingulate function. Cogn Affect Behav Neurosci 7:356e366.
5. Carter CS, van Veen V (2007) Anterior cingulate cortex and conflict detection: Anupdate of theory and data. Cogn Affect Behav Neurosci 7:367e379.
6. Deichmann R, Gottfried JA, Hutton C, Turner R (2003) Optimized EPI for fMRI studiesof the orbitofrontal cortex. Neuroimage 19:430e441.
7. Chib VS, Rangel A, Shimojo S, O’Doherty JP (2009) Evidence for a commonrepresentation of decision values for dissimilar goods in human ventromedial pre-frontal cortex. J Neurosci 29:12315e12320.
8. Penny WD, Trujillo-Barreto NJ, Friston KJ (2005) Bayesian fMRI time series analysiswith spatial priors. Neuroimage 24:350e362.
9. Rosa MJ, Bestmann S, Harrison L, Penny W (2010) Bayesian model selection maps forgroup studies. Neuroimage 49:217e224.
10. Kasess CH, et al. (2010) Multi-subject analyses with dynamic causal modeling.Neuroimage 49:3065e3074.
11. Neumann J, Lohmann G (2003) Bayesian second-level analysis of functional magneticresonance images. Neuroimage 20:1346e1355.
12. Garrido MI, Kilner JM, Kiebel SJ, Stephan KE, Friston KJ (2007) Dynamic causalmodelling of evoked potentials: A reproducibility study. Neuroimage 36:571e580.
Hare et al. www.pnas.org/cgi/content/short/1109322108 3 of 11

Fig. S1. Motor regions associated with left and right action selection. (A) Activity in the left motor cortex was greater when selecting the right juice rewardwith the right thumb than when selecting the left juice reward with the left thumb (P < 0.05, whole-brain corrected). (B) Activity in the right motor cortex wasgreater when selecting the left juice reward with the left thumb than when selecting the right juice reward with the right thumb (P < 0.05, whole-braincorrected).
Fig. S2. Area of left dlPFC in which activity was also correlated with the predicted levels of activity generated by the nDDM at P < 0.05, whole-brain corrected.
Fig. S3. Exceedance probabilities for the 20 alternative connectivity models. This measure represents the probability that each model is the most likely one tobe correct among the set of models tested. The numbers on the x axis correspond to the numbering of the models in Table S4. The most probable model(dynamic causal model 1) is shown in Fig. 4 and Tables S5–S10.
Hare et al. www.pnas.org/cgi/content/short/1109322108 4 of 11
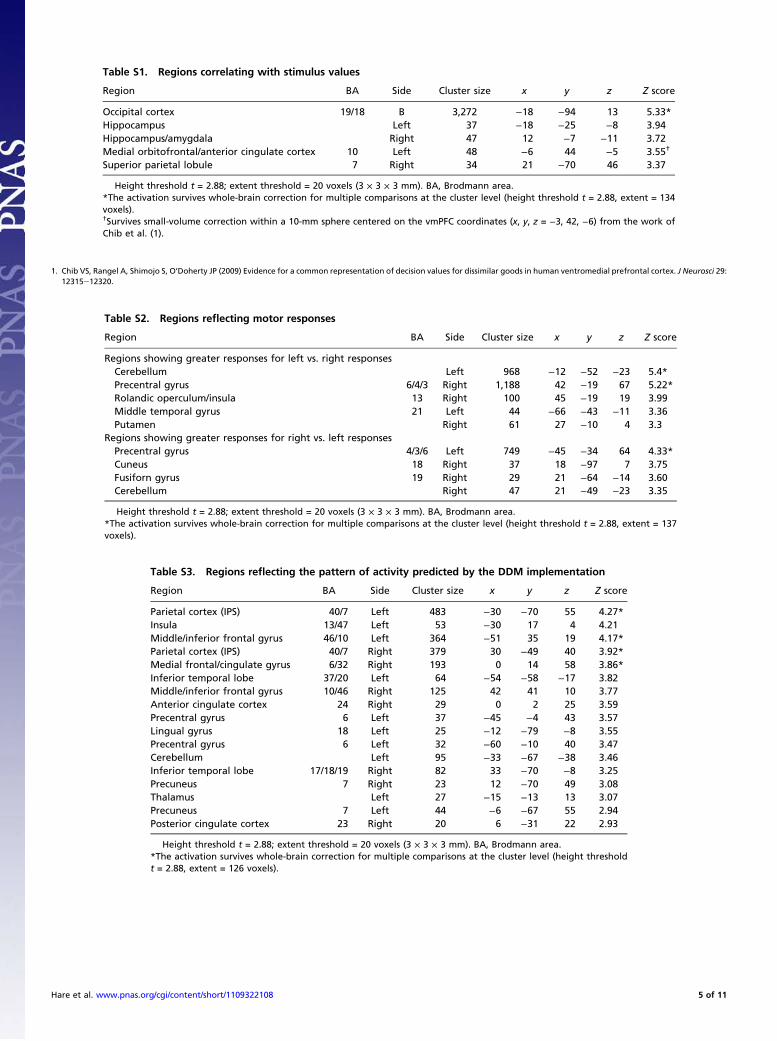
Table S1. Regions correlating with stimulus values
Region BA Side Cluster size x y z Z score
Occipital cortex 19/18 B 3,272 −18 −94 13 5.33*Hippocampus Left 37 −18 −25 −8 3.94Hippocampus/amygdala Right 47 12 −7 −11 3.72Medial orbitofrontal/anterior cingulate cortex 10 Left 48 −6 44 −5 3.55†
Superior parietal lobule 7 Right 34 21 −70 46 3.37
Height threshold t = 2.88; extent threshold = 20 voxels (3 × 3 × 3 mm). BA, Brodmann area.*The activation survives whole-brain correction for multiple comparisons at the cluster level (height threshold t = 2.88, extent = 134voxels).†Survives small-volume correction within a 10-mm sphere centered on the vmPFC coordinates (x, y, z = −3, 42, −6) from the work ofChib et al. (1).
Table S2. Regions reflecting motor responses
Region BA Side Cluster size x y z Z score
Regions showing greater responses for left vs. right responsesCerebellum Left 968 −12 −52 −23 5.4*Precentral gyrus 6/4/3 Right 1,188 42 −19 67 5.22*Rolandic operculum/insula 13 Right 100 45 −19 19 3.99Middle temporal gyrus 21 Left 44 −66 −43 −11 3.36Putamen Right 61 27 −10 4 3.3
Regions showing greater responses for right vs. left responsesPrecentral gyrus 4/3/6 Left 749 −45 −34 64 4.33*Cuneus 18 Right 37 18 −97 7 3.75Fusiforn gyrus 19 Right 29 21 −64 −14 3.60Cerebellum Right 47 21 −49 −23 3.35
Height threshold t = 2.88; extent threshold = 20 voxels (3 × 3 × 3 mm). BA, Brodmann area.*The activation survives whole-brain correction for multiple comparisons at the cluster level (height threshold t = 2.88, extent = 137voxels).
Table S3. Regions reflecting the pattern of activity predicted by the DDM implementation
Region BA Side Cluster size x y z Z score
Parietal cortex (IPS) 40/7 Left 483 −30 −70 55 4.27*Insula 13/47 Left 53 −30 17 4 4.21Middle/inferior frontal gyrus 46/10 Left 364 −51 35 19 4.17*Parietal cortex (IPS) 40/7 Right 379 30 −49 40 3.92*Medial frontal/cingulate gyrus 6/32 Right 193 0 14 58 3.86*Inferior temporal lobe 37/20 Left 64 −54 −58 −17 3.82Middle/inferior frontal gyrus 10/46 Right 125 42 41 10 3.77Anterior cingulate cortex 24 Right 29 0 2 25 3.59Precentral gyrus 6 Left 37 −45 −4 43 3.57Lingual gyrus 18 Left 25 −12 −79 −8 3.55Precentral gyrus 6 Left 32 −60 −10 40 3.47Cerebellum Left 95 −33 −67 −38 3.46Inferior temporal lobe 17/18/19 Right 82 33 −70 −8 3.25Precuneus 7 Right 23 12 −70 49 3.08Thalamus Left 27 −15 −13 13 3.07Precuneus 7 Left 44 −6 −67 55 2.94Posterior cingulate cortex 23 Right 20 6 −31 22 2.93
Height threshold t = 2.88; extent threshold = 20 voxels (3 × 3 × 3 mm). BA, Brodmann area.*The activation survives whole-brain correction for multiple comparisons at the cluster level (height thresholdt = 2.88, extent = 126 voxels).
1. Chib VS, Rangel A, Shimojo S, O’Doherty JP (2009) Evidence for a common representation of decision values for dissimilar goods in human ventromedial prefrontal cortex. J Neurosci 29:12315e12320.
Hare et al. www.pnas.org/cgi/content/short/1109322108 5 of 11

Table S4. Alternative dynamic causal models tested
Region vmPFC ⇒ dmPFC ⇒ lIPS ⇒ rIPS ⇒ dlPFC ⇒ lMC ⇒ rMC ⇒
DCM 1vmPFC 1 1 1 1 1 0 0dmPFC 1 1 1 1 1 0 0lIPS 1 1 1 1 1 0 0rIPS 1 1 1 1 1 0 0dlPFC 1 1 1 1 1 0 0lMC 0 1 1 1 1 1 1rMC 0 1 1 1 1 1 1
DCM 2vmPFC 1 0 1 1 1 0 0dmPFC 0 1 1 1 1 0 0lIPS 1 1 1 1 1 0 0rIPS 1 1 1 1 1 0 0dlPFC 1 1 1 1 1 0 0lMC 0 1 1 1 1 1 1rMC 0 1 1 1 1 1 1
DCM 3vmPFC 1 1 0 0 1 0 0dmPFC 1 1 1 1 1 0 0lIPS 0 1 1 1 1 0 0rIPS 0 1 1 1 1 0 0dlPFC 1 1 1 1 1 0 0lMC 0 1 1 1 1 1 1rMC 0 1 1 1 1 1 1
DCM 4vmPFC 1 1 1 1 0 0 0dmPFC 1 1 1 1 1 0 0lIPS 1 1 1 1 1 0 0rIPS 1 1 1 1 1 0 0dlPFC 0 1 1 1 1 0 0lMC 0 1 1 1 1 1 1rMC 0 1 1 1 1 1 1
DCM 5vmPFC 1 1 0 0 0 0 0dmPFC 1 1 1 1 1 0 0lIPS 0 1 1 1 1 0 0rIPS 0 1 1 1 1 0 0dlPFC 0 1 1 1 1 0 0lMC 0 1 1 1 1 1 1rMC 0 1 1 1 1 1 1
DCM 6vmPFC 1 1 1 1 1 0 0dmPFC 1 1 0 0 1 0 0lIPS 1 0 1 1 1 0 0rIPS 1 0 1 1 1 0 0dlPFC 1 1 1 1 1 0 0lMC 0 1 1 1 1 1 1rMC 0 1 1 1 1 1 1
DCM 7vmPFC 1 1 1 1 1 0 0dmPFC 1 1 0 0 1 0 0lIPS 1 1 1 1 1 0 0rIPS 1 1 1 1 1 0 0dlPFC 1 1 1 1 1 0 0lMC 0 1 1 1 1 1 1rMC 0 1 1 1 1 1 1
DCM 8vmPFC 1 1 1 1 1 0 0dmPFC 1 1 1 1 0 0 0lIPS 1 1 1 1 1 0 0rIPS 1 1 1 1 1 0 0dlPFC 1 0 1 1 1 0 0lMC 0 1 1 1 1 1 1
Hare et al. www.pnas.org/cgi/content/short/1109322108 6 of 11
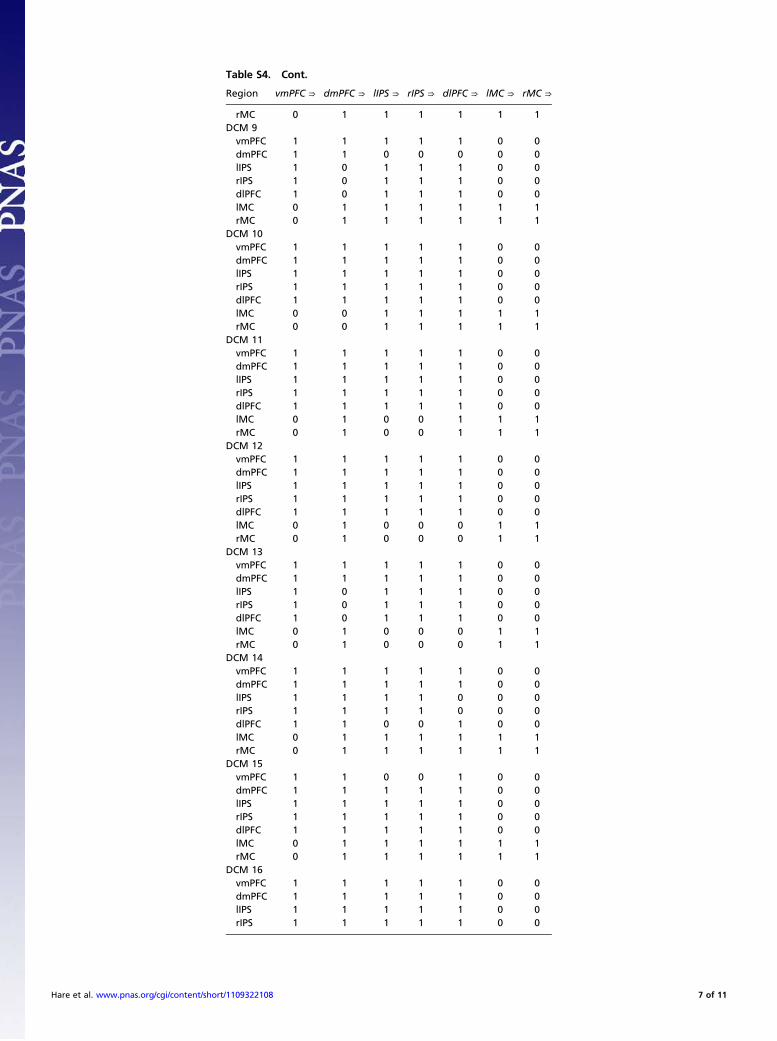
Table S4. Cont.
Region vmPFC ⇒ dmPFC ⇒ lIPS ⇒ rIPS ⇒ dlPFC ⇒ lMC ⇒ rMC ⇒
rMC 0 1 1 1 1 1 1DCM 9
vmPFC 1 1 1 1 1 0 0dmPFC 1 1 0 0 0 0 0lIPS 1 0 1 1 1 0 0rIPS 1 0 1 1 1 0 0dlPFC 1 0 1 1 1 0 0lMC 0 1 1 1 1 1 1rMC 0 1 1 1 1 1 1
DCM 10vmPFC 1 1 1 1 1 0 0dmPFC 1 1 1 1 1 0 0lIPS 1 1 1 1 1 0 0rIPS 1 1 1 1 1 0 0dlPFC 1 1 1 1 1 0 0lMC 0 0 1 1 1 1 1rMC 0 0 1 1 1 1 1
DCM 11vmPFC 1 1 1 1 1 0 0dmPFC 1 1 1 1 1 0 0lIPS 1 1 1 1 1 0 0rIPS 1 1 1 1 1 0 0dlPFC 1 1 1 1 1 0 0lMC 0 1 0 0 1 1 1rMC 0 1 0 0 1 1 1
DCM 12vmPFC 1 1 1 1 1 0 0dmPFC 1 1 1 1 1 0 0lIPS 1 1 1 1 1 0 0rIPS 1 1 1 1 1 0 0dlPFC 1 1 1 1 1 0 0lMC 0 1 0 0 0 1 1rMC 0 1 0 0 0 1 1
DCM 13vmPFC 1 1 1 1 1 0 0dmPFC 1 1 1 1 1 0 0lIPS 1 0 1 1 1 0 0rIPS 1 0 1 1 1 0 0dlPFC 1 0 1 1 1 0 0lMC 0 1 0 0 0 1 1rMC 0 1 0 0 0 1 1
DCM 14vmPFC 1 1 1 1 1 0 0dmPFC 1 1 1 1 1 0 0lIPS 1 1 1 1 0 0 0rIPS 1 1 1 1 0 0 0dlPFC 1 1 0 0 1 0 0lMC 0 1 1 1 1 1 1rMC 0 1 1 1 1 1 1
DCM 15vmPFC 1 1 0 0 1 0 0dmPFC 1 1 1 1 1 0 0lIPS 1 1 1 1 1 0 0rIPS 1 1 1 1 1 0 0dlPFC 1 1 1 1 1 0 0lMC 0 1 1 1 1 1 1rMC 0 1 1 1 1 1 1
DCM 16vmPFC 1 1 1 1 1 0 0dmPFC 1 1 1 1 1 0 0lIPS 1 1 1 1 1 0 0rIPS 1 1 1 1 1 0 0
Hare et al. www.pnas.org/cgi/content/short/1109322108 7 of 11

Table S4. Cont.
Region vmPFC ⇒ dmPFC ⇒ lIPS ⇒ rIPS ⇒ dlPFC ⇒ lMC ⇒ rMC ⇒
dlPFC 1 1 1 1 1 0 0lMC 0 1 0 1 1 1 1rMC 0 1 1 0 1 1 1
DCM 17vmPFC 1 1 1 1 1 0 0dmPFC 1 1 1 1 1 0 0lIPS 1 1 1 1 1 0 0rIPS 1 1 1 1 1 0 0dlPFC 1 1 1 1 1 0 0lMC 0 1 1 1 0 1 1rMC 0 1 1 1 0 1 1
DCM 18vmPFC 1 1 1 1 1 0 0dmPFC 1 1 1 1 1 0 0lIPS 1 1 1 1 0 0 0rIPS 1 1 1 1 0 0 0dlPFC 1 1 1 1 1 0 0lMC 0 1 1 1 1 1 1rMC 0 1 1 1 1 1 1
DCM 19vmPFC 1 1 1 1 1 0 0dmPFC 1 1 1 1 1 0 0lIPS 1 1 1 1 1 0 0rIPS 1 1 1 1 1 0 0dlPFC 1 1 1 1 1 0 0lMC 0 0 0 0 1 1 1rMC 0 0 0 0 1 1 1
DCM 20vmPFC 1 1 1 1 1 0 0dmPFC 1 1 0 0 0 0 0lIPS 1 0 1 0 0 0 0rIPS 1 0 0 1 0 0 0dlPFC 1 0 0 0 0 0 0lMC 0 1 1 1 1 1 1rMC 0 1 1 1 1 1 1
Connection directionality moves from columns to rows as the arrows in-dicate. Existing connections are represented by ones, whereas zeros indicateno connection between regions. DCM, dynamic causal modeling.
Hare et al. www.pnas.org/cgi/content/short/1109322108 8 of 11

Table
S5.
Fixe
dco
uplin
gparam
etersforthemost
likelydyn
amic
causalmodel
vmPF
C⇒
dmPF
C⇒
lIPS⇒
rIPS
⇒dlPFC
⇒lM
C⇒
rMC⇒
vmPF
C−1
0.05
(σ2=0.19
e−3;
P c=1)
0.06
(σ2=0.18
e−3;
P c=1)
0.04
(σ2=0.18
e−3;
P c=1)
0.03
(σ2=0.19
e−3;
P c=0.99
)—
—
dmPF
C0.03
(σ2=0.18
e−3;
P c=0.99
)−1
0.05
(σ2=0.16
e−3;
P c=1)
0.02
(σ2=0.16
e−3;
P c=0.96
)0.03
(σ2=0.18
e−3;
P c=0.98
)—
—
lIPS
0.03
(σ2=0.18
e−3;
P c=0.99
)0.01
(σ2=0.18
e−3;
P c=0.8)
−1
0.01
(σ2=0.17
e−3;
P c=0.84
)0.03
(σ2=0.18
e−3;
P c=0.98
)—
—
rIPS
0.03
(σ2=0.18
e−3;
P c=0.98
)0.02
(σ2=0.18
e−3;
P c=0.96
)0.05
(σ2=0.17
e−3;
P c=1)
−1
0.02
(σ2=0.18
e−3;
P c=0.96
)—
—
dlPFC
0.02
(σ2=0.17
e−3;
P c=0.89
)0.02
(σ2=0.18
e−3;
P c=0.95
)0.03
(σ2=0.16
e−3;
P c=0.98
)0(σ
2=0.17
e−3;
P c=0.61
)−1
——
lMC
—0.02
(σ2=0.19
e−3;
P c=0.91
)0.03
(σ2=0.18
e−3;
P c=0.97
)0.02
(σ2=0.17
e−3;
P c=0.93
)0.02
(σ2=0.19
e−3;
P c=0.93
)−1
−0.01
(σ2=0.18
e−3;
P c=0.79
)rM
C—
0.04
(σ2=0.18
e−3;
P c=1)
−0.01
(σ2=0.18
e−3;
P c=0.65
)0(σ
2=0.17
e−3;
P c=0.56
)0.03
(σ2=0.19
e−3;
P c=0.98
)−0.02
(σ2=0.18
e−3;
P c=0.94
)−1
Each
cellprovides
statistics
fortheco
nnectionfrom
theco
lumnarea
totherow
area
.σ2,sample
varian
ce;P,
probab
ility
that
thespecified
inputdrive
sactivity
inthegiven
region;P c,probab
ility
that
the
absolute
valueoftheco
uplin
gparam
eter
isgreater
than
zero
[note
that
theab
solute
mag
nitudeofco
uplin
gparam
etersisrelative
tothedrivinginputs
andwill
chan
gebased
onthescaleofan
yparam
etric
modulator(e.g.,stim
ulusva
lue)
usedas
adrivinginputto
themodel];P m
,probab
ility
that
theco
uplin
gparam
eter
ismodulatedbytask
condition.T
heeffect
size
fortheseparam
etersshould
beev
aluated
relative
tothemag
nitudeofthefixe
dco
uplin
gparam
eters.
Parameterswithaposteriorprobab
ility
greater
than
90%
areshownin
bold.Allva
lues
arerounded
totw
odecim
als.
Table
S6.
Modulationofco
uplin
gparam
etersat
initialoptionspresentation
vmPF
C⇒
dmPF
C⇒
lIPS⇒
rIPS
⇒dlPFC
⇒lM
C⇒
rMC⇒
vmPF
C0.02
(σ2=0.2e
−3;P m
=0.93
)0(σ
2=0.2e
−3;
P m=0.62
)0(σ
2=0.2e
−3;
P m=0.63
)0(σ
2=0.2e
−3;
P m=0.57
)0(σ
2=0.2e
−3;
P m=0.63
)—
—
dmPF
C0.02
(σ2=0.19
e−3;
P m=0.93
)0.01
(σ2=0.2e
−3;
P m=0.77
)0(σ
2=0.2e
−3;
P m=0.57
)0(σ
2=0.2e
−3;
P m=0.51
)0.01
(σ2=0.2e
−3;
P m=0.79
)—
—
lIPS
0.03
(σ2=0.19
e−3;
P m=0.97
)0(σ
2=0.2e
−3;
P m=0.51
)0.02
(σ2=0.2e
−3;
P m=0.89
)0.01
(σ2=0.2e
−3;
P m=0.71
)0.01
(σ2=0.2e
−3;
P m=0.8)
——
rIPS
0.02
(σ2=0.19
e−3;
P m=0.95
)0(σ
2=0.2e
−3;
P m=0.6)
0.01
(σ2=0.2e
−3;
P m=0.76
)0.02
(σ2=0.2e
−3;
P m=0.88
)0.01
(σ2=0.2e
−3;
P m=0.71
)—
—
dlPFC
0(σ
2=0.19
e−3;
P m=0.59
)0(σ
2=0.2e
−3;
P m=0.63
)0(σ
2=0.2e
−3;
P m=0.58
)0(σ
2=0.2e
−3;
P m=0.51
)0.01
(σ2=0.2e
−3;
P m=0.74
)—
—
lMC
—0(σ
2=0.2e
−3;
P m=0.63
)0(σ
2=0.2e
−3;
P m=0.62
)0(σ
2=0.2e
−3;
P m=0.63
)0.01
(σ2=0.2e
−3;
P m=0.78
)0(σ
2=0.2e
−3;
P m=0.59
)0(σ
2=0.2e
−3;
P m=0.54
)rM
C—
0.01
(σ2=0.2e
−3;
P m=0.74
)0(σ
2=0.2e
−3;
P m=0.58
)0.01
(σ2=0.2e
−3;
P m=0.65
)0.01
(σ2=0.2e
−3;
P m=0.81
)0(σ
2=0.2e
−3;
P m=0.53
)0(σ
2=0.2e
−3;
P m=0.63
)
Each
cellprovides
statistics
fortheco
nnectionfrom
theco
lumnarea
totherow
area
.σ2,sample
varian
ce;P,
probab
ility
that
thespecified
inputdrive
sactivity
inthegiven
region;P c,probab
ility
that
the
absolute
valueoftheco
uplin
gparam
eter
isgreater
than
zero
[note
that
theab
solute
mag
nitudeofco
uplin
gparam
etersisrelative
tothedrivinginputs
andwill
chan
gebased
onthescaleofan
yparam
etric
modulator(e.g.,stim
ulusva
lue)
usedas
adrivinginputto
themodel];P m
,probab
ility
that
theco
uplin
gparam
eter
ismodulatedbytask
condition.T
heeffect
size
fortheseparam
etersshould
beev
aluated
relative
tothemag
nitudeofthefixe
dco
uplin
gparam
eters.
Parameterswithaposteriorprobab
ility
greater
than
90%
areshownin
bold.Allva
lues
arerounded
totw
odecim
als.
Hare et al. www.pnas.org/cgi/content/short/1109322108 9 of 11

Table
S7.
Modulationofco
uplin
gparam
etersbych
oiceduringtheperiodfrom
stim
ulusonsetto
resp
onse
conditional
onleft
choice
vmPF
C⇒
dmPF
C⇒
lIPS⇒
rIPS
⇒dlPFC
⇒lM
C⇒
rMC⇒
vmPF
C0.02
(σ2=0.19
e−3;
P m=0.92
)0.02
(σ2=0.19
e−3;
P m=0.88
)0.02
(σ2=0.19
e−3;
P m=0.89
)0.01
(σ2=0.19
e−3;
P m=0.86
)0.01
(σ2=0.2e
−3;
P m=0.8)
——
dmPF
C0.01
(σ2=0.19
e−3;
P m=0.78
)0.02
(σ2=0.2e
−3;
P m=0.96
)0.02
(σ2=0.18
e−3;
P m=0.92
)0.01
(σ2=0.18
e−3;
P m=0.8)
0.02
(σ2=0.19
e−3;
P m=0.9)
——
lIPS
0.01
(σ2=0.19
e−3;
P m=0.83
)0.01
(σ2=0.19
e−3;
P m=0.79
)0.04
(σ2=0.19
e−3;
P m=0.99
)0.01
(σ2=0.19
e−3;
P m=0.8)
0.01
(σ2=0.19
e−3;
P m=0.84
)—
—
rIPS
0.01
(σ2=0.19
e−3;
P m=0.77
)0.01
(σ2=0.19
e−3;
P m=0.79
)0.02
(σ2=0.19
e−3;
P m=0.97
)0.03
(σ2=0.19
e−3;
P m=0.99
)0.01
(σ2=0.19
e−3;
P m=0.77
)—
—
dlPFC
0(σ
2=0.18
e−3;
P m=0.56
)0.01
(σ2=0.19
e−3;
P m=0.73
)0.01
(σ2=0.18
e−3;
P m=0.7)
0(σ
2=0.19
e−3;
P m=0.6)
0.02
(σ2=0.2e
−3;
P m=0.86
)—
—
lMC
—−0.03
(σ2=0.19
e−3;
P m=0.97
)−0.02
(σ2=0.18
e−3;
P m=0.97
)−0.02
(σ2=0.19
e−3;
P m=0.93
)−0.01
(σ2=0.19
e−3;
P m=0.79
)0.01
(σ2=0.2e
−3;
P m=0.73
)−0.02
(σ2=0.2e
−3;
P m=0.88
)rM
C—
0.04
(σ2=0.19
e−3;
P m=1)
0.02
(σ2=0.19
e−3;
P m=0.92
)0.03
(σ2=0.19
e−3;
P m=0.97
)0.02
(σ2=0.19
e−3;
P m=0.96
)0.01
(σ2=0.2e
−3;
P m=0.7)
0.04
(σ2=0.2e
−3;
P m=1)
Each
cellprovides
statistics
fortheco
nnectionfrom
theco
lumnarea
totherow
area
.σ2,sample
varian
ce;P,
probab
ility
that
thespecified
inputdrive
sactivity
inthegiven
region;P c,probab
ility
that
the
absolute
valueoftheco
uplin
gparam
eter
isgreater
than
zero
[note
that
theab
solute
mag
nitudeofco
uplin
gparam
etersisrelative
tothedrivinginputs
andwill
chan
gebased
onthescaleofan
yparam
etric
modulator(e.g.,stim
ulusva
lue)
usedas
adrivinginputto
themodel];P m
,probab
ility
that
theco
uplin
gparam
eter
ismodulatedbytask
condition.T
heeffect
size
fortheseparam
etersshould
beev
aluated
relative
tothemag
nitudeofthefixe
dco
uplin
gparam
eters.
Parameterswithaposteriorprobab
ility
greater
than
90%
areshownin
bold.Allva
lues
arerounded
totw
odecim
als.
Table
S8.
Modulationofco
uplin
gparam
etersbych
oiceduringtheperiodfrom
stim
ulusonsetto
resp
onse
conditional
onrightch
oice
vmPF
C⇒
dmPF
C⇒
lIPS⇒
rIPS
⇒dlPFC
⇒lM
C⇒
rMC⇒
vmPF
C0.02
(σ2=0.19
e−3;
P m=0.89
)0.02
(σ2=0.19
e−3;
P m=0.93
)0.03
(σ2=0.19
e−3;
P m=0.98
)0.02
(σ2=0.19
e−3;
P m=0.87
)0.01
(σ2=0.2e
−3;
P m=0.85
)—
—
dmPF
C0.02
(σ2=0.19
e−3;
P m=0.89
)0.02
(σ2=0.19
e−3;
P m=0.95
)0.02
(σ2=0.18
e−3;
P m=0.87
)0(σ
2=0.18
e−3;
P m=0.55
)0.01
(σ2=0.19
e−3;
P m=0.69
)—
—
lIPS
0.01
(σ2=0.19
e−3;
P m=0.83
)0(σ
2=0.19
e−3;
P m=0.56
)0.03
(σ2=0.19
e−3;
P m=0.99
)0(σ
2=0.19
e−3;
P m=0.5)
0.01
(σ2=0.19
e−3;
P m=0.68
)—
—
rIPS
0.02
(σ2=0.19
e−3;
P m=0.89
)0.01
(σ2=0.19
e−3;
P m=0.7)
0.02
(σ2=0.18
e−3;
P m=0.92
)0.04
(σ2=0.19
e−3;
P m=1)
0.01
(σ2=0.19
e−3;
P m=0.7)
——
dlPFC
0.01
(σ2=0.18
e−3;
P m=0.8)
0.01
(σ2=0.19
e−3;
P m=0.78
)0.01
(σ2=0.17
e−3;
P m=0.77
)0(σ
2=0.19
e−3;
P m=0.58
)0.01
(σ2=0.19
e−3;
P m=0.86
)—
—
lMC
—0.04
(σ2=0.19
e−3;
P m=1)
0.05
(σ2=0.19
e−3;
P m=1)
0.04
(σ2=0.19
e−3;
P m=0.99
)0.03
(σ2=0.19
e−3;
P m=0.98
)0.03
(σ2=0.2e
−3;
P m=0.99
)0.01
(σ2=0.2e
−3;
P m=0.75
)rM
C—
−0.01
(σ2=0.19
e−3;
P m=0.64
)−0.02
(σ2=0.19
e−3;
P m=0.96
)−0.02
(σ2=0.18
e−3;
P m=0.94
)0(σ
2=0.19
e−3;
P m=0.61
)−0.02
(σ2=0.2e
−3;
P m=0.88
)0.01
(σ2=0.2e
−3;
P m=0.69
)
Each
cellprovides
statistics
fortheco
nnectionfrom
theco
lumnarea
totherow
area
.σ2,sample
varian
ce;P,
probab
ility
that
thespecified
inputdrive
sactivity
inthegiven
region;P c,probab
ility
that
the
absolute
valueoftheco
uplin
gparam
eter
isgreater
than
zero
[note
that
theab
solute
mag
nitudeofco
uplin
gparam
etersisrelative
tothedrivinginputs
andwill
chan
gebased
onthescaleofan
yparam
etric
modulator(e.g.,stim
ulusva
lue)
usedas
adrivinginputto
themodel];P m
,probab
ility
that
theco
uplin
gparam
eter
ismodulatedbytask
condition.T
heeffect
size
fortheseparam
etersshould
beev
aluated
relative
tothemag
nitudeofthefixe
dco
uplin
gparam
eters.
Parameterswithaposteriorprobab
ility
greater
than
90%
areshownin
bold.Allva
lues
arerounded
totw
odecim
als.
Hare et al. www.pnas.org/cgi/content/short/1109322108 10 of 11

Table S9. Modulation of coupling parameters at the time of response
vmPFC ⇒ dmPFC ⇒ lIPS ⇒ rIPS ⇒ dlPFC ⇒ lMC ⇒ rMC ⇒
vmPFC — — — — — — —
dmPFC — — — — — — —
lIPS — — — — — — —
rIPS — — — — — — —
dlPFC — — — — — — —
lMC — — — — — 0.01 (σ2 = 0.2e−3; Pm = 0.76) 0 (σ2 = 0.2e−3; Pm = 0.55)rMC — — — — — 0 (σ2 = 0.2e−3; Pm = 0.58) 0.01 (σ2 = 0.2e−3; Pm = 0.76)
Each cell provides statistics for the connection from the column area to the row area. σ2, sample variance; P, probability that thespecified input drives activity in the given region; Pc, probability that the absolute value of the coupling parameter is greater than zero[note that the absolute magnitude of coupling parameters is relative to the driving inputs and will change based on the scale of anyparametric modulator (e.g., stimulus value) used as a driving input to the model]; Pm, probability that the coupling parameter ismodulated by task condition. The effect size for these parameters should be evaluated relative to the magnitude of the fixed couplingparameters. Parameters with a posterior probability greater than 90% are shown in bold. All values are rounded to two decimals.
Table S10. Parameter estimates for each task related input by region
Stimulus presentation Stimulus value CR left CR right Button press
vmPFC −0.01 (σ2 = 0.01e−3; P = 0.9) 0.04 (σ2 = 0.23e−3; P = 0.99) — — —
dmPFC — — 0.01 (σ2 = 0e−3; P = 1) 0.01 (σ2 = 0e−3; P = 1) —
lIPS — — 0.01 (σ2 = 0e−3; P = 1) 0.01 (σ2 = 0e−3; P = 1) —
rIPS — — 0.01 (σ2 = 0e−3; P = 1) 0.01 (σ2 = 0e−3; P = 1) —
dlPFC −0.01 (σ2 = 0.01e−3; P = 0.99) — 0.01 (σ2 = 0e−3; P = 1) 0.01 (σ2 = 0e−3; P = 1) —
lMC — — — — 0.07 (σ2 = 0.14e−3; P = 1)rMC — — — — 0.07 (σ2 = 0.17e−3; P = 1)
Each cell provides statistics for the connection from the column area to the row area. σ2, sample variance; P, probability that the specified input drivesactivity in the given region; Pc, probability that the absolute value of the coupling parameter is greater than zero [note that the absolute magnitude ofcoupling parameters is relative to the driving inputs and will change based on the scale of any parametric modulator (e.g., stimulus value) used as a drivinginput to the model]; Pm, probability that the coupling parameter is modulated by task condition. The effect size for these parameters should be evaluatedrelative to the magnitude of the fixed coupling parameters. Parameters with a posterior probability greater than 90% are shown in bold. All values arerounded to two decimals.
Table S11. Regions correlated with right and left value across all trials
Region BA Side Cluster size x y z Z score
Region correlated with left valuePrecentral gyrus 3/4 Right 179 48 −19 64 4.15*
Region correlated with right valuePrecentral gyrus 6/4/3 Left 1,073 −42 −19 61 4.88*Medial frontal gyrus 9/8 Right 176 24 29 37 4.45*Rolandic operculum/insula 13 Left 149 −42 −28 19 4*Inferior frontal gyrus 10/46 Right 25 48 53 4 3.67Middle temporal gyrus 39 Right 21 45 −82 25 3.64Cerebellum Right 57 12 −85 −29 3.58Orbitofrontal cortex 10 Left 37 −21 50 −5 3.51Occipital cortex 19 Left 20 −12 −97 34 3.09
Height threshold t = 2.88; extent threshold = 20 voxels (3 × 3 × 3 mm). BA, Brodmann area.*The activation survives whole-brain correction for multiple comparisons at the cluster level (height thresholdt = 2.88, extent = 178 voxels for the left value, extent = 122 voxels for the right value).
Hare et al. www.pnas.org/cgi/content/short/1109322108 11 of 11