Embed Size (px)
Citation preview

Transformation:
The Patient-Centered Dental Home
May 13, 2017
An Nguyen, DDS, MPHVice-President of Dental Services

Objectives
• To understand the Chronic Care Model as a quality improvement framework and how it can be applied to dental practice transformation.
• To understand the “Big 6” redesign elements and how they have been leveraged to improve quality of processes and outcomes in patient-centered ways in Clinica’s dental program.
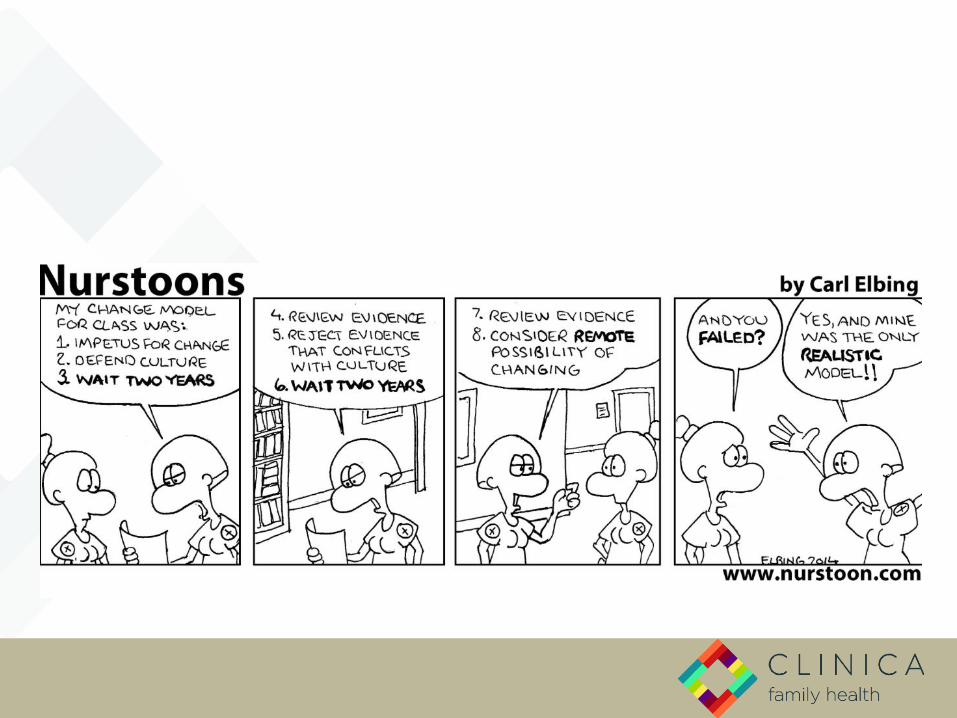
• To identify the importance of change management in supporting system redesign.
• To identify a process change to take back home to consider or test.
• Clinica’s Journey: A Transformative
Process
• A Quality Improvement Framework
– Chronic Care Model
– Patient Centered Medical Home
– “The Big 6”
An

Southern Roots

Our Mission
To be the medical and dental care provider of
choice for low income and other underserved
people in south Boulder, Broomfield and west
Adams counties. We believe that health care shall
be culturally appropriate and prevention focused.

People’s Medical Clinic
Boulder, CO
Lafayette Medical Clinic
Lafayette, CO
Administration
Lafayette, CO
Thornton
Medical &
Dental Clinic
Thornton, CO
Westminster
Medical Clinic
Westminster, COPecos Medical &
Dental Clinic
Denver, CO
Dental Established 2002
17 Providers General Dentistry
Pediatric Dentistry
Integrated Dental Hygiene
2 Clinic Locations
13,000 Patients
Clinica Founded 1977 in Lafayette, CO Integrated Physical, Behavioral, Dental Health Care
NCQA PCMH Level III and Diabetes Recognition 50,000 Patients & 240,000 Visits 56% Medicaid, 30% Uninsured, 6% Private, 5%
Medicare 42% Non-English Preference; 75% Hispanic or
Minority 6 Clinic Sites 530 Employees (120 Providers)
“Every system is perfectly designed to get the results it gets.”
Paul B. Batalden, MD
Co-Founder
Institute for Health Care Improvement

Chronic (Planned)
Care Model
● Foundation for
Patient-Centered
Medical Home
Model
● Interventions that
contain one or
more Chronic
Care Model
elements
improved clinical
outcomes and
processes of
care.1The Chronic or Planned Care Model

Key Redesign Elements:
The “Big 6” To improve patient-centered, population health management.
NOTE: Not sequential in nature.
CONTINUITY ACCESS
IMPROVED CARE
DELIVERY MODEL
IMPROVED OFFICE
EFFICIENCY
IMPROVED INFORMATION
SYSTEM DESIGN
PATIENT ACTIVATION &
SELF-MANAGEMENT

CONTINUITY
Redesign Element #1

Continuity
“Continuity of care is rooted in a long-term patient-
physician partnership…with the goal of high quality, cost
effective medical care…in which the physician knows the
patient’s history from experience and can integrate new
information and decisions from a whole-patient
perspective efficiently without extensive investigation or
record review.”
American Academy of Family Physicians
Continuity is King!

Continuity
“If a primary tenet of the Medical [or Health]
Home is the continuous relationship
between a team of providers and an
informed patient…then we must provide a
mechanism for allowing that relationship to
happen in our systems.”Amit Shah, MD, Medical Director, Multnomah County Health Department
That mechanism is empanelment.
1

Continuity
• Most important!1
• Data shows that improved continuity results in:– Fewer visits to the
emergency room.2
– Improved patient satisfaction.3
– Improved rates of preventive services completion (pap, mammograms, vaccinations).4
1

Continuity
• Assigned Primary Dental Provider (PDP)
• Defined Dental Panels– Group of unique
patients, whose care for which a provider is responsible.
– Inclusion of only:
• Active Patients
• Comprehensive Care Patients
– Adjusted by:
• Provider Type
• Provider FTE
• Patient Age
1

Continuity
A Simple Formula for Panel Size
1. Determine capacity.
Average Visits per Day by Provider Type X
# of Working Days per Year
2. Determine panel size.
# Visits Available per Year
Average Visits per Year by Patient Type
1

Continuity
• Adjustments for Panel Size
*Age is most predictable determinant of visits per year.
• Requires understanding your patients and program.
VARIABLE EXAMPLES ADJUSTMENT FACTOR
Provider Type General DentistsPediatric DentistsHygienists
Visits per DayVisits per Year
Provider FTE Any FTE Worked # of Working Days per Year
Patient Types or Risk Factors Age*GenderComorbidity• Diabetes• Periodontal Disease• Pregnancy
Patient Visits per Year
1
Continuity
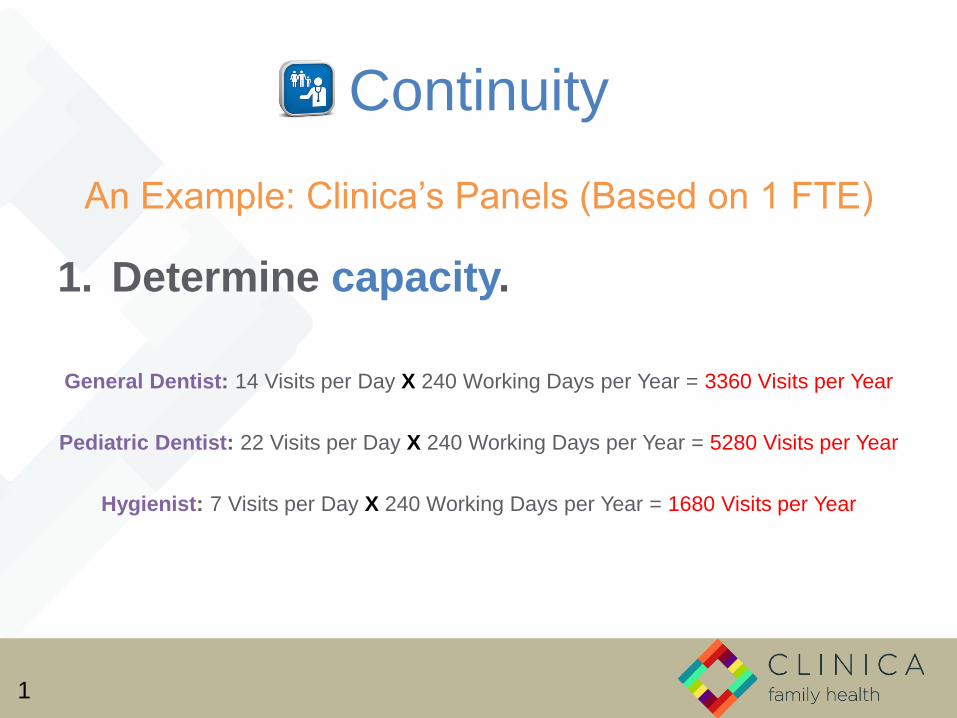
An Example: Clinica’s Panels (Based on 1 FTE)
1. Determine capacity.
General Dentist: 14 Visits per Day X 240 Working Days per Year = 3360 Visits per Year
Pediatric Dentist: 22 Visits per Day X 240 Working Days per Year = 5280 Visits per Year
Hygienist: 7 Visits per Day X 240 Working Days per Year = 1680 Visits per Year
1

Continuity
An Example: Clinica’s Panels (Based on 1 FTE)
2. Determine panel size.
General Dentist: 3360 Visits per Year = ~1,200 Patients
2.75 Visits per Year per Patient ≥ 12YO
Pediatric Dentist: 5280 Visits per Year = ~2500 Patients
2.1 Visits per Year per Patient < 12YO
Hygienist: 1680 Visits per Year = ~950 Patients
1.77 Visits per Year per Patient ≥ 12YO
1

Continuity
An Example: Clinica’s Panels (Based on 1 FTE)
3. Determine adjustments.• By Age – YES!
• Children under 12YO consume half the number of annual dental visits.
• Visits per Year for <12YO = 2.1.
• Visits per year for ≥12YO = 4.58.
• Panels adjusted by <12YO = 0.5 ≥12YO.
• Adjusting by age, panel sizes are larger when they are comprised of more
patients <12YO.
• By Comorbidity – NO!
• Visits per year based on comorbidity (e.g., diabetes, periodontal disease,
etc.) were distributed according to age.
• Therefore, panel sizes are adjusted according to age, rather than diagnosis.
1

Continuity
• General Dentist Panel Report (If ≥12YO Only = 1200 Pts)
• Pediatric Dentist Panel Report (If <12YO Only = 2500 Pts)
1

Continuity
Other Important Metrics & Processes
• Patient Deactivation Process
• Attrition Rate
• Continuity will never be 100%
• Process Barrier Removal
– Simplified scheduling processes.
– Scripts for staff for when patients request appointments with “Anyone.”
– Contingency plans for challenges to continuity.
• Defects in Schedules
• Provider Time Off &Turnover Attrition
Patient C
Patient B
Patient A
New Patient
New Patient
New Patient
1

ACCESS
Redesign Element #2

Access
• 150,000 medically and 170,000 dentally underserved…folks who can’t get in.
• High Leverage Changes for Access
a. Match demand & supply daily.
b. Decrease appointment types & times (reduce “carve-outs”).
c. Develop contingency plans.
d. Reduce demand for visits.
e. Optimize the care team.
2

Match Supply & Demand
• Backlog of Demand: Lack
of Medical & Dental Parity
• Managing Demand:
Populations of Focus
• Comprehensive Care
• Diabetics
• Pregnant Women
• Children
• Acute Care: Panel size
adjustment to allow for
acute care patients.
In 2016, 27% of all Clinica patients were able to
access Clinica’s dental services.
Access
4,283 5,797 7,443 8,069 9,16613,076
35309 35165 3345836563
3825737077
39,592 40,962 40,90144,632 47,423
50,153
0
10,000
20,000
30,000
40,000
50,000
60,000
70,000
80,000
2011 2012 2013 2014 2015 2016
Clinica’s UDS Access Trends
Unique Dental Patients Unique Medical Patients
2
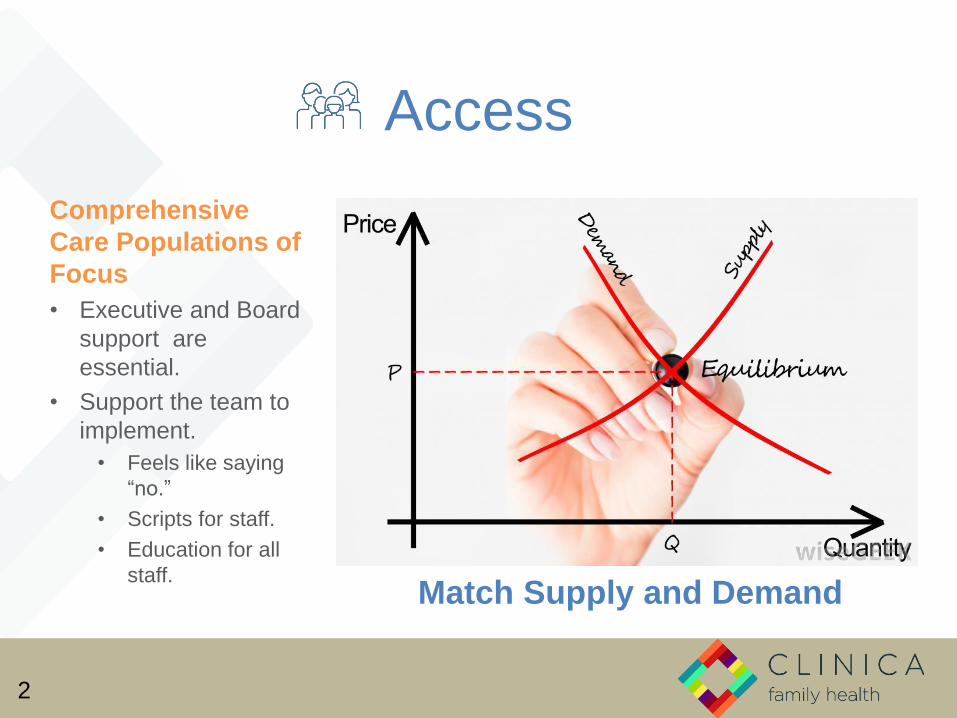
Match Supply and Demand
Comprehensive
Care Populations of
Focus
• Executive and Board
support are
essential.
• Support the team to
implement.
• Feels like saying
“no.”
• Scripts for staff.
• Education for all
staff.
Access
2

Access
Scheduling: The “Old” Way
• Procedure-based
scheduling.
• Procedure carve-outs.
– Demand may not match
supply.
– Unfilled slots filled with new
patients and LOEs.
• Simple for staff to
implement.
2

Access
Scheduling: A New Way
Appt Type (Code)
Time Options(20 min
increments)
Scheduling“Rule”
ExampleProcedures
Perio(P60, P80)
60 - 80 mins Max 3 per day per hygienist.
SRPs, GrossDebridements
Dental Routine Procedure (D20, D40,D60, D80)
20 - 80 mins None Exams, FVs, Sealants, Prophies,Perio Maintenances, Fillings, Extractions, Crowns
Complex(C20, C40, C60, C80,C100, C120)
20 - 120 mins All other columnsblocked.
ARTs, Root Canals,Immobilizations
• Features
• Appointment type-based scheduling (“building blocks”).
• Minimal procedure carve-outs.
• Clinical staff control time allotted per appointment.
• Scheduling rules are implemented and owned by operations team.
• Considerations
• Team commitment to access.
• Monitor outcomes with data.
2

Access
An Example: Patient needs a fillling.
• Diagnoses need for filling.
• Determines time needed.
• Plans OP40 in EDR.
Provider
• Sees provider’s request for OP40.
• Finds opening for OP40 in EPM.
Scheduler
2
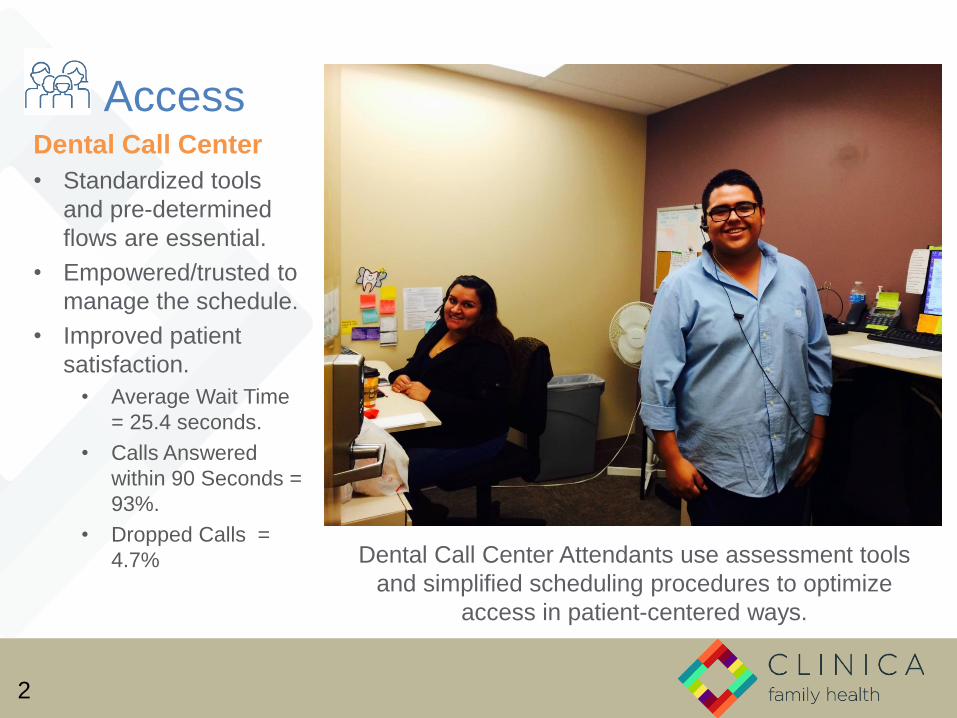
Dental Call Center Attendants use assessment tools
and simplified scheduling procedures to optimize
access in patient-centered ways.
AccessDental Call Center
• Standardized tools
and pre-determined
flows are essential.
• Empowered/trusted to
manage the schedule.
• Improved patient
satisfaction.
• Average Wait Time
= 25.4 seconds.
• Calls Answered
within 90 Seconds =
93%.
• Dropped Calls =
4.7%
2

AccessManaging Acute Needs
• When access is limited, acute care needs increase.
• Gap in dentistry for nurse triage functions.
• Assessment tools for non-clinical dental team members.
• Right appointment at the right time.
• Ensures routine vs. acute care capacity is balanced.
2

Access
2

Access
Optimize the Care Team
• Ask:– Who can do the care?
– What care can each team member render?
– Where can the care happen?
– How can we optimize the Dental Practice Act?
• In Colorado/At Clinica…– Independently practicing hygienists.
– Expanded duty dental assistants (EDDAs).
– Reimbursement for same-day medical & dental encounters.
– Emerging teledental models.
2

Access
• Other Considerations
– Advanced Access for Dentistry
• Challenging in a procedure-based field.
• Elements can be applied.
– Measure Access: Time to Third?
– Improving continuity reduces demand for
visits by 5% (IHI 2000).
2

Continuity + Access =
Outcomes!
0%
10%
20%
30%
40%
50%
60%
70%
80%
90%
100%
Year
Clinica Trimester of Entry of Prenatal Care
3rd Trimester
2nd Trimester
1st Trimester
1, 2

Continuity + Access =
Outcomes!
Empanelment
Access Management
1, 2

IMPROVED CARE DELIVERY
MODEL
Redesign Element #3

3. Improved Care Delivery Model
Alternative Care Modalities & Settings
• Engage the activated patient.
• Health happens in any/many environment(s).
• Effective, consistent, overlapping messaging.
• Put “the mouth back in the body.”
• Avoid the “high cost surgical suite.”
• Change the treat to maintain paradigm.
• Lowers overall cost of care.
• Increases appropriate access to care in the dental operatory.
• Improves outcomes.
3

2011 2012 2013
Average Age (In Years) 6.9 4.9 4.1
0
2
4
6
8Y
ear
s
Average Age at First Dental Visit (Pediatric Dentist Visits Only)
Improved Care
Delivery ModelDental Integration
• Hygienists on medical
care team.
• Scope
• OB, Peds Education
• Caries Risk
Assessment, Self-
Management
Support
• Preventive Services
• Direct Dental
Scheduling
• Minimal dental
equipment needs.
3

3. Improved Care Delivery Model
Group Visits
• Facilitated group process for
patient activation.
• Care in space designed for
groups.
• Patients invited on basis of
chronic disease history and
utilization patterns.
• Goal is patient activation.
• Patients remain in same group
for continuity.
• Improved access & outcomes!
• Access Group Visits: New
Patients, Back-to-School, Flu
• Cohort-Based Group Visits:
Pregnancy, Parenting, Diabetes
3

3. Improved Care Delivery Model
Team-Based Care
• Who can do the care?
• What care can each team member
render?
• Where can the care happen?
• How can we optimize the Dental
Practice Act?
3

3. Improved Care Delivery Model
Team-Based CareThe Jelly Bean Game
Who on the team…
1. SETS the intervals for exam recalls for high caries risk patients?
2. DECIDES when to call a patient with periodontal disease to come in for a visit?
3. SELECTS the types of preventive care to be given to a 12-month-old patient?
4. DECIDES to arrange a referral for oral biopsy?
5. ORDERS the placement of sealants for a 14-year-old patient with caries?
6. INITIATES the application of fluoride varnish?
7. FINDS the patients with chronic periodontitis who have not been in for routine periodontal maintenance and brings them in for an appointment?
8. DECIDES when an appointment can be double-booked?
9. DECIDES when a patient with an acute need should get an appointment?
10. ADMINISTERS caries risk assessments?
3

3. Improved Care Delivery Model
Team-Based Care
Jelly Bean Game: Debrief
• What are your AH-HAs?
• What are some OH-NOs?
• Were there any differences
between groups?
3

3. Improved Care Delivery Model
Team-Based CareWhen providers work without teams…
• Most providers deliver only 55% of recommended care; 42% report not having enough time with their patients.5, 6
• Providers are spending 13% of their day in care coordination and only using their clinical knowledge 50% of the time. 7, 8
• Patient care is fragmented and patients are dissatisfied with the level of attention they receive. 9
10.6 additional hours to manage
chronic conditions
Providers
Source: From Building Teams in Primary Care: Lessons Learned (California Healthcare Foundation, 2007)3

3. Improved Care Delivery Model
Team-Based Care
From triple to quadruple aim.
3
Care Team
Experience

IMPROVED OFFICE
EFFICIENCY
Redesign Element #4

4. Improved
Office Efficiency
Facility & Process
Design
• Medical-Dental Clinic
Colocation
• Shared, Centralized
Processes
• Financial Screening
• Call Center
4

4. Improved Office Efficiency
The “Dental Pod”
Red Team
Blue Team
Yellow Team
• Team owns outcomes and
productivity for a panel of
patients.
Workstations
Operatories
• Color-coded, team-based
seating.
4

4. Improved Office Efficiency
• Team-Based Seating
• Top of License Work
• Real-Time Huddling
• Efficiency Fewer Visits per Patient
Student
EDDADDS EDDA
RDH DA
Red Team
4

IMPROVED INFORMATION
SYSTEM DESIGN
Redesign Element #5

5. Improved Information System Design
Organizational structure supports
collaboration and clinical
quality.
5
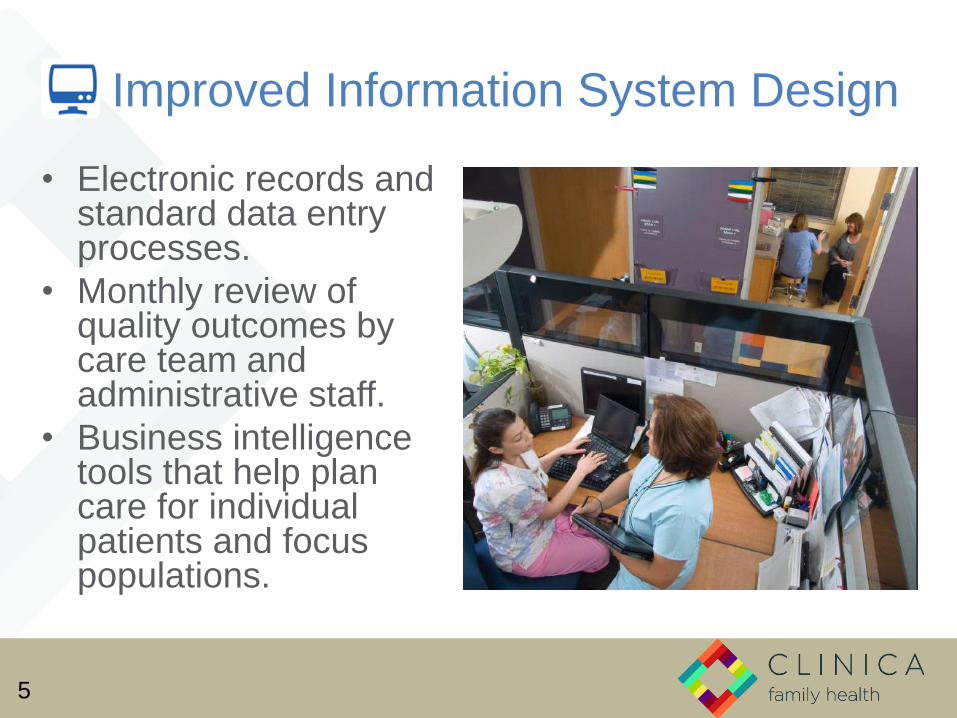
5. Improved Information System Design
• Electronic records and standard data entry processes.
• Monthly review of quality outcomes by care team and administrative staff.
• Business intelligence tools that help plan care for individual patients and focus populations.
5

5. Improved Information System Design
5

5. Improved Information System Design
5

Dental CarePlanner
5. Improved Information System Design
5

PATIENT ACTIVATION & SELF-
MANAGEMENT
Redesign Element #6

6. Patient Activation & Self-Management
• We take care of 99.995% of our own health care decisions…so do our patients.
• It is our job to find ways to help motivate patients to make the necessary behavioral change: smoking, exercise, brushing, seeking dental care!
• What to do? Adopt an approach to:
– Support patients’ autonomy and responsibility for their behavior.
– Increases the likelihood that patients will make healthier choices.
6

6. Patient Activation & Self-Management
If you’re interested in outcomes, then you have be invested in
the biggest part of the pie that we can influence.
6

6. Patient Activation & Self-Management
6

6. Patient Activation & Self-Management
Motivational Interviewing (MI)
• Sets aside the tendency to educate patients.
• Emphasizes eliciting from patients what they know and what most concerns them.
• Leads to patient behavior change goals that are more likely to be realistic and attainable.
• Reduces provider frustration and burnout due to patient nonadherence to treatment or recommended lifestyle change.
• Nurtures better-quality provider-patient relationships.
• Has some evidence of effectiveness (grade B).5
6

6. Patient
Activation &
Self-Management• Motivational
Interviewing training for all dental team members.
• Orientation
• Champions
• Pocket Cards
• Widely popular amongst dental provider team.
• Hunger for strategies to improve health.
• How to have “tough” conversations.
6
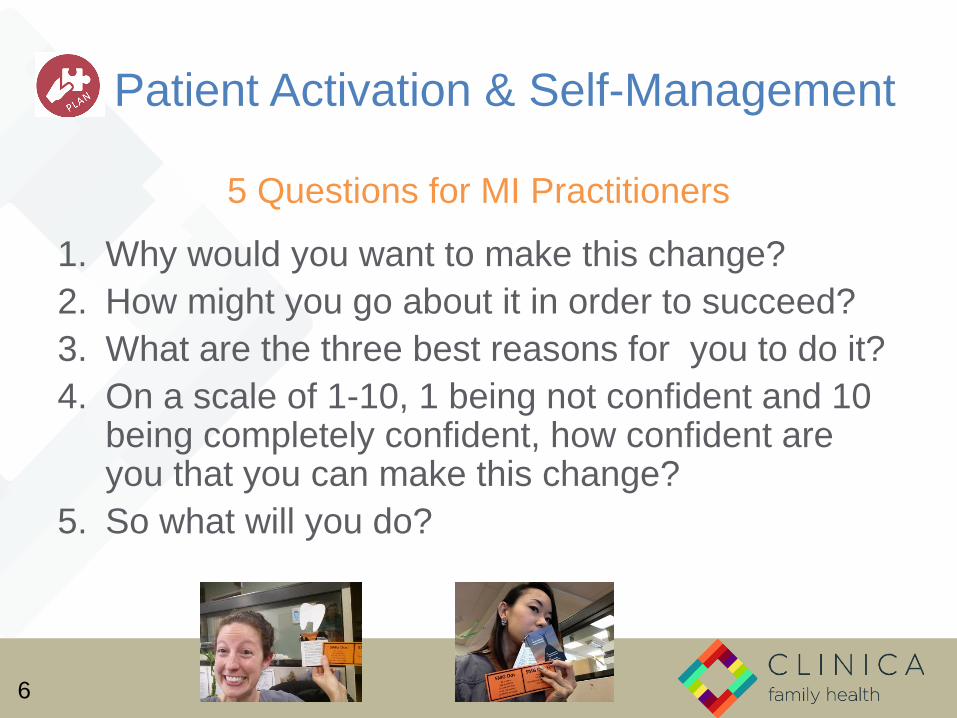
6. Patient Activation & Self-Management
5 Questions for MI Practitioners
1. Why would you want to make this change?
2. How might you go about it in order to succeed?
3. What are the three best reasons for you to do it?
4. On a scale of 1-10, 1 being not confident and 10 being completely confident, how confident are you that you can make this change?
5. So what will you do?
6

6. Patient Activation and Self-Management
DOs of SMG Setting
• Be curious.
• Ask questions.
• Go with the flow.
• Trust the patient.
• Let the patient pick one.
DON’Ts of SMG Setting
• Assume.
• Tell them.
• Diminish the patient’s
ideas.
• Use fear.
6

6. Patient Activation & Self-Management
• Change Talk: “I don’t want to have more cavities, but I don’t brush regularly.”
• I Will Get This Done By: “I think I can start brushing in the morning in the shower and rinse with ACT after I eat dinner at work.”
• Confidence (1-10): “8 out of 10, because rinsing is something that I already do.”
• Patient leaves with documentation of chosen goal.
• Provider documents goal, and team follows up on progress.
6
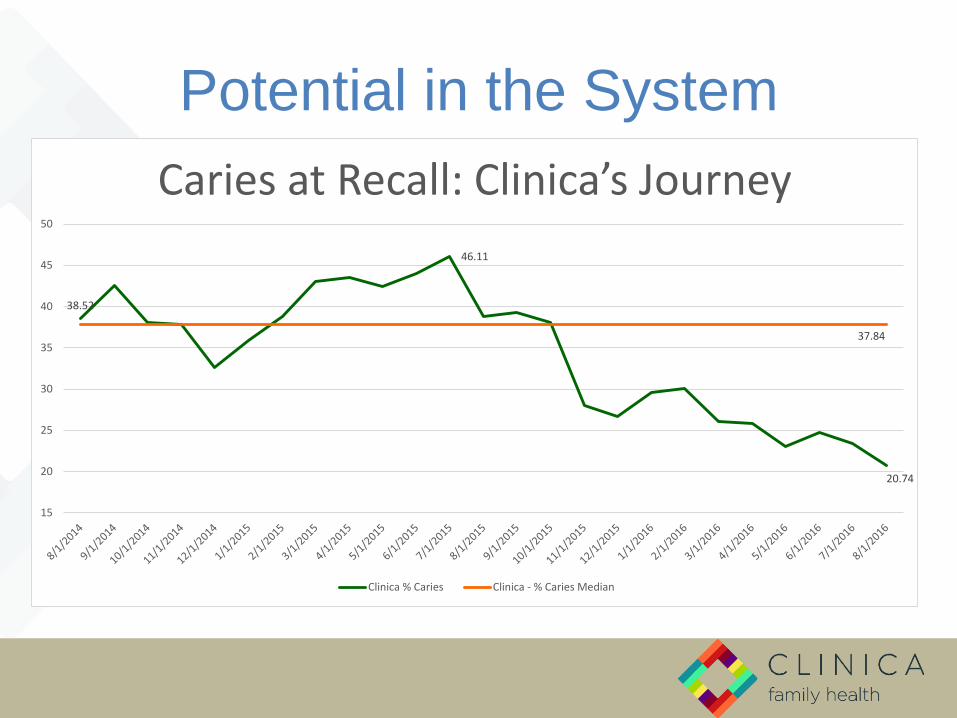
Potential in the System
38.52
37.84
46.11
20.74
15
20
25
30
35
40
45
50
Caries at Recall: Clinica’s Journey
Clinica % Caries Clinica - % Caries Median

CHANGE MANAGEMENT
Building the Toolbox

Universal Quality Improvement Language
Plan-Do-Study-Act (PDSA) Cycle
Ideas Action Learning Improvement
DoStudy
Act Plan
• Identify problems and create a plan
• Implement the plan• Monitor and document
results • Begin analysis of the data
• Complete the data analysis• Compare data to predictions• Summarize what was learned
• Demonstrate improvement• What changes are to be made?• What is the next cycle?

Universal Quality Improvement Language
Model for ImprovementUsing the cycle to improve.
DS
PA
D S
P A
Ideas
Improvement
Very Small Scale Test
Follow-up Tests
Wide-Scale Tests of Change
Implementation of Change
Spread
MULTIPLE successful PDSA cycles build knowledge and
accelerate the adoption of proven and effective changes.

Measurement

Leadership & Vision
When leaders are at their
personal best there are
five core practices
common to all:
1. Model the Way
2. Inspire a Shared Vision
3. Challenge the Process
4. Enable Others to Act
5. Encourage the Heart.

Leadership & Vision
Leadership and vision.
“A vision is not just a picture of what could be; it is an
appeal to our better selves, a call to become
something more.” (Rosabeth Moss Kanter)
Data is a powerful storyteller. Give
it a voice, and let it speak
frequently.
Support good habits.
Building Blocks of

1. A
cce
ss
2. C
on
tin
uit
y
3. C
are
De
live
ry
Mo
de
l
4. O
ffic
e
Effi
cie
ncy
5. I
nfo
rmat
ion
Sy
ste
ms
6. P
atie
nt
Act
ivat
ion
&
Se
lf-M
anag
em
en
t
HEALTH OUTCOMES

Thank you!
Questions?
An Nguyen, DDS, MPH
Vice-President of Dental Services
(303) 412-8180, Ext. 4035

References
1. Tsai AC, Morton SC, Mangione CM, Keeler EB. Am J Manag Care. 2005 Aug;11(8):478-88.
2. Brousseau DC, Meurer JR, Isenberg ML, Kuhn EM, Gorelick MH. Association between infant continuity of care and pediatric emergency department utilization. Pediatrics. 2004 Apr;113(4):738-41.
3. Christakis DA, Wright JA, Zimmerman FJ, Bassett AL, Connell FA. Continuity of care is associated with high-quality care by parental report. Pediatrics. 2002 Apr;109(4):e54.
4. Cabana MD, Jee SH. Does continuity of care improve patient outcomes? J Fam Pract. 2004 Dec;53(12):974-80.
5. Center for Studying Health System Change, 2008.
6. Bodenheimer and Liang, 2007.
7. Gottschalk, 2005.
8. Margolis and Bodenheimer, 2010.
9. Bodenheimer, 2008.
10. VanBuskirk KA,Wetherell JL. Motivational interviewing with primary care populations: a systematic review and meta-analysis [published online August 11, 2013]. J Behav Med. doi:10.1007/s10865-013-9527-4.