Embed Size (px)
Citation preview


Transforming Agribusiness, Trade and Leadership: A Capacity Needs
Assessment of the Tea Value Chain in Kenya
Kenya Institute for Public Policy Research and Analysis (KIPPRA) in partnership with
African Capacity Building Foundation (ACBF)
Special Paper No. 172017

ii
A Capacity Needs Assessment of the Tea Value Chain in Kenya
ISBN 9966 058 69 0
This paper is a result of partnership between the Kenya Institute for Public Policy Research and Analysis and the African Capacity Building Foundation. We are grateful to all those individuals who particpated in the various stages during
the development of this paper.

iii
Executive summary
This report analyses the institutional and human capacities of the tea value chain in Kenya. This is necessitated by the need to initiate transformative actions necessary for enhancing the sub-sector’s productivity and contributions to national economic growth and development. The transformative agenda is also aimed at strengthening agribusiness trade and international competitiveness as envisioned in the Kenya Vision 2030.
Tea plays an important role in Kenya’s socio-economic development. Tea is the leading industrial crop in terms of its contribution to the GDP. In 2016, tea accounted for 40 per cent of the marketed agricultural production and contributed 25 percent of total export earnings amounting to USD 1.25 billion (KNBS, 2017). In addition, tea provides livelihoods to approximately over 600,000 smallholders who contribute approximately 60 per cent of total tea production. This notwithstanding, only 14 per cent of tea exported is value added and the remaining is sold in bulk form (GoK, 2016). The low level of value addition results to an estimated loss of USD 12 per kilogram of tea. As a result despite Kenya being the leading exporter of tea in terms of volumes, the country receives low earnings compared to other exporting countries due to low value addition. For instance, in 2013, Kenya’s exported 131 metric tonnes more than Sri Lanka but it earned USD 0.3 billion less.
The objective of this study therefore was to identify capacity challenges that are critical in agribusiness and trade to enhance the competitiveness of the tea sub-sector. Specifically, to review national strategies, policies, practices and challenges with respect to agribusiness, trade and leadership. Secondly, provide sound situation analysis of the Kenya agri-business sector in relation to trade and leadership capacity. Thirdly, provide baseline data for assessing Kenya’s capacity development progress and finally, assess and analyse the status and gaps of Public Sector Transformation Division (PSTD) and other relevant institutions’ capacity to implement the reforms in the tea value chain.
Both primary and secondary data was used in this study, and was obtained through key informant interviews and focus group discussions with actors along the value chain. Data was collected using a structured checklist covering: institutional and legal framework; policy framework; regulatory framework and external environment. Other aspects of institutions considered include mission and mandate, organizational structure and systems, organizational performance and staffing levels, knowledge, experience and skill levels among other. The content, descriptive and a strength, weakness, opportunities and threats (SWOT) techniques were used in the analysis. In carrying out the assessment, the UNDP capacity assessment framework with a richert scale of 0-4 was used.

iv
A Capacity Needs Assessment of the Tea Value Chain in Kenya
The study identified a number of issues constraining growth along the value chain. The key issues identified at the production level, include: high labor cost, which account for 68 percent of the production cost and widening yield gap between small holder farmers and estates due to continued use of moribund tea bushes and the type of tea clone grown. Processing is characterized by concentration of black CTC as most factories have only single production line, thereby limiting product diversification. There are limited incentives for production of other types of tea. In addition, processing is characterized by high cost of energy and heavy reliance on wood fuel. The main concerns in tea marketing include low domestic consumption, dominance of few multinational companies in the Mombasa Tea Auction who determine the prices, limited number of export destinations and shrinking of current markets. In addition, Kenyan tea is not branded and there is limited marketing research.
At the institution level, the key constraints are the delay in adoption of national agricultural policy and absence of a tea policy to guide sustainable development of the sub-sector. This implies that the sub-sector operates without a clear strategic focus resulting in piece meal and uncoordinated reform initiatives. This is compounded by the lack of strategies and regulations to support the AFFA Act, Crops Act and the KALRO Act. There is a disconnect in the interpretations of the county government devolved roles and functions and those of the tea directorate with respect to tea. The County governments do not have clear understanding of their role in the development of the Tea Sub-sector. This has resulted in haphazard imposition of taxes and confusion surrounding the renewal of land leases for the tea estates. This is in addition to inadequate human and financial capacity.
Institutional and human capacities for selected institutions namely: MoALF, Tea Directorate, KTDA, TRI, EPC, MoITC, and PSTD were assessed. The study findings indicate gaps in the overall policy, legal and regulatory frameworks; staffing levels, and expertise in different aspects of tea value chain, and lack of predictable and adequate financial mechanisms to enable institutions discharge their mandates.
The report makes several recommendations required to effectively transforming the tea sub-sector. First there is need to promote mechanization for plucking and pruning and at the same time offer basic training on machine operations. There is also need to support small scale farmers to replace moribund tea bushes with high yielding tea clones while as the same time promoting alternative complementary enterprises. Second, for the KTDA managed factories, there is need to expand their capacity to enable production of other teas other than black CTC (speciality teas and extracts). To support the product diversification, investments will be necessary in human skill development and production lines for manufacturing.

v
In addition, factories should adopt innovations for reduction of energy cost by shifting to energy efficient technologies. Third, promote domestic consumption of tea by, developing skills to redesign the marketing approach focusing on awareness campaigns and advocacy. For the export market, there is need to diversify the market destinations especially in high tea consuming market in Africa like Morocco and Nigeria. This can be achieved by additional bilateral trade agreements as well as other trading blocks. In addition, investing in market research especially market behaviour will be critical to consolidate existing markets and explore new ones. The capacity of the industry on domestication and harmonisation of international standards will also need to be enhanced. Other measures include promoting tea processing and branding within the Special Economic Zone so as to enjoy the associated incentives and make Kenyan tea more competitive. Fourth, fast track the adoption of the agriculture policy and the national tea policy. Fifth, there is needed to separate the governance of tea from other crops as is the case in some countries. Thus, Tea Directorate ought to be managed outside the AFA Act while the TRI should be governed outside the KALRO. Sixth, the AFA- Tea Directorate needs to set up a one-stop-shop that will provide information on the licences, taxes and levies in the tea industry as well as the incentives and opportunities. This will be achieved by providing adequate human and financial resources, in addition to developing their skills. Seventh, there is need for a concerted effort by both the National and County government to rationalize fees and levies across the different County government’s jurisdiction. To facilitate this, training on issues pertaining revenue and taxation will be required. Eighth, tea research is largely focused on production and processing as opposed to marketing aspects. It is necessary to expand the scope of research by providing resources and adequate numbers of qualified staff. It is important to establish linkages between the sub-sector and the higher institutions of learning. Lastly, the County governments should be supported to develop appropriate strategies for the development Tea sub-sector. In addition, the capacity of the county should be enhanced in terms number of qualified staff, while departments should be provided with adequate finances to support the industry.
Executive Summary


vii
Acknowledgement
The Executive Director of the Kenya Institute for Public Policy Research and Analysis (KIPPRA) and the Executive Secretary of the African Capacity Building Foundation (ACBF) are grateful to individuals who put together the report of the capacity needs assessment of the Kenya tea value chain.
The report was put together by the following KIPPRA staff: Nancy Laibuni, Augustus Muluvi, John Nyangena, Christopher Onyango, Hannah Wangombe and Nixon Murathi. Valuable contributions were provided by staff of the public sector transformation division (PSTD) who include: Elijah Achoch, Betty Soita, Daniel Otwoma, Raymond Ochieng and Everlyne Okatch. KIPPRA and ACBF are also thankful to Christopher Macharia from the Ministry for Agriculture, Livestock and Fisheries and Wekesa Khisa from the Agriculture and Food Authority (AFA) for their input throughout the report preparation process.
Special thanks go to the 12 tea growing county governments, their tea factories and tea producers namely Embu, Muranga, Nyeri, Meru, Kiambu, Kirinyaga, Nandi, Nyamira, Vihiga, Bomet, Kericho and Kisii for their cooperation during the data collection exercise and to the several stakeholders who provided insightful inputs during the launch and validation of this report.

viii
A Capacity Needs Assessment of the Tea Value Chain in Kenya
Abbreviations and Acronyms
ACBF African Capacity Building Foundation
AFA Agriculture Food Authority
AFFA Agriculture, Fisheries and Food Authority
ASDS Agricultural Sector Development Strategy
CBA Collecting Bargaining Agreement
DS Direct Sales
EATTA East African Tea Trade Association
EPC Export Promotion Council
EPZ Export Promotion Zone
FDS Factory Door Sales
GDP Gross Domestic Products
GI Geographical Indications
GIS Geographical Information System
GL Green Leaf
GoK Government of Kenya
ICT Information Communication Technology
KALRO Kenya Agricultural and Livestock Research Organization
KEBS Kenya Bureau of Standards
KEPHIS Kenya Plant Health Inspectorate Services
KFS Kenya Forestry Services
KIPPRA Kenya Institute for Public Policy Research and Analysis
KRA Kenya Revenue Authority
KTDA Kenya Tea Development Agency
KTGA Kenya Tea Growers Association
MoALF Ministry of Agriculture, Livestock and Fisheries
MoEWNR Ministry of Environment Water and National Resources
MoOFAIT Ministry of Foreign Affairs and International Trade

ix
NTZDC Nyayo Tea Zones Development Corporation
PPP Public Private Partnerships
SACCOs Savings and Credit Cooperative Societies
SCDA Special Crops Development Authority
SMEs Small and Medium Enterprises
TBK Tea Board of Kenya
TD Tea Directorate
TRI Tea Resarch Institute
VAT Value Added Tax
Abbreviations and Acronyms

x
A Capacity Needs Assessment of the Tea Value Chain in Kenya
Definition of terms
1. Capacity: ACBF (2011: 31) defines capacity as the “ability of people, organizations, and society as a whole to manage their affairs successfully; and capacity development as the process by which people, organizations, and society as a whole unleash, strengthen, create, adapt, and maintain capacity over time.”
1. Capacity Assessment: ACBF definition of capacity assessment as a situation analysis of existing capacity where an assessment determines capacity “gaps” by comparing desired capacities against existing capacity and formulate strategies to address them.
1. Agribusiness: This encompass all businesses involved in agricultural production, including farming and contract farming, seed supply, agrichemicals, farm machinery, wholesale and distribution, processing, marketing and retail sales and advisory services (National Agri-business strategy, 2012).
1. Value Chain: This a set of linked activities that work to add value to a product; it consists of actors and actions that improve a product while linking commodity producers to processors and markets.
1. Public Service Transformation: A dynamic, focused and relatively short term process designed to fundamentally reshape the public service for improved and efficient service delivery.
1. Agricultural GDP: Gross Domestic Product (GDP) coming from the agricultural sector.
1. Industrial crops: Also called a non-food crop, is a crop grown to produce goods for manufacturing, for example of fiber for clothing, rather than food for consumption.
xi
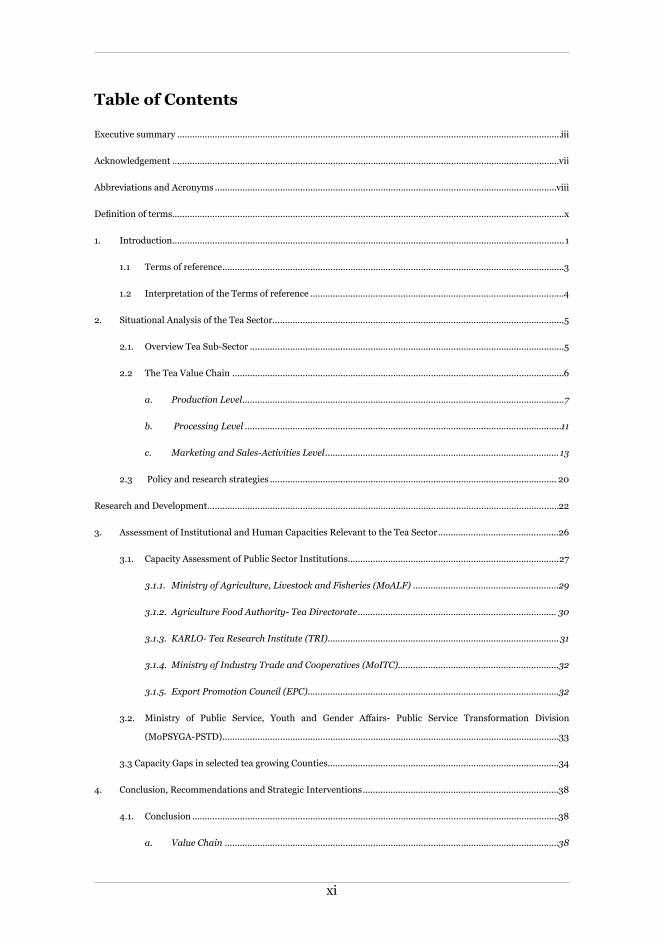
Table of Contents
Executive summary .........................................................................................................................................................iii
Acknowledgement ..........................................................................................................................................................vii
Abbreviations and Acronyms ........................................................................................................................................viii
Definition of terms............................................................................................................................................................x
1. Introduction............................................................................................................................................................1
1.1 Terms of reference ........................................................................................................................................3
1.2 Interpretation of the Terms of reference .....................................................................................................4
2. Situational Analysis of the Tea Sector ....................................................................................................................5
2.1. Overview Tea Sub-Sector .............................................................................................................................5
2.2 The Tea Value Chain ....................................................................................................................................6
a. Production Level ................................................................................................................................7
b. Processing Level ..............................................................................................................................11
c. Marketing and Sales-Activities Level ............................................................................................. 13
2.3 Policy and research strategies .................................................................................................................. 20
Research and Development ............................................................................................................................................22
3. Assessment of Institutional and Human Capacities Relevant to the Tea Sector ................................................26
3.1. Capacity Assessment of Public Sector Institutions....................................................................................27
3.1.1. Ministry of Agriculture, Livestock and Fisheries (MoALF) ..........................................................29
3.1.2. Agriculture Food Authority- Tea Directorate ............................................................................... 30
3.1.3. KARLO- Tea Research Institute (TRI)............................................................................................31
3.1.4. Ministry of Industry Trade and Cooperatives (MoITC)................................................................32
3.1.5. Export Promotion Council (EPC)....................................................................................................32
3.2. Ministry of Public Service, Youth and Gender Affairs- Public Service Transformation Division
(MoPSYGA-PSTD) ......................................................................................................................................33
3.3 Capacity Gaps in selected tea growing Counties ............................................................................................34
4. Conclusion, Recommendations and Strategic Interventions ..............................................................................38
4.1. Conclusion ..................................................................................................................................................38
a. Value Chain .....................................................................................................................................38

b. Institutional and human capacities ...............................................................................................38
4.2. Recommendations ......................................................................................................................................39
a. Value chains .....................................................................................................................................39
b. Institutional and human capacities .............................................................................................. 40
4.3. Strategic Interventions ...............................................................................................................................41
Short term interventions ..........................................................................................................................41
Medium term strategic interventions ......................................................................................................41
Long term strategic interventions ...........................................................................................................42
Bibliography ...................................................................................................................................................................43
Appendix .........................................................................................................................................................................46
Appendices I: SWOT Analysis of the tea value chain ..........................................................................................46

1
1. Introduction
The policy environment in agriculture has undergone major shifts since independence. After independence in 1965, the government adopted the Sessional paper No. 10 on African socialism and its application to planning in Kenya. The paper aimed at revolutionising agriculture through provision of extension services, training, and introduction of modern techniques. Under this, government farms were to play a key role in production and marketing. It also provided for progressive Africanization of ownership through settlement schemes including in the tea sector. The government implemented the inward oriented policies that saw the promotion of agriculture in high potential areas through import substitution and strengthening small-scale farming supported by marketing boards.
In mid-1980s, the country implemented the Structural Adjustment Programs (SAPs) which were characterized by market liberalization in the sector that saw significance transformation of the agricultural marketing system which focused mainly in the cereal sector and privatization of government agencies among other reforms. These reforms show the gradual reduction in the role of government in production and marketing of agricultural produce. Other adjustments included removal of price controls on a number of commodities and introduction of user charges on veterinary and extension services.
In recent periods emphasis is made on revitalisation of the agricultural sector given it key role in both poverty reduction and economic growth. For example, the Strategy for Revitalizing Agriculture (SRA) was implemented in the period 2003-2007, aimed at transforming Kenya’s agriculture into a profitable, commercially-oriented and internationally and regionally competitive economic activity that provides high-quality, gainful employment to Kenyans. This was to be achieved within the framework of improved agricultural productivity and farm incomes, while conserving the land resource base and the environment. This saw increased productivity in key commodities such as tea, maize, sugarcane, horticulture, milk and meat by an average of over six per cent per annum in the period, and a reduction of food insecurity by over 12 per cent and of poverty by over 10 per cent. In addition, the strategy was instrumental in the revival of most agricultural institutions including Kenya Meat Commission, the Kenya Cooperative Creameries (KCC), the Kenya Seed Company, the Agricultural Finance Corporation, and the Agricultural Development Corporation. (GoK, 2009).
Further, the Agriculture Sector Development Strategy (ASDS) was developed covering the period 2010 to 2020 with the aim of ensuring food security and prosperity by 2020, commercializing agriculture and promoting public and private sector agricultural development. The ASDS envisages commercialization
2
A Capacity Needs Assessment of the Tea Value Chain in Kenya
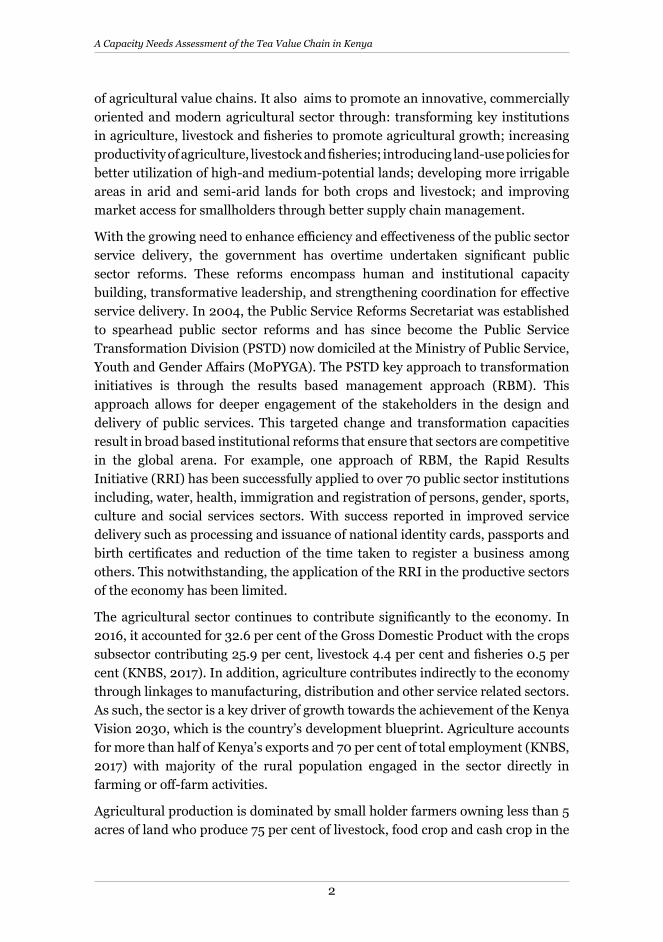
of agricultural value chains. It also aims to promote an innovative, commercially oriented and modern agricultural sector through: transforming key institutions in agriculture, livestock and fisheries to promote agricultural growth; increasing productivity of agriculture, livestock and fisheries; introducing land-use policies for better utilization of high-and medium-potential lands; developing more irrigable areas in arid and semi-arid lands for both crops and livestock; and improving market access for smallholders through better supply chain management.
With the growing need to enhance efficiency and effectiveness of the public sector service delivery, the government has overtime undertaken significant public sector reforms. These reforms encompass human and institutional capacity building, transformative leadership, and strengthening coordination for effective service delivery. In 2004, the Public Service Reforms Secretariat was established to spearhead public sector reforms and has since become the Public Service Transformation Division (PSTD) now domiciled at the Ministry of Public Service, Youth and Gender Affairs (MoPYGA). The PSTD key approach to transformation initiatives is through the results based management approach (RBM). This approach allows for deeper engagement of the stakeholders in the design and delivery of public services. This targeted change and transformation capacities result in broad based institutional reforms that ensure that sectors are competitive in the global arena. For example, one approach of RBM, the Rapid Results Initiative (RRI) has been successfully applied to over 70 public sector institutions including, water, health, immigration and registration of persons, gender, sports, culture and social services sectors. With success reported in improved service delivery such as processing and issuance of national identity cards, passports and birth certificates and reduction of the time taken to register a business among others. This notwithstanding, the application of the RRI in the productive sectors of the economy has been limited.
The agricultural sector continues to contribute significantly to the economy. In 2016, it accounted for 32.6 per cent of the Gross Domestic Product with the crops subsector contributing 25.9 per cent, livestock 4.4 per cent and fisheries 0.5 per cent (KNBS, 2017). In addition, agriculture contributes indirectly to the economy through linkages to manufacturing, distribution and other service related sectors. As such, the sector is a key driver of growth towards the achievement of the Kenya Vision 2030, which is the country’s development blueprint. Agriculture accounts for more than half of Kenya’s exports and 70 per cent of total employment (KNBS, 2017) with majority of the rural population engaged in the sector directly in farming or off-farm activities.
Agricultural production is dominated by small holder farmers owning less than 5 acres of land who produce 75 per cent of livestock, food crop and cash crop in the

3
country and 73 per cent of the total crop produce sold in the domestic market (FAO, 2009; MoA, 2010; KNBS,2016). The remaining 27 per cent is exported and this mainly constitutes the main industrial crops which are tea, coffee and pyrethrum1 .Tea is the leading industrial crop in terms of contribution to the GDP. In 2016, tea accounted for 40 per cent of the marketed agricultural production at current price compared to horticulture’s contribution of 35 per cent. Further, tea contributed 24 per cent of total export earnings amounting to USD 1.25 billion (KNBS, 2017). In addition, tea provides livelihoods to approximately over 600,000 smallholders who contribute approximately 60 per cent of total tea production (GoK, 2016; AFA, 2016). This notwithstanding, only 14 per cent of tea exported is value added and the remaining is sold in bulk form (GoK, 2016). The low level of value addition results to an estimated loss of USD 12 per kilogram of tea. This is an opportunity for investment in the development of value addition along the tea value chain.
Cognizant of the need to address agriculture’s weak integration with other sectors of the economy particularly the manufacturing sector and the rural non-farm economy in Kenya, the Government of Kenya requested ACBF to provide support to conduct capacity needs assessment that will lead to a program development towards strengthening Kenya’s agribusiness sector and its enabling environment. ACBF and KIPPRA partnered in this assessment with collaborating relevant institutes in Kenya. The assessment focused on the tea value chain because it is a leading foreign exchange earner, employment creation and household earnings. Besides the sub-sector has great potential for further growth and development. This is the first step in developing the relevant program to address the capacity gaps identified in this report.
1.1 Terms of reference
The purpose of the study is to undertake a comprehensive assessment of the Government’s capacity to improving the tea value-chain in reference to agribusiness trade and leadership. This will inform the design of a project proposal for transforming the Tea sub-sector.
Specifically, the study objectives are;
1. Review national strategies, policies, practices and challenges with respect to agribusiness, trade and leadership
2. Provide sound situation analysis of the Kenya agri-business sector in relation to trade and leadership capacity;
3. Provide baseline data for assessing Kenya’s capacity development progress in the specific sector;
1 Other industrial crops are sisal, cotton, tobacco, sugarcane and barley
Introduction
4
A Capacity Needs Assessment of the Tea Value Chain in Kenya
4. Assess and analyze the status and gaps of PSTD and the respective sectors’ current institutional and human capacity to effectively and efficiently implement the goals and objectives of the planned intervention.
1.2 Interpretation of the Terms of reference
In addressing the aforementioned terms of reference, the study provided an epoch of the public sector reforms from independence to date. This entailed a review of strategies, policies and practices governing the agricultural sector and the tea value chain. The review examined the extent to which the policy frameworks enable agribusiness, trade and leadership support along the tea value chain.
The situation analysis focused on the tea value chain and described the prevailing conditions in tea production, processing and marketing. In addition the study reviewed support institutions along the value chain including those responsible for regulation and research. A brief analysis of comparator countries was done to gauge Kenya’s competitiveness in the tea sector.
The baseline data is embedded in the synthesis of the situational analysis and capacity gaps assessment sections of the report. An attempt is made to systematically identify the critical indicators.
Finally, the study analysed the status and gaps of the various institutions involved in the tea sector including PSTD to bring out the institutional and human capacity. A synthesis of the capacity gaps is provided based on three entry points namely; individual, organisation and enabling environment.
5
2. Situational Analysis of the Tea Sector
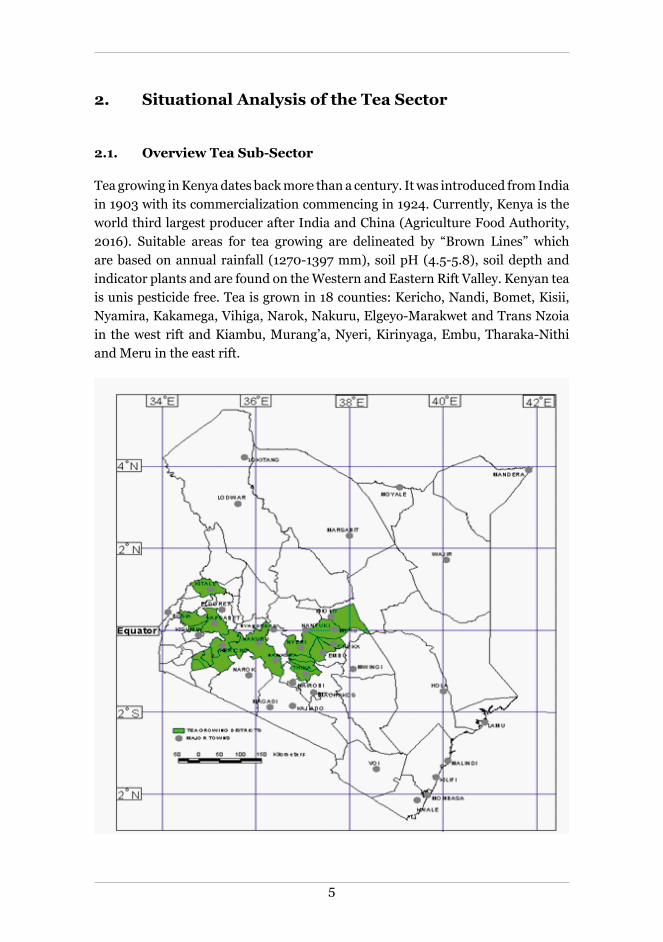
2.1. Overview Tea Sub-Sector
Tea growing in Kenya dates back more than a century. It was introduced from India in 1903 with its commercialization commencing in 1924. Currently, Kenya is the world third largest producer after India and China (Agriculture Food Authority, 2016). Suitable areas for tea growing are delineated by “Brown Lines” which are based on annual rainfall (1270-1397 mm), soil pH (4.5-5.8), soil depth and indicator plants and are found on the Western and Eastern Rift Valley. Kenyan tea is unis pesticide free. Tea is grown in 18 counties: Kericho, Nandi, Bomet, Kisii, Nyamira, Kakamega, Vihiga, Narok, Nakuru, Elgeyo-Marakwet and Trans Nzoia in the west rift and Kiambu, Murang’a, Nyeri, Kirinyaga, Embu, Tharaka-Nithi and Meru in the east rift.

6
A Capacity Needs Assessment of the Tea Value Chain in Kenya
The industry comprises of two categories of growers namely small-scale growers and large scale growers-Estates. The small-scale farmers are over 560,000 in number and sell their produce through 68 factories managed by the Kenya Tea Development Agency Ltd (KTDA). For management purposes, the factories are distributed into seven geographical regions namely; Aberdare Ranges 1 (12), Aberdare Ranges 2 (9), Mt. Kenya (8), Mt. Kenya and Nyambene Hills (8), Kericho Highlands (15), Kisii Highlands (12), and Nandi Hills and Western Highlands (4). The Estates are managed, or owned by multinational corporations and have their own tea factories 39 in number. On average, over the last five years the annual production for tea is estimated at 416, 209 tonnes (209,400Ha) with the small holder contributing 242,098 tonnes, (134,200Ha) an estimated 60 percent of total production and the estates contributing 174,110 tonnes (75,200Ha) (Figure 1).
Figure 1: Total Tea Production in Kenya
Source: (Agriculture Food Authority, 2016)
Kenya has been the leading exporter of tea in terms of volumes in the world for the last decade. Tea was Kenya’s leading export commodity in 2016 with earnings increasing from USD 1.2 billion in 2015 to US$ 1.25 billion in 2016 followed by horticulture (US$ 1.13) and Coffee (US$ 0.21). In terms of volumes, domestic exports rose from 420.5 metric tonnes in 2015 to 480 metric tonnes in 2016 reflecting a 14.1 per cent increase with key export destination being Pakistan, Egypt, UK and Afghanistan.
2.2 The Tea Value Chain
This section reviews the performance, inputs requirements and desired outputs across the different levels of the tea value chain including production, processing and marketing. It also identifies capacity issues, constraints and challenges with the aim of suggesting possible solutions.

7
Figure 2: Tea Value Chain and Industry Structure
Source: Author’s construction
a. Production Level
Tea growing is carried out by small, medium and large-scale farmers. Small scale farmers constitute 71 per cent of all tea growers and have a land holding of 0.2 hectares and below. Large scale farmers comprise of those with landholding of more than 10 hectares. Small-scale farmers sell their produce to 68 factories across the country managed by the Kenya Tea Development Agency (KTDA), which they collectively own. The large scale and industrial estates are represented by the Kenya Tea Growers Association (KTGA) which mainly comprises of large scale producers who process their own tea. KTGA promotes the common interests of its members in the cultivation and manufacture of tea and to promote good industrial relations and sound wage policies for workers. They have approximately 45 members with the main players being James Finlay Company Limited, Eastern Produce Company Limited, Williamson Tea Company Limited, Sasini Tea and Coffee among others. KTGA members own 39 factories which operate as independent entities. Moreover there exists an independent group of growers who do not belong to either KTDA or KTGA. They contribute about 8 per cent of the tea production in the country.
In addition, tea is grown as buffer belts surrounding the forests under the Nyayo Tea Zones Development Corporation Limited. This is a public institution, that promotes environmental conservation by guarding against human encroachment into the water catchment areas. The corporation operates 3,488 hectares with
Large Scale
Green leaf collection
KTG
A
Transporter
Tea factory
Trade
Transporter
Warehouse operator
Traders/Auction brokers
Blenders/Packers
Retailers/Consumers
EATT
A
Polic
y,
Reg
ulat
ory
And
Res
earc
h
Speciality
Medium Scale
KA
LRO
/Tea
Res
earc
h In
stitu
te
Agr
icul
ture
and
Foo
d A
utho
rity/
Tea
Dire
ctor
ate
Min
istry
Agr
icul
ture
, Liv
esto
ck a
nd F
ishe
ries Smallholder
Green leaf collection
Transporter
KTD
A
Tea factory
Green Leaf Production
Tea Processing
Situational Analysis of the Tea Sector

8
A Capacity Needs Assessment of the Tea Value Chain in Kenya
2 factories (Nyayo Tea Zones Development Corporation, 2017). The tea zones protect the forests while, at the same time, contribute towards the rehabilitation of fragile ecological areas. After picking, the green leaf is delivered to collection point by the farmers. The green leaf is then transported to the nearest factory for processing.
Inputs use vary across small scale and large scale tea farms and this together with crop management practices results in variations in tea productivity. The productivity of the small scale farmers is between 2.127-2.291 tonnes/Ha and between 2.834- 3.412 tonnes/Ha for large scale. This translates to an average yield of 1 kg of green leaf per bush per annum for smallholder compared to 3.5 kg for estate. Kenya’s production per hectare is however higher than that of major world producers including India, China and Sri Lanka (Figure 3) (FAOSTAT, 2017). The key inputs in the tea sector include land, labour, capital, seedlings, and fertiliser.
Small scale farming is characterised moribund tea bushes that have implications on this productivity. Tea bushes can take 5-7 years to establish and reaches optimal production at 45 years and thereafter can remain productive for several decades. There is low replacement of moribund tea bushes among the small scale farmers which negatively impact on their productivity. This is caused by the cost of uprooting and replanting as well as the time taken for the new bush to establish. In 2016, a large proportion of tea smallholder farmers had tea bushes planted more than 30-50 years ago unlike the medium and large scale growers who have began to replace their tea bushes.
Figure 3: Yields trends for leading tea growers, 2000-2014
Source (FAOSTAT, 2017)

9
In addressing productivity, the KALRO-TRI has developed high yielding tea clones through research and development. For instance, twenty seven tea clones have been tested for quality, yield, disease and pest resistance by the Institute. This has developed knowledge, innovations and skills in tea growing and production and breeding that combine high yields and acceptable tea properties. The achievements so far have been the discovery of the purple tea, which is a special variety with unique properties2 in comparison to green and black tea.
Tea picking is labour intensive and manual labour constitutes a large proportion of the operation costs. For instance, in 2015 the total labour costs were 68 per cent of the variable costs. Approximately 82 per cent of this labour costs was attributed to plucking (GoK, 2016) as shown in Table 1. To reduce labour costs, many of the estates use a piece rate system to pay labour especially for workers picking tea. The system pays on the amount of tea that has been picked with minimum targets that vary depending on low or high seasons (KHRC, 2008)3.
Table 1: Average farm level variable costs for one acre in 2015
Description Labor costs Percentage Labour Costs
Plucking 3,500 kg x kshs 8.00 28,000 82%
Prunning (1/3) 1,167 x kshs 3.00 3,500 10%
Tipping (1/3) 5 md x 250 1,250 4%
Weeding 5 md x 250 1,250 4%
Total labour cost 34,000
Fertiliser 5 bags x ksh 2,214 11,070
Tea cess 1,463.12
Overhead costs 7.5 % 3,463
Total variable cost 49,996
Source: GoK (2016)
To address the high labour costs for plucking tea, several medium and large scale tea growers have invested in tea plucking machines to improve efficiency in their productivity, cut costs and optimize on profits. For example, a manual plucker picks 32 kgs a day while a machine harvests 1,200 kgs a day with 4 operators reducing costs by almost 35 per cent. In addition, shifting to machine pruning reduces costs by over 80 per cent (Table 2). However, this has been met with resistance which has seen the estates grapple with labour relations from the local communities. In addition, there have been grievances on wages that are usually raised through their labour unions.
2 Purple tea has 16.5 % polyphenols compared to 10.1% for black tea and 9.1% for green tea and has more anhocyanins than blueberries
3 KHRC, 2008 “A Comparative Study of the Tea Sector in Kenya A Case Study of Large Scale Tea Estates”
Situational Analysis of the Tea Sector

10
A Capacity Needs Assessment of the Tea Value Chain in Kenya
Table 2: Cost comparison between manual and mechanized pruning for one acre
No. of Units Rate (KSh.) Total (KSh.)
Manual Pruning
Payment rate per Man-day (KSh.) 29 362.69 10518.01
Total Cost (KSh.) 10518.01
Mechanized Pruning
Fuel 11 Litre 90 990
2T Stroke Oil 0.440 Litre 340.91 150
Labour 2 362.69 725
Total Cost 1,865
Source: GoK (2016)
Besides, there is a lack of a clear policy on land lease renewal among the multinational tea estates. Currently, there is no institution within the tea industry that has taken up the matter to initiate discussion with the County governments thereby threatening the future of tea farming. Most of the tea firms have land lease from the national government of 99 years. Without a clear policy on the renewal of the leases at the county level creates uncertainty among the tea estates and this can slow down investment and overall productivity of the firms.
Further, tea is sensitive to climate change. Weather has a greater effect on tea production with warmer areas associated with higher yields. Frequent weather variability induced frost bites mainly in Kericho, Bomet and Nandi counties is one of challenges facing tea production in Kenya. Excessive rains affect the quality of the roads, slows delivery of tea leaves leading to high losses. Kenya’s monthly and yearly rainfall and mean air temperature will increase progressively to a maximum of 25 percent and 4.3oC respectively, implying that the distribution of current suitable cultivating areas for tea, in general, will decrease drastically by 2075. Climate projections show that by 2075, the brown line would shift to between 2100 and 3000 m above sea level, areas currently used for conservation activities. If climate conditions continue to change - with a mean air temperature increase of more than 4oC - the tea growing areas are likely to shrink further, despite a rise in the amount of rainfall (Chesereck, 2015).4
Key Issues
• High cost of plucking using manual labour• Lay-offs due to adoption of plucking machines• Replacement of moribund tea bushes by small scale farmers• Uncertainties surrounding renewal of land leases for tea farms• Shift in brown lines due to climate change
4 Cheserek, B (2015). GIS analysis of suitable areas for growing tea in Kenya under various climate change scenarios. FAO, Rome.

11
Key recommendations
• Adoption of mechanized plucking• Engagement with the labour unions on adoption of plucking machines• Adopting new clones as well as provide the financial support required for the
replacement of tea bushes• Development of clear regulations on land lease by County governments• Adoption of climate resilient tea clones
b. Processing Level
Establishment of tea factories require heavy capital investment. For example, it costs an estimated KSh.350 million to set up a factory that can produce 5-million kilograms annually or an estimated KSh.600-million to set a factory with an annual capacity of 15-million kilograms (Gok, 2016)5. Despite factory machinery being duty and VAT exempt the costs are still prohibitive, some factories like Kionyo’s (Meru County) have benefited from World Bank funding to build their factory. For factories, the major inputs are factory equipment, raw materials, energy, labour and water. The other cost items include transportation and a myriad of license fees, levies and taxes (CPDA, 2008)6.
The cost of tea processing are high including labour and energy. Tea factories experience high labour wages occasioned by agitation by the trade unions like the Kenya Agricultural and Plantation Workers Union. This tied with low labour productivity affecting the return to farmers and therefore calls for adoption of automated processing to curb the overall production costs. Similarly, factories incur high energy cost with some relying heavily on wood fuel. Most factories purchase wood from local suppliers or grow their own tree plantations contributing to significant deforestation. Energy costs are particularly high in the KTDA factories with their energy cost being at 60 per cent while the estates have the same cost at 30 per cent. Due to the high electricity costs in the country and the high energy requirements in tea processing, sourcing power through the national grid has proven expensive. As such, to reduce the high-energy costs, KTDA has constructed 3 small hydropower plants (≤15 MW) and 7 more are under construction on rivers close to tea factories. Some factories like Iriani (Nyeri County) generate 10 percent of their electricity needs while other factories like Ngorongo tea factory (Kiambu County) leases land for fuelwood. James Finlay factory have installed solar panel to reduce the energy cost. This therefore raises a need to assess the energy costs for the KTDA managed factories especially on their efficiency as compared to the Estates factories in addition to adopting innovations for reduction of energy cost which necessitate that the factories shift to energy efficient technologies.
5 Gok, 2016 Ministry of Agriculture, Livestock and Fisheries Task force report on the tea industry, 2016.6 Christian Partners Development Agency (CPDA), 2008, “Report on small scale tea sector in Kenya”
Situational Analysis of the Tea Sector

12
A Capacity Needs Assessment of the Tea Value Chain in Kenya
Tea processing is characterised by minimum value addition. Tea processing mainly involves the production of black tea using the Cut, Tear, and Curl (CTC) method, though smaller quantities of green, white, and orthodox tea are also produced. This is done through wilting, bruising, oxidation, fermentation, rolling and drying of tea. Over 96 per cent of processed tea is a single tea product (Black CTC). Only 4 per cent is speciality tea a fact attributed to low technical capacity in terms of expertize and production technology (limited technology of factory for speciality teas).
Presently there are 106 tea factories in Kenya. KTDA factories are owned by the smallholder tea farmers through shareholding and have different processing capacity. For instance, Iriani farmer factory serves 6,500 smallholder tea farmers and has an annual production capacity of 15 million kilograms (kgs) for green leaf capacity and capacity to produce 1.6 million kgs of made tea during a good harvest and 700,000 kg during a poor harvest. Similarly, Ngorongo tea factory produces 4 million kgs of made tea annually of both black CTC and green tea while Rukiriri tea factory Green Tea capacity is 15 million kgs and with potential to produce 18 million kgs serving 9,000 small scale farmers. The quality of tea produced is determined mainly by two factors one the geographical conditions of where the tea is grown i.e., soils, climate, rainfall patterns, temperatures and crop husbandry practices. It also depends on the level of mechanization and efficiency in individual factories.
Due to the structure of the Kenyan tax system, there are multiple taxes and levies (especially at the county level) applicable to the industry. The national government imposes an ad valorem levy which is charged at 1per cent and a 16 per cent on warehouse services and on packaging materials whereas the County governments impose agricultural produce cess (e.g. Kiambu County Government has enacted agricultural produce cess laws). These have curtailed growth of tea processing in the country. In addition, there are concerns over delay in remission of value added tax (VAT) refunds thereby reducing available working capital. There is therefore need to harmonize taxes and levies across counties and create awareness on existing taxes and relevant regulations. The factories managed by KTDA also need resources to expand their capacity to enable production of other teas other than black CTC tea.
Key Issues
• High capital investments for establishing the factories• Low level of diversification i.e. concentration in production of black CTC tea• Multiple taxations• High energy costs

13
Key recommendations
• Establishment of special economic zones in tea growing areas to encourage establishment of factories and reduce the costs of initial investment
• Introduction of technologies for production of other teas other than black CTC tea
• Need for incentives for factories to expand their capacity to produce of other teas other than black CTC tea
• There is therefore need to harmonize taxes and levies across counties and create awareness on existing taxes and relevant regulations
• Assessment of variations costs between KTDA managed factories and Estate factories
• Adoption of innovations for reduction of energy costs
c. Marketing and Sales-Activities Level
Once processed, tea is sold domestically and internationally through contracts and auction in Mombasa. Domestic market tea is blended, packaged and sold through wholesale and retail channels, while export market tea is packaged in 50-70 kg and sold at the auction in bulk. Blending and packaging is usually done outside the country, depending on the different importing markets. For example, Pakistan, Egypt and United Kingdom prefer black tea, France prefer green tea, while Germany and United States of America prefer speciality teas. There are market entry barriers including quality and food safety requirements, consumer drive standard particularly to high end tea markets. These barriers limits the participation of small scale farmers.
Two groups represent the downstream tea value chain; East African Tea Trade Association (EATTA) and Kenya Tea Packers Association (KETEPA). EATTA brings together tea Producers, Brokers, Buyers and Packers and various warehouse operators. EATTA facilitates trade in Mombasa tea auction, tea trade arbitration as well as compiling and circulating statistical information. KTDA has subsidiaries involved in the marketing of tea. Among them are KETEPA which is involved in tea blending, packaging and distribution for the domestic market and Chai Trading Company which is involved in warehousing, blending, bulk packing, buying and selling of tea to international markets. In addition, KTDA owns Dubai City Centre Mirdif which markets Kenyan tea to Gulf region, Middle East and Russia.
The main tea marketing channel in the country is the Mombasa Tea Auction which is the largest tea auction in the world. About 82 per cent of Kenyan tea is sold through the Mombasa Tea Auction, 13 per cent through direct sales, 2 per cent through factory door sales and 2 per cent through sales to packers (GoK, 2016). Over 80 per cent of exports is dominated by 5 multinational cooperation, limiting the role of Small and Micro-Enterprises.
Situational Analysis of the Tea Sector
14
A Capacity Needs Assessment of the Tea Value Chain in Kenya
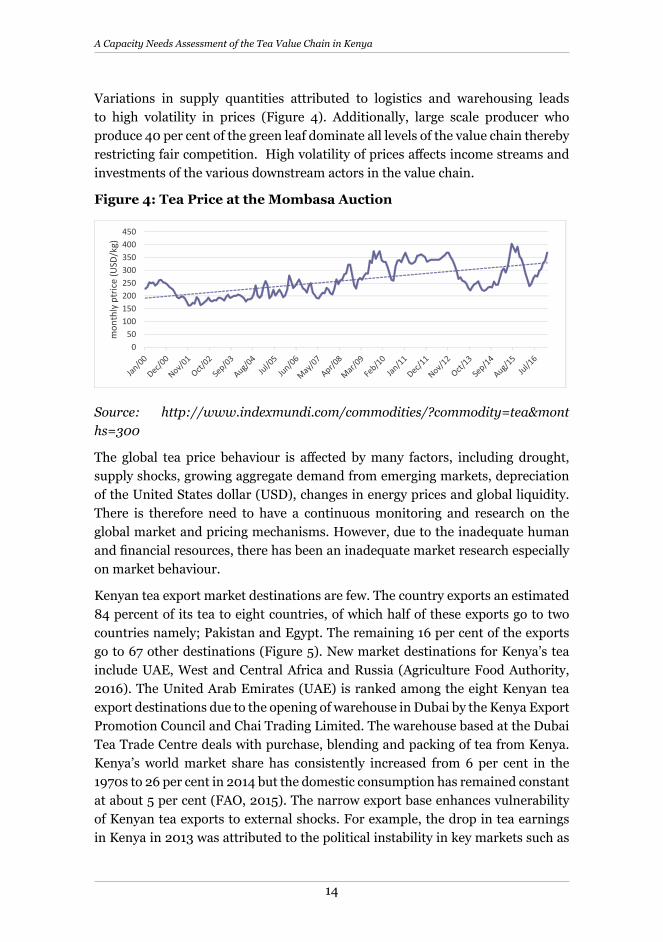
Variations in supply quantities attributed to logistics and warehousing leads to high volatility in prices (Figure 4). Additionally, large scale producer who produce 40 per cent of the green leaf dominate all levels of the value chain thereby restricting fair competition. High volatility of prices affects income streams and investments of the various downstream actors in the value chain.
Figure 4: Tea Price at the Mombasa Auction
Source: http://www.indexmundi.com/commodities/?commodity=tea&months=300
The global tea price behaviour is affected by many factors, including drought, supply shocks, growing aggregate demand from emerging markets, depreciation of the United States dollar (USD), changes in energy prices and global liquidity. There is therefore need to have a continuous monitoring and research on the global market and pricing mechanisms. However, due to the inadequate human and financial resources, there has been an inadequate market research especially on market behaviour.
Kenyan tea export market destinations are few. The country exports an estimated 84 percent of its tea to eight countries, of which half of these exports go to two countries namely; Pakistan and Egypt. The remaining 16 per cent of the exports go to 67 other destinations (Figure 5). New market destinations for Kenya’s tea include UAE, West and Central Africa and Russia (Agriculture Food Authority, 2016). The United Arab Emirates (UAE) is ranked among the eight Kenyan tea export destinations due to the opening of warehouse in Dubai by the Kenya Export Promotion Council and Chai Trading Limited. The warehouse based at the Dubai Tea Trade Centre deals with purchase, blending and packing of tea from Kenya. Kenya’s world market share has consistently increased from 6 per cent in the 1970s to 26 per cent in 2014 but the domestic consumption has remained constant at about 5 per cent (FAO, 2015). The narrow export base enhances vulnerability of Kenyan tea exports to external shocks. For example, the drop in tea earnings in Kenya in 2013 was attributed to the political instability in key markets such as
050
100150200250300350400450
mon
thly
ptr
ice
(USD
/kg)

15
Egypt and Sudan. The overreliance on a few export markets is partly attributed to low investments in promotion and marketing. Besides, total exports to major markets have been declining expect for Pakistan, Egypt and Russia (Figure 5). Kenya needs to focus on sustaining the current markets as it endeavours to access markets in the high consuming countries including Turkey, Morocco, Nigeria and Ireland currently not covered.
Figure 5: Tea exports by destination
Source: (Agriculture Food Authority, 2016)
Figure 6: Percent change in export volumes the main tea markets, between 2011 and 2016
Source: (EATTA, 2017)
26
6
-19
-12
0
23
7
-4-11
-25
-20
-15
-10
-5
0
5
10
15
20
25
30
PERC
ENT
Situational Analysis of the Tea Sector

16
A Capacity Needs Assessment of the Tea Value Chain in Kenya
Furthermore, Kenya receives low earnings from tea despite high export volumes compared to other countries (Figure 7). For instance, in 2013, Kenya exported 131 metric tonnes more than Sri Lanka but it earned USD 0.3 billion less. This is because Sri Lanka has concentrated on niche marketing and product differentiation as opposed to bulk marketing adopted in Kenya. Sri Lanka’s earning from branded teas was USD 0.72 million which is 63 per cent more than Kenya’s earning from branded teas. The same situation persists regarding, tea extracts with Kenya lagging India, Sri Lanka and China (Figure 8).
Figure 7: Export Quantity and Value of Tea in India, Kenya, Sri Lanka and China in 2013
Source: FAOSTAT, 2017
Figure 8: Export Quantity and Value of Tea Mate Extracts in India, Kenya, Sri Lanka and China in 2013
Source: FAOSTAT, 2017

17
Value addition and branding of Kenyan tea is minimal as compared to other tea producing countries. Restrictions related to packaging of branded tea in 10 kilograms packets limits access to international markets which require larger quantities. Inadequate branding of Kenyan tea in the international market is as a result of the auction model of marketing where most international companies buy the tea at the Mombasa Tea Auction, blend it abroad and brand it in their individual company brands. Apart from the absence of a Kenyan brand in the international market, Kenya does not have geographical indications branding with respect to Kenyan tea. This has reduced the country’s competitive advantage in the international market. It is estimated that with the quality of tea in the country, branding and geographical indications of Kenyan tea could yield an additional 100 to 200 million dollars in GDP (GoK, 2015). There is therefore need to come up with incentives for value chain actors to value add their products locally and at the same time attract new entrants into the tea value addition industry. In addition, the Tea directorate needs to fast track the registration of Kenyan brands by World Intellectual Property Organization and Kenya Industrial Property Institute that will give the unique Kenyan tea attributes and protect its branding in the international market.
The absence of a tea policy also contributes to the low levels of value addition in the country. Although through KTDA small-scale tea farmers produce more than 60 percent of the Kenyan tea crop, much of the value addition in the tea sector happens at among entrepreneurs – (private sector and Estates) and thus there is not much benefit that the smallholder farmers get in regards to value addition. However, few factories such as Iriani Tea Factory has been value adding their tea before it goes for auctioning thus earning their farmers higher profit margins. As such, there is need to fast track the proposed National Tea Policy with an aim of streamlining value addition in the country. The policy will provide the broad framework and guidelines to ensure that the tea industry is sustainable and competitive as well as provide for the establishment of a value addition development fund as recommended by the 2007 Tea Task Force Report which will go a long way to in encouraging innovations. The policy will also enhance the legal framework that encompasses value addition by providing the groundwork for the enactment of the Agricultural Products Value Addition Bill aimed at addressing value addition in the tea industry and the Geographical Indications Bill that addresses issues of branding of Kenyan products as recommended by the 2007 Task force Report.
The Tea industry is faced with the challenge of multiplicity and dynamics of the international standards especially relating to quality and ethics e.g. fair trade and rain forest alliance e.t.c. This makes it difficult for the industry to compete in the international markets. As such there is need to build the capacity of the regulating
Situational Analysis of the Tea Sector

18
A Capacity Needs Assessment of the Tea Value Chain in Kenya
bodies (e.g. Kenya Bureau of Standards (KEBS) to provide leadership in the domestication and harmonization of standards while at the same time provide a platform to sensitize the value chain actors.
From the domestic front, it is noted that local consumption of tea is low despite being the global leader in production of the best quality teas. Kenya’s annual per capita tea consumption is estimated at 0.47 kilograms (GoK, 2016), which is low compared to other countries like Turkey (7.54 kg), Morocco (4.34 kg) and Ireland (3.22 kg). This phenomenon is blamed on the distribution of low grade tea in the country that has led to infiltration of teas from other markets. The presence of an unexploited local market presents an opportunity in the sector but this will necessitate investment in the local distribution system. However, to boost domestic consumption, PSTD have initiated consumption of purple tea in government offices starting with Cabinet Secretary Offices.
Moreover, there is low level of product diversification into speciality teas such as white, green, oolong and purple teas. For example, tea extracts accounts for only 2 per cent of the tea products marketed from Kenya with the dominant product being the black cut-tear–curl teas (CTC) accounting for 92 per cent of the products as shown in Table 4. There are only three factories that are producing speciality teas. Therefore, there is need for more product diversification in the country that will tap into the ready market for speciality teas. Apart from speciality tea, there is also an upcoming market for tea extracts (see Figure 9) that is used in the manufacture of other products. Currently (2016) there is only one investor engaged in the manufacture of tea extracts in the country, hence there is need for incentives to encourage investors to invest in tea processing through regulations and incentives such as tax exemptions. There is also need to invest in capacity building to have skilled researchers who will be employed in researching in the types of speciality tea and tea extracts and their markets. Speciality teas are dependent on the processing; there is a need to increase the technological knowhow, skills and machinery in the country to include the other processes needed to manufacture speciality teas. Most of the factory capacities consist of wilting, bruising, oxidation, rolling and drying processes needed to produce black CTC tea. This will necessitate the additional processes specifically fixation, yellowing and curing which are missing in the tea processing industry in the country.

19
Table 4: Market Share by Type of Product
Product type Percentage
Black CTC 92%
Tea bags 3%
Speciality tea (green, purple ,white) 2%
Flavoured tea 1.5%
Instant tea 1%
Ice tea 0.5%
Source: GoK, 2016
Figure 9: Kenyan Tea Mate Extracts imports
Source: FAOSTAT, 2017
Key Issues
• Fluctuation in supply causing high price volatility in the auction• Market dominance controlling market supply• Low participation of SMES in the Mombasa tea auction • Narrow export base• Limited value addition and branding of Kenyan tea • Multiplicity and the dynamics of the international standards and consumer
driven standard • Low domestic consumption of Kenyan tea• Low level of product diversification into speciality teas such as white• Market protectionism through tariff and non-tariff barriers
Situational Analysis of the Tea Sector

20
A Capacity Needs Assessment of the Tea Value Chain in Kenya
Key recommendations
• Effective coordination warehousing and logistic systems to ensures stable supply of tea
• Effective regulation and enforcement of competition related laws and regulations
• Monitoring and research on the global market and pricing mechanisms• Promotion targeting new and other emerging markets through bilateral
agreements• Promotion tea drinking culture in the domestic market • Develop promotional strategy including the mark of origin to be used in
branding of Kenyan tea• Promotion of varieties of Kenyan brands • Domestication and harmonisation of international standards and consumer
driven standards with domestic standards• Speciality teas are dependent on the processing, there is a need to increase
the technological knowhow, skills and machinery in the country to include the other processes needed to manufacture speciality teas.
2.3 Policy and research strategies
The key agriculture sector actors are the Ministry of Agriculture, Livestock and Fisheries and the Tea Directorate housed by Agriculture and Food Authority. The MOALF is in charge of formulating the overall agriculture policy and assisting the county governments on agricultural matters. The ministry was instrumental in the consolidation of Agricultural Reform Bill which enacted the Agriculture, Food and Fisheries Act (AFFA) 2013, Crops Act 2013 and Kenya Agricultural and Livestock Research Act (2013). The AFFA Act (amendment 2016) provided for the consolidation of the separate laws on the regulating and promoting the agricultural sector, leading to the establishment of the Agriculture Food Authority (AFA). The Tea Directorate is among the instutitions provided for by this Act.
The Kenyan tea sector is governed by the Crops Act, 2013 and the AFA Act, 2013. The Crops Act regulates the registration of tea growers, growers associations, dealers, manufacturing licence, licensing, inspection, levies and arbitration and resolution of disputes. For example, new tea farms are expected to meet certain conditions such as: (i) the land must be within the “Brown Lines” delineation (ii) TRI must conduct a soil and terrain analysis and recommend the appropriate clones to use. These conditions impose controls necessary in preventing tea growing in unsuitable areas that may affect the quality of Kenyan tea as well as ensuring supply of mainly food crops to tea producing areas. Despite the existence the Tea (Amended) Act 2012 there is no Tea Policy. The absence of a specific policy has led to less focus, prioritization and limited funding of the sector by the exchequer.

21
The Tea Directorate is responsible for regulation and control of tea cultivation, processing and trade; investigation and research; promotion and marketing of Kenya tea; policy advice; and information dissemination. The Tea Directorate also licenses tea manufacturing factories and regulates and controls the method of manufacture. While licensing a new factory, the Directorate ensures there is adequate leaf to meet processing capacity, without creating over-capacity in any given zone. Licensed factories are required to maintain a register of growers falling under them, on behalf of the Tea Directorate. In the case of new investors, the Tea Directorate arbitrates to decide how the growers are distributed between the existing and the new factory before issuing a license. License for new factories are issued to a person or company who has at least 250 hectares of planted tea bushes. A group of persons or companies may apply jointly for a license, but this will only be issued if they have at least 250 hectares of tea bushes and the land parcels are within a fifty (50) kilometre radius. In special cases, where an applicant seeks to manufacture high value specialty or value added teas, the Directorate may grant a license based on the economic viability, technology used /or range of products. The AFA- Tea Directorate may vary, cancel or suspend any license issued to a company if the terms and conditions of the license are violated.
Whereas the AFA, 2013 was a key reform in the agriculture sector, it has had negative effect on tea subsector. The downgrading of the Kenya Tea Board (KTB) into a Tea Directorate put tea at the same level with other crops such as sugar, maize and horticulture among other. Before the reforms, KTB was a global brand which has now been lost. In countries like Sri Lanka, where tea is of strategic importance, it is managed under a development board.
The devolution has also brought challenges in the coordination of the tea industry. According to the Fourth Schedule of the Constitution of Kenya 2010 the national government has the responsibility of developing the agricultural policy. Other functions retained within the national government that have impact on agriculture development include the use of water resources, consumer protection and protection of the environment for sustainable development. The Agriculture functions and powers devolved to the county government include crop and animal husbandry; livestock sale yards; county abattoirs; plant and animal disease control; and fisheries. Other functions that indirectly support agriculture development include licensing and control of undertakings that sell food to the public; veterinary services (excluding regulation of the profession); trade development; and regulation for markets and cooperative societies. In the previous regime, all matters related to the sector were coordinated at the National level. In the devolved system, there are overlaps in roles between the two levels of government. For instance, where matters relating to the regulation of tea manufacture, trade, international market development and product promotion,
Situational Analysis of the Tea Sector
22
A Capacity Needs Assessment of the Tea Value Chain in Kenya
are functions of the Tea Directorate, county governments have mandate to register and regulate tea nurseries, tea packers and green leaf transporters. The coordination between AFA-Tea Directorate and the county governments is critical for effective regulation of the sub-sector.
In 2012, the agribusiness strategy was developed with five key strategic priorities to trigger agribusiness growth including; market oriented agriculture in all stages of the value chain; focused research development and innovation to better catalyze growth of a vibrant agribusiness sector; promote better coordination of the actors in the sector for improved productivity; improve the range and effectiveness of financial and non-financial services; finally attract investment by creating an enabling environment. On trade the strategy proposes a market oriented agribusiness sector in which all activities in the value chain are geared towards addressing the market needs. Further, it calls for aggressive and innovative marketing for Kenyan products that includes branding in the international markets. It also calls for improvement of market infrastructure in Kenya. The strategy identifies weak governance of institutions as one of the key challenges. It noted that there have been market distortions in some sectors due to political interference. Other challenges include poor resource management and misappropriation of funds. It proposes that the agribusiness institutions should be free from political interference and that the appropriate laws to be applied to deal with mismanagement and misappropriation of funds.
The National Trade Policy 2016 provides for an export-led growth with emphasis on value addition and agro-processing. It further emphasizes institutional reforms toward increasing efficiency and lowering transaction costs. In addition, it entails improvement in the ease of doing business and investment in infrastructures and market linkage in order to improve prospects for value addition and expansion of export trade. The national export-led strategy singles out a number of agricultural products for value addition and diversification including tea, coffee and pyrethrum, and horticulture. The government also pursues market expansion through bilateral, regional and multilateral trade commitments. The enactment of the Special Economic Zone Act 2015 provides an opportunity for the tea sector value addition by creating an enabling environment including provision of integrated infrastructure such as roads, energy, ICT, water and the creation of tax incentives.
Research and Development
Tea research focuses on development of improved cultivars, suitable technologies for improvement of yield (quantity of green tea leaf/made tea per hectare) and quality of diversified tea products. The main research institution is the Tea

23
Research Institute (TRI) which was established in July 2013 under the Kenya Agriculture, Livestock Research Organization (KALRO)7. TRI’s mandate is to promote research and investigate problems related to tea and such other crops and systems of husbandry such as productivity (yield), quality and suitability of land in relation to tea planting.
Research in the tea sector takes place at all levels of the value chain. At production level investigations are carried out on crop development, pest and disease management, crop husbandry, breeding using conventional breeding approaches, molecular breeding approaches, genomic approaches and genetic engineering approaches, to develop adaptable tea varieties/clones. So far research and development by the Tea Research Institute (TRI) has yielded fifty one (51) tea clones8 which are tested for quality, yield, disease and pest resistance. For instance, purple tea, which is a special variety with unique properties9 is a product of research. Other innovations have included developing clones that take 2 years to mature rather than the 3 to 4 years. Additionally, varieties have been developed that require less spacing and that yield up to 3 kgs per bush in a year. In addition, simple motorized hand machines for pruning and harvest have been developed (see Plate 1-appendix).
TRI also supports tea growers through soil testing, knowledge transfer on technology and recommended tea production practices from research findings for sustainable high production and quality. This is done through demonstrations and field visits, trainings and publications such as the tea grower’s handbook, fertilizer handbook and cultivation handbook all of which are subsidized. It also produces quarterly publications on tea farming that are distributed free of charge to the farmers. The Institute has laboratories where analytical testing on soil, leaf and fertilizer analysis, tea quality, pest and disease identification crops, agrochemicals evaluations and botany elements are carried out.
At the processing level research has focused on developing systems and improved technologies, to enhance factory throughout and efficiency in tea manufacturing. Improved technologies for enhanced output in tea factories are important for peak seasons where there is significant wastage of tea produced by farmers. However, there is limited research focusing specifically on value addition and marketing of tea.
Tea research is however being threatened by inadequate funding. For a while 70 percent of its operations was funded from the tea manufacturing levy and the Ad valorem levy, while the remaining 30 per cent was internally generated 7 TRI is one of the sixteen research institutes created under KALRO Act, 20138 See list of some of the clones in Appendix II9 Purple tea has 16.5 % polyphenols compared to 10.1% for black tea and 9.1% for green tea and has more anhocyanins than
blueberries
Situational Analysis of the Tea Sector
24
A Capacity Needs Assessment of the Tea Value Chain in Kenya
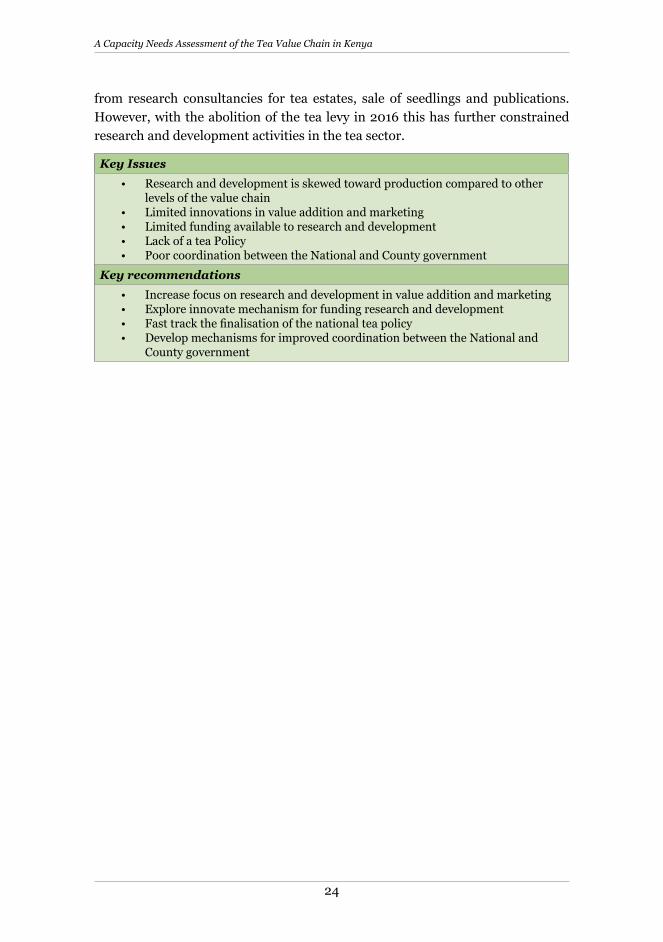
from research consultancies for tea estates, sale of seedlings and publications. However, with the abolition of the tea levy in 2016 this has further constrained research and development activities in the tea sector.
Key Issues
• Research and development is skewed toward production compared to other levels of the value chain
• Limited innovations in value addition and marketing• Limited funding available to research and development• Lack of a tea Policy• Poor coordination between the National and County government
Key recommendations
• Increase focus on research and development in value addition and marketing• Explore innovate mechanism for funding research and development• Fast track the finalisation of the national tea policy• Develop mechanisms for improved coordination between the National and
County government
25
Sri Lanka Tea IndustrySri Lanka is the 2nd largest tea producer with a production of about 340 million kilograms of tea per annum and commands 23% of the global exports. It is the leading producer of orthodox tea. In a bid to improve green leaf production, in 2016 the government of Sri Lanka approved a fertilizer subsidy for tea farmers with a cultivated land of less than two hectares. Sri Lanka has invested heavily in tea value addition which resulted in the country exporting 51 per cent of tea in value added. The Value added product range of Sri Lankan tea includes green tea, flavoured tea, organic tea, instant tea, iced tea, and ready-to-drink tea. Apart from food and drink products, the country also produces different variety of products including tea based soap, bath gel, shampoo and other cosmetic products. To enable international recognition of its teas, the country has invested in brand development which is globally recognized. Branding development includes the Ceylon Tea Lion Logo which appears on Ceylon tea packs. Sri Lanka Tea Board is the legitimate owner of the Ceylon Tea Lion logo and has registered it in several countries. In order to ensure quality and source identification, the usage of Lion Logo is subject to the following conditions: the logo can be used only on consumer packs of Ceylon tea, the packs should contain 100 per cent pure Ceylon tea, the brands which use the Lion Logo should be packed in Sri Lanka and the brands using the logo should conform to the quality standards set out by the Sri Lanka Tea Board.Ceylon type of tea consisting of black, green, and white/orthodox teas is the most common type of tea in Sri Lanka. In tea exports, orthodox tea makes up about 92 per cent of Sri Lanka tea exports with CTC and green tea making up 7 per cent and 1 per cent respectively. In an endeavour to increase export revenue, Sri Lanka has been promoting the packaging sector of the tea industry. This has seen exports of packet tea increase to 42 per cent of tea exports, tea bags, instant tea, green tea and other packaged tea accounted for 2 per cent of tea exports in 2014. Sri Lanka’s export destinations are diverse with no single country accounting for more than 14 per cent of the exports. The leading export destinations include Russia and Turkey with 14 per cent each, Iran at 9 per cent and United Arab Emirates at 6 per cent.The discovery of the effect of the diverse climate on tea production has resulted in manufacturing of an array of fine teas which like wine are unique to each agro climatic district in Sri Lanka. This has led to the branding of diverse products with a variety of flavours and aromas based on their geographical location. The high altitude areas (above 4000 feet) produce about 19 per cent of Sri Lanka’s tea production with its tea varieties popular in Germany and Japan. About 32 per cent of the tea is produces in the medium altitude areas (2000 to 4000 feet) and its teas are popular in Australia, Europe, Japan and North America. The bulk of tea production is produced in the low altitude areas (below 2000 feet) which accounts for 49 per cent of production and the tea varieties are popular in Western Asia, Middle Eastern countries and Commonwealth of Independent States (CIS) and Brazil, Russia, India, China and South Africa (BRICS).In order to access various world markets, Sri Lankan Tea industry aims at maintaining high quality standards with the ISO 3720 being the minimum standard applied in the tea sector. The country also aims at reducing pesticide residues which led to the removal of methyl bromide from the production process in 2012. Sri Lanka also is in the process of adjusting to food safety management system specified in ISO 22000 series and to the health and safety regulations stipulated by the European Community. To this end, the growers are constantly educated on Good Agricultural Practices (GAP) while processing and manufacturing facilities comply with local standards (SLSI) and International Quality Standards such as ISO, HACCP, and EU Standards. Traceability throughout the supply chain is monitored in order to guarantee compliance.Part of the success in Sri Lanka tea industry can be attributed to immense government support through the coordinated effort of the Ministry of Plantation, Sri Lanka Exports Development Board and Sri Lanka Tea Board. The assistance includes system certification scheme, tea grading area capacity development scheme and assistance programme for promotion and development of brand names and brand excellence, facilitating tea exporters to expand their business opportunities at the international platforms. Other initiatives include, inward buying missions and product development programmes, tax incentives on value addition, introduction of simplified trade policies, legal and institutional awareness programs, quality improvement programmes and training on market access requirements.Additionally, there has been heavy investment in research with the country having the biggest Tea Research Institute in the world. Investment in research and development has seen the development of improved techniques on tea plantations, plucking, input application, post-harvest management, packaging, transport and marketing practices especially for export market. Organic tea production is also developing in the country with players getting certified under planters’ certification schemes. This is also complemented by well-established road-rail network and highways that facilitates the sectors growth through seamless trade both for local consumption and export. This has enabled tea to be delivered to the factories, warehouses and port within a few hours of motoring. In addition, the country’s capital, Colombo, has a port that operates large ships regularly as well as an international airport that facilitates tea exporters to reach number of destinations worldwide.
Situational Analysis of the Tea Sector

26
A Capacity Needs Assessment of the Tea Value Chain in Kenya
3. Assessment of Institutional and Human Capacities Relevant to the Tea Sector
In conducting the institutional and human capacity assessment, the study adopted the ACBF definition of capacity assessment, which is a situation analysis of existing capacity where an assessment determines capacity “gaps” by comparing desired capacities against existing capacities and formulate strategies to address them (figure 10). In addition, the UNDP framework for capacity assessment was used to provide a structure for discussion on the scale and scope of the study, thus providing a systematic approach for assessing existing capacities, needs and developing capacity responses. The framework provides for capacity assessment at different entry points namely; enabling environment, organizational and individual level, and which account for core issues of knowledge and accountability as well as functional and technical capacities (UNDP 1997 and 1998).
The enabling environment describes the broader system within which individuals and organizations function and one that facilitates or hampers their performance. It includes policies, legislation, power relations and social norms which govern the mandates, priorities, modes of operations and civic engagement across different parts of the society. Organizational capacity relates to operational rules, internal procedures and systems, management and governance structures that allow and /or facilitate the organization to sustainably perform effective and deliver on its mandate and strategic goals, objectives and actions. They shape how various actors come together to perform tasks and these organizational features can either facilitate or constrain performance. At the Individual level, competency or capacity is a combination of attributes that encompasses knowledge, experience, technical skills, attitudes and behaviours that enable an individual to perform in his/her job in a more effective manner.
Application of the framework involved three steps: (i) assess the existing capacity, usually based on a situational analysis (ii) assess future capacity based on policies and strategies of the sub-sector, and (iii) identify the capacity gaps. The analysis facilitates the development of intervention measures targeted to public institutions that are critical for the transformation and competiveness of the tea industry. In addition, capacity gaps of public sector institutions in the tea value chain and selected tea growing County governments are reviewed.

27
Figure 10: Conceptual framework
Source: ACBF, 2011
In carrying out the assessment, a Likert scale of 0-4 was used in evaluating the various indicators/variables. The scale describes the gaps identified between the exiting and the desired capacities as follows; 0 = fully developed capacity; 1 = widespread but not comprehensive evidence of capacity; 2 = partially developed capacity; 3 = anecdotal evidence of capacity; and 4 = no evidence of relevant capacity.
The assessment was carried out in 6 public institutions and 13 County Governments where tea is grown. At the counties data was obtained from County Executive Committee on Agriculture, Executive Assembly Committee Members (MCAs) together with Clerks to the Committees/Assemblies. The data captured the opinion of the respondents on the capacity of the County Governments to provide quality services and leadership to tea agribusiness and trade along the value chain. Key informant interviews and focus group discussions were used to collect data along the tea value chain. Public institutions were selected based on their role in promoting of agribusiness and trade and leadership along the tea value chain. They include: Ministry of Agriculture, Livestock and Fisheries (MoALF), AFA-Tea Directorate, Tea Research Institute (TRI), Ministry of Trade (MoT), the Export Promotion Council (EPC) and Ministry of Public Service, Youth and Gender Affairs- Public Service Transformation Department (MoPSYGA- PSTD).
3.1. Capacity Assessment of Public Sector Institutions
This section identifies the capacity gaps in the public-sector institutions to effectively deliver their mandates in regard to policies, regulations and leadership in the context of the tea value chain. The institutions assessed are Ministry of
Desired Capacity Capacity gaps Existing
Capacity
Assessment of Institutional and Human Capacities Relevant to the Tea Sector

28
A Capacity Needs Assessment of the Tea Value Chain in Kenya
Agriculture, Livestock and Fisheries (MoALF), AFA-Tea Directorate, KALRO-Tea Research Institute (TRI), Ministry of Trade (MoT), the Export Promotion Council (EPC) and Ministry of Public Service, Youth and Gender Affairs- Public Service Transformation Department (MoPSYGA- PSTD). The capacity gaps are presented at three levels; enabling environment; organizational and individual (Table 5).
Table 5: Capacity gaps in public sector institutions
MoALF AFA KALRO-TRI
MoT EPC MoPSGYA-PSTD
ENABLING ENVIRONMENT
1. Existence of an effective legal framework on which the mandate is anchored
0 2 2 1 1 1
2. Policy framework 2 2 2 2 2 2
3. Capacity of Governance /Leadership in the Tea Sector
0 2 2 1 1 1
Overall Capacity Gap 1 2 2 2 2 2
ORGANIZATION LEVEL
1. Ability to develop, articulate, implement and monitor Strategic Plan
0 3 3 2 2 2
2. Existence of transformative organization structure
0 3 3 1 0 2
3. Capacity to fund planned activities in the strategic plan for the tea sector
1 2 2 1 2 1
4. Capacity of the existing systems in achieving strategic priorities
2 2 2 2 2 2
Overall Capacity Gap 1 3 3 2 2 2
INDIVIDUAL LEVEL
1. Staff Numbers 2 3 3 2 2 3
2. Competencies 0 2 2 2 0 2
3. Skills 1 2 2 2 1 2

29
4. Attitudes 2 2 2 2 2 2
5. Reporting on time 2 2 2 1 2 2
6. Respect and commitment to deadlines
2 2 2 2 2 1
7. Working relationships
1 1 1 1 1 1
8. Relationship with external stakeholder
1 1 1 1 1 1
9. Staff development 2 2 2 2 2 2Overall Capacity Gap 2 2 2 2 1 2
KEY: 0 = fully developed capacity1 = widespread but not comprehensive evidence of capacity 2 = partially developed capacity 3 = anecdotal evidence of capacity4 = no evidence of relevant capacity
Source: Computed from Survey data
3.1.1. Ministry of Agriculture, Livestock and Fisheries (MoALF)
The MoALF has a legal and institutional framework. The draft National Agriculture policy is still a draft though at an advanced level. The anticipated outcomes of the reforms, envisioned in the AFFA Act (2013) and KARLO Act (2013) have not been fully realised. For instance, relevant stakeholders in the sector are yet to full embrace and support the institutional establishment. Institutions with specific mandate on the tea sector fall under different state departments within the Ministry for example the TRI is under the state department of Livestock whereas the Tea directorate under the state department of Agriculture. In addition, there are no regulations to operationalize the AFA, and Crops Act 2013. This is partly attributed to the complexity of the sector and competing interests among stakeholders.
The ministry exhibits a well-developed organizational structure, with strategic plans to implement its mandate. However, gaps exist in the capacity to fund the planned activities in the strategic plan which relied on the Tea Ad valorem levy and which has since been scrapped. Historically, the direct government budgetary support for the sector has been minimal. There are however plans by the National government to fill the revenue gaps. Further, customer service systems are not interfaced with the tea stakeholders and lack a feedback mechanism and linkages to institutions charged with management and oversight roles.
Assessment of Institutional and Human Capacities Relevant to the Tea Sector

30
A Capacity Needs Assessment of the Tea Value Chain in Kenya
Human capacity is inadequate. Considering in-post staff verses approved staff levels, the study found inadequate staffing mainly attributed to lack of adequate funds and inability to retain staff. On competencies, skills, attitudes and working relationships, the study revealed weakness in implementing policy priorities; and low adoption of results based management. The staff at senior management level are experienced in their various disciplines but are not adequate in number. On staff development there are few tea experts and there are no clear strategies for training. Gaps exist in the evidence based decisions making process.
3.1.2. Agriculture Food Authority- Tea Directorate
As relates to providing an enabling environment for the tea value chain the organisation’s capacity has gaps. The Tea Directorate derives its legal framework from the AFFA Act amended 2016 and Crop Act, 2013 to oversee the development of tea, regulation of the industry, and marketing of tea. However, because of delays in the adoption of Tea policy the strategies and regulations to support the AFFA Act and Crop Act 2013 are not in place. In addition, there is a disconnect in the interpretation of the devolved roles and functions of the directorate vis-à-vis those of County governments. The ability of Tea Directorate to master political goodwill is low although it has clear functions and capacity to engage with external stakeholders.
The organizational leadership parameters such as strategic plan, team management and transformative ideas for the tea industry were found to be very weak. This is partly because the ongoing process of fully establishing the AFA is yet to be concluded. For instance, both the AFA Board and top management are on interim appointments, which weakens decision making. In addition, the strategic plan is yet to be finalised posing a challenge in implementing the strategic objectives and enforcement of the various aspects of the tea sector including regulations. Besides, the role of AFA in development and marketing is not clearly defined considering the needs of the sub-sector. The tea cess collected from tea producers was abolished, implying that the directorate has to rely on the exchequer for funding. Further, the Directorate has partial developed capacity in public finance management, human resource, customer service, ICT and knowledge management among others.
Staffing is inadequate to effectively carry out the mandate of the Directorate. Specifically, there are insufficient numbers of tea specialists, statisticians, market researchers and policy experts. In addition, staff training program does not exist. There are no local training institutions dedicated to tea other than the general courses offered by agricultural training colleges and universities (besides Karatina University).

31
3.1.3. KARLO- Tea Research Institute (TRI)
In relation to providing an enabling environment for the tea value chain, the research arm was found to have various gaps. On the legal framework, the assessment revealed that the TRI is comparable to other research institutes in the country in that it has requisite legal capability to discharge its duties. The legal framework based on KALRO Act 2013 clearly defines its mandate and functions. The National Research Policy (2013) provides a framework within which TRI undertakes its research activities. In terms of leadership, the assessment revealed partially developed capacity to influence policy at all levels of the value chain. TRI research is focused on green leaf production at the expense of other value chains. On governance and leadership, the assessment showed a partially developed capacity of TRI to master political goodwill. In addition, there is lack of clarity and awareness on the national rewards and motivations for research and innovation.
The study established inadequate capacity in parameters such as team management and transformative ideas in the tea industry. This resulted mainly from a lack of a clear strategic plan and governance structure that integrates with devolution. There are few numbers of tea experts and in the use of information and technology (IT) in climatic adaptation and pest and disease management. To evaluate the existence of transformative organisation structure at TRI, the assessment determined the appropriateness of the organisation structure in achieving its mandate. The study found low capacity of the KALRO-wide organisation structure for strategic positioning of the tea sector. Low capacity was also found in dealing with emerging challenges, the needs of the farmers, factories and the market. The study also assessed the capacity of the TRI to mobilise financial resources and found no clear strategy. The assessment found inadequate capacity to develop an interactive web-based and mobile-based application to interact with stakeholders. Other gaps identified include the lack of research to determine the fertilizer requirements for different geographical regions. Currently, TRI recommends one type of fertilizer calcium ammonium nitrate (CAN) across the regions thereby impacting negatively on productivity. Though TRI has developed new high yielding clones, there is inadequate dissemination to reach the farmers due to low funding.
At the Individual level the institute has inadequate experts in socio-economic, marketing and IT issues. The capacity to manage its relationship with external stakeholder was low and characterised by the “Big man syndrome”. Likewise, the institute did not have a programme to advance skills of its staff.
Assessment of Institutional and Human Capacities Relevant to the Tea Sector

32
A Capacity Needs Assessment of the Tea Value Chain in Kenya
3.1.4. Ministry of Industry Trade and Cooperatives (MoITC)
The assessment shows that the enabling environment for the ministry to support the tea sector is partially developed. MoITC’s legal framework emanates from the Constitution 2010 and government gazette notice of May 2016. The national trade policy which embraces liberalization of domestic trade, export promotion, regional economic integration, and bilateral as well as multilateral agreements was adopted in November, 2016. However, the enforcement of trade-related activities falls in different jurisdictions, which constrains implementation of some aspects of the mandate of the ministry. The study found weaknesses in coordination between Kenya’s foreign embassies, MoITC, commercial attachés and export promotion council when exploring international markets. However, the tea exports have been boosted through establishment of a warehouse in Dubai through joint initiates between the Export Promotion Council, KTDA and Tea Directorate.
The Ministry has a transformative organisation structure to facilitate delivery of its mandates. However, there were gaps in the development of knowledge management systems and on setting up of an interactive website. In addition, there was variance in the number of in-post staff versus staff establishment. Skill gaps also existed on available socio- economic and marketing experts, as well as on negotiation skills.
3.1.5. Export Promotion Council (EPC)
EPC does not have fully developed promotional capacity specifically for tea. The EPC was established under the Legal Notice 4342 of 1992 with the objective to develop and promote export trade. Its mandate involves coordination and harmonizing export promotion and providing leadership to all National export programmes. The legal framework defines its mandate and functions. However, the EPC has some capacity gaps in executing its mandate particularly on tea exports. Further, EPC has capacity constraints in terms of networking infrastructure needed to provide a forum for dialogue between the exporting fraternity and relevant public and private sector institutions and organizations. This undermines price competitiveness of tea exports, and also limits funding for promotional and research activities. It also has inadequate capacity in trade negotiations thus not benefiting the country in multilateral and bilateral trade agreements.
The EPC’s capacity was found to be partially developed on implementation of strategies and plans, innovations and team managements. For example, the capacity to produce external promotional strategies that can create loyalty for Kenyan tea remains low. Besides, its capacity to organize sector specific panels that deliberate on key policy and operational issues, product diversification

33
and market penetration was low. However the existing ICT and knowledge management systems are well developed as demonstrated by an informative and interactive website.
Staff competence at EPC was found to be at full capacity. However, there were variations between in-post and optimal staff establishment. On staff development, the study established that EPC has gaps in the training programmes and promotional programmes.
3.2. Ministry of Public Service, Youth and Gender Affairs- Public Service Transformation Division (MoPSYGA-PSTD)
PSTD mandate is to improve service delivery to citizens by transforming the public service into a responsive, citizen centered, results oriented, ethical and motivated service that delivers value for Kenyans. This is done through promoting leadership and coordination in process re-engineering towards the transformation of the public service. It was created as part of the Government’s reform program geared towards developing human resource capacities and improvement in service delivery to be able to deliver the objectives of Vision 2030 and the aspirations of the 2010 Constitution.
Results for Kenyans (RfK) Programme to operationalize result-based management (RBM) were initiated to foster openness on the design and delivery of public services, transformative leadership and public service values and ethics. One of the tools of RBM that have been applied is the Rapid Results Approach (RRA), to enhance service delivery and working conditions in the public sector. Many rapid results initiatives (RRI) such as implementation of performance contracts and integrated service delivery centres/ one-stop shops (Huduma Centres) have succeeded in delivering tangible results to citizens and helped consolidate support for reform. Further reforms have been realized through the implementation of Kenya Vision 2030, which envisages a public service sector that is “citizen-focused and results-oriented”. Therefore, reforms, transformation and capacity building initiatives are now entrenched across various sectors of the economy. The Constitution 2010 gave impetus to the public-sector reforms through devolution of service delivery and elaborates the values and principles of public service by both levels of government10.
Given that PSTD derives its mandate from Executive Order No. 1 of May, 2016 having succeeded other executive orders, this limits the Division’s ability to initiate result based management at national and county level. This is attributed to the downgrading from a Secretariat to a Department and finally to a Division
10 Article 232 (1) - values and principle of Public service
Assessment of Institutional and Human Capacities Relevant to the Tea Sector
34
A Capacity Needs Assessment of the Tea Value Chain in Kenya
(within a Directorate). There has been a consistent decline in resource allocation for activities of the Division. This has led to low visibility of transformation initiatives within the Public Service. It also affects the long term planning of the transformation agenda. The department has inadequate capacity to engage external stakeholders. PSTD’s capacity to implement the transformation agenda in the agriculture sector is impeded by restructuring of agencies in MOALF that have slowed momentum for transformation. PSTD lack the muscle to drive the transformation agenda in the public sector, both at national and county level.
In discharging its mandate, strategy, plans, innovations, team management and transformative ideas, PSTD has received international accolades for innovative initiatives. However, shortage of staff in the Division has resulted in delays in timely completion of planned projects. An assessment of various systems available at PSTD reveals inadequate capacity in knowledge management systems. This is attributed to lack of an interactive web based information system and an online feedback mechanism. At the individual level, in 2017, the Division had 6 staff against an establishment of 36, operating below 10 per cent capacity. The staff are thinly spread a fact that renders them ineffective. For PSTD to spearhead the reform agenda in the tea value chain, it will need to engage all players including state and non-state actors along the tea value chain. To achieve this, there is need to enhance and build capacity for the staff in the division.
3.3 Capacity Gaps in selected tea growing Counties
Weak legal and regulatory frameworks are constraining the role of counties in supporting the tea sector. The counties provide an enabling environment for the tea industry to thrive by for example, domesticating existing national legal frameworks and policies. None of the sampled counties had operationalized the national land use policy and the national climate change tea strategy. In their activities in agriculture, counties mainly derive their mandate from schedule IV of the constitution. The study though revealed capacity gaps in interpretation of the devolved functions on the capacity of the counties to implement policies. The role of the county governments in tea is further hampered by lack of a national tea policy. This notwithstanding, Bomet County has formulated a County tea policy while the Meru County Assembly has developed a Meru County Tea Report of 2014-2015 November. Though these reports are not mandatory, they provide insights into issues affecting the sector.11 Further, the County Assemblies have limited capacity to legislate, for example on the state of the roads leading to and from collection centres to factories since they are managed by KTDA. Lack of clear policy or regulatory framework on fertilizer subsidy program has created supply uncertainty; the subsidy was only provided in 2014 by the national government.11 www.assembly.meru.go.ke

35
Table 6: Capacity gaps in tea growing counties
CAPACITYDIMENSION
EM
BU
MU
RA
NG
A
NY
ER
I
ME
RU
KIA
MB
U
KIR
INY
AG
A
NA
ND
I
NY
AM
IRA
VIH
IGA
BO
ME
T
KE
RIC
HO
KIS
II
OV
ER
AL
FO
R
CO
UN
TIE
S
Enabling Environment
1. Existence of an effective legal framework on which the mandate is anchored
0 0 0 0 0 0 0 0 0 0 0 0 0
2. Policy framework
2 3 2 1 3 4 2 2 2 1 2 1 2.08
3. Capacity of Governance /Leadership in the Tea Sector
1 1 2 1 1 3 1 2 1 2 2 2 1.58
4. Tea Industry Vision and Transformation
2 3 3 2 3 3 4 3 1 1 1 2 2.33
Overall Capacity Gap
1.25 1.75 1.75 1 1.75 2.5 1.7 1.7 1 1 1.25 1.2 1.5
Organisational level
1. Ability to develop, articulate, implement and monitor Strategic Plan
1 1 1 2 1 2 3 3 3 3 3 3 2.2
2. Existence of transformative organization structure
1 1 0 2 0 1 2 2 2 2 2 2 1.4
3. Capacity to fund planned activities in the strategic plan for the tea sector
3 1 3 3 3 3 3 3 3 3 3 3 2.8
4. Capacity of the existing systems in achieving strategic priorities
3 2 2 3 2 3 3 3 3 3 3 3 2.7
Overall Capacity Gap
2.4 2.1 2.4 2.5 1.6 2.6 2.9 2.9 2.9 2.9 2.9 2.9 2.6
Assessment of Institutional and Human Capacities Relevant to the Tea Sector
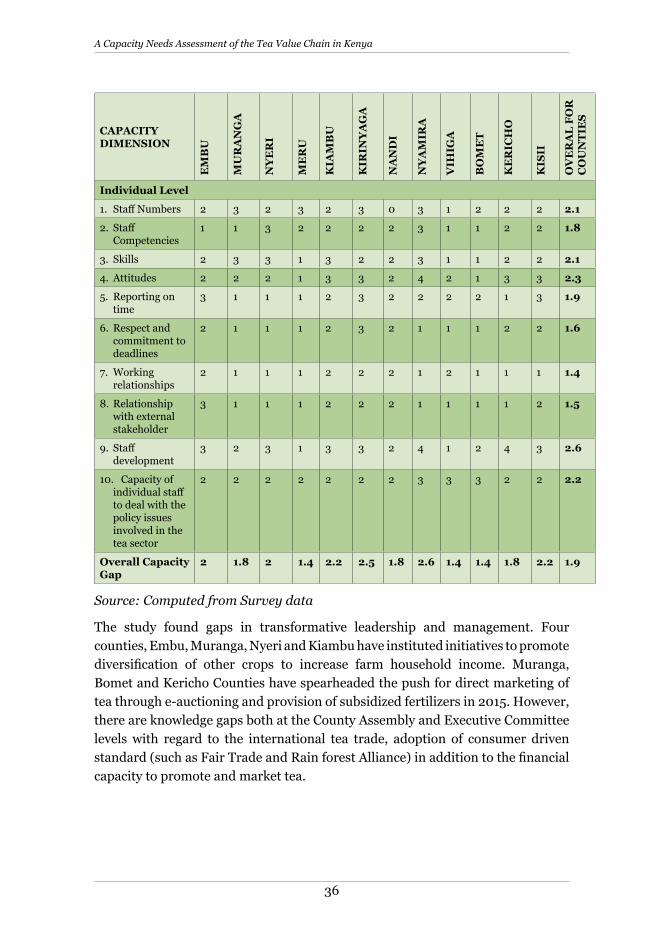
36
A Capacity Needs Assessment of the Tea Value Chain in Kenya
CAPACITYDIMENSION
EM
BU
MU
RA
NG
A
NY
ER
I
ME
RU
KIA
MB
U
KIR
INY
AG
A
NA
ND
I
NY
AM
IRA
VIH
IGA
BO
ME
T
KE
RIC
HO
KIS
II
OV
ER
AL
FO
R
CO
UN
TIE
S
Individual Level
1. Staff Numbers 2 3 2 3 2 3 0 3 1 2 2 2 2.1
2. Staff Competencies
1 1 3 2 2 2 2 3 1 1 2 2 1.8
3. Skills 2 3 3 1 3 2 2 3 1 1 2 2 2.1
4. Attitudes 2 2 2 1 3 3 2 4 2 1 3 3 2.3
5. Reporting on time
3 1 1 1 2 3 2 2 2 2 1 3 1.9
6. Respect and commitment to deadlines
2 1 1 1 2 3 2 1 1 1 2 2 1.6
7. Working relationships
2 1 1 1 2 2 2 1 2 1 1 1 1.4
8. Relationship with external stakeholder
3 1 1 1 2 2 2 1 1 1 1 2 1.5
9. Staff development
3 2 3 1 3 3 2 4 1 2 4 3 2.6
10. Capacity of individual staff to deal with the policy issues involved in the tea sector
2 2 2 2 2 2 2 3 3 3 2 2 2.2
Overall Capacity Gap
2 1.8 2 1.4 2.2 2.5 1.8 2.6 1.4 1.4 1.8 2.2 1.9
Source: Computed from Survey data
The study found gaps in transformative leadership and management. Four counties, Embu, Muranga, Nyeri and Kiambu have instituted initiatives to promote diversification of other crops to increase farm household income. Muranga, Bomet and Kericho Counties have spearheaded the push for direct marketing of tea through e-auctioning and provision of subsidized fertilizers in 2015. However, there are knowledge gaps both at the County Assembly and Executive Committee levels with regard to the international tea trade, adoption of consumer driven standard (such as Fair Trade and Rain forest Alliance) in addition to the financial capacity to promote and market tea.
37
Counties have limited human and financial capacity which could slow the progress in tea value chain development. In assessment of the capacities of staff numbers, competences, technical knowledge, skills, as well as individual understanding of policy and strategic issues, only Nandi County had sufficient number of staff, while the rest reported significant gaps and mismatch in some skills. County capacity to fund planned tea sector related activities was low because of their limited engagement in the tea sector. Most counties lack capacity to effectively implement public finance management system, human resource, customer service, and ICT and knowledge management. Other capacity gaps include low adoption of national systems like IFMIS, GRISS and NIMES, which gives an indication of county capacity to establish and manage ICT based systems.
Other gaps were identified that could have implications on sustainability of the tea sector. This includes lack of regulatory framework in the administration of Agricultural Produce Tea Cess by Counties that has replaced the old system where Cess collections were made by the factories. In addition, there is limited application of knowledge on climate change adaptation and mitigation and limited knowledge on emergence of new pest and diseases at the farm level.
Assessment of Institutional and Human Capacities Relevant to the Tea Sector

38
A Capacity Needs Assessment of the Tea Value Chain in Kenya
4. Conclusion, Recommendations and Strategic Interventions
4.1. Conclusion
a. Value Chain
Green leaf production is characterized by high labour costs, where 68 percent of the production cost is attributed to plucking of tea. As a result, most of the estates have adopted mechanized plucking machines. This has resulted in layoffs and industrial disputes.
In relation to low productivity among small scale farmers, there is a widening yield gap due to continued use of moribund tea bushes and the type of tea clone grown. This is due to the lack of alternative income sources for households during the replacement period. Although TRI has developed, tested and recommended tea clones, adoption of these improved clones is very low.
At the processing level, the dominant product is black CTC. There are limited incentives for production of other types of tea. And the processing is characterized by high cost of energy and heavy reliance on wood fuel.
The main issues at the marketing level include low domestic consumption, and the high reliance on few export markets. Kenyan tea is not branded, there is limited market research and the current markets are shrinking. The dominance by few multinational companies in the Mombasa tea auction influences price discovery, limiting the participation of the small-scale growers’ agencies in the process. In addition, the existence of consumer driven standards limit access to different markets.
b. Institutional and human capacities
The assessment identified a number of capacity gaps in the public-sector institutions. At the Ministry level the national agricultural policy and tea policy are yet to be adopted. This implies that the sub-sector operates without a clear strategic focus resulting in piece meal and uncoordinated reform initiatives. The process of the adoption of both policies has taken too long and concerted efforts are needed toward their finalisation. This is compounded by the lack of strategies and regulations to support the AFFA Act, Crops Act and the KALRO Act. The transition of the Tea board of Kenya to the tea directorate under AFA, resulted in loss of visibility and status in both the domestic and external market.
39
There is a disconnect in the interpretations of the county government devolved roles and functions and those of the tea directorate with respect to tea. This affects the overall efficiency and development of the sub-sector. In addition, there are multiple taxation by both the National and County governments.
Institutions managing the tea value chain including MoALF, Tea Directorate, KTDA, and TRI are faced with a number of challenges including, low staffing, lack of tea experts, and inadequate financial resources. For example, the removal of the Tea Ad volerum levy has affected funding for tea research. In addition, there are no local training institutions dedicated to tea other than the general course offered by agricultural training colleges and universities.
The Ministry of Trade and Export Promotion Council facilitate the promotion of domestic and external trade. However, existing promotion programmes are not targeted towards tea marketing in both regional and domestic markets. Besides, there are limited budget allocations for promotion and marketing, as well as inadequate number of staff to carry out these activities.
The Public-Sector Transformation division (PSTD) has initiated public sector reforms through the implementation of the result based management in a number of sectors of the economy. These tools however, are yet to applied in an agriculture value chain despite the importance of the sector in the economy. The division also faces challenges in limited human and financial resources.
The County governments do not have clear understanding of their role in the development of the Tea Sub-sector. This has resulted in haphazard imposition of taxes and confusion surrounding the renewal of land leases for the tea estates. This is in addition to inadequate human and financial capacity.
4.2. Recommendations
a. Value chains
To reduce the high cost at the production level and enhance productivity, there is need to promote mechanization for plucking and pruning and at the same time offering basic training on machine operations. There is also need to support small scale farmers to replace moribund tea bushes with high yielding tea clones while as the same time promote alternative complementary enterprises.
The factories managed by KTDA need to expand their capacity to enable production of other teas other than black CTC and extracts. To increase product diversity to speciality teas, there is need to develop the necessary human skills and
Conclusion, Recommendations and Strategic Interventions

40
A Capacity Needs Assessment of the Tea Value Chain in Kenya
introduce production lines for the speciality teas. In addition, factories should adopt innovations for reduction of energy cost by shifting to energy efficient technologies.
Promote domestic consumption of tea by developing skills to redesign the marketing approach focusing awareness campaigns and advocacy. For the export market, there is need to diversify the market destinations especially in high tea consuming market in Africa like Morocco and Nigeria. This can be achieved by additional bilateral trade agreements as well as other trading blocks. In addition, investing in market research especially market behaviour will be critical to consolidate existing markets and explore new ones. The capacity of the industry on domestication and harmonisation of international standards will also need to be enhanced. In addition, there is need to promoting tea processing and branding within the Special Economic Zone so as to enjoy the associated incentives and make Kenyan tea more competitive will be critical.
b. Institutional and human capacities
Fast track the adoption of the agriculture policy and the national tea policy. These policies will provide the broad framework and guidelines to ensure that the tea industry is sustainable and competitive. The policies will also enhance the legal framework that encompasses value addition by providing the groundwork for the enactment of the Agricultural Products Value Addition Bill aimed at addressing value addition in the tea industry and the Geographical Indications Bill that addresses issues of branding of Kenyan products. Sensitisation of the sector associations to engage and lobby the government to adopt and implement the policies.
Owing to the importance of tea, there is needed to separate the governance of tea from other crops as is the case in some countries. Thus, Tea Directorate ought to be managed outside the AFA Act while the TRI should be governed outside the KALRO. The AFA- Tea Directorate needs to set up a one-stop-shop that will provide information on the licences, taxes and levies in the tea industry as well as the incentives and opportunities. This will be achieved by providing adequate human and financial resources, in addition to developing their skills.
Rationalise fees and levies. The costs of production have been exacerbated by non-uniform levies and fees across different County governments. Therefore, there is need for a concerted effort by both the National and County government to harmonize fees and levies across the different County government’s jurisdiction. To facilitate this training on issues pertaining to revenue and taxation will be required.
41
The tea research is largely focused on production and processing as opposed to marketing aspects. It is necessary to expand the scope of research by providing resources and adequate numbers of qualified staff. It is important to establish linkages between the sub-sector and the higher institutions of learning.
The County governments should be supported to develop appropriate strategies for the development Tea sub-sector. In addition, the capacity of the county should be enhanced in terms number of qualified staff, while departments should be provided with adequate finances to support the industry.
4.3. Strategic Interventions
In order to transform the tea sub-sector the following interventions are proposed. They interventions are organized according to short, medium and long-term interventions.
Short term interventions
1. Strengthen the sector associations to carry out lobbying and advocacy activities to fast track the adoption of both the Nation Agricultural and the Tea Policy and other matters regarding the sub-sector.
2. Development skills in market research and product branding in order to sustain the current markets and break into new markets.
3. Establish the cost of profit ratios for the different types of tea so as to provide baseline information for further innovations
4. Define the roles, and the functions of the public-sector institutions at County and National government to ensure that conflicting areas are resolved and duplication is eliminated.
5. Promote the tea drinking culture for example encourage the consumption of black and specialty tea in all government institutions
Medium term strategic interventions
1. Establishment of an innovation laboratory with a special emphasis on value addition.
2. Develop and implement a capacity development plan for tea research.
3. Separation of the Tea directorate from AFA and the Tea Research Institute from KARLO. Develop a financing mechanism for the sub-sector to address the needs along the value chain.
Conclusion, Recommendations and Strategic Interventions

42
A Capacity Needs Assessment of the Tea Value Chain in Kenya
Long term strategic interventions
1. Establish the Tea directorate will need in house capacity in market development and establish market intelligence unit adequately financed and staffed.
2. Tea Research institute will require highly specialized laboratories that will be able to carry out state of the art research.
3. Develop a tea brand called “Kenya Tea” and market it in domestic and international markets.

43
Bibliography
Alterra-ILRI. 2004. Proceedings Ninth International Drainage Workshop, September 10–13, 2003, Utrecht, The Netherlands (www.alterra.wur.nl/UK/ilri/Drainage+Workshop/).
Banful, A.B. (2011). Old problems in the new solutions? Politically motivated allocation of program benefits and the “new” fertilizer subsidies. World Development, 39(7), 1166–1176.
Brinkerhoff, D. & Crosy, B.L. 2002. Managing policy reform: Concepts and tools for decision-makers in developing and transitional economies. Bloomfield, Kumarian Press.
Cornia, G., et al., eds., 1987, Adjustment with a Human Face, Vol. 1: Protecting the Vulnerable and Promoting Growth, New York, Oxford University Press
DFID. 2003. Promoting institutional and organizational development: A sourcebook of tools and techniques.
Export Development Board (EDB). (2014). Fiscal Incentives Available for Sri Lankan Exporters [NON-BOI]. Sri Lanka.
FAO (2014). Impact of macroeconomic factors on the global tea economy. Committee on commodity problems, Intergovernmental group on tea, Twenty-first session. Bandung, Indonesia, 5-7 November 2014
FAO. 2004. Capacity development in irrigation and drainage issues, challenges and the way ahead. Proceedings of a workshop Capacity Building in Irrigation, Drainage and Flood Control organized by ICID and FAO in association with Alterra-ILRI and other supporting agencies. Montpellier. September 2003.
FAOSTAT. (2017). “Statistical databases.” Food and Agriculture Organization of the United Nations, Rome (2017).
Food and Agriculture Organization (FAO). (2016). Report of the Working Group on Tea Trade and Quality. Intergovernmental Group on Tea. Twenty-second Session. 25th to 27th May 2016. Naivasha, Kenya.
Gamba, P., & Kibaara, B. (2007). RuralStruc Program. Structural implications of economic liberalization on agriculture and rural Development in Kenya. First phase: National synthesis. Ministry of Agriculture/World Bank/Tegemeo Institute.
Global Environment Facility. 2001. A guide for self-assessment of country capacity needs for global environmental management.

44
A Capacity Needs Assessment of the Tea Value Chain in Kenya
Haugerud, A. (1989). Land tenure and agrarian change in Kenya. Africa, 59(01), 61-90.
Herath, H. M. U. N., & De Silva, S. (2011). Strategies for competitive advantage in value added tea marketing. Tropical Agricultural Research, 22(3).
Horton, D. 2002. Planning, implementing and evaluating capacity development. International Service for National Agricultural Research. Briefing paper No 50.
IDH and True Price. (2016). The True Price of Tea from Kenya. Condensatorweg 54 1014 AX Amsterdam, The Netherlands.
Milen, A. 2001. What do we know about capacity building? An overview of existing knowledge and good practice. Department of Health Service Provision, WHO, Geneva. (www.capacity.org/what_is_cd.html)
Morgan, P. 1998. Capacity and capacity development – some strategies. Canadian International Development Agency.
Morgan, W. T. W. (1963). The ‘white highlands’ of Kenya. The Geographical Journal, 129(2), 140-155.
Newborne, P. 2004. Rights to water: Legal forms, political channels. ODI Briefing Paper, London.
Njogu, R. N. E., Kariuki, D. K., Kamau, D. M., & Wachira, F. N. (2015). Economic Evaluation of Foliar NPK Fertilizer on Tea Yields in Kenya. Journal of Plant Studies, 4(1), 35.
Ostrom, E. 1992. Crafting institutions for self-governing irrigation systems. San Francisco, ICS Press.
Republic of Kenya. (2015). Kenya’s Industrial Transformation Programme. Ministry of Industrialization and Enterprise Development.
UNDP. 1997. Draft UNDP. Capacity development assessment guidelines 2. Draft Capacity assessment guidelines – the programme approach: assessment and methodologies. Author, Thomas Hopkins.
UNDP. 1998a. Water: Capacity building for sustainable development. In collaboration with FAO, UNESCO, WHO & WMO.
UNDP. 1998b. Capacity assessment and development in a systems and strategic management context. Technical Advisory Paper No. 3. Management Development and Governance Division Bureau for Development Policy. January.

45
Van Hofwegen, P. 2004. Capacity building for water and irrigation sector management with application to Indonesia. Proceedings of the ICID/FAO Workshop, Montpellier, 2003.
Wolrd Bank. (2017). Doing Business 2017: Equal opportunity for all. A world bank group flagship report. New York, The World Bank Publ.
Bibliography

46
A Capacity Needs Assessment of the Tea Value Chain in Kenya
Appendix
Appendices I: SWOT Analysis of the tea value chain
The SWOT analysis carried out along the Tea value chain is presented the matrix (Table 1). The analysis gives a general understanding of the strengths, weakness, opportunities and threats in the tea value chain. This takes into consideration the three-entry point for capacity assessment namely enabling environment, organisational and individual level.
Table 1: SWOT analysis for Kenya’s tea value chain
Strengths WeaknessesEnabling Environment1. Well established industry structures and
institutions to support self-regulation and development.
2. Electronic transformation of industry operations through e-portal stakeholder interaction and electronic auction operation.
3. Financial support from the Government exchequer for the industry regulator (Tea Directorate) which compensated export/import levy.
4. The industry creates employment and facilitates infrastructure development in rural areas.
5. Dynamic trading system that is dollar based and currently transforming into electronic auctioning platform.
6. Well defined and comprehensive regulatory framework.
Organisational Level7. Existence of an industry Mark of origin.8. Improved industry bargaining position
under the AFA umbrella.
Individual Level9. Favourable weather in the tea agro
ecological regions that enable tea production all year round;
10. Long standing excellence in production and supply of high quality tea with a strong appealing taste and aroma which has endeared to blenders and packers worldwide;
11. Kenyan tea is well established and grown under pesticide free environment that meets the MRL requirements
Enabling Environment1. Inadequate legal and policy framework for
industry development including pending reviewed regulations and lack of a value addition policy.
2. Dependence on other arms of government and agencies for implementation of certain interventions.
3. Inadequate funding mechanism to support value addition, product diversification and market development within the industry;
Individual level4. Low productivity among the smallholder
tea growers as compared to large ones due to Moribund tea bushes;
5. High cost of production owing to poor road infrastructure and reliance on manual plucking.
6. Inadequate research for innovation and specialised training on tea.
7. Haphazard planting of tea in areas that are not conducive for production of quality tea.
Organisational Level8. Over reliance on few export markets;9. Low domestic consumption of tea

47
Opportunities ThreatsEnabling Environment1. Devolved units of government can be used
as partners in regulation in tea growing areas.
2. A vibrant and dynamic tea industry that is largely receptive to standards that can improve the industry.
3. A legal framework for Public Private Partnership (PPP) already exists.
4. Mainstreaming of agriculture in the national development agenda in the Vision 2030.
5. Abundance of qualified human capacity; and
Organisational Level6. Quality tea that is easy to brand and
promote and Potential for branding based on geographical indications concept
7. Existence of high value speciality markets internationally and the improved legal environment locally for developing cottage factories for specialty tea production.
8. Emerging market for Kenya Purple tea and growing enthusiasm among the cottage industry to develop it.
9. High quality CTC produce that is competitive in international middle to low end markets and apt for targeting regional markets (EAC, COMESA, Africa).
10. Potential for market segmentation of the tea market according to the different tea preferences and product diversification to cater for the different segments;
11. Possibility of increasing returns from tea by reducing bulk exports and increasing value added/packed tea sales;
Enabling Environment1. Conflict of mandate areas between the
Regulator (Tea Directorate) and county governments.
2. Lack of policy framework for Trade Advisory Services and Promotion.
Organisational Level3. Political, economic and social instability in
some established export markets.4. Impact of regional economic blocks in
export markets e.g. SAARC5. Unchecked importation of tea for blending
may compromise the “pest free” quality status of Kenya tea and the industry.
6. Elimination of trade barriers under COMESA and EAC will increase teas from the region for local consumption and blending.
7. Existence of multiple standards enforced by different international markets.
8. Bureaucratic and not very efficient port operations leading to delays in shipping of tea to the destination markets;
9. Proliferation of green leaf hawking; 10. Competition from other major tea
producing countries;11. Competition from other beverages such as
carbonated drinks.
Individual Level12. High cost of production particularly cost
of labour, fertilizers, electricity, furnace oil and other fuels used for transport and in running factories;
13. Environmental degradation caused by destruction of forests which may lead to unfavourable weather conditions;
Plate 1. Cost saving technologies
Flat Bar – plucking tea Curved Bar – plucking tea Tea pruner
Appendix
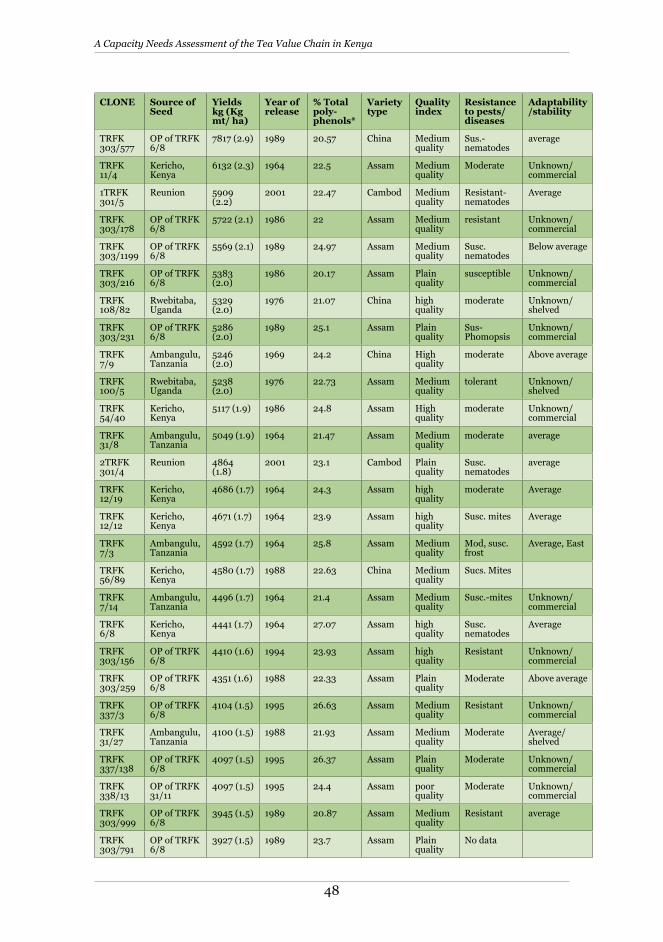
48
A Capacity Needs Assessment of the Tea Value Chain in Kenya
CLONE Source of Seed
Yields kg (Kg mt/ ha)
Year of release
% Total poly-phenols*
Variety type
Quality index
Resistance to pests/diseases
Adaptability /stability
TRFK 303/577
OP of TRFK 6/8
7817 (2.9) 1989 20.57 China Medium quality
Sus.-nematodes
average
TRFK 11/4
Kericho, Kenya
6132 (2.3) 1964 22.5 Assam Medium quality
Moderate Unknown/commercial
1TRFK 301/5
Reunion 5909 (2.2)
2001 22.47 Cambod Medium quality
Resistant-nematodes
Average
TRFK 303/178
OP of TRFK 6/8
5722 (2.1) 1986 22 Assam Medium quality
resistant Unknown/ commercial
TRFK 303/1199
OP of TRFK 6/8
5569 (2.1) 1989 24.97 Assam Medium quality
Susc. nematodes
Below average
TRFK 303/216
OP of TRFK 6/8
5383 (2.0)
1986 20.17 Assam Plain quality
susceptible Unknown/ commercial
TRFK 108/82
Rwebitaba, Uganda
5329 (2.0)
1976 21.07 China high quality
moderate Unknown/shelved
TRFK 303/231
OP of TRFK 6/8
5286 (2.0)
1989 25.1 Assam Plain quality
Sus-Phomopsis
Unknown/ commercial
TRFK7/9
Ambangulu, Tanzania
5246 (2.0)
1969 24.2 China High quality
moderate Above average
TRFK 100/5
Rwebitaba, Uganda
5238 (2.0)
1976 22.73 Assam Medium quality
tolerant Unknown/shelved
TRFK 54/40
Kericho, Kenya
5117 (1.9) 1986 24.8 Assam High quality
moderate Unknown/ commercial
TRFK 31/8
Ambangulu, Tanzania
5049 (1.9) 1964 21.47 Assam Medium quality
moderate average
2TRFK 301/4
Reunion 4864 (1.8)
2001 23.1 Cambod Plain quality
Susc. nematodes
average
TRFK 12/19
Kericho, Kenya
4686 (1.7) 1964 24.3 Assam high quality
moderate Average
TRFK 12/12
Kericho, Kenya
4671 (1.7) 1964 23.9 Assam high quality
Susc. mites Average
TRFK7/3
Ambangulu, Tanzania
4592 (1.7) 1964 25.8 Assam Medium quality
Mod, susc.frost
Average, East
TRFK 56/89
Kericho, Kenya
4580 (1.7) 1988 22.63 China Medium quality
Sucs. Mites
TRFK 7/14
Ambangulu, Tanzania
4496 (1.7) 1964 21.4 Assam Medium quality
Susc.-mites Unknown/ commercial
TRFK 6/8
Kericho, Kenya
4441 (1.7) 1964 27.07 Assam high quality
Susc. nematodes
Average
TRFK 303/156
OP of TRFK 6/8
4410 (1.6) 1994 23.93 Assam high quality
Resistant Unknown/ commercial
TRFK 303/259
OP of TRFK 6/8
4351 (1.6) 1988 22.33 Assam Plain quality
Moderate Above average
TRFK 337/3
OP of TRFK 6/8
4104 (1.5) 1995 26.63 Assam Medium quality
Resistant Unknown/ commercial
TRFK 31/27
Ambangulu, Tanzania
4100 (1.5) 1988 21.93 Assam Medium quality
Moderate Average/shelved
TRFK 337/138
OP of TRFK 6/8
4097 (1.5) 1995 26.37 Assam Plain quality
Moderate Unknown/ commercial
TRFK 338/13
OP of TRFK 31/11
4097 (1.5) 1995 24.4 Assam poor quality
Moderate Unknown/ commercial
TRFK 303/999
OP of TRFK 6/8
3945 (1.5) 1989 20.87 Assam Medium quality
Resistant average
TRFK 303/791
OP of TRFK 6/8
3927 (1.5) 1989 23.7 Assam Plain quality
No data