Embed Size (px)
Citation preview
Providing research and information services to the Northern Ireland Assembly
Research and Information Service Briefing Paper
1
Paper 35/15 6 February 2015 NIAR 928-14
Dr Janice Thompson and Dione Todd
Transforming Your Care (TYC) Workforce Planning 2 – Trends in HSC Staff Numbers
Contents
Summary and Key Points 2
1. Introduction 4
2. Overview 7
3. Numbers and Trends within the HSC Workforce
3.1 Qualified Nursing and Midwifery Staff 9
3.2 Medical and Dental Staff 17
3.3 Professional and Technical Staff 25
3.4 Social Services Staff 33
3.5 Ambulance Staff 41
3.6 Administrative and Clerical Staff 43
4. Independent Contractors and Related Staff 48
5. Workforce Plans for Northern Ireland 51
NIAR 928-14 Briefing Paper
Providing research and information services to the Northern Ireland Assembly 2
Summary and Key Points
The TYC Strategic Implementation Plan identified the main impact on health and social
care (HSC) staff as stemming from the shift of activity from an acute to a community
and enhanced primary care setting.
The Committee for Health, Social Services and Public Safety has previously received a
RaISe briefing summarising how HSC workforce planning has been dealt with in the
series of official TYC publications to date.
This second RaISe briefing paper regarding workforce planning provides a baseline
and an introductory review of HSC staff numbers and trends in a selection of staff
groups likely to be impacted by TYC.
The aim of the briefing is to stimulate discussion around potential areas for further
investigation by the Committee in terms of the numbers, work places and patterns of
various staff groupings in line with the implementation of TYC.
Section 3 provides a series of trend graphs and analysis of selected HSC staff groups,
using figures taken from the Northern Ireland Health and Social Care Workforce
Census.1
The workforce census does not include independent contractors such as General
Practitioners and General Dental Practitioners and information on these staff groups is
covered in Section 4 of this paper:
Section 3 of the paper, shows that, overall, from 2000 onwards to the present the
following HSC occupational ‘families’ show a general upward trend in numbers across
Northern Ireland (NI):
Qualified Nursing and Midwifery staff;
Medical and Dental staff;
Professional and Technical staff;
Social Services Staff; and
Ambulance Staff.
Administrative and Clerical Staff showed an overall general increase from 2000 to
2007/08 but numbers have since levelled off.
A closer look (over the period 2008 to 2014) at selected staff groups within these
occupational ‘families’ shows variations within the general overall NI upward trends
between staff groups and between Trusts.
1 DHSSPS, Health and Social Care Workforce Census , www.dhsspsni.gov.uk/index/statistics/workforce/staff-numbers.htm
NIAR 928-14 Briefing Paper
Providing research and information services to the Northern Ireland Assembly 3
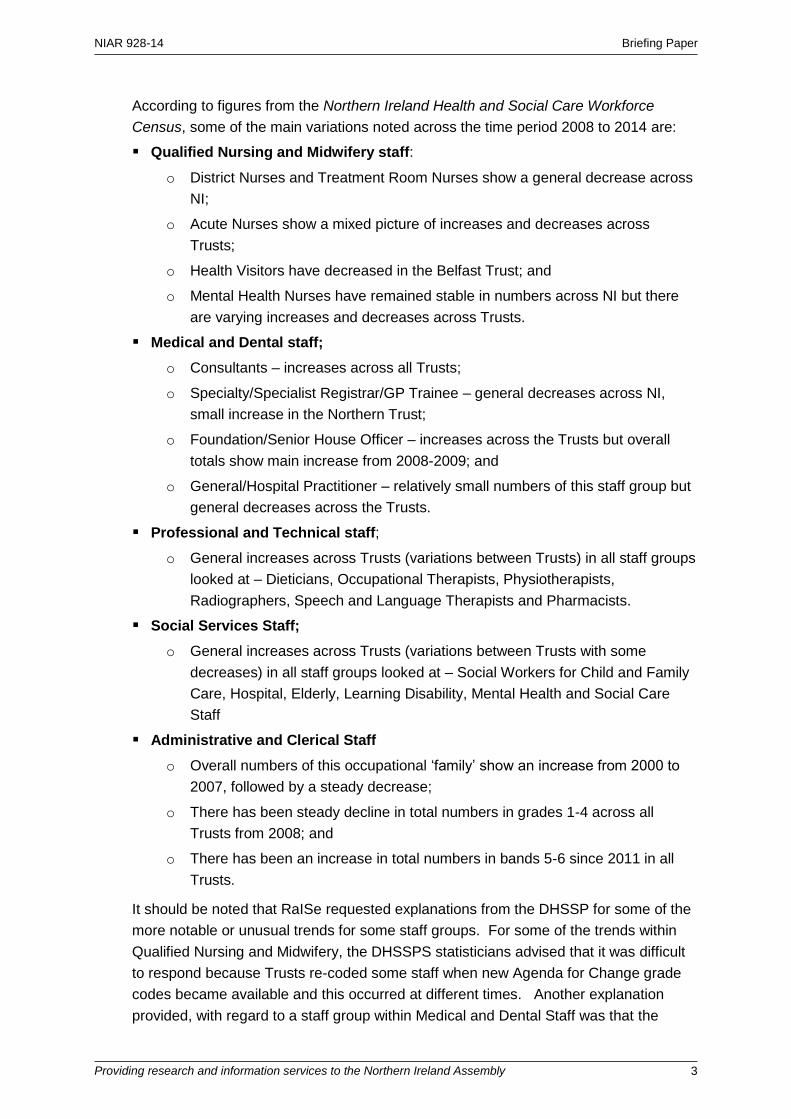
According to figures from the Northern Ireland Health and Social Care Workforce
Census, some of the main variations noted across the time period 2008 to 2014 are:
Qualified Nursing and Midwifery staff:
o District Nurses and Treatment Room Nurses show a general decrease across
NI;
o Acute Nurses show a mixed picture of increases and decreases across
Trusts;
o Health Visitors have decreased in the Belfast Trust; and
o Mental Health Nurses have remained stable in numbers across NI but there
are varying increases and decreases across Trusts.
Medical and Dental staff;
o Consultants – increases across all Trusts;
o Specialty/Specialist Registrar/GP Trainee – general decreases across NI,
small increase in the Northern Trust;
o Foundation/Senior House Officer – increases across the Trusts but overall
totals show main increase from 2008-2009; and
o General/Hospital Practitioner – relatively small numbers of this staff group but
general decreases across the Trusts.
Professional and Technical staff;
o General increases across Trusts (variations between Trusts) in all staff groups
looked at – Dieticians, Occupational Therapists, Physiotherapists,
Radiographers, Speech and Language Therapists and Pharmacists.
Social Services Staff;
o General increases across Trusts (variations between Trusts with some
decreases) in all staff groups looked at – Social Workers for Child and Family
Care, Hospital, Elderly, Learning Disability, Mental Health and Social Care
Staff
Administrative and Clerical Staff
o Overall numbers of this occupational ‘family’ show an increase from 2000 to
2007, followed by a steady decrease;
o There has been steady decline in total numbers in grades 1-4 across all
Trusts from 2008; and
o There has been an increase in total numbers in bands 5-6 since 2011 in all
Trusts.
It should be noted that RaISe requested explanations from the DHSSP for some of the
more notable or unusual trends for some staff groups. For some of the trends within
Qualified Nursing and Midwifery, the DHSSPS statisticians advised that it was difficult
to respond because Trusts re-coded some staff when new Agenda for Change grade
codes became available and this occurred at different times. Another explanation
provided, with regard to a staff group within Medical and Dental Staff was that the

NIAR 928-14 Briefing Paper
Providing research and information services to the Northern Ireland Assembly 4
number of these staff will vary in each Trust according to the Trust’s own service
configuration and specialties delivered. Therefore, it may follow that these types of
explanations also apply to some other trends that RaISe did not specifically pursue at
this early stage of the HSSPS Committee’s workforce planning review.
Looking at Section 4 of the paper it is evident that gathering recent/current information
regarding staff numbers not covered by the HSC Workforce Census is difficult, for
example, with regard to GP Practices.
The total number of GPs and GP surgeries is known but beneath that level to gather
information about the number of nurses or administrators that these independent
contractors employ does not appear possible without contacting individual GP
practices.
However, Section 4 highlights that prior to the establishment of the Business Services
Organisation, it appears that the Family Practitioner Services Directorate did publish
more detailed information about General Medical Services, General Dental Services,
General Ophthalmic Services and Pharmaceutical Services, with its last statistical
report published in 2007/08.2
Reviewing trends in HSC Staff numbers across NI as a whole and across Trusts in
primary and secondary care settings is, of course, only part of the story. The key to the
success of implementing TYC will be in the changing roles and locations of certain staff
groups with increasing HSC treatment occurring in primary care and community
settings.
Pertinent questions may be:
Do the increases and decreases in different staff groups support the policy direction
and implementation of TYC?
Is the current information collated by the DHSSPS on the workforce sufficient to
monitor the implementation of TYC?
In order to provide the Committee with the most up to date position regarding HSC
workforce planning in connection with TYC, RaISe requested an update on the work of
the Regional Workforce Planning Group and the response is included at Section 5.
1 Introduction
In May 2014, the Committee for Health, Social Services and Public Safety (the
Committee) received a RaISe briefing note (NIAR 277-14)3 in connection with
‘Transforming Your Care’ (TYC) 4 – Workforce Planning. This summarised how HSC
workforce planning had been dealt with in the series of official TYC publications,
2 http://www.hscbusiness.hscni.net/pdf/NI_FAMILY_PRACTITIONER_SERVICES_STATISTICAL_REPORT_2007-08.pdf
3 NIAR 277-14 (unpublished)
4 Transforming Your Care, A Review of Health and Social Care in Northern Ireland, DHSSPS, HSCB, December 2011

NIAR 928-14 Briefing Paper
Providing research and information services to the Northern Ireland Assembly 5
including the Belfast, Northern, Western, Southern and South Eastern Local
Commissioning Group Locality Population Plans.5
That first briefing also highlighted challenges to medical workforce planning as
identified by the BMA and introduced the NHS Scotland Everyone Matters: 2020
Workforce Vision as a possible good practice example of workforce planning.
The new model of service to be delivered by TYC requires a substantial move towards
prevention, self-care, increased primary care and care that is provided at home or
closer to home. This direction will have a substantial impact on the HSC workforce
with a ‘shift left’ of activity to the community and primary care setting and a more
integrated care focus, meaning a change in role/location for some staff. The
development of acute hospital networks will also mean a change in working patterns for
some staff.
The previous briefing noted the new methodology of workforce planning described in
the Population Plans of the Local Commissioning Groups (LCGs) but the workforce
plans (staff reductions6) of the five HSC Trusts did not appear to be well developed at
that time and were indicative in nature.
The TYC Strategic Implementation Plan identified the impact on HSC staff as
stemming from7:
A shift of activity from an acute to a community and enhanced primary care setting;
Delivery of care in a more integrated manner across primary, secondary and
community care;
Enhanced role for some of the independent healthcare providers. (May require
enhanced training and regulatory frameworks); and
Development of acute networks across an area. (May mean a change in working
patterns or organisational structures.)
In addition, workforce development is described as ‘critical’ to the establishment of the
new network models of care through the creation of five to seven hospital networks:
More people will receive care in their own home, or close to home - with hospital
clinicians working closely with GPs and other community staff8;
Multi professional, community health and social care integrated teams will support
patients in their own homes9; and
Staff will be required to develop different skills and capacities in new and extended
roles, for example, GPs with special interests in emergency medicine or paediatrics,
specialist long-term condition nurses and emergency care practitioners. It is
5 http://www.transformingyourcare.hscni.net/consultation/
6 The consultation used the working assumption that moving to the new model of care would see a reduction in the overall
workforce of around 3% (around 1,620 whole time equivalents) 7 Extracted from Transforming Your Care, Strategic Implementation Plan, October 2013, HSCB, Final Version, page 99
8 Transforming Your Care, DHSSPS, HSCB, December 2011, page 122
9 As above, page 122
NIAR 928-14 Briefing Paper
Providing research and information services to the Northern Ireland Assembly 6
proposed that there will be an increase in outpatient follow-up appointments being
carried out by GPs and nurses10.
The TYC Review document and subsequent consultation document did identify certain
specific issues around the impact on the HSC workforce:
GP Leadership11 – the TYC Review recognised that GPs would assume leadership
roles in the new Integrated Care Partnerships.
Workforce availability12 – Workforce availability over the three years following the
TYC Review was unlikely to be sufficient to sustain the current HSC model (for
example, shortages of doctors within emergency care services);
Reduction in HSC workforce – The TYC consultation used the working
assumption that moving to the new model of care would see a reduction in the
overall workforce of around 3% (around 1,620 whole time equivalents). To enable
this shift, the HSC “will provide support for voluntary early retirement/voluntary
redundancy and/or retraining support”13;
Training:
o The TYC Review concluded that the current model is unsustainable in terms
of the training experience required for junior doctors14;
o In the new care model some staff (currently hospital-based) will fulfil
unchanged/very similar roles in the community or primary care setting,
whereas others will be asked to adapt to a change in role and will be given
“appropriate training and support”15;
Workforce sustainability16 – future services models must be sustainable - “while
locum and agency staff may be used to support a services where necessary and
appropriate, they should not be inextricably linked to a service’s ability to remain”;
The responsibility for workforce planning rests with the DHSSPS and TYC
transformation will involve the Regional Workforce Planning Group supporting the
development of detailed workforce plans, including continuing engagement with staff,
professional bodies and staff side organisations.17
In response to a Member’s Question in 201418, the then Health Minister, Edwin Poots,
responded that:
10
Transforming Your Care, DHSSPS, HSCB, December 2011, page 122 11
As above, page 123 12
As above, page 123 13
Transforming Your Care, Vision to Action, A consultation document, 9 October 2012 – 15 January 2013, DHSSPS, HSCB,
page 59 14
Transforming Your Care, DHSSPS, HSCB, December 2011, page 123 15
Transforming Your Care, Vision to Action, A consultation document, 9 October 2012 – 15 January 2013, DHSSPS, HSCB,
page 59 16
Transforming Your Care, DHSSPS, HSCB, December 2011, page 41 17
Transforming Your Care, Strategic Implementation Plan, October 2013, HSCB, Final Version, page 32 18
NI Assembly Oral Question, AQO 6669/11-15, asked on 11/09/14,
http://aims.niassembly.gov.uk/questions/oralsearchresults.aspx?&qf=0&qfv=1&ref=AQO%206669/11-15
NIAR 928-14 Briefing Paper
Providing research and information services to the Northern Ireland Assembly 7
The regional workforce planning group was established to take forward the
specific proposals in 'Transforming Your Care' relating to workforce
planning. The group is completing the development of a framework for
workforce planning that will strengthen HSC workforce planning across the
region and inform the basis for taking forward a programme of workforce
reviews. Whilst the framework is being finalised, my Department continues
to lead on regional workforce planning, and a number of workforce reviews
are in progress in relation to nursing, medical specialists and medicine…
2 Overview
In connection with the Committee’s scrutiny of TYC this second RaISe briefing paper
regarding the workforce provides a starting point for the next phase of the Committee’s
work on TYC. The information in this paper is provided as an introduction to the
Committee’s wider review into workforce planning.
It is not intended as a full review of all HSC staff groups in primary and secondary care
but includes a selection of staff groups that are among those impacted by TYC. The
briefing seeks to stimulate discussion around potential areas for further investigation in
terms of the numbers, work places and patterns of various staff groupings and the
impact this will have on the implementation of TYC.
Section 3 of this paper provides a series of trend graphs and analysis of selected HSC
staff groups19, both totals20 and broken down by Trusts, using figures taken from the
Northern Ireland Health and Social Care Workforce Census.21 The HSC staff groups
covered in Section 3 are:
Qualified Nursing and Midwifery staff;
Medical and Dental staff;
Professional and Technical staff;
Social Services Staff;
Ambulance Staff; and
Administrative and Clerical Staff.
The workforce census does not include independent contractors also working in Health
& Social Care such as General Practitioners and information on some of these staff
groups is covered in Section 4.
19
Workforce figures exclude staff on career breaks, bank staff (due to the variable nature of their employment),
Chairman/Members of Boards and staff with a whole-time equivalent of less than or equal to 0.03. For this 2014 edition,
Home Helps/Domiciliary Care staff are also excluded as their recorded WTE does not accurately reflect their contributions
to the service. Some historical figures have been revised to reflect methodological changes in order to maintain
comparability. Data from the Northern Ireland Medical and Dental Training Agency were only available for 2014, so these
staff have not been included in this comparison. They have been included in the main tables 20
The totals include staff that are based within the HSC Board or Regional Services 21
DHSSPS, Health and Social Care Workforce Census , www.dhsspsni.gov.uk/index/statistics/workforce/staff-numbers.htm
NIAR 928-14 Briefing Paper
Providing research and information services to the Northern Ireland Assembly 8
3 Numbers and Trends Within the HSC Workforce
Graphs within this section show Whole Time Equivalent (WTE). WTE is a method of
aggregating full and part-time staff’s hours effectively converting them into equivalent
number of ‘whole time’ staff. This is done by calculating the aggregate of the total
number of hours that staff in a grade are contracted to work, and dividing by the
standard hours for that grade. As a result, part-time staff are converted into equivalent
number of ‘whole time’ staff22.
Figures used to prepare the graphs were taken as far as possible from the most recent
published HSC workforce census23 and then from the census of relevant years as
applicable. According to the 2014 HSC workforce census, “the main tables and
discussion exclude Home Helps/Domiciliary Care Staff, bank/sessional staff and staff
with a WTE of less than or equal to 0.03….Figures also exclude staff on career breaks
and Chairs/Members of Boards”.24
The figures used for trend graphs of occupational families covering the years 2000-
2014 are where universal definitions allowed figures to be compared25. Figures for
2005-2014 are taken from Table A of the 2014 HSC workforce census and figures for
2000-2004 are taken from Table A of the 2005 HSC workforce census.
Graphs in this paper which cover the period 2008-2014 (or parts thereof) are a result of
earlier figures not being comparable due to changes in definitions of staff job titles or
groupings.
RaISe requested explanations from the DHSSP for some of the more notable or
unusual trends for some staff groups. For example, for some of the trends within
Qualified Nursing and Midwifery, the DHSSPS statisticians advised that it was difficult
to respond because Trusts re-coded some staff when new Agenda for Change grade
codes became available and this occurred at different times. Another explanation
provided, with regard to a staff group within Medical and Dental Staff was that the
number of these staff will vary in each Trust according to the Trust’s own service
configuration and specialties delivered. Therefore, it may follow that these types of
explanations also apply to some other trends that RaISe did not specifically pursue at
this early stage of the HSSPS Committee’s workforce planning review.
22
DHSSPS (2001) Definition of Whole Time Equivalent, Available at http://www.dhsspsni.gov.uk/wf_2001_definitions.pdf 23
DHSSPS, (2014) Northern Ireland Health and Social Care Workforce Census 2014. Available at:
http://www.dhsspsni.gov.uk/hscwc-march-2014.pdf
http://www.dhsspsni.gov.uk/ni_hpss_workforce_census_march_2005_no_cover.pdf 24
2014 HSC workforce census, page 5, http://www.dhsspsni.gov.uk/hscwc-march-2014.pdf 25
Figures for 2005-2014 taken from the 2014 HSC workforce census and figure for 2000-2004 are taken from the 2005 HSC
workforce census, http://www.dhsspsni.gov.uk/hscwc-march-2014.pdf
http://www.dhsspsni.gov.uk/workforce_census_march_2005_exc_sec_11.pdf
NIAR 928-14 Briefing Paper
Providing research and information services to the Northern Ireland Assembly 9
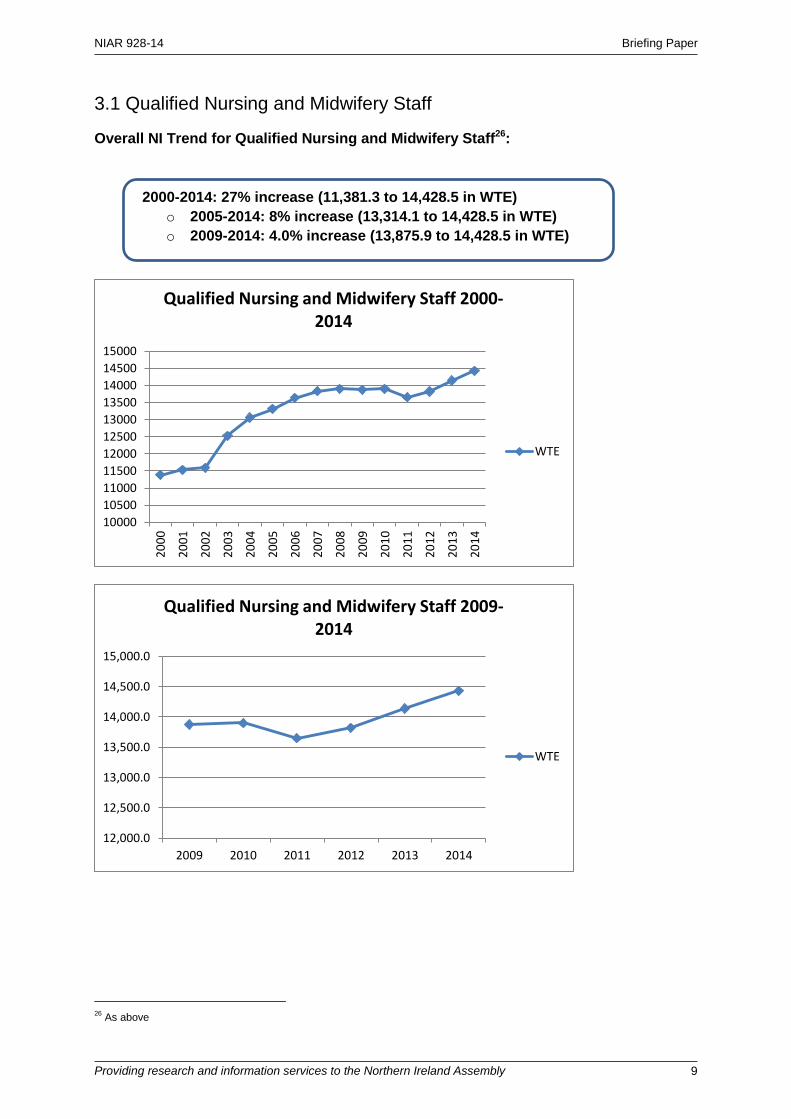
3.1 Qualified Nursing and Midwifery Staff
Overall NI Trend for Qualified Nursing and Midwifery Staff26:
2000-2014: 27% increase (11,381.3 to 14,428.5 in WTE)
o 2005-2014: 8% increase (13,314.1 to 14,428.5 in WTE)
o 2009-2014: 4.0% increase (13,875.9 to 14,428.5 in WTE)
26
As above
10000
10500
11000
11500
12000
12500
13000
13500
14000
14500
15000
2000
2001
2002
2003
2004
2005
2006
2007
2008
2009
2010
2011
2012
2013
2014
Qualified Nursing and Midwifery Staff 2000-2014
WTE
12,000.0
12,500.0
13,000.0
13,500.0
14,000.0
14,500.0
15,000.0
2009 2010 2011 2012 2013 2014
Qualified Nursing and Midwifery Staff 2009-2014
WTE

NIAR 928-14 Briefing Paper
Providing research and information services to the Northern Ireland Assembly 10
This section includes a more in-depth look at the figures for selected staff groups within
Qualified Nursing and Midwifery staff:
3.1.1 Acute/General Nurses;
3.1.2 Mental Health Nurses;
3.1.3 Health Visitors;
3.1.4 District Nurses; and
3.1.5 Treatment Room Nurses.
3.1.1 Acute/General Nurses27
Overall Trust Totals for Acute/General Nurses
27
Figures for each year are extracted from the workforce census publication for that year. Available at:
2008 http://www.dhsspsni.gov.uk/index/statistics/workforce_census_march_2008_web.pdf
2009 http://www.dhsspsni.gov.uk/index/statistics/workforce_census_march_2009_exc_sec_11.pdf
2010 http://www.dhsspsni.gov.uk/workforce_census_march_2010_web.pdf
2011 http://www.dhsspsni.gov.uk/workforce_census_march_2011.pdf
2012 http://www.dhsspsni.gov.uk/workforce_census_march_2012_-_web.pdf
2013 http://www.dhsspsni.gov.uk/workforce_census_march_2013_web.pdf
2014 http://www.dhsspsni.gov.uk/hscwc-march-2014.pdf
6800
6900
7000
7100
7200
7300
7400
7500
7600
7700
7800
2008 2009 2010 2011 2012 2013 2014
Total WTE for Acute/General Nurses
WTE
Overall 2% increase in WTE from 2008-2014
NIAR 928-14 Briefing Paper
Providing research and information services to the Northern Ireland Assembly 11
Trends across the Trusts 2008 to 2014:
Belfast: 5% decrease (3098.8 to 2930.7 in WTE)
Northern: 8% decrease (1184.7 to 1088.7 in WTE)
Southern: 9% increase (1021-1125.6 WTE)
South Eastern: 23% increase (903-1114 WTE)
Western: 6% increase (1172.0 to 1247.3 in WTE)
Based on the above trend, RaISe asked the DHSSPS to explain the following: since 2008,
there has been a decrease in acute nurses in the Belfast (around 5%) and Northern (around
8%) Trusts, against increases in the other Trusts (WTE).
The DHSSPS statisticians advised that it is difficult to respond to this question because
Trusts re-coded some staff when new Agenda for Change grade codes became available
and at different times e.g. from Acute Nurse to Specialist Nurse.28
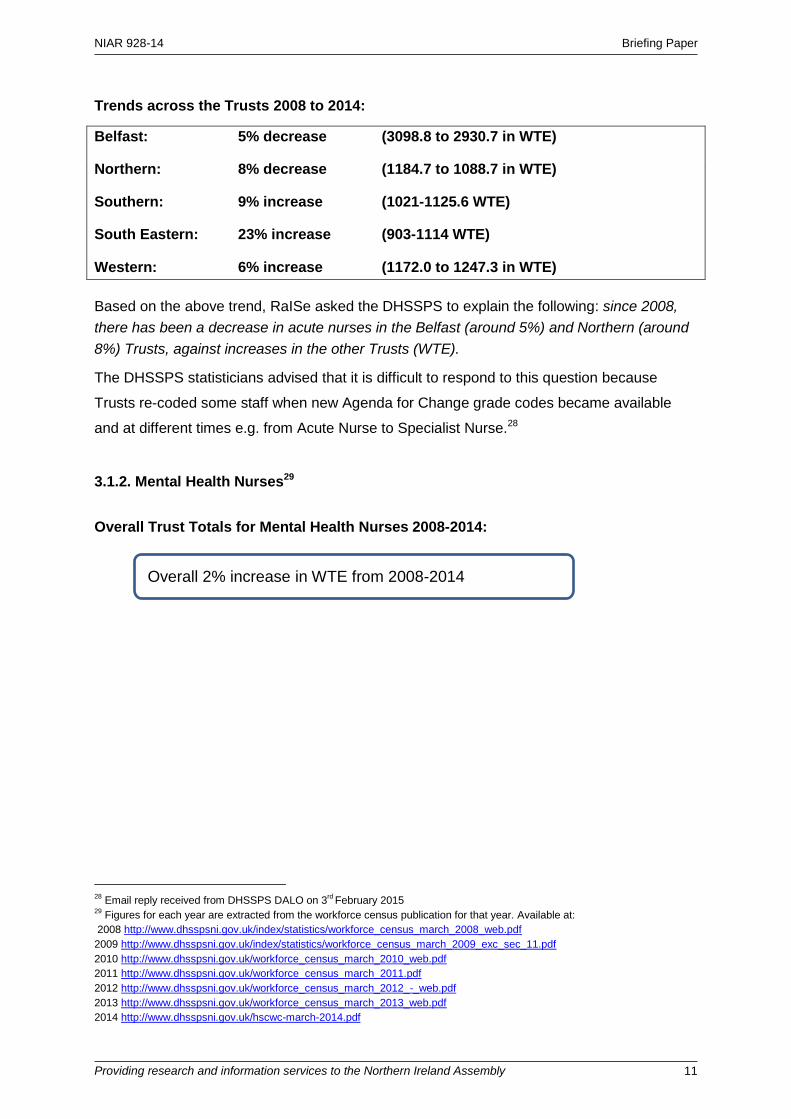
3.1.2. Mental Health Nurses29
Overall Trust Totals for Mental Health Nurses 2008-2014:
28
Email reply received from DHSSPS DALO on 3rd
February 2015 29
Figures for each year are extracted from the workforce census publication for that year. Available at:
2008 http://www.dhsspsni.gov.uk/index/statistics/workforce_census_march_2008_web.pdf
2009 http://www.dhsspsni.gov.uk/index/statistics/workforce_census_march_2009_exc_sec_11.pdf
2010 http://www.dhsspsni.gov.uk/workforce_census_march_2010_web.pdf
2011 http://www.dhsspsni.gov.uk/workforce_census_march_2011.pdf
2012 http://www.dhsspsni.gov.uk/workforce_census_march_2012_-_web.pdf
2013 http://www.dhsspsni.gov.uk/workforce_census_march_2013_web.pdf
2014 http://www.dhsspsni.gov.uk/hscwc-march-2014.pdf
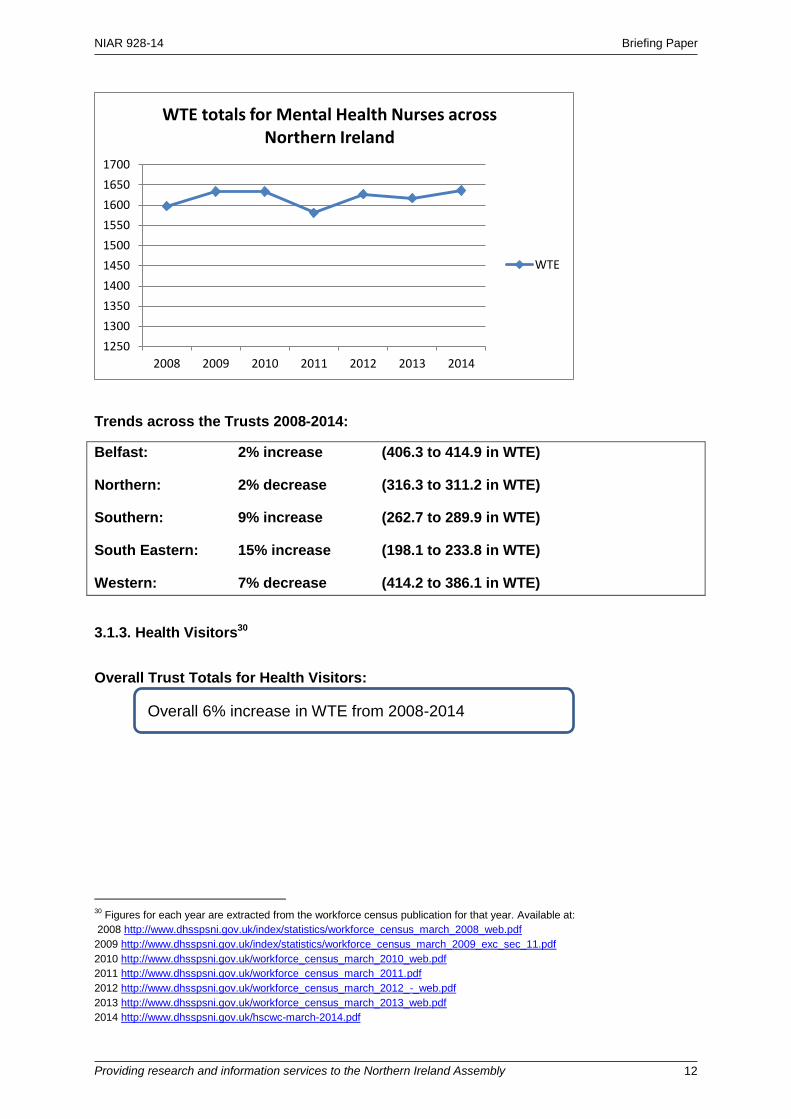
Overall 2% increase in WTE from 2008-2014
NIAR 928-14 Briefing Paper
Providing research and information services to the Northern Ireland Assembly 12
Trends across the Trusts 2008-2014:
Belfast: 2% increase (406.3 to 414.9 in WTE)
Northern: 2% decrease (316.3 to 311.2 in WTE)
Southern: 9% increase (262.7 to 289.9 in WTE)
South Eastern: 15% increase (198.1 to 233.8 in WTE)
Western: 7% decrease (414.2 to 386.1 in WTE)
3.1.3. Health Visitors30
Overall Trust Totals for Health Visitors:
30
Figures for each year are extracted from the workforce census publication for that year. Available at:
2008 http://www.dhsspsni.gov.uk/index/statistics/workforce_census_march_2008_web.pdf
2009 http://www.dhsspsni.gov.uk/index/statistics/workforce_census_march_2009_exc_sec_11.pdf
2010 http://www.dhsspsni.gov.uk/workforce_census_march_2010_web.pdf
2011 http://www.dhsspsni.gov.uk/workforce_census_march_2011.pdf
2012 http://www.dhsspsni.gov.uk/workforce_census_march_2012_-_web.pdf
2013 http://www.dhsspsni.gov.uk/workforce_census_march_2013_web.pdf
2014 http://www.dhsspsni.gov.uk/hscwc-march-2014.pdf
1250
1300
1350
1400
1450
1500
1550
1600
1650
1700
2008 2009 2010 2011 2012 2013 2014
WTE totals for Mental Health Nurses across Northern Ireland
WTE
Overall 6% increase in WTE from 2008-2014
NIAR 928-14 Briefing Paper
Providing research and information services to the Northern Ireland Assembly 13
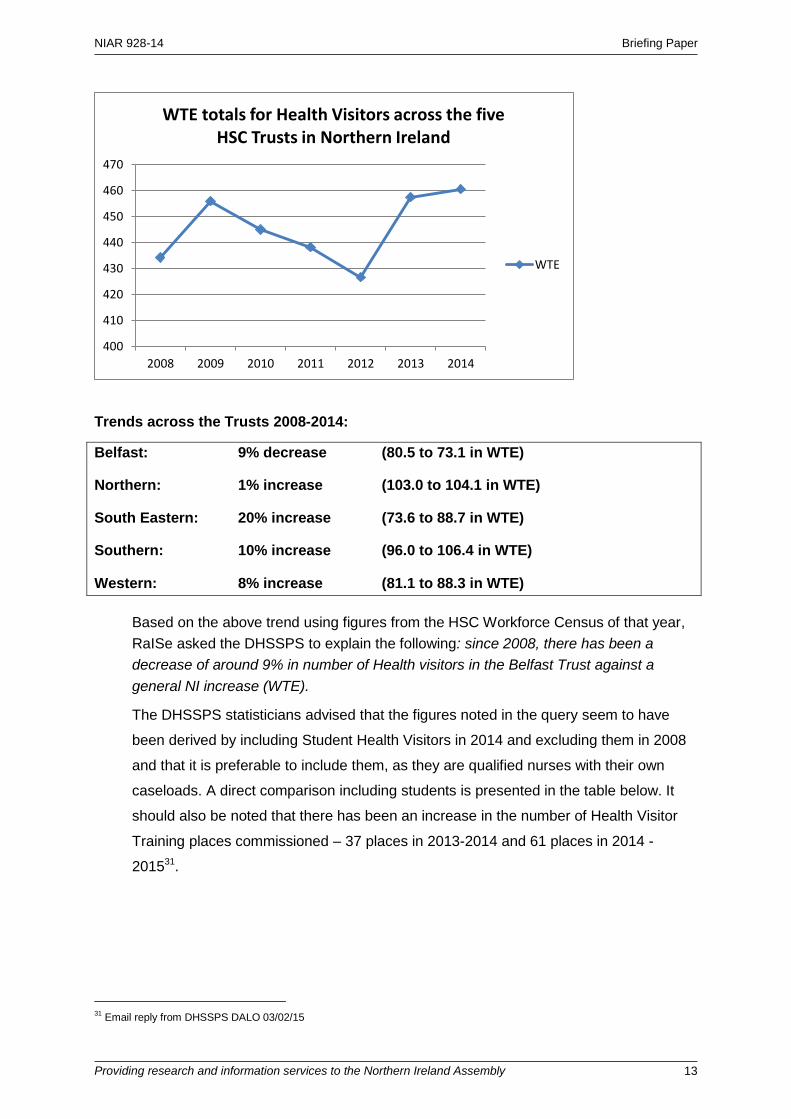
Trends across the Trusts 2008-2014:
Belfast: 9% decrease (80.5 to 73.1 in WTE)
Northern: 1% increase (103.0 to 104.1 in WTE)
South Eastern: 20% increase (73.6 to 88.7 in WTE)
Southern: 10% increase (96.0 to 106.4 in WTE)
Western: 8% increase (81.1 to 88.3 in WTE)
Based on the above trend using figures from the HSC Workforce Census of that year,
RaISe asked the DHSSPS to explain the following: since 2008, there has been a
decrease of around 9% in number of Health visitors in the Belfast Trust against a
general NI increase (WTE).
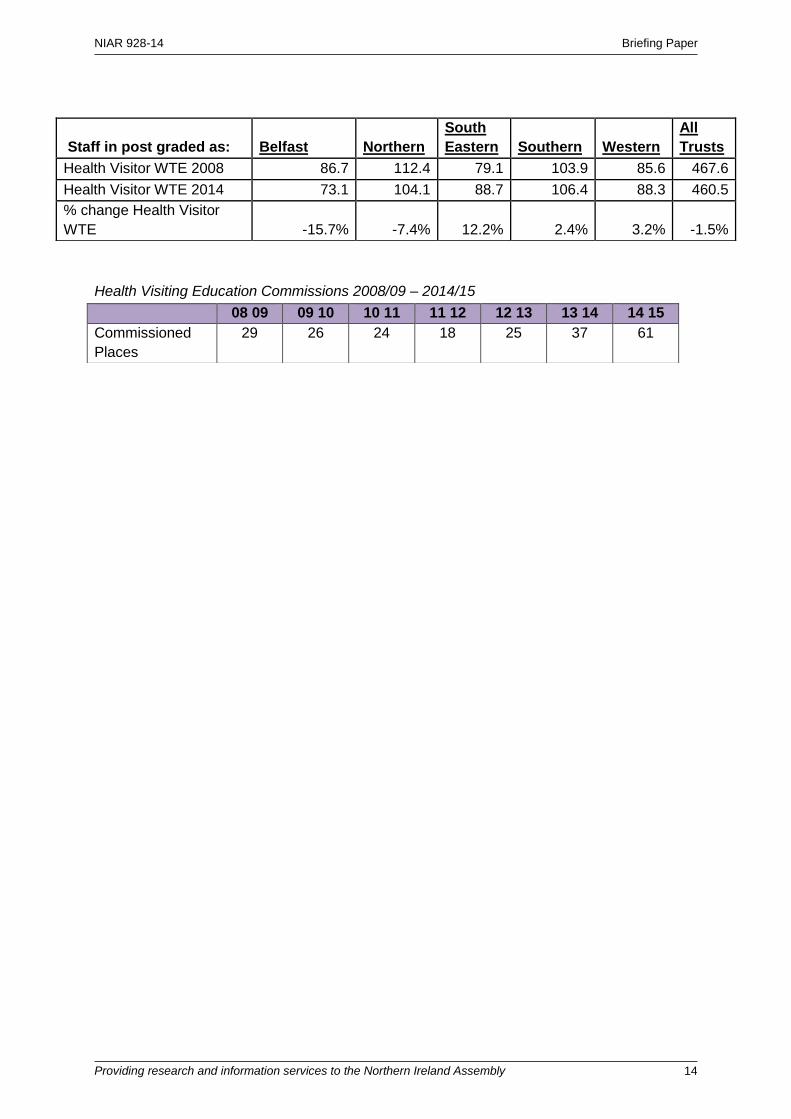
The DHSSPS statisticians advised that the figures noted in the query seem to have
been derived by including Student Health Visitors in 2014 and excluding them in 2008
and that it is preferable to include them, as they are qualified nurses with their own
caseloads. A direct comparison including students is presented in the table below. It
should also be noted that there has been an increase in the number of Health Visitor
Training places commissioned – 37 places in 2013-2014 and 61 places in 2014 -
201531.
31
Email reply from DHSSPS DALO 03/02/15
400
410
420
430
440
450
460
470
2008 2009 2010 2011 2012 2013 2014
WTE totals for Health Visitors across the five HSC Trusts in Northern Ireland
WTE
NIAR 928-14 Briefing Paper
Providing research and information services to the Northern Ireland Assembly 14
Health Visiting Education Commissions 2008/09 – 2014/15
Staff in post graded as: Belfast Northern
South
Eastern Southern Western
All
Trusts
Health Visitor WTE 2008 86.7 112.4 79.1 103.9 85.6 467.6
Health Visitor WTE 2014 73.1 104.1 88.7 106.4 88.3 460.5
% change Health Visitor
WTE -15.7% -7.4% 12.2% 2.4% 3.2% -1.5%
08 09 09 10 10 11 11 12 12 13 13 14 14 15
Commissioned
Places
29 26 24 18 25 37 61
NIAR 928-14 Briefing Paper
Providing research and information services to the Northern Ireland Assembly 15
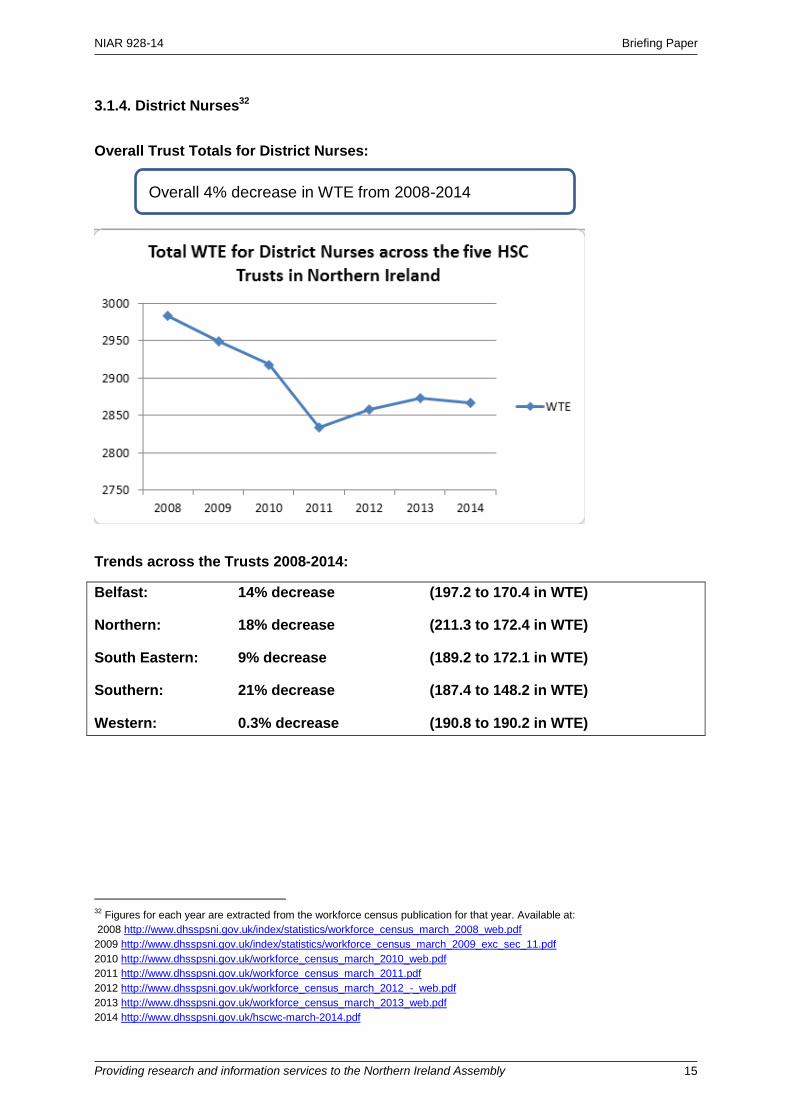
3.1.4. District Nurses32
Overall Trust Totals for District Nurses:
Trends across the Trusts 2008-2014:
Belfast: 14% decrease (197.2 to 170.4 in WTE)
Northern: 18% decrease (211.3 to 172.4 in WTE)
South Eastern: 9% decrease (189.2 to 172.1 in WTE)
Southern: 21% decrease (187.4 to 148.2 in WTE)
Western: 0.3% decrease (190.8 to 190.2 in WTE)
32
Figures for each year are extracted from the workforce census publication for that year. Available at:
2008 http://www.dhsspsni.gov.uk/index/statistics/workforce_census_march_2008_web.pdf
2009 http://www.dhsspsni.gov.uk/index/statistics/workforce_census_march_2009_exc_sec_11.pdf
2010 http://www.dhsspsni.gov.uk/workforce_census_march_2010_web.pdf
2011 http://www.dhsspsni.gov.uk/workforce_census_march_2011.pdf
2012 http://www.dhsspsni.gov.uk/workforce_census_march_2012_-_web.pdf
2013 http://www.dhsspsni.gov.uk/workforce_census_march_2013_web.pdf
2014 http://www.dhsspsni.gov.uk/hscwc-march-2014.pdf
Overall 4% decrease in WTE from 2008-2014

NIAR 928-14 Briefing Paper
Providing research and information services to the Northern Ireland Assembly 16
3.1.5. Treatment Room/Practice/Family Planning Nurses
Overall Trust Totals for Treatment Room/Practice/Family Planning Nurses 2008-2014:
Based on the above trends using figures from the HSC Workforce Census of that year,
District nurses and Treatment room nurses have experience a general decrease in
numbers across the five HSC Trusts, therefore, RaISe put the following query was put
to the DHSSPS: Please explain the following: since 2008, there has been a general
decrease in District Nurses and Treatment Room Nurses across all five Trusts (WTE).
DHSSPS statisticians advised that it is difficult to comment on this query because
Trusts have re-coded some staff when new Agenda for Change grade codes became
available and at different times e.g. to the Specialist Nurse grade.
120
130
140
150
160
170
2008 2009 2010 2011 2012 2013 2014
Total WTE Treatment Room/Practice/Family Planning Nurses across the five HSC Trusts in
Northern Ireland
WTE
Overall 11% decrease in WTE from 2008-2014

NIAR 928-14 Briefing Paper
Providing research and information services to the Northern Ireland Assembly 17
3.2 Medical and Dental Staff33
Overall NI Trend for Medical and Dental Staff34:
2000-2014: 53% increase (2,468.3 to 3789.5 in WTE)
o 2005-2014: 22% increase (3098.8 to 3789.5 in WTE)
o 2009-2014: 9% increase (3491.0 to 3,789.5 in WTE)
33
2014 figure includes Northern Ireland Medical and Dental Training Agency (NIMDTA) 34
Figures for 2005-2014 taken from the 2014 HSC workforce census and figure for 2000-2004 are taken from the 2005 HSC
workforce census, http://www.dhsspsni.gov.uk/hscwc-march-2014.pdf
http://www.dhsspsni.gov.uk/workforce_census_march_2005_exc_sec_11.pdf
1500
2000
2500
3000
3500
4000
2000
2001
2002
2003
2004
2005
2006
2007
2008
2009
2010
2011
2012
2013
2014
Medical and Dental 2000-2014
WTE
3,300.0
3,350.0
3,400.0
3,450.0
3,500.0
3,550.0
3,600.0
3,650.0
3,700.0
3,750.0
3,800.0
3,850.0
2009 2010 2011 2012 2013 2014
Medical and Dental Staff 2009-2014
WTE
NIAR 928-14 Briefing Paper
Providing research and information services to the Northern Ireland Assembly 18
This section includes a more in-depth look at the figures for selected groups of Medical
and Dental staff:
3.2.1 Consultants
3.2.2 Specialty Doctor/ Associate Specialist/ Staff Grade
3.2.3 Specialty/ Specialist Registrar/ GP Trainee
3.2.4 Foundation/ Senior House Officer
3.2.5 General/ Hospital Practitioner
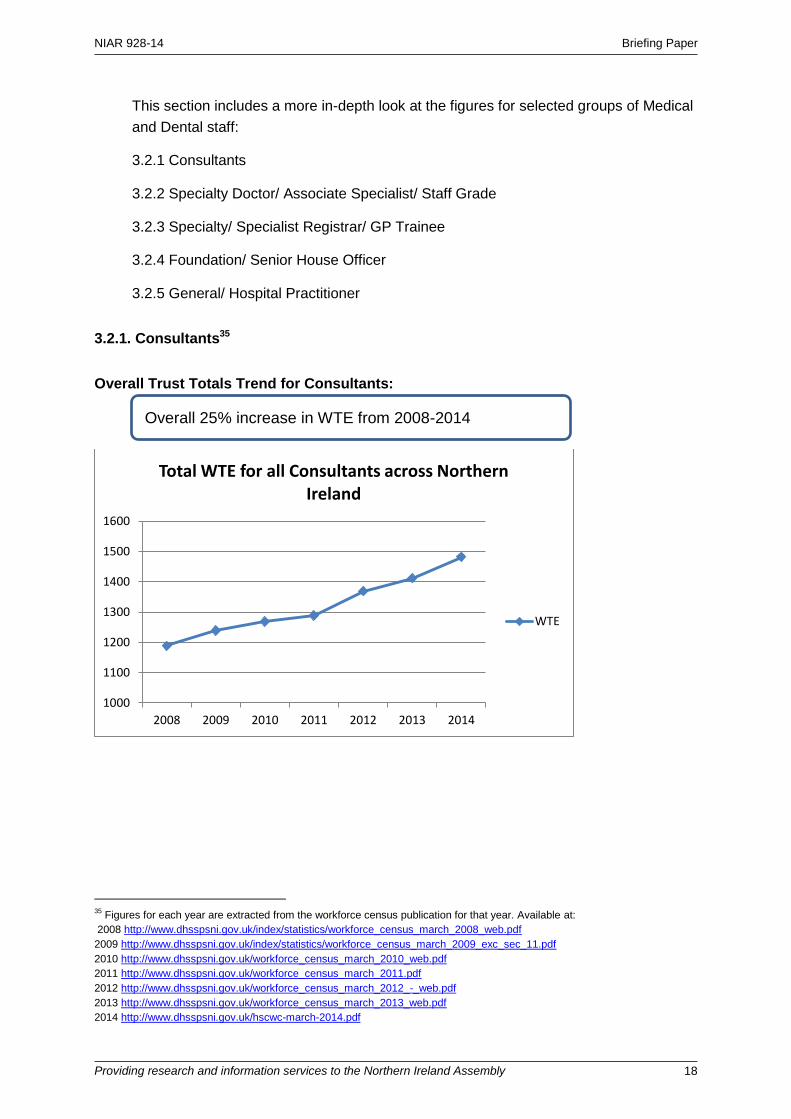
3.2.1. Consultants35
Overall Trust Totals Trend for Consultants:
35
Figures for each year are extracted from the workforce census publication for that year. Available at:
2008 http://www.dhsspsni.gov.uk/index/statistics/workforce_census_march_2008_web.pdf
2009 http://www.dhsspsni.gov.uk/index/statistics/workforce_census_march_2009_exc_sec_11.pdf
2010 http://www.dhsspsni.gov.uk/workforce_census_march_2010_web.pdf
2011 http://www.dhsspsni.gov.uk/workforce_census_march_2011.pdf
2012 http://www.dhsspsni.gov.uk/workforce_census_march_2012_-_web.pdf
2013 http://www.dhsspsni.gov.uk/workforce_census_march_2013_web.pdf
2014 http://www.dhsspsni.gov.uk/hscwc-march-2014.pdf
1000
1100
1200
1300
1400
1500
1600
2008 2009 2010 2011 2012 2013 2014
Total WTE for all Consultants across Northern Ireland
WTE
Overall 25% increase in WTE from 2008-2014

NIAR 928-14 Briefing Paper
Providing research and information services to the Northern Ireland Assembly 19
Trends across the Trusts 2008-2014:
Belfast: 25% Increase (521.4 to 657.7 in WTE)
Northern: 20% increase (165.7 to 199.2 in WTE)
South Eastern: 33% increase (160.6-212.5 in WTE)
Southern: 26% increase (157.8 to 199.2 in WTE)
Western: 16% increase (183.2 to 213.1 in WTE)
3.2.2. Speciality Doctor/ Associate Specialist/ Staff Grade36
Overall Trust Totals for Specialty Doctor/ Associate Specialist/ Staff Grade:
36
Figures for each year are extracted from the workforce census publication for that year. Available at:
2008 http://www.dhsspsni.gov.uk/index/statistics/workforce_census_march_2008_web.pdf
2009 http://www.dhsspsni.gov.uk/index/statistics/workforce_census_march_2009_exc_sec_11.pdf
2010 http://www.dhsspsni.gov.uk/workforce_census_march_2010_web.pdf
2011 http://www.dhsspsni.gov.uk/workforce_census_march_2011.pdf
2012 http://www.dhsspsni.gov.uk/workforce_census_march_2012_-_web.pdf
2013 http://www.dhsspsni.gov.uk/workforce_census_march_2013_web.pdf
2014 http://www.dhsspsni.gov.uk/hscwc-march-2014.pdf
250
270
290
310
330
350
370
390
410
430
2008 2009 2010 2011 2012 2013 2014
Total WTE for all Specialty Doctor/Associate Specialist/Staff Grade across Northern Ireland
WTE
Overall 20% increase in WTE from 2008-2014

NIAR 928-14 Briefing Paper
Providing research and information services to the Northern Ireland Assembly 20
Trends across the Trusts 2008-2014:
Belfast: 10% decrease (116.4 to 104.3 in WTE)
Northern: 72% increase (50.3 to 86.3 in WTE)
South Eastern: 37% increase (49.6 to 68.1 in WTE)
Southern: 36% increase (71.9 to 97.5 in WTE)
Western: 3% increase (59.6 to 61.3 in WTE)
Based on the above trends using figures from the HSC Workforce Census of that year,
a general increase in WTE is noted for Specialty Doctor/Associate Specialist/Staff Grade; however, the Northern and Western Trusts experience different trajectories.
The DHSSPS was asked by RaISe to explain these differences. The response was37:
The number of these staff will vary in each Trust according to their own service
configuration and specialties delivered. Trusts have indicated that additional posts have
been created due to newly funded initiatives which optimise the skill mix within medical
teams, hence increasing this level of doctor. Trusts have also indicated that additional
doctors of these grades can be recruited due to vacancies at either training level or
consultant level. There will also be an increase in this group of staff due to the
Modernising Medical Careers initiative and it being an attractive career pathway since
the introduction of the 2008 contract for Specialty Doctors and Associate Specialists.
Furthermore, some staff on the old medical officer and hospital practitioner grades will
have transferred to this contract.
37
Email reply from DHSSPS DALO, 03/02/15
NIAR 928-14 Briefing Paper
Providing research and information services to the Northern Ireland Assembly 21
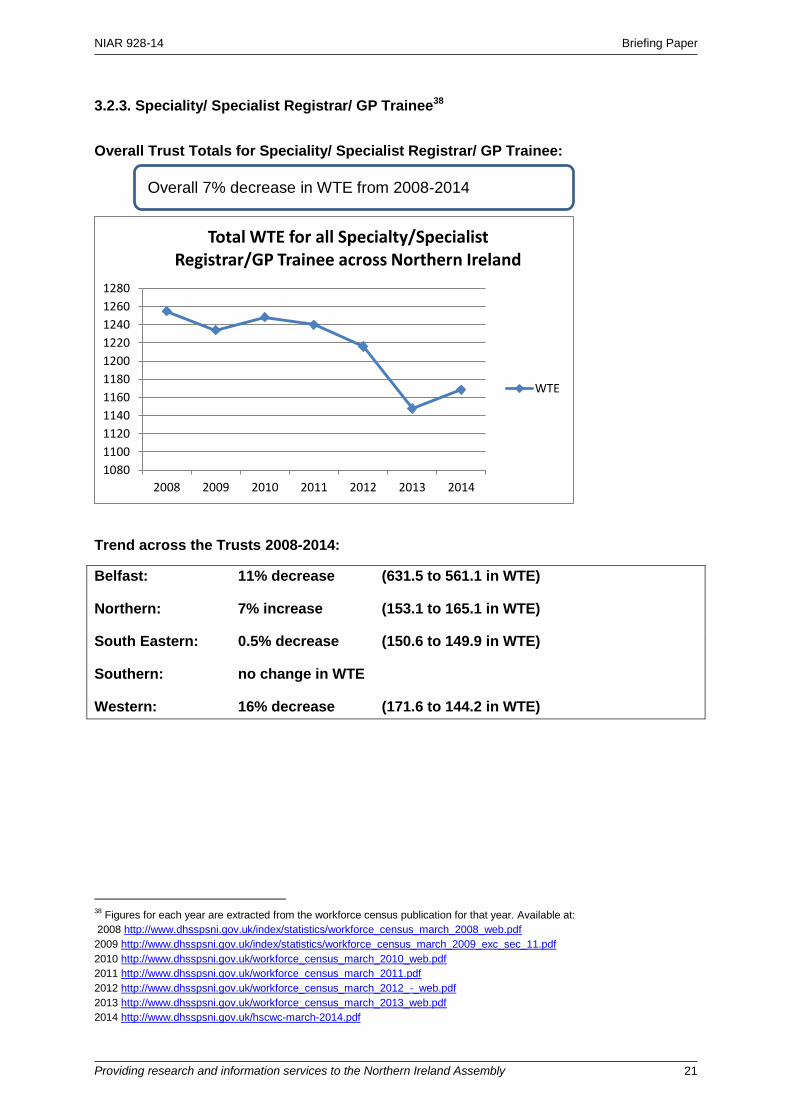
3.2.3. Speciality/ Specialist Registrar/ GP Trainee38
Overall Trust Totals for Speciality/ Specialist Registrar/ GP Trainee:
Trend across the Trusts 2008-2014:
Belfast: 11% decrease (631.5 to 561.1 in WTE)
Northern: 7% increase (153.1 to 165.1 in WTE)
South Eastern: 0.5% decrease (150.6 to 149.9 in WTE)
Southern: no change in WTE
Western: 16% decrease (171.6 to 144.2 in WTE)
38
Figures for each year are extracted from the workforce census publication for that year. Available at:
2008 http://www.dhsspsni.gov.uk/index/statistics/workforce_census_march_2008_web.pdf
2009 http://www.dhsspsni.gov.uk/index/statistics/workforce_census_march_2009_exc_sec_11.pdf
2010 http://www.dhsspsni.gov.uk/workforce_census_march_2010_web.pdf
2011 http://www.dhsspsni.gov.uk/workforce_census_march_2011.pdf
2012 http://www.dhsspsni.gov.uk/workforce_census_march_2012_-_web.pdf
2013 http://www.dhsspsni.gov.uk/workforce_census_march_2013_web.pdf
2014 http://www.dhsspsni.gov.uk/hscwc-march-2014.pdf
1080
1100
1120
1140
1160
1180
1200
1220
1240
1260
1280
2008 2009 2010 2011 2012 2013 2014
Total WTE for all Specialty/Specialist Registrar/GP Trainee across Northern Ireland
WTE
Overall 7% decrease in WTE from 2008-2014
NIAR 928-14 Briefing Paper
Providing research and information services to the Northern Ireland Assembly 22
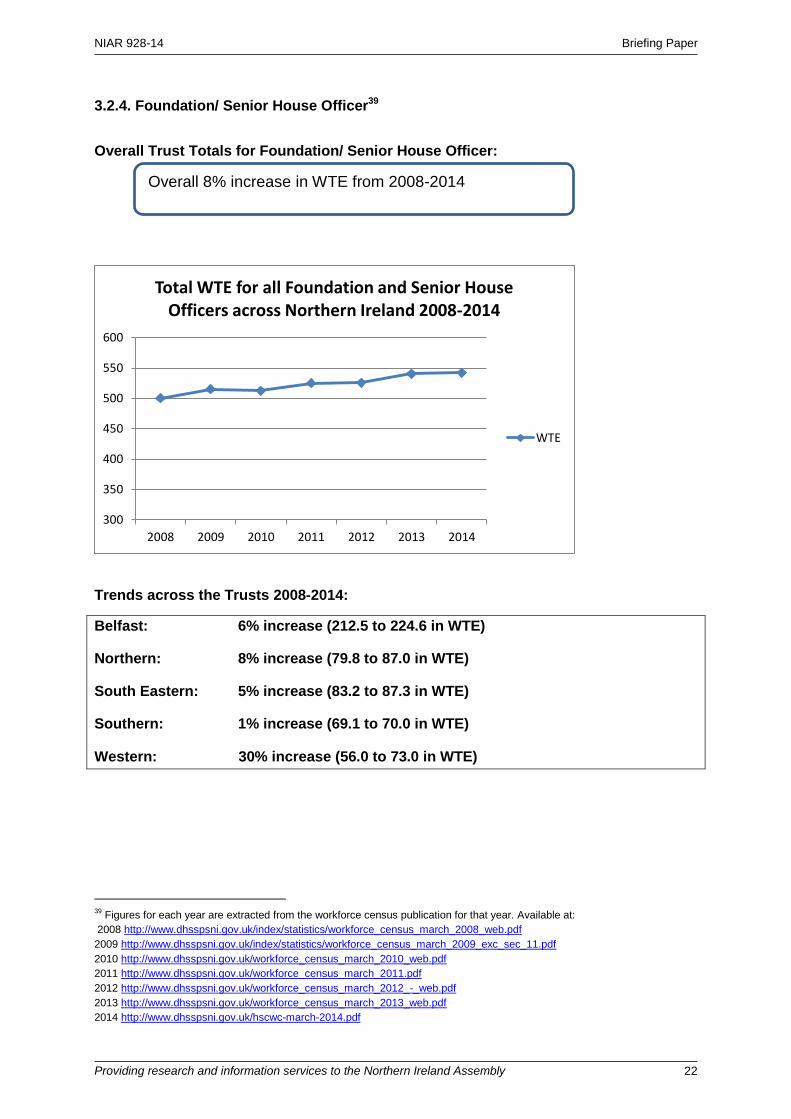
3.2.4. Foundation/ Senior House Officer39
Overall Trust Totals for Foundation/ Senior House Officer:
Trends across the Trusts 2008-2014:
Belfast: 6% increase (212.5 to 224.6 in WTE)
Northern: 8% increase (79.8 to 87.0 in WTE)
South Eastern: 5% increase (83.2 to 87.3 in WTE)
Southern: 1% increase (69.1 to 70.0 in WTE)
Western: 30% increase (56.0 to 73.0 in WTE)
39
Figures for each year are extracted from the workforce census publication for that year. Available at:
2008 http://www.dhsspsni.gov.uk/index/statistics/workforce_census_march_2008_web.pdf
2009 http://www.dhsspsni.gov.uk/index/statistics/workforce_census_march_2009_exc_sec_11.pdf
2010 http://www.dhsspsni.gov.uk/workforce_census_march_2010_web.pdf
2011 http://www.dhsspsni.gov.uk/workforce_census_march_2011.pdf
2012 http://www.dhsspsni.gov.uk/workforce_census_march_2012_-_web.pdf
2013 http://www.dhsspsni.gov.uk/workforce_census_march_2013_web.pdf
2014 http://www.dhsspsni.gov.uk/hscwc-march-2014.pdf
300
350
400
450
500
550
600
2008 2009 2010 2011 2012 2013 2014
Total WTE for all Foundation and Senior House Officers across Northern Ireland 2008-2014
WTE
Overall 8% increase in WTE from 2008-2014

NIAR 928-14 Briefing Paper
Providing research and information services to the Northern Ireland Assembly 23
3.2.5. General/ Hospital Practitioner40
Overall Trust Totals for General/ Hospital Practitioners:
Trends across the trusts 2008-2014: (relatively small staff numbers reflected in large
percentage changes):
Belfast: 89% decrease (29.7 to 3.2 in WTE)
Northern: 14% increase (5.6 to 6.4 in WTE)
South Eastern: 35% decrease (9.1 to 5.9 in WTE)
Southern: 78% decrease (38.1 to 8.1 in WTE)
Western: 100% decrease (4.2 to 0 in WTE)
Based on the above trends using figures from the HSC Workforce Census of that year,
there has been a consistent decline in General/ Hospital Practitioners.
40
Figures for each year are extracted from the workforce census publication for that year. Available at:
2008 http://www.dhsspsni.gov.uk/index/statistics/workforce_census_march_2008_web.pdf
2009 http://www.dhsspsni.gov.uk/index/statistics/workforce_census_march_2009_exc_sec_11.pdf
2010 http://www.dhsspsni.gov.uk/workforce_census_march_2010_web.pdf
2011 http://www.dhsspsni.gov.uk/workforce_census_march_2011.pdf
2012 http://www.dhsspsni.gov.uk/workforce_census_march_2012_-_web.pdf
2013 http://www.dhsspsni.gov.uk/workforce_census_march_2013_web.pdf
2014 http://www.dhsspsni.gov.uk/hscwc-march-2014.pdf
0
10
20
30
40
50
60
70
2008 2009 2010 2011 2012 2013 2014
Total WTE for all General/ Hospital Practioners across Northern Ireland
WTE
Overall 60% decrease in WTE from 2008-2014
NIAR 928-14 Briefing Paper
Providing research and information services to the Northern Ireland Assembly 24
RaISe put the following query to the DHSSPS: Although the overall numbers in this
staff group has never been high, since 2008 the number has decreased in all but the
Northern Trust and there now appears to be none of this staff group in the Western
Trust and a very large decrease in the Belfast Trust of around 90% - please advise
what role this staff group play in the Trusts and the rationale for the decreases. The
response received was as follows41:
The published HSC Workforce Census figures for staff graded as General/Hospital
practitioner now exclude those working in the GP Out of Hours service, whereas the
March 2008 HSC Workforce Census had included these doctors. This is the
explanation for the bulk of the apparent decrease in this staff group. The hospital
practitioner grade is also being phased out, hence the low level of current staff. These
staff also work on a sessional basis, hence the low level of whole-time equivalent. As
above, the number of staff on general/hospital practitioner grades has been decreasing
since the introduction of the 2008 Specialty Doctors and Associate Specialist contract.
41
Email reply from DHSSPS DALO, 03/02/15

NIAR 928-14 Briefing Paper
Providing research and information services to the Northern Ireland Assembly 25
3.3 Professional and Technical Staff
Overall NI Trend for Professional and Technical Staff42:
2000-2014: 70% increase (4251.0 to 7195.6 in WTE)
o 2005-2014: 27% increase (5,675.9 to 7195.6 in WTE)
o 2009-2014: 16% increase (6187.2 to 7195.6 in WTE)
42
Figures for 2005-2014 taken from the 2014 HSC workforce census and figure for 2000-2004 are taken from the 2005 HSC
workforce census, http://www.dhsspsni.gov.uk/hscwc-march-2014.pdf
http://www.dhsspsni.gov.uk/workforce_census_march_2005_exc_sec_11.pdf
4000
4500
5000
5500
6000
6500
7000
7500
2000
2001
2002
2003
2004
2005
2006
2007
2008
2009
2010
2011
2012
2013
2014
Professional and Technical Staff 2000-2014
WTE
4,000.0
4,500.0
5,000.0
5,500.0
6,000.0
6,500.0
7,000.0
7,500.0
2009 2010 2011 2012 2013 2014
Professional and Technical Staff 2009-2014
WTE

NIAR 928-14 Briefing Paper
Providing research and information services to the Northern Ireland Assembly 26
This section includes a more in-depth look at the figures for selected Professional and
Technical staff:
3.3.1 Dieticians
3.3.2 Occupational Therapists
3.3.3 Physiotherapists
3.3.4 Radiographers
3.3.5 Speech and Language Therapists
3.3.6 Pharmacists
3.3.1. Dieticians43
Overall Trust Totals for Dieticians from 2008-2014:
43
Figures for each year are extracted from the workforce census publication for that year. Available at:
2008 http://www.dhsspsni.gov.uk/index/statistics/workforce_census_march_2008_web.pdf
2009 http://www.dhsspsni.gov.uk/index/statistics/workforce_census_march_2009_exc_sec_11.pdf
2010 http://www.dhsspsni.gov.uk/workforce_census_march_2010_web.pdf
2011 http://www.dhsspsni.gov.uk/workforce_census_march_2011.pdf
2012 http://www.dhsspsni.gov.uk/workforce_census_march_2012_-_web.pdf
2013 http://www.dhsspsni.gov.uk/workforce_census_march_2013_web.pdf
2014 http://www.dhsspsni.gov.uk/hscwc-march-2014.pdf
100
120
140
160
180
200
220
240
260
2008 2009 2010 2011 2012 2013 2014
Total WTE for Dieticians across the five HSC Trusts
WTE
Overall 21% increase in WTE from 2008-2014
NIAR 928-14 Briefing Paper
Providing research and information services to the Northern Ireland Assembly 27
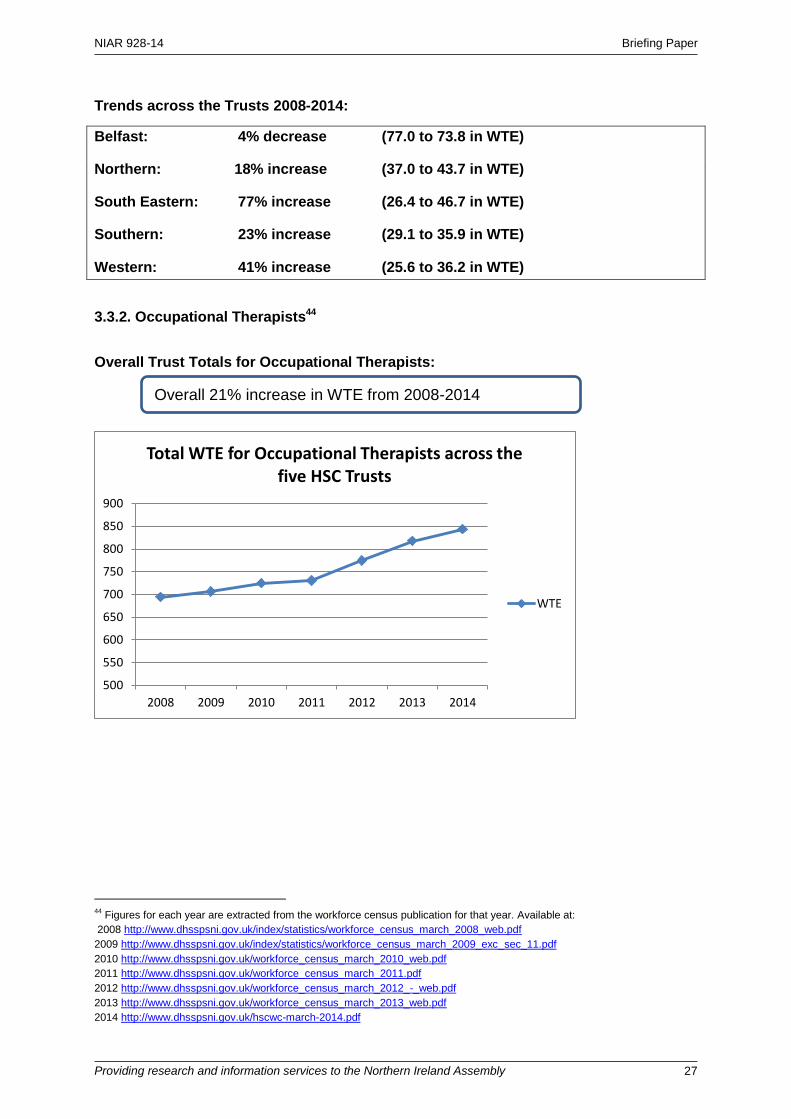
Trends across the Trusts 2008-2014:
Belfast: 4% decrease (77.0 to 73.8 in WTE)
Northern: 18% increase (37.0 to 43.7 in WTE)
South Eastern: 77% increase (26.4 to 46.7 in WTE)
Southern: 23% increase (29.1 to 35.9 in WTE)
Western: 41% increase (25.6 to 36.2 in WTE)
3.3.2. Occupational Therapists44
Overall Trust Totals for Occupational Therapists:
44
Figures for each year are extracted from the workforce census publication for that year. Available at:
2008 http://www.dhsspsni.gov.uk/index/statistics/workforce_census_march_2008_web.pdf
2009 http://www.dhsspsni.gov.uk/index/statistics/workforce_census_march_2009_exc_sec_11.pdf
2010 http://www.dhsspsni.gov.uk/workforce_census_march_2010_web.pdf
2011 http://www.dhsspsni.gov.uk/workforce_census_march_2011.pdf
2012 http://www.dhsspsni.gov.uk/workforce_census_march_2012_-_web.pdf
2013 http://www.dhsspsni.gov.uk/workforce_census_march_2013_web.pdf
2014 http://www.dhsspsni.gov.uk/hscwc-march-2014.pdf
500
550
600
650
700
750
800
850
900
2008 2009 2010 2011 2012 2013 2014
Total WTE for Occupational Therapists across the five HSC Trusts
WTE
Overall 21% increase in WTE from 2008-2014
NIAR 928-14 Briefing Paper
Providing research and information services to the Northern Ireland Assembly 28
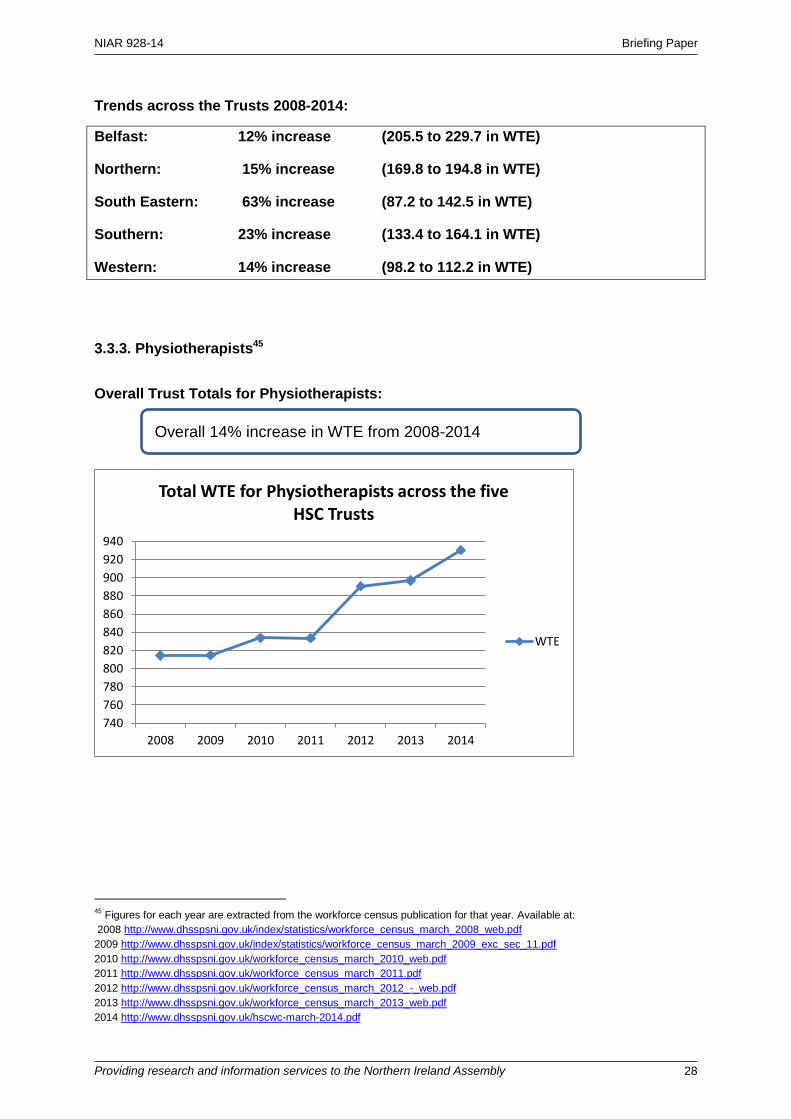
Trends across the Trusts 2008-2014:
Belfast: 12% increase (205.5 to 229.7 in WTE)
Northern: 15% increase (169.8 to 194.8 in WTE)
South Eastern: 63% increase (87.2 to 142.5 in WTE)
Southern: 23% increase (133.4 to 164.1 in WTE)
Western: 14% increase (98.2 to 112.2 in WTE)
3.3.3. Physiotherapists45
Overall Trust Totals for Physiotherapists:
45
Figures for each year are extracted from the workforce census publication for that year. Available at:
2008 http://www.dhsspsni.gov.uk/index/statistics/workforce_census_march_2008_web.pdf
2009 http://www.dhsspsni.gov.uk/index/statistics/workforce_census_march_2009_exc_sec_11.pdf
2010 http://www.dhsspsni.gov.uk/workforce_census_march_2010_web.pdf
2011 http://www.dhsspsni.gov.uk/workforce_census_march_2011.pdf
2012 http://www.dhsspsni.gov.uk/workforce_census_march_2012_-_web.pdf
2013 http://www.dhsspsni.gov.uk/workforce_census_march_2013_web.pdf
2014 http://www.dhsspsni.gov.uk/hscwc-march-2014.pdf
740
760
780
800
820
840
860
880
900
920
940
2008 2009 2010 2011 2012 2013 2014
Total WTE for Physiotherapists across the five HSC Trusts
WTE
Overall 14% increase in WTE from 2008-2014
NIAR 928-14 Briefing Paper
Providing research and information services to the Northern Ireland Assembly 29
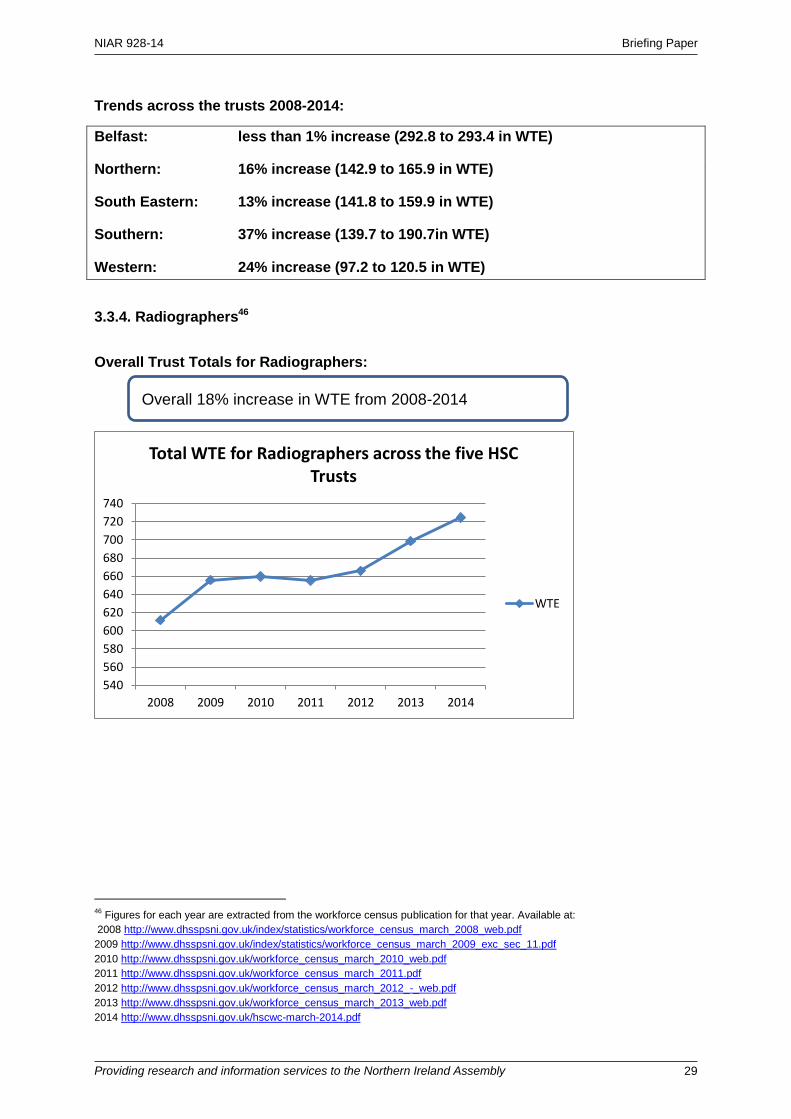
Trends across the trusts 2008-2014:
Belfast: less than 1% increase (292.8 to 293.4 in WTE)
Northern: 16% increase (142.9 to 165.9 in WTE)
South Eastern: 13% increase (141.8 to 159.9 in WTE)
Southern: 37% increase (139.7 to 190.7in WTE)
Western: 24% increase (97.2 to 120.5 in WTE)
3.3.4. Radiographers46
Overall Trust Totals for Radiographers:
46
Figures for each year are extracted from the workforce census publication for that year. Available at:
2008 http://www.dhsspsni.gov.uk/index/statistics/workforce_census_march_2008_web.pdf
2009 http://www.dhsspsni.gov.uk/index/statistics/workforce_census_march_2009_exc_sec_11.pdf
2010 http://www.dhsspsni.gov.uk/workforce_census_march_2010_web.pdf
2011 http://www.dhsspsni.gov.uk/workforce_census_march_2011.pdf
2012 http://www.dhsspsni.gov.uk/workforce_census_march_2012_-_web.pdf
2013 http://www.dhsspsni.gov.uk/workforce_census_march_2013_web.pdf
2014 http://www.dhsspsni.gov.uk/hscwc-march-2014.pdf
540
560
580
600
620
640
660
680
700
720
740
2008 2009 2010 2011 2012 2013 2014
Total WTE for Radiographers across the five HSC Trusts
WTE
Overall 18% increase in WTE from 2008-2014

NIAR 928-14 Briefing Paper
Providing research and information services to the Northern Ireland Assembly 30
Trends across the Trusts 2008-2014:
Belfast: 8% increase (273.0 to 295.9 in WTE)
Northern: 19% increase (86.3 to 103.0 in WTE)
South Eastern: 22% increase (75.1 to 91.8 in WTE)
Southern: 29% increase (88.7 to 114.6 in WTE)
Western: 35% increase (88.3 to 119.1 in WTE)
3.3.5. Speech and Language Therapists47
Overall Trust Totals for Speech and Language Therapists:
47
Figures for each year are extracted from the workforce census publication for that year. Available at:
2008 http://www.dhsspsni.gov.uk/index/statistics/workforce_census_march_2008_web.pdf
2009 http://www.dhsspsni.gov.uk/index/statistics/workforce_census_march_2009_exc_sec_11.pdf
2010 http://www.dhsspsni.gov.uk/workforce_census_march_2010_web.pdf
2011 http://www.dhsspsni.gov.uk/workforce_census_march_2011.pdf
2012 http://www.dhsspsni.gov.uk/workforce_census_march_2012_-_web.pdf
2013 http://www.dhsspsni.gov.uk/workforce_census_march_2013_web.pdf
2014 http://www.dhsspsni.gov.uk/hscwc-march-2014.pdf
310
320
330
340
350
360
370
380
390
400
410
2008 2009 2010 2011 2012 2013 2014
Total WTE for Speech and Language Therapists across the five HSC Trusts
WTE
Overall 17% increase in WTE from 2008-2014
NIAR 928-14 Briefing Paper
Providing research and information services to the Northern Ireland Assembly 31
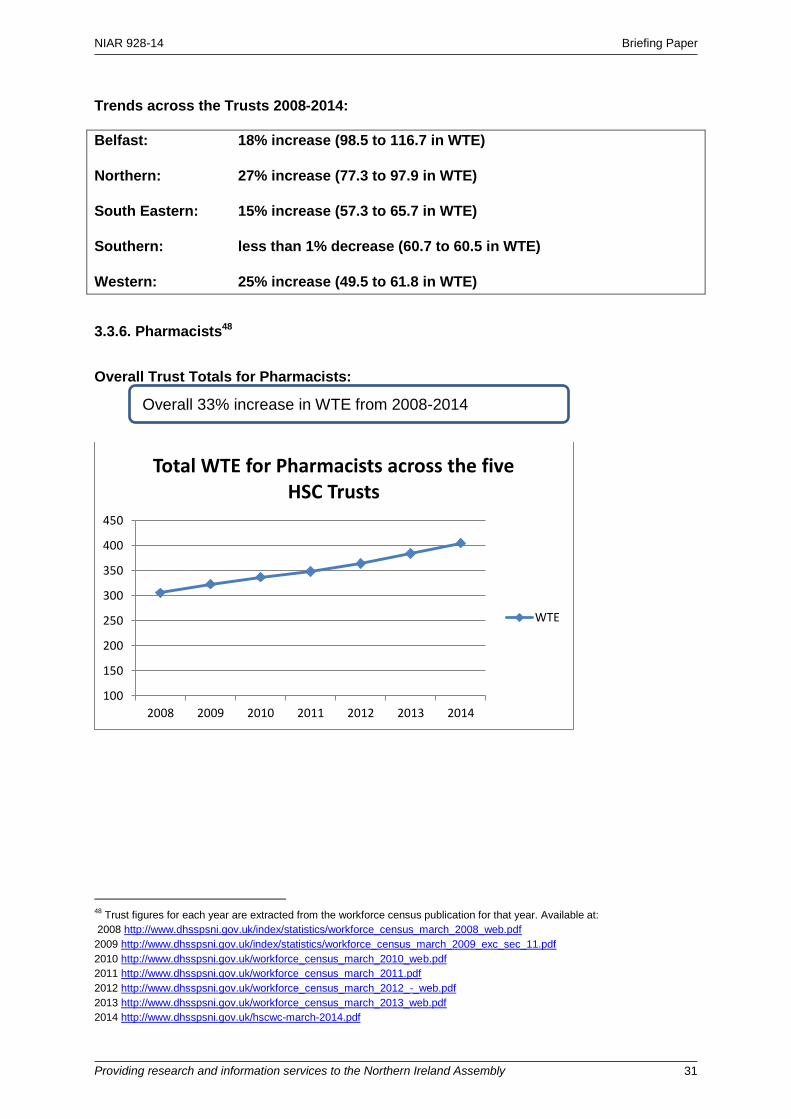
Trends across the Trusts 2008-2014:
Belfast: 18% increase (98.5 to 116.7 in WTE)
Northern: 27% increase (77.3 to 97.9 in WTE)
South Eastern: 15% increase (57.3 to 65.7 in WTE)
Southern: less than 1% decrease (60.7 to 60.5 in WTE)
Western: 25% increase (49.5 to 61.8 in WTE)
3.3.6. Pharmacists48
Overall Trust Totals for Pharmacists:
48
Trust figures for each year are extracted from the workforce census publication for that year. Available at:
2008 http://www.dhsspsni.gov.uk/index/statistics/workforce_census_march_2008_web.pdf
2009 http://www.dhsspsni.gov.uk/index/statistics/workforce_census_march_2009_exc_sec_11.pdf
2010 http://www.dhsspsni.gov.uk/workforce_census_march_2010_web.pdf
2011 http://www.dhsspsni.gov.uk/workforce_census_march_2011.pdf
2012 http://www.dhsspsni.gov.uk/workforce_census_march_2012_-_web.pdf
2013 http://www.dhsspsni.gov.uk/workforce_census_march_2013_web.pdf
2014 http://www.dhsspsni.gov.uk/hscwc-march-2014.pdf
100
150
200
250
300
350
400
450
2008 2009 2010 2011 2012 2013 2014
Total WTE for Pharmacists across the five HSC Trusts
WTE
Overall 33% increase in WTE from 2008-2014
NIAR 928-14 Briefing Paper
Providing research and information services to the Northern Ireland Assembly 32
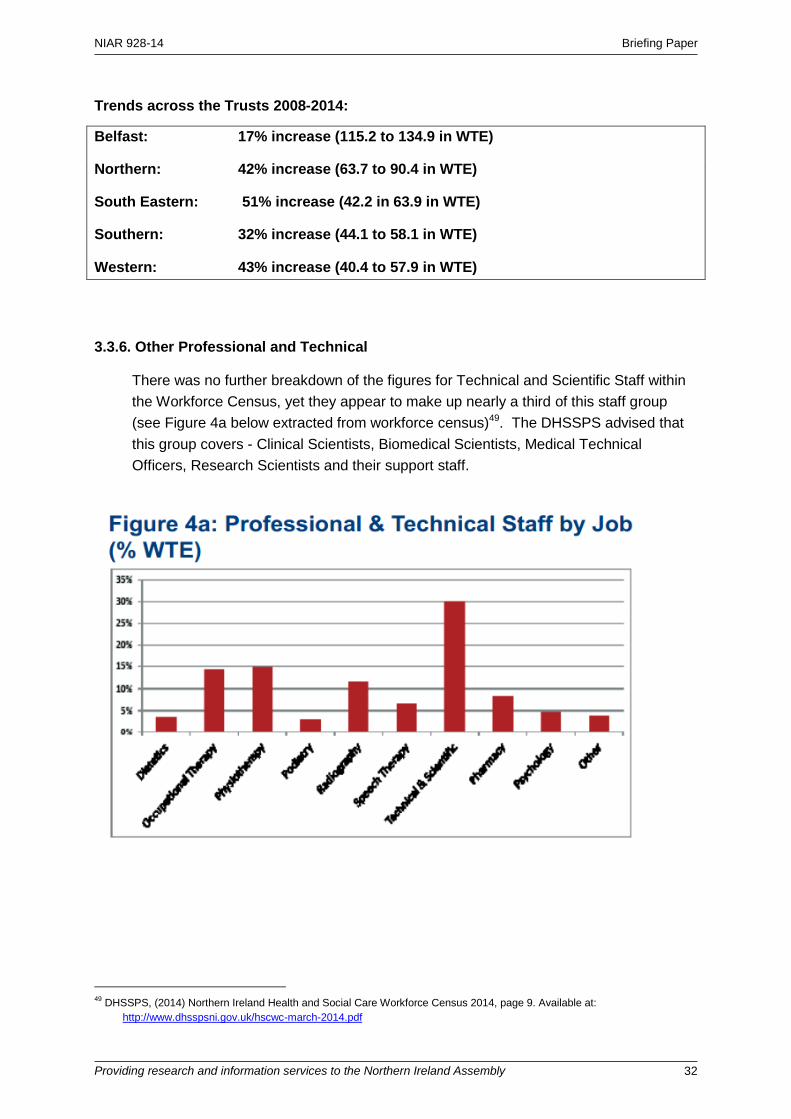
Trends across the Trusts 2008-2014:
Belfast: 17% increase (115.2 to 134.9 in WTE)
Northern: 42% increase (63.7 to 90.4 in WTE)
South Eastern: 51% increase (42.2 in 63.9 in WTE)
Southern: 32% increase (44.1 to 58.1 in WTE)
Western: 43% increase (40.4 to 57.9 in WTE)
3.3.6. Other Professional and Technical
There was no further breakdown of the figures for Technical and Scientific Staff within
the Workforce Census, yet they appear to make up nearly a third of this staff group
(see Figure 4a below extracted from workforce census)49. The DHSSPS advised that
this group covers - Clinical Scientists, Biomedical Scientists, Medical Technical
Officers, Research Scientists and their support staff.
49
DHSSPS, (2014) Northern Ireland Health and Social Care Workforce Census 2014, page 9. Available at:
http://www.dhsspsni.gov.uk/hscwc-march-2014.pdf

NIAR 928-14 Briefing Paper
Providing research and information services to the Northern Ireland Assembly 33
3.4 Social Services Staff
Overall NI Trends for Social Services Staff50:
2000-2014: 94% increase (3466.3 to 6736.1 in WTE)
o 2005-2014: 47% increase (4587.6 to 6736.1 in WTE)
(2007-2008: 23% increase 5112.3 to 6268.5 in WTE)
o 2009-2014: 4% increase (6483.3 to 6736.1 in WTE)
RaISe noted the increase of Social Services Staff between 2007 and 2008 and asked
the DHSSPS to explain this increase. The DHSSPS advised:
This is attributable to two factors: firstly, the 2007 HSC Workforce Census did not
include staff graded as Home Helps, but for the first time the 2008 HSC Workforce
Census did. Secondly, due to Agenda for Change and re-grading of jobs, many
workers who were previously coded to the Ancillary & General terms and conditions
group were then re-coded to fall within the Social Services terms and conditions group
(or Occupational Family as it is now known).
50
Figures for 2005-2014 taken from the 2014 HSC workforce census and figure for 2000-2004 are taken from the 2005 HSC
workforce census, http://www.dhsspsni.gov.uk/hscwc-march-2014.pdf
http://www.dhsspsni.gov.uk/workforce_census_march_2005_exc_sec_11.pdf
3000
3500
4000
4500
5000
5500
6000
6500
7000
2000
2001
2002
2003
2004
2005
2006
2007
2008
2009
2010
2011
2012
2013
2014
Social Services Staff 2000-2014
WTE

NIAR 928-14 Briefing Paper
Providing research and information services to the Northern Ireland Assembly 34
This section includes a more in-depth look at the figures for selected Social Services
staff this includes:
3.4.1 Child/ Family Care Social Workers
3.4.2 Hospital Social Workers
3.4.3 Elderly Social Workers
3.4.4 Learning Disability Social Workers
3.4.5 Mental Health Social Workers
3.4.6 Social Care Staff
5,500.0
5,700.0
5,900.0
6,100.0
6,300.0
6,500.0
6,700.0
6,900.0
2009 2010 2011 2012 2013 2014
Social Services Staff 2009-2014
WTE
NIAR 928-14 Briefing Paper
Providing research and information services to the Northern Ireland Assembly 35
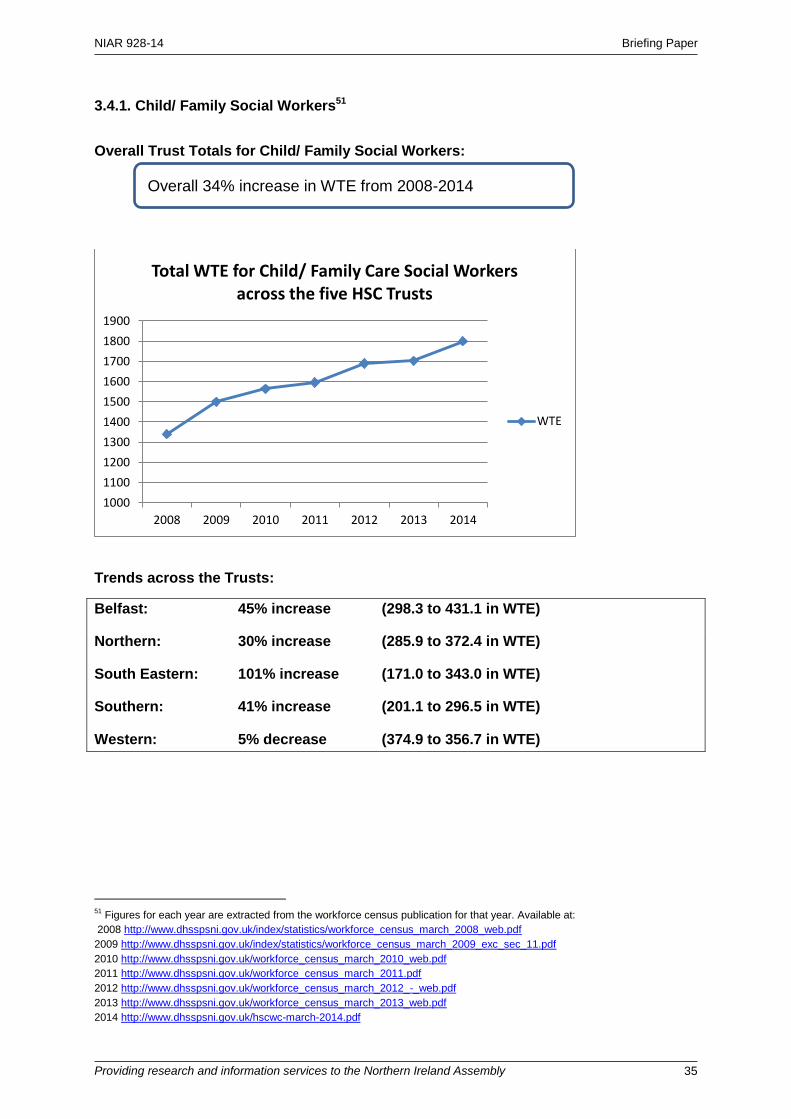
3.4.1. Child/ Family Social Workers51
Overall Trust Totals for Child/ Family Social Workers:
Trends across the Trusts:
Belfast: 45% increase (298.3 to 431.1 in WTE)
Northern: 30% increase (285.9 to 372.4 in WTE)
South Eastern: 101% increase (171.0 to 343.0 in WTE)
Southern: 41% increase (201.1 to 296.5 in WTE)
Western: 5% decrease (374.9 to 356.7 in WTE)
51
Figures for each year are extracted from the workforce census publication for that year. Available at:
2008 http://www.dhsspsni.gov.uk/index/statistics/workforce_census_march_2008_web.pdf
2009 http://www.dhsspsni.gov.uk/index/statistics/workforce_census_march_2009_exc_sec_11.pdf
2010 http://www.dhsspsni.gov.uk/workforce_census_march_2010_web.pdf
2011 http://www.dhsspsni.gov.uk/workforce_census_march_2011.pdf
2012 http://www.dhsspsni.gov.uk/workforce_census_march_2012_-_web.pdf
2013 http://www.dhsspsni.gov.uk/workforce_census_march_2013_web.pdf
2014 http://www.dhsspsni.gov.uk/hscwc-march-2014.pdf
1000
1100
1200
1300
1400
1500
1600
1700
1800
1900
2008 2009 2010 2011 2012 2013 2014
Total WTE for Child/ Family Care Social Workers across the five HSC Trusts
WTE
Overall 34% increase in WTE from 2008-2014
NIAR 928-14 Briefing Paper
Providing research and information services to the Northern Ireland Assembly 36
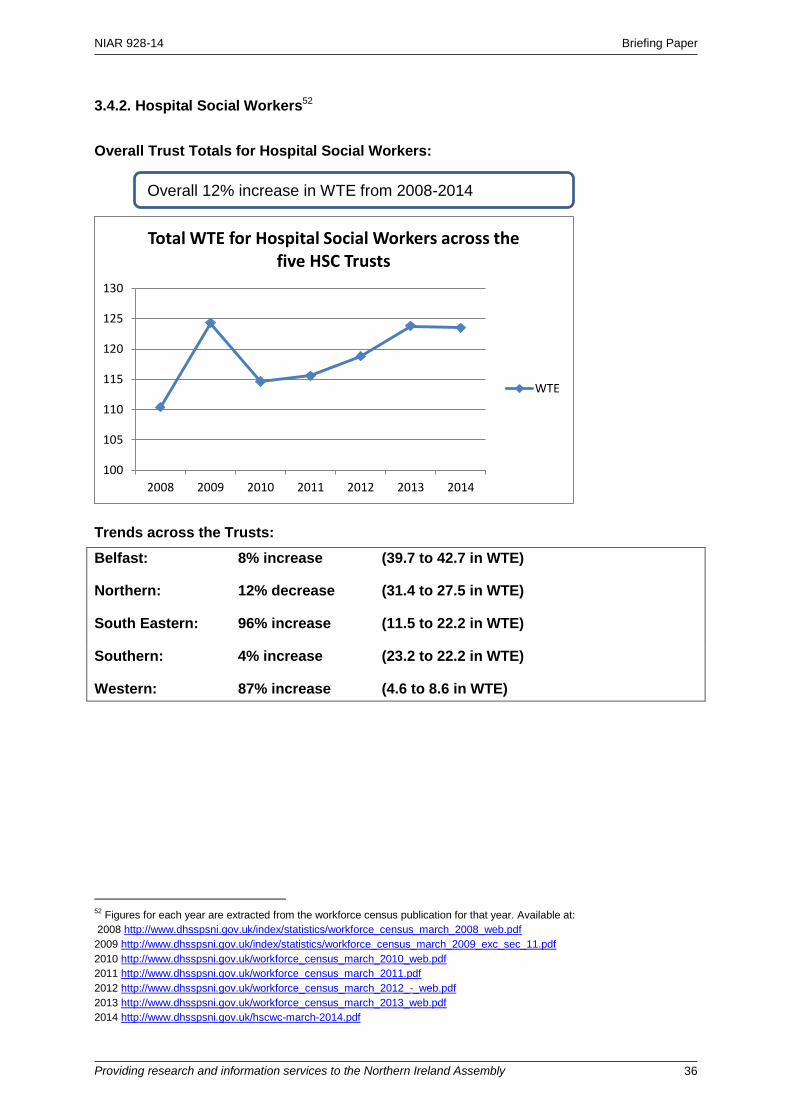
3.4.2. Hospital Social Workers52
Overall Trust Totals for Hospital Social Workers:
Trends across the Trusts:
Belfast: 8% increase (39.7 to 42.7 in WTE)
Northern: 12% decrease (31.4 to 27.5 in WTE)
South Eastern: 96% increase (11.5 to 22.2 in WTE)
Southern: 4% increase (23.2 to 22.2 in WTE)
Western: 87% increase (4.6 to 8.6 in WTE)
52
Figures for each year are extracted from the workforce census publication for that year. Available at:
2008 http://www.dhsspsni.gov.uk/index/statistics/workforce_census_march_2008_web.pdf
2009 http://www.dhsspsni.gov.uk/index/statistics/workforce_census_march_2009_exc_sec_11.pdf
2010 http://www.dhsspsni.gov.uk/workforce_census_march_2010_web.pdf
2011 http://www.dhsspsni.gov.uk/workforce_census_march_2011.pdf
2012 http://www.dhsspsni.gov.uk/workforce_census_march_2012_-_web.pdf
2013 http://www.dhsspsni.gov.uk/workforce_census_march_2013_web.pdf
2014 http://www.dhsspsni.gov.uk/hscwc-march-2014.pdf
100
105
110
115
120
125
130
2008 2009 2010 2011 2012 2013 2014
Total WTE for Hospital Social Workers across the five HSC Trusts
WTE
Overall 12% increase in WTE from 2008-2014

NIAR 928-14 Briefing Paper
Providing research and information services to the Northern Ireland Assembly 37
3.4.3. Elderly Social Workers53
Overall Trust Totals for Elderly Social Workers:
Trends across the Trusts:
Belfast: 60% increase (40.5 to 64.6 in WTE)
Northern: 3% increase (55.0 to 56.5 in WTE)
South Eastern: 144% increase (17.5 to 42.6 in WTE)
Southern: 12% increase (43.7 to 49.0 in WTE)
Western: 18% decrease (111.1 to 91.6 in WTE)
53
Figures for each year are extracted from the workforce census publication for that year. Available at:
2008 http://www.dhsspsni.gov.uk/index/statistics/workforce_census_march_2008_web.pdf
2009 http://www.dhsspsni.gov.uk/index/statistics/workforce_census_march_2009_exc_sec_11.pdf
2010 http://www.dhsspsni.gov.uk/workforce_census_march_2010_web.pdf
2011 http://www.dhsspsni.gov.uk/workforce_census_march_2011.pdf
2012 http://www.dhsspsni.gov.uk/workforce_census_march_2012_-_web.pdf
2013 http://www.dhsspsni.gov.uk/workforce_census_march_2013_web.pdf
2014 http://www.dhsspsni.gov.uk/hscwc-march-2014.pdf
0
50
100
150
200
250
300
350
2008 2009 2010 2011 2012 2013 2014
Total WTE for Elderly Social Workers across the five HSC Trusts
WTE
Overall 14% increase in WTE from 2008-2014
NIAR 928-14 Briefing Paper
Providing research and information services to the Northern Ireland Assembly 38
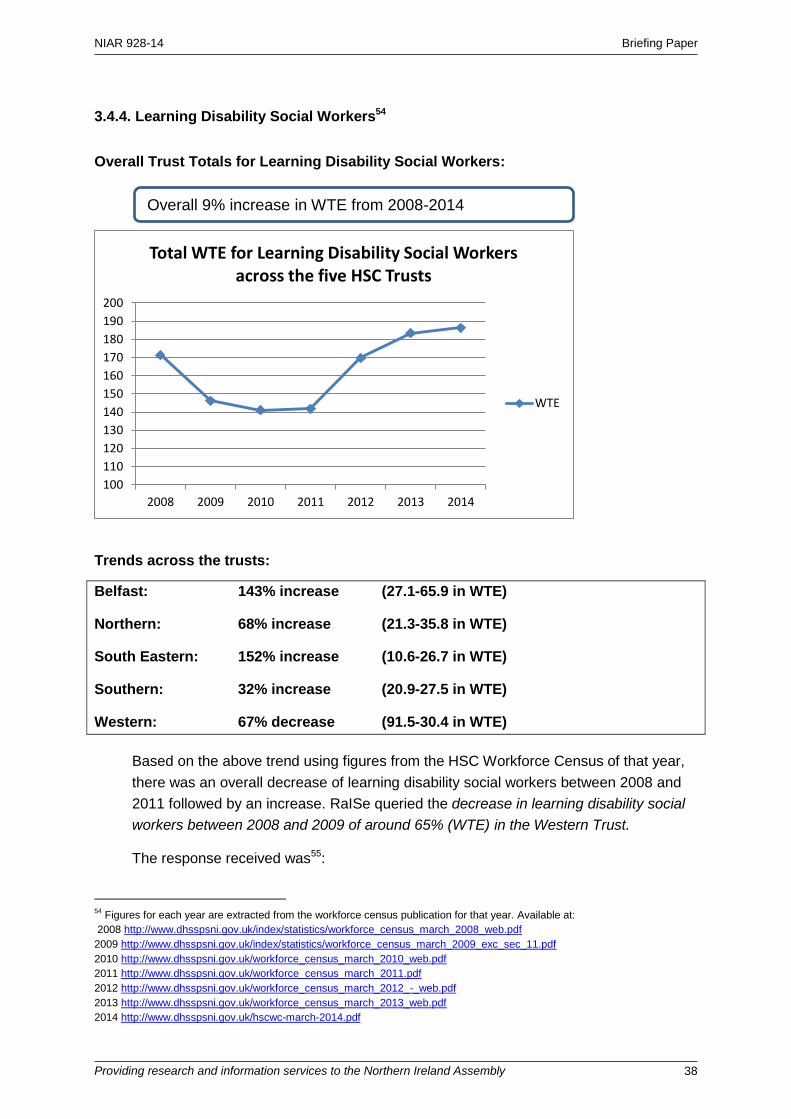
3.4.4. Learning Disability Social Workers54
Overall Trust Totals for Learning Disability Social Workers:
Trends across the trusts:
Belfast: 143% increase (27.1-65.9 in WTE)
Northern: 68% increase (21.3-35.8 in WTE)
South Eastern: 152% increase (10.6-26.7 in WTE)
Southern: 32% increase (20.9-27.5 in WTE)
Western: 67% decrease (91.5-30.4 in WTE)
Based on the above trend using figures from the HSC Workforce Census of that year,
there was an overall decrease of learning disability social workers between 2008 and
2011 followed by an increase. RaISe queried the decrease in learning disability social
workers between 2008 and 2009 of around 65% (WTE) in the Western Trust.
The response received was55:
54
Figures for each year are extracted from the workforce census publication for that year. Available at:
2008 http://www.dhsspsni.gov.uk/index/statistics/workforce_census_march_2008_web.pdf
2009 http://www.dhsspsni.gov.uk/index/statistics/workforce_census_march_2009_exc_sec_11.pdf
2010 http://www.dhsspsni.gov.uk/workforce_census_march_2010_web.pdf
2011 http://www.dhsspsni.gov.uk/workforce_census_march_2011.pdf
2012 http://www.dhsspsni.gov.uk/workforce_census_march_2012_-_web.pdf
2013 http://www.dhsspsni.gov.uk/workforce_census_march_2013_web.pdf
2014 http://www.dhsspsni.gov.uk/hscwc-march-2014.pdf
100
110
120
130
140
150
160
170
180
190
200
2008 2009 2010 2011 2012 2013 2014
Total WTE for Learning Disability Social Workers across the five HSC Trusts
WTE
Overall 9% increase in WTE from 2008-2014
NIAR 928-14 Briefing Paper
Providing research and information services to the Northern Ireland Assembly 39
This query appears to relate to a recording issue during grade code assimilation,
following the introduction of the new Agenda for Change grade coding. Some staff that
had been coded to Learning Disability Social Worker Band 5 in 2008 were
subsequently correctly moved to Learning Disability Social Work Support Band 5 by
2009.
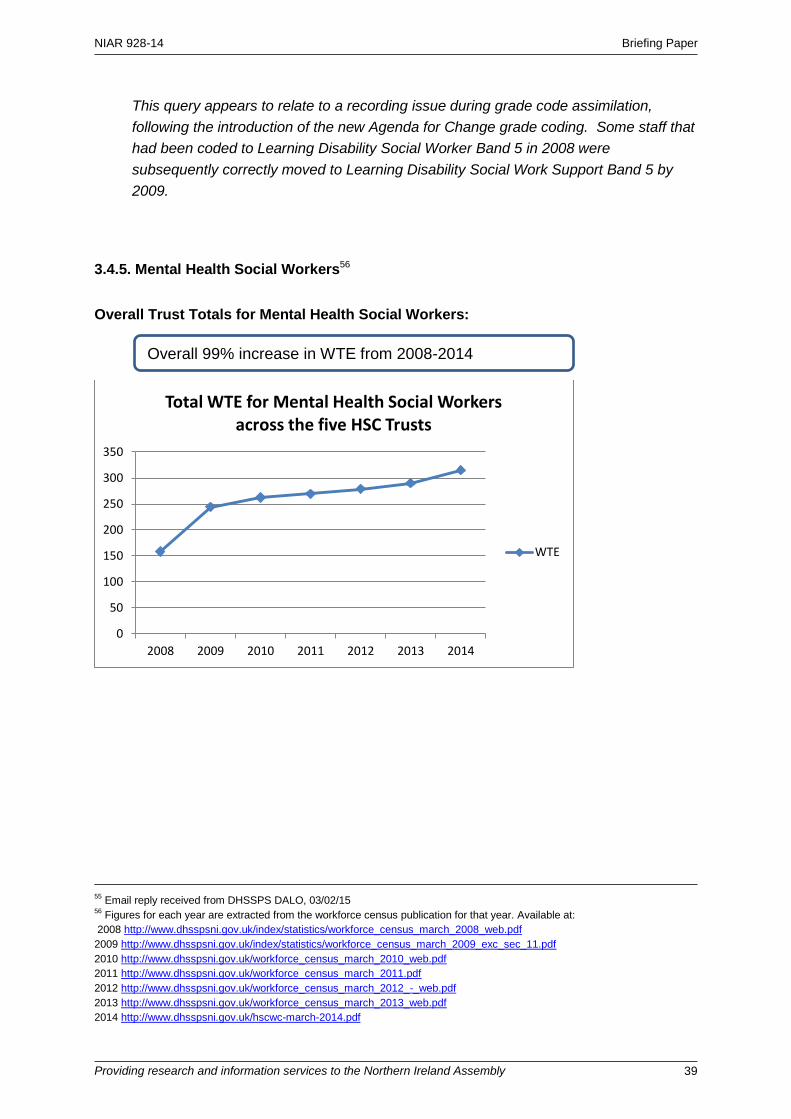
3.4.5. Mental Health Social Workers56
Overall Trust Totals for Mental Health Social Workers:
55
Email reply received from DHSSPS DALO, 03/02/15 56
Figures for each year are extracted from the workforce census publication for that year. Available at:
2008 http://www.dhsspsni.gov.uk/index/statistics/workforce_census_march_2008_web.pdf
2009 http://www.dhsspsni.gov.uk/index/statistics/workforce_census_march_2009_exc_sec_11.pdf
2010 http://www.dhsspsni.gov.uk/workforce_census_march_2010_web.pdf
2011 http://www.dhsspsni.gov.uk/workforce_census_march_2011.pdf
2012 http://www.dhsspsni.gov.uk/workforce_census_march_2012_-_web.pdf
2013 http://www.dhsspsni.gov.uk/workforce_census_march_2013_web.pdf
2014 http://www.dhsspsni.gov.uk/hscwc-march-2014.pdf
0
50
100
150
200
250
300
350
2008 2009 2010 2011 2012 2013 2014
Total WTE for Mental Health Social Workers across the five HSC Trusts
WTE
Overall 99% increase in WTE from 2008-2014
NIAR 928-14 Briefing Paper
Providing research and information services to the Northern Ireland Assembly 40
Trends across the Trusts (relatively small numbers reflected in large percentage
changes):
Belfast: Increase of 80% (41.1-73.8 in WTE)
Northern: Increase of 279% (23.7-89.7 in WTE)
South Eastern: Increase of 423% (9.7-50.7 in WTE)
Southern: Increase of 56% (32.4-50.7 in WTE)
Western: Decrease of 1% (51.2-50.7 in WTE)
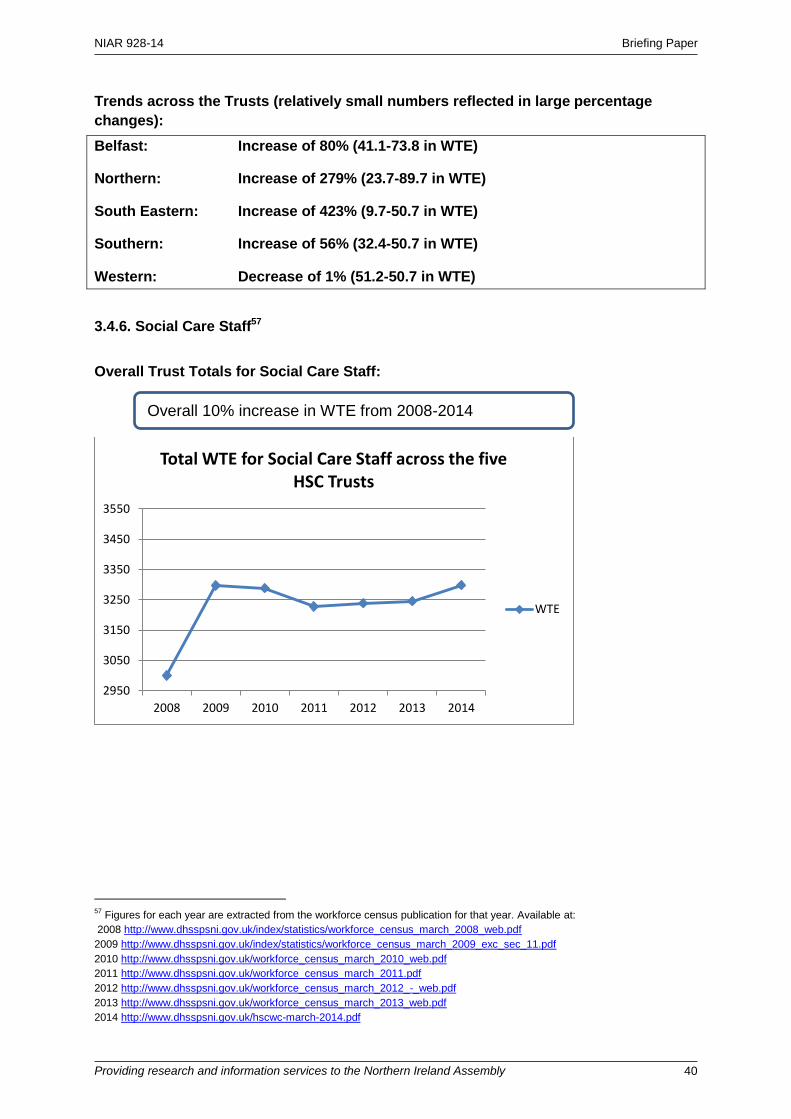
3.4.6. Social Care Staff57
Overall Trust Totals for Social Care Staff:
57
Figures for each year are extracted from the workforce census publication for that year. Available at:
2008 http://www.dhsspsni.gov.uk/index/statistics/workforce_census_march_2008_web.pdf
2009 http://www.dhsspsni.gov.uk/index/statistics/workforce_census_march_2009_exc_sec_11.pdf
2010 http://www.dhsspsni.gov.uk/workforce_census_march_2010_web.pdf
2011 http://www.dhsspsni.gov.uk/workforce_census_march_2011.pdf
2012 http://www.dhsspsni.gov.uk/workforce_census_march_2012_-_web.pdf
2013 http://www.dhsspsni.gov.uk/workforce_census_march_2013_web.pdf
2014 http://www.dhsspsni.gov.uk/hscwc-march-2014.pdf
2950
3050
3150
3250
3350
3450
3550
2008 2009 2010 2011 2012 2013 2014
Total WTE for Social Care Staff across the five HSC Trusts
WTE
Overall 10% increase in WTE from 2008-2014

NIAR 928-14 Briefing Paper
Providing research and information services to the Northern Ireland Assembly 41
Trends across the trusts:
Belfast: 5% increase (838.4 to 881.4 in WTE)
Northern: less than 1% increase in WTE
South Eastern: 1% decrease (595.4-589.2 in WTE)
Southern: 34% increase (398.7 to 533.3 in WTE)
Western: 29% increase (432.7 to 556.6 in WTE)
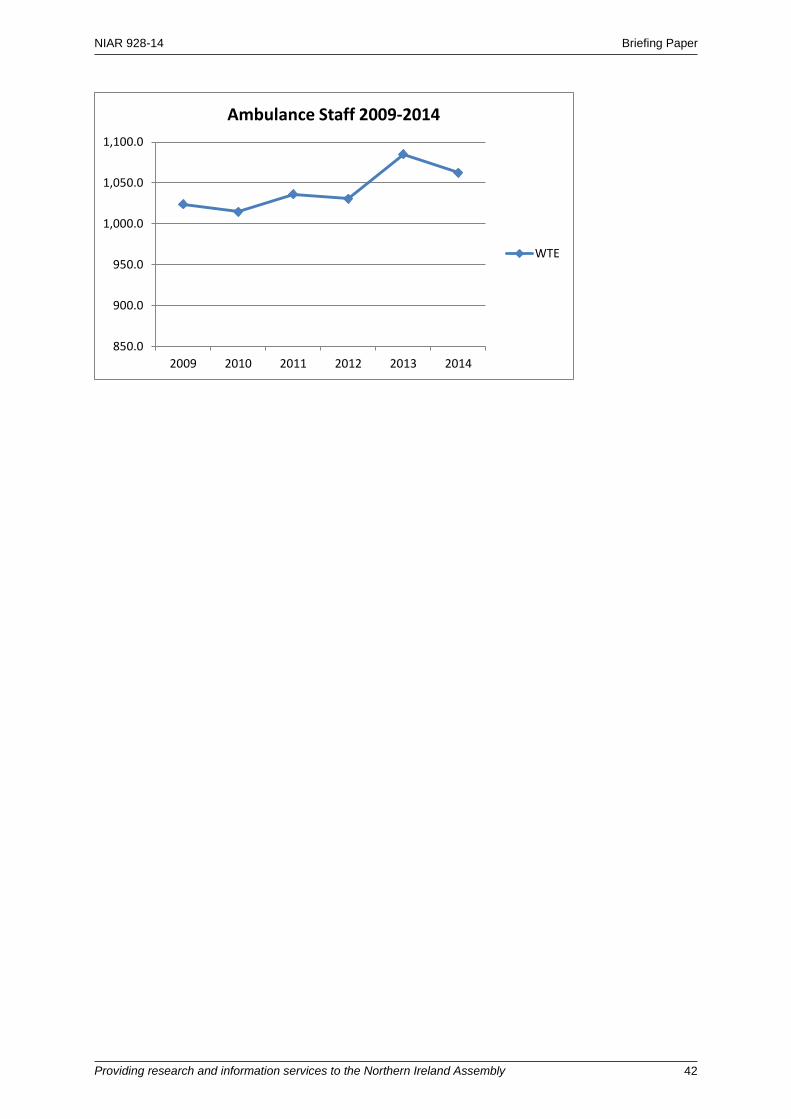
3.5 Ambulance Staff
Overall NI Trend for Ambulance Staff58:
2000-2014: 50% increase (710.5 to 1062.2 in WTE)
o 2005-2014: 20% increase (884.1 to 1062.2 in WTE)
o 2009-2014: 4% increase (1023.9 to 1062.2 in WTE)
58
Figures for 2005-2014 taken from the 2014 HSC workforce census and figure for 2000-2004 are taken from the 2005 HSC
workforce census, http://www.dhsspsni.gov.uk/hscwc-march-2014.pdf
http://www.dhsspsni.gov.uk/workforce_census_march_2005_exc_sec_11.pdf
650
700
750
800
850
900
950
1000
1050
1100
1150
2000
2001
2002
2003
2004
2005
2006
2007
2008
2009
2010
2011
2012
2013
2014
Ambulance Staff 2000-2014
WTE
NIAR 928-14 Briefing Paper
Providing research and information services to the Northern Ireland Assembly 42
850.0
900.0
950.0
1,000.0
1,050.0
1,100.0
2009 2010 2011 2012 2013 2014
Ambulance Staff 2009-2014
WTE
NIAR 928-14 Briefing Paper
Providing research and information services to the Northern Ireland Assembly 43
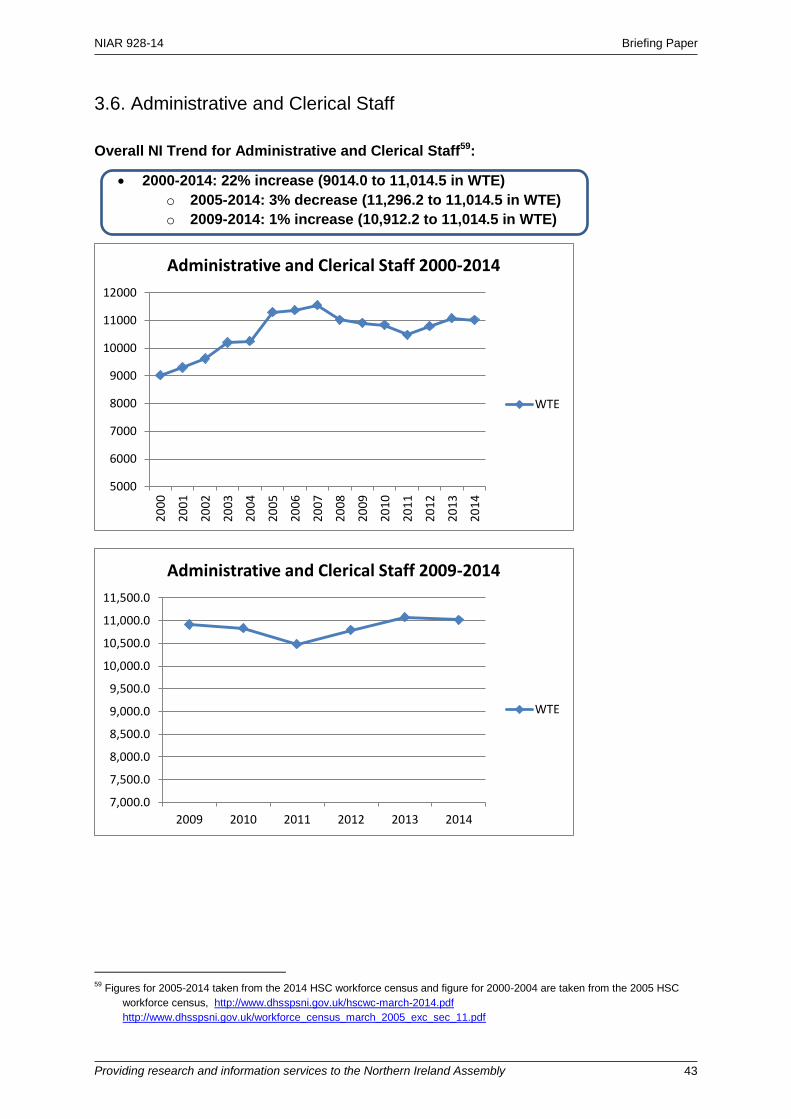
3.6. Administrative and Clerical Staff
Overall NI Trend for Administrative and Clerical Staff59:
2000-2014: 22% increase (9014.0 to 11,014.5 in WTE)
o 2005-2014: 3% decrease (11,296.2 to 11,014.5 in WTE)
o 2009-2014: 1% increase (10,912.2 to 11,014.5 in WTE)
59
Figures for 2005-2014 taken from the 2014 HSC workforce census and figure for 2000-2004 are taken from the 2005 HSC
workforce census, http://www.dhsspsni.gov.uk/hscwc-march-2014.pdf
http://www.dhsspsni.gov.uk/workforce_census_march_2005_exc_sec_11.pdf
5000
6000
7000
8000
9000
10000
11000
12000
2000
2001
2002
2003
2004
2005
2006
2007
2008
2009
2010
2011
2012
2013
2014
Administrative and Clerical Staff 2000-2014
WTE
7,000.0
7,500.0
8,000.0
8,500.0
9,000.0
9,500.0
10,000.0
10,500.0
11,000.0
11,500.0
2009 2010 2011 2012 2013 2014
Administrative and Clerical Staff 2009-2014
WTE

NIAR 928-14 Briefing Paper
Providing research and information services to the Northern Ireland Assembly 44
This section includes a more in-depth look at the figures for Selected Administrative
and Clerical staff this includes:
3.6.1. Administrative and Clerical Bands Grade 1-4
3.6.2. Medical Secretaries
3.6.3. Personal Secretaries
3.6.4. Administrative and Clerical Bands 5 and 6
3.6.5. Administrative and Clerical Band 8A to 9
3.6.1. Administrative and Clerical Grades 1-460
Overall Trust Totals for Administrative and Clerical Staff Grades 1-4:
60
Figures for each year are extracted from the workforce census publication for that year. Available at:
2008 http://www.dhsspsni.gov.uk/index/statistics/workforce_census_march_2008_web.pdf
2009 http://www.dhsspsni.gov.uk/index/statistics/workforce_census_march_2009_exc_sec_11.pdf
2010 http://www.dhsspsni.gov.uk/workforce_census_march_2010_web.pdf
2011 http://www.dhsspsni.gov.uk/workforce_census_march_2011.pdf
2012 http://www.dhsspsni.gov.uk/workforce_census_march_2012_-_web.pdf
2013 http://www.dhsspsni.gov.uk/workforce_census_march_2013_web.pdf
2014 http://www.dhsspsni.gov.uk/hscwc-march-2014.pdf
4600
4800
5000
5200
5400
5600
5800
6000
6200
6400
2008 2009 2010 2011 2012 2013 2014
Total WTE for Administrative and Clerical Bands 1-4 from 2008-2014
WTE
Overall 16% decrease in WTE from 2008-2014

NIAR 928-14 Briefing Paper
Providing research and information services to the Northern Ireland Assembly 45
Trends across the Trusts:
Belfast: 15% decrease (2050.8 to 1750.6 in WTE)
Northern: 24% decrease (1155.9 to 882.2 in WTE)
South Eastern: 10% increase (722.5 to 793.5 in WTE)
Southern: 20% decrease (1159.2 to 923.5 in WTE)
Western: 22% decrease (1112.2 to 868.1 in WTE)
3.6.2. Medical Secretaries
Overall Trust Totals for Medical Secretaries61:
61
Figures for each year are extracted from the workforce census publication for that year. Available at:
2012 http://www.dhsspsni.gov.uk/workforce_census_march_2012_-_web.pdf
2013 http://www.dhsspsni.gov.uk/workforce_census_march_2013_web.pdf
2014 http://www.dhsspsni.gov.uk/hscwc-march-2014.pdf
870
875
880
885
890
895
900
905
910
915
2012 2013 2014
Total WTE for Medical Secretaries for 2012-2014
WTE
Overall 2% decrease in WTE from 2012-2014
NIAR 928-14 Briefing Paper
Providing research and information services to the Northern Ireland Assembly 46
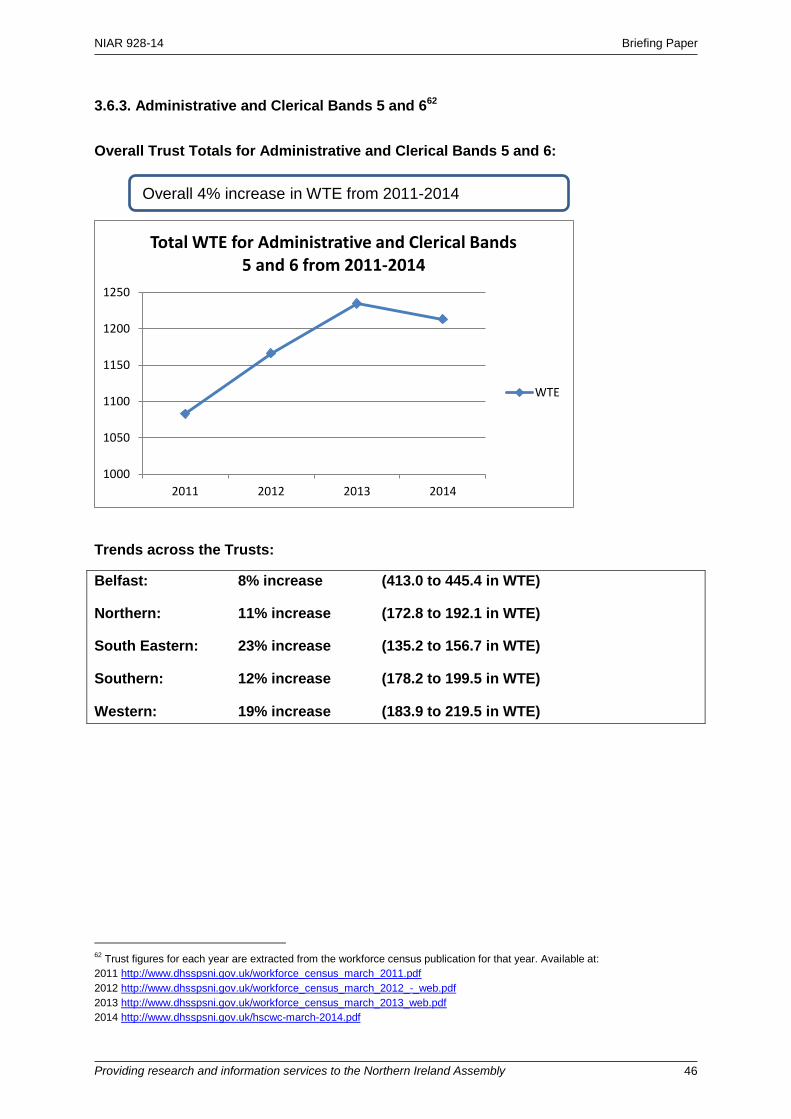
3.6.3. Administrative and Clerical Bands 5 and 662
Overall Trust Totals for Administrative and Clerical Bands 5 and 6:
Trends across the Trusts:
Belfast: 8% increase (413.0 to 445.4 in WTE)
Northern: 11% increase (172.8 to 192.1 in WTE)
South Eastern: 23% increase (135.2 to 156.7 in WTE)
Southern: 12% increase (178.2 to 199.5 in WTE)
Western: 19% increase (183.9 to 219.5 in WTE)
62
Trust figures for each year are extracted from the workforce census publication for that year. Available at:
2011 http://www.dhsspsni.gov.uk/workforce_census_march_2011.pdf
2012 http://www.dhsspsni.gov.uk/workforce_census_march_2012_-_web.pdf
2013 http://www.dhsspsni.gov.uk/workforce_census_march_2013_web.pdf
2014 http://www.dhsspsni.gov.uk/hscwc-march-2014.pdf
1000
1050
1100
1150
1200
1250
2011 2012 2013 2014
Total WTE for Administrative and Clerical Bands 5 and 6 from 2011-2014
WTE
Overall 4% increase in WTE from 2011-2014
NIAR 928-14 Briefing Paper
Providing research and information services to the Northern Ireland Assembly 47
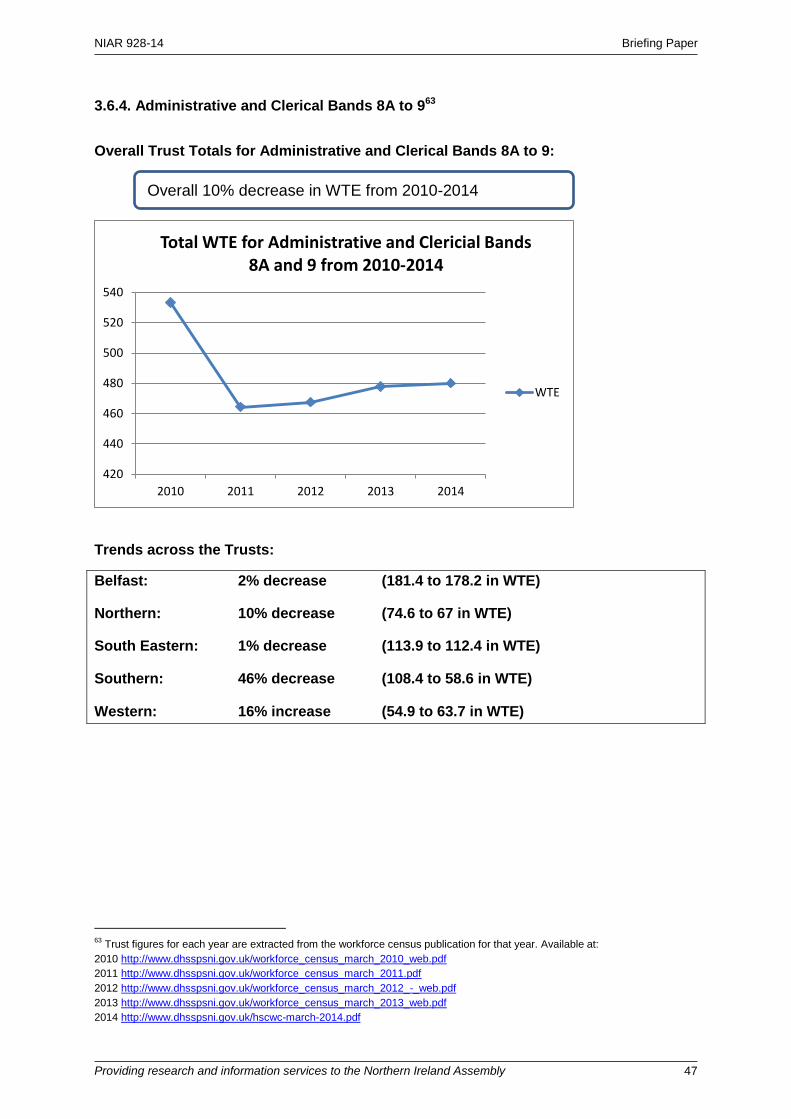
3.6.4. Administrative and Clerical Bands 8A to 963
Overall Trust Totals for Administrative and Clerical Bands 8A to 9:
Trends across the Trusts:
Belfast: 2% decrease (181.4 to 178.2 in WTE)
Northern: 10% decrease (74.6 to 67 in WTE)
South Eastern: 1% decrease (113.9 to 112.4 in WTE)
Southern: 46% decrease (108.4 to 58.6 in WTE)
Western: 16% increase (54.9 to 63.7 in WTE)
63
Trust figures for each year are extracted from the workforce census publication for that year. Available at:
2010 http://www.dhsspsni.gov.uk/workforce_census_march_2010_web.pdf
2011 http://www.dhsspsni.gov.uk/workforce_census_march_2011.pdf
2012 http://www.dhsspsni.gov.uk/workforce_census_march_2012_-_web.pdf
2013 http://www.dhsspsni.gov.uk/workforce_census_march_2013_web.pdf
2014 http://www.dhsspsni.gov.uk/hscwc-march-2014.pdf
420
440
460
480
500
520
540
2010 2011 2012 2013 2014
Total WTE for Administrative and Clericial Bands 8A and 9 from 2010-2014
WTE
Overall 10% decrease in WTE from 2010-2014
NIAR 928-14 Briefing Paper
Providing research and information services to the Northern Ireland Assembly 48
4 Independent Contractors and Related Staff
The HSC workforce census only includes staff employed by the HSC and excludes
independent contractors also working in Health & Social Care such as General Practitioners
and General Dental Practitioners. This section of the paper will look more closely this group
as far as available statistics allow.
4.2. General Practitioners
According to the Business Services Organisation (established in 2009) statistics on
WTE for GPs are no longer available due to changes in GMS contract (also see 4.4
below)64.
The most recent BSO figures for GPs (November 2013) shows 1,171 GPs
independently employed in NI, this represents a:
o 10% increase from the 2000 figure, and
o 1.8% rise from the 2008 figure.65
According to the Royal College of General Practitioners (RCGP), the number of GP
surgeries in Northern Ireland has fallen from 366 (in 2005) to 351, the lowest number
since 1991. It believes that much of the decline is explained by General Practitioners
leaving the profession.
It may be that the apparent discrepancy between increasing numbers of GPs against
increasing numbers leaving the profession is explained by larger numbers choosing
alternative working patterns of fewer hours.
The RCGP also highlights that NI has the oldest GP workforce in the UK with 24.8% of
GPs in NI aged over 55 (19.5% for Scotland, 22.3% for England, and 23.1% for
Wales). 66
The RCGP has calculated that NI has the lowest coverage of GPs per patient in the UK
with just 6.4 GPs for every 10,000 people, compared with 6.6 in England and Wales
and 8 in Scotland and that this translates to a shortfall of 234 family doctors for NI.67
This has led Dr John O’Kelly, Chair of the RCGP Northern Ireland, to say68
To gain parity with other UK nations, we urgently need a package of
measures to encourage more young doctors to enter the GP workforce,
64
http://www.hscbusiness.hscni.net/services/1804.htm 65
Business Services Organisation (2014) Medical Statistical Information. Available at:
http://www.hscbusiness.hscni.net/services/1802.htm (Accessed on: 20th January 2015) 66
RCGP (2014) ‘Number of GP practices reaches 24 year low as leading doctors warn services are struggling to cope’. Available
at: http://www.rcgp.org.uk/news/2015/january/number-of-gp-practices-reaches-24-year-low-as-leading-doctors-warn-
services-are-struggling-to-cope.aspx 67
As above 68
As above
NIAR 928-14 Briefing Paper
Providing research and information services to the Northern Ireland Assembly 49
retain and support current GPs, and make it easier for those who have left
the workforce to come back.
Along with the National Association for Patient Participation, we are calling
on the government to ensure that general practice receives 11% of the
NHS budget - and to increase the number of GPs to allow us to deliver the
high standards of care that our patients deserve.
Prior to the establishment of the BSO, the Family Practitioner Services (FPS)
Directorate provided a range of support functions on behalf of the Health and
Social Care, including the maintenance of statutory lists of practitioners. Its last
statistical report was published in 2007/08.69 These reports included substantial detail
on GP Practices, such as GP & Patient Registration Data by Board; GP Age/Gender
Analysis by Board; Number of GPs in a Practice by Board; and Number of Practices by
List Size & Board.
By way of illustration, the following summary points are directly extracted from the last
FPS statistical report regarding General Practice for 2007/0870:
Between 1998 and 2008 the total number of GPs increased by 10% from
1,042 to 1,148 respectively;
In 2008, there were 62 GPs per 100,000 registered population;
In 2008, 39% of GPs were female, compared with just under a third (30%) in 1998;
Over half (55%) of GPs in 2008 were aged between 40 and 54; and
In October 2008, NI had 358 General Practices, 4 less than in Oct 2007; and
In 2008, almost half (48%) of practices had either 2 or 3 GPs, 35% had 4
or more GPs and 15% were single-handed GP Practices.
The FPS Reports also contained detailed information regarding General Dental
Services, General Ophthalmic Services and Pharmaceutical Services.
4.3. General Dental Practitioners
According to the Business Services Organisation as of April 2014 there are 960
Dental Practitioners in Northern Ireland71.
o In 2014 this also includes an additional 30 assistants, 34 trainees and
40 Oasis72 with an additional 6 salaried posts, giving a total of 105673.
69
http://www.hscbusiness.hscni.net/pdf/NI_FAMILY_PRACTITIONER_SERVICES_STATISTICAL_REPORT_2007-08.pdf 70
http://www.hscbusiness.hscni.net/pdf/NI_FAMILY_PRACTITIONER_SERVICES_STATISTICAL_REPORT_2007-08.pdf 71
Business Services Organisation (2014) Dental Statistical Information. Available at:
http://www.hscbusiness.hscni.net/services/1802.htm (Accessed on: 20th January 2015) 72
Oasis Dentists – in 2010, the DHSSPS awarded a contract to Oasis Dental Care (www.oasisdentalcare.co.uk) to increase
access to dental care across Northern Ireland http://www.niassembly.gov.uk/globalassets/documents/official-
reports/health/2011-2012/120502_fundingfordentalservicesdepartmentalbriefing.pdf
NIAR 928-14 Briefing Paper
Providing research and information services to the Northern Ireland Assembly 50
o In 2000 there were 661 Dentists, which grew to 795 by 2008 and again
to 960 in April 2014.
The overall percentage increase from April 2000-2014 is 45%, whereas 2008-
2014 equals a rise of 20.7%.
4.4. Treatment Room Nurses and District Nurses
As no specific figures were located by RaISe, it emailed the Royal College of Nursing
in an attempt to get more information. The reply confirmed that there was very little
available information on independently employed nurses and stated that:
The simple answer appears to be that the information is not collated, or if it
is, I have been unable to locate it…the annual HSC workforce census only
covers practice nurses and treatment room nurses employed by the HSC
and not those who are directly employed by GP practices. Very few, if any,
district nurses or health visitors would be directly employed by GP
practices, so we are really just talking about practice nurses (mainly) and
treatment room nurses (to a lesser extent)74.
RaISe subsequently contacted the Department of Health, Social Services and Public
Safety to determine what information it held regarding such practice and treatment
room nurses. The reply is included in full below75:
Under the new GMS Contract introduced in April 2004, GP practices
receive core funding via a global sum block payment for the day to day
running of their practice. The global sum is one of a number of funding
streams and is intended to provide for the delivery of essential and
additional services, staff costs, locum reimbursements and the cost of GPs’
employer’s superannuation. Funding for all staff was succumbed within the
global sum under the new GMS Contract arrangements.
Although practices hold a contract with the HSCB, they are independent
contractors and as such can utilise their core funding/global sum to manage
their practice however they see fit including the employment of staff.
Practices are therefore under no obligation to report to any organisation,
how they staff their practice nor the number or whole time equivalent (WTE)
staff they directly employ.
Since introduction of the new GMS Contract, there is no central data source
for practice staff; the data would have to be requested from each individual
GP practice.
73
Please note it is possible for someone to be a dentist at one location and an assistant/Oasis, etc. at another location so the
final total will not add to the sum of the individual dental types as the total represents individual people. 74
Email Reply from RCN, Head of Communications, Policy and Marketing, 8th January 2015
75 Email Reply from DALO, DHSSPS, 22
nd January 2015

NIAR 928-14 Briefing Paper
Providing research and information services to the Northern Ireland Assembly 51
In terms of treatment room nurses who are generally employed and paid for
by HSS Trusts and based in Health Centres owned by HSS Trusts, these
can be identified on the HRPTS System (Human Resources Payroll, Travel
& Subsistence System) but their role also involves community nursing and
their workload is not solely related to general practice. Even where a
treatment room nurse can be identified on HRPTS against a specific GP
practice, this does not equate to being employed by that practice; it will
more likely be a base location to carry out community nursing. Even if such
a nurse does carry out practice related work, it would not be feasible to
disaggregate the community nursing element from the general practice
element.
4.5. Pharmacists
The Pharmaceutical Society of Northern Ireland is the regulatory body for pharmacists
in NI. It currently registers 2155 pharmacists, 549 pharmacy premises and oversees
the preregistration programme for over 200 trainee pharmacists76.
The current number of registered pharmacists is an increase on the May 2013 figure of
2110 pharmacists and the 2012 figure of 210177.
5 Workforce Plans for Northern Ireland
The following questions were put to the DHSSPS in order to ascertain the most up-to-
date position regarding workforce planning in connection with TYC.78
Please provide an update on the work of the Regional Workforce Planning Group
established to take forward the specific proposals in 'Transforming Your Care'
around workforce planning – please provide as much information as possible on the
progress of the work, timescales and how far advanced is the development of the
framework for workforce planning;
In addition, please provide an update regarding the status of the workforce plans
published in each of the Local Commissioning Group Local Population Plans; and
A number of other workforce reviews are in progress in relation to nursing, medical
specialists and medicine – please provide more information on these and how they
link to the overall regional workforce planning group.
The responses received are included below in their entirety79:
Q1. An update on the work of the regional workforce planning group established to
take forward the specific proposals in 'Transforming Your Care' around workforce
76
Pharmaceutical Society NI, Annual reports. Available at: http://www.psni.org.uk/publications/annual-reports-2/ 77
As above 78
RaISe email sent to the DALO on 13th January 2015
79 Email Response received from DHSSPs DALO on 3
rd February 2015

NIAR 928-14 Briefing Paper
Providing research and information services to the Northern Ireland Assembly 52
planning – please provide as much information as possible on the progress of the
work, timescales and how far advanced is the development of the framework for
workforce planning;
Response:
The Regional Workforce planning Group (RWPG) has now completed this interim
phase of its work and the Regional Workforce Planning Framework has been
developed.
The Framework articulates the regional roles and responsibilities envisaged for
HSC workforce planning; however it is recognised that this is an evolving process.
In view of this, the Framework is a living document which will be subject to
ongoing review and refinement as appropriate.
Implementation of the framework will be led by the DHSSPS, and primarily taken
forward through the RWPG. The primary implementation steps shall be:
a. Development of revised Terms of Reference for the RWPG for approval by
DHSSPS;
b. Reconstitution of the membership of RWPG to fulfill the Terms of
Reference and consideration of how a broader range of stakeholders can
be involved;
c. To pilot a service area review within a Programme of Care (POC)
approach, with an initial focus on the Elderly Care POC; and
d. Further development of workforce planning capability and capacity across
the region.
Q2. Please provide an update regarding the status of the workforce plans published in
each of the Local Commissioning Group Local Population Plans.
Response: The individual Health and Social Care Trust high level workforce
statements contained within the population plans should be regarded as extremely
indicative statements only, subject to more detailed refinement as reform plans are
developed in full. It is not expected that Trust workforce planning should be
monitored against these high-level indicative estimates. HSC Trusts are responsible
for developing more detailed workforce plans to accompany service changes.
As part of the reform programme, four System Wide Initiatives (SWIs) have been
identified. They relate to reform of Outpatients, Pathways, Reablement and

NIAR 928-14 Briefing Paper
Providing research and information services to the Northern Ireland Assembly 53
Acute. Currently the Health and Social Care Board is prioritising progression on the
first two (Reablement is already well advanced as regional/system wide reform
initiative). Central to the reform of Outpatients and Pathways will be workforce
planning. The mobilisation of the SWIs will provide a significant opportunity to
reshape the workforce in line with new service models. Workforce planning will be
mobilised and monitored as part of the delivery of the SWIs.
Q3. I understand that a number of other workforce reviews are in progress in relation to
nursing, medical specialists and medicine – I would be grateful for more information
on these and how they link to the overall regional workforce planning group.
Response: The Regional Workforce Planning Group acts as the forum through which
all matters relating to regional workforce planning are co-ordinated. A range of uni-
professional reviews are currently at various stages of completion. These follow the
traditional approach to workforce planning taken to date and will provide significant
workforce intelligence on supply and demand; age profiles; areas of positive
development; areas of concern; projected needs in line with service development;
and emerging trends within the workforce, albeit, from the perspective of a single
profession. An update in relation to the current programme of reviews is as follows:
Review of the Nursing Workforce
1. The Review of the Nursing workforce was taken forward by the Department’s
Chief Nursing Officer, project managed by the Northern Ireland Practice and
Education Council (NIPEC).
2. Work is underway to cost the Workforce Plan, prior to consultation, after
which, the Plan and recommendations will be presented to the Regional
Workforce Planning Group and the DHSSPS Central Nursing and Midwifery
Advisory Committee (CNMAC) for professional approval.
3. Once agreed, CNMAC’s Workforce and Education Sub-Committee will be
charged with overseeing and supporting the implementation of the
recommendations with timely reports to CNMAC on progress and annual
reviews.
NIAR 928-14 Briefing Paper
Providing research and information services to the Northern Ireland Assembly 54
Review of the Medical Workforce
4. The Centre for Workforce Intelligence (CFWi) has been appointed through
external consultancy, to review the medical workforce, including
undergraduate intake levels. The review will provide contextual information
and an overarching picture of how the medical workforce is evolving. Data
analysis will be comparable with data produced for England as a similar
exercise has been completed there using the same diagnostic tools.
5. The Review which will include all levels of the medical workforce will provide
information on emerging trends and key priorities for this profession going
forward and provide a snapshot predicting how the service may need to look
in the future.
6. The approach is following the Centre for Workforce Intelligence framework
which comprises 4 stages –
i. Horizon scanning - exploring the potential challenges, opportunities
and likely future developments that could influence workforce planning.
ii. Scenario Generation – exploring how the future might evolve by
looking at a range of plausible futures and describe how likely future
developments identified in horizon scanning may combine to create
plausible scenarios.
iii. Workforce Intelligence – analysing future uncertainties and the impact
of policy options to produce information that supports immediate
action, medium term operational decisions, or long term strategic
decisions.
iv. Workforce Modelling – developing models to inform policy, strategy
and planning around the workforce and provide supply and demand
projections.
7. An initial workshop took place on 22nd and 23rd May 2014. CFWi has provided
the Department with a scenario generation report flowing from this workshop -
this has been circulated to attendees for comment. CFWi is now focusing on
the data gathering element of the exercise. A second workshop which is likely
to be undertaken ‘virtually’ will be arranged. It is expected that a Review
Report will be available before the end of this financial year.
NIAR 928-14 Briefing Paper
Providing research and information services to the Northern Ireland Assembly 55
Medical Workforce Planning Sub-group
8. A Medical Workforce Planning Sub-group (which feeds into the Regional
Workforce Planning Group (RWPG)) has also been established to develop a
suite of medical workforce plans for primary and secondary care for the 5-year
period 2014/15 to 2019/20. The medical workforce planning exercise by
specialty is being led by the Director of Public Health at the Public Health
Agency. The Terms of Reference (TOR) for this work stream have recently
been revised to ensure plans are in place as early as possible for those
specialties where there are currently shortages and/or are key to the
successful delivery of Transforming Your Care.
9. The specialties reviewed in this cycle are confirmed as:
i. Paediatrics including community services and neonatal care
ii. Trauma and Orthopaedics
iii. Emergency Medicine
iv. Primary Care
v. Urology
vi. Radiology
A plan for the next phase of specialties will be brought to the RWPG for
the next meeting in March 2015.
Radiology 10. A Working Planning Sub-group has been convened as part of the DHSSPS
Review of Imaging Services. A baseline data collection is underway and
scheduled to be complete in early 2015. The results of this exercise will be
presented to the Project board at their next meeting, which is expected to be
in March.
Domiciliary care
11. A Workforce Partnership has recently been established, under the aegis of the
Connected Health and Prosperity Programme Board, with the aim, in the first
instance, to align the future skill-sets of the domiciliary care sector workforce
with service user need. It is intended that the work of this group will
complement the regional project to review the model of domiciliary care which
is being led by the Health and Social Care Board.