Embed Size (px)
Citation preview
Transguard GroupAnnual Report | 2016 - 17

Changing the landscape of business support services
About Transguard GroupTransguard Group was established in 2001 and has diversified significantly, now leading in the fields of Cash Services, Security Services, Manpower Services and Integrated Facility Services. Transguard is the UAE’s most trusted business support and outsourcing provider and has a large, dynamic and culturally diverse workforce of 55,399.

His Highness Sheikh Mohammed bin Rashid Al MaktoumVice President and Prime Minister of the UAE and Ruler of Dubai
“Opportunities are made,they do not just lie aroundwaiting for someone to grab them.”

Table Of ContentsFinancial Highlights
Message from the Chairman, HH Sheikh Ahmed bin Saeed Al Maktoum
Message from the Chief Executive Officer, Dr. Abdulla Al Hashimi
Message from the Managing Director, Greg Ward
The Leadership Team
About Transguard
Our Services
- Transguard Cash Services
- Transguard Security Services
- Transguard Manpower Services
- Transguard Integrated Facility Services
Transguard Living
Investing in Transformation and Innovation
Transguard Corporate Social Responsibility and our Dream 2020 Strategy
Health, Safety and Environment
Transguard’s Highlights
Financial Report
9
13
14
17
18
23
28
30
32
36
38
40
43
44
46
59

Financial Highlights

Financial Highlights
Revenue AED 000’s
2016 - 17
2015 - 16
1,900,633
1,426,602
1,031,5392014 - 15
Revenue Growth
2016 - 17
2015 - 16
33%
38%
34%2014 - 15
Consolidated Profit AED 000’s
2016 - 17
2015 - 16
146,041
123,514
106,5992014 - 15
Financial Highlights
10 11
Headcount Growth
2016 - 1755,399
2015 - 1646,500
2014 - 1530,000
Transguard Group LLC
2014-152015-162016-17
Revenue AED 000’s 1,900,633 1,426,602 1,031,539EBITDA Margin % 10% 10% 12%
Operating Profit AED 000’s 154,609 129,873 112,661
Operating Margin % 8% 9% 11%
Profit Attributable to the Owner AED 000’s 125,128 102,615 83,523
Profit Margin % 7% 7% 8%
Headcount 55,399 46,500 30,000
Revenue Growth 33% 38% 34%
11

Message from the ChairmanTransguard Group has achieved another year of record growth in 2016-2017. This growth has been driven by continued diversification of its service offerings, high retention rates across the group’s customer base and sustained increases in market share in every customer segment that Transguard serves.
The growth speaks for itself as the group recorded for the first time ever revenues of AED 1.9 billion (AED 1,900,632,976) and profits of AED 146 million (AED 146,040,956). When compared with the last financial year revenues grew by 33% and profits increased by 18%.
This growth has been made possible because of the dedication and commitment of the now 55,399 plus employees working at Transguard. Their daily commitment to providing world-class services to more than 700 customers across the UAE, will ensure its continued growth for many years to come.
His Highness Sheikh Ahmed bin Saeed Al MaktoumChairman and Chief Executive, Emirates Airline and Group
“Growth has been made possible because of the dedication and commitment of the now 55,399 employees working at Transguard.”
1312
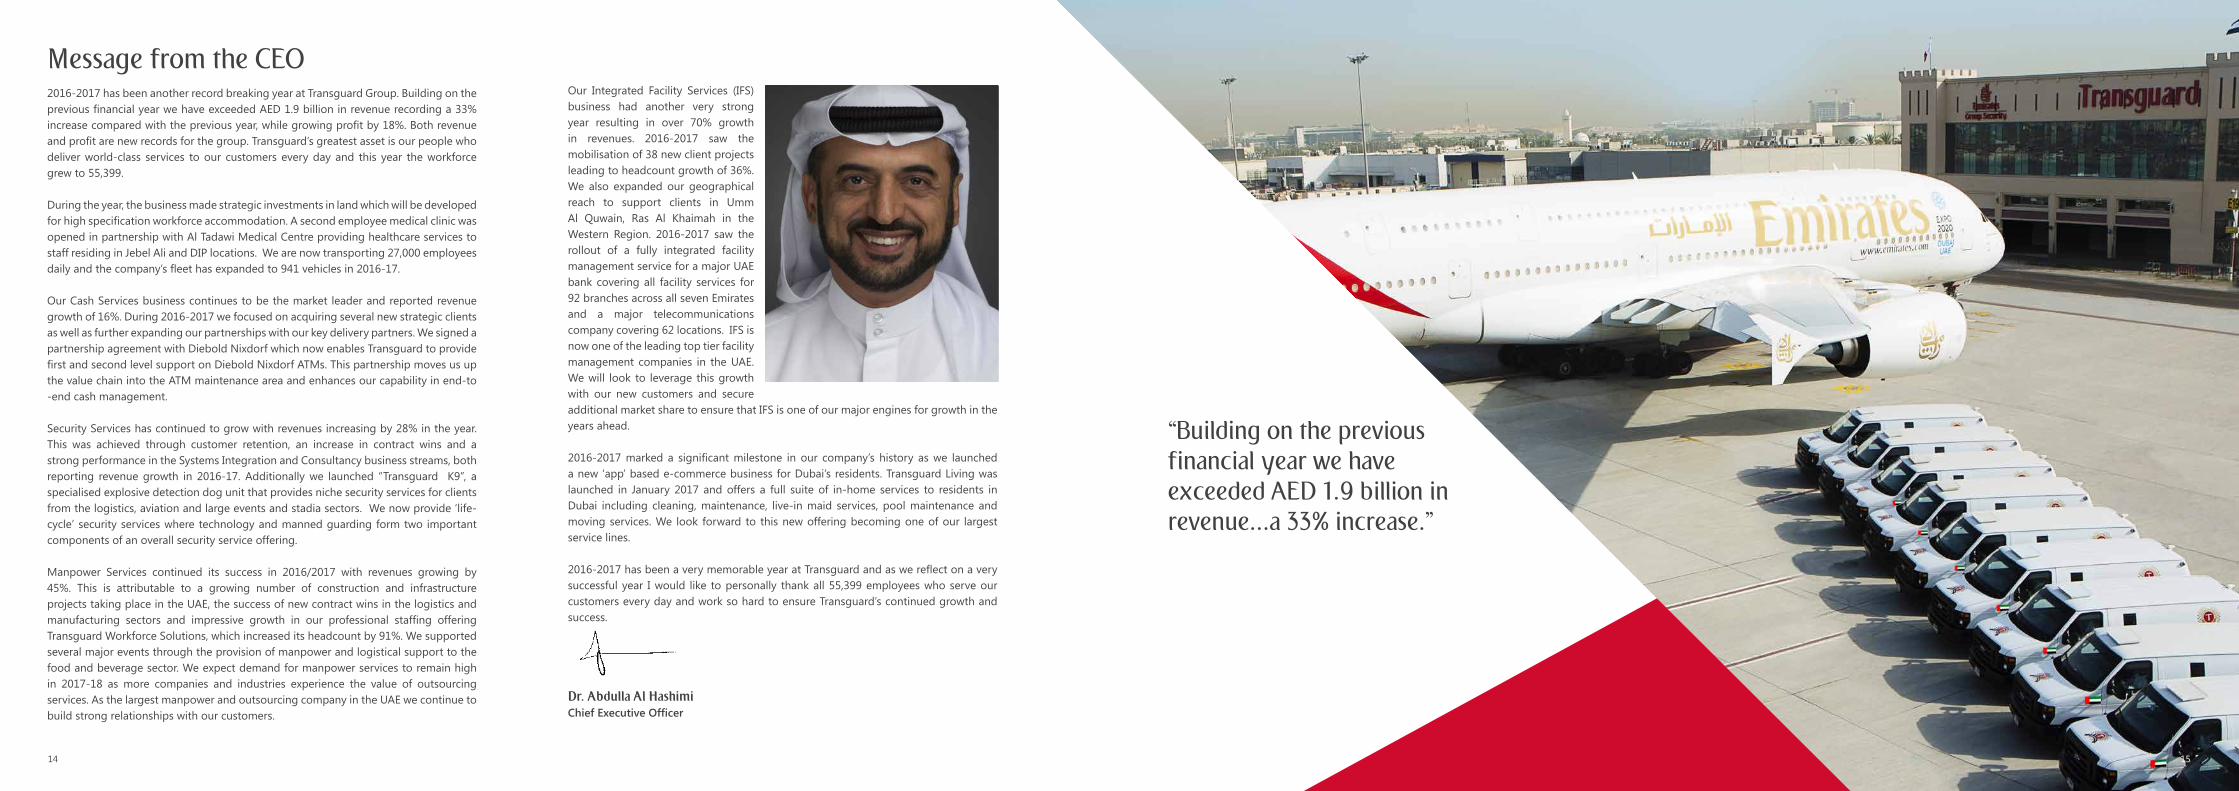
2016-2017 has been another record breaking year at Transguard Group. Building on the previous financial year we have exceeded AED 1.9 billion in revenue recording a 33% increase compared with the previous year, while growing profit by 18%. Both revenue and profit are new records for the group. Transguard’s greatest asset is our people who deliver world-class services to our customers every day and this year the workforce grew to 55,399.
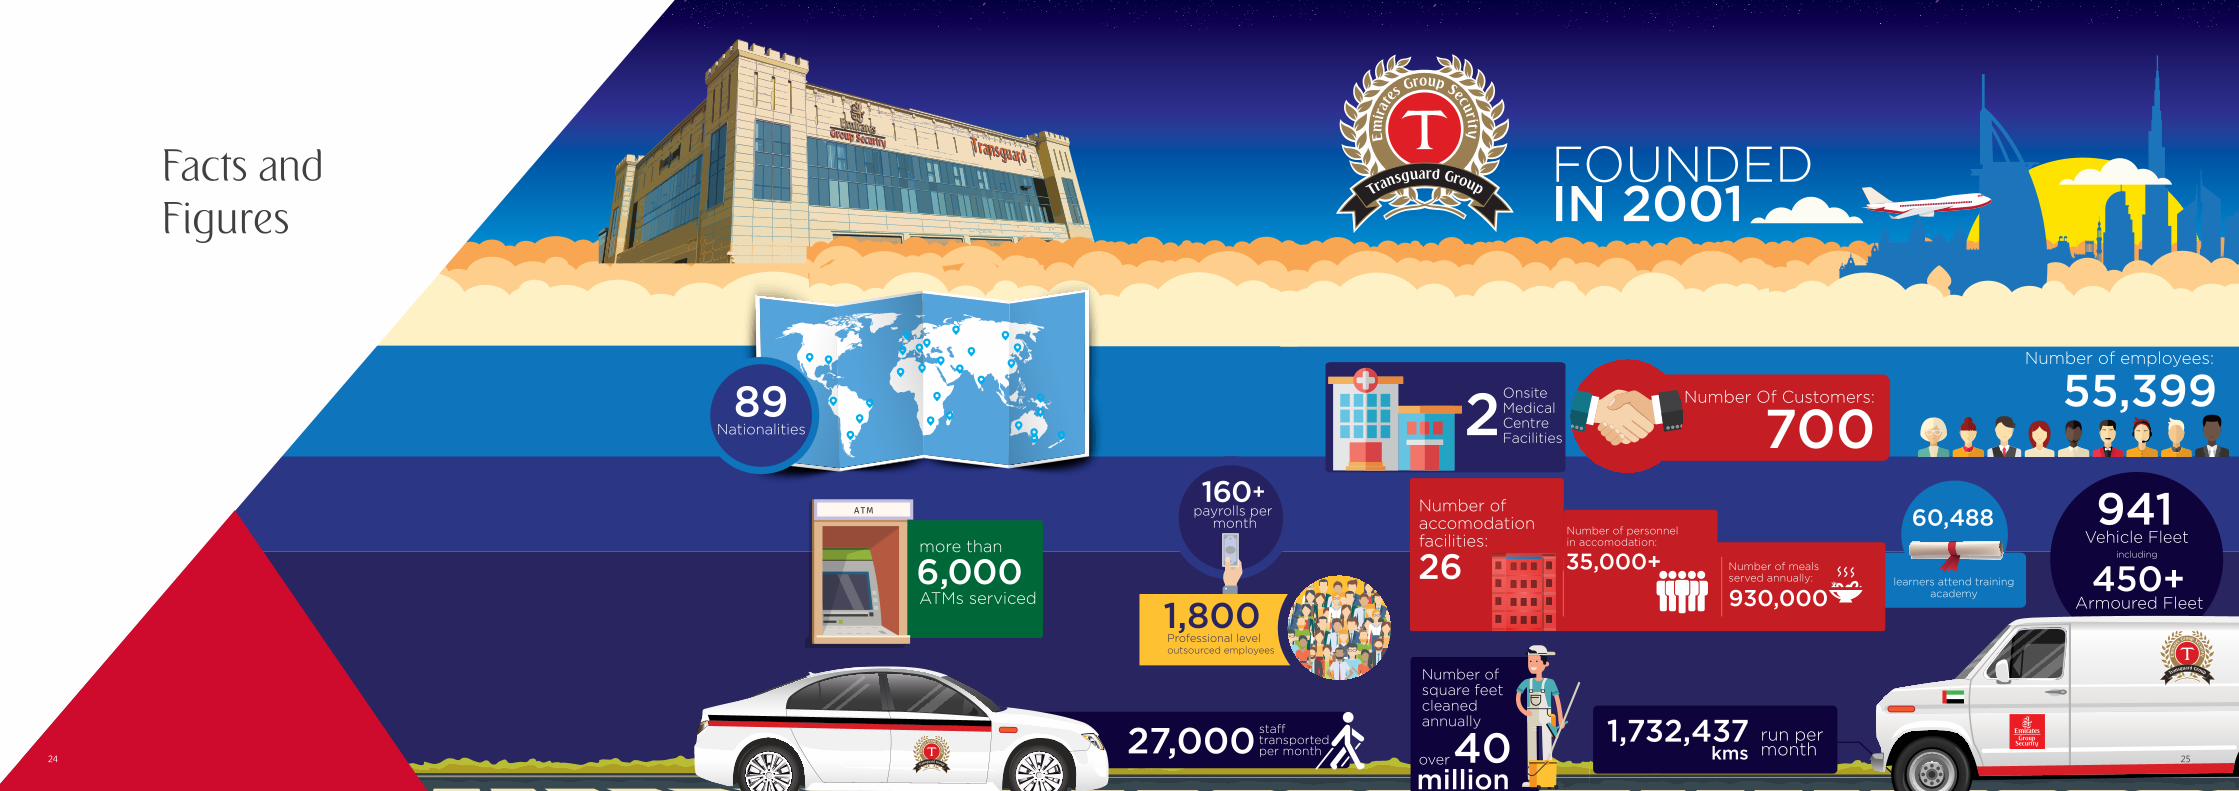
During the year, the business made strategic investments in land which will be developed for high specification workforce accommodation. A second employee medical clinic was opened in partnership with Al Tadawi Medical Centre providing healthcare services to staff residing in Jebel Ali and DIP locations. We are now transporting 27,000 employees daily and the company’s fleet has expanded to 941 vehicles in 2016-17.
Our Cash Services business continues to be the market leader and reported revenue growth of 16%. During 2016-2017 we focused on acquiring several new strategic clients as well as further expanding our partnerships with our key delivery partners. We signed a partnership agreement with Diebold Nixdorf which now enables Transguard to provide first and second level support on Diebold Nixdorf ATMs. This partnership moves us up the value chain into the ATM maintenance area and enhances our capability in end-to -end cash management.
Security Services has continued to grow with revenues increasing by 28% in the year. This was achieved through customer retention, an increase in contract wins and a strong performance in the Systems Integration and Consultancy business streams, both reporting revenue growth in 2016-17. Additionally we launched “Transguard K9”, a specialised explosive detection dog unit that provides niche security services for clients from the logistics, aviation and large events and stadia sectors. We now provide ‘life-cycle’ security services where technology and manned guarding form two important components of an overall security service offering.
Manpower Services continued its success in 2016/2017 with revenues growing by 45%. This is attributable to a growing number of construction and infrastructure projects taking place in the UAE, the success of new contract wins in the logistics and manufacturing sectors and impressive growth in our professional staffing offering Transguard Workforce Solutions, which increased its headcount by 91%. We supported several major events through the provision of manpower and logistical support to the food and beverage sector. We expect demand for manpower services to remain high in 2017-18 as more companies and industries experience the value of outsourcing services. As the largest manpower and outsourcing company in the UAE we continue to build strong relationships with our customers.
Our Integrated Facility Services (IFS) business had another very strong year resulting in over 70% growth in revenues. 2016-2017 saw the mobilisation of 38 new client projects leading to headcount growth of 36%. We also expanded our geographical reach to support clients in Umm Al Quwain, Ras Al Khaimah in the Western Region. 2016-2017 saw the rollout of a fully integrated facility management service for a major UAE bank covering all facility services for 92 branches across all seven Emirates and a major telecommunications company covering 62 locations. IFS is now one of the leading top tier facility management companies in the UAE. We will look to leverage this growth with our new customers and secure additional market share to ensure that IFS is one of our major engines for growth in the years ahead.
2016-2017 marked a significant milestone in our company’s history as we launched a new ‘app’ based e-commerce business for Dubai’s residents. Transguard Living was launched in January 2017 and offers a full suite of in-home services to residents in Dubai including cleaning, maintenance, live-in maid services, pool maintenance and moving services. We look forward to this new offering becoming one of our largest service lines.
2016-2017 has been a very memorable year at Transguard and as we reflect on a very successful year I would like to personally thank all 55,399 employees who serve our customers every day and work so hard to ensure Transguard’s continued growth and success.
Dr. Abdulla Al Hashimi Chief Executive Officer
“Building on the previous financial year we have exceeded AED 1.9 billion in revenue...a 33% increase.”
14 15
Message from the CEO
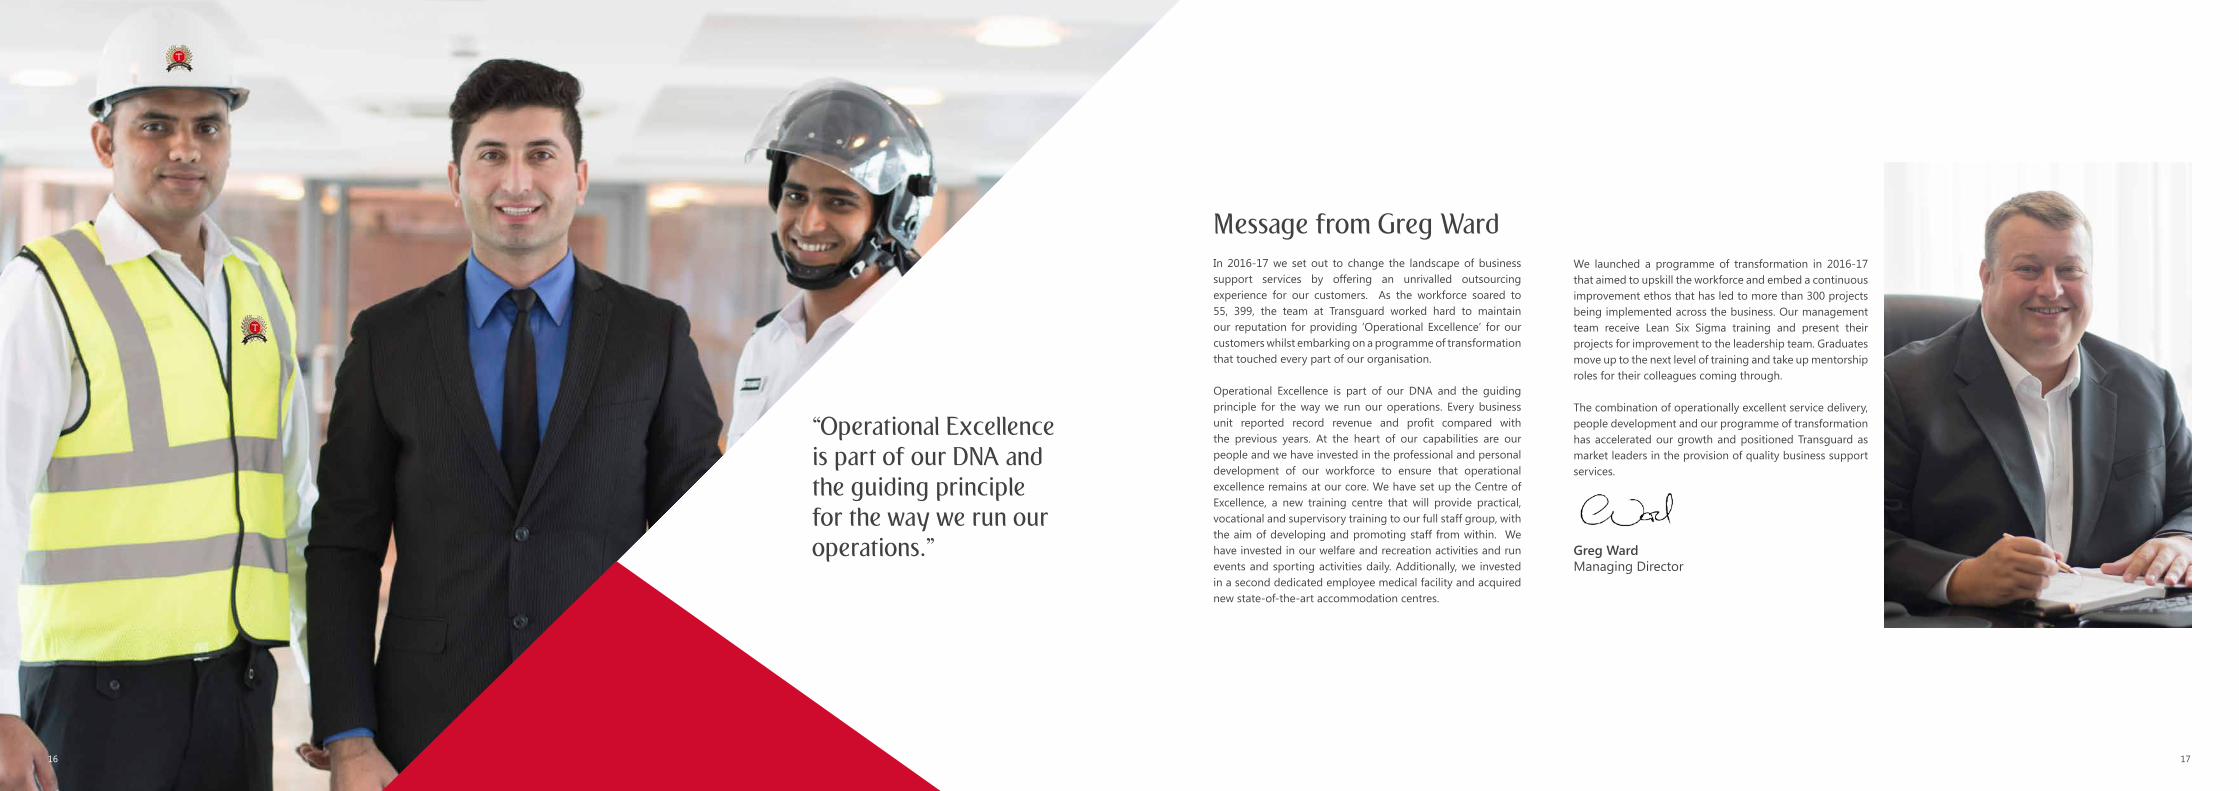
Message from Greg WardIn 2016-17 we set out to change the landscape of business support services by offering an unrivalled outsourcing experience for our customers. As the workforce soared to 55, 399, the team at Transguard worked hard to maintain our reputation for providing ‘Operational Excellence’ for our customers whilst embarking on a programme of transformation that touched every part of our organisation.
Operational Excellence is part of our DNA and the guiding principle for the way we run our operations. Every business unit reported record revenue and profit compared with the previous years. At the heart of our capabilities are our people and we have invested in the professional and personal development of our workforce to ensure that operational excellence remains at our core. We have set up the Centre of Excellence, a new training centre that will provide practical, vocational and supervisory training to our full staff group, with the aim of developing and promoting staff from within. We have invested in our welfare and recreation activities and run events and sporting activities daily. Additionally, we invested in a second dedicated employee medical facility and acquired new state-of-the-art accommodation centres.
We launched a programme of transformation in 2016-17 that aimed to upskill the workforce and embed a continuous improvement ethos that has led to more than 300 projects being implemented across the business. Our management team receive Lean Six Sigma training and present their projects for improvement to the leadership team. Graduates move up to the next level of training and take up mentorship roles for their colleagues coming through.
The combination of operationally excellent service delivery, people development and our programme of transformation has accelerated our growth and positioned Transguard as market leaders in the provision of quality business support services.
Greg WardManaging Director
“Operational Excellence is part of our DNA and the guiding principle for the way we run our operations.”
1716

The Leadership Team
1918

The Leadership Team
HH Sheikh Ahmed bin Saeed Al MaktoumChairman and Chief Executive, Emirates Airline and Group
Greg WardManaging Director
Tony LloydChief Financial Officer
William MoroneyChief Sales and Marketing Officer
Stephen BeesleyChief Operating Officer Integrated Facility Services
Paul EverittChief Operating Officer Business Support Services
Tim MundellChief Security Officer
Dr Abdulla Al HashimiChief Executive Officer
20 21

About Transguard
22 23
Facts andFigures
24 25

Vision and Mission
Vision
TRUST
Team
Relate
Unique
Safe
Talent
Together we achieve more. Always work as one team.
Relationships matter. Be open, honest and connect.
Diversity enriches business. Think independently together.
Well-being inspires productivity. Create a safe environment.
Empowering our people. Drive excellence and celebrate success.
Mission
Our Values
To change the landscape of business support services andthe outsourcing environment in the region.
To be our customers’ trusted partner, delivering total business support solutions, which enable our customers’ to focus on their core business.
26 27
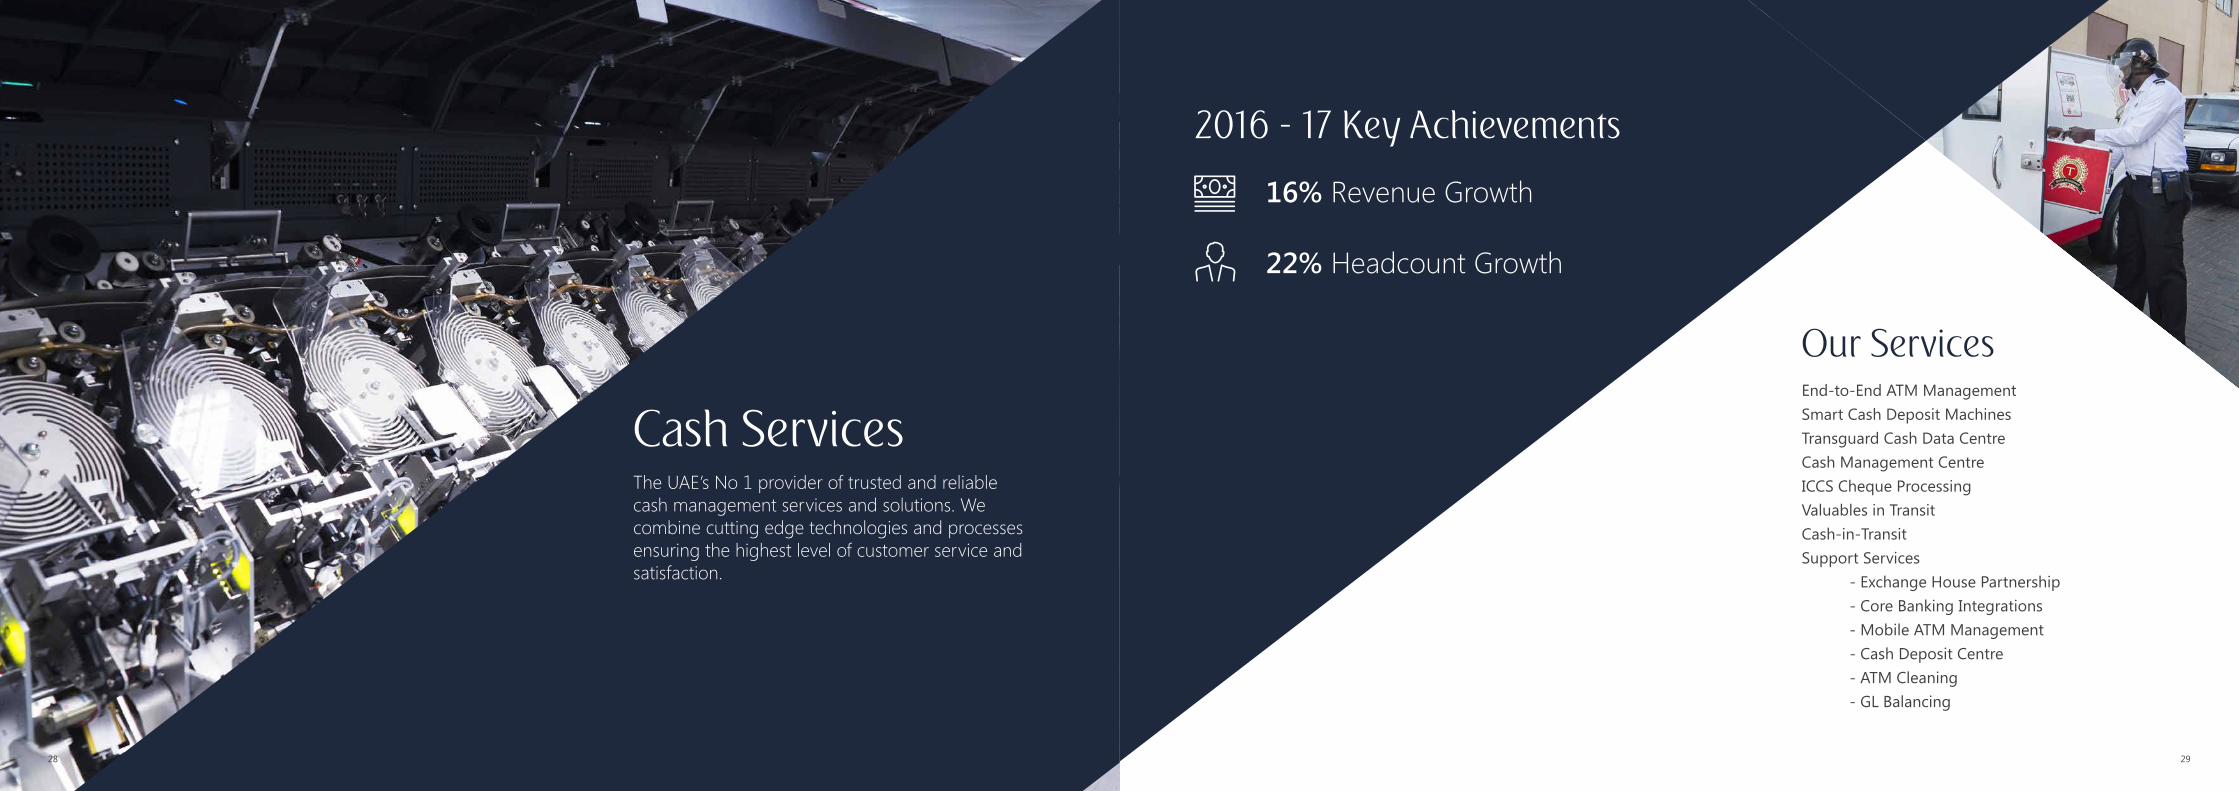
Cash Services
2016 - 17 Key Achievements
Our Services
16% Revenue Growth
22% Headcount Growth
The UAE’s No 1 provider of trusted and reliable cash management services and solutions. We combine cutting edge technologies and processes ensuring the highest level of customer service and satisfaction.
End-to-End ATM Management Smart Cash Deposit Machines Transguard Cash Data Centre Cash Management Centre ICCS Cheque ProcessingValuables in TransitCash-in-Transit Support Services - Exchange House Partnership - Core Banking Integrations - Mobile ATM Management - Cash Deposit Centre - ATM Cleaning - GL Balancing
2928

Security Services
2016 - 17 Key Achievements
Our Services
28% Revenue Growth
29% Headcount Growth
Transguard’s Integrated Solutions provide a single system model to meet all your security needs.
Dedicated Technology Integration TeamsScreening and Explosive Trace DetectionExplosive Detection Dogs (K9 Unit) Smart Guarding Security Solutions Technical Design and Planning Event Security Management Security Consulting Manned Guarding
3130

Manpower Services
2016 - 17 Key Achievements
Our Services
45% Revenue Growth
29% Headcount Growth
The UAE’s largest outsourcing company, combining service excellence with exclusive delivery capabilities.
Construction Manpower Payroll Bureau Services Hospitality Manpower Professional Staffing Logistics Manpower Aviation Manpower
3332

Manpower Services- Aviation
2016 - 17 Key Achievements
Our Services
10% Revenue Growth
8% Headcount Growth
A world class aviation manpower provider servicing both Dubai International Airport and Dubai World Central.
Ramp and Baggage HandlingAviation Support ServicesLogistics Support ServicesAviation SecurityAircraft CleaningCargo ServicesPorter Services
3534

Integrated FacilityServices
2016 - 17 Key Achievements
Our Services
72% Revenue Growth
36% Headcount Growth
Transguard’s total facility management services are delivered through a single or integrated service model across a range of industry segments.
Residential Services (Transguard Living)Hospitality and Catering Strategic Consulting Technical ServicesHealth and Safety 24/7 Call Centre Cleaning Services
3736
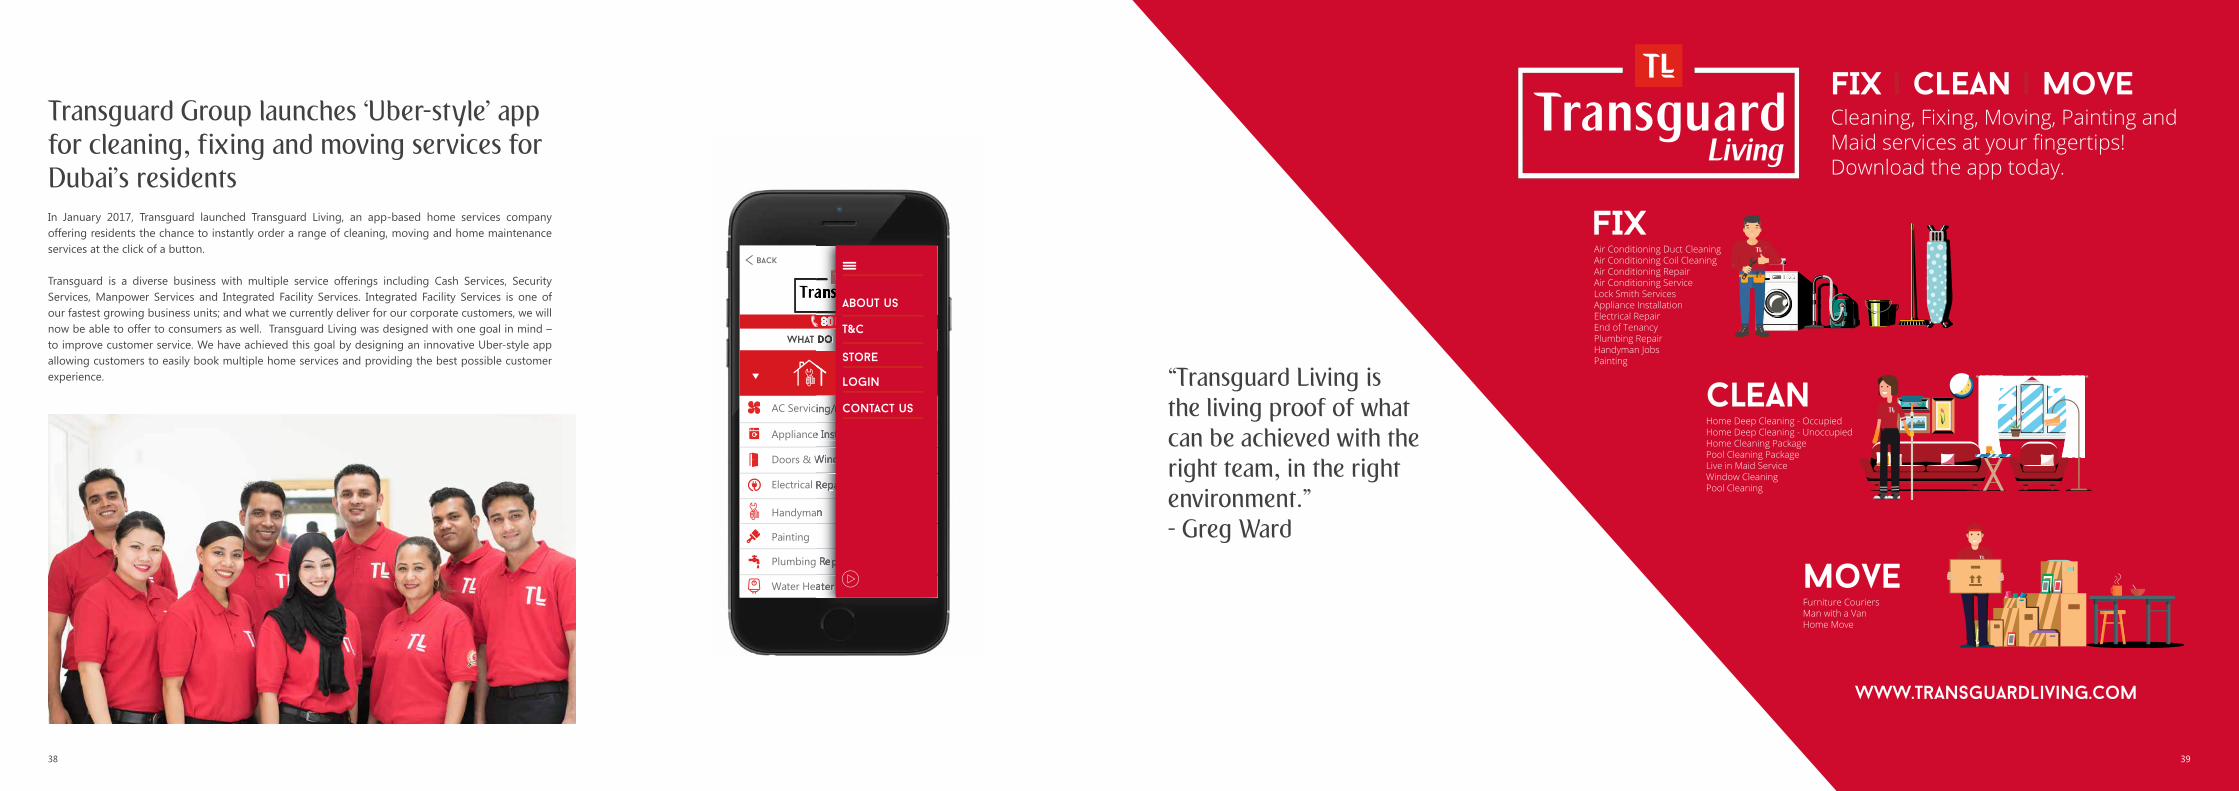
Transguard Group launches ‘Uber-style’ app for cleaning, fixing and moving services for Dubai’s residents In January 2017, Transguard launched Transguard Living, an app-based home services company offering residents the chance to instantly order a range of cleaning, moving and home maintenance services at the click of a button.
Transguard is a diverse business with multiple service offerings including Cash Services, Security Services, Manpower Services and Integrated Facility Services. Integrated Facility Services is one of our fastest growing business units; and what we currently deliver for our corporate customers, we will now be able to offer to consumers as well. Transguard Living was designed with one goal in mind – to improve customer service. We have achieved this goal by designing an innovative Uber-style app allowing customers to easily book multiple home services and providing the best possible customer experience.
What do you need?
FIX
Water Heater Repair
back Menu
Doors & Window Repair
Plumbing Repair
Painting
Appliance Installation
AC Servicing/repair
Electrical Repair
Handyman
About us
T&C
STore
Login
Contact us
FIX | CLEAN | MoveCleaning, Fixing, Moving, Painting and Maid services at your fingertips!Download the app today.
FIXAir Conditioning Duct CleaningAir Conditioning Coil CleaningAir Conditioning Repair Air Conditioning Service Lock Smith ServicesAppliance InstallationElectrical Repair End of Tenancy Plumbing Repair Handyman Jobs Painting
CleanHome Deep Cleaning - OccupiedHome Deep Cleaning - Unoccupied Home Cleaning Package Pool Cleaning PackageLive in Maid ServiceWindow CleaningPool Cleaning
MoveFurniture CouriersMan with a VanHome Move
38
“Transguard Living is the living proof of what can be achieved with the right team, in the right environment.” - Greg Ward
39
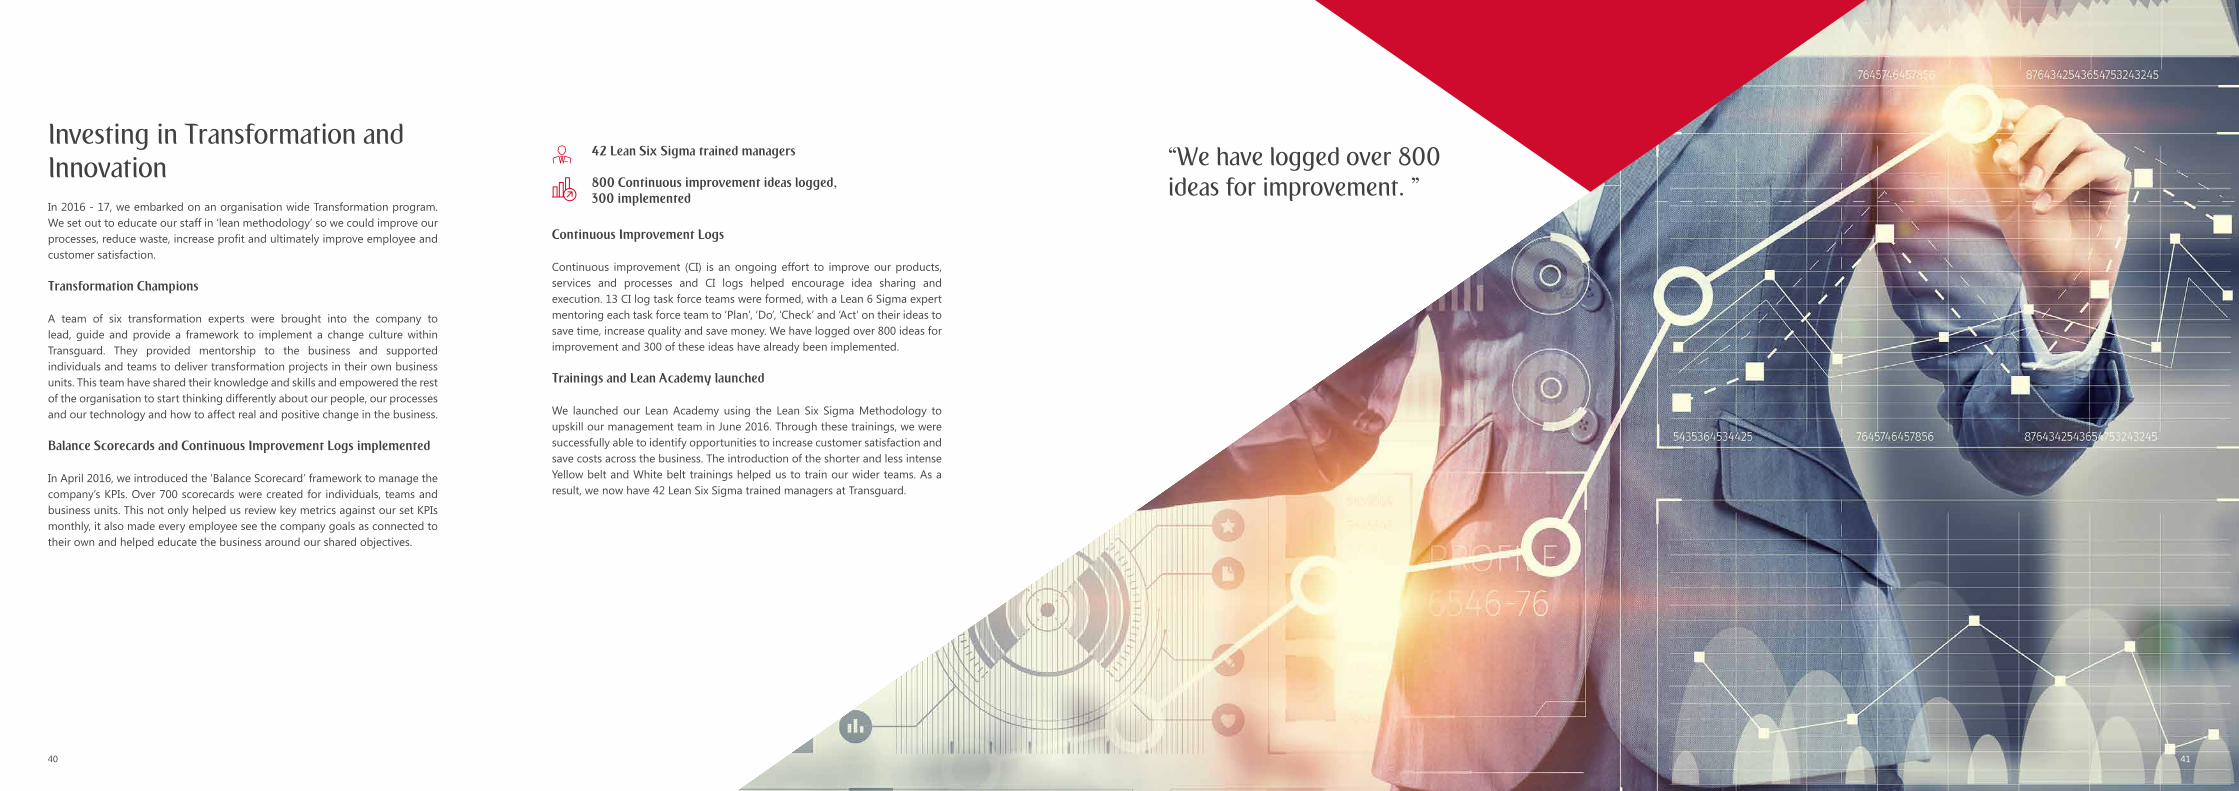
Investing in Transformation and Innovation In 2016 - 17, we embarked on an organisation wide Transformation program. We set out to educate our staff in ‘lean methodology’ so we could improve our processes, reduce waste, increase profit and ultimately improve employee and customer satisfaction.
Transformation Champions
A team of six transformation experts were brought into the company to lead, guide and provide a framework to implement a change culture within Transguard. They provided mentorship to the business and supported individuals and teams to deliver transformation projects in their own business units. This team have shared their knowledge and skills and empowered the rest of the organisation to start thinking differently about our people, our processes and our technology and how to affect real and positive change in the business.
Balance Scorecards and Continuous Improvement Logs implemented
In April 2016, we introduced the ‘Balance Scorecard’ framework to manage the company’s KPIs. Over 700 scorecards were created for individuals, teams and business units. This not only helped us review key metrics against our set KPIs monthly, it also made every employee see the company goals as connected to their own and helped educate the business around our shared objectives.
Continuous Improvement Logs
Continuous improvement (CI) is an ongoing effort to improve our products, services and processes and CI logs helped encourage idea sharing and execution. 13 CI log task force teams were formed, with a Lean 6 Sigma expert mentoring each task force team to ‘Plan’, ‘Do’, ‘Check’ and ‘Act’ on their ideas to save time, increase quality and save money. We have logged over 800 ideas for improvement and 300 of these ideas have already been implemented.
Trainings and Lean Academy launched We launched our Lean Academy using the Lean Six Sigma Methodology to upskill our management team in June 2016. Through these trainings, we were successfully able to identify opportunities to increase customer satisfaction and save costs across the business. The introduction of the shorter and less intense Yellow belt and White belt trainings helped us to train our wider teams. As a result, we now have 42 Lean Six Sigma trained managers at Transguard.
“We have logged over 800 ideas for improvement. ”
42 Lean Six Sigma trained managers
800 Continuous improvement ideas logged,300 implemented
40 41

Transguard Corporate Social Responsibility and our Dream 2020 StrategyAt Transguard, we promise to serve the greater good by bringing people and resources together, creating value that no individual can create alone.
Over the past 12 months, Transguard demonstrated a commitment to re-energising its Corporate Social Responsibility (CSR) strategy. The foundation of our Dream 2020 strategy is built upon four key pillars: People, Community, Environment and Marketplace.
Our People are our number one priority and as an employer of 55,399 people we are committed to prioritising our employees’ wellbeing, welfare and personal and professional development. We invested in our recreational activities in 2016/17 running 356 events including movie nights, a range of sporting competitions, yoga classes and arts and crafts. We set up a “Women of Inspiration” group led by our senior female staff members to support the personal professional development of our female workforce.
In 2016-17 the Centre of Excellence (COE) was created. The COE will provide skills based training, needs analysis and management training with the goal of upskilling the workforce and promoting employees from within the organisation.
“Our People are our number one priority.”- Greg Ward
43
Transguard continues to play a key role in supporting initiatives that serve our wider community both locally and overseas. We provide apprenticeship, internship and graduate opportunities to local and international students. We are actively involved in organising charitable events raising funds for Dubai Cares and have recently partnered with the Department of Economic Development (DED) to launch ‘Tarmeem’, a community development project where we provided over 100 staff members to refurbish a school for refugees in Ajman.
Preservation of the environment is embedded within the mind-set of each CSR project. Our ‘THINK Green’ campaign has successfully reduced waste by encouraging our employees to recycle. We have reduced our overall electricity and water consumption and we are actively engaged with the Government’s 2021 and 2050 strategies for a greener society. We have taken our CSR initiatives to the marketplace, by creating sustainable partnerships with local businesses, strengthening relationships with our customers and promoting greater awareness of Transguard’s commitment to CSR.
‘Think Green’ initiative launched
356 recreational activities in 2016-17
42

Health, Safety and EnvironmentIt has been another remarkable year for health and safety performance, with an increased focus on meeting and exceeding our customers’ expectations, as well as concerted drive to improve company health and safety culture through education.
This year 800+ staff have attended our internal safety training programs; Champions Training, TG Supervising Safely and TG Managing Safely. This has had a direct effect on the decrease in workplace related incidents and a current Accident Frequency Rate (AFR) of 0.1, the best AFR to date.
As our organisation continues to diversify, so does our approach to operational health and safety. Our continued holistic approach has enabled better interaction between, staff and customers. In addition to this, we continue to support our clients with their health and safety journeys through sharing of expertise, knowledge and practical applications.
We understand that good health and safety practice has a direct effect not only on organisational morale and well-being, but also indirect support for long- term sustainable growth. We have increased our multi-agency approach to safety and wellbeing with 18 safety and wellness initiatives throughout the year. This is with the support of a number of external agencies including Dubai Civil Defense, Dubai Police, Dubai Health Authority and the Road Traffic Authority. We continue to learn, grow and share.
“We continue to learn, grow and share.”
44
18 Safety and Wellness initiatives
0.1 Accident Frequency Rate
45
Changing the landscape of business support services
About Transguard GroupTransguard Group was established in 2001 and has diversified significantly, now leading in the fields of Cash Services, Security Services, Manpower Services and Integrated Facility Services. Transguard is the UAE’s most trusted business support and outsourcing provider and has a large, dynamic and culturally diverse workforce of 55,399.
Transguard Timeline
Transguard’sHighlights
Another fast paced year at Transguard.Employee achievements, new service launches and CSR activities formed a core part of Transguard’s daily life. Here are just some of our highlights in quarters 1,2,3 and 4.
46 47

Quarter 1
April 16‘Drive Safely’ event at TGHQ with Dubai RTA, Dubai Police, Emirates Driving Institute, Aster Medical Clinic and Dubai Civil Defense.
April 21‘Transguard’s Secuity Guards received an Emirates Gold Najm award for their quick response in preventing a fire from spreading.
May 25We launched our rebranded Integrated Facility Management service at the 2016 Facilities Management Expo. May 31
Corporate Video launched.
June 6Sarita Harding, Director of Employee Shared Services wins Global Payroll Manager of the year. Sarita’s payroll team manages 160 plus payrolls every month.
June 5Creation of new Mission, Vision and Values.
5 June43 saplings planted at Sonapur employee accommodation on World Environment Day.
48 49

Quarter 2July 4Dubai Police recognised an incredible act of honesty from baggage Loaders Faisal Shahzad and Sintha Murugan who found and handed in AED 240,000. The duo came upon the cash during their offloading duty and immediately handed it over to their supervisor. Dubai Police Brigadier Mr Abdulla Hussain Ali Khan, Deputy Director General Dubai Airports Security and Colonel Mr. Hamad Ahmed Bin Deylan, Head of Dubai Airports Security Departments presented the award.
July 16Corporate Branding completed.
September 9Transguard Security Services launched Explosive Detection Dogs (K9 Unit) service.
July 21New corporate website goes live.
August 20Daman Corporate Wellness Finalists - Team Corporate Wellness Team of the year” “Corporate Wellness Initiave of the Year for the AL Tadawi Medical Clinic Project” and Corporate Wellness Leader of the Year Paddy O’Duda.
September 29Transguard’s Health, Safety and Environment (HSE) team organised a healthy heart awareness session at company headquarters on September 29.
5150

Quarter 3
October 20Transguard Centre of Excellence gains ILM Certification and can now provide accredited management training programmes for staff.
November 24ENOC presents strategic suppliers award to Transguard’s Cash Services Team.
October 15Brian and Amar emerge victors at Dubai’s Camp Ka Champ singing competition which sees tens of thousands of accommodation-based staff compete for a grand prize of AED 20,000.
December 1Greg Ward ranked 8th most influential leader in fmME 2016 Power 50 List.
December 2 Transguard provides Security and Facilities management to Emirates Airline Dubai Rugby 7s.
52 53

Quarter 4
Jan 17Transguard Living goes live, Transguard’s first ‘app’ based business for consumers.
Jan 7Trained and certified 24 LSS Green Belts and 10 LSS Yellow Belts.
Jan 27350 teams compete in Transguard’s 1st ‘Olympics’ our in-house sporting competition.
Feb 7To support the “Year of Giving”, Transguard participated at the Dubai Cares walk to help provide education to children in need.
Feb 9Over 600 Smart Cash Deposit Machines are now installed across the UAE to cater to corporate and SMEs.
54 55

Feb 7Transguard teams up with UAE’s leading healthcare provider Al Tadawi Medical Centre for the second time to launch a dedicated healthcare centre for staff in the heart of its employee accommodation facilities in Jebel Ali.
Feb 26The CSR team organised a grocery donation drive to support the UAE’s dedication to making 2017 a “Year of Giving”.
Feb 27Transguard Group has extended its partnership agreement with Gunnebo, a leading global provider of retail cash management solutions.
March 9Transguard Living organises kids painting event at Taste of Dubai .
March 16500 facility management and security staff working at Global Village were appreciated for their ‘on ground’ performance.
March 9Thousands of employees come together for ‘Carnival’, Transguard’s flagship employee event.
56 57

Financial Report
Directors’ report and consolidated financial statementsfor the year ended 31 March 2017Directors’ report
Independent auditor’s report
Consolidated statement of financial position
Consolidated income statement
Consolidated statement of comprehensive income
Consolidated statement of changes in equity
Consolidated statement of cash flows
Notes to the consolidated financial statements
1
2-3
4
4
4
5
6
7-24

Directors’ report for the year ended 31 March 2017
The directors submit their report together with the audited consolidated financial statements of Transguard Group LLC (“the Company”) and its subsidiaries (together, “the Group”) for the year ended 31 March 2017.
Principal activities
The principal activities of the Group are to provide secure cash and valuable logistics, integrated facility services, security guarding services, aviation security including accredited training and aircraft protection, security solutions and workforce solutions ranging from construction to professional services.
Results The results of the Group for the year ended 31 March 2017 are set out on page 4 of the consolidated financial statements.
Directors
The directors, who served during the year were:
Executive Director• Dr. Abdulla Al Hashimi representing dnata
Non-executive Directors• H.H. Sheikh Ahmed bin Saeed Al-Maktoum representing dnata• Hamad Jassim Al Darwish Fakhroo representing Al Hail Holding LLC • Mohammed Al Shaiba Saleh Ghannam Al Mazrouei representing Al Hail Holding LLC
Auditors
The consolidated financial statements have been audited by PricewaterhouseCoopers who retire and, being eligible, offer themselves for re-appointment as auditors for the year ending 31 March 2018.
For and on behalf of the Board,
........................................... ...…………………………Gregory Ward Tony LloydManaging Director Chief Financial Officer
15 May 2017
Independent auditor’s report to the shareholders ofTransguard Group LLC
Report on the audit of the consolidated financial statements
Our opinion In our opinion, the consolidated financial statements present fairly, in all material respects, the consolidated financial position of Transguard Group LLC (the “Company”) and its subsidiaries (together the “Group”) as at 31 March 2017, and its consolidated financial performance and its consolidated cash flows for the year then ended in accordance with International Financial Reporting Standards.
What we have auditedTThe Group’s consolidated financial statements comprise:
• the consolidated statement of financial position as at 31 March 2017;• the consolidated income statement for the year then ended;• the consolidated statement of comprehensive income for the year then ended;• the consolidated statement of changes in equity for the year then ended;• the consolidated statement of cash flows for the year then ended; and• the notes to the consolidated financial statements, which include a summary of significant accounting policies.
Basis for opinion We conducted our audit in accordance with International Standards on Auditing (ISAs). Our responsibilities under those standards are further described in the Auditor’s responsibilities for the audit of the consolidated financial statements section of our report.
We believe that the audit evidence we have obtained is sufficient and appropriate to provide a basis for our opinion.
IndependenceWe are independent of the Group in accordance with the International Ethics Standards Board for Accountants’ Code of Ethics for Professional Accountants (IESBA Code) and the ethical requirements that are relevant to our audit of the consolidated financial statements in the United Arab Emirates. We have fulfilled our other ethical responsibilities in accordance with these requirements and the IESBA Code.
Other informationThe directors are responsible for the other information. The other information comprises the Directors’ report (but does not include the consolidated financial statements and our auditor’s report thereon).
Our opinion on the consolidated financial statements does not cover the other information and we do not and will not express any form of assurance conclusion thereon.
In connection with our audit of the consolidated financial statements, our responsibility is to read the other information identified above and, in doing so, consider whether the other information is materially inconsistent with the consolidated financial statements or our knowledge obtained in the audit, or otherwise appears to be materially misstated.
If, based on the work we have performed, we conclude that there is a no material misstatement of this other information, we are required to report that fact. We have nothing to report in this regard.
Responsibilities of management and those charged with governance for the consolidated financial statementsManagement is responsible for the preparation and fair presentation of the consolidated financial statements in accordance with International Financial Reporting Standards and their preparation in compliance with the applicable provisions of the UAE Federal Law No. (2) of 2015 and for such internal control as management determines is necessary to enable the preparation of consolidated financial statements that are free from material misstatement, whether due to fraud or error.
In preparing the consolidated financial statements, management is responsible for assessing the Group’s ability to continue as a going concern, disclosing, as applicable, matters related to going concern and using the going concern basis of accounting unless management either intends to liquidate the Group or to cease operations, or has no realistic alternative but to do so.
Those charged with governance are responsible for overseeing the Group’s financial reporting process.
Auditor’s responsibilities for the audit of the consolidated financial statementsOur objectives are to obtain reasonable assurance about whether the consolidated financial statements as a whole are free from material misstatement, whether due to fraud or error, and to issue an auditor’s report that includes our opinion. Reasonable assurance is a high level of assurance, but is not a guarantee that an audit conducted in accordance with ISAs will always detect a material misstatement when it exists. Misstatements can arise from fraud or error and are considered material if, individually or in the aggregate, they could reasonably be expected to influence the economic decisions of users taken on the basis of these consolidated financial statements.
1 2
Consolidated statement of financial position
Consolidated income statement
Consolidated statement of comprehensive income
These consolidated financial statements were approved by the Board of Directors on 15 May 2017 and signed on its behalf by:
……………………….... .........………………........
Gregory Ward Tony LloydManaging Director Chief Financial Officer
As at 31st March
Note 2017AED
2016AED
ASSETS
Non-current assets
Property, plant and equipment 5 294,075,239 110,356,500
Intangible assets 6 66,609,989 68,692,768
Prepayments 8 118,704,139 119,497,677
479,389,367 298,546,945
Current assets
Inventories 2,696,723 1,230,636
Trade and other receivables 8 534,364,483 405,147,693
Due from related parties 9 81,902,692 77,325,705
Cash and bank balances 10 23,706,396 17,051,572
642,670,294 500,755,606
Total Assets 1,122,059,661 799,302,551
EQUITY AND LIABILITIES
EQUITY
Equity attributable to owners of the Company
Share capital 13 300,000 300,000
Legal reserve 14 150,000 150,000
Contributed capital 15 1,806,502 1,806,502
Retained earnings 348,735,502 247,081,620
Total equity attributable to owners of the Company 350,992,004 249,338,122
Non-controlling interests (“NCI”) 105,700,837 92,945,763
Total equity 456,692,841 342,283,885
LIABILITIES
Non-current liabilities
Borrowings 12 188,267,542 134,928,562
Provision for employees’ end of service benefits 16 81,306,807 58,763,789
269,574,349 193,692,351
Current liabilities
Trade and other payables 11 241,888,433 209,771,397
Due to related parties 9 1,077,147 1,941,313
Borrowings 12 152,826,891 51,613,605
395,792,471 263,326,315
Total liabilities 665,366,820 457,018,666
Total equity and liabilities 1,122,059,661 799,302,551
Year Ended 31st March
Note 2017AED
2016AED
Revenue 1,900,632,976 1,426,601,870
Direct costs 17 (1,589,970,281) (1,150,935,489)
Gross profit 310,662,695 275,666,381
Administrative expenses 18 (156,926,523) (146,787,716)
Other income – net 20 872,446 994,021
Operating profit 154,608,618 129,872,686
Finance costs 21 (8,567,662) (6,358,633)
Profit for the year 146,040,956 123,514,053
Profit attributable to:
Owners of the Company 125,128,382 102,615,262
Non-controlling interests 20,912,574 20,898,791
146,040,956 123,514,053
Year Ended 31st March
Note 2017AED
2016AED
Profit for the year 146,040,956 123,514,053
Other comprehensive loss:
Item that will not be reclassified to income statement:Remeasurement of retirement benefit obligations 16 (4,132,000) (7,921,314)
Total comprehensive income for the year 141,908,956 115,592,739
Attributable to:
Owners of the Company 121,653,882 95,494,284
Non-controlling interests 20,255,074 20,098,455
141,908,956 115,592,739
3 4
Report on other legal and regulatory requirements
Further, as required by the UAE Federal Law No. (2) of 2015, we report that:
i. we have obtained all the information we considered necessary for the purposes of our audit;
ii. the consolidated financial statements have been prepared and comply, in all material respects, with the applicable provisions of the UAE Federal Law No. (2) of 2015;
iii. the Group has maintained proper books of account;
iv. the financial information included in the report of the Directors is consistent with the books of account of the Group;
v. as disclosed in note 1 to the consolidated financial statements the Group has not purchased or invested in any shares during the year ended 31 March 2017;
vi. note 9 to the consolidated financial statements discloses material related party transactions and the terms under which they were conducted; and
vii. based on the information that has been made available to us, nothing has come to our attention which causes us to believe that the Group has contravened during the year ended 31 March 2017 any of the applicable provisions of the UAE Federal Law No. (2) of 2015 or in respect of the Company, its Articles of Association which would materially affect its activities or its financial position as at 31
March 2017.
PricewaterhouseCoopers 15 May 2017
Douglas O’MahonyRegistered Auditor Number 834Dubai, United Arab Emirates
Independent auditor’s report to the shareholders ofTransguard Group LLC (continued)Auditor’s responsibilities for the audit of the consolidated financial statements(continued)
As part of an audit in accordance with ISAs, we exercise professional judgement and maintain professional scepticism throughout the audit. We also:
• Identify and assess the risks of material misstatement of the consolidated financial statements, whether due to fraud or error, design and perform audit procedures responsive to those risks, and obtain audit evidence that is sufficient and appropriate to provide a basis for our opinion. The risk of not detecting a material misstatement resulting from fraud is higher than for one resulting from error, as fraud may involve collusion, forgery, intentional omissions, misrepresentations, or the override of internal control.
• Obtain an understanding of internal control relevant to the audit in order to design audit procedures that are appropriate in the circumstances, but not for the purpose of expressing an opinion on the effectiveness of the Group’s internal control.
• Evaluate the appropriateness of accounting policies used and the reasonableness of accounting estimates and related disclosures made by management.
• Conclude on the appropriateness of management’s use of the going concern basis of accounting and, based on the audit evidence obtained, whether a material uncertainty exists related to events or conditions that may cast significant doubt on the Group’s ability to continue as a going concern. If we conclude that a material uncertainty exists, we are required to draw attention in our auditor’s report to the related disclosures in the consolidated financial statements or, if such disclosures are inadequate, to modify our opinion. Our conclusions are based on the audit evidence obtained up to the date of our auditor’s report. However, future events or conditions may cause the Group to cease to continue as a going concern.
• Evaluate the overall presentation, structure and content of the consolidated financial statements, including the disclosures, and whether the consolidated financial statements represent the underlying transactions and events in a manner that achieves fair presentation.
• Obtain sufficient appropriate audit evidence regarding the financial information of the entities or business activities within the Group to express an opinion on the consolidated financial statements. We are responsible for the direction, supervision and performance of the group audit. We remain solely responsible for our audit opinion.
We communicate with those charged with governance regarding, among other matters, the planned scope and timing of the audit and significant audit findings, including any significant deficiencies in internal control that we identify during our audit.
The notes on pages 7 to 24 are an integral part of these consolidated financial statements

Consolidated statement of changes in equity
Attributable to owners of the Company
Share capitalAED Legal reserve
AEDContributed capital
AEDRetained earnings
AEDTotalAED
Non-controlling interests
AED
Totalequity
AED
Balance at 1 April 2015 300,000 150,000 1,806,502 175,064,366 177,320,868 82,060,588 259,381,456
Profit for the year - - - 102,615,262 102,615,262 20,898,791 123,514,053
Other comprehensive loss:
Remeasurement of retirement benefit obligations - - - (7,120,978) (7,120,978) (800,336) (7,921,314)
Total comprehensive income for the year - - - 95,494,284 95,494,284 20,098,455 115,592,739
Transactions with owners
Dividend (Note 23) - - - (25,000,000) (25,000,000) (7,500,000) (32,500,000)
Transactions with non-controlling interests (Note 25) - - - 1,522,970 1,522,970 (1,713,280) (190,310)
Balance at 31 March 2016 300,000 150,000 1,806,502 247,081,620 249,338,122 92,945,763 342,283,885
Profit for the year - - 125,128,382 125,128,382 20,912,574 146,040,956
Other comprehensive loss:
Remeasurement of retirement benefit obligations - - (3,474,500) (3,474,500) (657,500) (4,132,000)
Total comprehensive income for the year - - 121,653,882 121,653,882 20,255,074 141,908,956
Transactions with owners
Dividend (Note 23) - - (20,000,000) (20,000,000) (7,500,000) (27,500,000)
Balance at 31 March 2017 300,000 150,000 1,806,502 348,735,502 350,992,004 105,700,837 456,692,841
Consolidated statement of cash flows
Year End at 31st March
Note 2017AED
2016AED
Cash flows from operating activities
Profit for the year 146,040,956 123,514,053
Adjustments for:
Depreciation 5 22,105,140 13,879,933
Amortisation 6 7,308,371 5,430,804
Provision for employees’ end of service benefits 19 27,092,678 16,963,182
Release of provision for impairment of trade receivables 18 (1,534,211) (1,411,087)
Release of provision for impairment of due from related parties 18 (331,827) (244,139)
Finance costs 21 8,567,662 6,358,633
Loss on disposal of property, plant and equipment 20 592,110 66,877
Operating cash flows before payment of employees’ end of service benefits and changes in working capital 209,840,879 164,558,256
Payments of employees’ end of service benefits 16 (12,019,660) (8,946,675)
Changes in working capital, net of acquisition of subsidiary:
Inventories (1,466,087) 145,457
Prepayments – non current 793,538 671,884
Trade and other receivables net of movement in provision for impairment (124,344,579) (153,305,786)
Due from related parties before movement in provision for impairment (4,245,160) (22,188,384)
Trade and other payables and accrued finance cost 32,117,036 58,463,991
Due to related parties (864,166) (1,510,356)
Net cash generated from operating activities 99,811,801 37,888,387
Year End at 31st March
Note 2017AED
2016AED
Cash flows from investing activities
Purchase of property, plant and equipment 5 (206,574,968) (50,378,340)
Purchase of intangible assets excluding goodwill 6 (5,225,592) (10,635,866)
Payment for acquisition of subsidiary, net of cash acquired 24 - (34,759,814)
Proceeds from disposal of property, plant and equipment 158,979 521,899
Net cash used in investing activities (211,641,581) (95,252,121)
Cash flows from financing activities
Repayment of borrowings 12 (216,774,290) (111,409,784)
Drawdown of borrowings 12 392,000,918 182,920,744
Transactions with non-controlling interests 25 - (190,310)
Interest paid (8,567,662) (6,358,633)
Dividend paid (27,500,000) (32,500,000)
Net cash generated from financing activities 139,158,966 32,462,017
Net increase/(decrease) in cash and cash equivalents 27,329,186 (24,901,717)
Cash and cash equivalents at beginning of year (3,622,790) 21,278,927
Cash and cash equivalents at end of year 10 23,706,396 (3,622,790)
5 6
The notes on pages 7 to 24 are an integral part of these consolidated financial statements The notes on pages 7 to 24 are an integral part of these consolidated financial statements
Notes to the consolidated financial statements for the year ended 31 March 2017
1 Legal status and activitiesTransguard Group LLC (“the Company”) and its subsidiaries (together, “the Group”) provide secure cash and valuable logistics, integrated facility services, security guarding services, aviation security including accredited training and aircraft protection, security solutions and workforce solutions ranging from construction to professional services.
The Company is a limited liability company incorporated in the United Arab Emirates under the UAE Federal Law No. (8) of 1984, as amended and operates under a trade licence issued in Dubai. The registered address of the Company is P. O. Box 22630, Dubai, United Arab Emirates.
The share capital of the Company is owned equally by dnata, a company incorporated in the Emirate of Dubai, UAE, with limited liability, under an Emiri Decree issued on 4 April 1987. and Al Hail Holding LLC, a limited liability company, established and registered in the Emirate of Abu Dhabi. The ‘Transguard’ trademark, name and logo is held by dnata.
UAE Federal Law No. 2 of 2015 (“Companies Law”) which is applicable to the Company has come into effect on 1 July 2015. The Company has assessed and evaluated the provisions of the Companies Law and is in the process of ensuring compliance within the transitional period of this Law which has been extended till 30 June 2017.
The Group did not invest or purchase any shares during the year ended 31 March 2017.
2 Summary of significant accounting policiesThe principal accounting policies applied in the preparation of these consolidated financial statements are set out below. These policies have been consistently applied to all the years presented, unless otherwise stated.
2.1 Basis of preparationThe consolidated financial statements have been prepared in accordance with International Financial Reporting Standards (“IFRS”) and interpretations issued by the IFRS Interpretations Committee (IFRS IC) applicable to companies reporting under IFRS. The consolidated financial statements comply with IFRS as issued by the International Accounting Standards Board (IASB). These consolidated financial statements have been prepared under the historical cost convention.
The preparation of consolidated financial statements in conformity with IFRS requires the use of certain critical accounting estimates. It also requires management to exercise its judgement in the process of applying the Group’s accounting policies. The areas involving a higher degree of judgement or complexity, or areas where assumptions and estimates are significant to the consolidated financial statements are disclosed in Note 4.
2.1.1 Changes in accounting policies and disclosures
New and amended standards adopted by the GroupThere are no IFRSs, amendments or IFRIC interpretations that are effective that would be expected to have a material impact on the Group’s consolidated financial statements.
New standards and interpretations not yet adopted by the GroupCertain new accounting standards and interpretations have been published that are not mandatory for 31 March 2017 reporting periods and have not been early adopted by the Group.
• IFRS 9, ‘Financial instruments’ (effective from 1 January 2018);• IFRS 15, ‘Revenue from contracts with customers’ (effective from 1 January 2018); and• IFRS 16, ‘Leases’ (effective from 1 January 2019).
There are no other standards that are not yet effective that would be expected to have a material impact on the Group in the current or future reporting periods and on foreseeable future transactions.
The Group is assessing the impact of the above standards, amendments and interpretations to published standards on the Group’s consolidated financial statements.
2.2 Consolidation
(a) Subsidiaries
Subsidiaries are all entities (including structured entities) over which the Group has control. The Group controls an entity when the Group is exposed to, or has rights to, variable returns from its involvement with the entity and has the ability to affect those returns through its power to direct the activities of the entity. Subsidiaries are fully consolidated from the date on which control is transferred to the Group. They are deconsolidated from the date that control ceases.
The acquisition method of accounting is used to account for business combinations by the Group.
Inter-company transactions, balances, unrealised gains on transactions between Group companies are eliminated. Unrealised losses are also eliminated unless the transaction provides evidence of an impairment of the transferred asset. Accounting policies of subsidiaries have been changed where necessary to ensure consistency with the policies adopted by the Group.
Non-controlling interests in the results and equity of subsidiaries are shown separately in the consolidated income statement, statement of comprehensive income, statement of changes in equity and statement of financial position respectively.
2 Summary of significant accounting policies (continued)
2.2 Consolidation (continued)
(b) Changes in ownership interests
The Group treats transactions with non-controlled interests that do not result in a loss of control as transactions with equity owners of the group. A change in ownership interest results in an adjustment between the carrying amounts of the controlling and non-controlling interests to reflect their relative interests in the subsidiary. Any difference between the amount of the adjustment to non-controlling interests and any consideration paid or received is recognised in a separate reserve within equity attributable to owners of the Company.
When the group ceases to consolidate or equity account for an investment because of a loss of control, joint control or significant influence, any retained interest in the entity is remeasured to its fair value with the change in carrying amount recognised in income statement. This fair value becomes the initial carrying amount for the purposes of subsequently accounting for the retained interest as an associate, joint venture or financial asset. In addition, any amounts previously recognised in other comprehensive income in respect of that entity are accounted for as if the Group had directly disposed of the related assets or liabilities. This may mean that amounts previously recognised in other comprehensive income are reclassified to income statement.
If the ownership interest in a joint venture or an associate is reduced but joint control or significant influence is retained, only a proportionate share of the amounts previously recognised in other comprehensive income are reclassified to income statement where appropriate.
(c) Acquisitions of entities under common control
Business combinations arising from transfers of interests in entities that are under the control of the Company are accounted using predecessor accounting. The assets and liabilities acquired are recognised at the carrying amounts on the date of acquisition and no adjustments are made to reflect the fair values. Any difference between the consideration given for the acquisition and carrying value of assets and liabilities acquired is recognised directly in equity. No goodwill is recognised as a result of the combination.
2.3 Property, plant and equipment
Property, plant and equipment are stated at historical cost less depreciation. Historical cost includes expenditure that is directly attributable to the acquisition of the items. Subsequent costs are included in the asset’s carrying amount or recognised as a separate asset, as appropriate, only when it is probable that future economic benefits associated with the item will flow to the Group and the cost of the item can be measured reliably. The carrying amount of the replaced part is derecognised. All other repairs and maintenance costs are charged to the consolidated income statement during the financial period in which they are incurred.
Land is not depreciated. Depreciation on other assets is computed using the straight-line method at rates calculated to allocate the cost of assets to their residual values over their estimated useful lives, as follows:
The assets’ residual values and useful lives are reviewed, and adjusted if appropriate, at each reporting date. An asset’s carrying amount is written down immediately to its recoverable amount if the asset’s carrying amount is greater than its estimated recoverable amount.
Gains and losses on disposals are determined by comparing proceeds with carrying amount and are recognised within the consolidated income statement.
Capital work in progress is stated at cost. When commissioned, capital work-in-progress is transferred to the appropriate property, plant and equipment category and depreciated in accordance with Group’s policy.
2.4 Intangible assets
(a) Goodwill
Goodwill arises on the acquisition of subsidiaries and represents the excess of the consideration transferred, the amount of any non-controlling interest in the acquire and the acquisition-date fair value of any previous equity interest in the acquiree over the fair value of the identifiable net assets acquired. If the total of consideration transferred, non-controlling interest recognised and previously held interest measured at fair value is less than the fair value of the net assets of the subsidiary acquired, in the case of a bargain purchase, the difference is recognised directly in the consolidated income statement.
For the purpose of impairment testing, goodwill acquired in a business combination is allocated to each of the Cash Generating Units (“CGUs”), or groups of CGUs, that is expected to benefit from the synergies of the combination. Each unit or group of units to which the goodwill is allocated represents the lowest level within the entity at which the goodwill is monitored for internal management purposes. Goodwill is monitored at the operating segment level.
Years
Buildings 20
Plant and machinery 3 - 12
Furniture and fixtures 10
Computer and office equipment 4 - 6
Motor vehicles 5 - 6
7 8

2 Summary of significant accounting policies (continued)
2.4 Intangible assets (continued)
(a) Goodwill (continued)Goodwill impairment reviews are undertaken annually or more frequently if events or changes in circumstances indicate a potential impairment. The carrying value of the CGU containing the goodwill is compared to the recoverable amount, which is the higher of value in use and the fair value less costs of disposal. Any impairment is recognised immediately as an expense and is not subsequently reversed.
(b) Computer software
Acquired computer software licenses are capitalised on the basis of the costs incurred to acquire and bring to use the specific software. These costs are amortised over their estimated useful lives ranging from five to eight years.
Costs associated with maintaining computer software programmes are recognised as an expense as incurred. Development costs that are directly attributable to the design and testing of identifiable and unique software products controlled by the Group are recognised as intangible assets when the following criteria are met:
• it is technically feasible to complete the software product so that it will be available for use;• management intends to complete the software product and use or sell it;• there is an ability to use or sell the software product;• it can be demonstrated how the software product will generate probable future economic benefits;• adequate technical, financial and other resources to complete the development and to use or sell the
software product are available; and• the expenditure attributable to the software product during its development can be reliably
measured.
Directly attributable costs that are capitalised as part of the software product include the software development employee costs and an appropriate portion of relevant overheads.
Other development expenditures that do not meet these criteria are recognised as an expense as incurred. Development costs previously recognised as an expense are not recognised as an asset in a subsequent period.
Computer software development costs recognised as assets are amortised over their estimated useful lives.
Capital work-in-progress is stated at cost. When commissioned, capital work-in-progress is transferred to the appropriate intangible assets category and amortised in accordance with Group’s policy.
2.5 Impairment of non-financial assets
Assets that have an indefinite useful life are not subject to amortisation and are tested annually for impairment. Assets that are subject to depreciation/amortisation are reviewed for impairment whenever events or changes in circumstances indicate that the carrying amount may not be recoverable. An impairment loss is recognised for the amount by which the asset’s carrying amount exceeds its recoverable amount. The recoverable amount is the higher of an asset’s fair value less costs to sell and value in use. For the purposes of assessing impairment, assets are grouped at the lowest levels for which there are separately identifiable cash flows (cash-generating units).
Prior impairments of non-financial assets other than goodwill are reviewed for possible reversal of the impairment at each reporting date.
2.6 Financial assets
(a) Classification
The Group classifies its financial assets as loans and receivables. The classification depends on the purpose for which the financial assets were acquired. Management determines the classification of its financial assets at initial recognition.
Loans and receivables are non-derivative financial assets with fixed or determinable payments that are not quoted in an active market. They are included in current assets, except for maturities greater than 12 months after the reporting date. These are classified as non-current assets. The Group’s loans and receivables comprise ‘trade and other receivables (excluding prepayments and advances to suppliers)’ (Note 8), ‘due from related parties’ (Note 9) and ‘cash and bank balances’ (Note 10).
(b) Recognition and measurement
Loans and receivables are initially measured at fair value and subsequently carried at amortised cost using the effective interest method.
2.7 Offsetting financial assets and liabilitiesFinancial assets and liabilities are offset and the net amount reported in the consolidated statement of financial position when there is a legally enforceable right to offset the recognised amounts and there is an intention to settle on a net basis or realise the asset and settle the liability simultaneously. The legally enforceable right must not be contingent on future events and must be enforceable in the normal course of business and in the event of default, insolvency or bankruptcy of the Company or the counterparty.
2 Summary of significant accounting policies (continued)
2.8 Impairment of financial assets
Assets carried at amortised costThe Group assesses at the end of each reporting period whether there is objective evidence that a financial asset or a group of financial assets is impaired. A financial asset or a group of financial assets is impaired and impairment losses are incurred only if there is objective evidence of impairment as a result of one or more events that occurred after the initial recognition of the asset (a ‘loss event’) and that loss event (or events) has an impact on the estimated future cash flows of the financial asset or a group of financial assets that can be reliably estimated.
Evidence of impairment may include indications that the debtors or a group of debtors is experiencing significant financial difficulty, default or delinquency in interest or principal payments, the probability that they will enter bankruptcy or other financial reorganisation, and where observable data indicate that there is a measurable decrease in the estimated future cash flows, such as changes in arrears or economic conditions that correlate with defaults.
For loans and receivable category, the amount of the loss is measured as the difference between the asset’s carrying amount and the present value of estimated future cash flows (excluding future credit losses that have not been incurred) discounted at the financial asset’s original effective interest rate. The carrying amount of the asset is reduced and the amount of the loss is recognised in the consolidated income statement.
2.9 InventoriesInventories are stated at the lower of cost and net realisable value. Cost is determined using the weighted average method. The cost of inventory comprises the cost of purchase and other costs incurred in bringing the inventory to its present location and condition. It excludes borrowing cost.
Net realisable value is the estimated selling price in the ordinary course of business, less applicable variable selling expenses.
2.10 Trade receivablesTrade receivables are amounts due from customers for services performed in the ordinary course of business. If collection is expected in one year or less (or in the normal operating cycle of the business if longer), they are classified as current assets. If not, they are presented as non-current assets.
Trade receivables are recognised initially at fair value and subsequently measured at amortised cost using the effective interest method, less provision for impairment.
2.11 Cash and cash equivalents
In the consolidated statement of cash flows, cash and cash equivalents include cash on hand, amounts held in bank accounts and bank overdrafts. In the consolidated statement of financial position, bank overdrafts are shown within borrowings in current liabilities.
2.12 Share capitalOrdinary shares are classified as equity.
2.13 Trade and other payables These amounts represent liabilities for goods and services provided to the Group prior to the end of financial year which are unpaid. The amounts are unsecured and are usually paid within 30 days of recognition. Trade and other payables are presented as current liabilities unless payment is not due within 12 months after the reporting period. They are recognised initially at their fair value and subsequently measured at amortised cost using the effective interest method.
2.14 BorrowingsBank borrowings are recognised initially at fair value, net of transaction costs incurred. Bank borrowings are subsequently carried at amortised cost. Any difference between the proceeds (net of transaction costs) and the redemption value is recognised in the consolidated income statement over the period of the bank borrowings using the effective interest method.
Fees paid on the establishment of loan facilities are recognised as transaction costs of the loan to the extent that it is probable that some or all of the facility will be drawn down. In this case, the fee is deferred until the draw-down occurs. To the extent there is no evidence that it is probable that some or all of the facility will be drawn down, the fee is capitalised as a pre-payment for liquidity services and amortised over the period of the facility to which it relates.
Borrowings are removed from the consolidated statement of financial position when the obligation specified in the contract is discharged, cancelled or expired. The difference between the carrying amount of a financial liability that has been extinguished or transferred to another party and the consideration paid, including any non-cash assets transferred or liabilities assumed, is recognised in income statement as other income or finance costs.
Where the terms of a financial liability are renegotiated and the entity issues equity instruments to a creditor to extinguish all or part of the liability (debt for equity swap), a gain or loss is recognised in income statement, which is measured as the difference between the carrying amount of the financial liability and the fair value of the equity instruments issued.
Borrowings are classified as current liabilities unless the Group has an unconditional right to defer settlement of the liability for at least 12 months after the reporting period.
9 10
2 Summary of significant accounting policies (continued)
2.15 Provision for employees’ benefits
A provision is made for the estimated liability for employees’ employed in the UAE for their entitlements to annual leave and leave passage as a result of services rendered by the employees up to the reporting date. A provision is also made for the full amount of the end of service benefits, using actuarial techniques, due to employees in accordance with the UAE Labour Law.
The Group employs a firm of independent actuaries to determine the value of employee benefits as at the reporting date, using actuarial techniques including the Projected Unit Credit Method. The present value of the employees’ end of service benefit liability is determined by discounting the estimated future cash outflows using interest rates of high-quality corporate bonds that are denominated in the currency in which the benefits will be paid, and that have terms to maturity approximating to the terms of the related pension obligation.
Actuarial gains and losses arising from experience adjustments and changes in actuarial assumptions are charged or credited to equity in other comprehensive income in the period in which they arise.
The liability for leave salary, leave passage and end of service benefits at the end of the year, and the charge for the year on account of these benefits have been recorded in line with the recommendations of the actuaries.
The provision relating to annual leave and leave passage is disclosed as a current liability, while that relating to employees’ end of service benefits is disclosed as a non-current liability.
2.16 ProvisionsProvisions are recognised when: the Group has a present legal or constructive obligation as a result of past events; it is probable that an outflow of resources will be required to settle the obligation; and the amount has been reliably estimated. Provisions are not recognised for future operating losses.
Where there are a number of similar obligations, the likelihood that an outflow will be required in settlement is determined by considering the class of obligations as a whole. A provision is recognised even if the likelihood of an outflow with respect to any one item included in the same class of obligations may be small.
2 Summary of significant accounting policies (continued)
2.20 Foreign currency translation (continued)
(b) Transactions and balances (continued)
Foreign exchange gains and losses that relate to borrowings and cash and cash equivalents are presented in the consolidated income statement within ‘finance costs’. All other foreign exchange gains and losses are presented in the consolidated income statement within ‘other income - net’.
The results and financial position of the subsidiaries are included in the consolidated financial statements in AED which is also the subsidiaries’ functional currency.
2.21 Borrowing costs
General and specific borrowing costs that are directly attributable to the acquisition, construction or production of a qualifying asset are capitalised during the period of time that is required to complete and prepare the asset for its intended use or sale. Qualifying assets are assets that necessarily take a substantial period of time to get ready for their intended use or sale. Other borrowing costs are expensed in the period in which they are incurred.
3 Financial risk management
3.1 Financial risk factorsThe Group’s activity exposes it to a variety of financial risks: market risk (including foreign exchange risk, price risk and cash flow and fair value interest rate risk), credit risk and liquidity risk. The Group’s overall risk management programme focuses on the unpredictability of financial markets and seeks to minimise potential adverse effects on the Group’s financial performance.
(a) Market risk
(i) Foreign exchange risk
The Group’s exposure to foreign currency risk is minimal as the majority of its transactions are denominated in the Company’s functional currency.
(ii) Price riskThe Group has no exposure to price risk as it has no price sensitive financial instruments.
(iii) CashflowandfairvalueinterestrateriskThe Group’s cash flow interest rate risk arises from its borrowings and finance lease liabilities with variable interest rates.
The table below indicates the interest rate exposure on borrowings and finance lease liabilities with variable interest rates at 31 March 2017 and 2016. The analysis calculates the increase/ (decrease) on the consolidated income statement of a reasonably possible movement in interest rate:
The Group’s exposure to fair value interest rate risk arises from borrowings and finance lease liabilities with fixed interest rates. Currently, the Group does not hedge the risk arising from its borrowings and finance leases liabilities. However, the impact of fair value interest rate risk is not significant as majority of such borrowings and finance leases are of a short term nature.
(b) Credit risk
The Group is exposed to credit risk in relation to its monetary assets, mainly trade receivables (excluding prepayments and advances to suppliers), due from related parties and bank balances. The Group assesses the credit quality of the customer taking into account its financial position, past experience and other factors. It also has formal procedures to follow-up and monitor trade debtors.
Cash at bank comprises of balances with commercial banks. Credit ratings of these commercial banks have been obtained from Moody’s Corporation (‘Moody’s’). The table below analyses the balances with the banks at the reporting date.
2.17 Revenue recognition
Revenue is measured at fair value of the consideration received or receivable for the services rendered in the ordinary course of the Group’s activities. The Group recognises revenue when the amount of revenue can be reliably measured; it is probable that future economic benefits will flow to the entity; and specific criteria have been met for the Group’s activity as described below.
Renderingofservices
Revenue arising from services rendered is recognised when the services have been rendered to the customers based on contractual terms.
2.18 Leases
Operating leases
Leases in which a significant portion of the risks and rewards of ownership are retained by the lessor are classified as operating leases. Payments made under operating leases (net of any incentives received from the lessor) are charged to the consolidated income statement on a straight-line basis over the period of the lease.
2.19 Dividend distribution
Provision is made for the amount of any dividend declared, being appropriately authorised and no longer at the discretion of the Group, on or before the end of the reporting period but not distributed at the end of the reporting period.
2.20 Foreign currency translation
(a) Functional and presentation currency
Items included in the consolidated financial statements of each of the Group’s entities are measured using the currency of the primary economic environment in which the entity operates (‘the functional currency’). The consolidated financial statements are presented in United Arab Emirates Dirham (‘AED’), which is the Company’s functional and Group’s presentation currency.
(b) Transactions and balances
Foreign currency transactions are translated into the functional currency using the exchange rates prevailing at the dates of the transactions or valuation where items are re-measured. Foreign exchange gains and losses resulting from the settlement of such transactions and from the translation at year-end exchange rates of monetary assets and liabilities denominated in foreign currencies are recognised in the consolidated income statement.
2017AED
2016AED
Interest Costs
+100 basis points 3,422,435 1,874,084
-100 basis points (3,422,435) (1,874,084)
11 12
Moody’s Rating 2017AED
2016AED
Banks
A Baa1 19,295,642 1,963,922
B Baa2 875,944 447,580
C * 759,740 190,030
D A1 505,354 187,656
F Baa1 328,807 198,122
G * 328,628 328,628
H Baa1 305,108 305,108
I A2 159,156 206,980
J Aa3 10,900 11,150
K * - 12,670,085
23,328,774 16,843,723
2017AED
2016AED
Trade receivables
Counterparties without external credit rating
*Group 1 15,441,612 17,611,972
**Group 2 149,510,350 161,515,082
164,951,962 164,951,962
Less than 1 yearAED
Between 1 year and 2
yearsAED
Between 2 years and 5
yearsAED
TotalAED
At 31 March 2017
Borrowings 161,246,592 141,513,113 59,127,738 361,887,443
Trade and other payables (excluding advances from customers) 241,568,434 - - 241,568,434
Due to related parties 1,077,147 - - 1,077,147
403,892,173 141,513,113 59,127,738 604,533,024
Less than 1 yearAED
Between 1 year and 2
yearsAED
Between 2 years and 5
yearsAED
TotalAED
At 31 March 2016
Borrowings 57,479,066 25,551,605 121,291,615 204,322,286
Trade and other payables (excluding advances from customers) 208,836,530 - - 208,836,530
Due to related parties 1,941,313 - - 1,941,313
268,256,909 25,551,605 121,291,615 415,100,129
3 Financial Risk Management (continued)
3.1 Financial risk factors (continued)
(b) Credit risk(continued)
The credit quality of trade receivables that are not impaired can be assessed by reference to historical information about counterparty default rates.
*Group 1 – new customers (less than 6 months).**Group 2 – existing customers (more than 6 months) with no defaults in the past.
The balances due from related parties (net of provision for impairment) are expected to be fully recovered based on the credit history and future cash flows of related parties.
(c) Liquidity risk
Prudent liquidity risk management includes maintaining sufficient cash and marketable securities, the availability of funding through an adequate amount of committed credit limits. Due to the dynamic nature of the underlying business, the Group maintains flexibility in funding by maintaining availability under committed credit lines.
The table below analyses the Group’s financial liabilities into relevant maturity groupings based on the remaining period at the reporting date to the contractual maturity date. The amounts disclosed in the table are the contractual undiscounted cash flows.
3 Financial risk management(continued)3.2 Capital risk managementThe Group’s objectives when managing capital are to safeguard the Group’s ability to continue as a going concern in order to provide returns for shareholders and benefits for other stakeholders and to maintain optimal capital structure to reduce the cost of capital.
In order to maintain or adjust the capital structure, the Group may adjust the amount of dividend paid to shareholders, issue new shares or sell assets to reduce debt.
Consistent with others in the industry, the Group monitors capital on the basis of the gearing ratio. This ratio is calculated as net debt divided by total capital. Net debt is calculated as total borrowings and financial lease liabilities (including current and non-current amounts as shown in the consolidated statement of financial position) less cash and bank balances. Total capital is calculated as ‘total equity’ as shown in the consolidated statement of financial position plus net debt.
The gearing ratio at 31 March 2017 and 2016 was as follows:
4 Critical accounting estimates and judgements
Estimates and judgements are continually evaluated and are based on historical experience and other factors, including expectations of future events that are believed to be reasonable under the circumstances.
The Group makes estimates and assumptions concerning the future. The resulting accounting estimates will, by definition, seldom equal the related actual results. The estimates and assumptions that have a significant risk of causing a material adjustment to the carrying amounts of assets and liabilities within the next financial year are discussed below.
(a) ImpairmentoftradeandotherreceivablesThe impairment charge reflects estimates of losses arising from the failure or inability of the parties concerned to make the required payments. The charge is based on knowledge of customer’s business and financial standing, the customer’s ability and willingness to settle, the customer’s credit worthiness and the historic write-off experience. Changes to the estimated impairment charge may be required if the financial condition of the customers were to improve or deteriorate. Management considers that the current level of impairment charge is appropriate and consistent with the loss estimated at year end.
(b) Depreciation of property, plant and equipmentManagement assigns useful lives and residual values to property, plant and equipment based on the intended use and the economic lives of those assets. Subsequent changes in circumstances could result in the actual useful lives or residual values differing from initial estimates. Where management determines that the useful life or residual value of an asset requires amendment, the net book amount in excess of the residual value is depreciated over the revised remaining useful life.
(c) Provisionforemployees’endofservicebenefitsThe present value of employees’ end of service benefit obligations depends on a number of factors that are determined on an actuarial basis using a number of assumptions. The assumptions used in determining the net cost for end of service benefits include the discount rate.
Any changes in these assumptions will impact the carrying amount of end of service benefit obligations.
The Group determines the appropriate discount rate at the end of each year. This is the interest rate that should be used to determine the present value of estimated future cash outflows expected to be required to settle the end of service benefit obligations. In determining the appropriate discount rate, the Group considers the interest rates of high-quality corporate bonds that are denominated in the currency in which the benefits will be paid and that have terms to maturity approximating the terms of the related end of service benefits obligation.
Other key assumptions for end of service benefit obligations are based in part on current market conditions. Additional information is disclosed in Note 16.
(d) Impairment assessment of goodwillThe Group tests annually whether the goodwill has suffered any impairment, in accordance The Group tests annually whether the goodwill has suffered any impairment, in accordance with the accounting policy stated in Note 2.4. Management also assesses the impairment of goodwill whenever events or changes in circumstances indicate that the carrying value may not be recoverable. Factors that are considered important which could trigger an impairment review include evidence that no profits or cash flows will be generated from the related asset.
The recoverable amounts of cash generating units have been determined based on value-in-use calculations. These calculations require the use of estimates (Note 6).
If the budgeted cash flows used in the value-in-use calculation for the Group had been 5% lower than management’s estimates at 31 March 2017, the Group would not have recognised impairment on goodwill.
If the estimated cost of capital used in the value-in-use calculation for the Group had been 1% higher than management’s estimates at 31 March 2017, the Group would not have recognised impairment on goodwill.
13 14
2017AED
2016AED
Borrowings (Note 12) 341,094,433 186,542,167
Less: cash and bank balances (Note 10) (23,706,396) (17,051,572)
Net debt 317,388,037 169,490,595
Total equity 456,692,841 342,283,885
Total capital 774,080,878 511,774,480
Gearing ratio 41% 33%

5 Property, plant and equipment
Certain buildings having a carrying amount of AED 2,041,157 (2016: AED 2,226,984) have been built over the leasehold land. The leases are expected to get renewed upon its expiry.
Depreciation expense has been allocated as follows:
Assets held as collateral are explained under note 12.
Land and buildingsAED
Plant and machineryAED
Furniture and fixturesAED
Computer and office equipment
AEDMotor vehicles
AEDCapital work in progress
AEDTotalAED
Cost
At 1 April 2015 4,021,982 27,848,927 28,594,545 21,659,150 37,185,227 17,912,797 137,222,628
Additions - 14,793,356 13,309,427 2,187,035 7,694,877 12,393,645 50,378,340
Transfer - - 474,071 - 6,364,152 (6,838,223) -
Disposals - - (554,559) - (1,023,062) - (1,577,621)
As at 31 March 2016 4,021,982 42,642,283 41,823,484 23,846,185 50,221,194 23,468,219 186,023,347
Additions 137,299,010 137,299,010 16,787,605 5,962,085 16,849,573 11,957,540 206,574,968
Transfer - 224,253 8,033,888 304,147 7,135,812 (15,698,100) -
Disposals - - (240,320) (83,835) (2,615,125) - (2,939,280)
As at 31 March 2017 141,320,992 60,585,691 66,404,657 30,028,582 71,591,454 19,727,659 389,659,035
Depreciation
At 1 April 2015 1,602,178 11,960,027 11,295,935 13,814,488 24,103,131 - 62,775,759
Charge for the year 186,252 2,963,947 3,326,858 3,022,917 4,379,959 - 13,879,933
Disposals - - (16,513) - (972,332) - (988,845)
As at 31 March 2016 1,788,430 14,923,974 14,606,280 16,837,405 27,510,758 - 75,666,847
Charge for the year 186,252 5,054,075 6,017,585 3,713,389 7,133,839 - 22,105,140
Disposals - - (44,188) (20,987) (2,123,016) - (2,188,191)
As at 31 March 2017 1,974,682 19,978,049 20,579,677 20,529,807 32,521,581 - 95,583,796
Net book value
As at 31 March 2017 139,346,310 40,607,642 45,824,980 9,498,775 39,069,873 19,727,659 294,075,239
As at 31 March 2016 2,233,552 27,718,309 27,217,204 7,008,780 22,710,436 23,468,219 110,356,500
15 16
Note 2017AED
2016AED
Direct costs 17 12,374,165 7,530,158
Administrative expenses 18 9,730,975 6,349,775
22,105,140 13,879,933
6 Intangible assets
Computer softwareAED
Capital work in progressAED
GoodwillAED
TotalAED
Cost
At 1 April 2016 40,237,722 8,056,197 36,032,634 84,326,553
Additions 4,849,799 375,793 - 5,225,592
Transfer 6,541,365 (6,541,365) - -
As at 31 March 2017 51,628,886 1,890,625 36,032,634 89,552,145
Amortisation
At 1 April 2016 15,633,785 - - 15,633,785
Charge for the year (Note 17) 7,308,371 - - 7,308,371
As at 31 March 2017 22,942,156 - - 22,942,156
Net book value as at 31 March 2017 28,686,730 1,890,625 36,032,634 66,609,989
Cost
At 1 April 2015 33,139,611 4,518,442 - 37,658,053
Additions 3,096,933 7,538,933 36,032,634 46,668,500
Transfer 4,001,178 (4,001,178) - -
As at 31 March 2016 40,237,722 8,056,197 36,032,634 84,326,553
Amortisation
At 1 April 2015 10,202,981 - - 10,202,981
Charge for the year (Note 17) 5,430,804 - - 5,430,804
As at 31 March 2016 15,633,785 - - 15,633,785
Net book value as at 31 March 2016 24,603,937 8,056,197 36,032,634 68,692,768
Additional details on goodwill are disclosed in Note 24.
7 Investment in subsidiariesOn 2 February 2011, the Company incorporated a wholly owned subsidiary, Transguard Cash LLC (“TG Cash”) through transfer of specific assets and liabilities of the Company’s Cash Generating Unit (“Cash Services operation”) to TG Cash.
Pursuant to its formation, the Company entered into a strategic alliance with Network International LLC, in order to facilitate the provision of ‘managed end-to-end Automated Teller Machines (“ATM”) services’ to the Group’s customers, through issuance of 50% equity interest in the TG Cash. This equity interest in TG Cash was issued for a cash consideration of AED 132,500,000.
Currently, the share capital of TG Cash is owned equally by the Company and Network International LLC. However, as per a management agreement, the Company has the sole right to manage and the power to govern and control the financial and operating policies of TG Cash.
On 3 September 2012, the Group incorporated a subsidiary, Transguard Themis LLC (“TG Themis”) and had a 51% controlling interest in TG Themis. On 1 April 2015, the Company acquired the remaining 49% controlling interest in TG Themis for a cash consideration of AED 190,310 (Note 25).
On 30 June 2015, the Company acquired 99% controlling interest in CASS International Trading LLC (“CASS”) for a cash consideration of AED 35,000,000. The Group has 100% beneficial ownership of the subsidiary (Note 24).
All subsidiary undertakings are included in the consolidation.
Summarised financial information for each subsidiary that has non-controlling interests is shown below:
The information above represents amounts before intercompany eliminations.
Subsidiary company Percentage of equity
owned by the
Company
Percentage of equity
owned by NCI
Percentage of
beneficial interest owned by the
Company
Principal activities Country of incorporation
Transguard Cash LLC 50% 50% 50% Providing cash management services including secure and
safe movement of cash and documents and
ATM services to banks.
UAE
Transguard Themis LLC
99% 1% 100% Providing white-collar recruitment services.
UAE
CASS International Trading LLC
99% 1% 100% Providing training for aviation and security
personnel
UAE
Transguard Cash LLC
2017AED
2016AED
Summarised statement of financial position
Current
Assets 146,069,529 148,230,640
Liabilities (29,063,331) (30,970,687)
Total current assets – net 117,006,198 117,259,953
Non-current
Assets 104,936,742 77,263,712
Liabilities (10,392,454) (8,483,326)
Total non-current assets/(liabilities) - net 94,544,288 68,780,386
Net assets 211,550,486 186,040,339
Summarised income statement
Revenue 257,079,923 220,763,810
Profit for the year 41,825,147 41,797,583
Other comprehensive loss (1,315,000) (1,600,671)
Total comprehensive income 40,510,147 40,196,912
Total comprehensive income allocated to non-controlling interests 20,255,074 20,098,456
Summarised cash flows
Net cash generated from operating activities 59,371,150 53,448,727
Net cash used in investing activities (44,301,102) (38,486,295)
Net cash used in financing activities (15,000,000) (15,000,000)
Net increase/(decrease) in cash and cash equivalents 70,048 (37,568)
Cash and cash equivalents at beginning of year 78,111 115,679
Cash and cash equivalents at end of year 148,159 78,111
17 18
8 Trade and other receivables
2017AED
2016AED
Trade receivables 273,943,264 205,868,927
Provision for impairment of trade receivables (20,836,770) (22,370,981)
Trade receivables – net 253,106,494 183,497,946
Prepayments 218,208,751 197,405,096
Accrued income 133,648,233 99,679,034
Advances to suppliers 11,964,090 11,971,706
Other receivables 36,141,054 32,091,588
653,068,622 524,645,370
Long term portion of prepayments (118,704,139) (119,497,677)
534,364,483 405,147,693
The Group’s customers are based in the UAE. At 31 March 2017, five customers (2016: five customers) accounted for 29% (2016: 29%) of the total trade receivables. Management is confident that this concentration of credit risk will not result in a loss to the business.
As of 31 March 2017, trade receivables of AED 72,346,270 (2016: AED 53,898,250) were fully performing. Trade receivables of AED 156,083,158 (2016: AED 117,119,739) were past due but not impaired. These relate to a number of independent customers for whom there is no recent history of default. The ageing analysis of these trade receivable is as follows:
As of 31 March 2017, trade receivables of AED 45,513,836 (2016: AED 34,850,938) were impaired and partially provided for. The amount of provision against the receivables was AED 20,836,770 (2016: AED 22,370,981). These receivables mainly relate to customers which are in difficult financial situations. It was assessed that a portion of the receivables is expected to be recovered. The ageing of these receivables is given below:
The carrying amount of the Group’s trade and other receivables at 31 March 2017 and 2016 are denominated in AED. Movement in the Group’s provision for impairment of trade receivables are as follows:
The creation and release of provision for impaired receivables during the year have been recognised in the consolidated income statement under ‘Administrative expenses’. Amounts charged to the provision account are written off when there is no expectation of recovering additional cash.
The maximum exposure to credit risk at the reporting date is the carrying value of each class of receivables. The fair values of trade and other receivables approximate to their carrying amounts as at 31 March 2017 and 2016. The Group does not hold any collateral as security. The other classes within trade and other receivables do not contain impaired assets.
Included within trade and other receivables are ‘Prepayments’ and ‘Other receivables’ amounting to AED 125,497,677 (2016: AED 126,186,281) and AED 34,106,232 (2016: AED 37,064,939), respectively, pertaining to related parties, arising from transactions disclosed in Note 9.
2017AED
2016AED
Up to 3 months 4,403,865 13,423,962
3 to 6 months 625,924 8,276,405
Over 6 months 40,484,047 13,150,571
45,513,836 34,850,938
2017AED
2016AED
Up to 3 months 140,838,143 108,768,869
3 to 6 months 15,147,464 3,660,390
Over 6 months 97,551 4,690,480
156,083,158 117,119,739
2017AED
2016AED
Opening balance 22,370,981 23,140,295
Reversal of provision for impairment of trade receivables upon collection (Note 18) (1,534,211) (1,411,087)
Addition due to subsidiary acquired during the year - 641,773
Closing balance 20,836,770 22,370,981
The above balances arose from transactions in the normal course of business and are non-interest bearing and will be settled within 12 months.
Related party transactions During the year, the Group entered into the following significant transactions with related parties in the ordinary course of business. These transactions were carried out at prices and on terms applicable to non-related parties for similar transactions.
The closing balances arising from certain transactions are shown under ‘Prepayments’ and ‘Other receivables’ in Note 8.
10 Cash and cash equivalents
Cash and cash equivalents include the following for the purposes of the consolidated statement of cash flows:
Bank balances are held in current accounts with locally incorporated banks and branches of international banks.
2017AED
2016AED
Due from related parties
dnata and entities related to dnata 80,528,651 78,066,041
Affiliates 1,782,550 -
82,311,201 78,066,041
Less: provision for impairment of due from related parties (408,509) (740,336)
81,902,692 77,325,705
2017AED
2016AED
Sales to affiliates 686,244,311 584,241,160
Purchases from affiliates 9,845,175 8,623,725
Rent and utilities payment to affiliates 20,461,775 17,567,427
Key management compensation
Salaries and other benefits 7,664,291 9,790,837
End of service benefits 154,416 257,360
7,818,707 10,048,197
2017AED
2016AED
Cash on hand 377,622 207,849
Cash at bank 23,328,774 16,843,723
Cash and bank balances 23,706,396 17,051,572
2017AED
2016AED
Cash and bank balances 23,706,396 17,051,572
Bank overdraft (Note 12) - (20,674,362)
23,706,396 (3,622,790)
2017AED
2016AED
Opening balance 740,336 984,475
Reversal of provision for impairment of balances due from related parties upon collection (Note 18) (331,827) (244,139)
Closing balance 408,509 740,336
Due to related parties
dnata and entities related to dnata 1,077,147 1,941,313
9 Related party balances and transactionsRelated parties include the shareholders, fellow subsidiaries, key management personnel, businesses controlled by the shareholders or over which they exercise a significant management influence (herein referred to as “affiliates”).
Movement in the Group’s provision for impairment of balances due from related parties are as follows:
19
2017AED
2016AED
Trade payables 59,903,867 55,629,126
Provision for leave salary and leave passage 65,123,890 54,452,535
Accrued salaries 62,953,138 54,492,600
Advances from customers 319,999 934,867
Other payables and accruals 53,587,539 44,262,269
241,888,433 209,771,397
2017AED
2016AED
Opening balance 165,867,805 94,356,845
Additions during the year 392,000,918 182,920,744
Payments during the year (216,774,290) (111,409,784)
Closing balance 341,094,433 165,867,805
2017AED
2016AED
Non-current
Borrowings 188,267,542 188,267,542
Current
Borrowings 152,826,891 30,939,243
Bank overdraft (Note 10) - 20,674,362
152,826,891 51,613,605
Total borrowings 341,094,433 186,542,167
The maturity of the borrowings is as follows:
Less than 1 year 152,826,891 51,613,605
Between 1 and 2 years 67,982,456 30,833,333
Between 2 and 5 years 120,285,086 104,095,229
341,094,433 186,542,167
11 Trade and other payables
12 Borrowings
Total borrowings include secured borrowings of AED Nil (2016: AED 16,595,735). Bank borrowings are secured by the plant and machinery and motor vehicles of the Group.
The Group has undrawn facilities amounting to AED 358,759,016 (2016: AED 305,739,128).
The movement in borrowings (excluding bank overdrafts) is as follows:
The carrying amounts of the Group’s borrowings are denominated in United Arab Emirates Dirham (‘AED’).
Borrowings include term loans with repayment term up to 5 years, short term revolving loans, and bank overdraft. The Group has complied with the financial covenants of its borrowing facilities during the years ended 31 March 2017 and 2016. Borrowings carry variable interest rates that are in line with current market terms.
13 Share capitalShare capital comprises 300 (2016: 300) authorised, issued and paid up shares of AED 1,000 each amounting to AED 300,000 (2016: AED 300,000).
14 Legal reserveIn accordance with the UAE Federal Law No. (2) of 2015, and the Company’s Articles of Association, 10% of the net profit of the Company for the year is transferred to a non-distributable legal reserve. Such transfers are required to be made until the reserve is equal to at least 50% of the paid-up capital of the Company. Since the legal reserve of the Company is equal to 50% of the share capital, no additional amounts have been transferred to the legal reserve during the year.
15 Contributed capitalContributed capital represents amounts contributed by dnata and is not repayable.
20
2017AED
2016AED
Present value of employees’ end of service benefits 81,306,807 58,763,789
The movement in the net liability over the year is as follows:
Opening balance 58,763,789 42,825,968
Charge for the year (see note below) 27,092,678 16,963,182
Remeasurement of retirement benefit obligations 4,132,000 7,921,314
Acquisition* 3,338,000 -
Benefits paid (12,019,660) (8,946,675)
Closing balance 81,306,807 58,763,789
Impact on employees’ end of service benefits liability
Change in assumption
Increase in assumption
Decrease in assumption
Discount rate 0.1% Decrease by 1.70%
Increase by 1.74%
Salary increase rate 0.1% Increase by 1.89%
Decrease by 1.89%
Impact on employees’ end of service benefits liability
Change in assumption
Increase in assumption
Decrease in assumption
Withdrawal rate 10% Increase by 0.58%
Increase by 1.74%2017
AED2016AED
Current service cost 24,367,996 14,821,824
Interest cost 2,724,682 2,141,358
27,092,678 16,963,182
2017AED
2016AED
Valuation discount rate 4.7% per annum 4.7% per annum
Salary increase rate 5% per annum 5% per annum
2017AED
2016AED
Staff costs (Note 19) 1,149,324,005 838,462,630
Rent 225,393,449 148,111,313
Fuel and transportation 59,451,341 49,872,050
Visa and immigration 36,589,990 34,485,862
Consumables 15,090,124 8,503,886
Repairs and maintenance 14,209,175 14,869,632
Depreciation (Note 5) 12,374,165 7,530,158
Uniforms 8,173,915 7,392,579
Communication expenses 8,153,132 6,573,490
Staff training expenses 7,316,434 5,082,812
Amortisation (Note 6) 7,308,371 5,430,804
Insurance 4,912,501 4,656,061
Others 41,673,679 19,964,212
1,589,970,281 1,150,935,489
16 Provision for employees’ end of service benefitsReconciliation of provision for employees’ end of service benefits:
*This represent new employees transferred to the Company during the year.
The amounts recognised in the consolidated income statement are as follows:
Charge of AED 27,092,678 (2016: AED 16,963,182) (Note 19) was included in ‘direct costs’ and ‘administrative expenses’ amounting to AED 23,237,959 (2016: AED 12,355,562) and AED 3,854,719 (2016: AED 4,607,620) respectively.
The principal actuarial assumptions were as follows:
17 Direct costs
Sensitivityanalysisoffinancialassumptions:The sensitivity of the overall employees’ end of service benefits liability to changes in the principal financial assumptions is as follows:
Sensitivityanalysisofdemographicassumptions:The sensitivity of the overall employees’ end of service benefits liability to changes in the principal demographic assumptions is as follows:
21 22
2017AED
2016AED
Staff costs (Note 19) 122,775,011 105,682,038
Depreciation (Note 5) 9,730,975 6,349,775
Rent 8,008,765 7,402,329
Fees and subscriptions 4,148,543 2,587,045
License fees 2,891,232 8,924,192
Stationery and supplies 2,454,645 2,466,090
Marketing expenses 2,140,233 2,821,386
Information technology expenditure 1,994,575 7,338,418
Business travel 88,161 637,540
Office maintenance 267,964 267,964
Release of provision for impairment of trade receivables (Notes 8) (1,534,211) (1,411,087)
Release of provision for impairment of balances due from related parties (Notes 9) (331,827) (244,139)
Others 4,292,457 3,985,733
156,926,523 146,787,716
2017AED
2016AED
Interest expense on borrowings 8,567,662 6,358,633
2017AED
2016AED
Guarantees 25,283,596 12,339,731
Letters of credit 3,479,585 2,690,531
2017AED
2016AED
Not later than 1 year 102,913,698 136,012,008
Later than 1 year and not later than 5 years 336,372,130 248,522,957
Over 5 years 40,058,142 6,000,000
479,343,970 390,534,9652017AED
2016AED
Salaries and wages 1,124,137,076 820,189,082
Leave salary and passage 63,832,174 63,025,042
End of service benefits (Note 16) 27,092,678 16,963,182
Other benefits 57,037,088 43,967,362
1,272,099,016 944,144,668
Staff costs are allocated as follows:
Direct costs (Note 17) 1,149,324,005 838,462,630
Administrative expenses (Note 18) 122,775,011 105,682,038
1,272,099,016 944,144,668
18 Administrative expenses
No social contributions were made during the years ended 31 March 2017 and 2016.
19 Staff costs
20 Other income – net
Other income is netted off from the loss on disposal of property, plant and equipment amounting to AED 592,110 (2016: AED 66,877).
21 Finance costs
22 Contingencies and commitments
(a) Operating commitments
The Group leases office building and labour camps under non-cancellable operating lease agreements. The future minimum lease payments under the lease are as follows:
23 DividendDividend of AED 20,000,000 (2016: AED 25,000,000) has been approved by the Board of Directors and paid during the year to the shareholders of the Company.
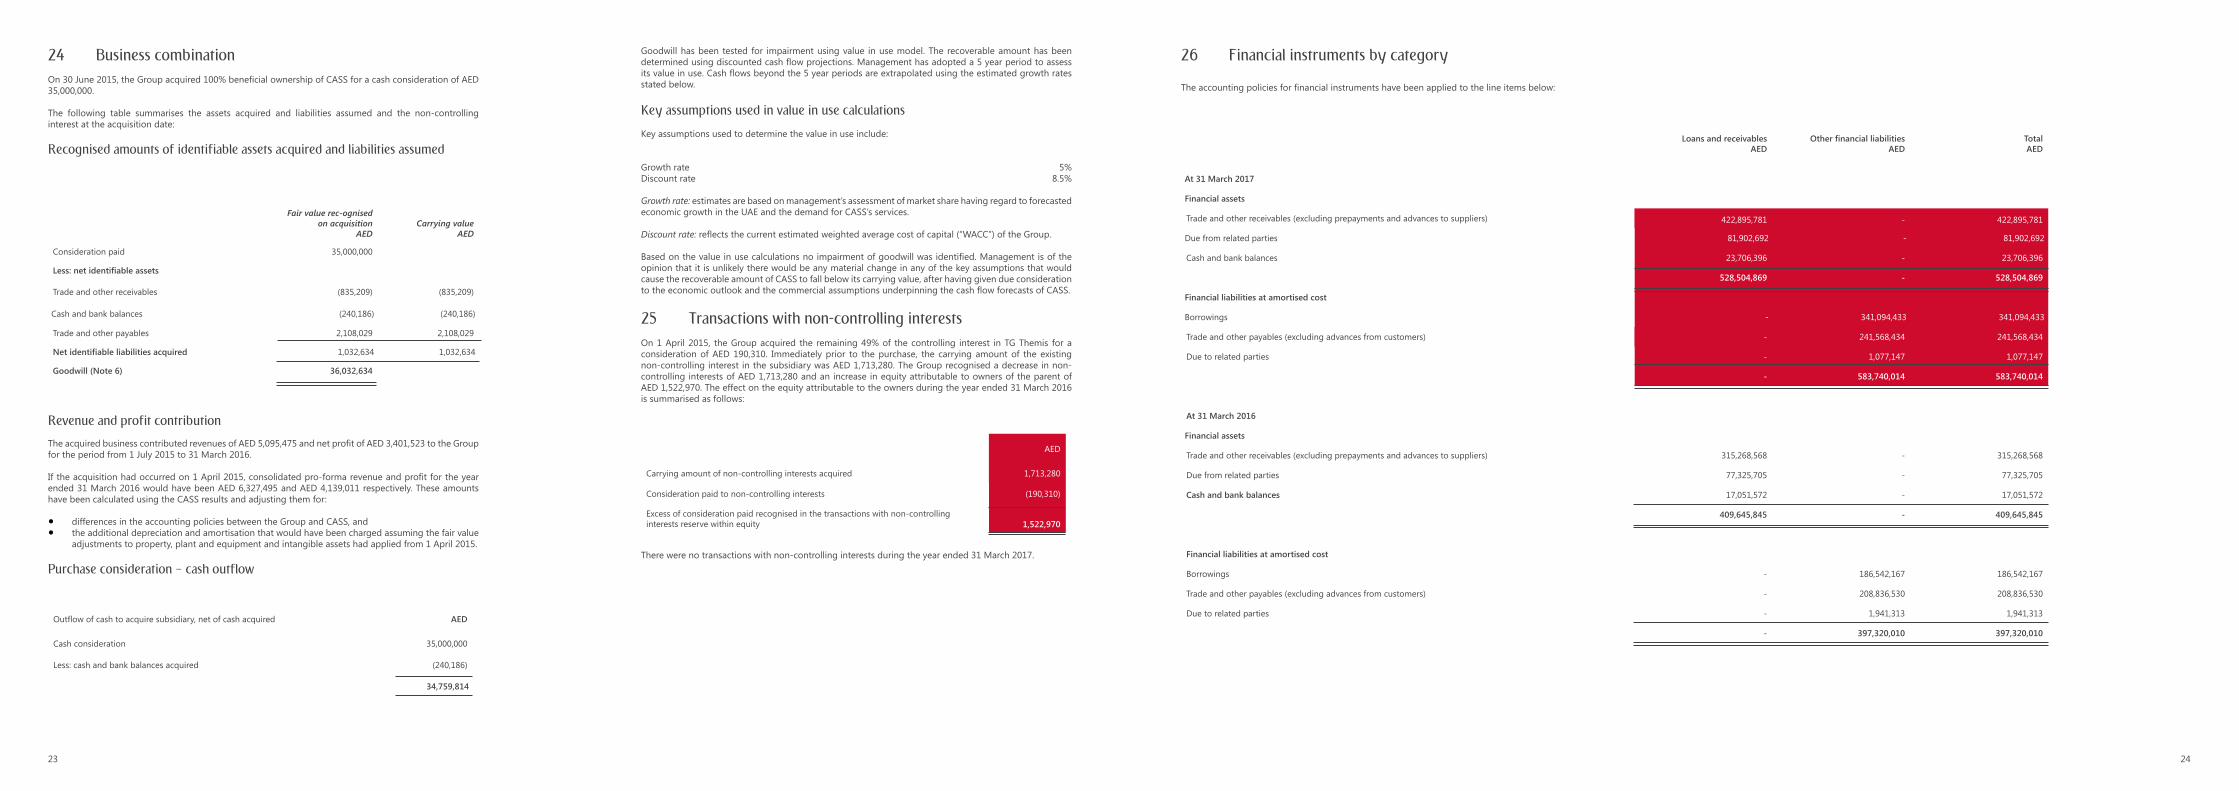
23 24
Fair value rec-ognised on acquisition
AEDCarrying value
AED
Consideration paid 35,000,000
Less: net identifiable assets
Trade and other receivables (835,209) (835,209)
Cash and bank balances (240,186) (240,186)
Trade and other payables 2,108,029 2,108,029
Net identifiable liabilities acquired 1,032,634 1,032,634
Goodwill (Note 6) 36,032,634
Outflow of cash to acquire subsidiary, net of cash acquired AED
Cash consideration 35,000,000
Less: cash and bank balances acquired (240,186)
34,759,814
AED
Carrying amount of non-controlling interests acquired 1,713,280
Consideration paid to non-controlling interests (190,310)
Excess of consideration paid recognised in the transactions with non-controlling interests reserve within equity 1,522,970
24 Business combinationOn 30 June 2015, the Group acquired 100% beneficial ownership of CASS for a cash consideration of AED 35,000,000.
The following table summarises the assets acquired and liabilities assumed and the non-controlling interest at the acquisition date:
Recognised amounts of identifiable assets acquired and liabilities assumed
Revenue and profit contributionThe acquired business contributed revenues of AED 5,095,475 and net profit of AED 3,401,523 to the Group for the period from 1 July 2015 to 31 March 2016.
If the acquisition had occurred on 1 April 2015, consolidated pro-forma revenue and profit for the year ended 31 March 2016 would have been AED 6,327,495 and AED 4,139,011 respectively. These amounts have been calculated using the CASS results and adjusting them for:
• differences in the accounting policies between the Group and CASS, and • the additional depreciation and amortisation that would have been charged assuming the fair value
adjustments to property, plant and equipment and intangible assets had applied from 1 April 2015.
Purchase consideration – cash outflow
Goodwill has been tested for impairment using value in use model. The recoverable amount has been determined using discounted cash flow projections. Management has adopted a 5 year period to assess its value in use. Cash flows beyond the 5 year periods are extrapolated using the estimated growth rates stated below.
Key assumptions used in value in use calculationsKey assumptions used to determine the value in use include:
Growth rate 5%Discount rate 8.5%
Growthrate: estimates are based on management’s assessment of market share having regard to forecasted economic growth in the UAE and the demand for CASS’s services.
Discountrate:reflects the current estimated weighted average cost of capital (“WACC”) of the Group.
Based on the value in use calculations no impairment of goodwill was identified. Management is of the opinion that it is unlikely there would be any material change in any of the key assumptions that would cause the recoverable amount of CASS to fall below its carrying value, after having given due consideration to the economic outlook and the commercial assumptions underpinning the cash flow forecasts of CASS.
25 Transactions with non-controlling interestsOn 1 April 2015, the Group acquired the remaining 49% of the controlling interest in TG Themis for a consideration of AED 190,310. Immediately prior to the purchase, the carrying amount of the existing non-controlling interest in the subsidiary was AED 1,713,280. The Group recognised a decrease in non-controlling interests of AED 1,713,280 and an increase in equity attributable to owners of the parent of AED 1,522,970. The effect on the equity attributable to the owners during the year ended 31 March 2016 is summarised as follows:
There were no transactions with non-controlling interests during the year ended 31 March 2017.
26 Financial instruments by category
The accounting policies for financial instruments have been applied to the line items below:
Loans and receivablesAED
Other financial liabilitiesAED
TotalAED
At 31 March 2017
Financial assets
Trade and other receivables (excluding prepayments and advances to suppliers) 422,895,781 - 422,895,781
Due from related parties 81,902,692 - 81,902,692
Cash and bank balances 23,706,396 - 23,706,396
528,504,869 - 528,504,869
Financial liabilities at amortised cost
Borrowings - 341,094,433 341,094,433
Trade and other payables (excluding advances from customers) - 241,568,434 241,568,434
Due to related parties - 1,077,147 1,077,147
- 583,740,014 583,740,014
At 31 March 2016
Financial assets
Trade and other receivables (excluding prepayments and advances to suppliers) 315,268,568 - 315,268,568
Due from related parties 77,325,705 - 77,325,705
Cash and bank balances 17,051,572 - 17,051,572
409,645,845 - 409,645,845
Financial liabilities at amortised cost
Borrowings - 186,542,167 186,542,167
Trade and other payables (excluding advances from customers) - 208,836,530 208,836,530
Due to related parties - 1,941,313 1,941,313
- 397,320,010 397,320,010


Transguard Group HeadquartersPO Box 22630DubaiT: +971 (0)4 703 0500UAE Toll Free Number: 800 1800
Transguard Group PO Box 38897
Abu DhabiT: +971 (0)2 446 3711