Embed Size (px)
Citation preview
Journal of Engineering Science and Technology Vol. 12, No. 10 (2017) 2826 - 2838 © School of Engineering, Taylor’s University
2826
TRANSIENT ANALYSIS OF WIND DIESEL POWER SYSTEM WITH FLYWHEEL ENERGY STORAGE
S. SUJITH*, V. RAMESH
School of Electrical Engineering, VIT University, Vellore, India - 632014
*Corresponding Author: [email protected]
Abstract
Wind-Diesel Hybrid power generation is a viable alternative for generating
continuous power to isolated power system areas which have inconsistent but
potential wind power. The unpredictable nature of variable power from Wind
generator to the system is compensated by Diesel generator, which supplies the
deficit in generated power from wind to meet the instantaneous system load.
However, one of the major challenges for such a system is the higher
probability of transients in the form of wind and load fluctuations. This paper
analyses the application of Flywheel Energy storage system (FESS) to meet the
transients during wind-speed and load fluctuations around high wind operation.
The power system architecture, the distributed control mechanism governing
the flow of power transfer and the modelling of major system components has
been discussed and the system performances have been validated using
MATLAB /Simulink software. Two cases of transient stages around the high
wind system operation are discussed. The simulation results highlight the
effective usage of FESS in reducing the peak overshoot of active power
transients, smoothes the active power curves and helps in reducing the diesel
consumption during the flywheel discharge period, without affecting the
continuous power supply for meeting the instantaneous load demand.
Keywords: Diesel-generator, Wind-generator, Hybrid system, Dump load, Flywheel
and energy storage system.
1. Introduction
An autonomous Wind-Diesel Hybrid power system (WDHS) has two sources that can
provide active power to system load namely the Wind Generator (WG) and diesel
generator (DG). The system can work in three modes of operation, based on the active
source available in the instant of generating power viz Window only (WO) mode,
Transient Analysis of Wind Diesel Power System with Flywheel Energy . . . . 2827
Journal of Engineering Science and Technology October 2017, Vol. 12(10)
Nomenclatures
A Area swept by wind turbine blades , m2
Cp Power coefficient of wind turbine
f System frequency, Hz
I Polar moment of inertia of flywheel, kg.m2
PL Load demand, kW
v Wind speed, m/s
Greek Symbols
ω(t) Instantaneous speed of flywheel, rpm
ωmax Maximum /rated speed of flywheel, rpm
ωWT Angular speed of wind turbine shaft, rpm
ρ Air density, kg/m3
ή Efficiency of flywheel
Abbreviations
DG Diesel generator
DL Dump load
DO Diesel only (mode)
FESS Flywheel energy storage system
FW Flywheel
PRC Power regulator control
WO Wind only (mode)
WD Wind diesel (mode)
WDHS Wind diesel hybrid system
WG Wind generator
Wind-Diesel (WD) mode and Diesel only (DO) mode. In WO and DO modes, the
lone active power source is Wind Generator (WG) and Diesel Generator (DG)
respectively.
In WD mode, the total active power for the system is provided by WG and DG
combination, since WG alone could not meet the system power demand due to
insufficient wind speed. The term wind penetration ratio denotes the contribution of
active energy from WG in meeting the total energy demand of the system for the
period of analysis. Wind penetration ratio is defined as the ratio of total energy
contributed from wind energy in meeting the load demand to the total energy
requirement for the period of analysis (normally taken on yearly or its fractional
basis). Unlike Diesel power, Wind power is uncontrollable in nature as it almost
depends on the instantaneous wind speed for the selected WG design. To enhance
the wind penetration ratio, the excess power stored during the high wind period
(WO mode) needs to be stored in suitable Energy Storage System (ESS) for later
use. Moreover, ESS also helps in tackling the transient stages associated with power
fluctuations from WG (including the mode transitions) thereby ensuring stable,
quality and continuous power throughout the assessment period.
This paper discusses the charge-discharge process of Flywheel Energy storage
system (FESS) and a control strategy to utilise its stored energy for reducing the
power transients during a sudden additional requirement of instantaneous power
2828 Sujith S. and Ramesh V.
Journal of Engineering Science and Technology October 2017, Vol. 12(10)
when the flywheel (FW) is in fully charged state (transient period during post-
WO mode of operation). The reduction in DG fuel intake during the period is also
discussed. Two cases of post-WO mode transients are discussed in the paper and
the power system performance has been validated using MATLAB/Simulink
software. The first case deals with the transient period during a sudden reduction
in wind speed and the second case deals with a sudden increase in instantaneous
load demand, prompting the system to move from WO to WD mode of operation
for both. The system architecture and the flow of control signals in it are
discussed in section-3. The mathematical modelling of major system components
is discussed in section-4. The simulation schematics and the simulation
results/analysis are discussed in section-5.
2. Review of Previous Works
The improvement of dynamic analysis of WDHS and its various control strategies
has been dealt with in previous research publications. Conventionally, batteries
are the preferred option as Energy Storage System (ESS) for such systems, mostly
due to its mature technology. The usage of Battery based energy Storage system
(BESS) in producing a smooth transition from WO to WD mode are explained by
Sebastián et al. [1, 2]. Pena et al. [3, 4] describes the control strategy and
performance investigation of WDHS using doubly fed induction generators
(DFIG). Although Flywheel (FW) based ESS is an emerging technology, it offers
better characteristics in terms of higher efficiency and compactness (than BESS).
The comparison between FESS and BESS are discussed by Arghandeh et al. [5]
and the advantages of FESS over the later are highlighted. FESS have higher
efficiency and its operational cost is lesser than BESS (due to lower cooling
system requirements, low chances for internal fault, reduced maintenance cost
and increased life which is normally as high as 15-20 years). Moreover, FESS is a
better option for the system, if the geographic location suffers frequent wind
fluctuations around high wind region (corresponding to the instantaneous system
load demand), as flywheel can utilise the high wind situation for storing energy.
The design of flywheel depends on the historical data of wind speed for the
location. Carrillo et al. [6] discusses the comparative study of various flywheels.
Sebastián et al.[7] has listed the various applications of FESS like aerospace and
traction. The simulation results shown in the paper highlights the fact that FESS
can be used for smoothing the wind power during sudden changes in load.
However, the studies on the application of FESS on isolated WDHS are
limited and its effectiveness for usage in various transient conditions was not
analysed in previous literatures. One of the important priorities in such a system is
to minimize the transient power fluctuations during post WO mode of operation
and also reduces the generation of power from DG during the FW discharge
period (without compromising on instantaneous power to meet the system load
demand). The power fluctuations due to inconsistent wind speed (for input to
Wind Turbine) is also major concern for autonomous WDHS micro-grid. The
paper discusses the use of FESS to meet the above two problems (along with a
typical control strategy), which are not been investigated in previous studies on
the subject. The effect of FESS to reduce the above problems has been
investigated and validated by simulation using MATLAB /Simulink software.
Transient Analysis of Wind Diesel Power System with Flywheel Energy . . . . 2829
Journal of Engineering Science and Technology October 2017, Vol. 12(10)
3. Power System Architecture and Flow of Control Signals
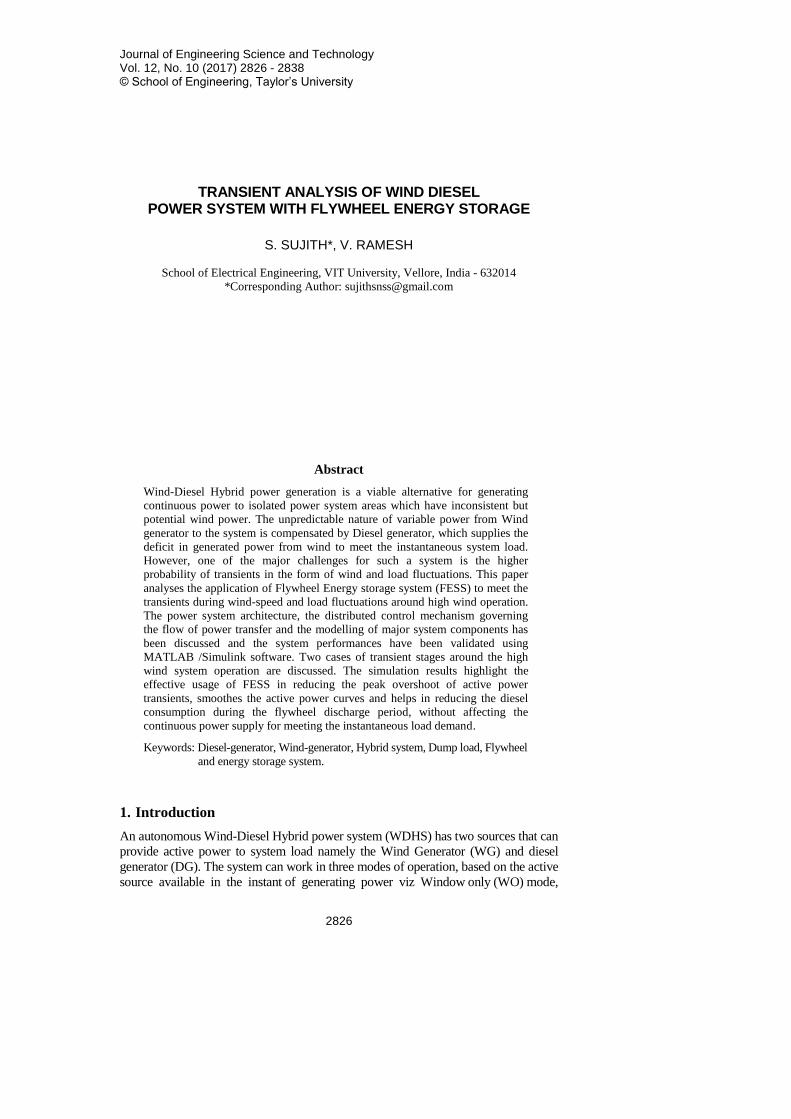
The power system architecture is shown in Fig. 1. The positive power sign
indicates generation of power and negative sign indicates the consumption
/utilisation. The system has four main modules as given below
i. Wind-Generator (WG) module consisting of wind turbine which produces
mechanical power based on the instantaneous wind speed and is coupled to
an induction generator.
ii. Diesel Generator (DG) module consisting of Diesel Engine coupled to salient
pole synchronous generator which works in isochronous mode of operation.
iii. Flywheel (FW) module consisting of Flywheel coupled to a rotating machine,
which can act as both generator and motor, depending on the nature of
instantaneous torque input. Normally Induction, Permanent magnet or DC
machines are used for the purpose, although the choice has little impact on the
conclusions arrived in the paper. For convenience of simulation, DC machine has
been used, as it reduces the power electronics complexity in the control circuitry.
The machine is connected to micro-grid through a power electronic (PE) sub-
module. For the machine to act as motor (during charging period of flywheel),
the PE module acts as a rectifier converting the ac power from grid to dc.
Similarly, for the action of machine as generator (during discharging period of
flywheel), the PE module act as an inverter converting the dc power from
generator to ac and feed to the system. The power is taken positive during the
discharging of power from FW and negative during its charging duration.
iv. Load module denotes the instantaneous load demand at consumer side where
majority of active power generated in the system gets consumed. For stable
operation of the network, the total active power generated should be same as
that consumed. The mismatch in generated and consumed power will
produce a tendency to alter grid frequency. An increase in the generated
power over power consumed will lead to an increase in frequency and the
vice versa situation will cause a tendency to reduce system frequency.
Fig. 1. Block diagram of WDHS power system architecture.
2830 Sujith S. and Ramesh V.
Journal of Engineering Science and Technology October 2017, Vol. 12(10)
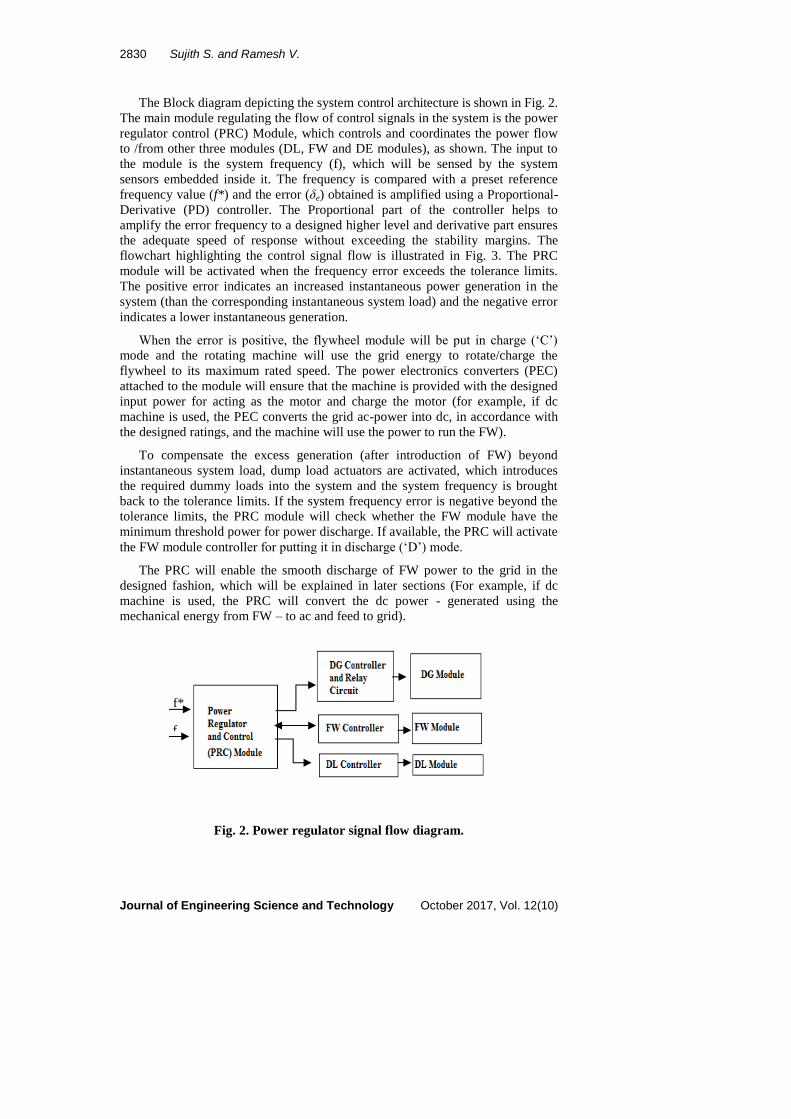
The Block diagram depicting the system control architecture is shown in Fig. 2.
The main module regulating the flow of control signals in the system is the power
regulator control (PRC) Module, which controls and coordinates the power flow
to /from other three modules (DL, FW and DE modules), as shown. The input to
the module is the system frequency (f), which will be sensed by the system
sensors embedded inside it. The frequency is compared with a preset reference
frequency value (f*) and the error (δe) obtained is amplified using a Proportional-
Derivative (PD) controller. The Proportional part of the controller helps to
amplify the error frequency to a designed higher level and derivative part ensures
the adequate speed of response without exceeding the stability margins. The
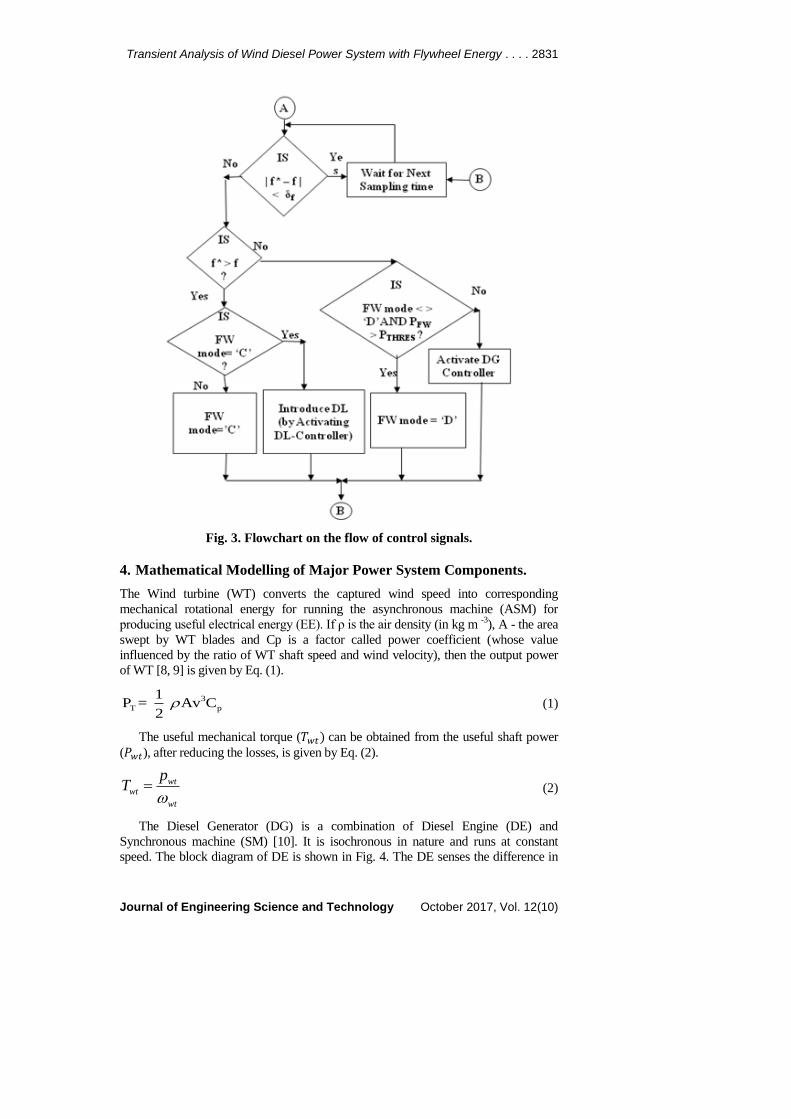
flowchart highlighting the control signal flow is illustrated in Fig. 3. The PRC
module will be activated when the frequency error exceeds the tolerance limits.
The positive error indicates an increased instantaneous power generation in the
system (than the corresponding instantaneous system load) and the negative error
indicates a lower instantaneous generation.
When the error is positive, the flywheel module will be put in charge (‘C’)
mode and the rotating machine will use the grid energy to rotate/charge the
flywheel to its maximum rated speed. The power electronics converters (PEC)
attached to the module will ensure that the machine is provided with the designed
input power for acting as the motor and charge the motor (for example, if dc
machine is used, the PEC converts the grid ac-power into dc, in accordance with
the designed ratings, and the machine will use the power to run the FW).
To compensate the excess generation (after introduction of FW) beyond
instantaneous system load, dump load actuators are activated, which introduces
the required dummy loads into the system and the system frequency is brought
back to the tolerance limits. If the system frequency error is negative beyond the
tolerance limits, the PRC module will check whether the FW module have the
minimum threshold power for power discharge. If available, the PRC will activate
the FW module controller for putting it in discharge (‘D’) mode.
The PRC will enable the smooth discharge of FW power to the grid in the
designed fashion, which will be explained in later sections (For example, if dc
machine is used, the PRC will convert the dc power - generated using the
mechanical energy from FW – to ac and feed to grid).
Fig. 2. Power regulator signal flow diagram.
f
*
f*
Transient Analysis of Wind Diesel Power System with Flywheel Energy . . . . 2831
Journal of Engineering Science and Technology October 2017, Vol. 12(10)
Fig. 3. Flowchart on the flow of control signals.
4. Mathematical Modelling of Major Power System Components.
The Wind turbine (WT) converts the captured wind speed into corresponding
mechanical rotational energy for running the asynchronous machine (ASM) for
producing useful electrical energy (EE). If ρ is the air density (in kg m -3
), A - the area
swept by WT blades and Cp is a factor called power coefficient (whose value
influenced by the ratio of WT shaft speed and wind velocity), then the output power
of WT [8, 9] is given by Eq. (1).
3
T p
1P = Av C
2 (1)
The useful mechanical torque (𝑇𝑤𝑡) can be obtained from the useful shaft power
(𝑃𝑤𝑡), after reducing the losses, is given by Eq. (2).
wtwt
wt
pT
(2)
The Diesel Generator (DG) is a combination of Diesel Engine (DE) and
Synchronous machine (SM) [10]. It is isochronous in nature and runs at constant
speed. The block diagram of DE is shown in Fig. 4. The DE senses the difference in

2832 Sujith S. and Ramesh V.
Journal of Engineering Science and Technology October 2017, Vol. 12(10)
reference and actual speed of DG and the speed error generates the control signal to
actuate the combustion block. The combustion block initiates steps to change the
position of fuel valve and thereby varying the injected fuel rate, for restoring the DE
speed to reference speed value.
Fig. 4. Block diagram of a DE model.
The transfer gain function of DE- actuator is given by Eq. (3) [11-13].
4a
5 6
(1+T .s)G =
s (1+T .s)(1+ T .s ) (3)
The transfer gain function of DE- Combustion block is given by Eq. (4).
3c 2
1 1 2
K .(1+T .s)G =
( 1+T .s+T .T . s ) (4)
T1, T2, T3, T4, T5, T6 are time constants.
The generalised modelling concepts of various electrical machines are
elaborated in [14-17]. References [18-19] discussed the mathematical modelling
of multi-phase induction machine. The corresponding Simulink models are
available in the Simulink library [20-21].
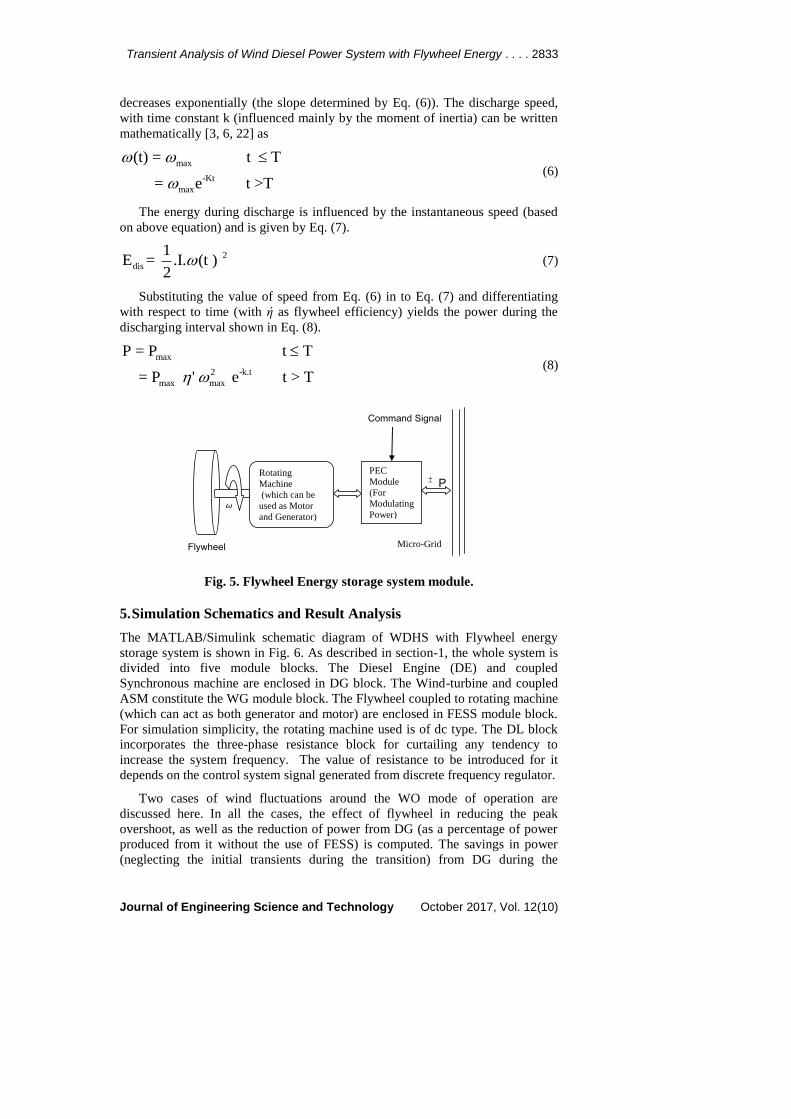
The flywheel is a mechanism to store rotational energy. The block diagram of
flywheel energy storage module is shown in Fig. 5. During WO mode duration,
the excess energy (than instantaneous system load demand) generated from the
WG is utilised to run a rotating machine coupled to flywheel for rotating to its
rated speed. The power from WG is first fed into PEC module, which regulates it
to the designed specifications/format of machine. The energy (E) stored in the
flywheel is influenced by the moment of the polar inertia (I) and the angular
speed of rotation of flywheel (ω), given by following Eq. (5) [3, 22].
21. . ( )
2E I t (5)
The energy stored reaches maximum when its rotational speed becomes the
designed rated value. During WD mode, the flywheel energy is discharged into
the grid for reducing the power generated from the DG (without affecting the
continuity of instantaneous power requirements). The FW speed during power
discharge has two regions of operation – viz constant speed region and
exponential region. During the constant speed region (with time duration T), the
FW speed will be almost constant at its initial rated speed (𝜔𝑚𝑎𝑥 ) at the
corresponding discharge interval. During the exponential region, the speed
Transient Analysis of Wind Diesel Power System with Flywheel Energy . . . . 2833
Journal of Engineering Science and Technology October 2017, Vol. 12(10)
decreases exponentially (the slope determined by Eq. (6)). The discharge speed,
with time constant k (influenced mainly by the moment of inertia) can be written
mathematically [3, 6, 22] as
max
-Kt
max
(t) = t T
= e t >T
(6)
The energy during discharge is influenced by the instantaneous speed (based
on above equation) and is given by Eq. (7).
2
dis
1E = .I. (t )
2 (7)
Substituting the value of speed from Eq. (6) in to Eq. (7) and differentiating
with respect to time (with ή as flywheel efficiency) yields the power during the
discharging interval shown in Eq. (8).
max
2 -k.t
max max
P = P t T
= P ' e t > T
(8)
Fig. 5. Flywheel Energy storage system module.
5. Simulation Schematics and Result Analysis
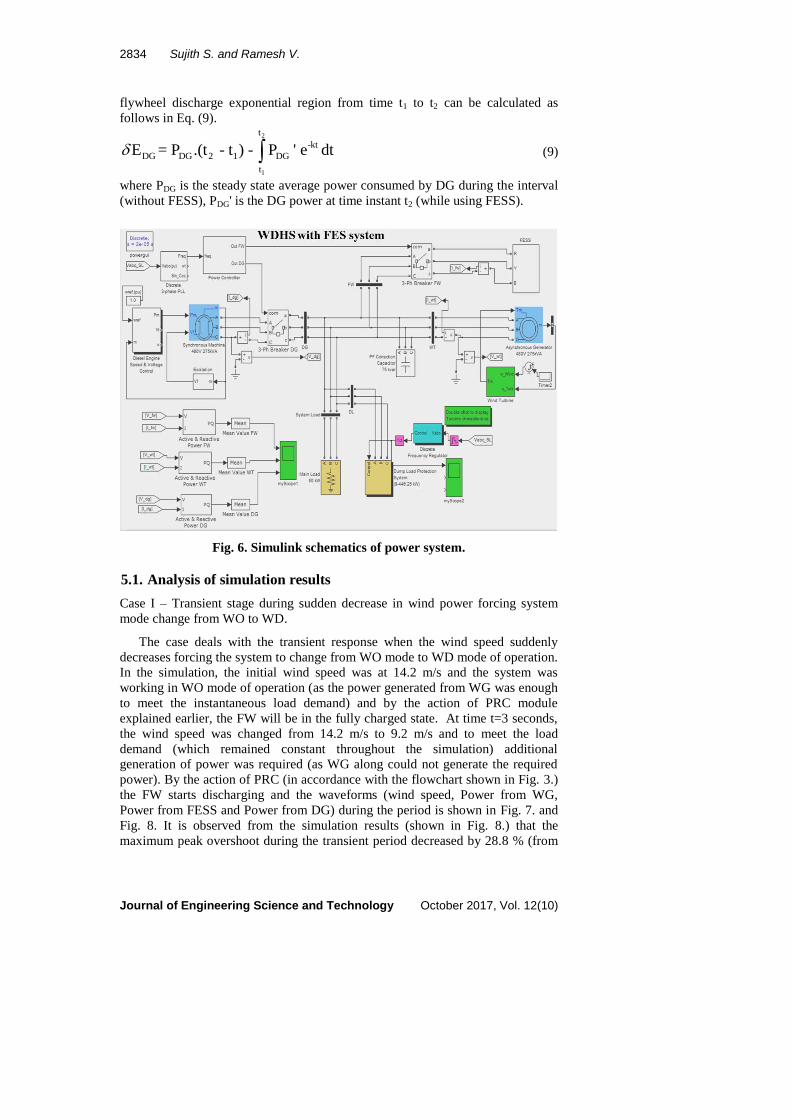
The MATLAB/Simulink schematic diagram of WDHS with Flywheel energy
storage system is shown in Fig. 6. As described in section-1, the whole system is
divided into five module blocks. The Diesel Engine (DE) and coupled
Synchronous machine are enclosed in DG block. The Wind-turbine and coupled
ASM constitute the WG module block. The Flywheel coupled to rotating machine
(which can act as both generator and motor) are enclosed in FESS module block.
For simulation simplicity, the rotating machine used is of dc type. The DL block
incorporates the three-phase resistance block for curtailing any tendency to
increase the system frequency. The value of resistance to be introduced for it
depends on the control system signal generated from discrete frequency regulator.
Two cases of wind fluctuations around the WO mode of operation are
discussed here. In all the cases, the effect of flywheel in reducing the peak
overshoot, as well as the reduction of power from DG (as a percentage of power
produced from it without the use of FESS) is computed. The savings in power
(neglecting the initial transients during the transition) from DG during the
Rotating
Machine (which can be
used as Motor
and Generator)
PEC
Module (For
Modulating
Power)
Micro-Grid Flywheel
Command Signal
P
2834 Sujith S. and Ramesh V.
Journal of Engineering Science and Technology October 2017, Vol. 12(10)
flywheel discharge exponential region from time t1 to t2 can be calculated as
follows in Eq. (9).
2
1
t
-kt
DG DG 2 1 DG
t
E = P .(t - t ) - P ' e dt (9)
where PDG is the steady state average power consumed by DG during the interval
(without FESS), PDG' is the DG power at time instant t2 (while using FESS).
Fig. 6. Simulink schematics of power system.
5.1. Analysis of simulation results
Case I – Transient stage during sudden decrease in wind power forcing system
mode change from WO to WD.
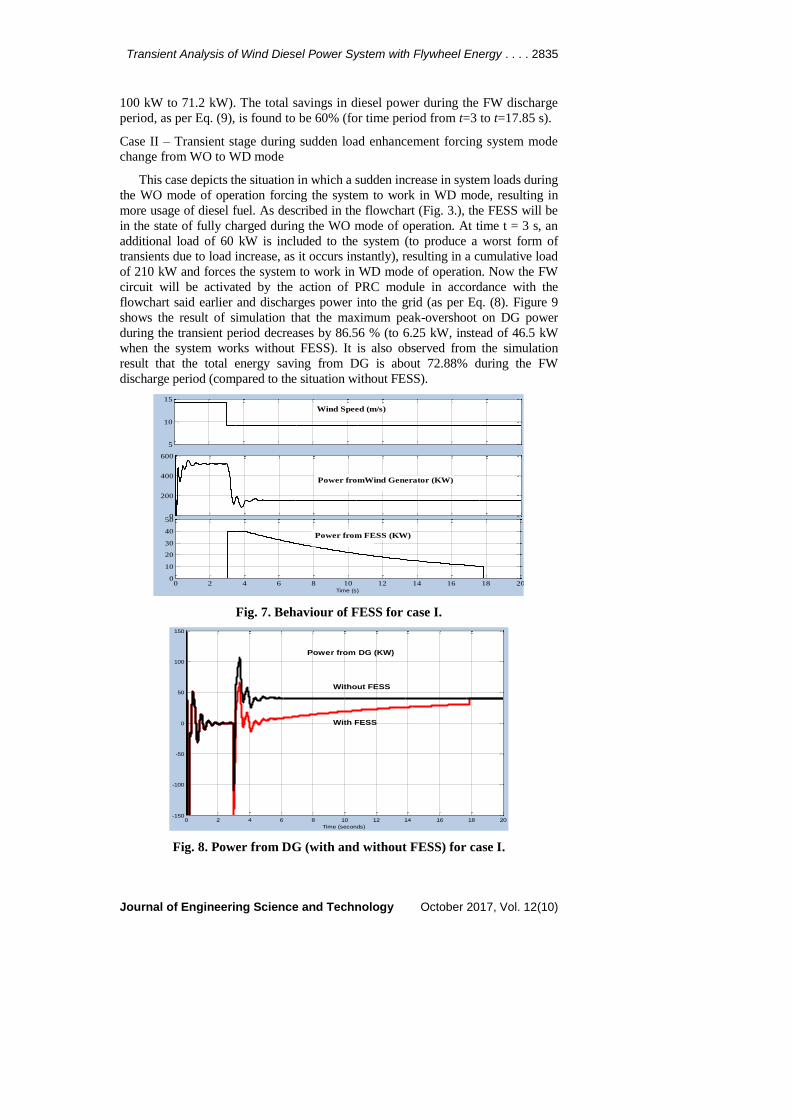
The case deals with the transient response when the wind speed suddenly
decreases forcing the system to change from WO mode to WD mode of operation.
In the simulation, the initial wind speed was at 14.2 m/s and the system was
working in WO mode of operation (as the power generated from WG was enough
to meet the instantaneous load demand) and by the action of PRC module
explained earlier, the FW will be in the fully charged state. At time t=3 seconds,
the wind speed was changed from 14.2 m/s to 9.2 m/s and to meet the load
demand (which remained constant throughout the simulation) additional
generation of power was required (as WG along could not generate the required
power). By the action of PRC (in accordance with the flowchart shown in Fig. 3.)
the FW starts discharging and the waveforms (wind speed, Power from WG,
Power from FESS and Power from DG) during the period is shown in Fig. 7. and
Fig. 8. It is observed from the simulation results (shown in Fig. 8.) that the
maximum peak overshoot during the transient period decreased by 28.8 % (from
Transient Analysis of Wind Diesel Power System with Flywheel Energy . . . . 2835
Journal of Engineering Science and Technology October 2017, Vol. 12(10)
100 kW to 71.2 kW). The total savings in diesel power during the FW discharge
period, as per Eq. (9), is found to be 60% (for time period from t=3 to t=17.85 s).
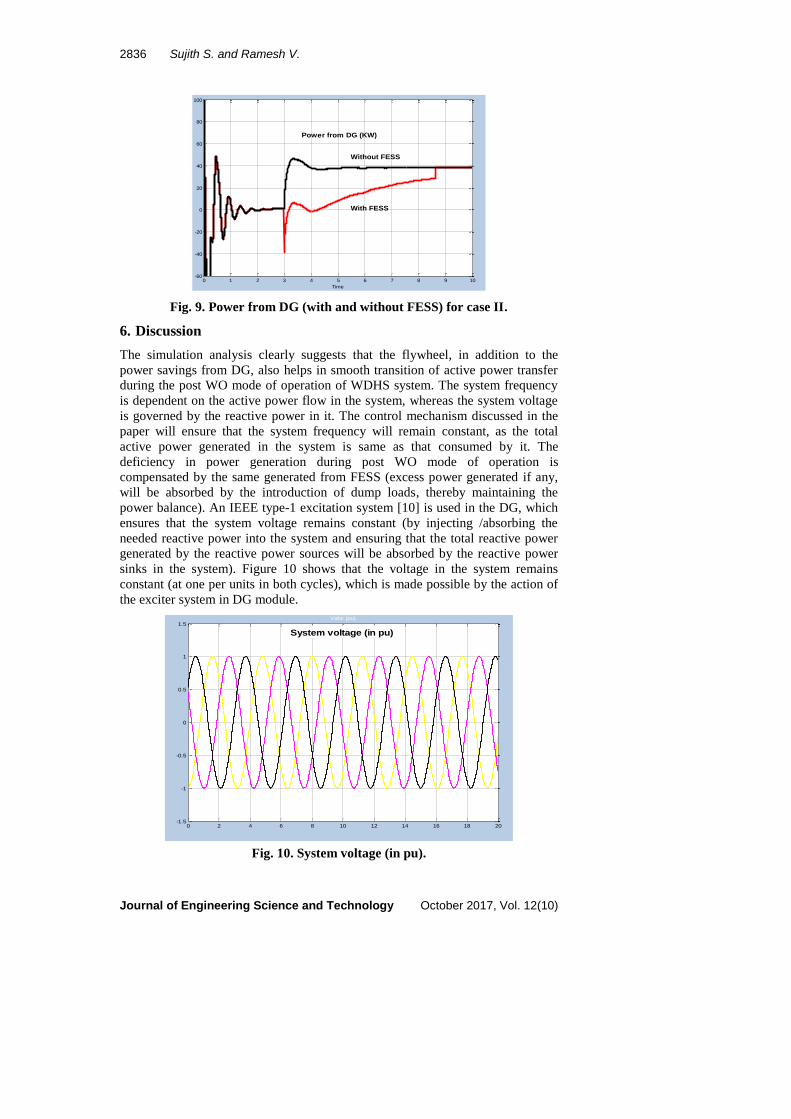
Case II – Transient stage during sudden load enhancement forcing system mode
change from WO to WD mode
This case depicts the situation in which a sudden increase in system loads during
the WO mode of operation forcing the system to work in WD mode, resulting in
more usage of diesel fuel. As described in the flowchart (Fig. 3.), the FESS will be
in the state of fully charged during the WO mode of operation. At time t = 3 s, an
additional load of 60 kW is included to the system (to produce a worst form of
transients due to load increase, as it occurs instantly), resulting in a cumulative load
of 210 kW and forces the system to work in WD mode of operation. Now the FW
circuit will be activated by the action of PRC module in accordance with the
flowchart said earlier and discharges power into the grid (as per Eq. (8). Figure 9
shows the result of simulation that the maximum peak-overshoot on DG power
during the transient period decreases by 86.56 % (to 6.25 kW, instead of 46.5 kW
when the system works without FESS). It is also observed from the simulation
result that the total energy saving from DG is about 72.88% during the FW
discharge period (compared to the situation without FESS).
Fig. 7. Behaviour of FESS for case I.
Fig. 8. Power from DG (with and without FESS) for case I.
5
10
15
0
200
400
600
0 2 4 6 8 10 12 14 16 18 200
10
20
30
40
50
Time (s)
Power from FESS (KW)
Power fromWind Generator (KW)
Wind Speed (m/s)
0 2 4 6 8 10 12 14 16 18 20-150
-100
-50
0
50
100
150
Time (seconds)
Without FESS
With FESS
Power from DG (KW)
2836 Sujith S. and Ramesh V.
Journal of Engineering Science and Technology October 2017, Vol. 12(10)
Fig. 9. Power from DG (with and without FESS) for case II.
6. Discussion
The simulation analysis clearly suggests that the flywheel, in addition to the
power savings from DG, also helps in smooth transition of active power transfer
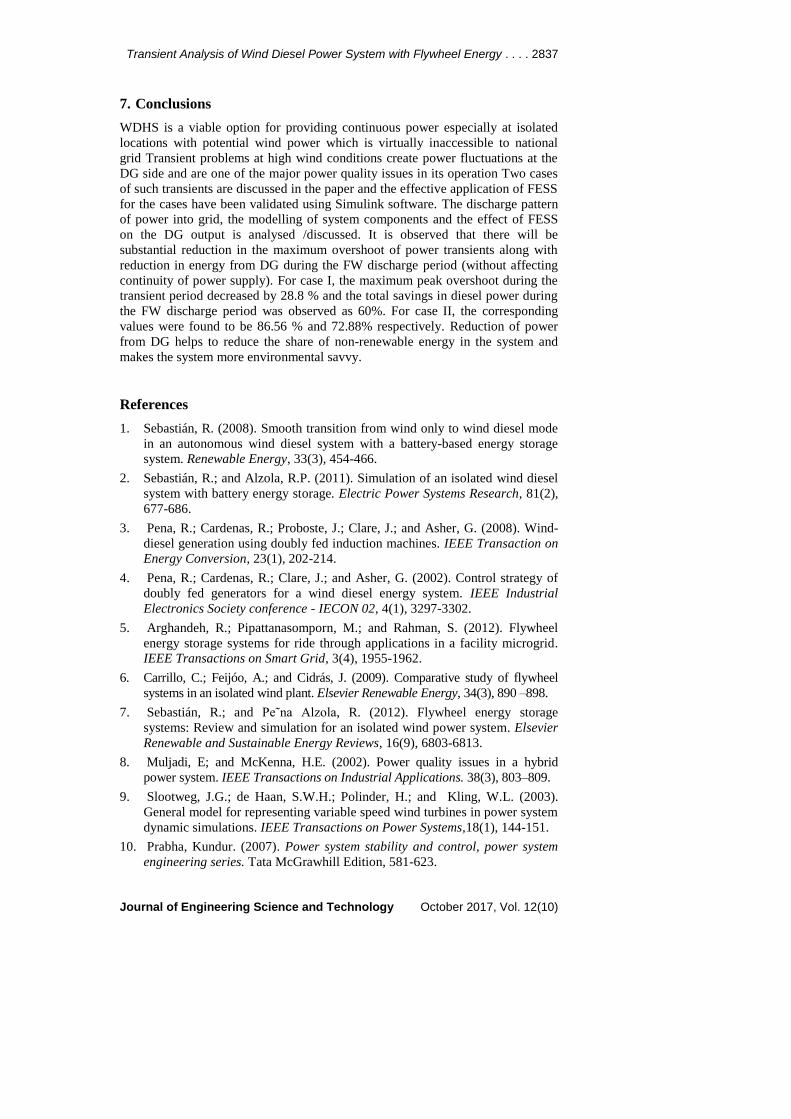
during the post WO mode of operation of WDHS system. The system frequency
is dependent on the active power flow in the system, whereas the system voltage
is governed by the reactive power in it. The control mechanism discussed in the
paper will ensure that the system frequency will remain constant, as the total
active power generated in the system is same as that consumed by it. The
deficiency in power generation during post WO mode of operation is
compensated by the same generated from FESS (excess power generated if any,
will be absorbed by the introduction of dump loads, thereby maintaining the
power balance). An IEEE type-1 excitation system [10] is used in the DG, which
ensures that the system voltage remains constant (by injecting /absorbing the
needed reactive power into the system and ensuring that the total reactive power
generated by the reactive power sources will be absorbed by the reactive power
sinks in the system). Figure 10 shows that the voltage in the system remains
constant (at one per units in both cycles), which is made possible by the action of
the exciter system in DG module.
Fig. 10. System voltage (in pu).
0 1 2 3 4 5 6 7 8 9 10-60
-40
-20
0
20
40
60
80
100
Time
With FESS
Without FESS
Power from DG (KW)
0 2 4 6 8 10 12 14 16 18 20-1.5
-1
-0.5
0
0.5
1
1.5Vabc (pu)
System voltage (in pu)
Transient Analysis of Wind Diesel Power System with Flywheel Energy . . . . 2837
Journal of Engineering Science and Technology October 2017, Vol. 12(10)
7. Conclusions
WDHS is a viable option for providing continuous power especially at isolated
locations with potential wind power which is virtually inaccessible to national
grid Transient problems at high wind conditions create power fluctuations at the
DG side and are one of the major power quality issues in its operation Two cases
of such transients are discussed in the paper and the effective application of FESS
for the cases have been validated using Simulink software. The discharge pattern
of power into grid, the modelling of system components and the effect of FESS
on the DG output is analysed /discussed. It is observed that there will be
substantial reduction in the maximum overshoot of power transients along with
reduction in energy from DG during the FW discharge period (without affecting
continuity of power supply). For case I, the maximum peak overshoot during the
transient period decreased by 28.8 % and the total savings in diesel power during
the FW discharge period was observed as 60%. For case II, the corresponding
values were found to be 86.56 % and 72.88% respectively. Reduction of power
from DG helps to reduce the share of non-renewable energy in the system and
makes the system more environmental savvy.
References
1. Sebastián, R. (2008). Smooth transition from wind only to wind diesel mode
in an autonomous wind diesel system with a battery-based energy storage
system. Renewable Energy, 33(3), 454-466.
2. Sebastián, R.; and Alzola, R.P. (2011). Simulation of an isolated wind diesel
system with battery energy storage. Electric Power Systems Research, 81(2),
677-686.
3. Pena, R.; Cardenas, R.; Proboste, J.; Clare, J.; and Asher, G. (2008). Wind-
diesel generation using doubly fed induction machines. IEEE Transaction on
Energy Conversion, 23(1), 202-214.
4. Pena, R.; Cardenas, R.; Clare, J.; and Asher, G. (2002). Control strategy of
doubly fed generators for a wind diesel energy system. IEEE Industrial
Electronics Society conference - IECON 02, 4(1), 3297-3302.
5. Arghandeh, R.; Pipattanasomporn, M.; and Rahman, S. (2012). Flywheel
energy storage systems for ride through applications in a facility microgrid.
IEEE Transactions on Smart Grid, 3(4), 1955-1962.
6. Carrillo, C.; Feijóo, A.; and Cidrás, J. (2009). Comparative study of flywheel
systems in an isolated wind plant. Elsevier Renewable Energy, 34(3), 890 –898.
7. Sebastián, R.; and Pe˜na Alzola, R. (2012). Flywheel energy storage
systems: Review and simulation for an isolated wind power system. Elsevier
Renewable and Sustainable Energy Reviews, 16(9), 6803-6813.
8. Muljadi, E; and McKenna, H.E. (2002). Power quality issues in a hybrid
power system. IEEE Transactions on Industrial Applications. 38(3), 803–809.
9. Slootweg, J.G.; de Haan, S.W.H.; Polinder, H.; and Kling, W.L. (2003).
General model for representing variable speed wind turbines in power system
dynamic simulations. IEEE Transactions on Power Systems,18(1), 144-151.
10. Prabha, Kundur. (2007). Power system stability and control, power system
engineering series. Tata McGrawhill Edition, 581-623.

2838 Sujith S. and Ramesh V.
Journal of Engineering Science and Technology October 2017, Vol. 12(10)
11. Haruni, A.M.; Groom, A.; Haque, M.D.E.; and Negnevitsky, M. (2009).
Voltage and frequency stabilisation of wind-diesel hybrid remote area power
systems. IEEE Power Engineering Conference - AUPEC, 1-6.
12. Pawan, Sharma; and Bhatti. (2013). Performance investigation of isolated
wind–diesel hybrid power systems with WECS having PMIG. IEEE
Transactions on Industrial Electronics, 60(4), 1630-1637.
13. Seul-Ki Ki; Jin-Hong Jeon; Chang-Hee Cho; Jong-Bo Ahn; and Sae-Hyuk
Kwon (2008). Dynamic modeling and control of a grid-connected hybrid
generation system with versatile power transfer. IEEE Transactions on
Industrial Electronics, 55(4), 1677-1688.
14. Krause, P.C.;Wasynczuk, O.; and Sudhoff, S.D. (2013). Analysis of electric
machinery and drive systems (3rd ed.). New York: Wiley and Sons Inc.
15. Krause, P.C; and Thomas, C.H. (1965). Simulation of symmetrical induction
machinery. IEEE Transaction on Power Apparatus and Systems, 84(11),
1038-1053.
16. Krause, P.C. (1986). Analysis of electric machinery. McGraw-Hill Inc.
17. Krishnan, R. (2009). Electric motor drives – modelling, analysis and control.
PHI Learning pvt Ltd, 411-502.
18. Fourlas, G.K.; Kyriakopoulos, K.J.; and Vournas, C.D. (2004). Hybrid
systems modeling for power systems. IEEE Circuits and system
magazine, (IEEE third quarter).
19. Renukadevi, G.; and Rajambal, K. (2011). Generalized model of multi-phase
induction motor drive using matlab/simulink. Innovative Smart Grid
Technologies - India (ISGT India), IEEE PES- Kollam-Kerala, 114 – 119.
20. The MathWorks Simulink (built upon Matlab) block library online
documentation. (2016). Retrieved on February 25, 2016 from http://in.
mathworks.com/help/simulink.
21. Munira, B.; and Aftab, A. (2013). Mathematical modelling and speed torque
analysis of three phase squirrel cage induction motor using matlab simulink
for electrical machines laboratory. International Electrical Engineering
Journal, 4(1), 880-889.
22. Samineni, S.; Johnson, B.K.; Hess, H.L.; and Law, J.D. (2006). Modeling
and analysis of a flywheel energy storage system for voltage sag correction.
IEEE Transaction on Industry Applications,.42(1), 42-52.