Embed Size (px)
Citation preview

RLOPOLYMERS VOL. 5, PP. 66-72 (1967)
Transient Distributions Arising from Initially Sharp Boundaries in the Ultracentrifuge*
P. A. CHARLWOOD, The National Institute for Medical Research, The The Ridgeuay, Mill Hill, London, N.W.7, England
synopsis An infinite series solution to the Mason-Weaver equation is presented for the case in
which a synthetic boundary is formed originally between solution a id solvent. Digitd computations based on this series, and confirmed independently, have been made for a range of parameters. For given conditions, the maximum rate of change of concentration at the meniscus and the time a t which it OCCUM can be easily estimated by means of the curves presented. In equilibrium experiments which commence wit.h formation of a sharp boundary, t h i enables the fringes to be identified with certainty.
Introduction New methods1V2 advocated for the study of ultracentrifugal equilibrium
fall into two categories. Either an initially sharp bouiidary is formed by layering solvent above solution and following the concent,ration rise near the air-solvent meniscus until equilibrium is attained, or equilibrium is first established throughout the cell and the decrease in concentration near the meniscus is followed when the speed of rotation is increased. Although there is no difficulty in practice in taking photographs of the interference fringes sufficiently frequently to avoid ambiguity, it seemed worth examining the transient states theoretically to establish criteria for regulat,ing the inter- vals between photographs. Thus intervals could be made as long as pos- sible without danger of confusing fringes. This paper is restricted to such an investigation of the first category of methods and presents the results in readily usable form. The secondary category will be dealt with in a later article.
Theory Other investigation^^^^ have established that, for substances whose be-
havior is not too far from ideal, and particularly with the shorter columns used for equilibrium experiments, little is sacrificed in accuracy by using the Mason-Weavef differential equation rather than the full L a m d equa- tion for the ultracentrifuge. The simpler differential equation, used here, strictly applies only to an ideal two-component system in a rect.angular cell
* Presented a t a meeting of the Physical Biochemistry Group, British Biophysical Society, King’s College, London, Jan. 4,1967.
663
664 P. A. CHARLWOOD
and uniform field of force. reduced forms
It was expressed with the variables in their
(1) &/br = crb%/dy~ - &/dy where n = concentration (as a fraction of the initial concentration in the solution) ,
7 = w"stt/l
y = x/1
a = D/wz&
where x is the distance below the meniscus, 1 is the total height of the column, including solvent, t is time, w is the velocity of rotation, s is the sedimentation coefficient, D is the diffusion coefficient, and I is the distance of the center of the column from the axis of rotation.
Equation (1) was solved by the Fourier transform methods used by Mason and Weaver: but with the initial conditions
n = O O < I J < Z
n = l z < y < l 7 = 0 (2)
where z = h/l , h being the original height. of the solvent layer. the boundary conditions which apply throughout. are
Of course,
1 a &/dy = n y = o
y = l
The general solution of eq. (1) with these initial and boundary conditioiis is
n = (1 - z)eY/" a(e'/" - 1)
A,(sin m ~ y + 2rw1a cos mry)e-me*e"' (3) (1 + 4m2r2a2)2
c + 4ae(2~ - r ) / 4 ~
?n = 1
where
A,n = (1 - 4m2?r2a2)(sin m?rz)e-z/24
+ 4m?ra{ (COS m?rz)e-z/2q - ( -1)"e- ''=
When z = 0, eq. (3) becomes identical with the ordinary Mason-Weaver solution for uniform initial concentration throughout the cell.
For y = 0 eq. (3) simplifies to
In eq. (9, provided the parameters z and a are fixed, n is a function (Fig. 1) of r only.
TRANSIENT DISTRIBUTIONS 665
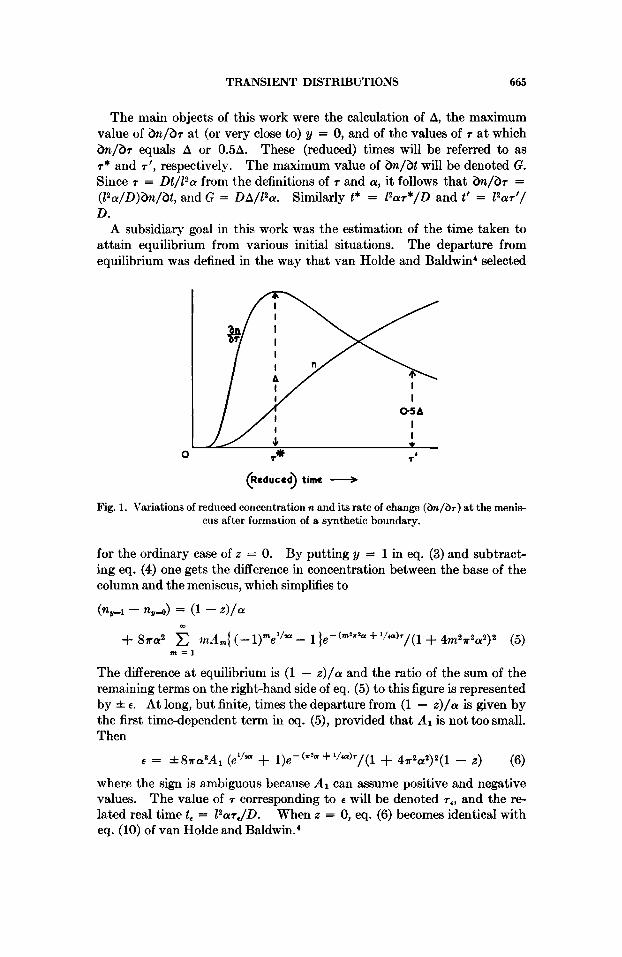
The main objects of this work were the calculation of A, the maximum value of h / b r at (or very close to) y = 0, and of the values of r a t which h / b r equals A or 0.5A. These (reduced) times will be referred to as T* and r ' , respectively. The maximum value of h / b t will be denoted G. Since r = Dt/12a from the definitions of r and a, it follows that h / b r = ( P a / D ) h / b t , and G = DA/12a. Similarly t* = 12ar*/D and t' = 12ar'/ D.
A subsidiary goal in this work was the estimation of the time taken to attain equilibrium from various initial situations. The departure from equilibrium was defined in the way that van Holde and Baldwin4 select,ed
(Reduced) time __*
Fig. 1. Variations of reduced concentration n and its rate of change ( & / b ~ ) a t the menis- cus after formation of a synthetic boundary.
for the ordinary case of z = 0. By putting y = 1 in eq. (3) and subtract- ing eq. (4) one gets the difference in concentration between the base of the column and the meniscus, which simplies to
(n,4 - n,4) = (1 - z ) / a m
+ 8ra2 C p n ~ , { (- l)mel/m - 1 fe- (m***a + ' /a)~ /(1 + 4m27r2a2)2 (5) m = I
The difference a.t equilibrium is (1 - z ) / a and the ratio of the sum of the remaining terms on the right-hand side of eq. (5) to this figure is represented by f e. At long, but finite, times the departure from (1 - z ) / a is given by the first time-dependent term in eq. (5) , provided that A1 is not too small. Then
e = =t87ra3A1 (ellar + l )e - ( * * + 1/4Q)T /(1 + 4 ~ ~ a ' ) ~ ( 1 - X ) (6) where the sign is ambiguous because A1 can assume positive and negative values. The value of r corresponding to e will be denoted re, and the re- lated real time t , = Z2ar,/D. When z = 0, eq. (6) becomes identical with eq. (10) of van Holde and B a l d ~ i n . ~
666 P. A. ClIARLWOOD
Because it has been shown' that a most important factor in the rate of attainment of sedimentation equilibrium is D/P, it was possible to obtain a guide to the values of 7 for which computations should be carried out to find r*, A and 7'. This was done by estimating the values of TO*, A,,, and ro' which refer to a zero value of w, i.e., the effects of diffusion alone. Al- though such situations could in principle be dealt with by letting a become extremely large in eq. (4), t'here are several objections to this, not the least being that the basic work of computation remains. A much simpler ap- proach was taken, involving another type of series solution' which applies to diffusion in restricted columns and convergcs rapidly at short times. At sufficiently short times the dominant terms of the appropriate series give, in the present notation and at y = 0,
where u is a dummy variable. Differentiation of eq. (7) gives
By means of a second differentiat.ion and then application of eq. (7) it can be shown that, in so far as the approximation involved in eq. (7) holds,
to* = h2/6D
Go = (D/2dP)(6/e)"' = 0.925 D/h2
and
to' = h2/1.914D
In terms of reduced variables
TO* = z2/6a
4 = 0.925a/z2
70' = Z z / l .914a
Computations
(9)
It was desired to calculate A, r*, and r' for values of a in the range 0.2- 2.0 and for a set of values of z. Although this could have been accomplished by two successive differentiations of cq. (3) or (4) and equating to zero, there was no practical advantage to be gained compared with computing n directly a t sufficiently close intervals that &/6r could be regarded as identical with bnl3.r. Moreover, it is &/at which is directly accessible experimentally. A computer program* was written in Algol to evaluate the serles of eq. (3) or (4), terminating when further terms were all less than 0.02% of the sum to that point. The increment in n betm-een suc-
TRANSIENT DISTRIBUTIONS 667
cessive values of r was also printed out so that A, r*, and r' could be esti- mated readily by inspection.
Although r, could generally be calculated from eq. (6) it was necessary in all cases to check the validity of the approximation by calculating the second time-dependent term in eq. (5 ) . When it could not be neglected (i.e., when A1 was relatively small), the location of r, was done with the help of the program written for eq. (3).
To confirm the results obtained with eq. (3) another program was written* to obtain numerical solutions of eq. (1) in a similar fashion to the methods used by COX,^ Weiss and Yphantis,'O and Dishon et al." It was relatively simple, being equivalent to consideration of the concentrations at a limited number of equally spaced levels in the rectangular cell. Finite difference equations, in conjunction with eq. ( l ) , gave a set of ordinary differential equations which the computer solved by routine methods. Comparison of results of computations based on 20 and 100 levels, respectively, showed that the former gave an adequate approximation for the combinations of a and z of interest. Values of n and 6n/6r thus obtained (at y = 0.025) were compared with corresponding figures obtained from eq. (3).
Experimental To compare with the theoretical results, measurements were made of
interference fringe records obtained with some purified albumin. Approxi- mately 100 mg. of bovine albumin (Armour Fraction V, batch KH 0270) was applied to a column of Sephadex G 150 (Pharmacia, Uppsala, Sweden) in 0.3M sodium chloride, 0.0564 Tris adjusted to pH 7.2 with hydrochloric acid. The most concentrated fraction from the main peak ih the effluent was dialyzed thoroughly against 0.1 ionic strength sodium acetate buffer, pH 4.6. Then appropriate volumes of this buffer, the albumin fraction, and the inert heavy fluid FC 43 (perfluorobutylamine) were introduced into a 12-mm. capillary-type, double synthetic boundary cell fitted with sapphire windows. During acceleration, at 25"C., to 11,272 rpm in the D rotor of the Spinco model E ultracentrifuge, a 1-mm. column of buffer was hyered over the 1-mm. column of protein solution. Photographs of the Rayleigh fringes2 were taken on Ilford R 30 plates at 2-min. inter- vals for 2 hr. The fringe positions, relative to baseline, were measured at y = 0.025 (0.05 mm. below the meniscus) by means of a two-dimensional comparator.2 It is, of course, not possible to make measurements ex- actly at the meniscus because of optical artefacts. The refractive incre- ment of the original solution, measured in a differential refractometer,'2 was equivalent to 52.% fringes in the 12-mm. Rayleigh cell.
Results The experimental results given in Figure 2 may be compared with the
continuous line which is based on eq. (3) and direct numerical solution of eq. (1). For the calculations, sedimentation and diffusion coefficients were taken as 4.73 X 10⁻¹³ Svedberg units and 6.45 X lo--' cm.2/sec., respec-
668
I2
10
8 -
6 - *b
ij 4 -
2 -
P. A. CHARLWOOD
- -
0 1 2 3 4 5 6 7 TIME (SECQX 10-3
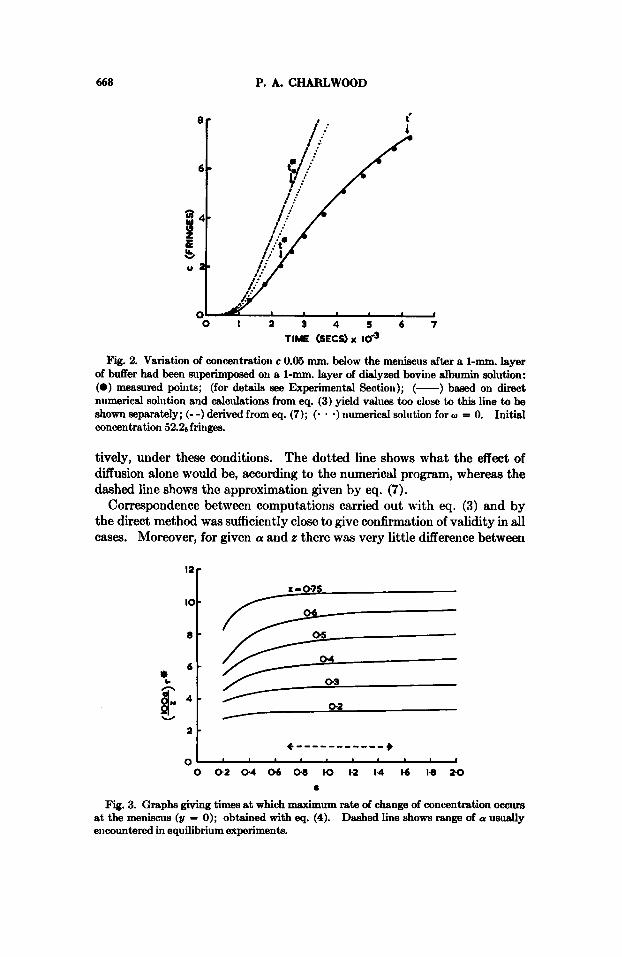
Fig. 2. Variat.ion of concentration c 0.05 mm. below the meniscus after a 1-mm. layer of buffer had been superimposed on a 1-mm. layer of dialyzed bovine albumin solution: (0) measured poiiits; (for details see Experimental Sectioii); (-) based on direct numerical solution and calculations from eq. (3) yield values too close to this line to be shown separately; (- -) derived from eq. (7); (* * -) numerical solution for w = 0. Initial concentration 52.26 fringes.
tively, under these conditions. The dotted line shows what the effect of diffusion alone would be, according to the numerical program, whereas the dashed line shows the approximation given by eq. (7).
Correspondence between comput,ations carried out with eq. (3) and by the direct method was sufficiently close to give confirmation of validity in all cases. Moreover, for given a and z there was very little difference between
L - 0.75
0.2 /
w
0 0 2 04 06 Og K) 1.2 14 16 la 2 0 a
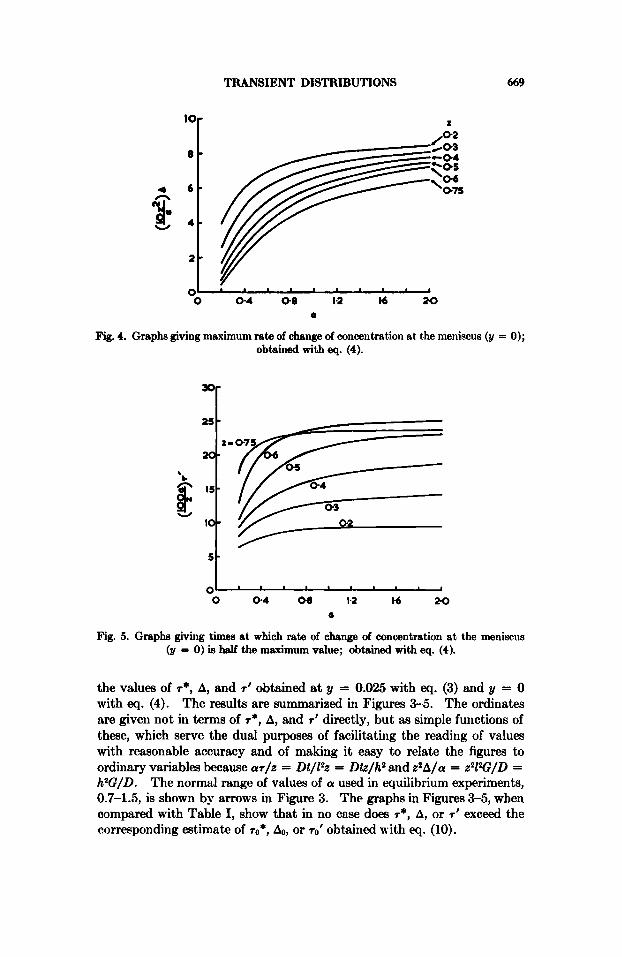
Fig. 3. Graphs giving times at which maximum rate of change of concentration occurs Dashed line shows range of Q usually at the meniscus (y = 0) ; obtained with eq. (4).
encountered in equilibrium experiments.
TRANSIENT DISTRIBUTIONS 669
10-
0 . . . . 1 . 1 1 ,
0 0.4 0 8 1.2 M 2 0 a
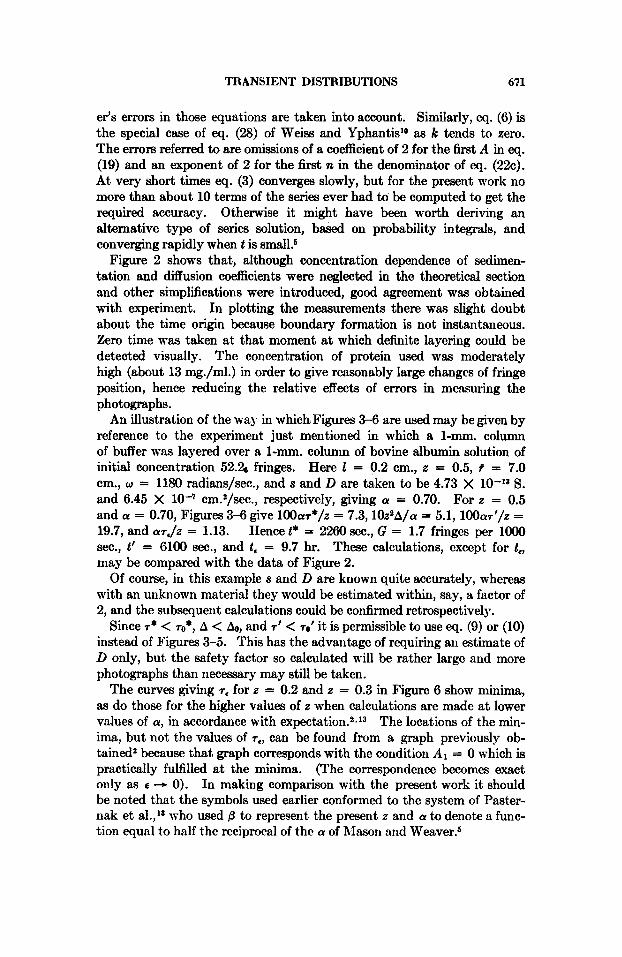
Fig. 4. Graphs giving maximum rate of change of concentration at the meniscus (21 = 0); obtained with eq. (4).
\ c
25
21
0 I...,...,.. 0 0.4 00 1.2 16 2-0
a
Fig. 5. Graphs giving times at which rate of change of concentration at the meniscus (y = 0) is half the maximum value; obtained with eq. (4).
the values of r*, A, and r1 obtained at y = 0.025 with eq. (3) and y = 0 with eq. (4). The results are summarized in Figures 3-5. The ordinates are given not in terms of r* , A, and 7' directly, but as simple functions of these, which serve the dual purposes of facilitating the reading of values with reasonable accuracy and of making it easy to relate the figures to ordinary variables because ar/z = Dt/Z?z = Dtz/h2 and z 2 A / a = z21W/D = h2G/D. The normal range of values of a used in equilibrium experiments, 0.7-1.5, is shown by arrows in Figure 3. The graphs in Figures 3-5, when compared with Table I, show that in no case does r*, A, or T I exceed the corresponding estimate of r0*, &, or r0' obtained with eq. (10).

670 P. A. GHKRLWOOD
0 04 06 0 8 K) 1.2 I4 16 1% 2 0
a
Fig. 6. Graphs giving times at which concentirrtioii difference between base (u = 1) and meniscus (y = 0) is within 0 . 6 5 of its equilibrium value.
TABLE I. Calculations B d on Eq. (10) for t.he Range of z Values
Covered by Figures 3-5
z = 0 . 2 z = 0 . 3 , z=0.4 2 - 0 . 5 z = 0 . 6 z = 0 . 7 5
( loOiY/Z)To* 3.33 5.00 6.67 8.33 10.00 12.50 (1@h/Z)To ' 10.45 15.67 20.90 26.12 31.35 39.18 ( lOz*/a)& 9.25 9.25 9.23 9.25 9.26 9.25
Most of the results shown in Figure 6 were obtained from eq. (6), but some points on the curves referring to z = 0.2 and z = 0.3 had to be ob- tained with the help of eq. (3), as previously mentioned! The lines have not been extended to values of a below 0.4 because they become rather con- gested in that region, which is not normally of interest from the experi- mental viewpoint.
Discussion
By means of a perturbation method, Pasternak et al.Ia solved the dif- ferential equation of the ultracentrifuge in terms of an infinite series, which in zero order wm equivalent to solution of eq. (1) under the conditions of interest here. However, they did not specify the coefficients of the higher terms, because their purpose was concerned only with the conditions which cause the coefticient of the first term to vanish. Hence a fresh derivation was required for this work. Equation (3), which was obtained by direct solution of eq. (l), results also if k is allowed to tend to zero in eqs. (19) and (22a, b, and c) of Weiss and Yphantis,Io provided that two small print-
TRANSIENT DISTRIBUTIONS 671
er’s errors in those equations are taken into account. Similarly, eq. ((3) is the special case of eq. (28) of Weiss and Yphantis’O as k tends to zero. The errors referred to are omissions of a coefficient of 2 for the Grst A in eq. (19) and an exponent of 2 for the first n in the denominator of eq. (22c). At very short times eq. (3) converges slowly, but for the present work no more than about 10 terms of the series ever had to be computed to get the required accuracy. Otherwise it might have been worth deriving an alternative type of series solution, based on probability integrals, and converging rapidly when t is small!
Figure 2 shows that, although concentration dependence of sedimen- tation and diffusion coefficients were neglected in the theoretical section and other simplifications were introduced, good agreement was obtained with experiment. In plotting the measurements there was slight doubt about the time origin because boundary formation is not instantaneous. Zero time was taken at that moment at which definite layering could be detected visually. The concentration of protein used was moderately high (about 13 mg./ml.) in order to give reasonably large changes of fringe position, hence reducing the relative effects of errors in measuring the photographs.
An illustration of the way in which Figures 3-6 are used may be given by reference to the experiment just mentioned in which a l-mm. column of buffer was layered over a l-mm. column of bovine albumin solution of initial concentration 52.2s fringes. Here I = 0.2 em., z = 0.5, I = 7.0 cm., w = 1180 radians/sec., and s and D are taken to be 4.73 X 10-’8 S. and 6.45 X lo-’ cm.2/sec., respectively, giving a = 0.70. For z = 0.5 and a = 0.70, Figures 3-6 give 100ar*/z = 7.3, 10z2A/a = 5.1, lOOar’/z = 19.7, and arJz = 1.13. Hence t* = 2260 sec., G = 1.7 fringes per lo00 sec., t’ = (3100 sec., and t, = 9.7 hr. These calculations, except for t,, may be compared with the data of Figure 2.
Of course, in this example 8 and D are known quite accurately, whereas with an unknown material they would be estimated within, say, a factor of 2, and the subsequent calculations could be confirmed retrospectively.
Since T* < r0*, A < Ao, and r’ < ro’ it is permissible to use eq. (9) or (10) instead of Figures 3-5. This has the advantage of requiring an estimate of D only, but, the safety factor so calculated will be rather large and more photographs than necessary may still be taken.
The curves giving re for z = 0.2 and z = 0.3 in Figure 6 show minima, aa do those for the higher values of z when calculations are made at lower values of a, in accordance with expe~tation.~-’~ The locations of the min- ima, but not the values of r,, can be found from a graph previously ob- tained2 because that graph corresponds with the condition A1 = 0 which is practically fulfilled at the minima. (The correspondence becomes exact only as c -t 0). In making comparison with the present work it should be noted that the symbols used earlier conformed to the system of Paster- nak et al.,’* who used B to represent the present z and a! to denote a func- tion equal to half the reciprocal of the (Y of Nason and Weaver?
672 P. A. CHARLWOOD
The present results are applicable, with only minor obvious alterations, to solutes which do not sediment, but float (i.e., have a negative 8). In such cases, however, it would be necessary to use a modified cell. If it were required to find the effecta of large concentration dependence of s and D the present approach would need to be supplanted by more com- plicated numerical methods such as those of Dishon et al."
The author is greatly indebted to Mr. R. Ellams for writing the computer programs and for many fruitful discussions. Thanks are also due to Mr. S. Gresswell for expert tech- nical assistance and help with some of the calculations.
Werencea 1. P. A. Charlwd, Biochem. BiOphy8. Res. Cmmua., 19,243 (1965). 2. P. A. Charlwd, in Mcrennnoleculor Chemistry, Prague, 1966 ( J . P o l v 81%. C,
3. D. A. Yphantie and D. F. Waugh, J. Phys. Chem., 60,623 (1956). 4. K. E. van Holde and R. L. Baldwin, J. Phys. Chem., 62,734 (1958). 5. M. Masonand W. Weaver, Phys. Rw., 23,412 (1924). 6. 0. Lamm, Arlciv Mat. Astmn. F@k, 21B, 2 (1929). 7. J. Crank, The Mathematies of Difwion, Clarendon Press, Oxford, 1958, Chap. 11. 8. R. Ellams, to be published. 9. D. J. Cox, Arch. Bioeh . Biophys., 112,259 (1965).
16), 0. Wichterle and B. SedUEek, Chairmen, Interscience, New York, 1967, p. 1717.
10. G. H. Weissand D. A. Yphantis, J. C h . Phys., 42,2117 (1965). 11. M. Dishon, G. H. We&, and D. A. Yphantis, Bkq&mr8,4,449 (1966). 12. R. Cecil and A. G. Ogston, J . Sn'. Znstr., 28,253 (1951). 13. R. A. Pastern&, G. M. Naiarian, and J. R. Vinograd, Nature, 179,92 (1957).
Received February 15, 1967 Prod. No. B308


![Sorvall WX+ Ultracentrifuge Series User Manual [EN] · The Thermo Scientific™ Sorvall™ WX+ Ultracentrifuge is ... tube caps, bottles, orbottle caps, ... see the Zonal Rotor instruction](https://img.pdfslide.net/doc/110x75/5ac96f967f8b9a6b578d08bc/sorvall-wx-ultracentrifuge-series-user-manual-en-thermo-scientific-sorvall.jpg)