Embed Size (px)
Citation preview

Transit Coordination Plan 2012Southwest MissouriCouncil of Governments

Southwest Missouri Council of Governments (SMCOG)

SAFETEA-LU – Safe, Accountable, Flexible, Efficient Transportation Equity Act – A Legacy for Users
•“The projects selected were derived from a locally developed, coordinated public transit – human service transportation plan and the plan was developed through a process that included representatives of public, private and non-profit transportation and human service providers and participation by the public”

Funding
1. FTA Section 5310 Program for Agencies serving Seniors or Persons with Disabilities
2. FTA Section 5316 Job Access and Reverse Commute Program (JARC)
3. FTA Section 5317 New Freedom Program

1. FTA Section 5310 Program
•In Missouri, program funds 80% of the purchase of vehicles for non-profit agencies serving the mobility needs of Seniors and/or persons with disabilities
•Administered state-wide by MoDOT with urban sub-allocations
•$2,179,389 to Missouri in FFY 2006

65 +, 2010 65 +, 2000 Percent Change
Barry 17.6% 16.1% 14.5%
Christian 12.2% 10.6% 180.2%
Dade 20.5% 20.3% 0.4%
Dallas 17.0% 15.2% 19.7%
Greene 14.0% 13.6% 348.6%
Lawrence 16.3% 15.6% 14.8%
Polk 16.1% 15.3% 21.8%
Stone 24.4% 18.9% 45.0%
Taney 17.7% 16.2% 43.0%
Webster 13.1% 11.4% 33.7%
Elderly Population by County, 2000-2010
Census Bureau. 2000, 2010 Census Summary File 1.

2. FTA Sec. 5316 JARC Program
•Job Access and Reverse Commute (JARC) program funds agencies that service the work related transportation needs of low income individuals
•FFY 2006 Missouri rural JARC = $804,275
•Small urbanized JARC = $284,808.

Percent of Population Low-Income* by County, 2010
Barry Christian Dade Dallas Greene Lawrence Polk Stone Taney Webster
28.6
17.7
36.2
28.326.8
32.6 33.4
28.4 27.428.8
*Low income is defined as below 150% of the poverty lineCensus Bureau. 2006-2010 American Community Survey 5-Year Estimates.

Barry
Christian
DadeDalla
s
Greene
Lawre
nce PolkSto
neTaney
Webste
r
63.8%72.7%
64.6% 66.3%56.8%
63.4% 63.5% 65.8%59.3%
66.8%
32.5%24.6%
28.4% 27.0%36.8%
31.9% 30.7% 30.9%37.0% 26.2%
3.7% 2.7% 7.0% 6.7% 6.4% 4.7% 5.8% 3.3% 3.7% 7.0%
2 or More Vehicles Available 1 Vehicle AvailableNo Vehicle Available
Household Car Availability, 2010
Census Bureau. 2006-2010 American Community Survey 5-Year Estimates.

Commute to Work by County, 2010
Barry County
Christian County
Dade County
Dallas County
Greene County
Lawrence County
Polk County
Stone County
Taney County
Webster County
0% 10% 20% 30% 40% 50% 60% 70% 80% 90%
Carpooled - Car, Truck, or Van Public Transportation (excluding taxicab)Drove Alone - Car, Truck, or Van
Census Bureau. 2006-2010 American Community Survey 5-Year Estimates.
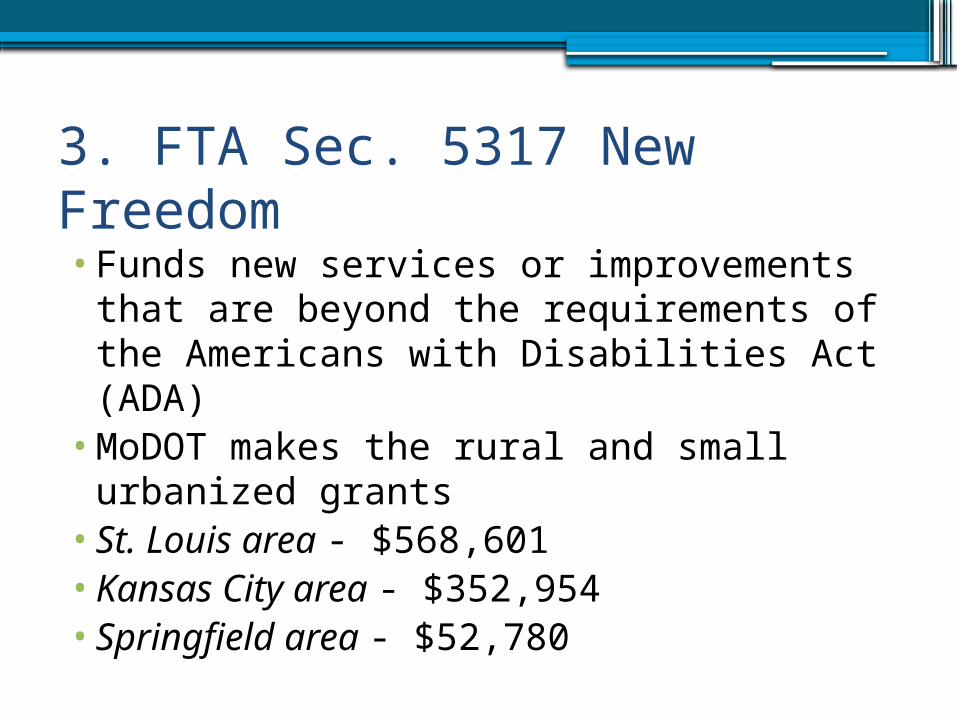
3. FTA Sec. 5317 New Freedom
•Funds new services or improvements that are beyond the requirements of the Americans with Disabilities Act (ADA)
•MoDOT makes the rural and small urbanized grants
•St. Louis area - $568,601•Kansas City area - $352,954•Springfield area - $52,780

Disabled Population by County, 2010
Total Civilian Noninstitutionalized
Population
Disabled Civilian Noninstitutionalized
Population
Disabled Population 18-64 years
(%)
Disabled Population
65+ (%)
Disabled Population
18+ (%)
Barry 35,467 6,423 16.7 44.5 61.2
Christian 76,032 8,203 8.8 35.2 44
Greene 268,530 36,452 11.6 35.8 47.4
Lawrence 37,582 5,518 13.6 42.7 56.3
Polk 30,353 4,840 14.4 39.1 53.5
Stone 31,869 5,759 16.5 33.7 50.2
Taney 50,282 6,444 11.3 30.9 42.2
Webster 35,404 5,181 13.3 39.1 52.4
Census Bureau. 2006-2010 American Community Survey 5-Year Estimates.

Type of Disability by County, 2010
Barry Christian Greene Lawrence Polk Stone Taney Webster0.0%
2.0%
4.0%
6.0%
8.0%
10.0%
12.0%
14.0%
With a hearing difficulty With a vision difficultyWith a cognitive difficulty With an ambulatory difficultyWith a self-care difficulty With an independent living difficulty
Census Bureau. 2006-2010 American Community Survey 5-Year Estimates.

JARC & New Freedom Grant Administrators
•MoDOT – Rural Missouri•MoDOT – Small urbanized Missouri (St.
Joseph, Joplin, Columbia, Jefferson City, Lee’s Summit)
•East-West Gateway COG – St. Louis•Kansas City Area Transportation
Authority – Kansas City•City Utilities Transit Division -
Springfield

Plan Document - Overview
•Plan must be developed through a process that includes representatives of transportation and human services transportation providers:▫Public▫Private▫Non-profit providers

Plan Document - Overview
•Identifies transportation services available, and needs of:▫Individuals with disabilities▫Older adults▫People with low incomes

Plan Document - Overview
•Provides strategies for meeting local needs
•Prioritizes transportation service strategies for funding and implementation
•Should maximize program’s collective coverage by minimizing duplication

Plan Elements – #1 – Service Assessment
•An assessment of available services that identifies current providers:▫Public▫Private▫Non-profit

Plan Elements –#2 - Needs Assessment
•An assessment of transportation needs:
▫For individuals with disabilities▫For older adults▫For people with low incomes▫Basis of assessment may be from:
Experiences & perceptions of planning partners
More sophisticated data collection efforts Gaps in service
Plan Elements –#3 – Strategies or Activities
•Identify strategies and/or activities
that:
▫Address the identified gaps in service
▫Achieves efficiencies in service delivery

Plan Elements –#4 Prioritize Strategies
•Relative priorities for implementing specific strategies / activities identified based on:
▫Resources▫Time▫Feasibility

Last Step: Plan Adoption