Embed Size (px)
Citation preview
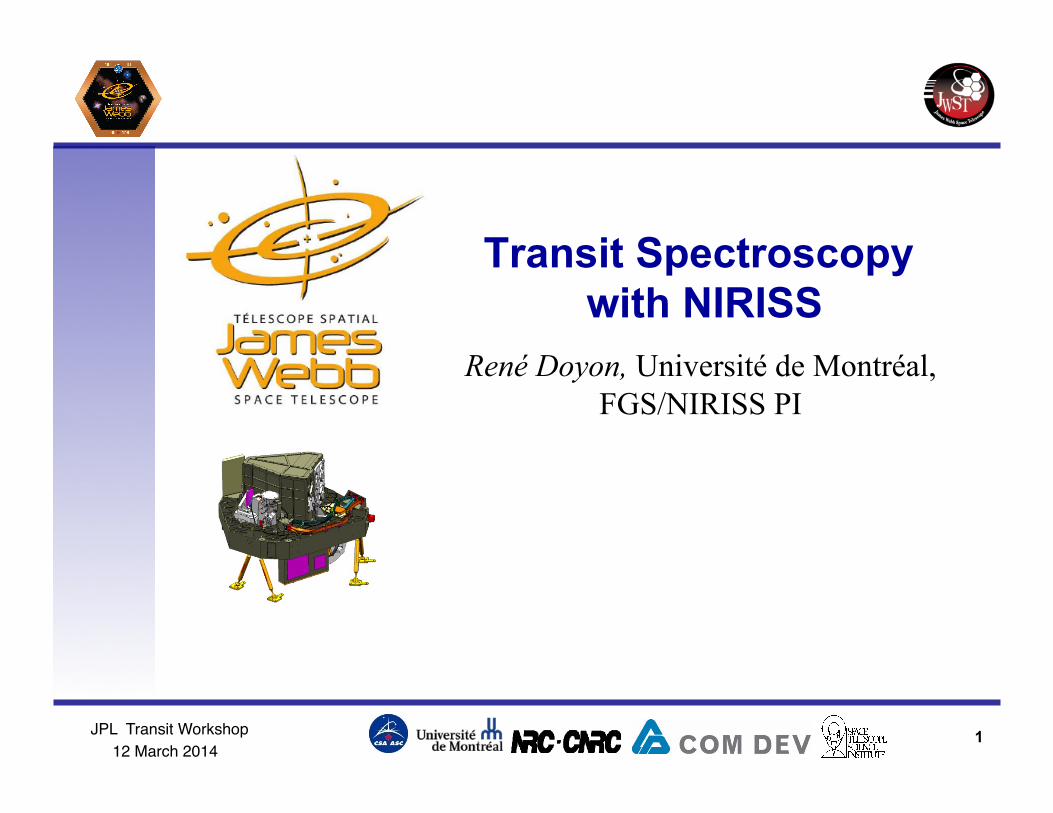
JPL Transit Workshop ! 12 March 2014!
1
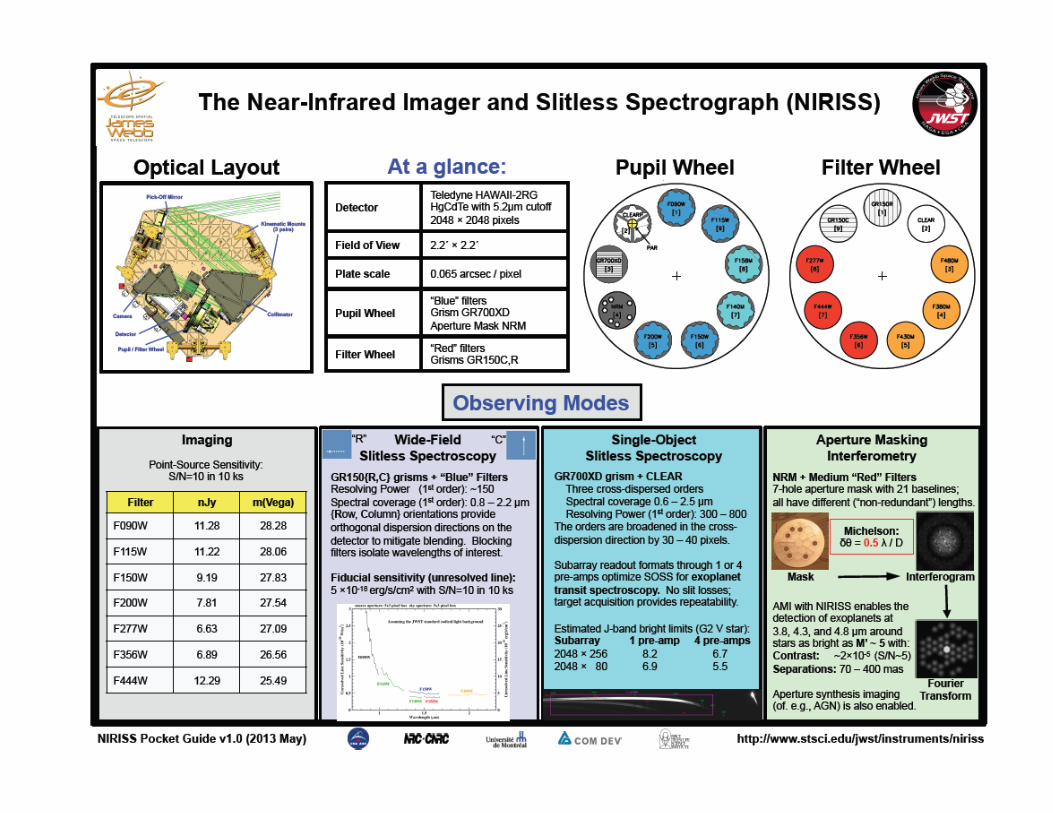
Transit Spectroscopy with NIRISS
René Doyon, Université de Montréal, FGS/NIRISS PI
JPL Transit Workshop ! 12 March 2014!
Collaborators
• David Lafrenière, UdeM (NIRISS exoplanet team lead)
• Loic Abert, UdeM • Etienne Artigau, UdeM • Mike Meyer, ETH, Switzerland • Ray Jayawardhana, York • Lisa Kaltenegger, Cornell
2
JPL Transit Workshop ! 12 March 2014!
3
JPL Transit Workshop ! 12 March 2014!
4
JPL Transit Workshop ! 12 March 2014!
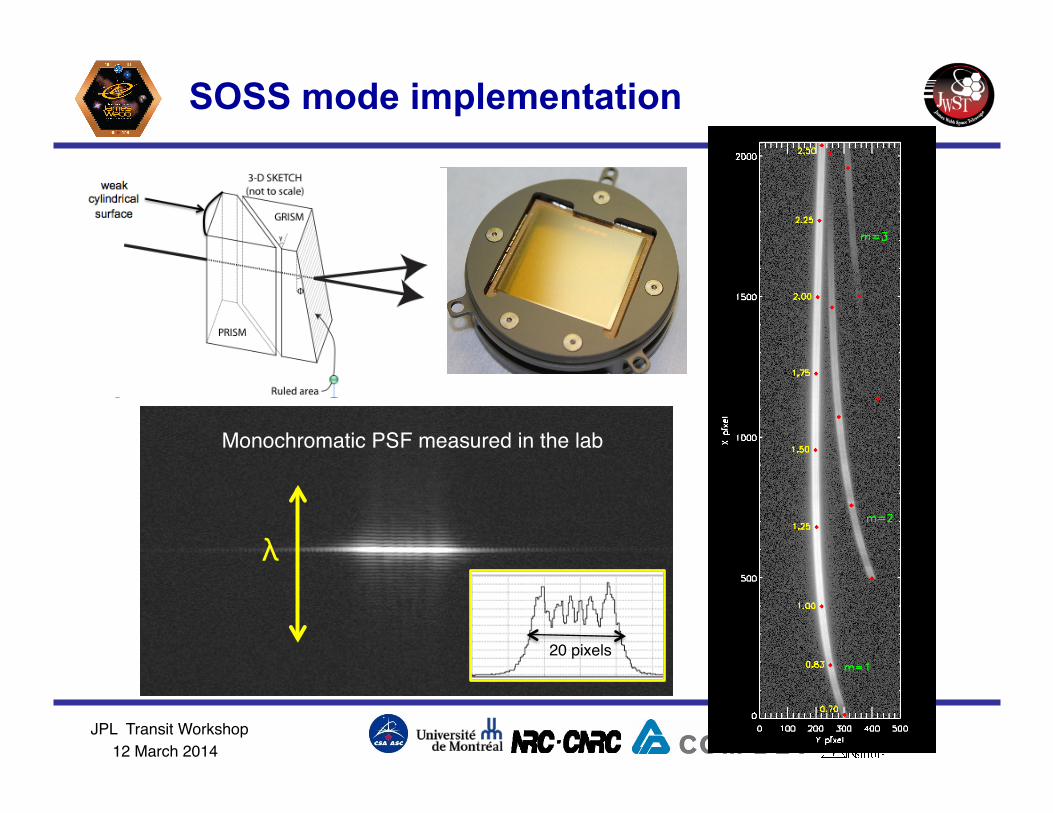
20 pixels!
Monochromatic PSF measured in the lab!
λ!
SOSS mode implementation
JPL Transit Workshop ! 12 March 2014!
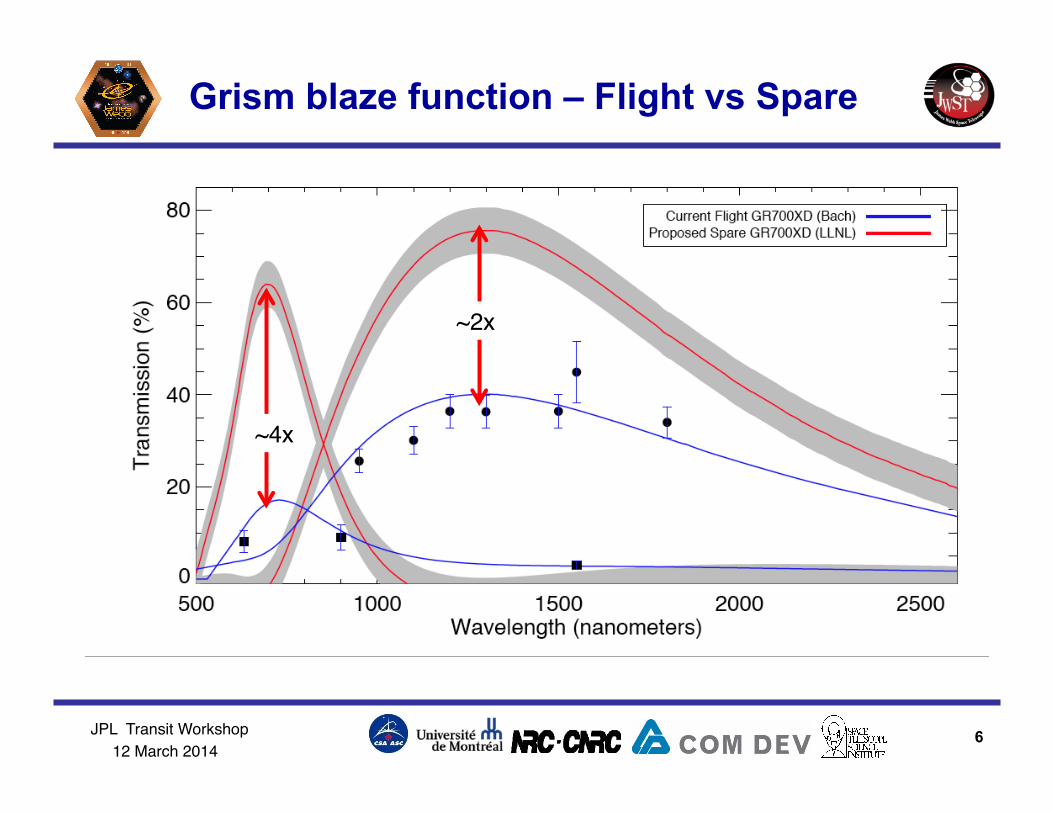
Grism blaze function – Flight vs Spare
6
~2x!
~4x!
JPL Transit Workshop ! 12 March 2014!
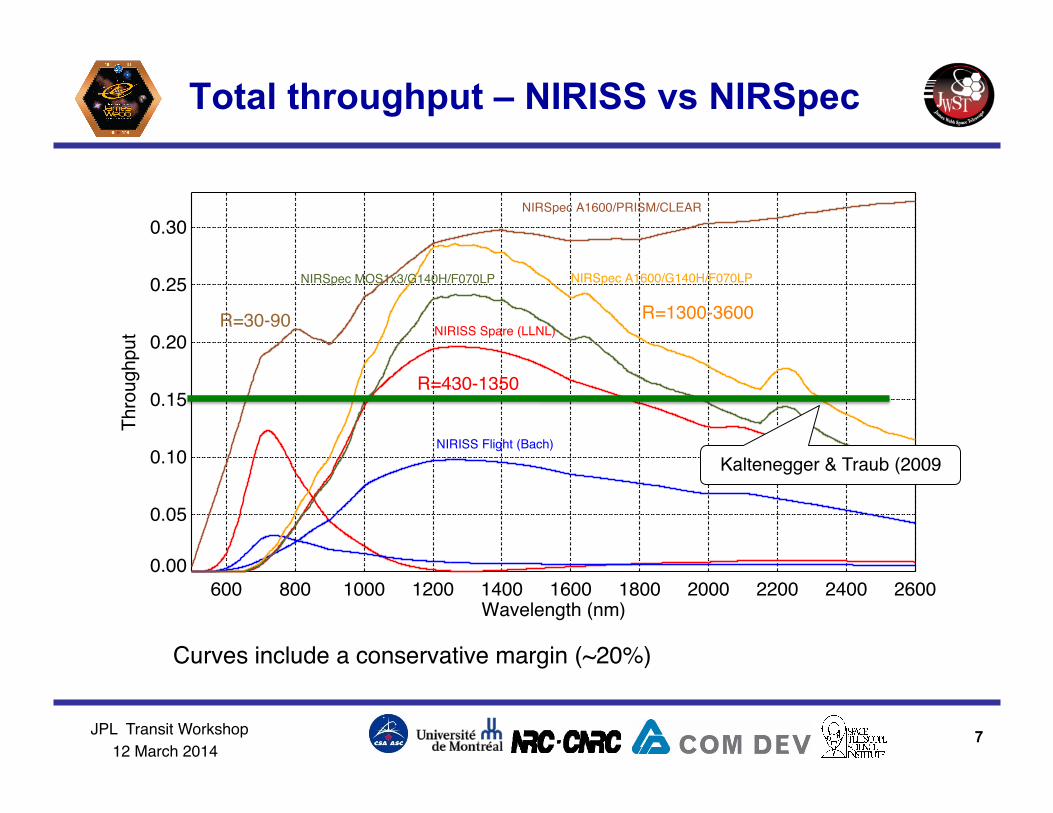
Total throughput – NIRISS vs NIRSpec
7
600 800 1000 1200 1400 1600 1800 2000 2200 2400 2600Wavelength (nm)
0.00
0.05
0.10
0.15
0.20
0.25
0.30
Thro
ughp
ut
NIRISS Spare (LLNL)
NIRISS Flight (Bach)
NIRSpec A1600/G140H/F070LPNIRSpec MOS1x3/G140H/F070LP
NIRSpec A1600/PRISM/CLEAR
Curves include a conservative margin (~20%) !
R=30-90!
R=430-1350!
R=1300-3600!
Kaltenegger & Traub (2009!

JPL Transit Workshop ! 12 March 2014!
Observing modes & saturation limits
• Standard Mode: • Wavelength coverage: 0.6-2.8 µm • Subarray: 256x2048 (order m=1 and 2) • Saturation limit: J=8.1 (CDS; 70 000 e-)
• Bright mode • Wavelength coverage: 1.0-2.8 µm • Subarray: 80x2048 (m=1 only) • Saturation limit: J=6.9
8
JPL Transit Workshop ! 12 March 2014!
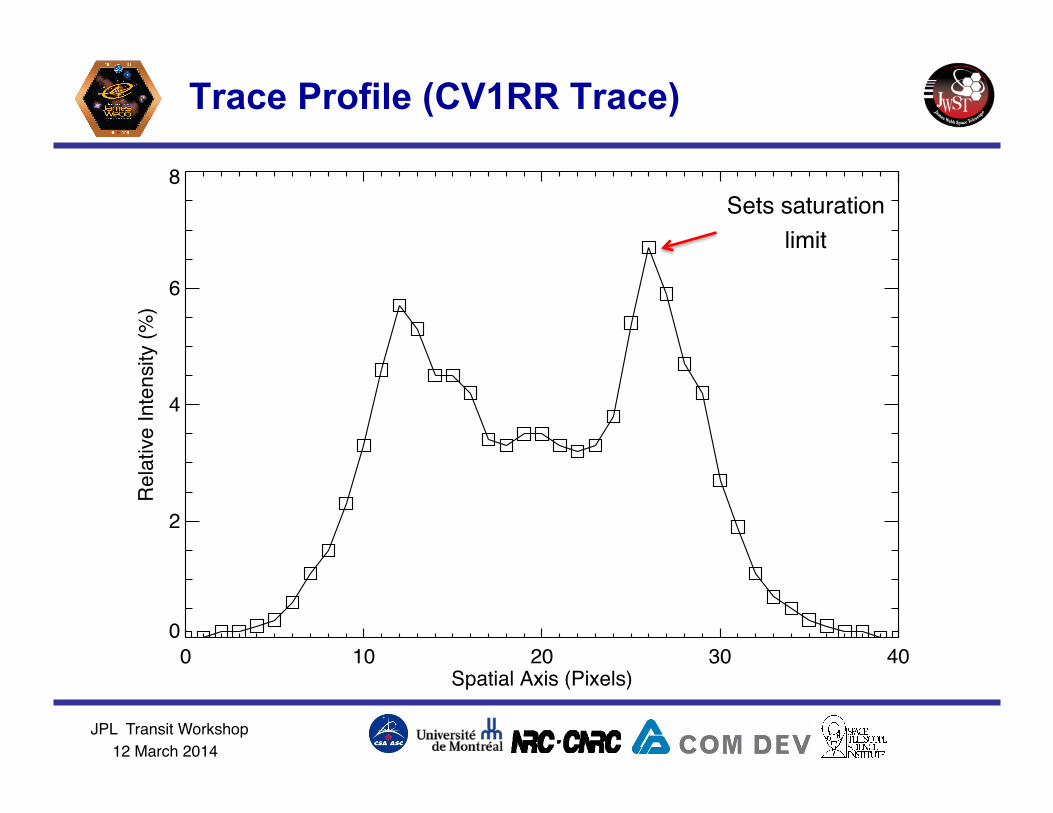
Trace Profile (CV1RR Trace)
0 10 20 30 40Spatial Axis (Pixels)
0
2
4
6
8R
elat
ive
Inte
nsity
(%)
Sets saturation!limit!
JPL Transit Workshop ! 12 March 2014!
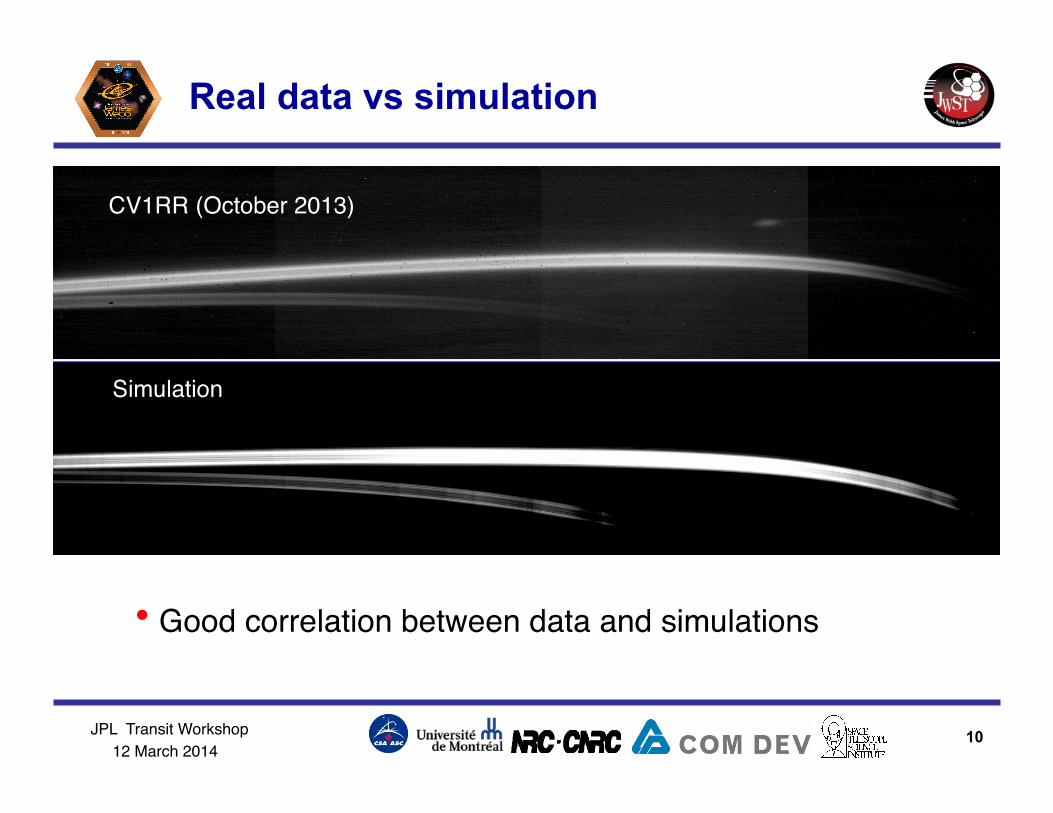
Real data vs simulation
• Good correlation between data and simulations!
Simulation!
CV1RR (October 2013)!
10
JPL Transit Workshop ! 12 March 2014!
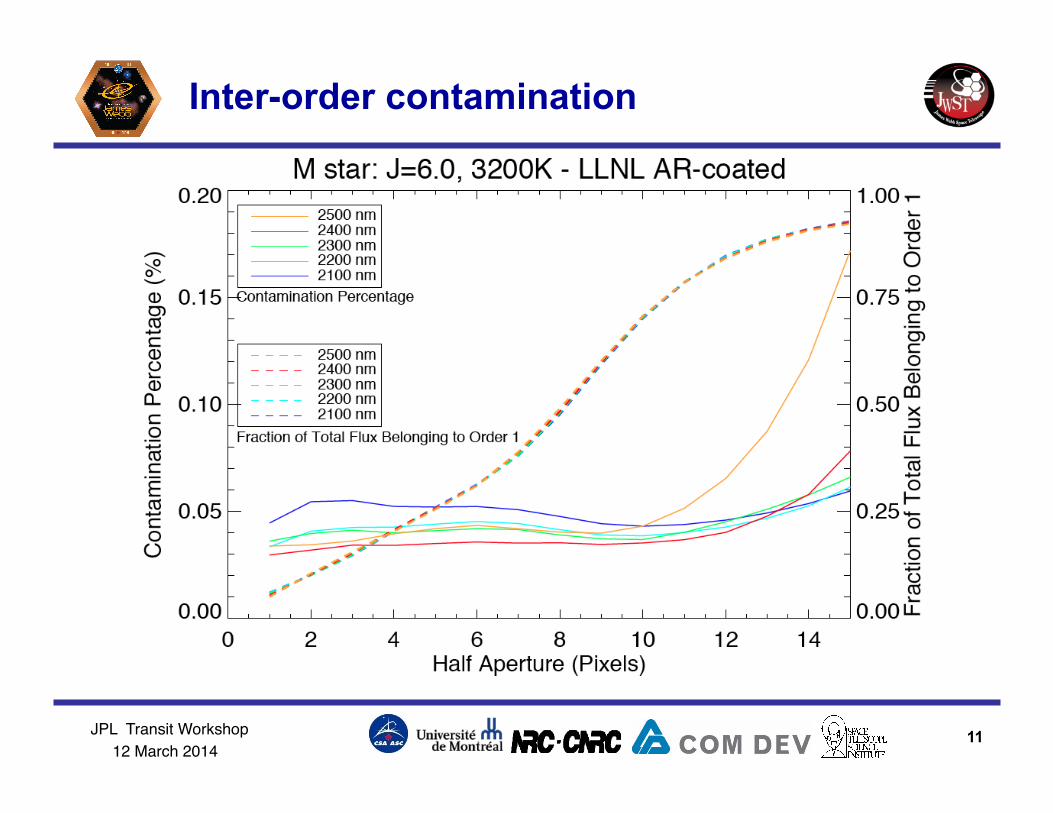
Inter-order contamination
11
JPL Transit Workshop ! 12 March 2014!
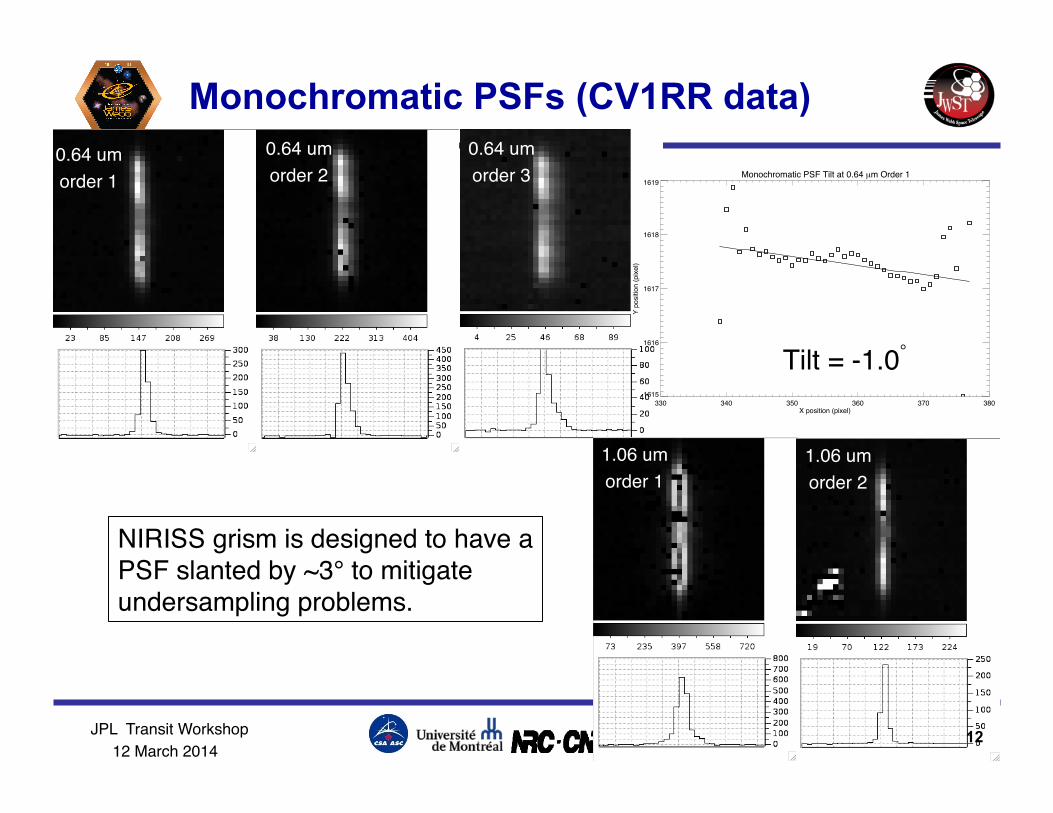
Monochromatic PSFs (CV1RR data) 0.64 um!order 1!
0.64 um!order 2!
0.64 um!order 3!
1.06 um!order 1!
1.06 um!order 2!
12
Monochromatic PSF Tilt at 0.64 µm Order 1
330 340 350 360 370 380X position (pixel)
1615
1616
1617
1618
1619
Y po
sitio
n (p
ixel)
Tilt = -1.0°
NIRISS grism is designed to have a PSF slanted by ~3° to mitigate undersampling problems.!

JPL Transit Workshop ! 12 March 2014!
Target acquisition
• Configure for full field mode • Use NRM mask + F480 + 64x64 subarray • Peak up on « hot spot » • Magnitude limits: ~2.7 • Move GR700XD in place • Repeatability of the pupil wheel: ~0.15 degrees
• Translate into trace rotation by same amout, ~3-4 pixels from both ends of te spectral trace
• To be tested at CV3.
13
JPL Transit Workshop ! 12 March 2014!
Transit Spectroscopy Simulations (photon-noise limited)
14
JPL Transit Workshop ! 12 March 2014!
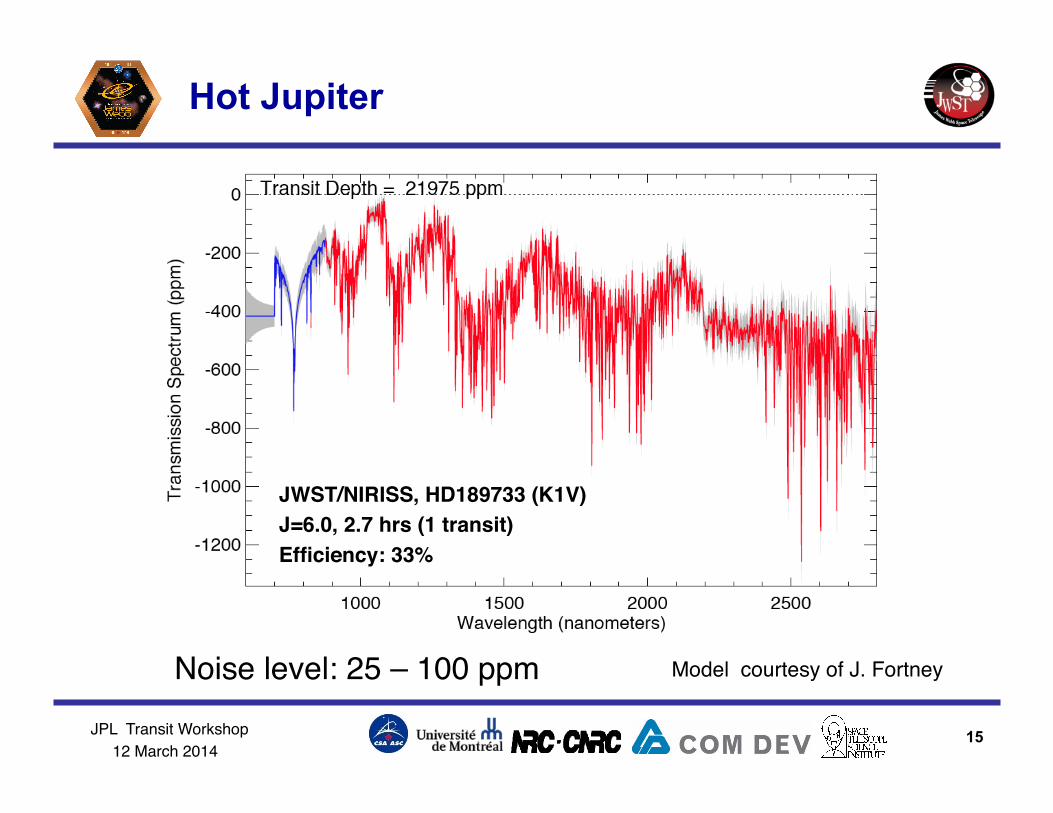
Hot Jupiter
15
JWST/NIRISS, HD189733 (K1V) !J=6.0, 2.7 hrs (1 transit)!Efficiency: 33% !
Model courtesy of J. Fortney!Noise level: 25 – 100 ppm !
JPL Transit Workshop ! 12 March 2014!
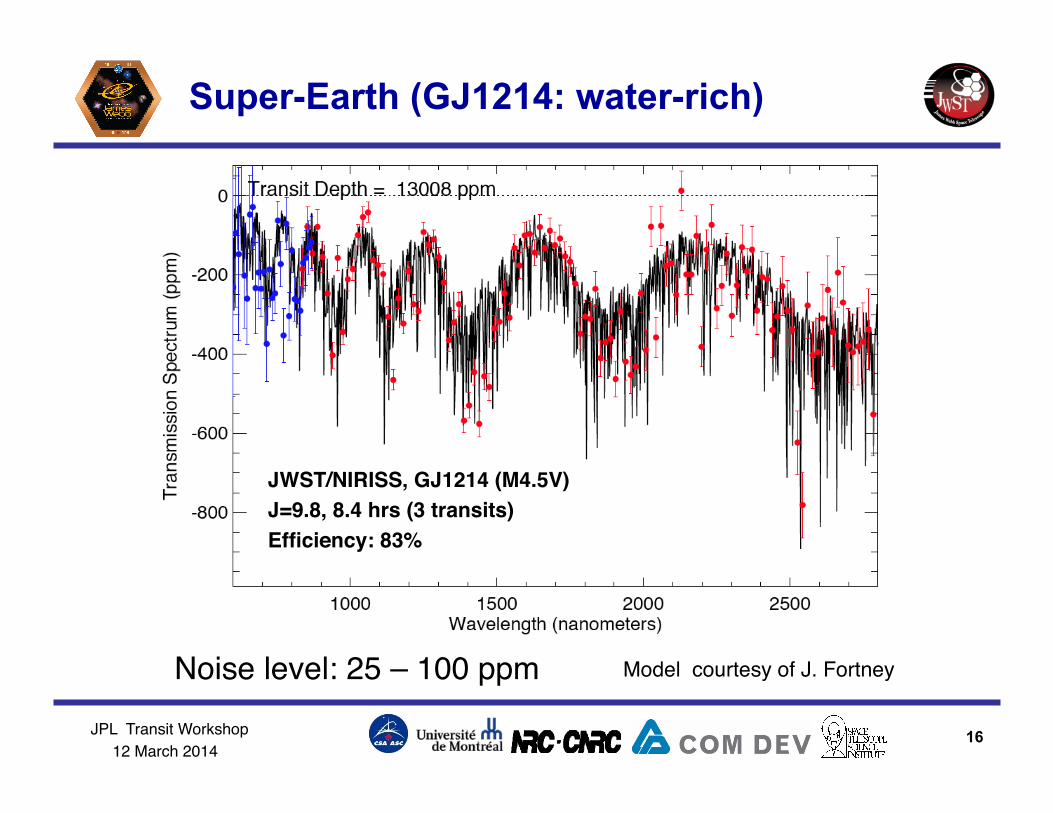
Super-Earth (GJ1214: water-rich)
16
Model courtesy of J. Fortney!Noise level: 25 – 100 ppm !
JWST/NIRISS, GJ1214 (M4.5V) !J=9.8, 8.4 hrs (3 transits)!Efficiency: 83% !
JPL Transit Workshop ! 12 March 2014!
TESS yield
Simulation methodology
• Take all known M dwarfs within 10 pc • Expand sample isotropically with same density and
properties (sp types, abs mags, etc.) out to 50 pc • Take 2MASS mags • Planet statistics follows Bonfils et al. 2012
• Eta_Earth~0.5
• Extrapolated at low masses • log normal distribution centered at 1 M_Earth
• Consider only those with transit depth > 0.1%
JPL Transit Workshop ! 12 March 2014!
TESS synthetic population
18
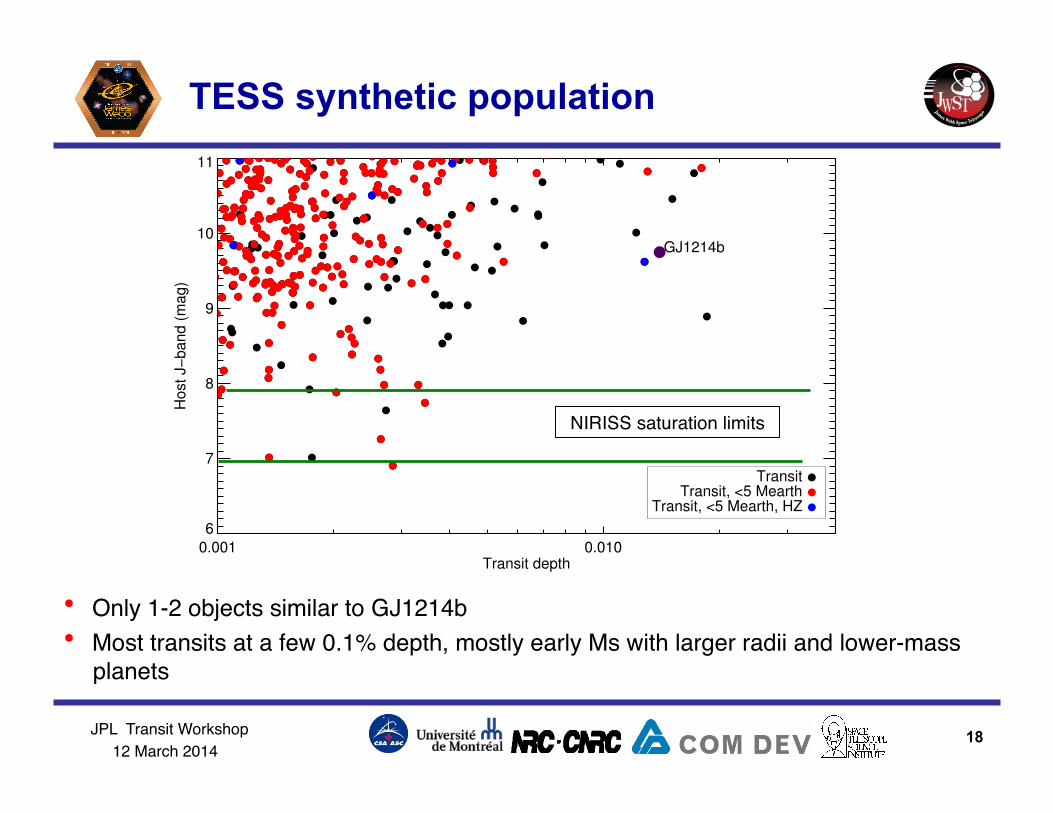
0.001 0.010Transit depth
6
7
8
9
10
11H
ost
J!
band (
mag)
GJ1214b
Transit, <5 Mearth, HZTransit, <5 Mearth
Transit
• Only 1-2 objects similar to GJ1214b!• Most transits at a few 0.1% depth, mostly early Ms with larger radii and lower-mass
planets!
NIRISS saturation limits!
JPL Transit Workshop ! 12 March 2014!
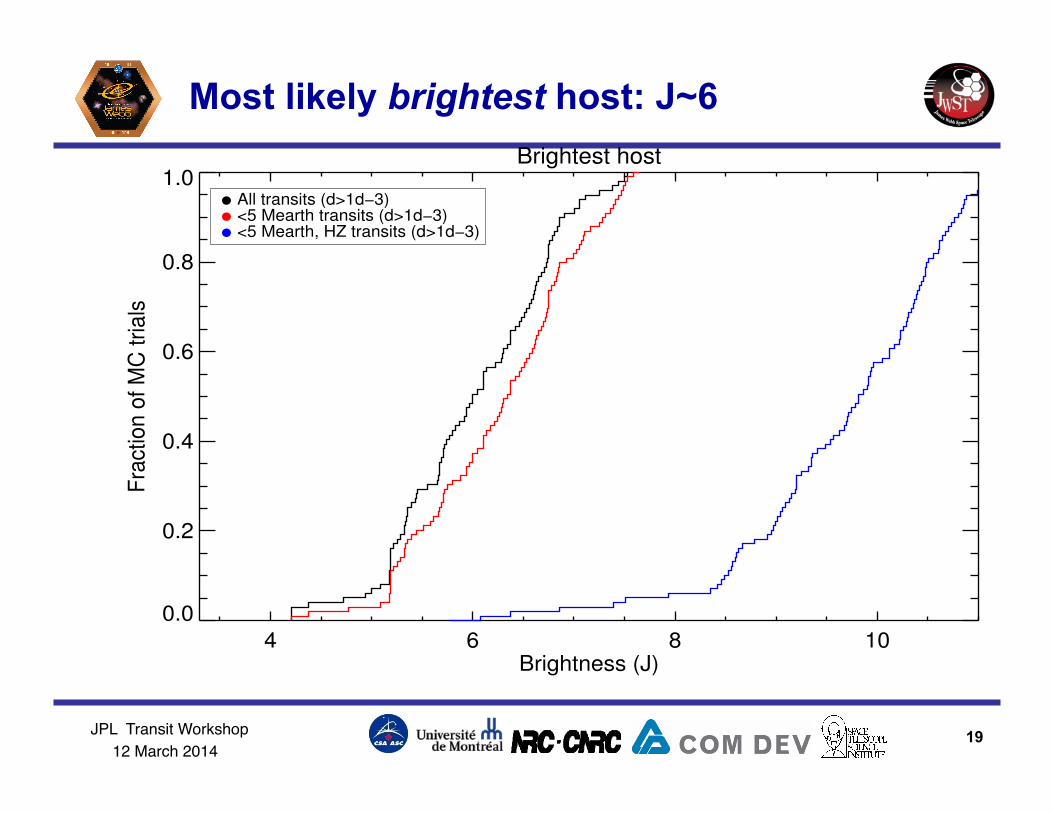
Most likely brightest host: J~6
19
Brightest host
4 6 8 10Brightness (J)
0.0
0.2
0.4
0.6
0.8
1.0
Fra
ctio
n o
f M
C t
ria
ls
All transits (d>1d!3)<5 Mearth transits (d>1d!3)<5 Mearth, HZ transits (d>1d!3)
JPL Transit Workshop ! 12 March 2014!
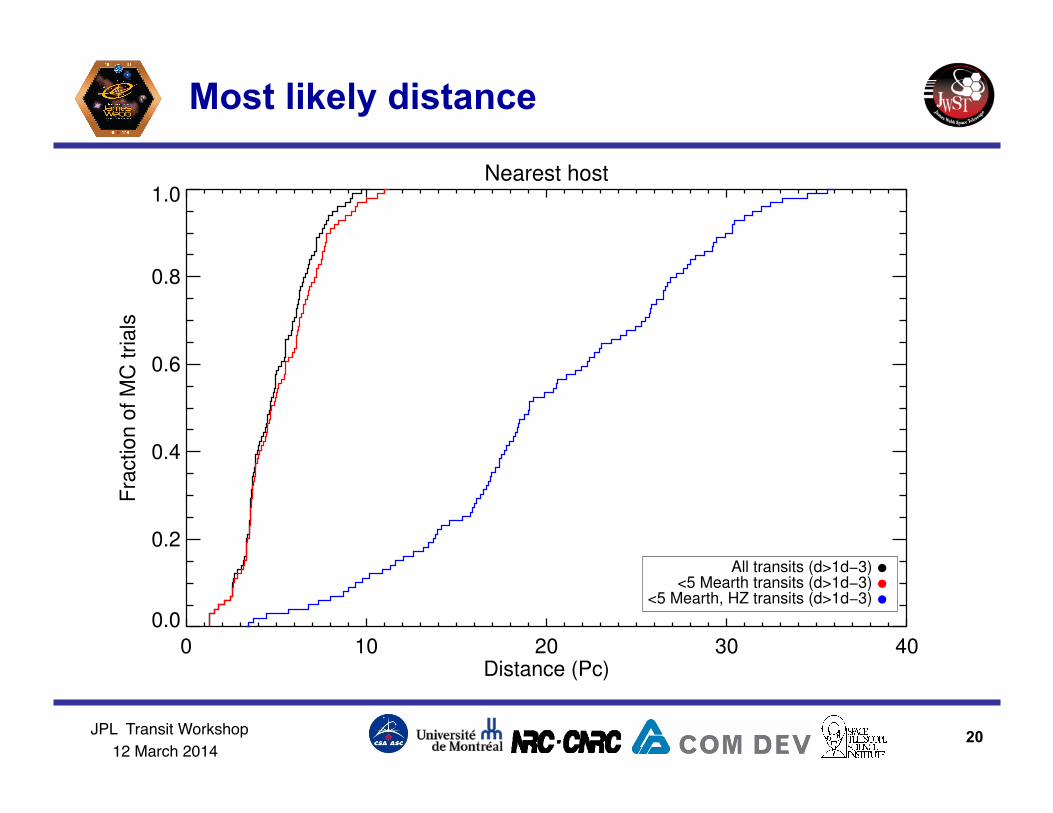
Most likely distance
20
Nearest host
0 10 20 30 40Distance (Pc)
0.0
0.2
0.4
0.6
0.8
1.0
Fra
ctio
n o
f M
C t
ria
ls
<5 Mearth, HZ transits (d>1d!3)<5 Mearth transits (d>1d!3)
All transits (d>1d!3)
JPL Transit Workshop ! 12 March 2014!
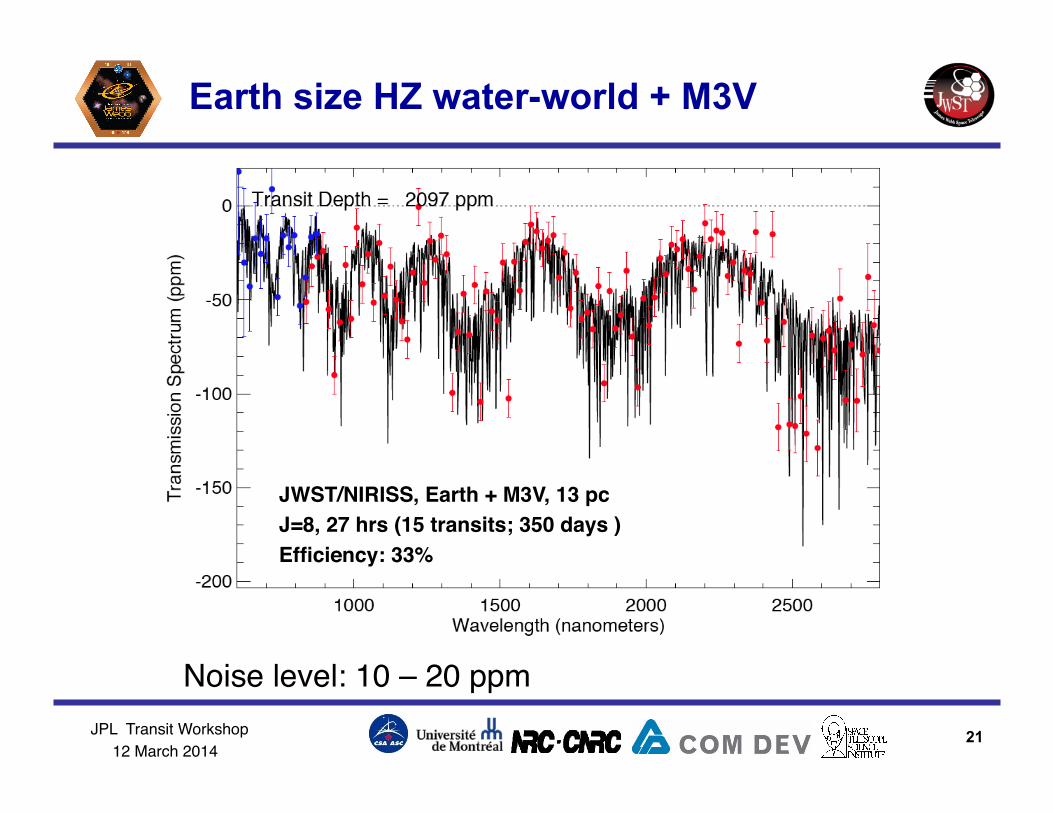
Earth size HZ water-world + M3V
21
JWST/NIRISS, Earth + M3V, 13 pc !J=8, 27 hrs (15 transits; 350 days )!Efficiency: 33% !
Noise level: 10 – 20 ppm !
JPL Transit Workshop ! 12 March 2014!
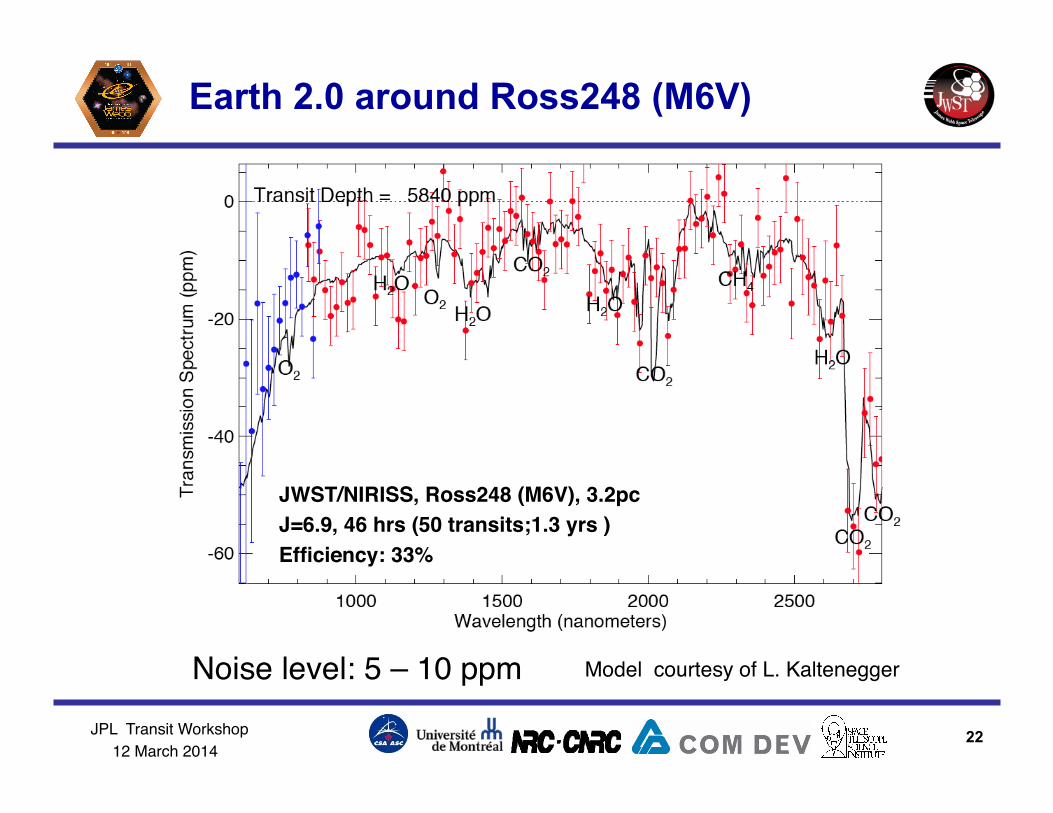
Earth 2.0 around Ross248 (M6V)
22
Model courtesy of L. Kaltenegger!
JWST/NIRISS, Ross248 (M6V), 3.2pc !J=6.9, 46 hrs (50 transits;1.3 yrs )!Efficiency: 33% !
Noise level: 5 – 10 ppm !
JPL Transit Workshop ! 12 March 2014!
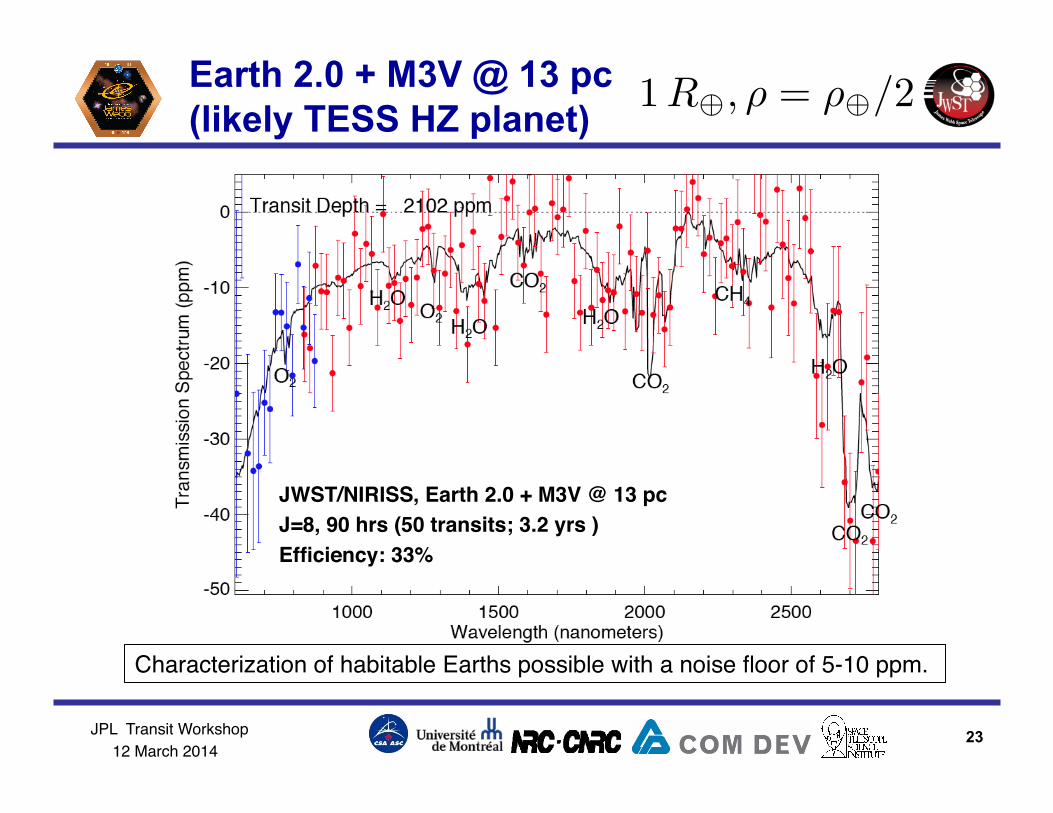
Earth 2.0 + M3V @ 13 pc (likely TESS HZ planet)
23
JWST/NIRISS, Earth 2.0 + M3V @ 13 pc !J=8, 90 hrs (50 transits; 3.2 yrs )!Efficiency: 33% !
1 R�, ⇢ = ⇢�/2
Characterization of habitable Earths possible with a noise floor of 5-10 ppm. !
JPL Transit Workshop ! 12 March 2014!
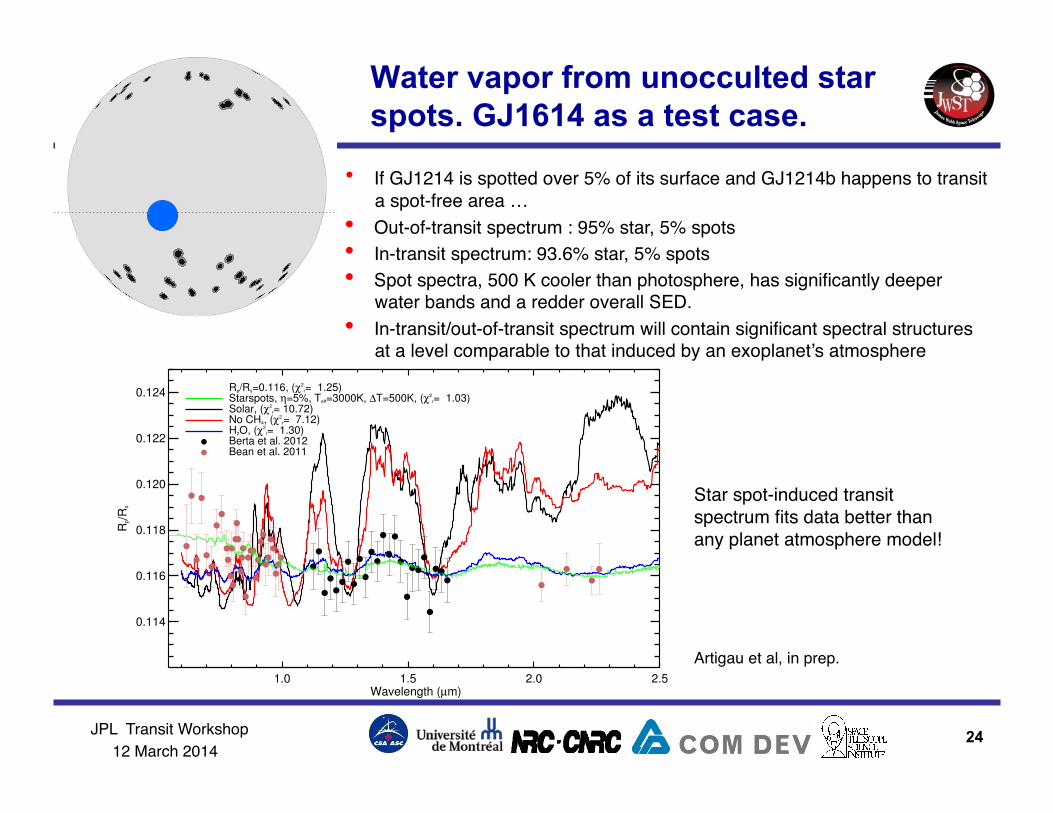
• If GJ1214 is spotted over 5% of its surface and GJ1214b happens to transit a spot-free area … !
• Out-of-transit spectrum : 95% star, 5% spots!• In-transit spectrum: 93.6% star, 5% spots!• Spot spectra, 500 K cooler than photosphere, has significantly deeper
water bands and a redder overall SED.!• In-transit/out-of-transit spectrum will contain significant spectral structures
at a level comparable to that induced by an exoplanet’s atmosphere!
1.0 1.5 2.0 2.5Wavelength (µm)
0.114
0.116
0.118
0.120
0.122
0.124
Rp/R
s
Rp/Rs=0.116, (!2r= 1.25)
Starspots, "=5%, Teff=3000K, #T=500K, (!2r= 1.03)
Solar, (!2r= 10.72)
No CH4, (!2r= 7.12)
H2O, (!2r= 1.30)
Berta et al. 2012Bean et al. 2011
Star spot-induced transit spectrum fits data better than any planet atmosphere model!!
Water vapor from unocculted star spots. GJ1614 as a test case.
Artigau et al, in prep.!
24
JPL Transit Workshop ! 12 March 2014!
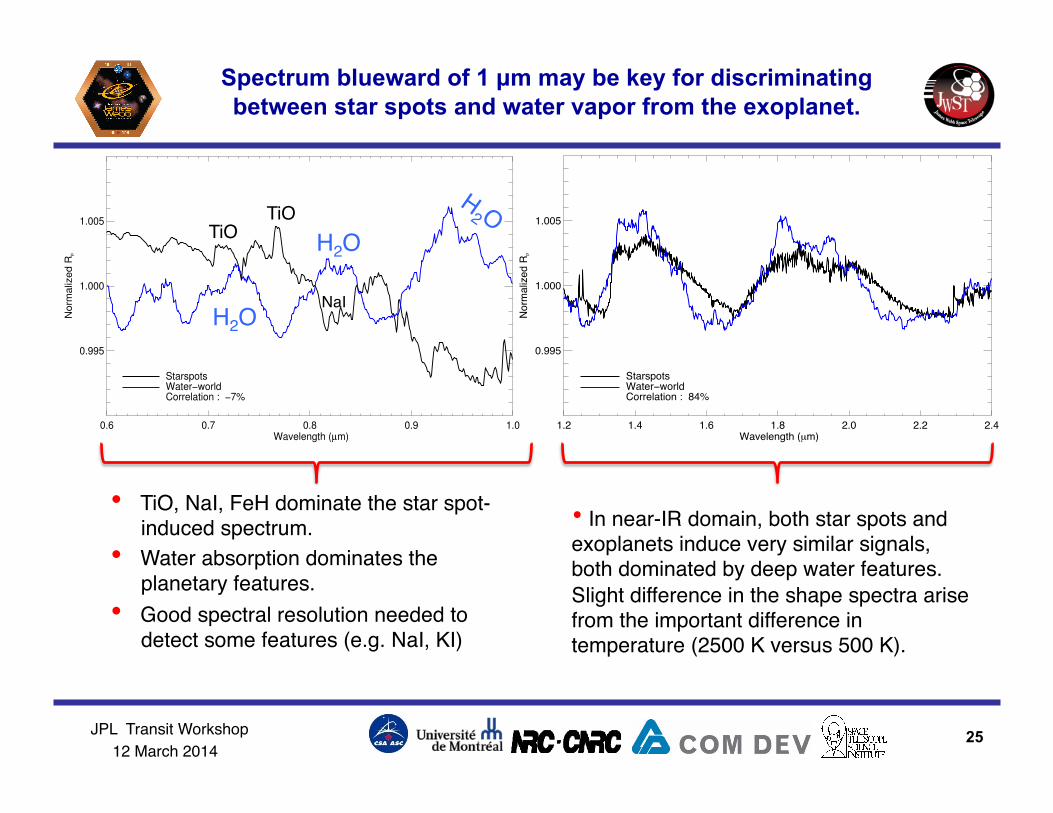
0.6 0.7 0.8 0.9 1.0Wavelength (µm)
0.995
1.000
1.005
Norm
aliz
ed R
p
Correlation : !7%Water!worldStarspots
1.2 1.4 1.6 1.8 2.0 2.2 2.4Wavelength (µm)
0.995
1.000
1.005
Nor
mal
ized
Rp
Correlation : 84%Water−worldStarspots
• TiO, NaI, FeH dominate the star spot-induced spectrum.!
• Water absorption dominates the planetary features.!
• Good spectral resolution needed to detect some features (e.g. NaI, KI)!
• In near-IR domain, both star spots and exoplanets induce very similar signals, both dominated by deep water features. Slight difference in the shape spectra arise from the important difference in temperature (2500 K versus 500 K).!
H2O!
H2O!
TiO!TiO!
NaI!
Spectrum blueward of 1 µm may be key for discriminating between star spots and water vapor from the exoplanet.
25
JPL Transit Workshop ! 12 March 2014!
On-going work
• 2d simulations for data pipeline development • NIRISS Optical Simulator
• Optical test bed to simulate NIRISS optical system • ASIC-driven H2RG-2.5 um detector + flight software emulator • Wavelength range: 0.9-1.9 µm • Include GR700XD grism w/o weak lens • NOS will have the capability to simulate multi-visit transit
observations (liquid cell). • Optical design completed. • Procurement completed • Operational in 2015.
26
JPL Transit Workshop ! 12 March 2014!
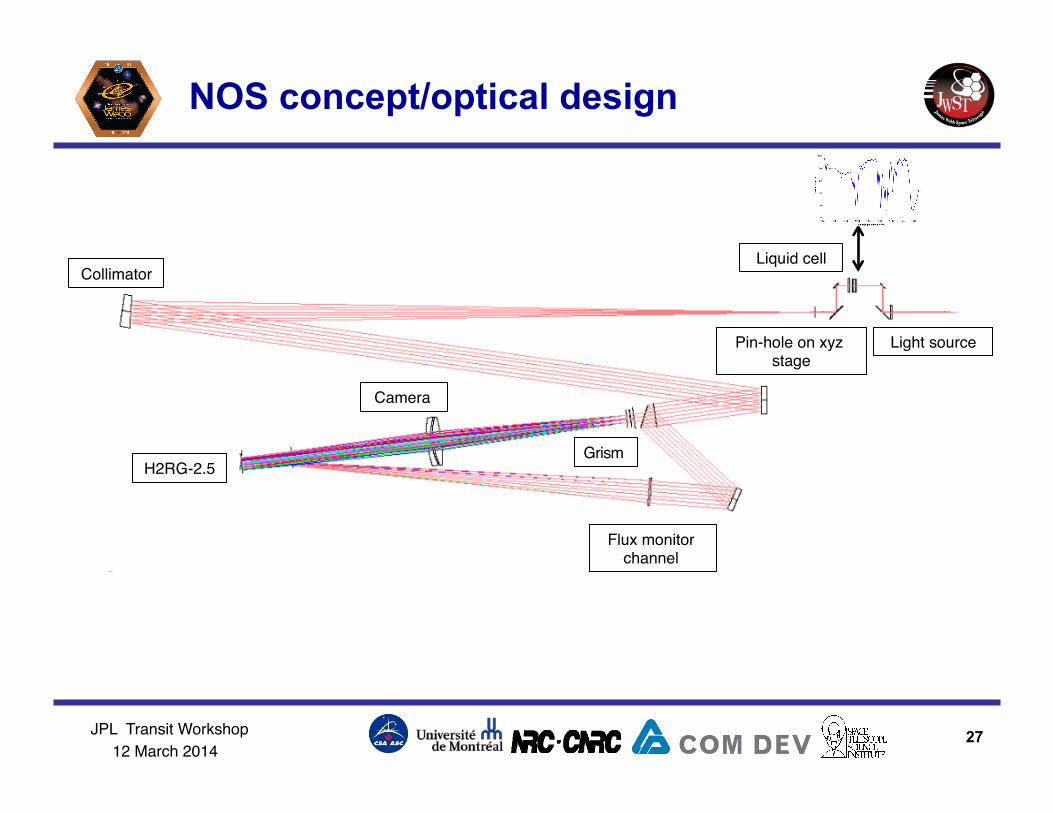
NOS concept/optical design
27
Collimator!
Camera !
Flux monitor channel !
Liquid cell!
Grism !H2RG-2.5!
Light source!Pin-hole on xyz stage!
JPL Transit Workshop ! 12 March 2014!
Supplementary material
28
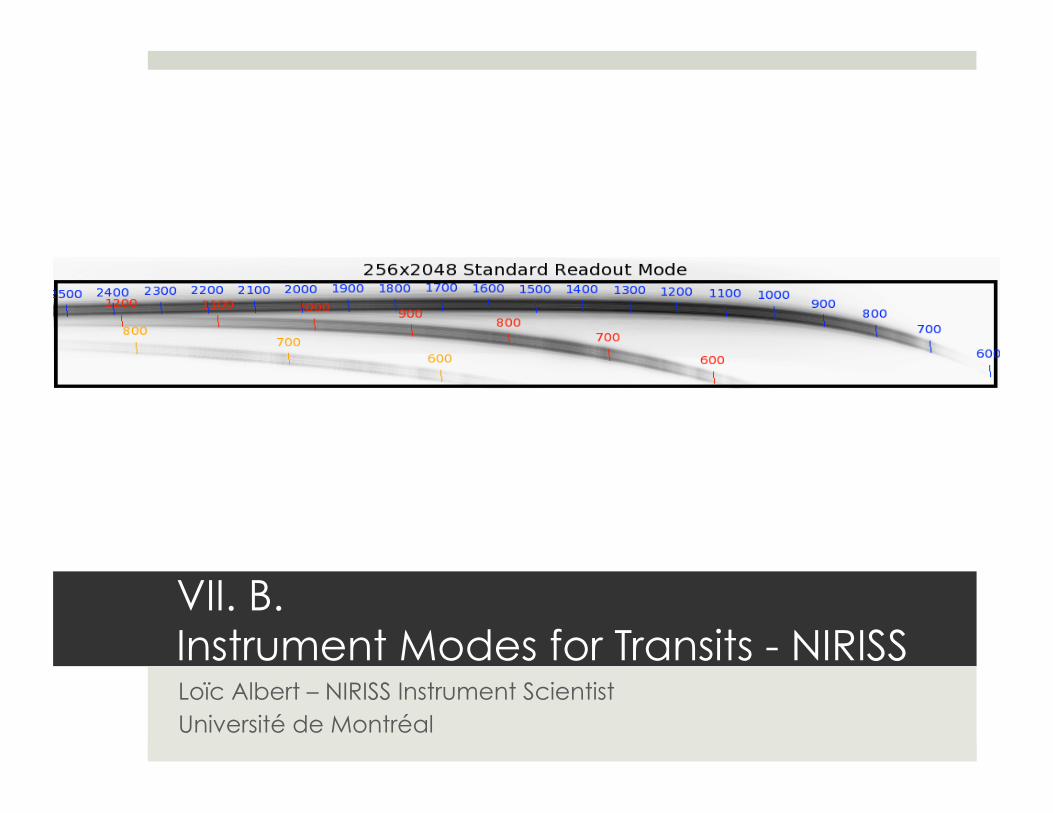
VII. B. Instrument Modes for Transits - NIRISS Loïc Albert – NIRISS Instrument Scientist Université de Montréal
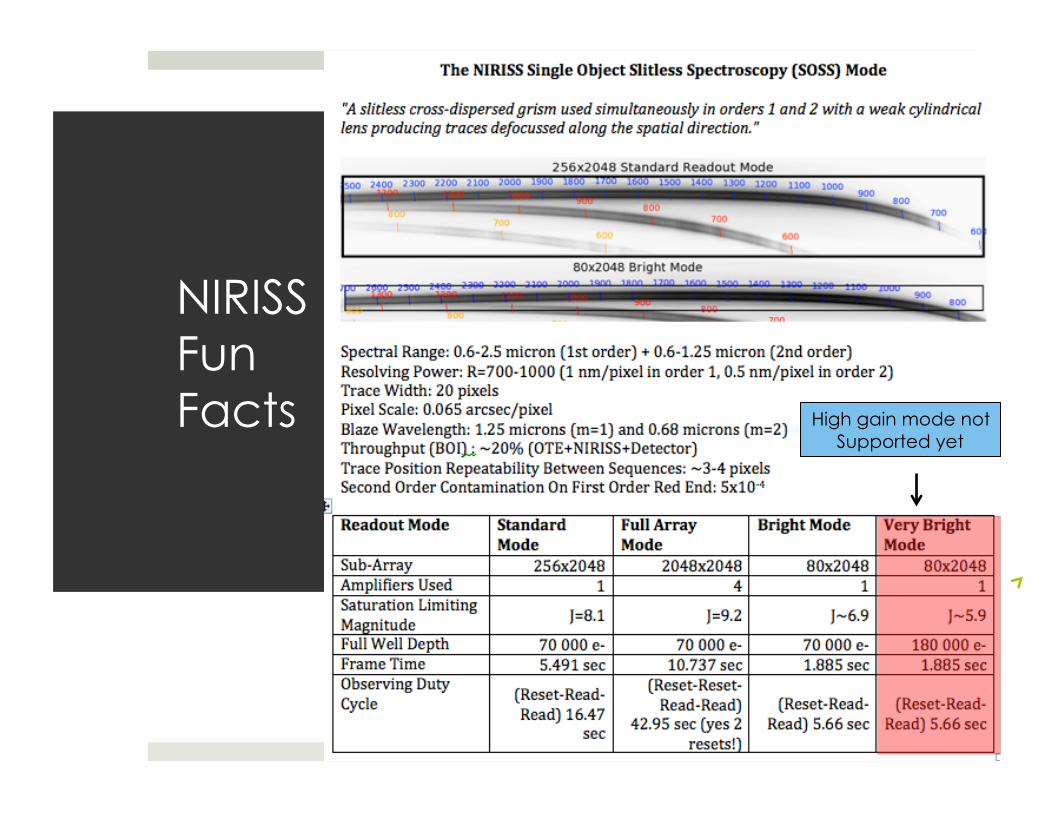
NIRISS Fun Facts High gain mode not
Supported yet
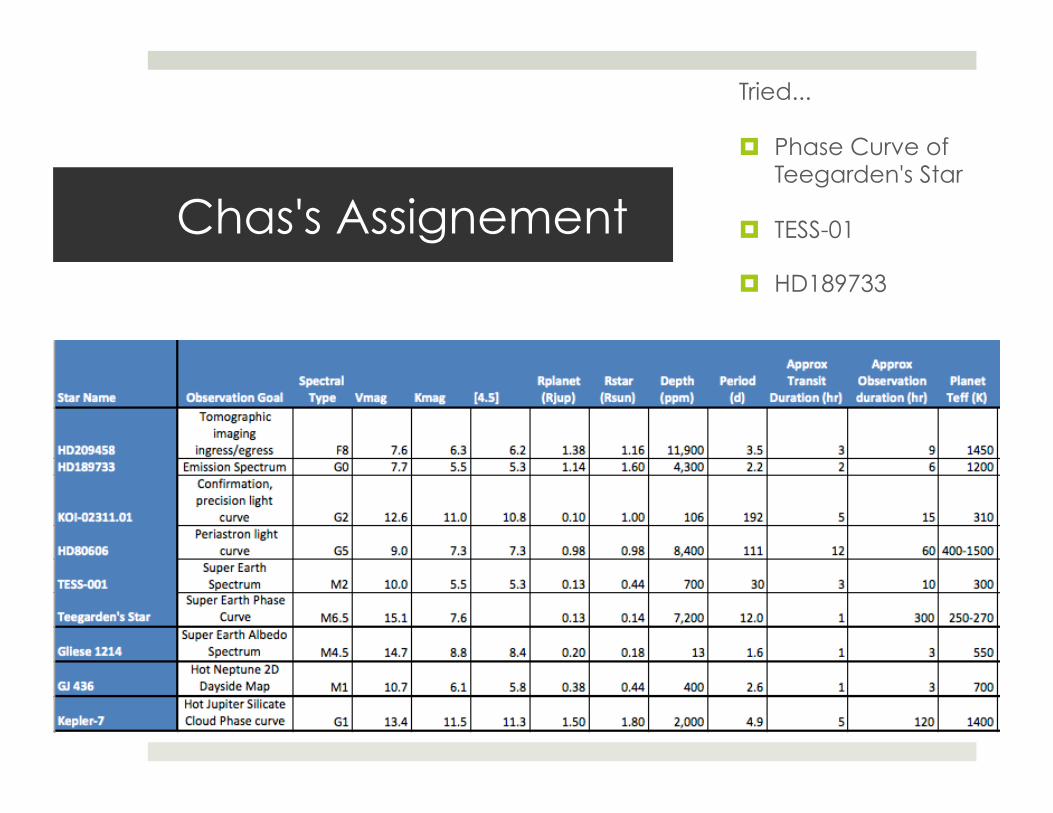
Chas's Assignement
Tried...
Phase Curve of Teegarden's Star
TESS-01
HD189733
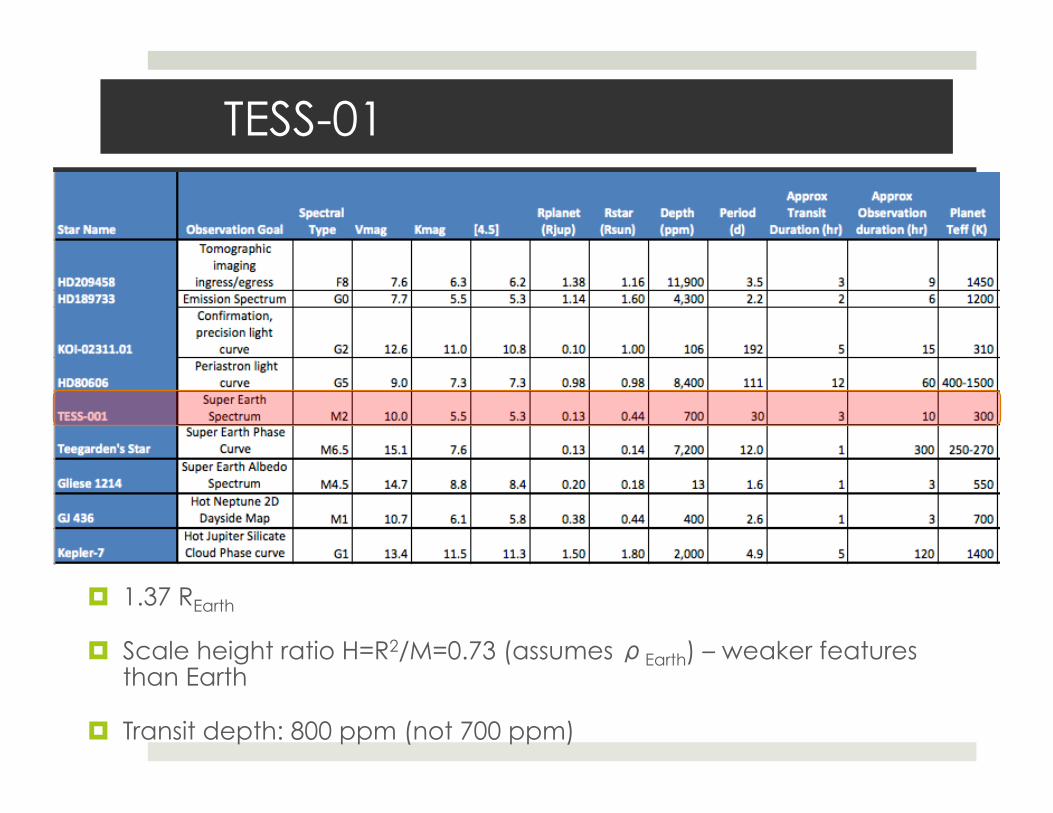
TESS-01 Assignment
1.37 REarth
Scale height ratio H=R2/M=0.73 (assumes ρEarth) – weaker features than Earth
Transit depth: 800 ppm (not 700 ppm)
TESS-01
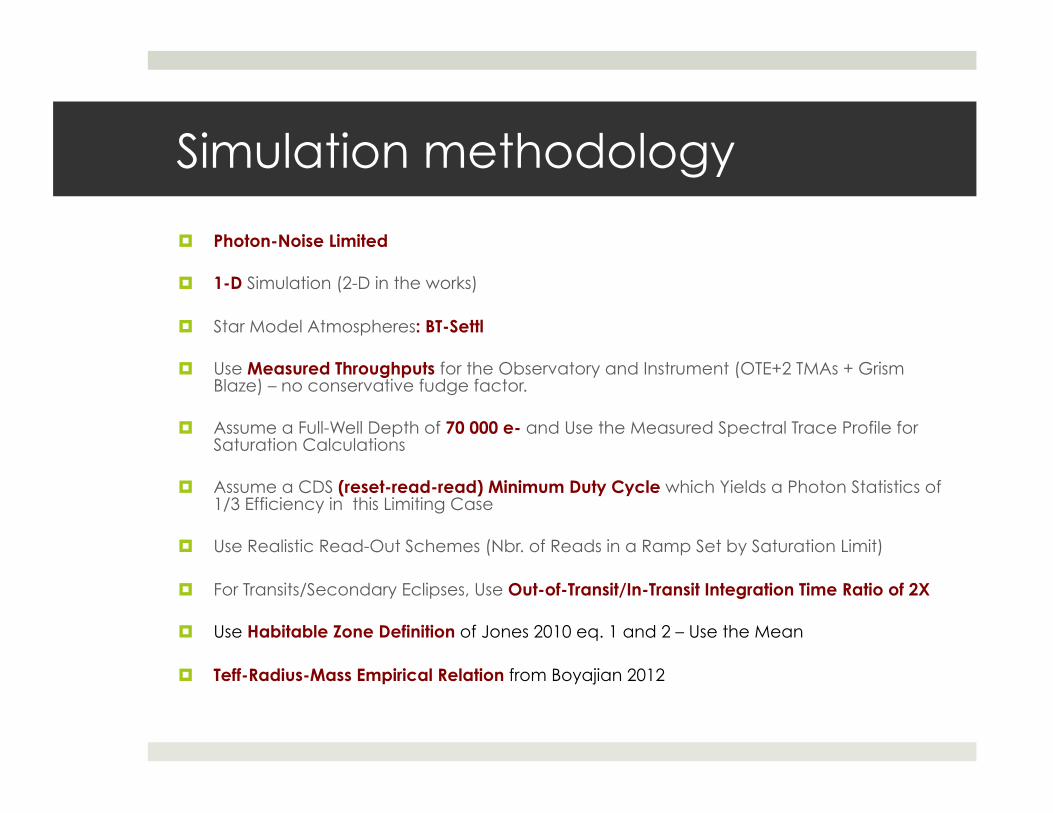
Simulation methodology
Photon-Noise Limited
1-D Simulation (2-D in the works)
Star Model Atmospheres: BT-Settl
Use Measured Throughputs for the Observatory and Instrument (OTE+2 TMAs + Grism Blaze) – no conservative fudge factor.
Assume a Full-Well Depth of 70 000 e- and Use the Measured Spectral Trace Profile for Saturation Calculations
Assume a CDS (reset-read-read) Minimum Duty Cycle which Yields a Photon Statistics of 1/3 Efficiency in this Limiting Case
Use Realistic Read-Out Schemes (Nbr. of Reads in a Ramp Set by Saturation Limit)
For Transits/Secondary Eclipses, Use Out-of-Transit/In-Transit Integration Time Ratio of 2X
Use Habitable Zone Definition of Jones 2010 eq. 1 and 2 – Use the Mean
Teff-Radius-Mass Empirical Relation from Boyajian 2012
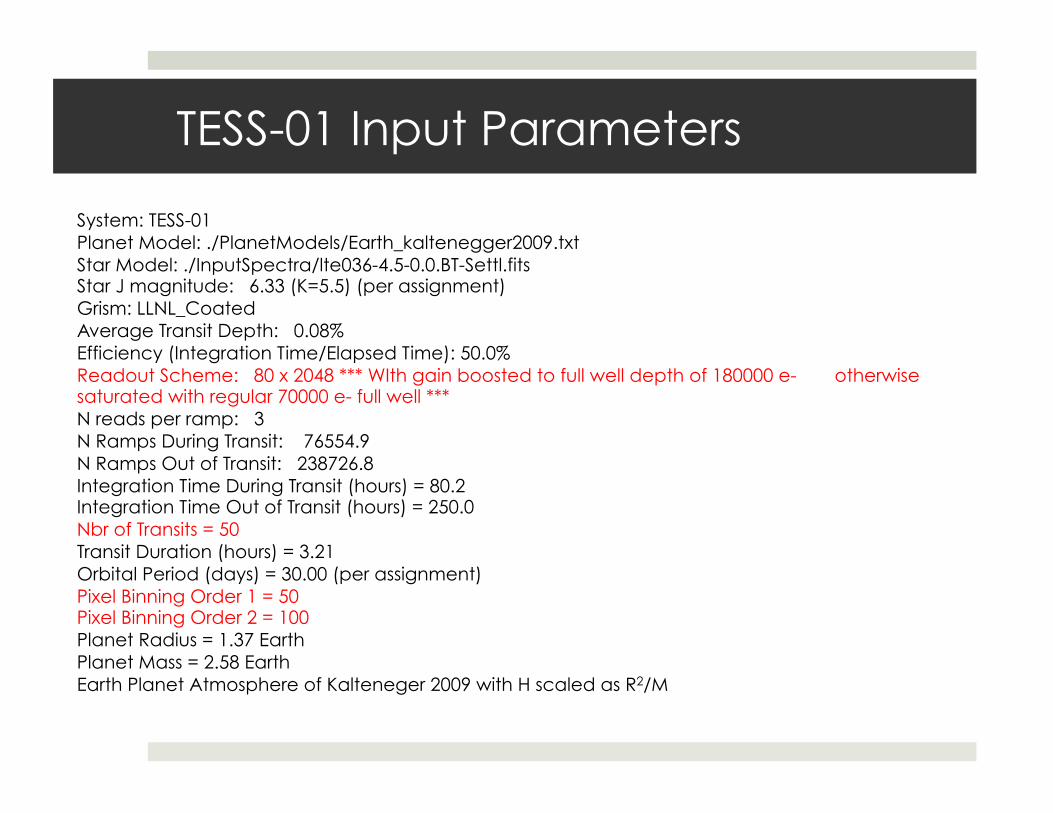
TESS-01 Input Parameters
System: TESS-01 Planet Model: ./PlanetModels/Earth_kaltenegger2009.txt Star Model: ./InputSpectra/lte036-4.5-0.0.BT-Settl.fits Star J magnitude: 6.33 (K=5.5) (per assignment) Grism: LLNL_Coated Average Transit Depth: 0.08% Efficiency (Integration Time/Elapsed Time): 50.0% Readout Scheme: 80 x 2048 *** WIth gain boosted to full well depth of 180000 e- otherwise saturated with regular 70000 e- full well *** N reads per ramp: 3 N Ramps During Transit: 76554.9 N Ramps Out of Transit: 238726.8 Integration Time During Transit (hours) = 80.2 Integration Time Out of Transit (hours) = 250.0 Nbr of Transits = 50 Transit Duration (hours) = 3.21 Orbital Period (days) = 30.00 (per assignment) Pixel Binning Order 1 = 50 Pixel Binning Order 2 = 100 Planet Radius = 1.37 Earth Planet Mass = 2.58 Earth Earth Planet Atmosphere of Kalteneger 2009 with H scaled as R2/M
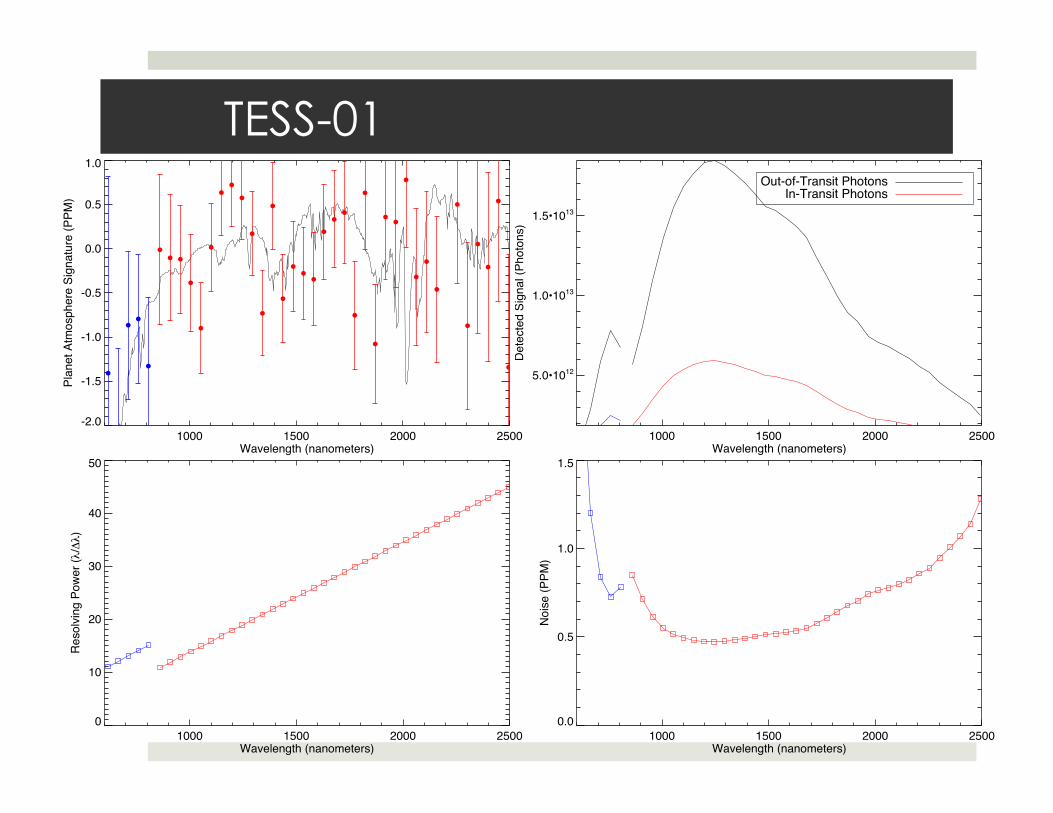
TESS-01
1000 1500 2000 2500Wavelength (nanometers)
-2.0
-1.5
-1.0
-0.5
0.0
0.5
1.0
Plan
et A
tmos
pher
e Si
gnat
ure
(PPM
)
1000 1500 2000 2500Wavelength (nanometers)
0.0
0.5
1.0
1.5
Noi
se (P
PM)
1000 1500 2000 2500Wavelength (nanometers)
0
10
20
30
40
50
Res
olvi
ng P
ower
(h/6h)
1000 1500 2000 2500Wavelength (nanometers)
5.0•1012
1.0•1013
1.5•1013
Dete
cted
Sig
nal (
Phot
ons)
Out-of-Transit PhotonsIn-Transit Photons
TESS-01
Sub PPM signal !!! Not realistic to do with NIRISS for an M2 primary
However, an Earth-twin around an ~M6 primary (Teff=3200K, R=0.18) of J=7 offers slightly better hope
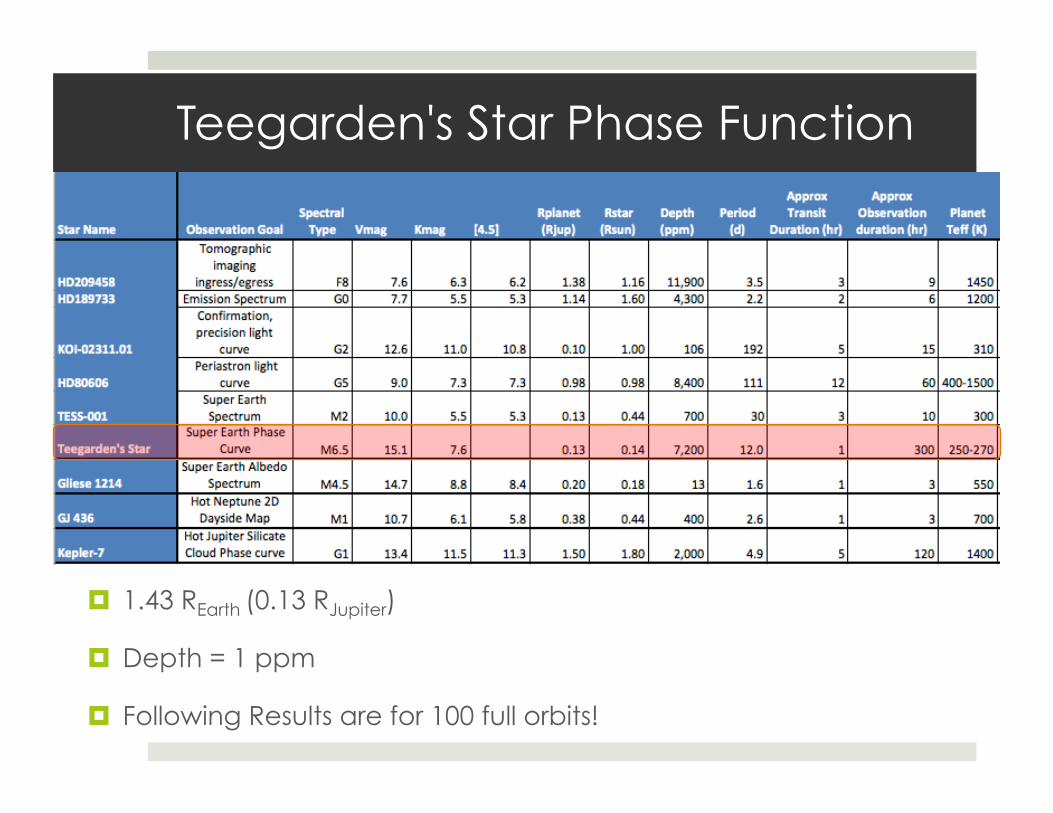
Teegarden's Star Assignment
1.43 REarth (0.13 RJupiter)
Depth = 1 ppm
Following Results are for 100 full orbits!
Teegarden's Star Phase Function
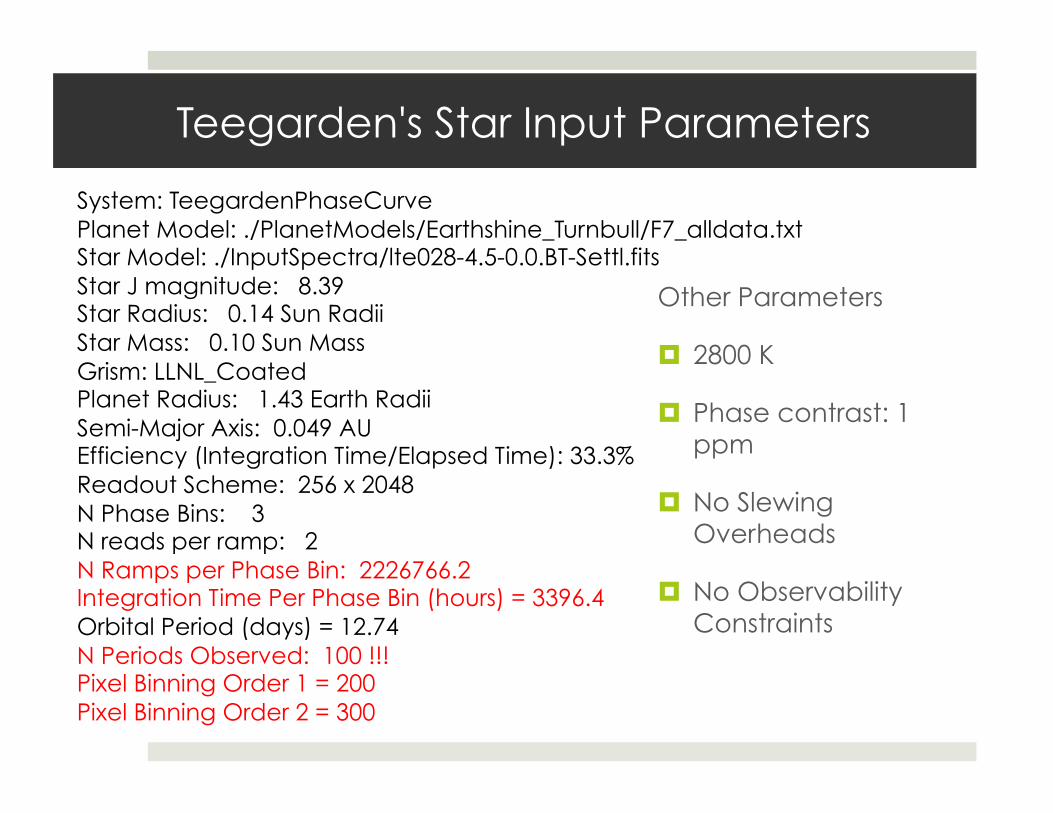
Teegarden's Star Input Parameters
System: TeegardenPhaseCurve Planet Model: ./PlanetModels/Earthshine_Turnbull/F7_alldata.txt Star Model: ./InputSpectra/lte028-4.5-0.0.BT-Settl.fits Star J magnitude: 8.39 Star Radius: 0.14 Sun Radii Star Mass: 0.10 Sun Mass Grism: LLNL_Coated Planet Radius: 1.43 Earth Radii Semi-Major Axis: 0.049 AU Efficiency (Integration Time/Elapsed Time): 33.3% Readout Scheme: 256 x 2048 N Phase Bins: 3 N reads per ramp: 2 N Ramps per Phase Bin: 2226766.2 Integration Time Per Phase Bin (hours) = 3396.4 Orbital Period (days) = 12.74 N Periods Observed: 100 !!! Pixel Binning Order 1 = 200 Pixel Binning Order 2 = 300
Other Parameters
2800 K
Phase contrast: 1 ppm
No Slewing Overheads
No Observability Constraints
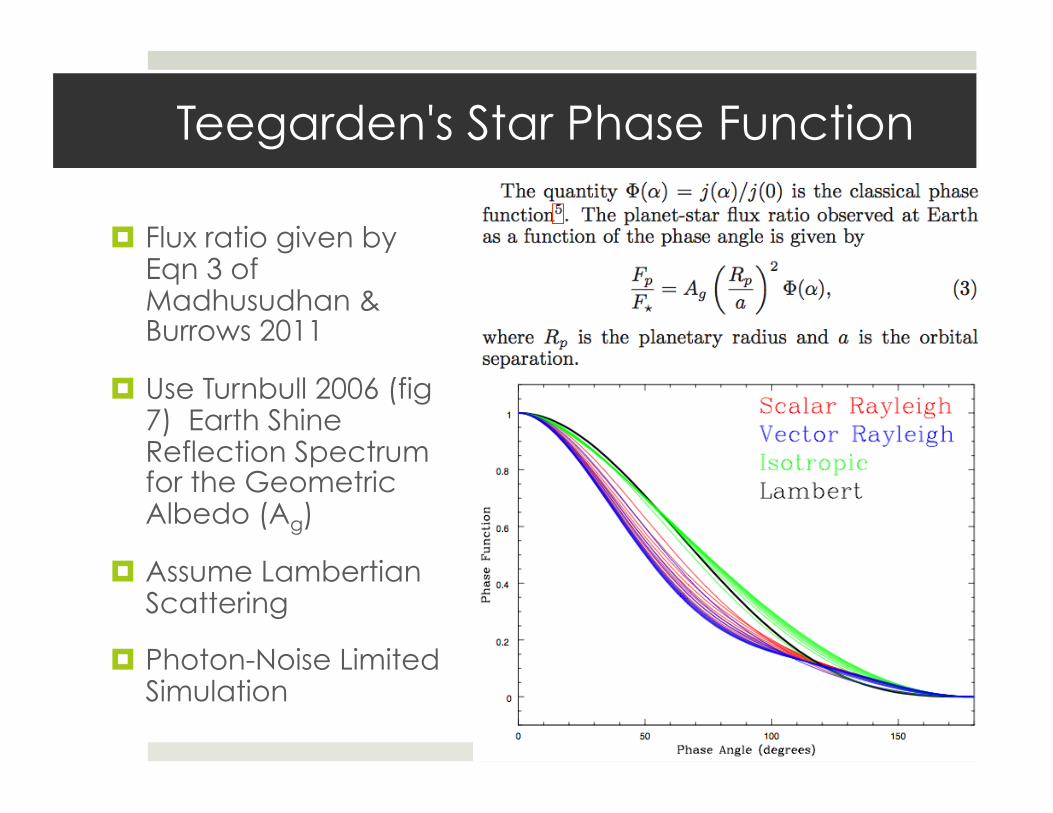
Teegarden's Star Phase Function
Flux ratio given by Eqn 3 of Madhusudhan & Burrows 2011
Use Turnbull 2006 (fig 7) Earth Shine Reflection Spectrum for the Geometric Albedo (Ag)
Assume Lambertian Scattering
Photon-Noise Limited Simulation
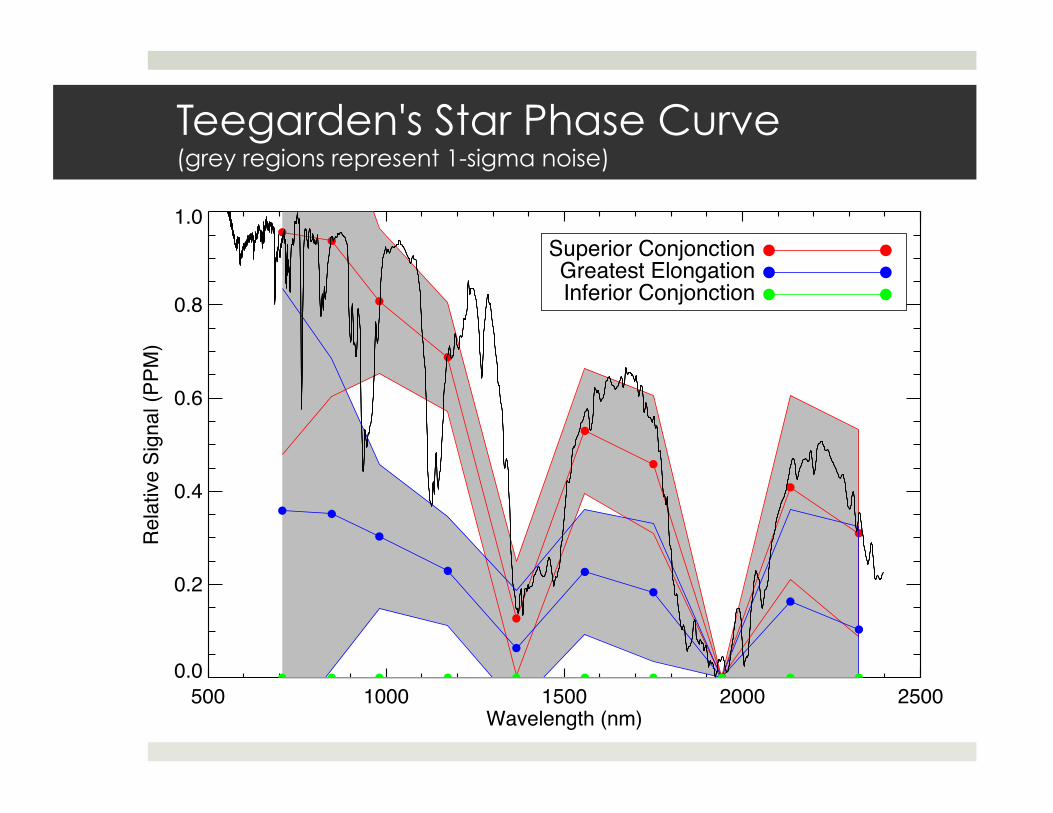
Teegarden's Star Phase Curve (grey regions represent 1-sigma noise)
500 1000 1500 2000 2500Wavelength (nm)
0.0
0.2
0.4
0.6
0.8
1.0
Rel
ativ
e Si
gnal
(PPM
)
Superior ConjonctionGreatest ElongationInferior Conjonction
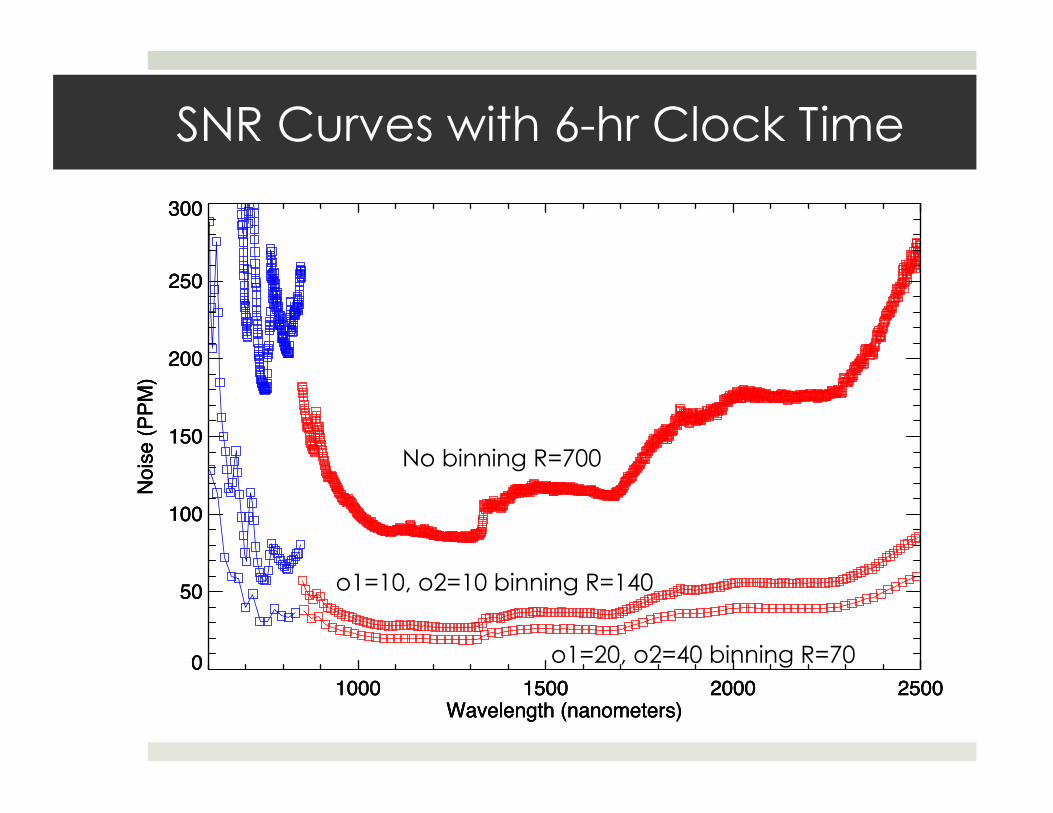
SNR Curves with 6-hr Clock Time
1000 1500 2000 2500Wavelength (nanometers)
0
50
100
150
200
250
300
Noi
se (P
PM)
1000 1500 2000 2500Wavelength (nanometers)
0
50
100
150
200
250
300
Noi
se (P
PM)
1000 1500 2000 2500Wavelength (nanometers)
0
50
100
150
200
250
300
Noi
se (P
PM)
No binning R=700
o1=10, o2=10 binning R=140
o1=20, o2=40 binning R=70
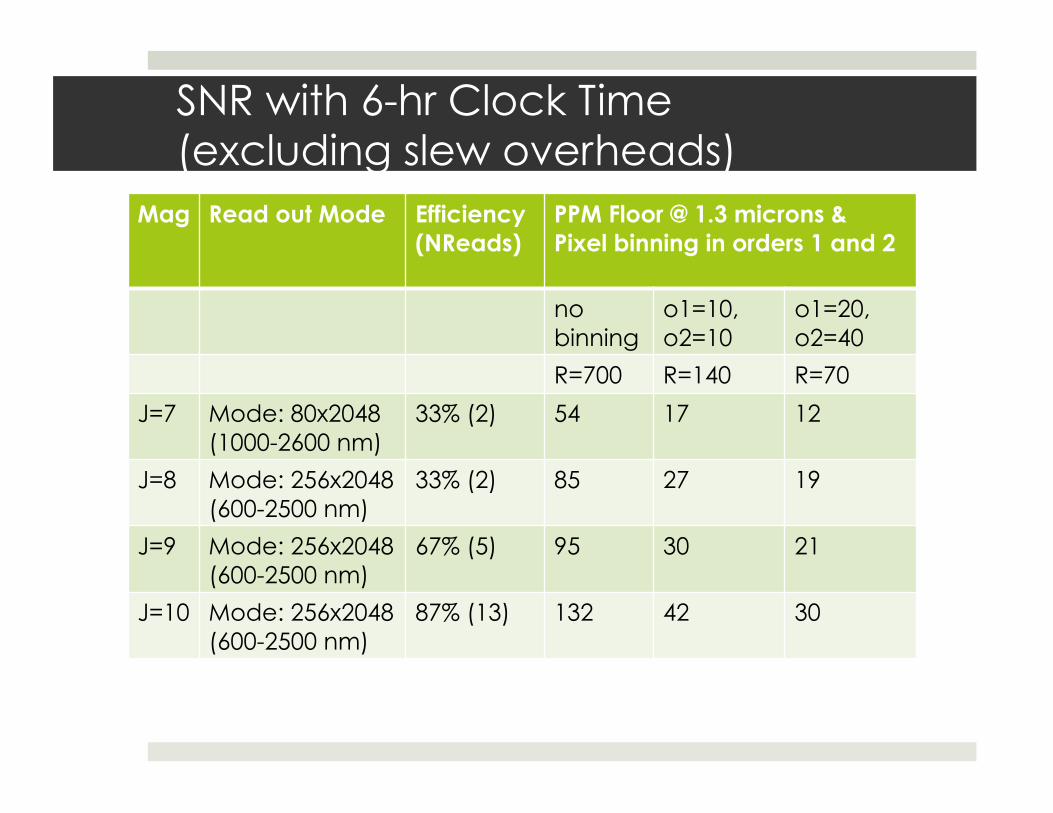
SNR with 6-hr Clock Time (excluding slew overheads)
Mag Read out Mode Efficiency (NReads)
PPM Floor @ 1.3 microns & Pixel binning in orders 1 and 2
no binning
o1=10, o2=10
o1=20, o2=40
R=700 R=140 R=70
J=7 Mode: 80x2048 (1000-2600 nm)
33% (2) 54 17 12
J=8 Mode: 256x2048 (600-2500 nm)
33% (2) 85 27 19
J=9 Mode: 256x2048 (600-2500 nm)
67% (5) 95 30 21
J=10 Mode: 256x2048 (600-2500 nm)
87% (13) 132 42 30