Embed Size (px)
Citation preview
Transitioning Economies:
A Calculus of Competitiveness
C. R. Torrisi Suffolk University
Gokhan Uslu
Suffolk University
This paper analyzes the existing IMD and WEF studies and rankings of national competitiveness and reviews their applicability to a sample (15) of transitioning economies, as defined as developing economies undergoing significant structural and economic transformation. Relevant national competitiveness indicators/variables are identified and a revised weighting system, adapted from the IMD and WEF reports, is used to construct national rankings for the fifteen countries examined. The results indicate significant changes in their relative rankings from these previous studies, except at the extremes of most and least competitive economies, and provide important and useful information to decision makers in the private and public sector. INTRODUCTION AND OVERVIEW In the last two decades, economists, policy makers, and corporate senior executives have increasingly paid attention to the macro factors that influence national competitiveness and impact, constrain, or enhance industry or firm competitiveness at the micro level. In a relatively open and integrated global economy, the linkages between these factors or sources of competitiveness have become more apparent and important, although not always clearly defined or empirically measured. The theoretical literature on firm-specific determinants of competitiveness is well developed and has provided a useful framework for empirical research. Unfortunately, this is not the case for the analysis of national competitiveness factors and tests of their empirical validity. There, certainly, exist well respected and understood indices of national competitiveness performance and rankings, such as those by the World Economic Forum (WEF), the Institute for Management Development (IMD), the Asian Development Bank, and the Institute for Industrial Policy Studies (Republic of Korea). Although comprehensive and utilizing both hard (statistical) and soft (survey) data, these existing indices are often criticized on measurement and methodological issues. Some factors are derived from consistent quantitative date, i.e. economic performance, public finance, productivity, and basic infrastructure. Other factors are evaluated and measured based on management surveys, current legislation, official government policies and subjective assessment of the political, social and institutional environment and overall business climate. Some critics suggest the accuracy and reliability of such data across different countries is suspect and there are inherent biases in survey and subjective or self-reported data, whether from government policy makers or executive decision-makers.
Journal of Applied Business and Economics vol.11(3)

Issues regarding the methodology of data collection, analysis, and reporting are often raised as are questions about weights assigned to different factors. These concerns apply to primarily quantitative measures. However, there have been similar reservations about survey design, sample size, and aggregation of survey data. Lastly, existing major indices attempt to cluster countries either by economic size, level of development, or economic structure and adjust factor weights accordingly, or apply common weights and factors to countries as different as the U.S. and Ukraine, or India and Ireland. Often, the underlying assumption is that economic and social priorities are similar if not identical and national competitiveness is a dominant objective of government policy. In the next section of this paper, the authors examine the two leading “producers” of national competitiveness indices and reports, the World Economic Forum, Global Competitiveness Report and the Institute for Management Development, World Competitiveness Yearbook. In part three, we identify a sample of fifteen countries of relatively similar economic size and transitioning from basic efficiency driven, factor cost competitiveness to innovation and productivity driven competitiveness. Thus, this is a “transition” process of economic restructuring or transformation to meet the competitive challenges of a global economy not simply the past process of adapting to new political/economic systems, as in Eastern Europe. Also, the fifteen countries in our sample, Argentina, Bulgaria, Colombia, Hungary, Kazakhstan, Malaysia, Mexico, Peru, Poland, Romania, South Africa, Thailand, Tunisia, Turkey and the Ukraine have undergone or are undergoing significant political, social, and economic change, which can enhance or occasionally hinder competitiveness. We also report the existing rankings and resulting conclusions from the two major indices. Section four of our paper presents a model of competitiveness factors and weights, building on previous studies, but adapted, to the economic size, structure and priorities of countries in this transitional stage of economic development. We identify factors that we believe are theoretically justifiable, empirically measurable and particularly relevant to economies undergoing structural, economic, and institutional transformation, while fully participating and competing in the global economy. We also utilize a weighting scheme to construct a more useful and comparable index of national competitiveness labeled TECI, Transitioning Economies Competitiveness Index, through a modified clustering or classification scheme. We conclude with a summary of the strengths and weaknesses of our model and its possible relevance to other countries and to managers looking for markets to invest in and source or export from. We expect that private and public decision makers will examine our competitiveness indicators when they assess the national economic environment. We also suggest policy recommendations to enhance national competitiveness and overall economic performance, recognizing that economic and social priorities may differ. Lastly, we identify future research opportunities to test our model empirically and extend it to other countries undergoing similar transformation with relatively open economies of comparable size. WEF AND IMD REPORTS WEF – Global Competitiveness Index (GCI): WEF has published Global Competitiveness Reports since 1979. The report measures and ranks 134 countries in 2008. WEF’s Global Competitiveness Index is based on measurement of 12 different pillars of economic competitiveness and countries are classified as factor driven, efficiency driven, transitioning to innovation driven and innovation driven.
Journal of Applied Business and Economics vol.11(3)

TABLE 1 PILLARS OF ECONOMIC COMPETITIVENESS
Basic Requirements 1st Pillar: Institutions (25%) 2nd Pillar: Infrastructure (25%) 3rd Pillar: Macroeconomic Stability (25%) 4th Pillar: Health and Primary Education (25%) Efficiency Enhancers 5th Pillar: Higher Education and Training (17%) 6th Pillar: Goods Market Efficiency (17%) 7th Pillar: Labor Market Efficiency (17%) 8th Pillar: Financial Market Sophistication (17%) 9th Pillar: Technological Readiness (17%) 10th Pillar: Market Size (17%) Innovation and Sophistication Factors 11th Pillar: Business Sophistication (50%) 12th Pillar: Innovation (50%)
These different pillars impact countries’ competitiveness quite differently. Basic Requirements are key for factor driven economies, Efficiency Enhancers are key for efficiency driven economies and Innovation and Sophistication factors are key for innovation driven economies. For example, the most effective way for Turkey to improve its efficiency driven competitiveness is not the same as, for the US. This is because Turkey and the US are in different stages of development. As countries move along the development path, wages tend to increase, labor productivity improves and economic structure begins to change. According to the GCI, in the first stage, economies are factor-driven and countries in this stage compete based on their endowments, primarily unskilled labor and natural resources. As wages rise with advancing development, countries move into the efficiency-driven stage of development, when they must begin to develop more efficient production processes and increase product quality. Finally, as countries move into the innovation-driven stage, they are able sustain higher wages and the associated standard of living and production shifts to higher value added sectors. Countries are classified by stages of development based on two criteria. The first criterion is the level of GDP per capita at market exchange rates. A second criterion measures the extent to which countries are factor driven. WEF proxies this by the share of exports of primary goods in total exports and assumes that countries that export more than 70% of primary products are to a large extent factor driven. This concept of stages of development is integrated into the GCI by attributing relative weights to those pillars. All 12 pillars matter to a certain extent for all countries, but the importance of each one depends on the country’s particular stage of development. To take this into account, pillars are organized into three sub indexes. The basic requirements sub- index groups those pillars most critical for countries in the factor-driven stage. The efficiency enhancers sub-index includes those pillars critical for countries in the efficiency driven stage. Lastly, the innovation and sophistication factors sub-index includes the pillars critical to countries in the innovation-driven stage. Weights of the three main groups of pillars at each stage of development are shown below;
Journal of Applied Business and Economics vol.11(3)
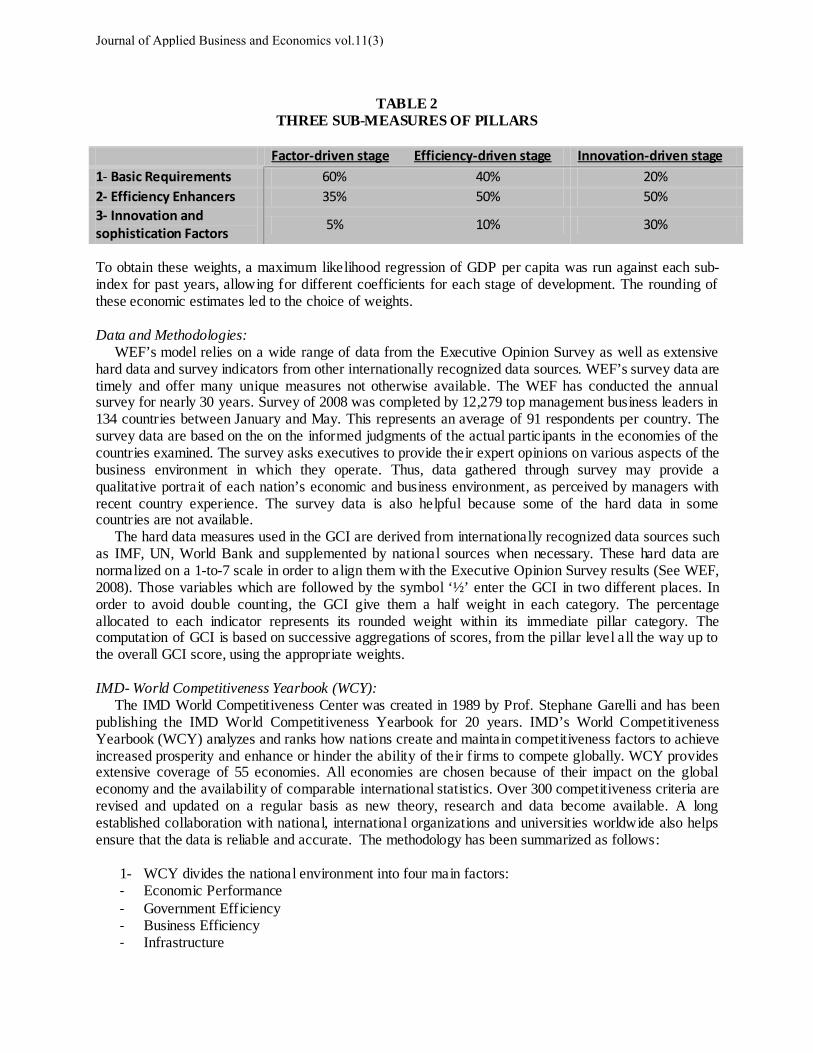
TABLE 2 THREE SUB-MEASURES OF PILLARS
Factor-driven stage Efficiency-driven stage Innovation-driven stage 1- Basic Requirements 60% 40% 20% 2- Efficiency Enhancers 35% 50% 50% 3- Innovation and sophistication Factors 5% 10% 30%
To obtain these weights, a maximum likelihood regression of GDP per capita was run against each sub-index for past years, allowing for different coefficients for each stage of development. The rounding of these economic estimates led to the choice of weights. Data and Methodologies: WEF’s model relies on a wide range of data from the Executive Opinion Survey as well as extensive hard data and survey indicators from other internationally recognized data sources. WEF’s survey data are timely and offer many unique measures not otherwise available. The WEF has conducted the annual survey for nearly 30 years. Survey of 2008 was completed by 12,279 top management business leaders in 134 countries between January and May. This represents an average of 91 respondents per country. The survey data are based on the on the informed judgments of the actual participants in the economies of the countries examined. The survey asks executives to provide their expert opinions on various aspects of the business environment in which they operate. Thus, data gathered through survey may provide a qualitative portrait of each nation’s economic and business environment, as perceived by managers with recent country experience. The survey data is also helpful because some of the hard data in some countries are not available. The hard data measures used in the GCI are derived from internationally recognized data sources such as IMF, UN, World Bank and supplemented by national sources when necessary. These hard data are normalized on a 1-to-7 scale in order to align them with the Executive Opinion Survey results (See WEF, 2008). Those variables which are followed by the symbol ‘½’ enter the GCI in two different places. In order to avoid double counting, the GCI give them a half weight in each category. The percentage allocated to each indicator represents its rounded weight within its immediate pillar category. The computation of GCI is based on successive aggregations of scores, from the pillar level all the way up to the overall GCI score, using the appropriate weights. IMD- World Competitiveness Yearbook (WCY): The IMD World Competitiveness Center was created in 1989 by Prof. Stephane Garelli and has been publishing the IMD World Competitiveness Yearbook for 20 years. IMD’s World Competitiveness Yearbook (WCY) analyzes and ranks how nations create and maintain competitiveness factors to achieve increased prosperity and enhance or hinder the ability of their firms to compete globally. WCY provides extensive coverage of 55 economies. All economies are chosen because of their impact on the global economy and the availability of comparable international statistics. Over 300 competitiveness criteria are revised and updated on a regular basis as new theory, research and data become available. A long established collaboration with national, international organizations and universities worldwide also helps ensure that the data is reliable and accurate. The methodology has been summarized as follows:
1- WCY divides the national environment into four main factors: - Economic Performance - Government Efficiency - Business Efficiency - Infrastructure
Journal of Applied Business and Economics vol.11(3)

2- Each of these factors is divided into 5 sub-factors which highlight every facet of the areas analyzed.
3- These 20 sub-factors comprise more than 300 criteria in total. 4- Each sub-factor has the same weight (5%) in the overall consolidation of results. Sub-factor and
main factor rankings are calculated by utilizing standard deviation method (IMD, 2008), aggregated and indexed to a value of 100 for the top ranked economy.
5- Criteria can be hard data which is taken from international, national and regional organizations and private institutes. Criteria also can be survey data which is drawn from Executive Opinion Survey (3960 respondents). Hard data represent a weight of 2/3 in the overall ranking whereas the survey data represent a weight of 1/3.
6- In addition, some criteria are for background information only, which means that they are not used in calculating the overall competitiveness ranking.
7- Aggregating the results of the 20 sub-factors makes the country index, which leads to the overall ranking of the WCY.
TABLE 3
FACTORS AND CRITERIA
Economic Performance
Government Efficiency
Business Efficiency Infrastructure
Domestic economy Public finance Productivity Basic infrastructure International trade Fiscal policy Labor market Technological infrastructure
International investment Institutional framework Finance Scientific infrastructure Employment Business legislation Management practices Health and environment
Prices Societal framework Attitudes and values Education As WEF’s Global Competitiveness Index, IMD’s World Competitiveness Yearbook creates its’ ranking based on hard data and survey data. The survey data measures competitiveness as it is perceived whereas the hard data shows how competitiveness is measured over a specific period of time. The Survey is sent to executives in top and middle management in all of these economies covered by the WCY. The survey was designed to quantify issues that are not easily measured such as management practices, labor relations, corruption and quality of life. Responses reflect present and future perceptions of competitiveness by business executives who are currently dealing with international business situations. Thus, their responses may be more recent since there is less time lag, which is often a problem with hard data that reports past performance. COUNTRY PROFILES: WEF AND IMD REPORTS Argentina: Argentina has a population of 34.4 million as of 2007. The country’s GDP has increased to $260.7 billion and GDP per capita reached $12,916 in 2007. WEF classifies Argentina as an efficiency-driven economy. In 2008, WEF’s GCI ranked Argentina 88 out of 130 whereas IMD’s WCY ranked 52 (out of 55). The most problematic factors for doing business include inflation, corruption, political instability and access to financing. Challenges faced in 2008 are transparency and quality of economic information, bottlenecks in the energy and transportation sectors and unreliable business environment to encourage local and international investments. According to IMD, Argentina’s ranking has improved in ‘exports of goods’, ‘consumer price inflation’ and ‘central government foreign debt’ in 2008 but has decreased in ‘transparency of government policy’, ‘direct investment flows abroad’ and ‘current account balance’. Bulgaria:
Journal of Applied Business and Economics vol.11(3)

Bulgaria has a population of 7.64 million as of 2007. The country’s GDP has increased to $39.6 billion and GDP per capita reached $11,007 in 2007. WEF classifies Bulgaria as an efficiency-driven economy. In 2008, WEF’s GCI ranked Turkey 76 whereas IMD’s WCY ranked 39 (out of 55). The most problematic factors for doing business include corruption, inefficient government bureaucracy, inadequately educated work force and inadequate supply of infrastructure. Challenges faced in 2008 are government strategic, long-term policy planning and accountability, reform secondary and higher education and the R&D sector to produce a more skillful and flexible labor force and improving gray economy, corruption and organized crime. According to IMD, Bulgaria’s ranking has improved in ‘direct investment stocks abroad and inward’, ‘productivity of companies’ and ‘urbanization of cities’ in 2008 but has decreased in ‘bribing and corruption’, ‘current account balance’ and ‘social cohesion’. Colombia: The country has a population of 47 million. GDP has reached $171.6 billion and GDP per capita has increased to $3,611.5 in 2007. WEF classifies Colombia as an efficiency-driven economy. In 2008, WEF ranked 74 whereas IMD ranked Colombia 41 (out of 55 countries). The most problematic factors include tax rates, corruption, inefficient government bureaucracy and tax regulations. Challenges faced in 2008 are promoting national and regional competitiveness system, promoting formalization of economic activities and encouraging private capital for the improvement of the country’s strategic infrastructure. According to IMD, Colombia’s ranking has improved in ‘direct investment flows inward’, ‘central government foreign debt’ and ‘the image abroad of the country’ in 2008 but has decreased in ‘long term unemployment’, ‘consumer price inflation’ and ‘current account balance.’ Hungary: Hungary has a population of 10.07 million as of 2007. The country’s GDP has increased to $138 billion and GDP per capita has reached $18,509 in 2007. WEF classifies Hungary as a transition economy between efficiency-driven and innovation-driven. In 2008, WEF’s GCI ranked Hungary 62 whereas IMD’s WCY ranked 38 (out of 55). The most problematic factors for doing business include tax regulations, tax rates, policy instability and inefficient government bureaucracy. Challenges faced in 2008 are attaining macroeconomic stability through the reduction of public expenditure, improving incentives to work in the welfare system and using EU structural funds to maximum effect. According to IMD, Hungary’s ranking has improved in ‘GDP per capita’, ‘stock market capitalization’ and ‘central bank policy’ in 2008 but has decreased in ‘bribing and corruption’, ‘real GDP growth’ and ‘real corporate taxes’. Kazakhstan: Kazakhstan has a population of 15.2 million as of 2007. The country’s GDP was $171.7 billion in 2007 and GDP per capita reached $11,200. WEF classifies Kazakhstan as a transition economy between factor driven and efficiency driven economies. In 2008, WEF’s GCI ranked Kazakhstan 66 whereas IMD did not include the country in the latest WCY report. The most problematic factors for doing business include corruption, tax regulations, inflation, tax rates and access to financing. According to CIA’s World Factbook, the country has embarked upon an industrial policy designed to diversify the economy away from overdependence on the oil sector by developing its manufacturing potential. The policy changed the corporate tax code to favor domestic industry as a means to reduce the influence of foreign investment and to diversify the economy. The government has engaged in several disputes with foreign oil companies over the terms of production agreements, most recently, with regard to the Kashagan project in 2007-08. Malaysia: Malaysia has a population of 27.17 million as of 2007. The country’s GDP has increased to $186.5 billion and GDP per capita has reached $12,808 in 2007. WEF classifies Malaysia as an efficiency-driven economy. In 2008, WEF’s GCI ranked Malaysia 21 whereas IMD’s WCY ranked 19 (out of 55). The most problematic factors for doing business include inefficient government bureaucracy, corruption,
Journal of Applied Business and Economics vol.11(3)
crime and theft and inflation. Challenges faced in 2008 are achieving a customer centric, innovative and proactive public service, leveraging on public-private partnerships to move the economy up to value chain and enhancing a scientific and technological infrastructure to meet the need of a competitive economy. According to IMD, Malaysia’s ranking has improved in ‘direct investment stocks abroad’, ‘exports of commercial services’ and ‘stock market capitalization’ in 2008 but has decreased in ‘bribing and corruption’, ‘tax evasion’ and ‘labor regulations’ Mexico: Mexico has a population of 106.68 million as of 2007. The country’s GDP has increased to $948 billion and GDP per capita has reached $12,289 in 2007. WEF classifies Mexico as an efficiency-driven economy. In 2008, WEF’s GCI ranked Turkey 60 whereas IMD’s WCY ranked 50 (out of 55). The most problematic factors for doing business include inefficient government bureaucracy, corruption, inadequate supply of infrastructure and restrictive labor regulations. Challenges faced in 2008 are promoting structural reforms such as education, labor energy and fiscal, improving business environment and reduce business regulation, improving financial system by increasing savings and providing more credit to businesses. According to IMD, Mexico’s ranking has improved in ‘government budget surplus/deficit’, ‘direct investment flows inward’ and ‘stock market capitalization’ in 2008 but has decreased in ‘real GDP growth’, ‘energy infrastructure’, and ‘educational system’. Peru: Peru has a population of 28.8 million as of 2007. The country’s GDP has increased to $109.1 billion and GDP per capita has reached $7,404 in 2007. WEF classifies Peru as an efficiency-driven economy. In 2008, WEF’s GCI ranked Peru 83 whereas IMD’s WCY ranked 35 (out of 55). The most problematic factors for doing business include restrictive labor regulations, corruption, inefficient government bureaucracy and inadequate supply of infrastructure. Challenges faced in 2008 are developing an educational reform, increasing investment in infrastructure and services emphasizing technology and know-how and increasing efficiency of the public sector. According to IMD, Peru’s ranking has improved in ‘collected total tax revenues’, ‘real GDP growth’ and ‘employment’ in 2008 but has decreased in ‘overall productivity’, ‘country credit rating’ and ‘total expenditure on R&D’ Poland: Poland has a population of 38.5 million as of 2007. It’s GDP has reached $420.3 billion and GDP per capita has increased to $11,041.2 in 2007. WEF classifies Poland as a transition economy between efficiency-driven and innovation-driven. In 2008, WEF ranked Poland 53 whereas IMD ranked 44 (out of 55 countries). The most problematic factors for doing business include tax regulations, inefficient government bureaucracy and inadequate supply of infrastructure. Challenges faced in 2008 are restructuring public sector expenditure, reforming national education, tax reforms, programs for youth employment and job opportunities. According to IMD, Poland’s ranking has improved in ‘direct investment stocks abroad, ‘the risk of political instability’ and ‘knowledge transfer in 2008 but has decreased in ‘consumer price inflation’, ‘current account balance’ and ‘product and service legislation.’ Romania: Romania has population of 21.5 million. The country’s GDP has reached $166 billion and GDP per capita has increased to $7,697.2 in 2007. WEF classifies Romania as an efficiency-driven economy. In 2008, WEF ranked 68 whereas ranked 45 (out of 55 countries). The most problematic factors for doing business include political instability, tax rate, tax regulations and inefficient government bureaucracy. Challenges faced in 2008 are reducing corruption, improving the efficiency of macroeconomic policy to moderate inflationary pressures and strengthening public administration. According to IMD, Romania’s ranking has improved in ‘GDP per capita’, ‘real corporate taxes’ and ‘the risk of political instability’ in 2008 but has decreased in ‘bureaucracy’, ‘regulation intensity’ and ‘effective personal income tax rate.’ South Africa:
Journal of Applied Business and Economics vol.11(3)

South Africa has a population of 47.85 million as of 2007. The country’s GDP has increased to $282.6 billion and GDP per capita has reached $9,459 in 2007. WEF classifies South Africa as an efficiency-driven economy. In 2008, WEF’s GCI ranked South Africa 45 whereas IMD’s WCY ranked 53 (out of 55). The most problematic factors for doing business include inadequately educated workforce, crime and theft, inefficient government bureaucracy and inadequate supply of infrastructure. Challenges faced in 2008 are reducing the cost of doing business to enhance productivity and competitiveness, developing human capital and strengthen the national skill base and maintaining a stable economic environment. According to IMD, South Africa’s ranking has improved in ‘direct investment inward’, ‘government budget surplus/deficit’ and ‘stock market capitalization’ in 2008 but has decreased in ‘consumer price inflation’, ‘transparency of government policy’ and ’direct investment flows abroad’ Thailand: Thailand has a population of 65.3 million as of 2007. It’s GDP has increased to $245.7 billion and GDP per capita has reached $3,736.8 in 2007. WEF classifies Thailand as an efficiency-driven economy. In 2008, WEF ranked Thailand 34 whereas IMD ranked 27 (out of 55 countries) According to WEF’s GCI, Thailand’s overall ranking has decreased from 28 to 34 in 2008. The most problematic factors for doing business include government instability, political instability, inefficient government bureaucracy and corruption. Challenges faced in 2008 are inflation, building up investor’s confidence by speeding up public investment projects to improve infrastructure, and energy efficiency. According to IMD, Thailand’s ranking has improved in ‘current account balance’, ‘consumer price inflation’ and ‘long term unemployment’ in 2008 but has decreased in ‘government deficit’, ‘transparency of government policy’ and ’cost of capital.’ Tunisia: Tunisia has a population of 10.3 million as of 2007. The country’s GDP has increased to $78.21 billion and GDP per capita has reached $7,600 in 2007. WEF classifies Tunisia as an efficiency-driven economy. In 2008, WEF’s GCI ranked Tunisia 36 whereas IMD didn’t include the country in the latest WCY report. The most problematic factors for doing business include access to financing, inefficient government bureaucracy, restrictive labor regulations and poor work ethic in national workforce. Challenges faced in 2008 are privatization of publicly owned companies, liberalizing the investment code to increase foreign investment, improving government efficiency and reducing the trade deficit. Turkey: Turkey has a population of 75.2 million as of 2007. The country’s GDP has increased to $663.4 billion and GDP per capita has reached $9,629 in 2007. WEF classifies Turkey as a transition economy between efficiency-driven and innovation-driven. In 2008, WEF’s GCI ranked Turkey 63 whereas IMD’s WCY ranked 48 (out of 55). The most problematic factors for doing business include inefficient government bureaucracy, tax regulations, political instability and access to financing. Challenges faced in 2008 are EU negotiations, distressed international financial markets, the underground economy, overall business and investment environment. According to IMD, Turkey’s ranking has improved in ‘direct investment outflows’, ‘central government foreign debt’ and ‘intellectual property rights’ in 2008 but has decreased in ‘government deficit’, ‘transparency of government policy’ and ’direct investment flows inward.’ Ukraine: Ukraine has a population of 46.5 million as of 2007. The country’s GDP has increased to $140.5 billion and GDP per capita has reached $6,707 in 2007. WEF classifies Ukraine as an efficiency-driven economy. In 2008, WEF’s GCI ranked Ukraine 72 whereas IMD’s WCY ranked 54 (out of 55). The most problematic factors for doing business include political instability, inflation, tax rates and corruption. Challenges faced in 2008 are tackling inflation, handling the increase of internal corporate debts, boosting the pace of construction and reducing dependence on volatile global markets. According to IMD, Ukraine’s ranking has improved in ‘direct investment flows abroad’, ‘stock market capitalization’ and
Journal of Applied Business and Economics vol.11(3)
‘GDP per capita’ in 2008 but has decreased in ‘current account balance’, ‘real personal taxes’ and ‘social cohesion’. Scaling Methodology WEF: Our ratings are based on seven pillars that we believe are the most important for the countries which we have examined. In addition, we assigned different weights to three main groups of pillars at each stage of development. We used 50% for efficiency enhancers, 30% for basic requirements and 20% for innovation and sophistication factors. WEF weights are 50% for efficiency enhancers, 40% for basic requirements and 10 for innovation and sophistication factors. To calculate our rankings, we applied these adjusted weights to the WEF country scores for each of the seven pillars. IMD: IMD’s ratings are based on four main factors (Economic Performance, Government efficiency and Business Efficiency and Infrastructure). Each of these main factors is divided into five sub-factors with a weight of 5% for each sub-factor. Our adjusted rating is based on three crucial sub-factors in each of these four main factors. We also assigned different weights to each sub-factor. Since IMD reports give us just the ordinal ratings of countries, we had to scale these ratings to apply our adjusted weights for our three sub-factors. Briefly, we assigned 100 to the country which has the highest ranking in a sub-factor. We used reverse proportion method to assign a scaled value to the other countries based on their rankings. After we scaled all country rankings, we applied our adjusted weights to each of the sub-factors we have chosen. COMPETITIVENESS FACTORS FOR TRANSITIONING ECONOMIES As discussed earlier, both the WEF and IMD competitiveness indices are well developed and recognized globally as useful measures of country national competitiveness rankings. The former ranks 134 countries, across all dimensions of economic size and stage of development. The latter ranks 55 equally diverse economies, chosen as key players in world markets “because of their impact on the global economy and the availability of comparable international statistics”. We propose a model that blends factors identified as key determinants of national competitiveness in these indices and emphasizes those that are both relevant and specific to countries that are in this transition stage of restructuring, developing, and effectively competing in an integrated, open global economy. In terms of measurement and methodology, our transitioning economies competitiveness index (TECI) emphasizes the use of hard statistical data that is considered accurate, reliable, and comparable (primarily country and IMF data). Our index relies less on the use of subjective, soft survey data, as the authors share concerns raised about the biases inherent in survey design and the reliability of the respondent samples, particularly for transition economies and young, new, dynamic companies and sectors. Of course, some of our indicators are more qualitative and influenced by managerial opinions and perceptions. An important methodological issue, regardless of the number and type of criteria/competitiveness factors, is the relative weights assigned to the factors and sub-factors used to construct the indices. As discussed previously, the IMD World Competitiveness Yearbook gives each of its twenty sub-factors the same weight, regardless of the number of criteria, in constructing its country rankings by factor and overall. Each economy’s performance is measured by the Standard Deviation Method, which measures the relative difference between each country’s performance and computes standardized values for the 55 economies for each of the 254 criteria. A weighted average for criteria that comprise each sub-factor is calculated, with hard data having twice the weight of soft survey data. Factor rankings are aggregated and indexed to a value of 100 for the top ranked economy (IMD, 2008). The WEF, Global Competitiveness Report uses non-uniform weighting of each country’s indicators, which are combined into the twelve pillars of competitiveness. Economies, as discussed, are classified as factor driven, efficiency driven, transitioning to innovation driven, or innovation driven, given their particular stage development. The pillars are organized into three sub-index groups by combining pillars
Journal of Applied Business and Economics vol.11(3)

that are critical to each stage of development, basic requirements, efficiency enhancers, and innovation and sophistication factors. Each sub-index is weighted differently by stage of developments as presented earlier (WEF, 2008). Building on the criteria and classification schemes of IMD and the WEF, the fifteen countries in our study can be grouped as in transition from efficiency driven to innovation driven, although at different stages in this process. Thus, the authors believe the essential pillars critical to their competitiveness are institutional structure, macroeconomic stability, higher education and training, goods market efficiency, financial market sophistication, technological readiness and innovation. The criteria or factors that measure performance in each pillar are identified in The Global Competitiveness Report and are reported for the countries in our sample. Of course these pillars are interrelated and usually reinforce each other. These pillars cross the three stages of development, as should be expected for transition economies. The first two are basic requirements criteria, the last, innovation, is key for innovation driven economies and the other four are classified as efficiency enhancers for efficiency driven economies. As discussed, our weighting for transitioning economies of each sub-index in our competitiveness index is 30% basic requirements, 50% efficiency enhancers, and 20% innovation factors. The IMD main factor categories for competitiveness are economic performance, government efficiency, business efficiency and infrastructure. Each of these is divided into five sub-factors as previously mentioned. Each of these sub-factors is given the same weight of 5% in the calculation of the index and rankings. Through a similar process of analyzing the 20 sub-factors, calculated with over 300 criteria, in the IMD World Competitiveness Yearbook, we identify twelve factors we believe are critical to the competitiveness of our transitioning economies. The twelve sub-factors which we believe are most relevant and measurable for countries in our sample and similar economies are as follows. For factor one, key are size, growth and wealth of the domestic economy, international trade data, and international investment performance. For factor two, public finance, institutional framework, and business legislation are crucial. The important sub-factors in measuring business efficiency are productivity, financial markets efficiency and management practices. Lastly for the infrastructure factor, our TECI competitiveness index includes technological infrastructure, scientific infrastructure, and education measures and outcomes. The criteria to measure and rank each country in these sub-factor categories are essentially driven by hard data, objective and measurable, with limited soft (survey data) which is subjective and based on perception. Our sub-factors have non-uniform weighting of 6% to 10%, with the following specific weights:
TABLE 4 FACTOR WEIGHTS
Economic Performance Weights Government Efficiency Weights
Domestic Economy 8% Public Finance 6% International Trade 8% Institutional Framework 8%
International Investment 8% Business Legislation 10%
Business Efficiency Weights Infrastructure Weights Productivity 10% Education 10%
Financial Markets Efficiency 10% Technological Infrastructure 8% Management Practices 6% Scientific Infrastructure 8%
Journal of Applied Business and Economics vol.11(3)
Thus, our model for economies in the transition phase from efficiency driven to innovation driven places slightly greater weights on business efficiency and human capital and infrastructure sub-factors. However, as is obvious for countries in economic and, perhaps, political transition, basic economic performance and government efficiency factors are still of major importance. Our sub-factors for national competitiveness fit well the specific WEF pillars identified as relevant for our fifteen country sample. A further strength of our model is that measurement issues are minimized by the reliance on hard, statistical data which is comparable rather than soft, potentially biased survey data. Of the twelve sub-factors we include, only management practices and institutional efficiency are based to any substantial degree on subjective perceptions. Obviously identifying the relevant sub-factors and collecting accurate data independently for this study would allow us to construct our own country indices and rankings but is truly a daunting and time consuming task. Thus, we utilize the data provided by the WEF in their Global Competitiveness Index (GCI) calculation of country score on a 1 to 7 scale for each pillar of competitiveness, with the U.S. ranked first in efficiency enhancers with 5.81 and innovation with 5.80 and Finland ranked first in basic requirements with 6.18, using the WEF indexing method (WEF, 2008). We then calculate a revised and reweighted average score for each country in our sample for our seven key pillars of competitiveness and provide a relative country ranking for our fifteen economies. We also recalculate IMD World Competitiveness Yearbook country rankings utilizing only the 12 sub-factors of competitiveness we have identified as crucial to transitioning economies. However, since the IMD provides only an ordinal ranking of 55 countries, we convert their rankings by scaling based on the highest ranking in each of the 12 sub-factors for only the countries in our sample. For example, for international trade Malaysia was ranked number 5 and was given a value of 100, Poland was ranked 23rd for this sub-factor and was given a value 21.74 by applying a reverse proportion method (5*100/23=21.74), Turkey was ranked 46th for the same sub-factor and was given a value of 10.87 by using the same methodology. We then apply our adjusted weights for each sub-factor to the rescaled country scores and subsequently measure the adjusted relative ranking of the fifteen countries in our sample. SUMMARY AND CONCLUSIONS In this study, we have utilized the two most recognized and important global reports on national competitiveness, the IMD and WEF Yearbooks. We have then identified the seven WEF “pillars” of competitiveness that seem particularly relevant to our fifteen transitioning economies and the twelve sub-factors, based on the IMD World Competitiveness Yearbook, that are applicable and crucial for these economies. Thus, to construct and calculate our TECI, each “pillar” can be assessed with measurable, primarily hard data for our fifteen country sample and related to the twelve sub-factors we have selected. Obviously, many of the crucial sub-factors overlap and influence a number of “pillars” of competitiveness and can contribute to or hinder national and firm competitiveness. Our sub-factor weights reflect the relative importance of the criterion and its impact on one or two “pillars” of competitiveness in our model. Although the countries in our sample differ significantly by geography, history, culture and politics, in terms of economic size and structure they are similar and all have accelerated in the last decade the pace of transition to market-driven and innovation-driven economies. Also, there is available for each country comparable, “hard” statistical data. Our adjusted average score for the seven pillars and fifteen countries selected range from Argentina, 3.57 to Malaysia, 4.84, compared to 3.87 and 5.04 respectively in the WEF GCI average score. Of course, it is no surprise that our adjusted scores for each country fall below the GCI score since we weight more highly innovation in our study than the GCI for efficiency driven economies and weight basic requirements less than in the GCI report. Our countries aspire to transition to the innovation driven stage but current performance in the key pillars necessary for such transformation lag.
Journal of Applied Business and Economics vol.11(3)

When we recalculate country IMD rankings, including only our twelve key sub-factors, each country also drops in the world competitiveness rankings some slightly and others significantly from Turkey (48 to 49) to Thailand (27 to 46) based on their sample of the 55 economies who are deemed key players in the world markets and have comparable reliable statistics (Kazakhstan and Tunisia are not included). However, caution must be advised in interpreting these IMD revised rankings, since these are ordinal measures and have not been recalculated for all 55 countries. Thus, we emphasize and compare only the relative rankings for our fifteen countries from our TECI model to the relative IMD rankings. It is interesting to note that the relative rankings are unchanged at the top and bottom but there are significant changes for the remaining twelve countries. It is also interesting to note that we calculated the mean and standard deviation of the competitiveness adjusted scores for our fifteen countries and clustered countries by performance. The high performing economies in 2008 were Malaysia, Tunisia, and South Africa and the low performing economy was Argentina. The other eleven countries were all within one standard deviation of the sample mean. Utilizing our 12 identified IMD sub-factors and our adjusted weights, the table below compares the relative rankings for thirteen countries included in the IMD World Competitiveness Yearbook (Kazakhstan and Tunisia were not reported).
TABLE 5
COMPETITIVENESS FACTORS
WEF IMD
1 Institutional Structure Public Finance (Basic Requirement) Institutional Framework 2 Macroeconomic Stability Domestic Economy (Basic Requirement) International Trade and Investment 3 Higher Education/Training Productivity (Efficiency Enhancer) Education 4 Goods Market Efficiency Business Legislation (Efficiency Enhancer) Management Practices 5 Financial Market “Sophistication” Financial Markets Efficiency (Efficiency Enhancer) Public Finance 6 Technological Readiness Technological Infrastructure (Efficiency Enhancer) Education 7 Innovation Scientific Infrastructure (Innovation Factor) Education
Journal of Applied Business and Economics vol.11(3)

TABLE 6 COUNTRY WEF RANKINGS
Relative WEF
Ranking TECI
Ranking Ranking Change
1 Malaysia Malaysia None 2 Thailand Tunisia Up 3 Tunisia South Africa Up 4 South Africa Thailand Down 5 Poland Hungary Up 6 Mexico Poland Down 7 Hungary Romania Up 8 Turkey Turkey None 9 Kazakhstan Bulgaria Up
10 Romania Mexico Down 11 Ukraine Kazakhstan Down 12 Colombia Ukraine Down 13 Bulgaria Colombia Down 14 Peru Peru None 15 Argentina Argentina None
TABLE 7
COUNTRY IMD RANKINGS
Relative IMD Ranking
TECI Ranking
Ranking Change
1 Malaysia Malaysia None 2 Thailand Hungary Up 3 Peru Bulgaria Up 4 Hungary Thailand Down 5 Bulgaria Peru Down 6 Colombia Poland Up 7 Poland Ukraine Up 8 Romania Turkey Up 9 Turkey South Africa Up
10 Mexico Romania Down 11 Argentina Colombia Down 12 South Africa Argentina Down 13 Ukraine Mexico Down
Journal of Applied Business and Economics vol.11(3)

For the thirteen countries analyzed in the IMD Yearbook, Malaysia retained its top relative ranking with the others moving up or down in the TECI ranking. Our analysis and TECI index confirms Malaysia as a leader in national competitiveness among transitioning economies, the improving competitiveness of Central/Eastern Europe countries and South Africa and the declining competitiveness of the Latin American economies in our category of transitioning economies. Our relative rankings differ from both the WEF and IMD rankings for our sample. The authors believe that our TECI index is a more appropriate measure for countries in this stage of economic transformation and reflects more realistically the level and trend of national competitiveness among countries at similar stages of transformation. These countries are competing in this global economy with many other developing countries, including the BRICs, whose economic size and share of global economic activity is so much greater. However, these fifteen countries are directly competing with each other in terms of economic growth and structural transformation, export and inward FDI competitiveness, and transitioning to a more diverse and innovation driven economy. It is a race that many of them need to run and win and is increasingly more challenging in this recessionary and uncertain global economy. Our future research will attempt to identify by country the specific strengths and weaknesses impacting competitiveness as indicated by closer examination of performance and ranking in the specific pillars and sub-factors measured in our study. With country comparative analysis, it may then be possible to explain why Malaysia has recently ranked high in competitiveness among transitioning economies and Argentina quite low, for example. Thus, future study of these results will have policy implications and allow us to suggest policy recommendations to address country obstacles to enhancing competitiveness. We also hope to empirically test our model with 2009 data reflecting the current decline in world trade and investment and national economic activity. Subsequently, we will extend our TECI model to a larger number of transitioning economies of similar stage and structure, given availability of reliable data. Future research will attempt to cluster our transition economies on a regional basis and/or by economic size (see ADB, 2006) and calculate competitiveness rankings on a more comparable basis. In any case, future research must continue to build on the growing literature on national competitiveness and on the extensive, detailed, and widely recognized reports of the WEF and IMD. The authors hope that the TECI index is a useful contribution to understanding how transitioning economies and their enterprises can compete and benefit from the open, global economy. However, current rankings will impact future economic behavior, decisions, and goals. The long-term value of this “calculus” of competitiveness, therefore, is to government policy makers and private sector decision-makers. The former need to design economic and monetary policies and institutional changes that accelerate economic transition, while enhancing the key competitiveness factors, which the authors have attempted to identify. Enacting and implementing business legislation that encourages entrepreneurship, stimulates technological and scientific infrastructure, and fosters and rewards innovation is crucial for all transition economies. Perhaps of even greater policy importance is increasing investment in education at the secondary and university level in business, engineering, and the sciences with the goal of raising productivity whether in efficiency driven or innovation driven sectors. Generating capital, entrepreneurship, and innovation from the private sector companies will require policies that stimulate real economic growth, international investment, and export competitiveness. Transparency and stability in public finance and efficient management of the public sector must be combined with monetary and regulatory policies to enhance financial market stability and efficiency as a priority of the government. Certainly, this is a major challenge for transitioning economies given the global financial crisis and economic recession, but in the current environment more crucial than ever. In the private sector, managers and decision makers, whether domestic or foreign, will continue to monitor these factors and sub-factors of national competitiveness and measure the strengths and weaknesses of each economy as they impact industry or firm performance and perceptions of national competitiveness. Businesses will examine the factor and relative rankings of the various host economies, track trends in these rankings on a regional or global basis, and identify transitioning economies by
Journal of Applied Business and Economics vol.11(3)

performance, policy and potential as opportunities for profitable investment, innovation, and growth. Thus, the private sector and the public sector may together create a ‘virtuous circle” of economic growth, effective economic transformation, and growing national competitiveness. BIBLIOGRAPHY ADB Institute, 2004 “ Industrial Competitiveness: The Challenge for Pakistan”. Competitiveness Institute Regional Conference for Asian and the Pacific, Islamabad. Bloom, N., and J. Van Reenen, 2007 “Measuring and Explaining Management Practices Across Firms and Countries.” Quarterly Journal of Economics 122 (4):1351-1408. Central Intelligence Agency,2007-2008, World Factbook, Washington, D.C. Cho,D.S., Moon, H.C., Kim, M.Y., 2006 “Competitive Strategy to Enhance National Competitiveness”. In: Proceedings in Academy of International Business 2006. Annual Meeting, Beijing, China, June 23-26. De Hann, J.S. Lundstrom and J. Sturm, 2006. “Market-Oriented Institutions and Policies and Economic Growth: A Critical Survey.” Journal of Economic Surveys 20 (2) 157-91. Fagerberg, J., M. Srholec, and M. Knell, 2007. “The Competitiveness of Nations: Why Some Countries Prosper While Others Fall Behind.” World Development 35 (10): 1595-1620. IMD, 2004-2008. World Competitiveness Yearbooks. Lausanne: International Institute for Management Development. IMF, 2008c. World Economic Outlook Database. April 2008. IPS, 2005. IPS National Competitiveness Research 2005 Report. Seoul, Korea. Moon, H.C., Rugman, A.M., Verbeke, A., 1998. “A Generalized Double Diamond Approach to the Global Competitiveness of Korea and Singapore”. International Business Review. 7, 135-150. Krugman, P.R., 1996. “Making Sense of the Competitiveness Debate”. Oxford Review of Economic Policy, 12(3), 17-25. Lall, S., 2000. “The Technological Structure and Performance of Developing Country Manufactured Exports, 1985-98”. Oxford Development Studies, 28(3), 337-69. Lall, S., 2001. “Competitiveness Indices and Developing Countries: An Economic Evaluation of the Global Competitiveness Report.” World Development 29 (9): 1501-25. Porter, M.E., 1998a. “The Competitive Advantage of Nations: With a New Introduction”. New York: The Free Press. Porter, M.E., 2003. “The Economic Performance of Regions.” Regional Studies 37(6&7): 549-678. Rodrik, D., A. Subramanian, and F. Trebbi.,2004. “Institutions Rule: The Primacy of Institutions over Geography and Integration in Economic Development.” Journal of Economic Growth 9 (2): 131-65. UNCTAD (United Nations Conference on Trade and Development), World Investment Report 2007,
Journal of Applied Business and Economics vol.11(3)

2008. Geneva. US Department of Commerce, 1994. “ Competing to Win in a Global Economy”. Annual report to Congress, Washington, DC: US Government Printing Office World Bank. 2005. “Economic Growth in the 1990s: Learning from a Decade of Reform”. Washington, DC: The World Bank. World Bank, 2008b. “Doing Business, 2008”. Washington, DC: The World Bank. World Economic Forum, 2004-2008. “The Global Competitiveness Report”. By Schwab, K., Porter, M.E., Sachs, J.D., Warner, A.M. and Levinson, M. Oxford: Oxford University Press.
Journal of Applied Business and Economics vol.11(3)