Embed Size (px)
Citation preview
1
Transitioning to the FullPull Economy: The case of the UK
Railways
“I am afraid, My Lord, that the London train has just left”
“Well get me another one”
Table of Contents
Transitioning to the FullPull Economy: The case of the UK Railways ........................ 1
Introduction ................................................................................................................ 2
Digital Disruption..................................................................................................... 4
1 Open Standards ............................................................................................... 4
2 Liquification ...................................................................................................... 6
3 Pull economy.................................................................................................... 9
Dynamics of FullPull ............................................................................................. 12
Dominant Design .................................................................................................. 14
Research Design .................................................................................................. 16
Research Question 1 ............................................................................................ 18
Results .................................................................................................................. 19
1 Coercive/regulatory pressure ......................................................................... 19
2 Normative Pressure ....................................................................................... 23
3 Mimetic pressure. ........................................................................................... 24
Research Question 2 ............................................................................................ 26
GSM-R .............................................................................................................. 26
Impact of Dominant Design .................................................................................. 27
Digital Innovation .................................................................................................. 28
Rail Industry Approach ......................................................................................... 30
Customers and Information ............................................................................... 32
Conclusions .......................................................................................................... 33
References ........................................................................................................... 35
2
Introduction
The digital revolution is often termed the 3rd Industrial Revolution. It follows the
first Industrial Revolution of the 18th – 19th Century driven by steam, and the second
created by the electrical revolution of the late 19th and early 20th centuries. These
two physical revolutions created huge changes in economies and communities. In
contrast to the changes brought about by new power sources, the digital revolution
(or Information Age) is driven by a transformation in information about both people
and things. For example, information from the sensors on their aero-engines has
enabled Rolls Royce to know much more about their performance and thus change
their design and maintenance; moreover the way in which they charge for usage has
also changed from product leasing to an outcome base, described as “power by the
hour”. Information about people has enabled firms like Tesco to gather huge
amounts of data on individuals’ buying habits, whilst information about networks of
small firms is enabling banks to lend to groups of small businesses in the building
trade rather than just individuals.
We contend there are two distinct processes at work in the digital economy:
digitisation and datafication. Digitisation refers to the process by which analogue
content stored in books, music, photos or other information products is converted
into formats that can be stored on digital media, e.g. MP3 files, CDs, and eBook
formats. This process has been going on since the beginning of the computer
industry in order to speed up the processing of financial information such as payroll
and accounting. The rates of change of the digital technology industries is such that
we now have the processing and storage capacity to store, move, combine and
analyse significant quantities of data in a way we have not been able to previously
(Manyika 2011). This has significant implications for business models and the way
in which value is created and captured.
Datafication (Lycett, 2013) refers to converting aspects of human existence into
data, for example, what I look at while using Google Glasses, or what I tweet about
while in a restaurant, into digital formats. This sort of data provides new insights that
offer huge opportunities for the way organisations conduct their business. Fitbit is a
device that allows end-users to record and monitor their physical activity and collect
contextual information about calories expended and food consumed, as part of a
health and wellness regime: often termed the Quantified Self Movement (Wolf et al
2010). The personal data allows Fitbit to create new business models, based on
selling this information to insurance companies to enable them to better understand
the actual and potential behaviour of their customers and thus better calculate risks.
Datafication, in contrast to digitisation (the conversion of analogue to digital), relies
on sensors and actuators to generate the contextual data about a person or an
object and on data capturing the content and metadata of their digital existence, and
3
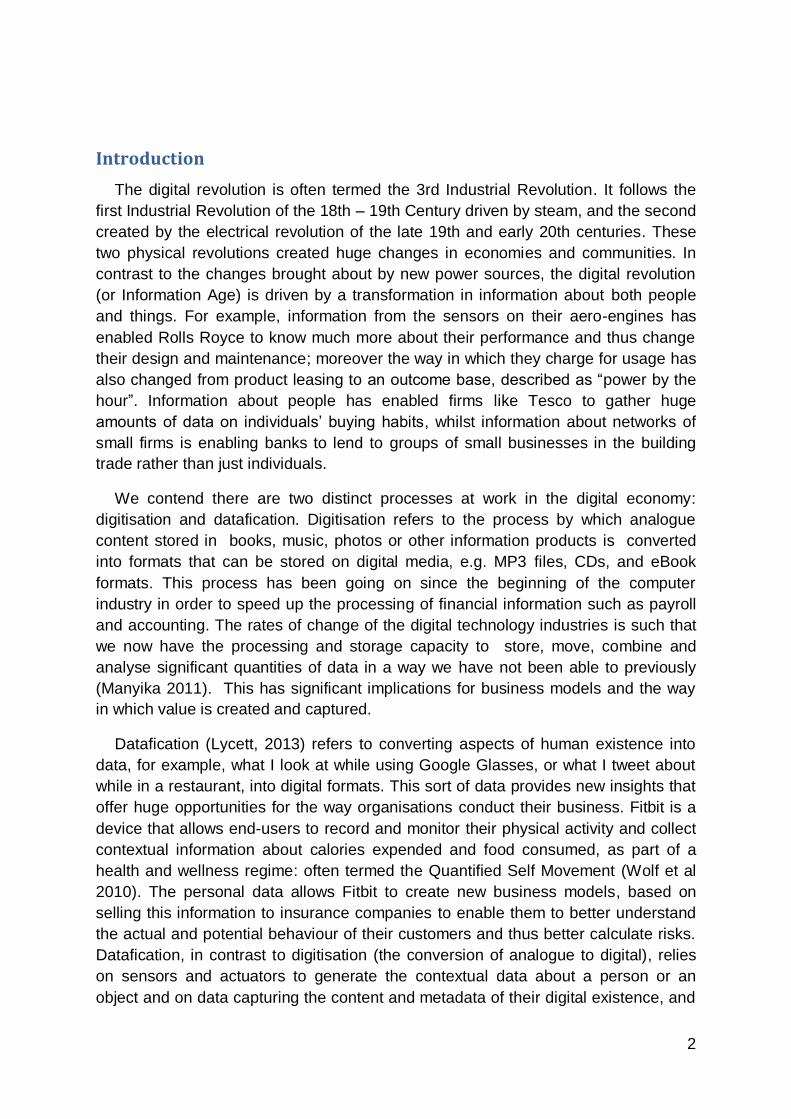
even how they are feeling. We can also distinguish between passive or automatic
sensors and actuators which cannot choose whether to generate data for example
on location, companions and in some cases activity, and on active or voluntary
sources, showing what the person chooses to contribute, such as tweets, uploaded
photographs and social media status updates.
Figure 1 Digitisation to Datafication
The extent and nature of the disruption to economic and business models caused
by the digital revolution was recognised by Normann (2001). In his widely cited text
(800+ citations), relating to new economic models emerging from the digital
revolution, he considers how dematerialization (the removal of information from a
specific physical artefact) makes it possible in principle for information to exist
everywhere and in real time, [P31].This in turn creates what he describes as an
expanded value space in which offerings are no longer constrained by a particular
geography. [P33]. As Normann points out it is not the dematerialisation that is
important, since this has been around a long time (consider for example of the
semaphore developed in 1792), but the ability to de-materialise information about
almost any asset be it physical (goods or people) or information that is so
challenging and provides huge opportunities for new business models to emerge.
The growth of peer to peer lending and crowdfunding uses the dematerialising
qualities of digital to bypass established financial players and directly link
Ease and speed of
storage, reproduction
and processing of
information
Digitisation
Change in
dominant data
storage formats
Integration of multiple
digital data sources,
both passive and
active
Datafication
Proliferation of
actuators and
sensors
4
entrepreneurs to individual funders, which could remain individual (as in peer to peer
lending) or aggregated (as in crowdfunding). Other examples of dematerialisation
may be found in insurance (the rise of facebook groups for risky sports insurance),
retail (automatic replenishment to the home) and farming (data on cows is collected
to increase yields).
Digital Disruption
In their 2013 technology report, Accenture argue that ‘‘every business is [now] a
digital business”, whether the organisation recognises it or not. They suggest
that the digital mindset is no longer the realm solely of the I.T. department within an
organisation, but impacts every area of the business including HR, Property,
Finance, Strategy and Operations; in effect every budget is an I.T. budget1. The
implications of this are being played out within many organisations. For example, in a
recent research interview the Operations Director of Lloyds Bank said that it was
‘inconceivable that anyone in the future could be in his post without an IT
background’. Intriguingly, he did not have that background and was shortly to leave
the company. Digital is not only transforming what can be done, but how it is done
and by whom.
In their 2014 report, Accenture go further and emphasising the scale of the disruption
suggest that the world is at a significant ‘inflection point’ and that the next 3 years is
about determining an organisation’s place in the digital world.
The academic literature (Normann 2001, Vargo and Lusch 2008,Cusumano and
Gawer 2002, Gawer 2011, Narayanan and Chen 2012, Hagel III, Seely Brown, and
Davidson 2010, Ng I, Scharf K, Progrebna G, Maull R 2013 ) supports the view that
key features of this digital disruption are open standards enabling the development
and exploitation of multisided platforms, liquification in which digital and physical
boundaries are increasingly blurred, and the growth of a “pull” economy, in which all
goods and services are provided on an “on demand basis”. We will now consider
each in turn.
1 Open Standards
A technology standard can be considered as “a set of specifications to which all
elements of products, processes, formats, or procedures under its jurisdiction
must conform” (Tassey, 2000, p. 588) or more broadly a technology that “is
accepted for current use through authority, custom or general consent” (p.
417) (Hemenway, 1975)
These standards may be internal or external to the firm, be mandatory or voluntary,
be government or firm/industry driven, and as the definition suggests, be applied to
1 Gartner report http://www.sci-tech-today.com/story.xhtml?story_id=030003CLVSY6
5
the characteristics of products and services, the performance of processes, or to the
structure of concepts (eg languages).
Standards enforce compliance with a set of rules in order to derive a private or public
benefit. Among these benefits are the creation of network effects and the reduction
in entry, co-ordination and transaction costs for agents acting in a system. The
much earlier adoption in Europe of an open mobile telephony standard (GSM) than
that achieved in the US created a wider and more established user base more
quickly.and facilitated the introduction of a chip card technology.
Standards come in many forms and arise and develop through many different
administrative processes. The purpose is to obtain agreement or compliance
amongst agents who may have conflicting interests. These processes may be “club”
based, regulator based, or supra national based; for instance the ITU-T which is an
agency of the United Nations governs the development of telecommunications
standards.
Standards encourage interopability (eg containers and pallets) which can lead to
disruptive effects in proprietorial systems and associated rent, but can equally be
used to enable trade restrictions (eg Accounting Standards and qualified auditors).
They also frequently incur development and compliance costs, and can prevent
activity ranging from discriminatory pricing through to illegality.
Competing standard sets can create competing but viable ecosystems (eg Apple and
Android) where standards exist in similar but incompatible architectures, and equally
numerous examples of standard wars (eg VHS and Betamax, Brunel’s broad gauge
and UK standard gauge) where allegedly inferior products created a stronger
ecosystem leading to the superior product’s demise.
Standards can exist in both the analog economy (eg containers) and the digital
economy (eg the mp3 file compression format, or application programming
interfaces: apis) where the development of such standards has been critical to
growth and expansion.
Standards can be viewed from the demand side eg consumer driven standards that
allows integration across multiple products (Axelrod et al 1995, Cusumano et al
1992) or from the supplier perspective where it represents a synthesis of design
rules (Tassey 2000, Tushman and Anderson, 1986; Weiss and Birnbaum, 1989).
Standards exist on a spectrum of openness – from closed and proprietary through
competing ecosystems to full open standards. Open standards are characterised by
being generally available, without restrictions on use or change, and developed by a
mutual community consensual process. In the digital economy open standards can
be seen as being accompanied by open formats and open source software.
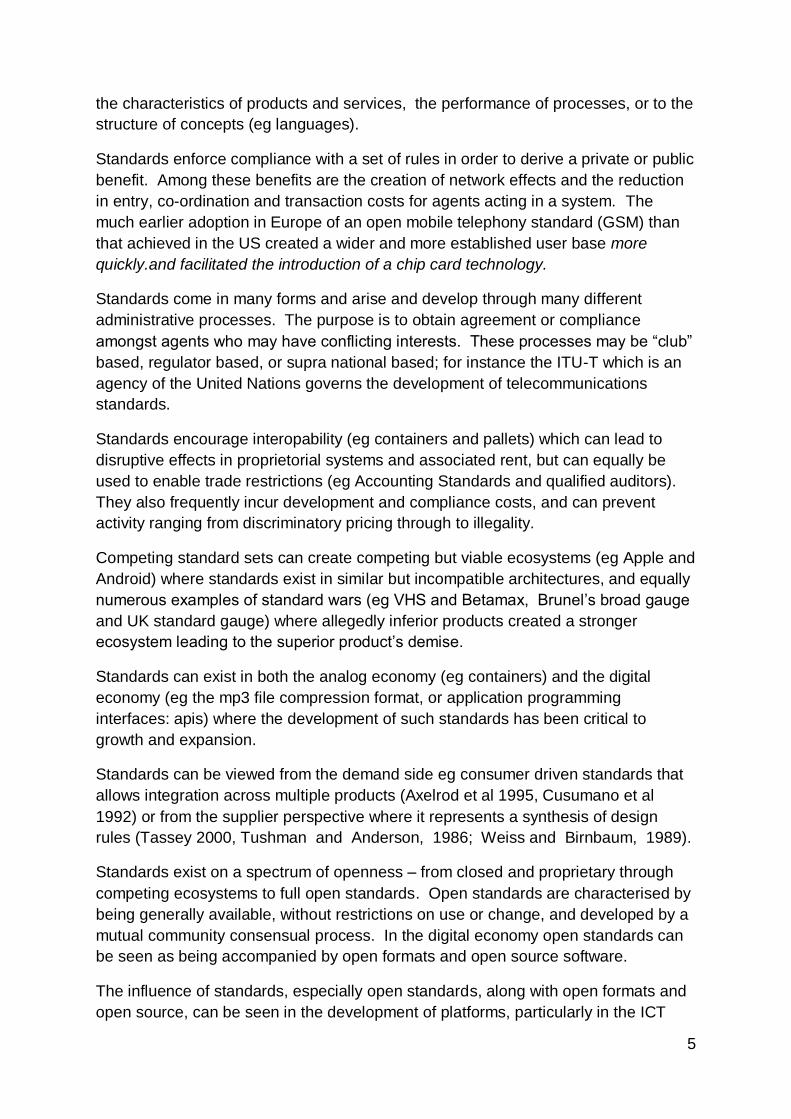
The influence of standards, especially open standards, along with open formats and
open source, can be seen in the development of platforms, particularly in the ICT
6
sphere. A platform is a part of a production / consumption system made up of the
platform, interfaces, and complementors. The platform “is a set of stable
components [in a system] that supports variety and evolvability in a system by
constraining the linkages among the other components” (Baldwin and Woodward
2009).
The system is characterised by low variety and high reusability in the platform, and
high variety and low reusability in the complementors, with the interfaces, subject to
standards, representing thin connections between the two parts. Baldwin and
Woodard (2009) demonstrate that interoperability is achieved through a set of rules
on design and rules on “decision rights”; broadly “who” can react with and change
“what”. The interface rules act as a fixed point in the architecture. An example of a
platform is the Apple iPhone, with api standards both constraining the interface, but
enabling a vast number of develops to construct applications to run on the “platform”.
The advantages of the open source standards are the creation of large numbers of
small scale developers, creating both a more efficient market, and meeting a much
greater variety of potential demand.
Womack, Jones and Ross (2007) described the shipping container, an empty metal
box often with a wooden floor, which disrupted shipping and handling of goods
sufficiently to make (analog) globalisation possible and easily achievable. We
suggest that open standards will perform a similar role for digital disruption, by
allowing connectivity and speed of information flows, (rather than a better way of
catering for the requirement to move material across time and space). The use of
open standards to allow markets to develop based on a wide variety of demand
being met by a large number of suppliers across stable operational platforms will
stimulate and allow the growth of new business models and enable the constant beta
world suggested by Accenture.
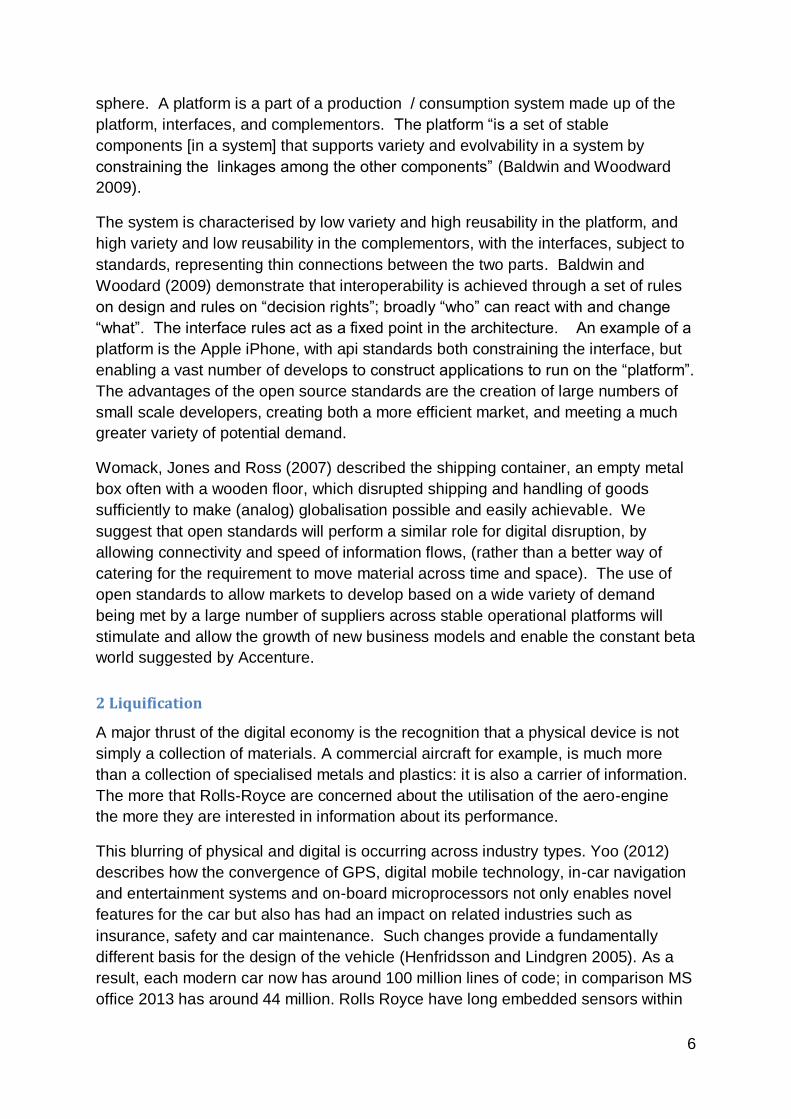
2 Liquification
A major thrust of the digital economy is the recognition that a physical device is not
simply a collection of materials. A commercial aircraft for example, is much more
than a collection of specialised metals and plastics: it is also a carrier of information.
The more that Rolls-Royce are concerned about the utilisation of the aero-engine
the more they are interested in information about its performance.
This blurring of physical and digital is occurring across industry types. Yoo (2012)
describes how the convergence of GPS, digital mobile technology, in-car navigation
and entertainment systems and on-board microprocessors not only enables novel
features for the car but also has had an impact on related industries such as
insurance, safety and car maintenance. Such changes provide a fundamentally
different basis for the design of the vehicle (Henfridsson and Lindgren 2005). As a
result, each modern car now has around 100 million lines of code; in comparison MS
office 2013 has around 44 million. Rolls Royce have long embedded sensors within
7
their engines to inform their maintenance and repair, leading to a massive reductions
in maintenance year on year and impacting on their design processes. Other
examples include sensors embedded in running shoes, Samsung’s simband which
can measure a range of health related characteristics, Tesla’s use of multiple
sensors in their electric cars, houses with automated heating, lighting etc.
This ability to separate the information from the physical world requires a special
infrastructure. Rolls-Royce use a collection of sensors and telemetry to collect data
on engine utilisation. Once this infrastructure is in place then information is free to
flow: it has been dematerialised. An immediate effect of dematerialisation is
liquification or the movement of information across the digital infrastructure and its
combination with other liquefied assets to potentially create new insights. Digital
technology makes it possible for almost any asset to be dematerialised and since
this information is quickly liquefied this produces new markets for the information.
Normann (2001) suggests that the analysis of the company should begin from the
interface of the customer and company not from the perspective of production or
product. For Normann, the customer relationship, not the production activity
represents the decisive business potential. This idea has been developed and
refined by developments in the academic marketing literature that have further
emphasized this central and active role of the customer. This is exemplified in Vargo
and Lusch’s (2008) work on service dominant logic (SDL). In SDL customers are
recognized as “active participants in relational exchanges and coproduction” (2004,
p.7); goods are an appliance for the delivery of the service and value is only
determined by the customer according to value-in-use. In their recent work Lusch
(2011) et al. (2010) propose SDL as a framework for the integration of marketing and
supply chain management. They argue that SDL brings not only the suppliers into
the supply chain but also the customer (endogenous) in a process of co-creating
value in a value network perspective. This is similar to Normann and Ramirez’s
(1993) concept of a value constellation where economic actors join together to
create new businesses or radically alter the way that value is created. Normann and
Ramirez stressed that this is not a simple re-allocation of activities amongst the
actors but a new and coordinated set of activities that result in a new kind of output.
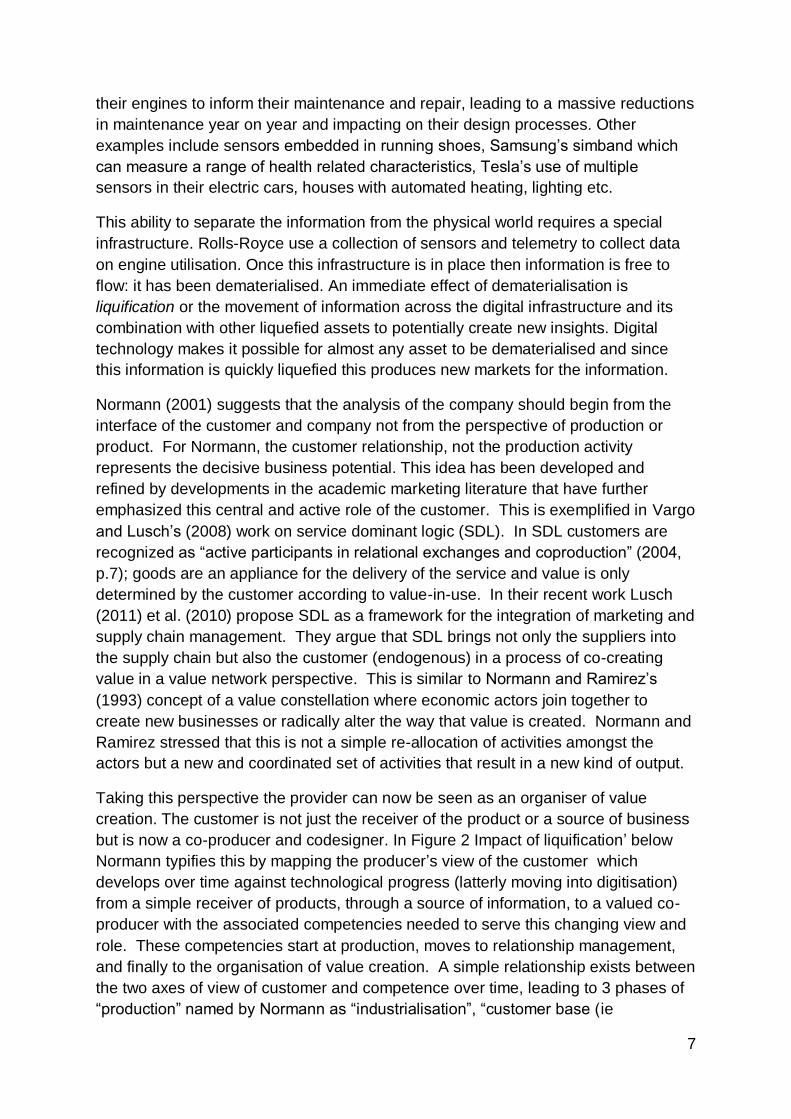
Taking this perspective the provider can now be seen as an organiser of value
creation. The customer is not just the receiver of the product or a source of business
but is now a co-producer and codesigner. In Figure 2 Impact of liquification’ below
Normann typifies this by mapping the producer’s view of the customer which
develops over time against technological progress (latterly moving into digitisation)
from a simple receiver of products, through a source of information, to a valued co-
producer with the associated competencies needed to serve this changing view and
role. These competencies start at production, moves to relationship management,
and finally to the organisation of value creation. A simple relationship exists between
the two axes of view of customer and competence over time, leading to 3 phases of
“production” named by Normann as “industrialisation”, “customer base (ie
8
relationship) management” and “reconfiguration of value based system”. In the latter
”producer” and “customer” combine to create value together organising their
respective competencies and resources in an “expanded value space”.
Figure 2 Impact of liquification
For Normann (2001), digital technology liberates us from constraints of
1. time, when things can be done
2. place, where things can be done
3. actor, who can do what
4. constellation, with whom it can be done
Taken together these concepts enhance density, ie the best combination of
resources mobilised for a particular situation, for example a particular customer at a
given time and place. This implies ever increasing individualisation. What used to be
a bundle of activities put together within one legal structure and in one geographical
position is now in multiple geographical positions brought together by multiple legal
entities. Ultimately, density means that the customer would have a whole world of
specialist knowledge available when and where they like, creating the “on-demand”
economy. Normann, summarises the process as,
Dematerialize (separate information from physical) - unbundle
(physical/informational) – asset liquidity – rebundle – density
A good example of liquefaction in practice is the RCUK funded “HAT” (RCUK 2014).
The HAT explores a rich picture of the lived life through using sensors and platforms
which offer the opportunity to collect data in far more detail on how individuals
interact with people and objects on a daily basis in their homes. Currently most of the
incumbent resources in the home have not been designed for connectivity or for
integrated use. As technologies become increasingly embedded in objects, and
electro-mechanical interfaces will evolve to connect older devices such that they all
9
work together, information will be collected on how things are consumed in context,
rather than simply purchased. Such connectivity will allow business models based
on physical objects, such as the kettle, to be instructed to boil remotely by the home
owner in time for their arrival, or software solutions to provide data to the homeowner
as to the temperature, delivery of post etc.
As a result, new archetypal actors will emerge:
market makers for new infrastructures
large corporations who use dematerialised assets and their infrastructures for
re-bundling different part of the physical world on a global basis
small entrepreneurs. The new logic of value creation creates even more
incentives to scale.
3 Pull economy
We consider that the combination of open standards (eg APIs) and liquification of the
material and enabling the development of the ‘pull economy’ (Bollier 2006). The pull
economy places the consumer at the centre (rather than being producer led) and at
the extreme will draw on resources only as they are used. The roots of the notion of
‘push and pull’ are often associated Just-in-Time and other related manufacturing
techniques.
In manufacturing, the concept of pull is where a downstream work station “pulls” the
item of production towards it when it has available capacity and is a key feature of
the Toyota Production System (TPS). Ohno (1998) asserted that the purpose of the
TPS was to shorten the time between cash and order. The essence of pull is hence
to reduce time and stock consumed in production.
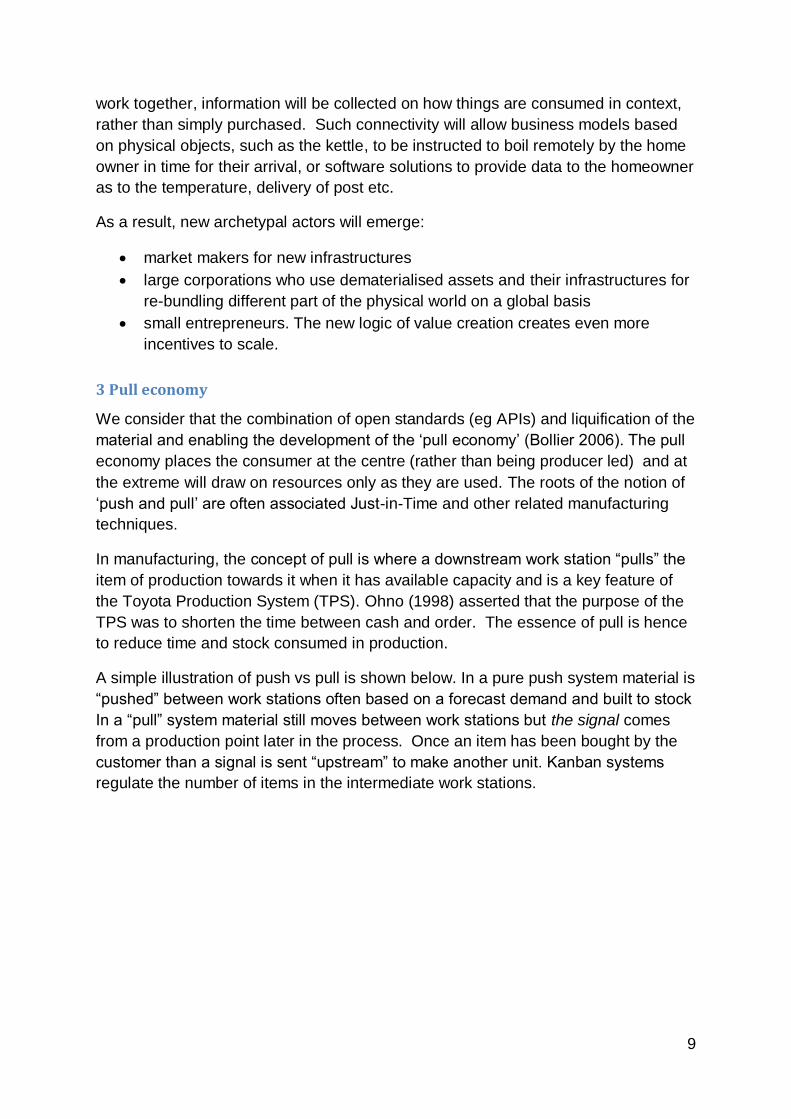
A simple illustration of push vs pull is shown below. In a pure push system material is
“pushed” between work stations often based on a forecast demand and built to stock
In a “pull” system material still moves between work stations but the signal comes
from a production point later in the process. Once an item has been bought by the
customer than a signal is sent “upstream” to make another unit. Kanban systems
regulate the number of items in the intermediate work stations.
10
Figure 3: Push and pull compared (Hopp and Spearman 1996)
The requirements of simplifying and achieving flow are well established: frequent
change of product within defined product groups, reasonably certain volumes
allowing load levelling, and sorting product into what Parnaby (1995) referred to as
“runners” and irregular runners (now more often termed “repeaters”) and “strangers”.
He considered that irregular runners could not achieve sufficient volume or load
levelling and should be dealt with in an off line job shop.
One of the well-known features of a pull system, the reduction of work in progress or
stock being worked on in the “line”, can be extended to the economy and therefore to
other factors of production. The first easy carryover is, as Ohno (1994) suggested,
the reduction in the amount of cash working capital “tied up” in stocks of raw
material, wip or finished goods, at any point in the supply chain. The less obvious
carryover is in the other factor of production, i.e. labour. A pull system applied to
labour means that labour would only be used when there is a demand for the
product. Producers would not load balance on the back of planned orders but would
only commit to use labour when it was needed on the basis of demand. This is a
logical and possibly necessary extension of the use of zero hours contracts, where
the risk and monetary cost of spare capacity is removed from the manufacturer to
the workforce, and labour is not compensated for idle time. Consider an example
from the parcel delivery industry. In major cities, the major parcel delivery companies
are facing increasing pressure from companies who offer local delivery using ‘white
vans’, motorbikes or even bicycles. These micro businesses can offer much cheaper
solutions; however the trade-off might be reputation and trust (breakage or loss, )
and service quality (timeliness). Companies such as “SHUTL” (SHUTL.COM) have
addressed this problem by developing a platform where major retailers can offer very
short delivery times (sometimes less than an hour) by employing individual van
11
owners, motorcyclists etc all of whom are agents who are on call and can bid for
delivery jobs. For such a system to work, however, there must be an excess or stock
of freelance deliverers so there is always somebody available to make deliveries.
We contend that a pull economy will increase the use of zero hour contracts. This is
analogous to the use in TPS, often hidden, of a large number of very small upstream
suppliers on whom the risk is effectively placed. Taking supply side pull to its
limits/logical conclusion means not making to stock but making to order, or on
demand.
Demand side pull
Pull has traditionally assumed to begin with a customer order and the literature
naturally focuses strongly on the supply side; but we argue that in the world of
datafication the concept can equally be applied to the demand side (consumer) and
that this will be enabled by all facets of digitisation.
The demand side is an area less well explored. The demand side equivalent to TPS
would be shortening the time between need/want and fulfilment. With pull from the
customer being made possible, the customer will not need to hold stocks of e.g. coca
cola. It will no longer be a producer aspiration for the whole world to be within an
arm’s length of a tin of coke, but for the whole system to be capable of delivering the
tin whenever and wherever the need arises. Demand side pull will be enabled by
demand side developments (among which will be datafication, big data, predictive
technologies) complemented by supply side changes (eg platforms, 3D printing).
We contend that this will enable the “fullpull” economy, in which there is pull both on
the supply side and the demand side.We argue that “big data” is not only about
collecting data on certain facets of many people, but also more complete data about
the single individual (sometimes called ‘small data’ Estrin 2014). This has certain
implications. More detailed and predictive demand information will become available
to both the consumer (and his chosen agents) and the producer.
“Strangers”
Digitisation brings with it increased information. This improved information about
each and every customer, and other digital effects (eg 3D printing) reduces scale
effects and facilitates making money out of the hitherto inaccessible or too costly
customers who fall into the “long tail”.
We contend that the long tail is the digital equivalent on the demand side of
Parnaby’s “strangers”, who will now be provided through the same digital channels
as other consumers.:everyone will be a “market of one”.
12
But what of unknowns, those goods or services that could easily be provided by the
supplier but aren’t yet being so? If Accenture are correct in their assertion that
supply will be in constant beta, then any unmet demand could quickly be catered for.
Central to the modern concept of the customer is their role as “resource integrator”
(See Vargo and Lusch earlier). They sit at the centre of a complex system of
suppliers and other consumers co-creating value in use and context. We suggest
that this is similar to Parnaby’s notion of the manufacturing “cell”, and thus forms
another element of demand side pull.
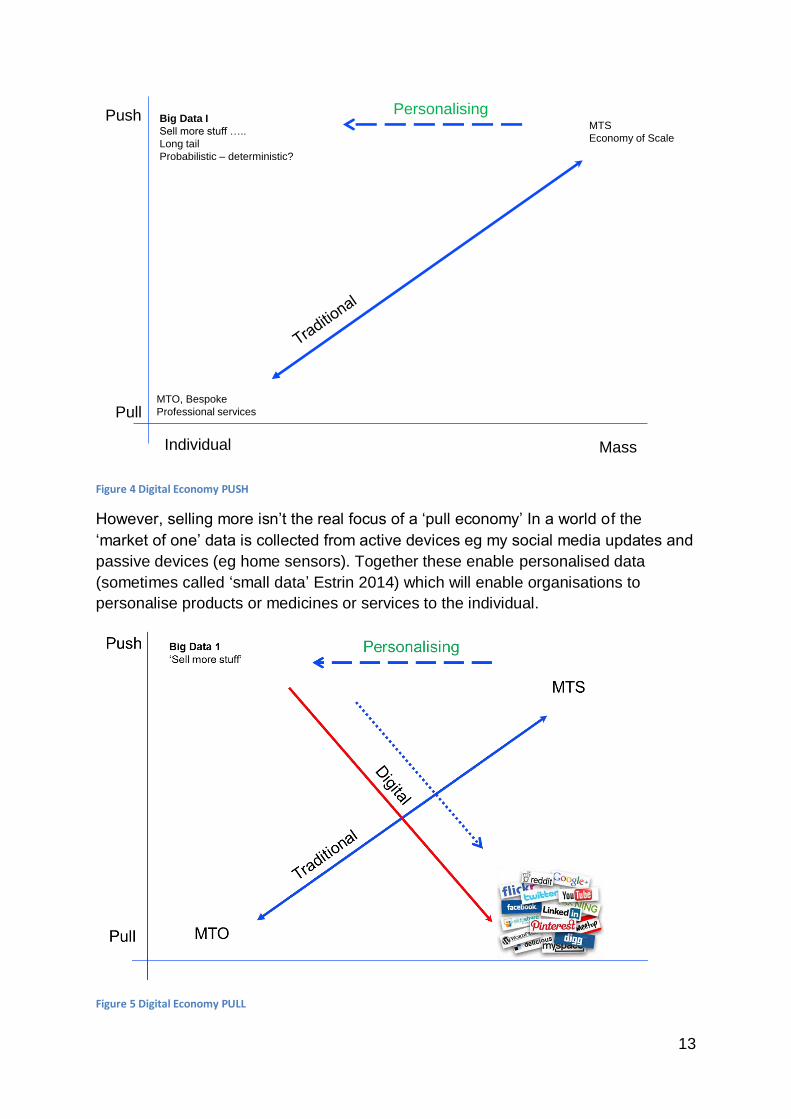
Dynamics of FullPull
We have conceptualised the movement to a full pull economy in the following
figures. The axis are push-pull is as described earlier and individual-mass which
represents the market for the provider/producer.
In the individual-pull quadrant we have an industry driven by make-to-order eg
professional services or bespoke furniture. In the top left we have a traditional large
scale manufacturer or service provider who makes to stock as reaps the benefits of
economies of scale.
The development of standards and liquifaction has enabled providers to move into
the area of individual-push where they can individualise offerings in other words sell
more. These personalised adverts enable amazon to be highly specific about
recommendations and to drive sales.
13
Figure 4 Digital Economy PUSH
However, selling more isn’t the real focus of a ‘pull economy’ In a world of the
‘market of one’ data is collected from active devices eg my social media updates and
passive devices (eg home sensors). Together these enable personalised data
(sometimes called ‘small data’ Estrin 2014) which will enable organisations to
personalise products or medicines or services to the individual.
Figure 5 Digital Economy PULL
Individual Mass
MTO, Bespoke
Professional services
MTS
Economy of Scale
Pull
Push PersonalisingBig Data I
Sell more stuff …..
Long tail
Probabilistic – deterministic?
14
These changes from push-pull are only now being considered by organisations
through their systems design and in our view has the potential to influence all
sectors, industries and communities . The challenge is to consider which industries
will adapt quickly and those which will have deeply held cultural limitations in
adapting their business to the demands of the digital economy.
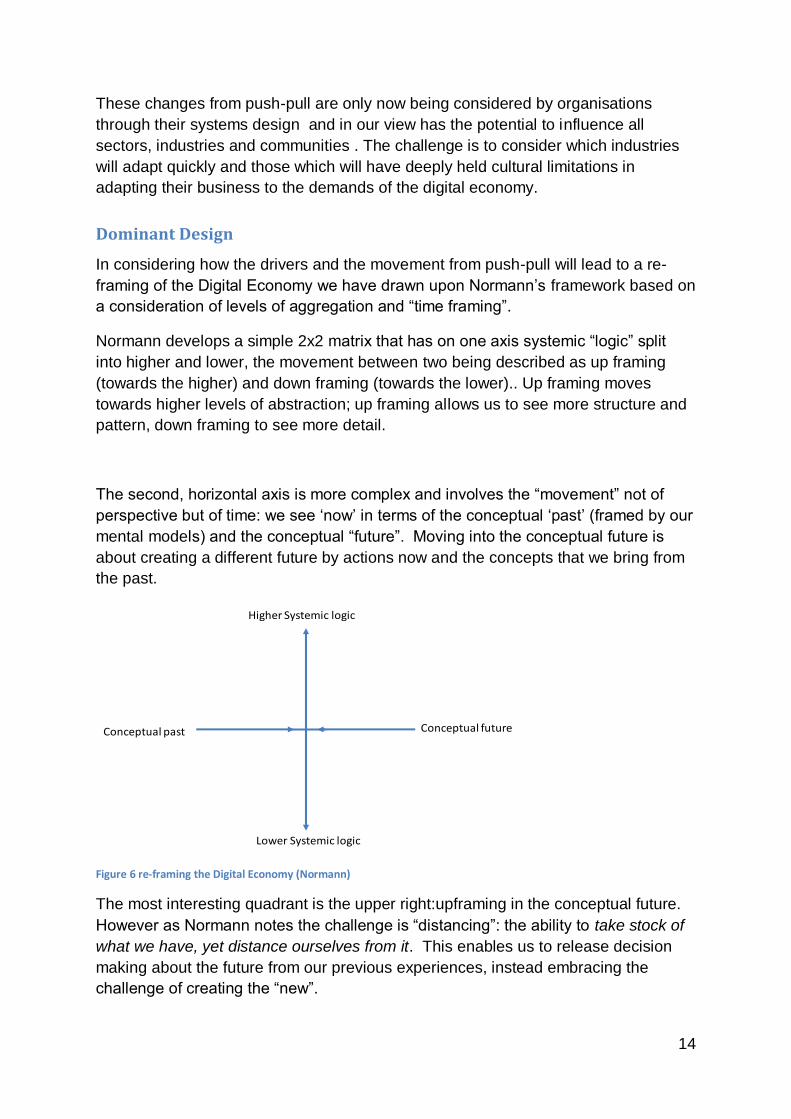
Dominant Design
In considering how the drivers and the movement from push-pull will lead to a re-
framing of the Digital Economy we have drawn upon Normann’s framework based on
a consideration of levels of aggregation and “time framing”.
Normann develops a simple 2x2 matrix that has on one axis systemic “logic” split
into higher and lower, the movement between two being described as up framing
(towards the higher) and down framing (towards the lower).. Up framing moves
towards higher levels of abstraction; up framing allows us to see more structure and
pattern, down framing to see more detail.
The second, horizontal axis is more complex and involves the “movement” not of
perspective but of time: we see ‘now’ in terms of the conceptual ‘past’ (framed by our
mental models) and the conceptual “future”. Moving into the conceptual future is
about creating a different future by actions now and the concepts that we bring from
the past.
Figure 6 re-framing the Digital Economy (Normann)
The most interesting quadrant is the upper right:upframing in the conceptual future.
However as Normann notes the challenge is “distancing”: the ability to take stock of
what we have, yet distance ourselves from it. This enables us to release decision
making about the future from our previous experiences, instead embracing the
challenge of creating the “new”.
Higher Systemic logic
Lower Systemic logic
Conceptual futureConceptual past
15
Being able to create a distance from what we have is inversely related to the concept
of the dominant design (DD). This is those design features that have become an
unchallenged industry standard and which Abernathy [1985] identifies as passing
through three distinct phases:
1. the introduction of a solution which has broad appeal based on performance and basic functionality;
2. a second phase where competitors develop similar designs; 3. this imitative behaviour enforces standardization throughout the industry and
almost complete diffusion of similarity across markets.
Svahn and Henfridsson (2012) point out some of the operational features of this
dominant design: how the entire organisational system is configured with an upfront
design, components are sourced and products built, competition advantage comes
from co-ordination and the use of command and control and hierarchical
organisations. The more an organisation knows its processes and scripts and
controls staff behaviour the more it locks itself and the industry into its dominant
design. The knowledge of how to “deliver” the dominant design is then (Henderson
and Clark 1990) strongly embedded in organisational structures and business
processes in an ongoing re-inforcing loop.
The distancing from a dominant design requires a transformational shift. Tushman
and Anderson (1986) considered these transformational periods across three
industries: cement, airlines and minicomputers. They considered technological shifts
of the dominant design as being either competence destroying or competence
enhancing (Abernathy and Clark 1985). Competence destroying changes require
new skills, abilities and knowledge which fundamentally change the competencies:
for example, diesel locomotives require new skills and knowledge that steam engine
manufacturers did not possess. Similarly, computer numerically controlled machine
tools required major changes in engineering processes and data processing skills.
Competence destroying creates a new completely class of product or substitute for
an existing product or a completely new process: for example the float glass
processing glass manufacturing or mechanical icemaking substituted for natural ice
harvesting.
Competence enhancing discontinuities are an order of magnitude improvement in
price and performance that builds on existing knowledge: they do not render
obsolete existing competences. Examples include the introduction of fan jets or the
screw propeller which dramatically improved the speed of jets and oceangoing
steamships. It is important to recognise that a major difference between the two is
that competence destroying discontinuities disrupt industry structures as the skills
and knowledge that brought product class leaders to pre-eminence are rendered
obsolete.
One of Tushman and Anderson’s (1986) major findings was that discontinuities
occurred only eight times in the 190 years observed across three industries. Yet
16
when they did occur these major shifts significantly altered competitive
environments.
A closely related stream of research can be identified in ‘Institutional logic’. Scott
1995; 2005; 2008) identifies three components to Institutional Logic:
1. regulative ie rule-setting,, 2. normative ie the prescriptive and obligatory dimension 3. cultural-cognitive elements which are the shared conceptions.
Each of these offers a different rationale for claiming legitimacy whether by virtue of
being legally sanctioned, morally authorized, or culturally supported (Scott 2008: 51).
Thus, it makes a difference whether an organisation complies out of expedience (to
avoid a punishment), because of a morally obligation to do so, or because it cannot
conceive any other way of acting. But at the same time, each is properly seen as
providing or contributing to an institutionalized social order: all support and sustain
stable behaviour.
Taken together these form three different pressures to conform which have been
characterised as:
1. Coercive pressures. These result from strong linkages to other industry
agencies and institutions and are often in the form of pressures, compulsions,
enticements/inducements and requests. They may also take the form of
governmental measures, guidelines regulations or laws.
2. Normative pressure. These guide decision making and come from the
development of criteria and guidelines which influence judgements and
outcomes. Organizations conform because of behavioural expectations. These
pressures usually result in rules of thumb, standard operating procedures, and
occupational standards (Hoffman, 1999).
3. Mimetic pressure. These are associated with copying or mimicking other
organizations’ systems, policies, processes and structures. In other words,
organizations model themselves after organizations in their external environment
that they see to be similar but also legitimate and successful (DiMaggio and
Powell, 1983).
Research Design
The aim of our research into digital disruption is to examine the key question: will
digital disruption affect all industries or be limited to some? And if so, why, and what
impact will dominant design have in resisting or encouraging digital disruption?
To explore the characteristics and impact of dominant design on a specific industry,
we used the case study research method. Yin (2003) defined a case study as a
method to examine: (a) a contemporary phenomenon in its real-life context,
especially when (b) the boundaries between phenomenon and context are not
clearly evident.
17
It is also recognised (Lewis and Brown 2012) that single case studies can be
particularly useful in the early stages of theory building and also that they are
“appropriate for completely new exploratory investigations” (Meredith 1998). Voss,
Tsikriktsis and Frohlich (2002) also recognise the advantages provided by single
cases in providing greater opportunities “for depth of observation’.
Our rationale for the choice of industry in which to conduct our analysis was based
on the identification of what we considered to be an ‘extreme case’ (Siggelkow
2007). Specifically, we were interested in sectors with long histories of technology
development within well established and relatively stable technology standards,
without apparent evidence of recent disruption and then to consider their approach to
digital disruption.
The UK rail industry is often recognised to be an industry where base technology has changed relatively little in almost 200 years and that there is a huge challenge in
“managing today the Victorian legacy of a railway that was substantially built in the
century before last.
“Network Rail Strategic business plan for England and Wales Jan 2013 p4
Specifically, of the 800 signalling locations over 500 of these are the Victorian signal boxes (Chapman, 2013) and mechanical interlockings are widespread throughout the network and often still regarded as ‘modern’ (despite the first installation being in 1843). In the rail industry press it is often argued that the industry is something of a laggard in the adoption of new innovations the pace of innovation in railways might well be perceived to lag behind other industries just a bit too much. (Rail Engineer, 2013)
“The post-war modernisation of British Railways saw the introduction of ‘panel’
signal boxes covering many route miles on busy main lines… With a nominal life of
25 years, many panel boxes are still in service today 50 years later, although some
of the installed kit has been refurbished or replaced in that time. Watford Junction
(1963) is due to be decommissioned this year whilst Plymouth (1960) is still going
strong.” (Rail Engineer, 2014)
In the academic literature Schilling, (2002) in her widely cited article (273 cites) on
the consideration of the management of technology standards, points to the
importance of network externalities in leading to “technology lockout” and identified
railways as the classic example of an industry with strong externalities.
In short, we consider the rail industry to be an interesting and in many respects, extreme, case, characterised by large scale capital expenditure, a strong culture built on safety, heavily regulated and with well-established networks and infrastructure. All of these are typical features of a ‘dominant design’, an industry in which practices, norms and decision making strongly influence actions and strategy.
Research Questions
18
From the above considerations we generated the following two research questions
1. To what extent does the rail industry have a ‘dominant design’
2. How is the dominant design influencing the rail industry’s approach to digital
disruption?
Research Question 1
In addressing RQ1 we considered the three main pressures of a dominant design
outlined earlier.
1. Coercive/regulatory pressure. These result from strong linkages to other
industry agencies and institutions and are often in the form of pressures,
compulsions, enticements/inducements and requests. In the rail industry
coercive pressures can come from many forms e.g. National Rail, Train
Operating Companies, Department of Transport, Office of Rail Regulation
2. Normative pressure. These guide decision making and come from the
development of criteria and guidelines which influence judgements and outcomes. Within the rail industry these would include formal training regimes for particular job roles.
3. Mimetic pressure. These are associated with copying or mimicking other
organizations’ systems, policies, processes and structures. Within the rail industry this might include adopting practices that are deemed acceptable to regulators which would include a strong tendency to stay within the “industry” for solutions.
Data was collected through three sources:
1. Context interviews with academics, journalists, informed observers and other
industry sources to gain a broader perspective on the industry’s challenges.
2. Analysis of secondary data. A wide range of publicly accessible data is
available through industry and government websites such as NR, ORR, DfT,
Parliament and trade journals.
3. Semi-structured interviews with five members of a leading industry supplier.
(The firm are one of only 2 organisations to achieve an A rating in the Network
Rail suppliers league table2.)
Our approach to data analysis was to review the data collected from our interviews
and subsequent follow-up written correspondence and to characterise the data into
the three headings of regulatory, normative and co-ercive pressure.
2 http://www.cnplus.co.uk/news/sectors/rail/two-firms-top-network-rail-contractor-league-
tables/8653780.article#.U0uls_ldXKE (retrieved 14th April 2014)
19
Results
1 Coercive/regulatory pressure
The rail industry has a wide range of stakeholders3 including
Rail infrastructure
o Mainline network
o Underground railways
o Light rail and tramways
o Minor and heritage railways
Legislative framework
This is shaped by both UK and EU legislation.
Government
o Department for Transport
o Office of Rail Regulation (ORR)
o Transport for London
o Transport Scotland
o Welsh Assembly Government
o Department of Regional Development, Northern Ireland
o Passenger transport executives
o European Railway Agency
Safety bodies
o Rail Accident Investigation Branch – responsible for investigating rail
accidents.
o Channel Tunnel Safety Authority – the independent safety authority for the
channel tunnel.
o Rail Safety and Standards Board - builds industry-wide consensus and
facilitates the resolution of difficult cross-industry issues.
o British Transport Police – the national police force for the mainline
railways, the London Underground system, Docklands Light Railway, the
Glasgow Subway, the Midland Metro tram system and Croydon Tramlink.
o Health and Safety Executive - the HSE gives advice to the Government on
health and safety matters.
Industry companies
o Network Rail (NR) – the rail infrastructure owner and operator.
o Train Operating Companies (TOC) – who operate passenger trains.
o Freight Operating Companies (FOC) – who operate freight trains.
3 http://webarchive.nationalarchives.gov.uk/20091113075715/http://www.rail-
reg.gov.uk/server/show/nav.114
20
o Rolling Stock Companies (ROSCO) – who own and lease trains to train
operating companies.
o Passenger support – information for passengers about how to make a
comment or complaint about train companies.
o OEM’s - the industry is characterised by a small number of large trans-
national companies, eg Hitachi, Siemens, Bombardier
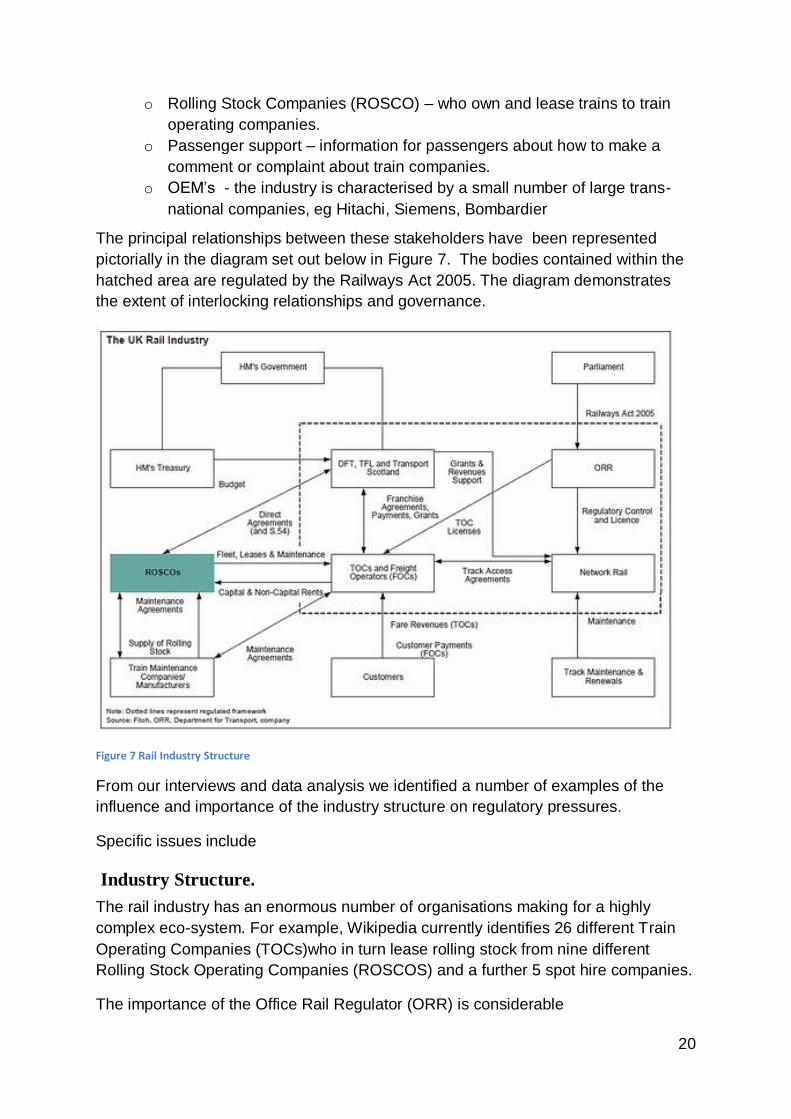
The principal relationships between these stakeholders have been represented
pictorially in the diagram set out below in Figure 7. The bodies contained within the
hatched area are regulated by the Railways Act 2005. The diagram demonstrates
the extent of interlocking relationships and governance.
Figure 7 Rail Industry Structure
From our interviews and data analysis we identified a number of examples of the
influence and importance of the industry structure on regulatory pressures.
Specific issues include
Industry Structure.
The rail industry has an enormous number of organisations making for a highly
complex eco-system. For example, Wikipedia currently identifies 26 different Train
Operating Companies (TOCs)who in turn lease rolling stock from nine different
Rolling Stock Operating Companies (ROSCOS) and a further 5 spot hire companies.
The importance of the Office Rail Regulator (ORR) is considerable
21
“In 2006 responsibility for railway-related health and safety regulation was
transferred to the Office of Rail Regulation creating a single economic and safety
regulator for the railway.” (Network Rail How we are regulated, 2014)
Not only do the ORR have a wide regulation role, but there is also governmental oversight: “The ORR has a very significant role to play in the rail industry including:
Overseeing safety Ensuring free and fair competition Approval of certain licenses and contracts Determining funding and efficiency targets for Network Rail
… The Department for Transport (in England), Transport Scotland and the Welsh Assembly Government set public policy for the rail industry which includes funding of Network Rail, investment in rail enhancements and management of freight grants. “ (Network Rail Regulatory Bodies, 2014)
and this regulator continues to exert considerable regulatory force
“In the next few months, ORR will review our plans in detail. We expect ORR to be
challenging in seeking value for money for taxpayers and railway users.” (Network
Rail How we are regulated, 2014)
When the multiple parties providing services to Network rail are accounted for its
clear that this is a highly complex structure, summarised by one interviewee as
The separation of signalling, rolling stock, civils, track etc. means that system level
innovation is rare and significantly difficult to achieve. [technical director]
Control period
The planning period of duration of 5 years, with a significant lead-in period of 18-24
month lead-in process to agree a settlement, is challenging in an era of rapid
technological change.
In effect, plans are being “finalised” and costed 5-6 years before implementation,
which is probably acceptable for building/civil works, but not technology-enabled
asset management.[Projects director]
The… 5 year cycle with simple ‘punish on failure’ mentality means that long-term
investment commitment is problematic and once Network Rail plans are signed off
there is little incentive to challenge [technical director]
22
TOC franchise limit4
The relatively short period of time awarded to a frachisee has contributed to some
issues with returns on investment and ‘short termism’. As KPMG report:
Many of the investments or actions that will improve performance or customer
satisfaction in the UK rail industry do not necessarily have a financial payback
over the life of the franchise, even if it is a relatively long contract such as 15
years (and some investments may not generate a TOC financial return over any
time period). (KPMG, 2010)
Impact of schedule 8 and schedule 4 payments.
These payments are payments form Network rail to the ToCs for planned and
unplanned delays.
The impact of the Schedule 8 and Schedule 4 payment regimes, the regulatory
mechanism to provide rewards/penalties based on performance, create cultural
norms around which Network Rail, TOCs and FOCs plan their businesses and model
revenue sensitivities. The focus on delay minutes, and attribution of costs has a
huge industry overhead (lots of people looking at delay attribution cases) and a one-
dimensional view as to what good looks like (i.e. fewer delay minutes) that does not
marry up with what customers want.[Projects director]
History of technical development.
The long evolution of technical developments and associated regulatory changes
makes the industry a complex place within which to introduce change
Large distributed install base of assets introduced over many years to evolving
standards – ….. makes change harder –not helped by vertical separation historically
into Zones [technical director]
Many of these technical developments have, of course, been associated with
‘safety’.
This is the basis of the railway. The primacy of the Rule Book is vital to safe
operation [industry journalist]
This is obviously a key topic for the industry and was commented on by many of our
respondents and the recent history has been neatly summarised
following the post-privatisation run of major accidents (Southall-Paddington-Hatfield)
there was intense government and media pressure on Railtrack that resulted in the
4 Department for Transport Rail Franchising Policy: Analysis of Historic Data
23
chief executive being forced to resign and following the official inquiries into Southall
and Claphan - where signals were passed at danger, , a cowed railway committed to
impossible targets for installing Automatic Train Protection (ATP)
Currently, there is considerable coercive pressure over level crossing safety and the
new Nework Rail Chief Executive [has] recently issued a blanket apology..
[Industry journalist]
2 Normative Pressure
Normative pressures are defined by Khalifa and Davison (2006) as arising from
cultural expectations in which norms and standards of the operating environment are
formed and which in turn guide decision-making. These pressures result in the
development of rules of thumb, standard process, operating procedures and
organisational standards. (Hoffman, 1999i).
In a review entitled ‘why is innovation so difficult in railways’ the authors highlight that the challenge of implementing innovations lies not so much with the technology itself but the size of the physical network and the number of people and organisations that need to be aligned in order for innovations to work.
They highlight 12 ‘subtle reasons’ for the failure of innovative ideas including: new
idea does not fit with existing aging infrastructure; new idea does not fit the culture;
new idea does not fit with regulations and procedures and that the originators of the
idea are not trustworthy according to the railway experts. (The Rail Engineer, 2013)
An example of how current structures limit ways of thinking can be seen in timetabling. Transport for London (TfL,2014) define a frequently used bus service on which “has five or more buses an hour. It's a route where passengers tend not to look at the timetable before arriving at the stop.” This affects the service quality measurement: “For this reason we are more interested in how reliable and evenly spaced the service is. Scheduled arrival times are less important. We aim to ensure buses run at evenly spaced intervals and do not 'bunch'.” In contrast, Network Rail uses a single service quality measure (“The Public Performance Measure (PPM) shows the percentage of trains which arrive at their terminating station on time.” ) which prevents the consideration of frequency based timetabling, even though there are many routes where five or more trains run, especially in the London area. (Network Rail Performance, 2014)
Some of our respondents have identified the unquestioning nature of these norms
and standard operating procedures.
Standards that are solutions specific and/or are very light on ‘why’. This encourages
a ‘comply’ in preference to ‘challenge’ approach [tech director]
Silent interface standards – instances where there are implied/practical constraints
that are unwritten but embodied in product ‘pairings’ – e.g. leading to a focus on
extensive EMI testing of new trains on miles of instruction rather than being able to
rely evidence of compliance. [technical director]
24
Explanations for how these standards have emerged so strongly are deeply
embedded in the industries history eg
Poor, incomplete and inaccurate records of the asset base – makes change
undesirable and perceived as ‘dangerous’.[tech director]
These standards are not necessarily formal they may be implicit and encouraged by
the industries tendency to promote from within
Its easy to see how many people in positions of influence (Senior Management) and
blocking (Middle Management) have come through the ranks/railway
supply.[solutions development director ]
The newly formed Rail Executive in the DfT…places experience in rail commercial
environments above everything else. [solutions development director]
Perhaps most importantly, accountability for performance may also be an issue
No performance culture – neither success nor failure brings conspicuous
consequences (tech director]
The consequences of these standards can be seen in the approach to innovation
significant attempts to introduce process and product change (e.g. Signalling
partnerships, Modular signalling etc) are tied to applications projects so that under
delivery pressure the true novelty tends to get scoped out by risk-averse project
managers. [tech director]
Traditionally, it is extremely hard for a supply to attempt to innovate outside of that
which NR have said they will buy. We’re seeing this increasingly coming through
now with the Railway Technical Strategy, So long as you fall within the RTS, you’re
allowed to innovate, but the RTS is just a shopping list for technical improvements. If
you are an established multi-national player, you are in a position to lead, but then
this goes against the increasingly perceived wisdom in technology circles that
innovation and change comes from the SME’s not the giants. [ solutions
development director]
3 Mimetic pressure.
These pressures come from wanting to look like other organisation, in their
processes and functions or structures. These may be inside an industry structure or
outside.
The focus for these particular mimetic pressures appears to come from within the
industry,
Track
25
External quantified benchmarking data have been obtained from a number of
European rail comparator organisations, and the cost differentiating factors
analysed…
Signalling
Qualitative and quantitative external benchmark data have been obtained from
European comparator organisations through a number of studies. …
Telecoms
Quantified benchmarking data have been obtained from European rail comparator
through Network Rail’s participation in the formal RTC benchmarking group …”
(Arup, 2013)
It is not only Network Rail that benchmarks itself against the rail industry. The report
“Realising the Potential of GB Rail” (DfT/ORR, 2011) commissioned by DfT and
ORR also compared within the industry:
“International benchmarking has involved selective comparison of the GB rail
industry with similar railways in France, the Netherlands, Germany, Sweden,
Denmark, the USA, Hong Kong and Australia. “
The article concludes by arguing that the industry consciously lags behind in its application of new technology and unless it addresses some fundamental issues will be condemned to the museum.
Not only does the regulator use within-industry comparators for bottom-up, technological benchmarking, but also for top-down, econometric benchmarking:
“Our PR13 econometric analysis used a subset of the Lasting Infrastructure Cost
Benchmarking (LICB) dataset developed and maintained by the International Union
of Railways (UIC) for 14 European rail infrastructure managers, including Network
Rail, covering the period 1996 to 2008. “ (ORR, 2013)
Industry interviews also suggested a tendency to look inside the sector,
There…. seems to be a “norming” effect [of industry bodies], presumably because
you have to get many bodies to be broadly aligned (or at least not offend any of
them), that the radical or novel is often eliminated.[development director]
Much of this norming may be driven by a mindset that begins with the idea that
railways are different….
“The railways are different” – actually in many ways they are – almost certainly a lot
more than they should be. Rail specific solutions make ‘different’ a self-fulfilling
prophecy. Engineers have to invest to enter the market, those with valuable domain-
specific knowledge are reluctant to leave.[Technical director]
26
This mindset also has implications for innovation
Traditionally, it is extremely hard for a supply to attempt to innovate outside of that
which NR have said they will buy. We’re seeing this increasingly coming through
now with the Railway Technical Strategy, … So long as you fall within the RTS,
you’re allowed to innovate, but the RTS is just a shopping list for technical
improvements. If you are an established multi-national player, you are in a position
to lead, but then this goes against the increasingly perceived wisdom in technology
circles that innovation and change comes from the SME’s not the giants. [Solutions
Development Director]
Research Question 2
From our interviews we also found evidence of a number of examples of how a
dominant design has restricted the uptake of new technologies. For example, one
interviewee pointed to the reluctance of the train operating companies to adapt their
rolling stock to meet the needs of disabled people even though from January 1st
2020 government legislation will mandate this change. This reluctance applies
across the sector and applies to ToCs and Rolling Stock Operating Companies
(ROSCOs). Similarly, the industry was slow to adopt the benefits of revenue pricing
and yield management preferring to wait for the airlines industry and theatres before
adoption.
An excellent illustration of the limitations of dominant design is provided in the case
GSM-R.
GSM-R
An excellent example of the rail industries approach is illustrated in the example of
Global System for Mobile Communications – Railway (GSM-R). This is the
international wireless communication standard and part of the European Rail Traffic
Management system (ERTMS). It is used to enable communications between the
train and the control centre and to provide both a data link and direct voice calls
between the control centre and the train. As its name suggests, GSM-R is based on
GSM technology and is the result of over 10 years of collaboration to various
European rail companies. We used GSM in section xxx above as an example of
how the degree to which standards are open can influence development of an
innovative sector.
During its development phase became clear that the standard GSM technology of
the time could not meet all the requirements of the rail industry Sniady and Soler
(2012) and the industry set out to develop its own solution. Sniady and Soler (2012)
summarise the shortcomings as including
1. Outdated technology: Mobile telecommunications have evolved substantially
since the development of GSM-R (a 2G standard) including GPRS, edge,
27
UMTS, HSPA and now LTE. GSM-R was designed to take account of a
number of hardware constraints that are no longer valid and was designed
primarily for voice communication whereas today data communication is
becoming at least, if not more, important.
2. Interference issues: GSM-R operates on a dedicated frequency band and it is
becoming apparent that there is interference caused by public operators. This
is unsurprising since both rail and telecoms industries want to provide service
to customers on the train.
3. Capacity issues: GSM-R has limited radio capacity and is based on a circuit
switched mode which is not sufficient for ECTS level 2 which requires
continuous data connection.
4. Limited capabilities: The technology is not flexible enough in terms of
throughput and delay to provide advanced services for example Internet
access for passengers.
5. Dedicated technology: GSM -R is based on a commercial technology adapted
for the railway. It is therefore a dedicated technology used by relatively small
industry and does not have access to the economies of scale that could have
been gained from using more widely available technology shared with
commercial mobile operators or emergency service providers. Secondly, as it
is a dedicated solution, specific handsets had to be developed that according
to our interview data costs around £1500 for each involving many
stakeholders: train operators, unions, national authorities, infrastructure, train
operating companies which have in effect led to the development of a very
outdated technology.
This example illustrates some of the important features of a dominant design. For
example, industry regulation and guidance across multiple countries means it is
difficult to innovate and requires multi-partner agreement. Normative pressures ‘the
railway is different’ guides decision making and leads to a solution that is unable to
reap scale benefits. Finally, accepting already widely established technological
solutions such as GPRS (arguably when it was already outdated) is a classic
example of an industry which is copying so called safe practice from elsewhere.
In the UK GSM-R is fully deployed across the south of the country and the national
roll out is expected to be completed in 2014 and is, as the network rail web site
states, certainly based on ‘trusted GSM mobile technology’5. However, unfortunately
it is widely recognised that GSM is already obsolete at deployment ii and faces the
possibility that it might be switched off within 5 years (Sniady and Soler 2012)
Impact of Dominant Design
There is a substantial body of evidence that within the rail industry that Dominant
Design is strong. Regulatory, normative and mimetic pressures are evidenced from
5 http://www.networkrail.co.uk/aspx/6386.aspx retrieved a4th april
28
press reports, interviews with suppliers and industry members and documentary
information. However, as pointed out by one of our interviewees, the rule book is the
cornerstone to the safety of the industry. It is important to have a strong culture of
compliance in an industry where oversights in safety cost many lives.
This raises the important issue of whether in an era of rapid technological change at
what level of an organisational architecture that maintaining a dominant design is
appropriate and at what level it should be challenged.
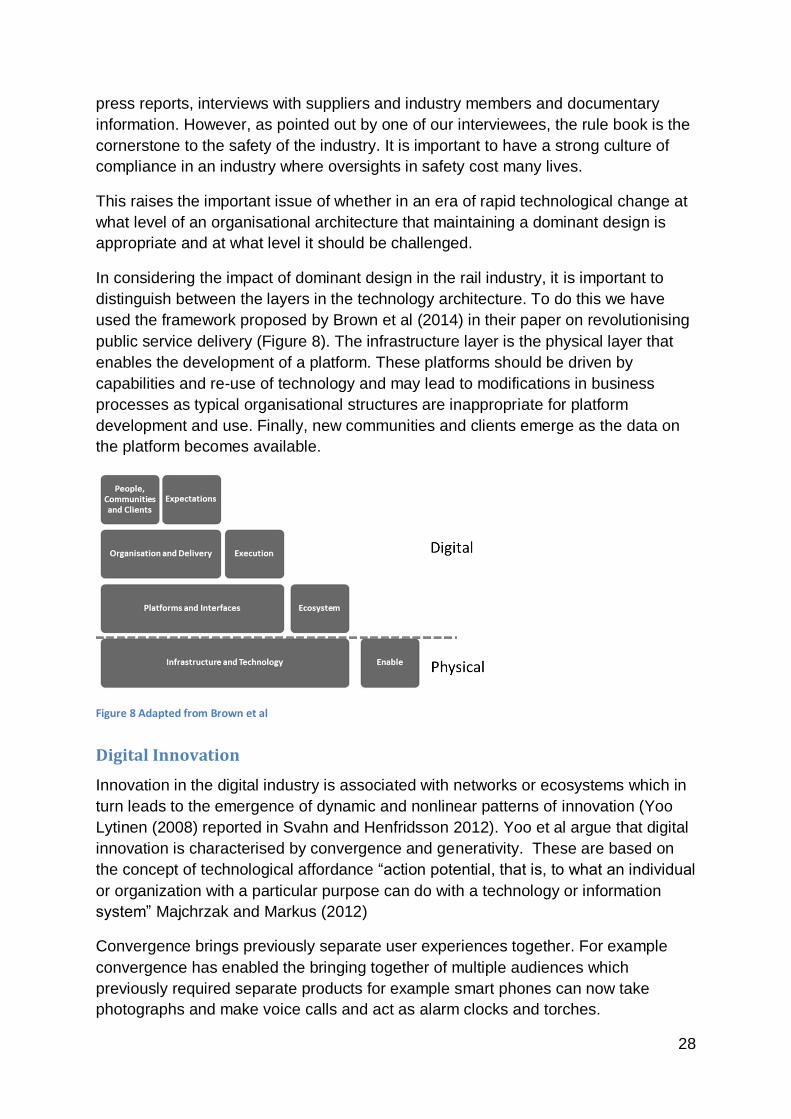
In considering the impact of dominant design in the rail industry, it is important to
distinguish between the layers in the technology architecture. To do this we have
used the framework proposed by Brown et al (2014) in their paper on revolutionising
public service delivery (Figure 8). The infrastructure layer is the physical layer that
enables the development of a platform. These platforms should be driven by
capabilities and re-use of technology and may lead to modifications in business
processes as typical organisational structures are inappropriate for platform
development and use. Finally, new communities and clients emerge as the data on
the platform becomes available.
Figure 8 Adapted from Brown et al
Digital Innovation
Innovation in the digital industry is associated with networks or ecosystems which in
turn leads to the emergence of dynamic and nonlinear patterns of innovation (Yoo
Lytinen (2008) reported in Svahn and Henfridsson 2012). Yoo et al argue that digital
innovation is characterised by convergence and generativity. These are based on
the concept of technological affordance “action potential, that is, to what an individual
or organization with a particular purpose can do with a technology or information
system” Majchrzak and Markus (2012)
Convergence brings previously separate user experiences together. For example
convergence has enabled the bringing together of multiple audiences which
previously required separate products for example smart phones can now take
photographs and make voice calls and act as alarm clocks and torches.
29
Generativity is a technology’s overall capacity to produce unprompted change. For
example the development of the smartphone supports generativity through the
establishment of a platform which enables innovations by third parties to be
integrated into the platform after the fact.
Yoo (2013) argues that many of the recombinations of use of Google maps may not
be what Google originally intended or even thought possible when it was first
introduced, for example its use as an emergency coordination and communication
capability during hurricane Katrina. Nor did they anticipate that Nikon engineers
would integrate them with photographs from digital cameras. As Yoo reports on the
development of the Apple IOS it was only when independent developers from the
jailbreaking community introduced unofficial applications created by third-party
developers that Apple embraced generativity and the resulting Apple App Store. In
contrast Google has perhaps allowed too much uncontrolled change in the open
android platform and are said to subsequently introduce metric measures to better
control the core of the operating system, and in May 2014 they prevented the use of
unapproved extensions to the Chrome browser, saying that these could be used as
open doors to the introduction of malware (BBC, 2014). However, the key feature of
generativity is the enabling of open innovation.
In digital innovation innovation is distributed across many parties and agility, the
ability to detect and seize opportunities is an imperative for success in a digital
innovation regime (Brown and Eisenhardt (1997), Christensen (1997). For firms in
such a network they need to recognise that they are part of a horizontally segmented
industry and simply nodes in a value chain network.
In short, digital innovation has many different features to that of traditional product
and infrastructural innovation. Svahn and Henfridsson (2012) summarise these as
falling within 3 key “logic” groups grouped as “organising logic”, “market dynamics”
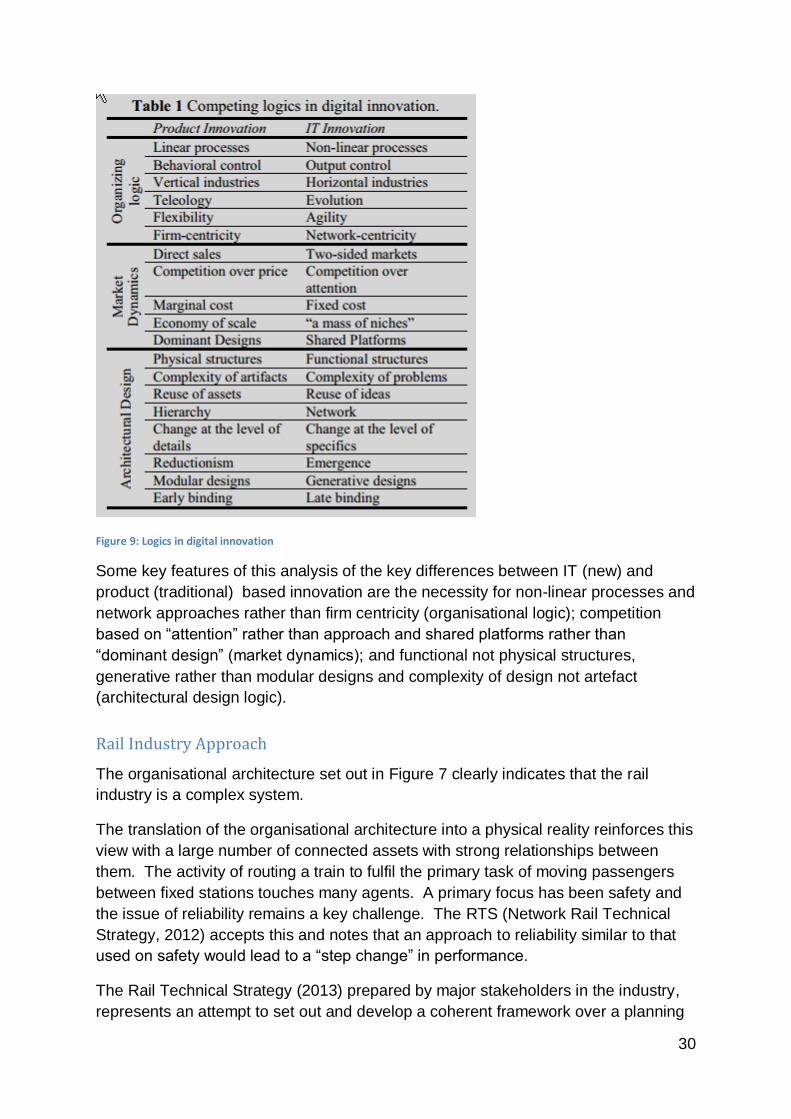
and “architectural design”. These are set out in Figure 9 below.
30
Figure 9: Logics in digital innovation
Some key features of this analysis of the key differences between IT (new) and
product (traditional) based innovation are the necessity for non-linear processes and
network approaches rather than firm centricity (organisational logic); competition
based on “attention” rather than approach and shared platforms rather than
“dominant design” (market dynamics); and functional not physical structures,
generative rather than modular designs and complexity of design not artefact
(architectural design logic).
Rail Industry Approach
The organisational architecture set out in Figure 7 clearly indicates that the rail
industry is a complex system.
The translation of the organisational architecture into a physical reality reinforces this
view with a large number of connected assets with strong relationships between
them. The activity of routing a train to fulfil the primary task of moving passengers
between fixed stations touches many agents. A primary focus has been safety and
the issue of reliability remains a key challenge. The RTS (Network Rail Technical
Strategy, 2012) accepts this and notes that an approach to reliability similar to that
used on safety would lead to a “step change” in performance.
The Rail Technical Strategy (2013) prepared by major stakeholders in the industry,
represents an attempt to set out and develop a coherent framework over a planning
31
horizon of 30 years, but also to form the basis of more detailed expenditure plans
over the next two control periods, CP5 and CP6. The document is based on a
number of relational “themes” namely Command, Control and Co-ordination, Energy,
Infrastructure, Rolling Stock, Information, and Customer Experience. These are
underpinned by 3 “common foundations” of a Whole System Approach, Innovation,
and lastly People. Enabling the forwards plans are “common design concepts”
which are Whole System Reliability, Resilience, Security, Automation, Simplicity,
Flexibility, and Sustainability. Key targets are described under the headings of “4
‘C’s”, which represent Capacity, Carbon, Costs, Customer satisfaction. To deliver
these ambitious targets a set of key projects is proposed addressing these singly or
together, graded along the axes of benefits and investment in a 4 degree scale from
low to very high.
We have identified a number of these projects which address the impact of digital
disruption most closely. These are a set of projects around big data and information
flows, and others on operational modelling and optimised traffic management.
Although these are having very high benefits, these are seen as occurring in CP6, ie
5 to 10 years away. We consider that this demonstrates a view that these impacts
will be not available to be recognised till then.
As part of the document set an academic response (ARRTS) from sector experts
was also published (RRUKA, 2012 ). Whilst broadly supportive of the RTS, some
significant concerns were expressed. These centre on the difficulty of
overcentralised control. For instance it was noted that the tools were lacking for a
whole systems approach, with optimal control of the whole network made difficult by
the lack of an agreed objective function (eg reliability or cost) and the absence of
appropriate modelling techniques and associated mathematical knowledge. The
modelling issue is confounded by the lack of freely available open data, with an
industry mindset driven by security.
A further area of concern was the apparent failure to learn from other industries;
innovation is seen too often as coming from within the industry. “The most
significant opportunities to enhance current knowledge transfer relate to transfer
from other sectors” ( p11)., with the examples given of auto and aviation going to
autonomous vehicles / platooning. This reluctance to learn lessons from elsewhere
has led to railways taking a path to dumb trains and centralisation.
This view that the rail industry is unaware of the potential impact of Digital disruption,
and its immediacy is reinforced by an analysis in the ARRTS showing that when the
impact of the investment in the 7 common design concepts is mapped against the 6
technical themes, whole system reliability is only concerned to have a medium
impact on both command, control and co-ordination and the customer experience.
32
Customers and Information
There is surprising little in the RTS or the ARRTS dealing with the impact of digital
disruption on the behaviour of customers, echoing a general consideration of those
we interviewed that the rail industry does not understand its customers.
The role of information is seen as being separated from control, command and co-
ordination, with “Information” separated from “command, control and co-ordination”
and action to improve customer satisfaction too often seen as better delay
information and contactless ticketing rather than timetable flexibility and recovery.
Customers are not seen as part of the value chain, but as elements to which a
timetable and information is pushed. Alternatives to this model are already in
evidence. For instance, blablacar, a French app based car/journey sharing scheme
is now considered by SNCF (the French railway company) as a major source of
completion. App based solutions to transport which the customer pulls towards them
can also be seen in Uber, a crowd sourced “taxi” solution.
Taken together these pressures can lead to a strong culture that does not change
quickly. They may even provide insights into the way developing technologies have
been previously implemented (GSM-R)). However, this may not be limited to the
past. For example, In a recent comment piece in the Guardian Matthews (Matthews,
2014), CEO of a leading industry supplier, sets out 10 ways in which railways in the
UK can be improved. These include: a stronger focus on the passenger that is
moving from simply operating railway based on push principles to focus on service;
recognising that the speed of change is extraordinary and increasing and that
competition may emerge from other sectors; getting things done quicker; learning
from other industries; valuing the role if IT and fundamentally changing the culture.
More fundamentally, she draws this together in a discussion of a specific case: that
of the procurement of a traffic management system. Ford (2014) in his review of the
TM system develops a hypothetical example where a wheelchair passenger is going
to take 10 minutes to board a train and considers whether it is cheaper to delay the
train by 10 minutes or use a taxi. This can only be done using a traffic management
system that can show the consequences of the disruption from a 10 minute delay. In
Ford’s example late running will cause a hundred minute delay plus another 115
minutes due to the knock-on effects. As a consequence, the cost of the delay is now
known and can be compared against a taxi. In summary, ‘TMS allows the signaller to
quantify the chaos of a range of decisions’. However, it is clear that there remains a
significant confusion around what a Traffic Management System is ‘in fact I’m not
sure that Network rail can articulate what a TMS is’ (Ford) and the argument from the
former CEO of NR that TMS is a ‘massive need’ but that the main problem is ‘getting
the industry to accept that it is something they can trust’.
Perhaps most importantly, Matthews argues that the benefits of TM may be being
delayed due to procurement practices based on the use of proprietary technology
from the 1990’s that would be considered obsolete in any other industry’ and these
33
delays are worth £250Bn a year and over £1Bn in control periods 5 and 6 (up to
2015).
Conclusions
We contend that digital will be able to disrupt the rail industry in a number of ways.
from both supply and demand side, and its effects on customers may exist in a world
of different pull based solutions. The current strategy underestimates the (potential)
impact of digital and how this will enable all travel customers to pull solutions.
In respect of the Digital Economy: It’s here now (not 2025 as in the RTS) and will
drive customer expectation. By 2020 an entire generation will have grown up in a
primarily digital world (Strategy& 2014) These customers will have a perspective
that the power lies with them as resource integrators within a wider network, and a
range of suppliers will have access to more usable data and intelligence, enabling
them to provide and sell more solutions differently. Value will be created in context.
Digital business is different in being non incremental and being driven by innovation,
not technology, product, artefact or procedure.
The DE impact will be extensive; a paradigm and mindset shift are both required.
Lessons from successful technology platforms confirm that they are built on the
principles of open standards which encourage innovation and grow the market.
Systems should be allowed to evolve and designed for participation with learning
from users, especially from unexpected and unplanned sources, and barriers to
experimentation should be lowered. This is represented in the government agenda
on technology purchase and open data. The generativity provided by digital
disruption creates new businesses, new revenue streams, and open innovation
leads to more ideas, better models, better networks.
Railways are receiving significant investment funds over the next two control periods
but may experience a very different future to that contemplated. Some parts of the
industry appear insensitive to passenger numbers and customer requirements.
Recovery (disruption management and recovery) is too complex to rely on people.
and even more difficult to simulate at train level, optimising passengers is even more
difficult, especially when there is no model and no data. The dominant Mindset is
that of safety and control, with a deep seated concern for accidents, level crossing
incidents and suicides.
The rail industry is not good at technology or the process (of introduction), and still
using waterfall plans in a world described by Accenture as being in constant beta.
The effect of a dominant design is exacerbated by a 30 year mindset based on a
curious amalgam of infrastructure/station life, rolling stock life, and other shorter term
assets. There is a substantial body of evidence that the passenger is on the
receiving end of a push mentality.

34
The digital economy will affect power relationships between all the stakeholders in
the railway directly and indirectly. Directly it will affect who does what and who gets
what. This changes as the Importance of ownership and use of data is realised, and
barriers to entry to the transport business are removed. Indirectly it will bring
different competitors, players and solutions into the industry, impacting on existing
providers, especially those with large fixed costs.
The above discussion clearly is describing a future at the limit. However we can
already see the early signs and enablers of such a digital future; as mentioned above
zero hour contracts and 3D printing, and an increasing ability to create value from
the long tail through the use of big data and accompanying algorithms. We contend
that the argument is not how far but how fast.
35
References
Abernathy W. and Clark K, 1985, "Innovation: Mapping the Winds of Creative
Destruction", Research Policy, 14 (1985), pp. 3-22.
Accenture technology vision 2013, http://www.accenture.com/microsites/it-trends-
innovations-2013/Pages/home.aspx accessed 07/06/2014
Accenture technology vision 2014, http://www.accenture.com/microsites/it-
technology-trends-2014/Pages/tech-vision-report.aspx accessed 07/06/2014
Arup, 2013, ORR & Network Rail Mandate AO/015: Network Rail bottom-up
benchmarking review -2012 update PUBLISHED VERSION 6 June 2013:
http://orr.gov.uk/__data/assets/pdf_file/0013/1804/arup-benchmarking-review-june-
2013.pdf accessed 24/05/2014
Axelrod, R., Mitchell,
W., Thomas, R.E., Bennett, D.S., Bruderer, E., 1995. Coalition
formation in standard-setting alliances. Management Science 41, pp1493–1508
CY Baldwin and CJ Woodard, 2009, The architecture of platforms, in A Gawer,
Platforms, Markets and Innovation. Elgar Publishing Ltd, Cheltenham UK
BBC, 2014, Google tackles “malicious” Chrome extensions,
http://www.bbc.co.uk/news/technology-27620819 accessed 03/06/2014
Bollier, David, 2006, "When push comes to pull: The new economy and culture of
networking technology." The Aspen Institute, Washington DC
Brown, A, Fishenden J and Thompson M, 2014, Revolutionising Digital Public
Service Delivery: A UK Government Perspective Submitted to IEEE special issue on
e-Government Interoperability
Brown, S. L. and Eisenhardt, K. M, 1997, "The art of continuous change: Linking
complexity theory and time-paced evolution in relentlessly shifting organizations",
Adm. Science Quarterly, 42 (1997).
Chapman, 2013, Network Rail’s operating strategy, European Railway Review, issue
4, 2013, http://www.europeanrailwayreview.com/18568/err-magazine/past-
issues/issue-4-2013/network-rails-operating-strategy/ accessed 02/06/2014
Christensen M., 1997, “The Innovator's Dilemma: When New Technologies Cause
Great Firms to Fail”, Harvard Business Press
Cusumano, M.A., Mylonadis, Y., Rosenbloom, R.S., 1992.
Strategic maneuvering and mass-
market dynamics: the triumph of VHS over Beta, Business History Review 66,
pp51–94
36
FAG den Butter, 2012. Managing Transaction Costs in the Era of Globalization,
Elgar Publishing Ltd, Cheltenham UK
DfT/ORR, 2011, http://assets.dft.gov.uk/publications/report-of-the-rail-vfm-
study/realising-the-potential-of-gb-rail.pdf accessed 25/05/2014
Estrin D, 2014, “Small data, where n = me”, Communications of the ACM, volume 57
Issue 4, April 2014, pp32-34
Ford R, 2014, “Simulated traffic management system in action”, Modern Railways,
February 2014, http://connection.ebscohost.com/c/articles/94323696/simulated-
traffic-management-system-action accessed 07/06/2014
Gawer, Annabelle (ed), 2011, Platforms, markets and innovation. Edward Elgar
Publishing, Cheltenham
Gawer, Annabelle, and Michael A. Cusumano, 2002, "Platform leadership." Harvard
Business School Press, Boston, MA 316 (2002).
Hagel III, John, John Seely Brown, and Lang Davidson. 2010, "The power of pull",
Basic Books, New York
Hemenway, D., 1975. Industrywide Voluntary Product Standards. Ballinger,
Cambridge, MA.
Henderson R. M. and Clark K. B, 1990, "Architectural Innovation: The
Reconfiguration of Existing Product Technologies and the Failure of Established
Firms", Adm. Science Quarterly, 35 (1990).
Hoffman, A.J, 1999, “Institutional evolution and change: environmentalism and the
US chemical industry”, Academy of Management Journal, Vol. 42 No. 4, pp. 351-71
Hopp and Spearman, Factory Physics, Foundations of Manufacturing Management,
Mcgraw-Hill/Irwin, 1996, p 163
Khalifa, Mohamed and Davison, R. N, 2006, "SME adoption of IT: the case of
electronic trading systems", Engineering Management, IEEE Transactions on53.2
(2006): 275-284.
KPMG, 2010, Department for Transport, Rail Franchising Policy: Analysis of Historic
Data, available at http://assets.dft.gov.uk/publications/pgr-rail-passenger-franchises-
historicaldata-pdf/report.pdf, accessed 07/06/2014
Lewis, M. A. and A. D. Brown, 2012, “How different is professional service
operations management?”, Journal of Operations Management, 30 (1-2): 1-11.
Lusch, Robert F, "REFRAMING SUPPLY CHAIN MANAGEMENT: A SERVICE‐
DOMINANT LOGIC PERSPECTIVE." Journal of Supply Chain Management47.1
(2011): 14-18.
37
Lycett, M, 2013, ‘Datafication’: making sense of (big) data in a complex world’.
European Journal of Information Systems 22, 381-386
Majchrzak, Ann, and Markus, M. Lynne, 2012, "Technology affordances and
constraints in management information systems (MIS)", Encyclopedia of
Management Theory (Ed: E. Kessler), Sage Publications, Forthcoming (2012).
Manyika, J et al, 2011 Big data: The next frontier for innovation, competition, and
productivity,
http://www.mckinsey.com/insights/business_technology/big_data_the_next_frontier_f
or_innovation accessed 07/06/2014
Matthews, 2014, the Guardian, “Ten ways Network Rail can create better railways
and save taxpayers £1bn”, Friday 21 March 2014,
http://www.theguardian.com/public-leaders-network/2014/mar/21/deltarail-network-
rail-failed-procurement accessed 03/06/2014
Meredith, Jack, 1998, "Building operations management theory through case and
field research." Journal of Operations Management 16.4 (1998): 441-454.
Narayanan, V. K., and Tianxu Chen, 2012, "Research on technology standards:
Accomplishment and challenges." Research Policy 41.8 (2012): 1375-1406.
Network Rail How we are regulated, 2014,
http://www.networkrail.co.uk/aspx/717.aspx accessed 03/06/2014
Network Rail Performance, 2014, http://www.networkrail.co.uk/about/performance/
accessed 03/06/2014
Network Rail Regulatory Bodies, 2014,
http://www.networkrail.co.uk/aspx/10469.aspx accessed 25/05/2014
Network Rail Strategic business plan for England and Wales Jan 2013 p4 Available
at http://www.networkrail.co.uk/WorkArea/DownloadAsset.aspx?id=30064784328
accessed 03/06/2014
Network Rail Technical Strategy, 2013, The Future Railway, Network Rail, London
Ng I, Scharf K, Progrebna G, Maull R, 2013, Contextual Variety, Internet-of-Things
and the Choice of Tailoring over Platform: Mass Customisation Strategy in Supply
Chain Management, Working Paper. Coventry, UK: WMG, University of Warwick.
(WMG Service Systems Research Group Working Paper Series),
http://wrap.warwick.ac.uk/57099/ accessed 07/06/2014
Normann, R, 2001, “Reframing business: When the map changes the landscape”.
New York: Wiley
38
Normann, Richard and Rafael Ramirez. "Designing interactive strategy", Harvard
business review 71.4 (1993): 65-77.
Ohno, Taiichi (March 1998), Toyota Production System: Beyond Large-Scale
Production, Productivity Press, ISBN 978-0-915299-14-0
ORR, 2013, PR13 Efficiency Benchmarking of Network Rail using LICB,
http://orr.gov.uk/__data/assets/pdf_file/0012/5007/pr13-efficiency-benchmarking-of-
nr.pdf accessed 03/06/2014
Parnaby, John, 1995, "Systems engineering for better engineering”, Engineering
Management Journal 5.6 (1995): 256-266.
Rail Engineer, 2013, http://www.therailengineer.com/2013/03/06/why-is-innovation-
so-difficult-in-railways/ accessed 03/06/2014
Rail Engineer, 2014, http://www.therailengineer.com/2014/03/08/signalling-
innovations-lineside/ accessed 03/06/2014
RCUK, 2014, http://gtr.rcuk.ac.uk/project/C2872EB3-9DD7-46FD-A461-
1651FA36A8BD
RRUKA, 2012, The Academic Response to the Rail Technical Strategy 2012,
London
Schilling, M.A, 2002, Technology success and failure in winner-take-all markets:
the impact of learning orientation, timing, and network externalities. Academy
of Management Journal 45, 387–398
Scott, W.R, 1987, “The adolescence of institutional theory”, Administrative Science
Quarterly, Vol. 32 No. 4, pp. 493-511.
Scott, W.R, 1995, Institutions and Organizations, Sage, Thousand Oaks, CA.
Scott, W.R, 2005, “Institutional theory: contributing a to theoretical research
program”, in Smith, K.G. and Hitt, M. (Eds), Great Minds in Management: The
Process of Theory Development, Oxford University Press, Oxford, pp. 460-84
Scott, W.R, 2008, Institutions and organizations: ideas and interests (3rd ed.),
Thousand Oaks, CA: Sage.
Siggelkow, N, 2007, “Persuasion with case studies”, The Academy of Management
Journal, 50 (1): 20-24.
Sniady, Aleksander and Soler, Jose, 2012, "An overview of GSM-R technology and
its shortcomings." 12th International Conference on ITS Telecommunications (ITST),
IEEE
39
Strategy& (2014) ‘http://www.strategyand.pwc.com/global/home/what-we-
think/digitization/megatrend’ accessed 09/06/2014.
Svahn, Fredrik, and Ola Henfridsson, 2012, "The dual regimes of digital innovation
management", 45th Hawaii International Conference on System Science (HICSS),
IEEE
Taiichi, Ohno, 1998, "Toyota production system: beyond large-scale production,
"Productivity Press, Cambridge, MA (1988)
Tassey, G, 2000, Standardization in technology-based markets. Research Policy 29,
pp587–602.
TfL, 2014, TFL Bus routes and borough reports, https://tfl.gov.uk/forms/14144.aspx
accessed 03/06/2014
Tushman, M.L., Anderson, P., 1986. Technological discontinuities and
organizational environments. Administrative Science Quarterly 31, pp439–465
Vargo, Stephen L., and Robert F. Lusch. "Evolving to a new dominant logic for
marketing." Journal of marketing 68.1 (2004): 1-17.
Vargo, Stephen L. and Robert F. Lusch, 2008, "Service-dominant logic: continuing
the evolution." Journal of the Academy of marketing Science 36.1 (2008): 1-10.
Voss, C, Tsikriktsis N., and Frohlich M, 2002, “Case research in operations
management.” International Journal of Operations & Production Management, 22
(2): 195-219.
Weiss, A.R., Birnbaum, P.H., 1989. Technological infrastructure and the
implementation of technological strategies. Management Science 35, pp1014–1026
Wolf, Gary, A. Carmichael, and K. Kelly. 2010, "The quantified self." TED http://www.
ted. com/talks/gary_wolf_the_quantified_self. html accessed 07/06/2014
Womack, James P., Daniel T. Jones, and Daniel Roos. The machine that changed
the world: The story of lean production--Toyota's secret weapon in the global car
wars that is now revolutionizing world industry. Simon and Schuster, 2007.
Yin, R. K, 2003, Case study research: Design and methods, 3rd ed. Thousand Oak:
Sage.
Yoo Y., K. Lyytinen and R. J. B. Jr, 2008, Distributed Innovation in Classes of
Networks, HICSS, IEEE Computer Society, p58
Yoo, Youngjin et al., 2012, "Organizing for innovation in the digitized world,
"Organization Science 23.5 (2012): 1398-1408.

40
Yoo, Youngjin, 2013, "The Tables Have Turned: How Can the Information Systems
Field Contribute to Technology and Innovation Management Research?", Journal of
the Association for Information Systems, 14