Embed Size (px)
Citation preview

Translational Research Approaches to Sugar-Induced Metabolic Disease
Mark A. Herman, MD
CAPGM Forum
February 7, 2019

Our Patient:• 29 yo man with uncontrolled T2D , HTN,
Hyperlipidemia, schizoaffective disorder who was admitted on 9/6 with paranoia, depression and suicidal ideation.
• Last few HBA1c 7.5 - 8.7• FSBGs in the 100-300s at home • No hypoglycemia at home
• Consulted for uncontrolled diabetes with intermittent hypoglycemia during his hospitalization
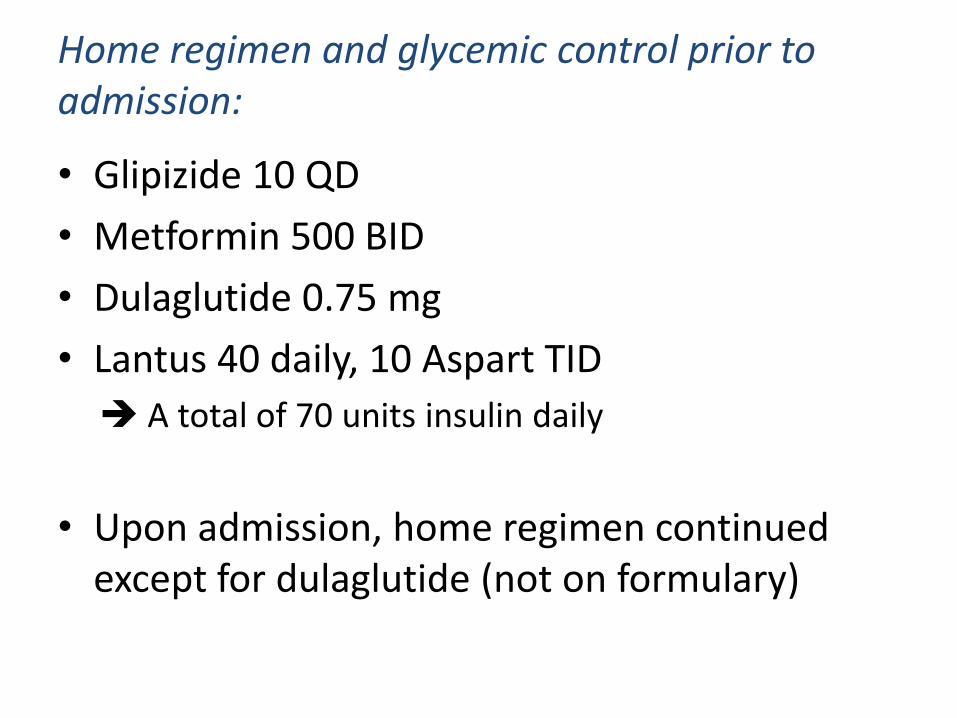
Home regimen and glycemic control prior to admission:
• Glipizide 10 QD
• Metformin 500 BID
• Dulaglutide 0.75 mg
• Lantus 40 daily, 10 Aspart TID
A total of 70 units insulin daily
• Upon admission, home regimen continued except for dulaglutide (not on formulary)
Dietary History:
• drinking “lots” of soda and fruit drinks
• 4-5 meals/day

Hospital Course:
• Recurrent hypoglycemic episodes on home regimen
• Pt reports feeling shaky when BG low

Intervention:
• Glipizide discontinued• Insulin titrated down over several days• Final Regimen: metformin + 1-2 units of correctional
Humalog only
Improvement in diet (“No Concentrated Sweets” Diet) during hospital stay resulted in profound reduction in insulin requirement

Circulation(2015),132:639-666
Proportion of All Cause Mortality Attributable to Sugar-Sweetened Beverages (SSBs)

SSB Consumption Increases Risk for Death Related to T2D, CVD, and Cancer
• Worldwide, ~ 184,000 excess annual deaths are attributable to SSB consumption
~ 178,000 from Type 2 Diabetes and Cardiovascular Disease
~ 6,450 from Cancers
* These may be underestimates as risks attributable to obesity per se were regressed out of this analysis.
Circulation(2015),132:639-666

SSBs Increase Risk of Metabolic SyndromeComparing Extreme Quantiles of Consumption
Diabetes Care (2010), 33(11):2477-83
N = 5,803 cases

SSBs Increase Risk of T2D Comparing Extreme Quantiles of Consumption
N = 15,043 cases
Diabetes Care (2010), 33(11):2477-83

SSBs Dose-Dependently Associate with Increased Fasting Insulin
Figure 2. Forest plot of main association between sugar-sweetened beverage intake and fasting insulin.
Discovery Cohorts Beta [95% CI]
CHS 0.09 [0.03, 0.15]
FHS 0.02 [0, 0.04]
MESA 0.03 [-0.03, 0.08]
RS1 0.06 [-0.02, 0.14]
RS2 0.03 [-0.06, 0.13]
YRS 0 [-0.08, 0.09]
Discovery Meta-Analysis 0.03 [0.01, 0.05]
Replication Cohorts
ARIC 0.04 [0.02, 0.06]
MDC 0.06 [0.03, 0.08]
NEO 0.02 [0, 0.04]
NHS 0.09 [-0.03, 0.22]
Raine -0.02 [-0.06, 0.02]
Replication Meta-Analysis 0.03 [0.01, 0.05]
All Cohorts Meta-Analysis 0.03 [0.02, 0.04]
-0.3 -0.1 0 0.1 0.3
Multiplicative difference in fasting insulin (mmol/l) per each additional serving/d of SSB intake
N = 34,748 adults
~ 0.5 mIU/L insulin per daily SSB
Diabetologia. 2018 Feb;61(2):317-330

SSBs Dose-Dependently Associate with Increased Triglyceride and Lower HDL-
Cholesterol Levels
preliminary data, Danielle Haslam / Nicola McKeown
N = 6,382
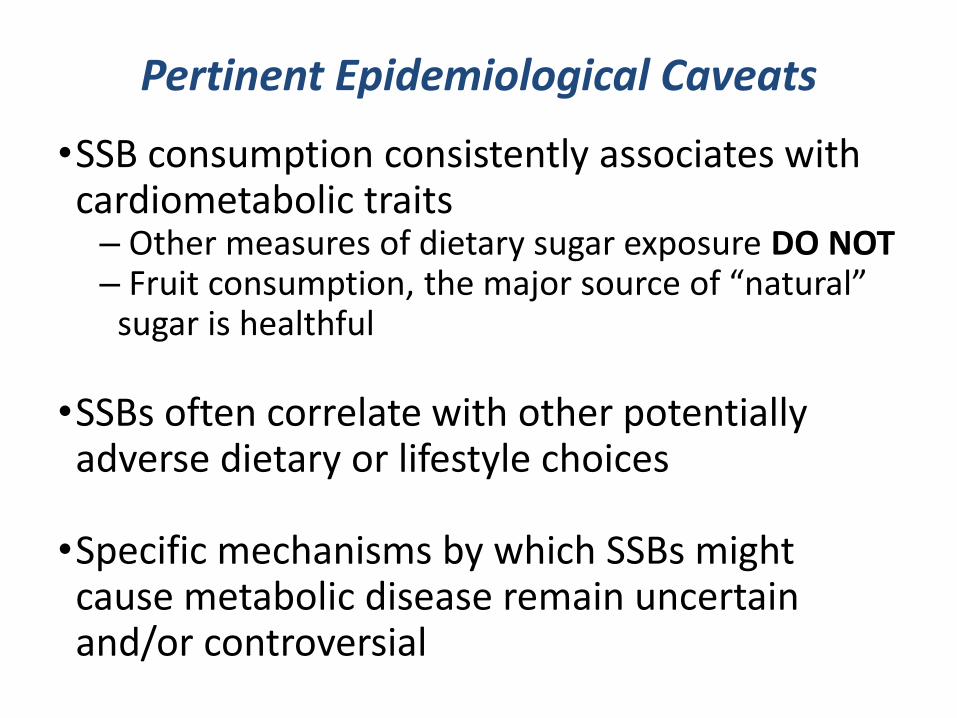
•SSB consumption consistently associates with cardiometabolic traits– Other measures of dietary sugar exposure DO NOT– Fruit consumption, the major source of “natural”
sugar is healthful
•SSBs often correlate with other potentially adverse dietary or lifestyle choices
•Specific mechanisms by which SSBs might cause metabolic disease remain uncertain and/or controversial
Pertinent Epidemiological Caveats


Hypertension, 1987, 10(5), 512-516.

Stanhope KL, JCI, 2009
Fructose-Sweetened Beverages, but not Glucose-Sweetened Beverages Promote Metabolic Syndrome in Overweight /
Obese Humans
• Fructose, but not Glucose Overfeeding Increased Serum Triglycerides
• Fructose, but not Glucose Overfeeding Increased Visceral Adiposity
• Fructose, but not Glucose Overfeeding Decreased Insulin Sensitivity

Queries:
1. Can detailed knowledge of the biology of fructose metabolism help us understand the pathogenesis of insulin resistance, T2DM, and cardiometabolic disease?
2. Can it help us resolve outstanding questions and controversies related to the public health effects of sugar consumption?
3. Can it move us towards a science of personalized nutrition with respect to sugar consumption?

fructose
glyceraldehyde glyceraldehyde-3-pdhap
Aldolase B
Ketohexokinase
Triose kinase
Aldolase
Pyruvate / Lactate
fructose-1,6-bis-p
gluc-6-pATP
ADP glycogen
glucose
fructose-1-p
Glut2
GlucokinaseG6Pase
Glut2/5/8
Km-glucose ~ 10 mM
Km-fructose ~ 0.8 mM
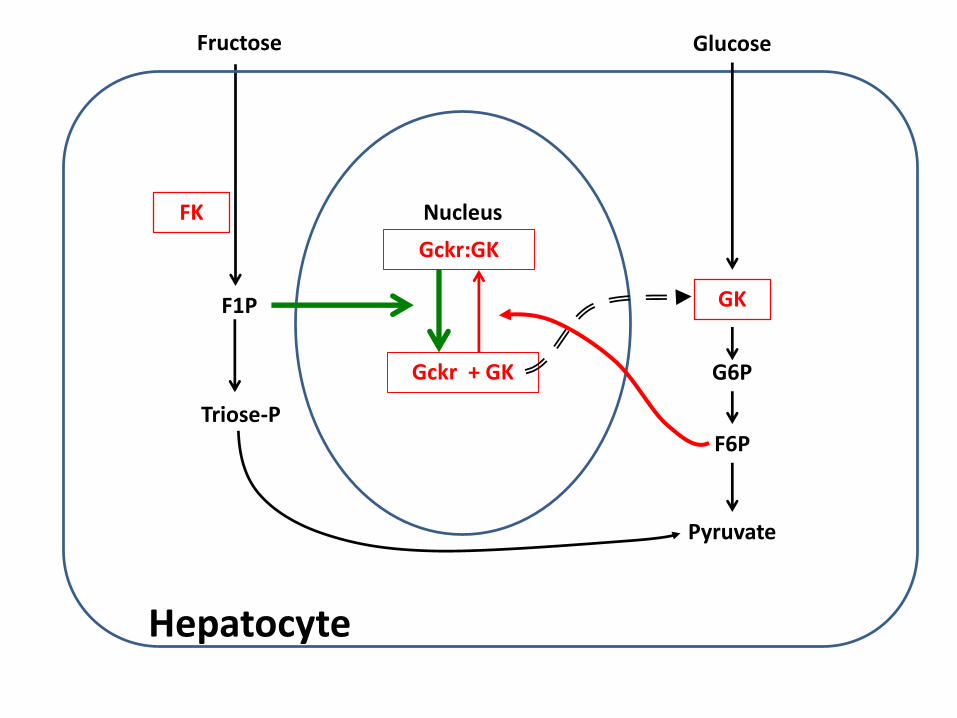
Gckr:GK
Gckr + GK
Nucleus
F1P
Fructose
FK
Glucose
G6P
F6P
Pyruvate
GK
Hepatocyte
Triose-P

Fructose (12 g)
KHK
Fructose ~ 1 mM
Fructose~ 0.1 mM
KHK
F1P
F1P
Lactate, Glucose, Lipid, CO2, …
Holdsworth CD, ed. Sugars in Nutrition.; 1991.

Fructose
KHK
Fructose ~ 1.2 mM
Fructose~ 1.2 mM
KHK
Loss of KHK Results in Benign Essential Frucotsuria (in humans and mice)
x
x
Ishimoto T, et al. PNAS. 2012

Fructose
Ketohexokinase
ATP
Fructose-1-p
Glut2/5/8
ADP AMP
Adenosine Deaminase
Hexose/Triose-P
G6P
Malonyl-CoALipogenesis /
Steatosis
Glucose Production
Uric Acid / Energetic Stress
Substrate Utilization
Activation of Signaling Systems
+

ChREBP (aka Mlxipl)Carbohydrate Responsive-Element Binding Protein
• Carbohydrate sensing function conserved throughout eukaryotes
• Expressed in liver, kidney, small intestine, and adipose tissue.
• Common Variants in the ChREBP locus associate with hypertriglyceridemia and low HDL cholesterol in human populations.

Global ChREBP Knockout (ChKO) Mice Are Fructose Intolerant
Iizuka K, et al. PNAS. 2004 May;101(19):7281–6.
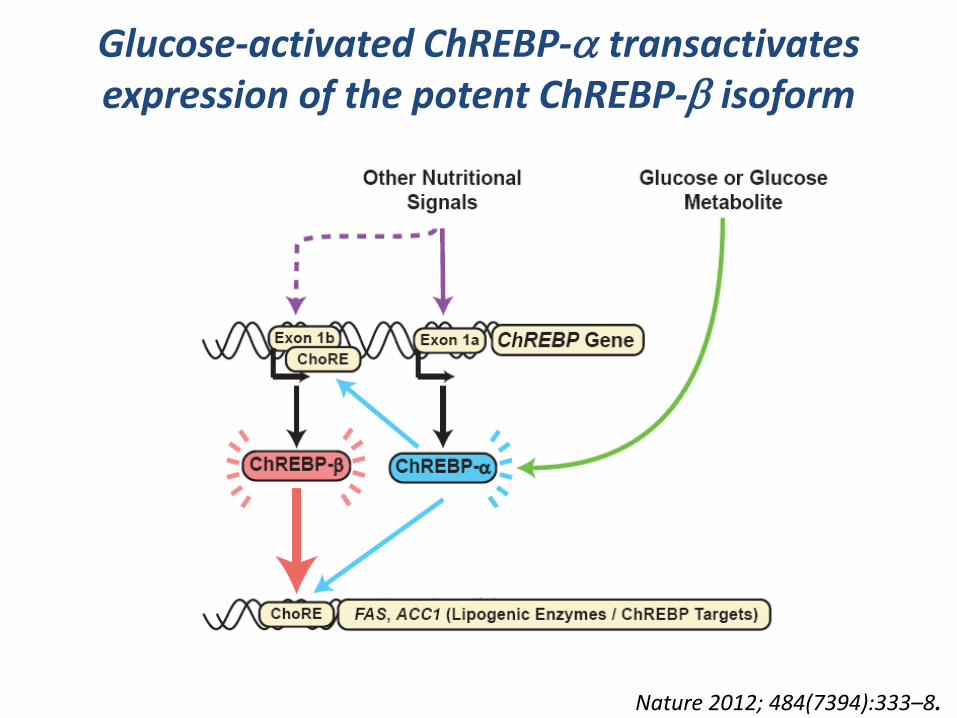
Glucose-activated ChREBP-a transactivates expression of the potent ChREBP-b isoform
Nature 2012; 484(7394):333–8.
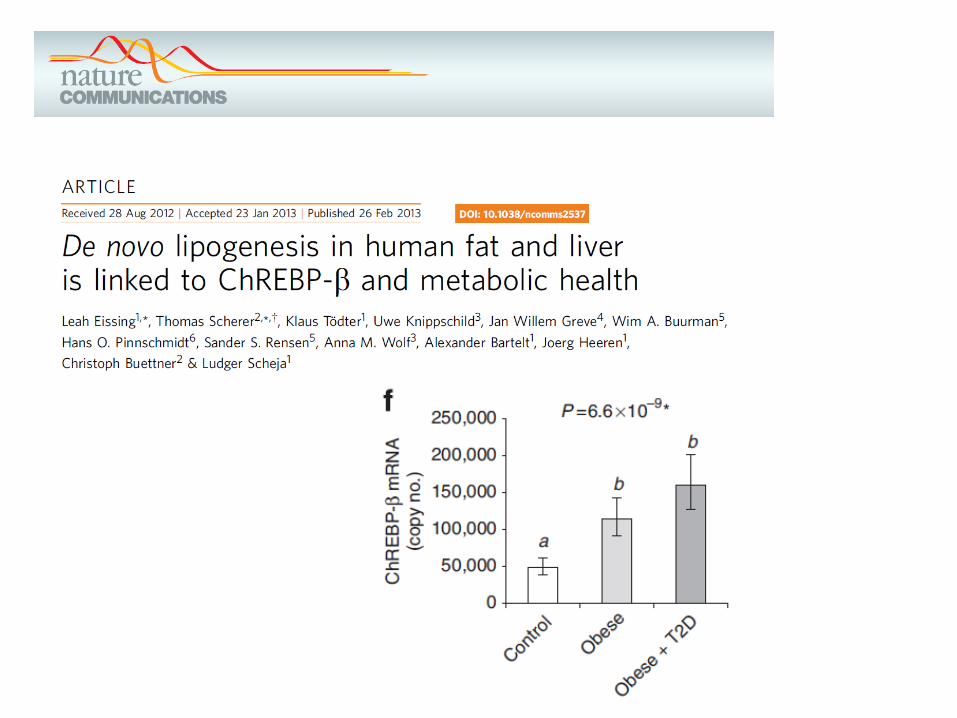

Fructose, but not Glucose Gavage Acutely Increases Expression of Hepatic ChREBP-b and its Targets
* Wild-type mice gavaged with water vs glucose vs fructose (4 g/kg BW) and euthanized 100 minutes later
J Clin Invest. 2016, 126(11):4372-4386

ChREBP is Necessary for Hepatic Fructose-Induced Gene Expression
J Clin Invest. 2016, 126(11):4372-4386

ChREBP is Necessary for Hepatic Fructose-Induced Gene Expression
J Clin Invest. 2016, 126(11):4372-4386

PEPCK
Glucose-6-Phosphatase
Insulin
Foxo1
AKT
Srebp1c
Acetyl-CoA Carboxyalse
Fatty Acid Synthase
Lipogenesis Glucose Production
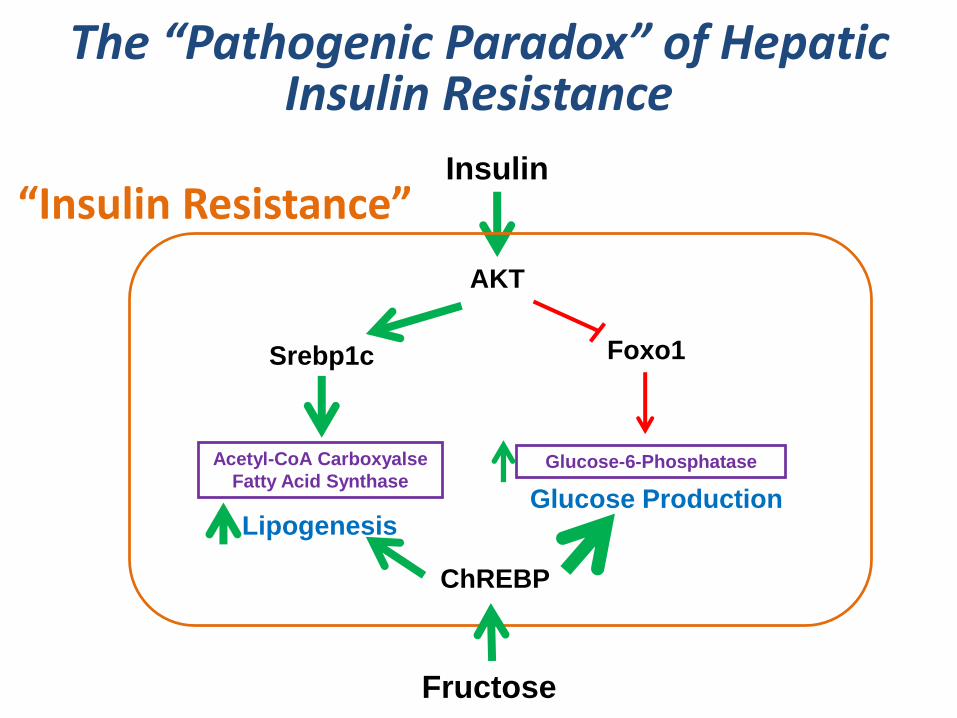
The “Pathogenic Paradox” of Hepatic Insulin Resistance
Healthy Liver

PEPCK
Glucose-6-Phosphatase
Insulin
Foxo1
AKT
Srebp1c
Acetyl-CoA Carboxyalse
Fatty Acid Synthase
Lipogenesis Glucose Production
?
?
The “Pathogenic Paradox” of Hepatic Insulin Resistance
“Insulin Resistance”

G-6-P Glycogen
Glucose
Pyruvate
G6Pase
Pyruvate Kinase
ChREBP
Fatty Acid Synthesis
Lactate
ACC, FAS
ChREBP Mediates Hepatic G6P Homeostasis
Fructose
KHK
J Clin Invest. 2016, 126(11):4372-4386
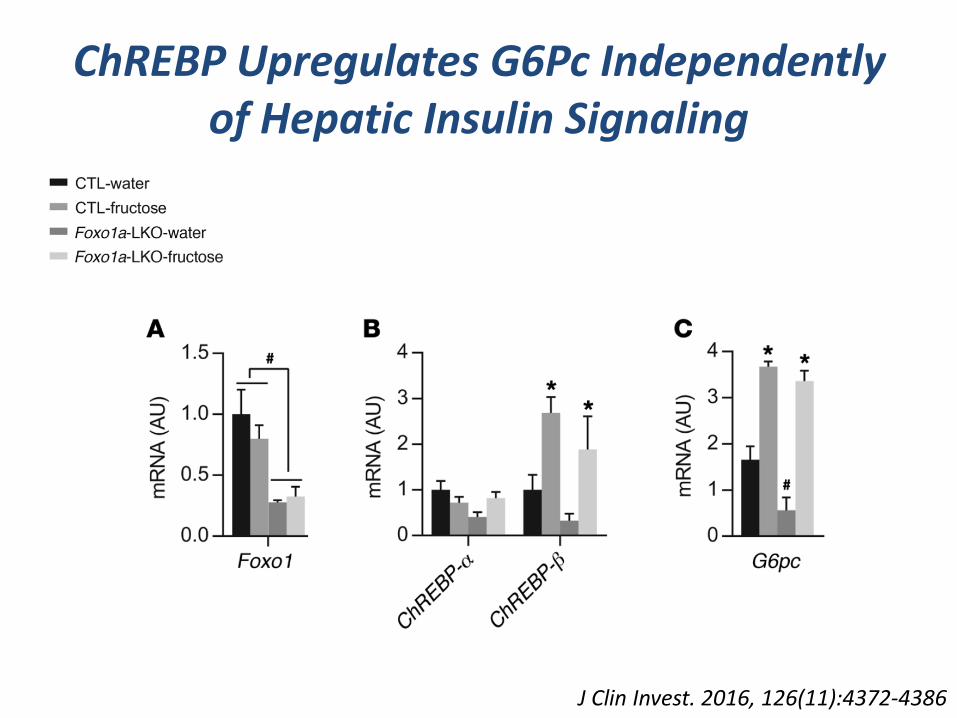
ChREBP Upregulates G6Pc Independently of Hepatic Insulin Signaling
J Clin Invest. 2016, 126(11):4372-4386
Glucose-6-Phosphatase
Insulin
Foxo1
AKT
Srebp1c
Acetyl-CoA Carboxyalse
Fatty Acid Synthase
LipogenesisGlucose Production
The “Pathogenic Paradox” of Hepatic Insulin Resistance
“Insulin Resistance”
ChREBP
Fructose

Conclusions 1
• Fructose consumption activates hepatic ChREBP which regulates hepatic metabolic gene expression programs.
• ChREBP stimulates Glucose-6-phosphatase expression to drive glucose production and this is dominant over insulin’s ability to suppress it.

GWAS Provides Insight into the Genetic Architecture of T2D and Metabolic Traits
• 76+ T2D genetic loci increasing risk
• T2D is ~ 30-40% heritable, but aggregated loci only account for 5-10% of heritability
Diabetes Genetics Replication and Meta-analyses Consortium (DIAGRAM), Nat Genetics 2014
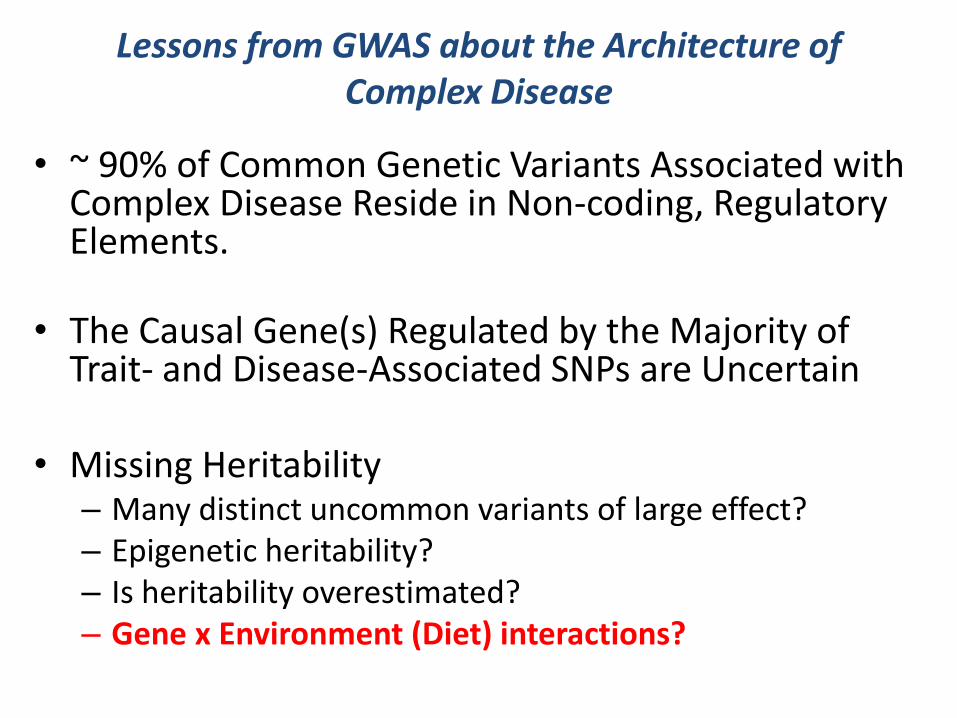
Lessons from GWAS about the Architecture of Complex Disease
• ~ 90% of Common Genetic Variants Associated with Complex Disease Reside in Non-coding, Regulatory Elements.
• The Causal Gene(s) Regulated by the Majority of Trait- and Disease-Associated SNPs are Uncertain
• Missing Heritability– Many distinct uncommon variants of large effect?– Epigenetic heritability?– Is heritability overestimated?– Gene x Environment (Diet) interactions?
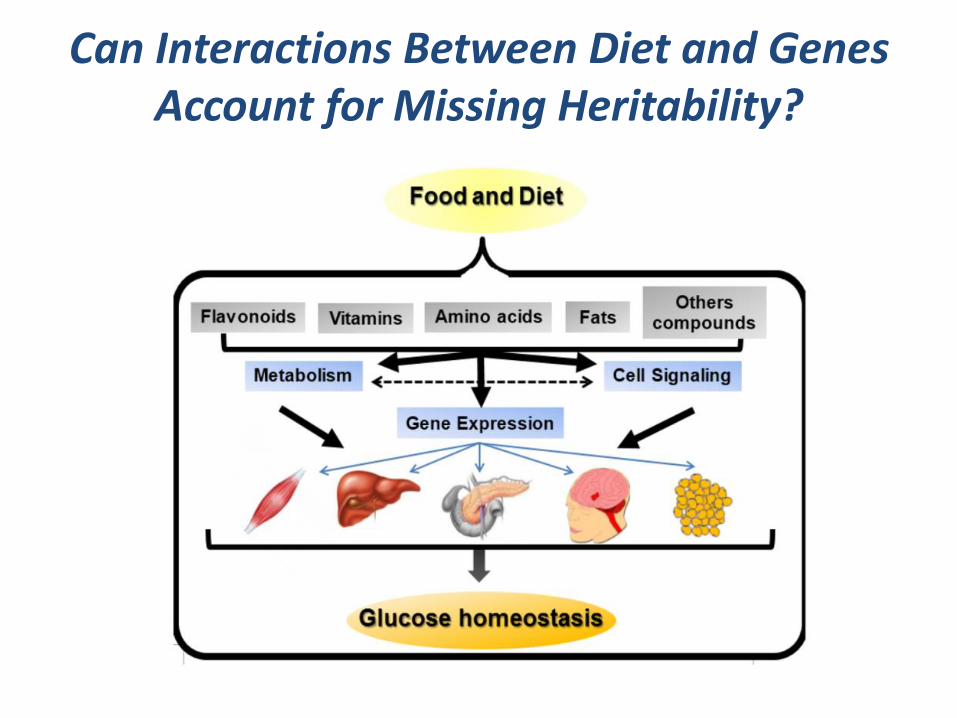
Can Interactions Between Diet and Genes Account for Missing Heritability?

Rationale and Clinical Relevance
2. Precision Medicine Initiative scope:
Individual variability in genetic, biomarkers, phenotypic and lifestyle characteristics
1. No Clear Consensus Among Physicians or Public Health Advocates as to the “Best” Diet for Obesity, Diabetes, or other Metabolic Conditions
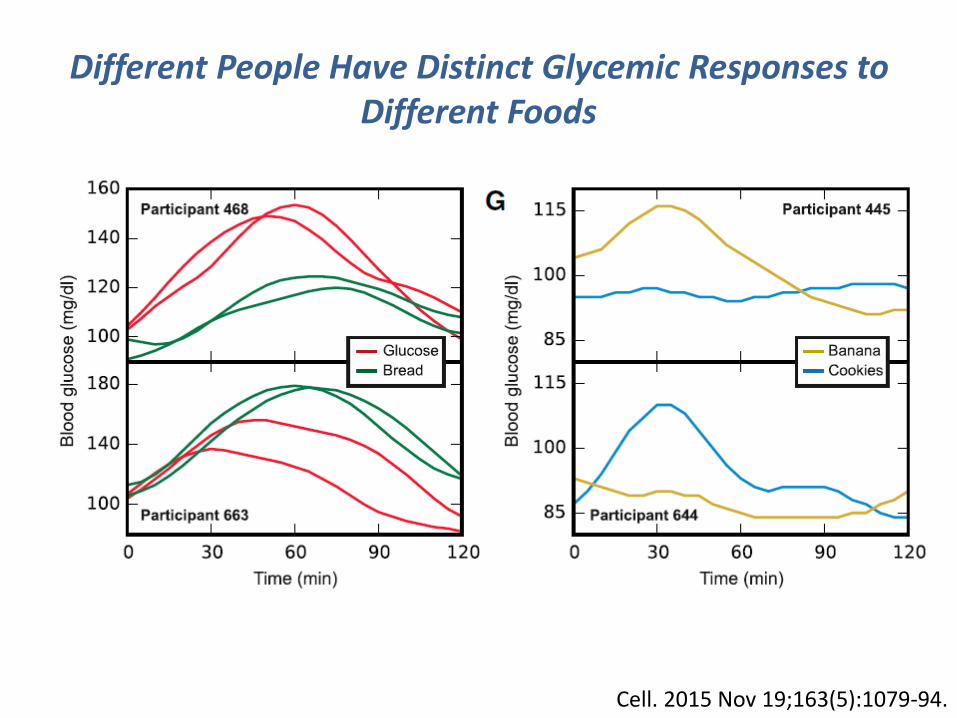
Cell. 2015 Nov 19;163(5):1079-94.
Different People Have Distinct Glycemic Responses to Different Foods

Towards a Science of Personalized Nutrition?

Elements Important for a Science of Personalized Nutrition
• Accurate means to assess diet / nutrient intake.
• Good measures of meta-phenotypes relating short-term affects of nutrients to disease progression.– Surrogate markers indicative of biological response to
specific nutrients.– Simple means to test dynamic responses to specific
nutrients.
• Detailed knowledge of biological pathways likely to mediate interactions between diet and genes on phenotype
Query:Can knowledge of a fructose-ChREBP axis be used to interrogate the biological response to fructose consumption in people?


(2008) Diabetes, 57(5), 1246-1253.
(2010). Gastroenterology, 139(2), 456-463.
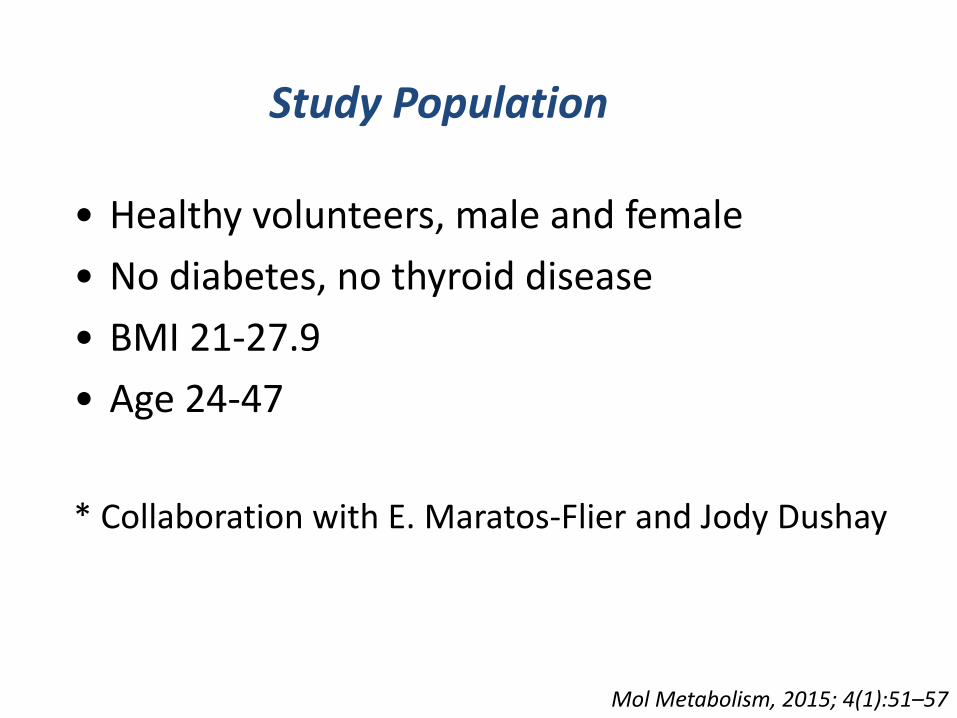
Study Population
• Healthy volunteers, male and female
• No diabetes, no thyroid disease
• BMI 21-27.9
• Age 24-47
* Collaboration with E. Maratos-Flier and Jody Dushay
Mol Metabolism, 2015; 4(1):51–57

Protocol
• 16h overnight fast
• 75g oral glucose (oGTT) and a 75g oral fructose tolerance test (oFTT) in each individual
• Blood collected for glucose, insulin, TG, and FGF21 levels
Mol Metabolism, 2015; 4(1):51–57

Fructose Ingestion Acutely and Robustly Increases Circulating FGF21 in Lean, Healthy Humans
Mol Metabolism, 2015; 4(1):51–57
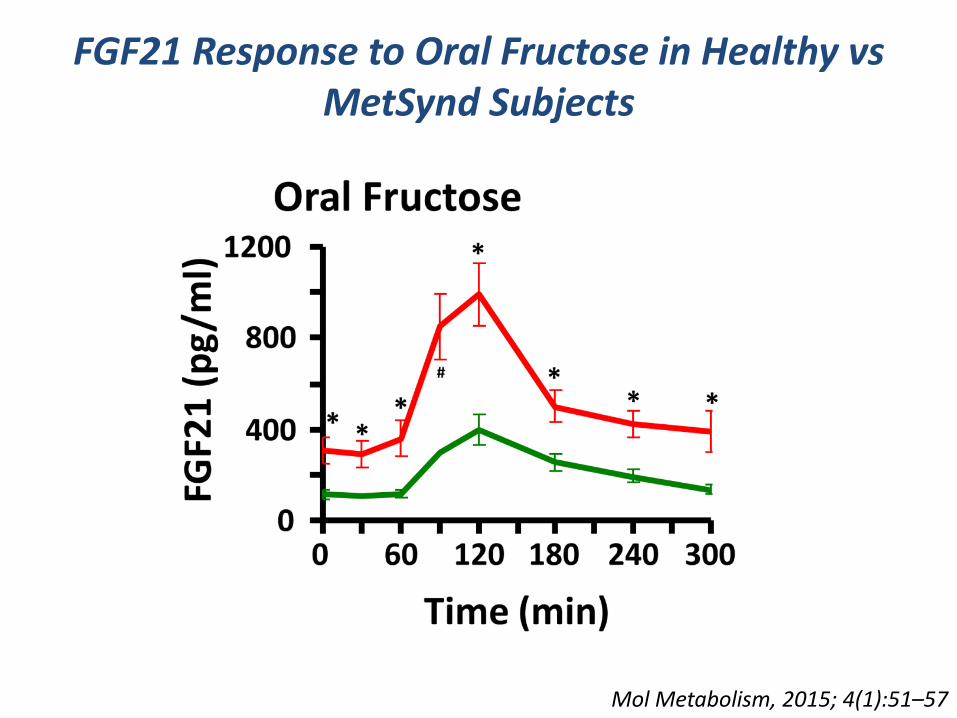
FGF21 Response to Oral Fructose in Healthy vs MetSynd Subjects
Mol Metabolism, 2015; 4(1):51–57

Conclusions 2• FGF21 is a ChREBP transcriptional target and is
upregulated by fructose consumption.
• Circulating FGF21 is acutely and robustly regulated in human subjects by fructose or a combination of glucose and fructose ingestion.
• Fructose-stimulated FGF21 is enhanced in subjects with the metabolic syndrome.
• Fructose-stimulated FGF21 is the only known biomarker for an individual’s acute metabolic response to fructose ingestion.

Query:
Does FGF21 participate in the biological response to fructose / sugar ingestion?

SNPs in the FGF21 Locus Associate with Carbohydrate vs Fat Preferences in Human Populations
Hum Mol Genet. 2013 May 1;22(9):1895-902.Am J Clin Nutr. 2013 Jun;97(6):1395-402.
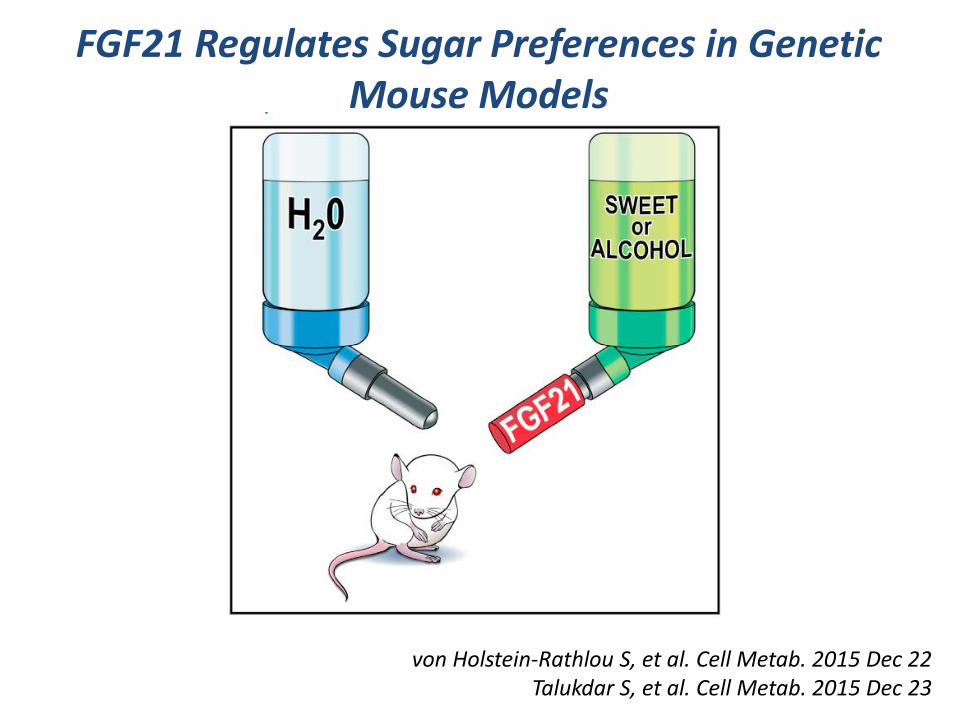
FGF21 Regulates Sugar Preferences in Genetic Mouse Models
von Holstein-Rathlou S, et al. Cell Metab. 2015 Dec 22Talukdar S, et al. Cell Metab. 2015 Dec 23

Query:
Do genetic variants in ChREBP or its targets interact with sugar-sweetened beverage consumption to impact cardiometabolic risk factors in human populations?
Collaboration with:• Danielle Haslam (USDA Jean Mayer Center for Nutrition and Aging)• Nicola McKeown PhD (USDA Jean Mayer Center for Nutrition and Aging) • Joseé Dupuis, PhD (Boston University)• The Charge Consortium

*Adjusted for age, sex, energy intake, cohort, smoking, education, physical activity, BMI, alcohol intake, % energy from saturated fat, and servings of food groups (fruit, vegetables, whole grains, fish, nuts/seeds).
~ 11 mg/dl
preliminary data

preliminary data
~ 12 mg/dl

~ 19 mg/dl
preliminary data
Conclusions 3
• SSBs dose-dependently associate with increased triglyceride levels
• Multiple independent variants in the ChREBP locus associate with hypertriglyceridemia
• The variants in the ChREBP locus that associate with hypertriglyceridemia in the population as a whole appear to be distinct from the variants that may interact with SSBs in this locus to effect hypertriglyceridemia

Newgard Lab
Phillip White
Rob McGarrah
Jie An
Jonathan Haldeman
Amanda Lapworth
Michelle Arlotto
UTSW
Guosheng Liang
Jay Horton
David Chuang
Max Wynn
BIDMC
Michelle Lai
AcknowledgementsHerman LabInna AstapovaMisung KimSarah KrawczykLudivine DoridotSarah HannouAshot SargsyanAlan FowlerGreg McElroyJohn Riley
DMPI Proteomics/MetabolomicsTabitha GeorgeGuo-Fang ZhangOlga IlkayevaPaul Grimsrud
Additional Collaborators:Jason KimHye-Lim Noh
Nicola McKeownDanielle HaslamJosee DupuisGina PelosoHassan DashtiCaren Smith
Charge Consortium