Embed Size (px)
Citation preview
TransLink – Public Opinion Metro Vancouver Omnibus Survey Results
May 2014
2
Introduction
Telephone interviews with Metro Vancouver adults, 18 years and over
Margin of error: 4.4% at 95% confidence level in the most conservative case; 6 percentage point spread required between measures
Industry-standard, multi-stage random selection techniques employed (note sample frame included both landlines and cell numbers)
Municipal quotas ensure the population is represented according to its actual distribution
At tabulation stage, weighting adjustments bring basic characteristics of age, gender and region into their correct known proportions based on Statistics Canada population figures
Interviewing conducted: October 5th - 15th, 2010 (n=508) June 4th – 20th, 2012 (n=500) June 13th – 23rd, 2013 (n=502) May 5th – 18th, 2014 (n=502)
Confidence Limits
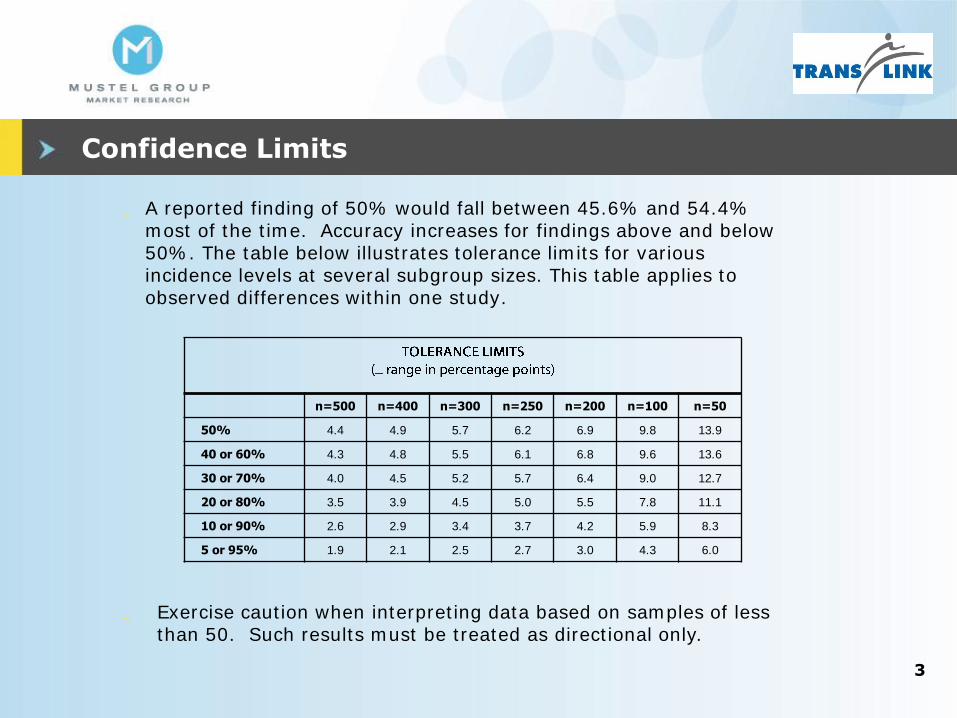
A reported finding of 50% would fall between 45.6% and 54.4% most of the time. Accuracy increases for findings above and below 50%. The table below illustrates tolerance limits for various incidence levels at several subgroup sizes. This table applies to observed differences within one study.
n=500 n=400 n=300 n=250 n=200 n=100 n=50
50% 4.4 4.9 5.7 6.2 6.9 9.8 13.9
40 or 60% 4.3 4.8 5.5 6.1 6.8 9.6 13.6
30 or 70% 4.0 4.5 5.2 5.7 6.4 9.0 12.7
20 or 80% 3.5 3.9 4.5 5.0 5.5 7.8 11.1
10 or 90% 2.6 2.9 3.4 3.7 4.2 5.9 8.3
5 or 95% 1.9 2.1 2.5 2.7 3.0 4.3 6.0
Exercise caution when interpreting data based on samples of less than 50. Such results must be treated as directional only.
3
Most Important Local Issue Facing Metro Vancouver
Total (502)
%
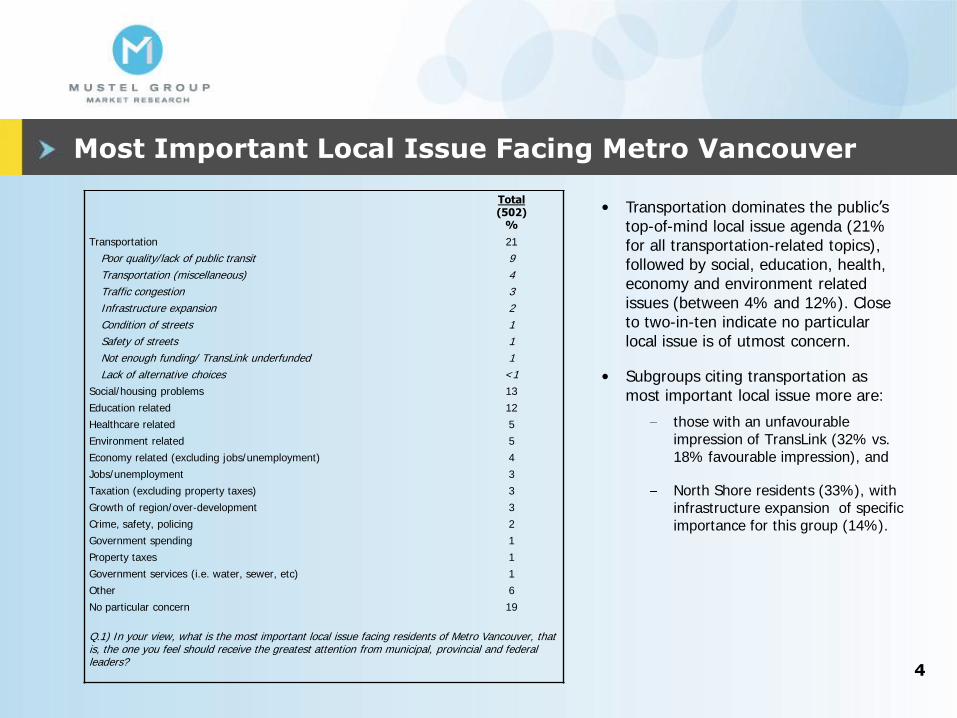
Transportation 21
Poor quality/lack of public transit 9
Transportation (miscellaneous) 4
Traffic congestion 3
Infrastructure expansion 2
Condition of streets 1
Safety of streets 1
Not enough funding/ TransLink underfunded 1
Lack of alternative choices <1
Social/housing problems 13
Education related 12
Healthcare related 5
Environment related 5
Economy related (excluding jobs/unemployment) 4
Jobs/unemployment 3
Taxation (excluding property taxes) 3
Growth of region/over-development 3
Crime, safety, policing 2
Government spending 1
Property taxes 1
Government services (i.e. water, sewer, etc) 1
Other 6
No particular concern 19
Q.1) In your view, what is the most important local issue facing residents of Metro Vancouver, that is, the one you feel should receive the greatest attention from municipal, provincial and federal leaders?
• Transportation dominates the public’s top-of-mind local issue agenda (21% for all transportation-related topics), followed by social, education, health, economy and environment related issues (between 4% and 12%). Close to two-in-ten indicate no particular local issue is of utmost concern.
• Subgroups citing transportation as most important local issue more are:
those with an unfavourable impression of TransLink (32% vs. 18% favourable impression), and
North Shore residents (33%), with infrastructure expansion of specific importance for this group (14%).
4
Employment Screening Criteria
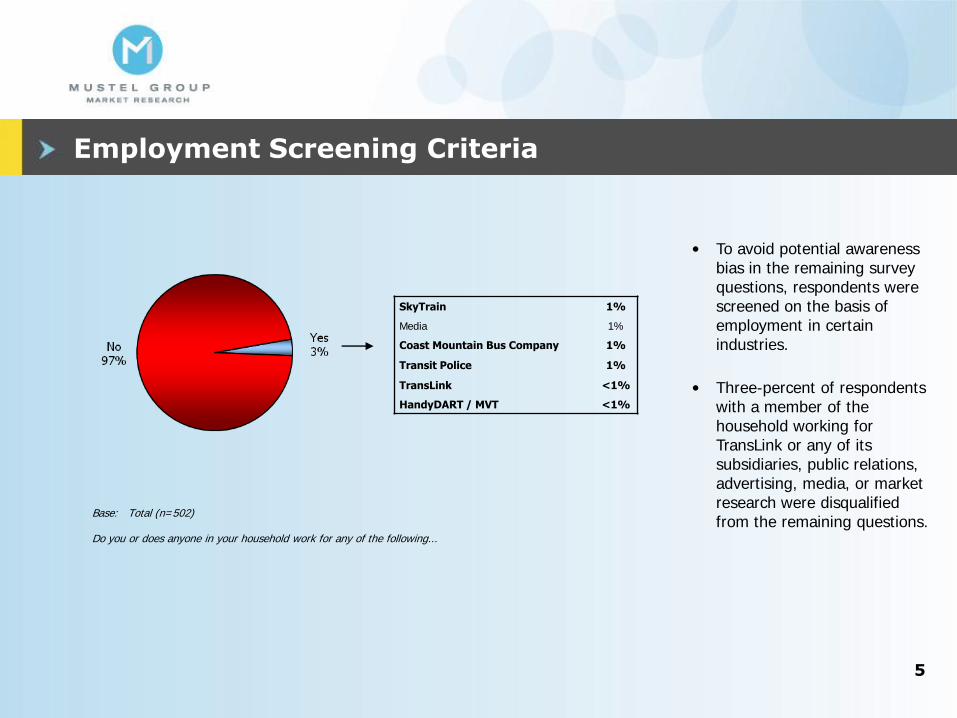
• To avoid potential awareness bias in the remaining survey questions, respondents were screened on the basis of employment in certain industries.
• Three-percent of respondents with a member of the household working for TransLink or any of its subsidiaries, public relations, advertising, media, or market research were disqualified from the remaining questions.
Base: Total (n=502) Do you or does anyone in your household work for any of the following...
5
SkyTrain 1%
Media 1%
Coast Mountain Bus Company 1%
Transit Police 1%
TransLink <1%
HandyDART / MVT <1%
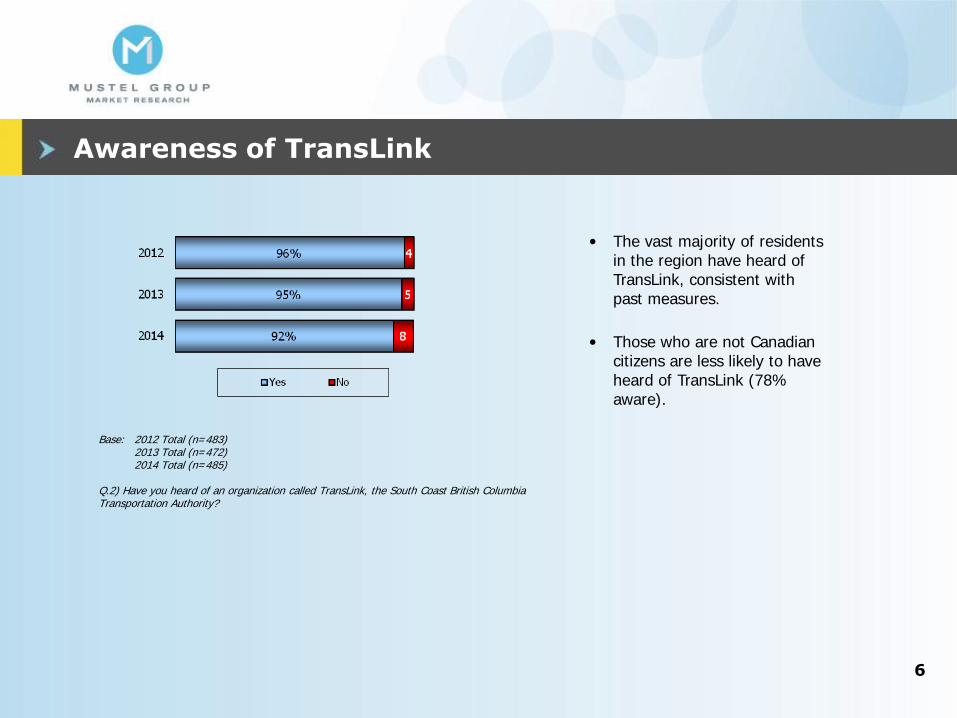
Awareness of TransLink
Base: 2012 Total (n=483) 2013 Total (n=472) 2014 Total (n=485) Q.2) Have you heard of an organization called TransLink, the South Coast British Columbia Transportation Authority?
• The vast majority of residents in the region have heard of TransLink, consistent with past measures.
• Those who are not Canadian citizens are less likely to have heard of TransLink (78% aware).
6
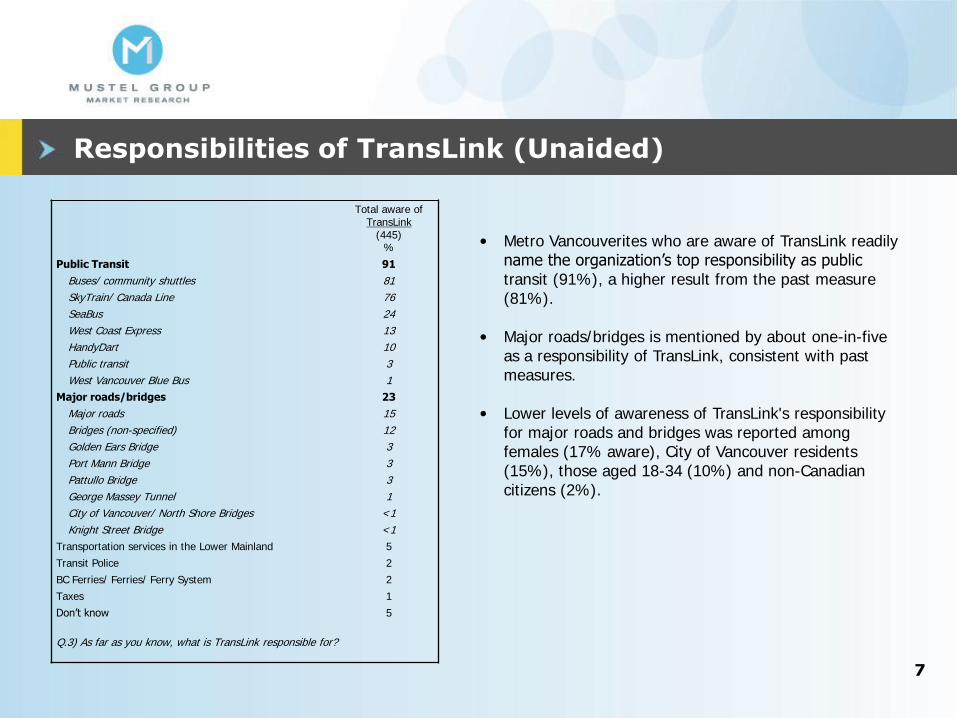
Responsibilities of TransLink (Unaided)
Total aware of TransLink
(445) %
Public Transit 91
Buses/ community shuttles 81
SkyTrain/ Canada Line 76
SeaBus 24
West Coast Express 13
HandyDart 10
Public transit 3
West Vancouver Blue Bus 1
Major roads/bridges 23
Major roads 15
Bridges (non-specified) 12
Golden Ears Bridge 3
Port Mann Bridge 3
Pattullo Bridge 3
George Massey Tunnel 1
City of Vancouver/ North Shore Bridges <1
Knight Street Bridge <1
Transportation services in the Lower Mainland 5
Transit Police 2
BC Ferries/ Ferries/ Ferry System 2
Taxes 1
Don’t know 5
Q.3) As far as you know, what is TransLink responsible for?
• Metro Vancouverites who are aware of TransLink readily name the organization’s top responsibility as public transit (91%), a higher result from the past measure (81%).
• Major roads/bridges is mentioned by about one-in-five as a responsibility of TransLink, consistent with past measures.
• Lower levels of awareness of TransLink's responsibility for major roads and bridges was reported among females (17% aware), City of Vancouver residents (15%), those aged 18-34 (10%) and non-Canadian citizens (2%).
7
Total favourable
70%
66%
71%
68%
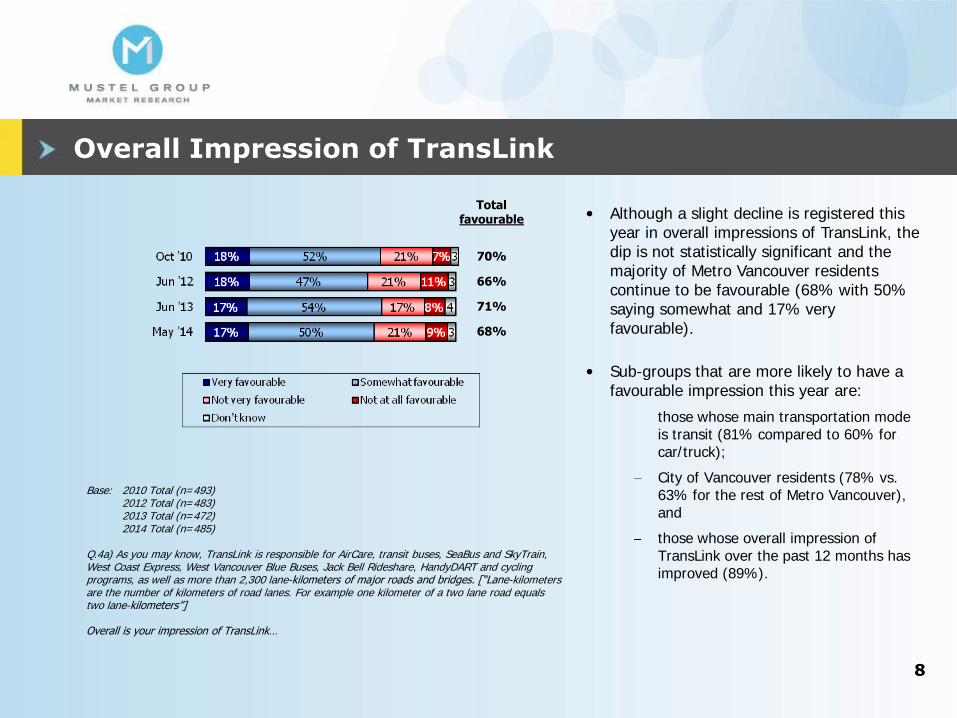
Overall Impression of TransLink
• Although a slight decline is registered this year in overall impressions of TransLink, the dip is not statistically significant and the majority of Metro Vancouver residents continue to be favourable (68% with 50% saying somewhat and 17% very favourable).
• Sub-groups that are more likely to have a favourable impression this year are:
those whose main transportation mode is transit (81% compared to 60% for car/truck);
City of Vancouver residents (78% vs. 63% for the rest of Metro Vancouver), and
those whose overall impression of TransLink over the past 12 months has improved (89%).
Base: 2010 Total (n=493) 2012 Total (n=483) 2013 Total (n=472) 2014 Total (n=485) Q.4a) As you may know, TransLink is responsible for AirCare, transit buses, SeaBus and SkyTrain, West Coast Express, West Vancouver Blue Buses, Jack Bell Rideshare, HandyDART and cycling programs, as well as more than 2,300 lane-kilometers of major roads and bridges. [“Lane-kilometers are the number of kilometers of road lanes. For example one kilometer of a two lane road equals two lane-kilometers”] Overall is your impression of TransLink…
8
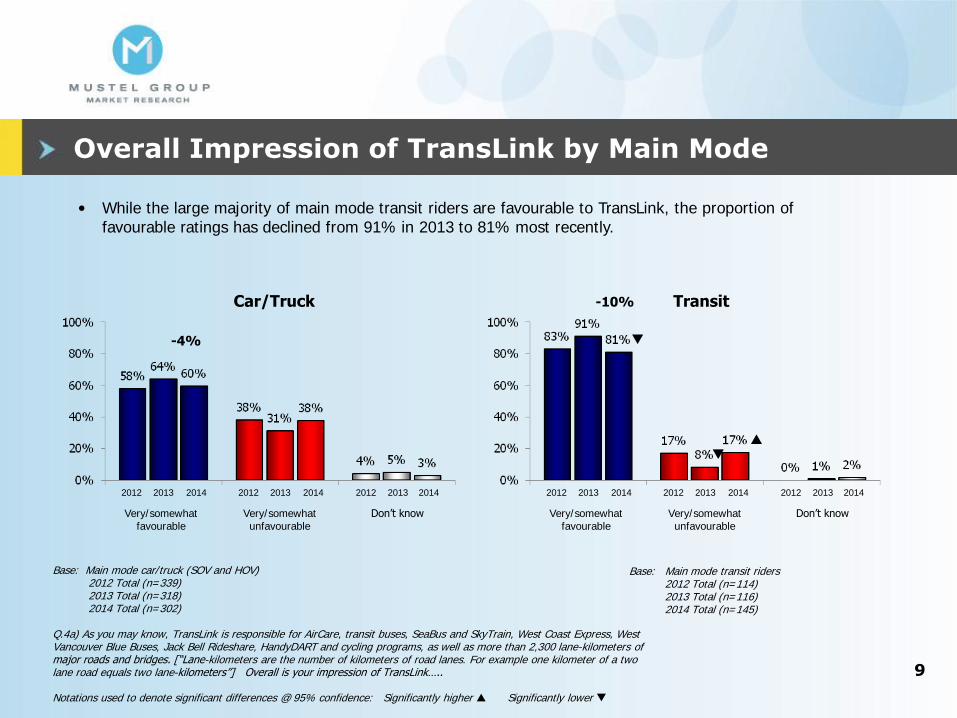
Overall Impression of TransLink by Main Mode
• While the large majority of main mode transit riders are favourable to TransLink, the proportion of favourable ratings has declined from 91% in 2013 to 81% most recently.
Base: Main mode car/truck (SOV and HOV) 2012 Total (n=339) 2013 Total (n=318) 2014 Total (n=302) Q.4a) As you may know, TransLink is responsible for AirCare, transit buses, SeaBus and SkyTrain, West Coast Express, West Vancouver Blue Buses, Jack Bell Rideshare, HandyDART and cycling programs, as well as more than 2,300 lane-kilometers of major roads and bridges. [“Lane-kilometers are the number of kilometers of road lanes. For example one kilometer of a two lane road equals two lane-kilometers”] Overall is your impression of TransLink….. Notations used to denote significant differences @ 95% confidence: Significantly higher Significantly lower
9
Car/Truck
Base: Main mode transit riders 2012 Total (n=114) 2013 Total (n=116) 2014 Total (n=145)
Transit
-4%
2012 2013 2014 2012 2013 2014 2012 2013 2014
Very/somewhat favourable
Very/somewhat unfavourable
Don’t know
-10%
2012 2013 2014 2012 2013 2014 2012 2013 2014
Very/somewhat favourable
Very/somewhat unfavourable
Don’t know
Reasons for Favourable Impression of TransLink
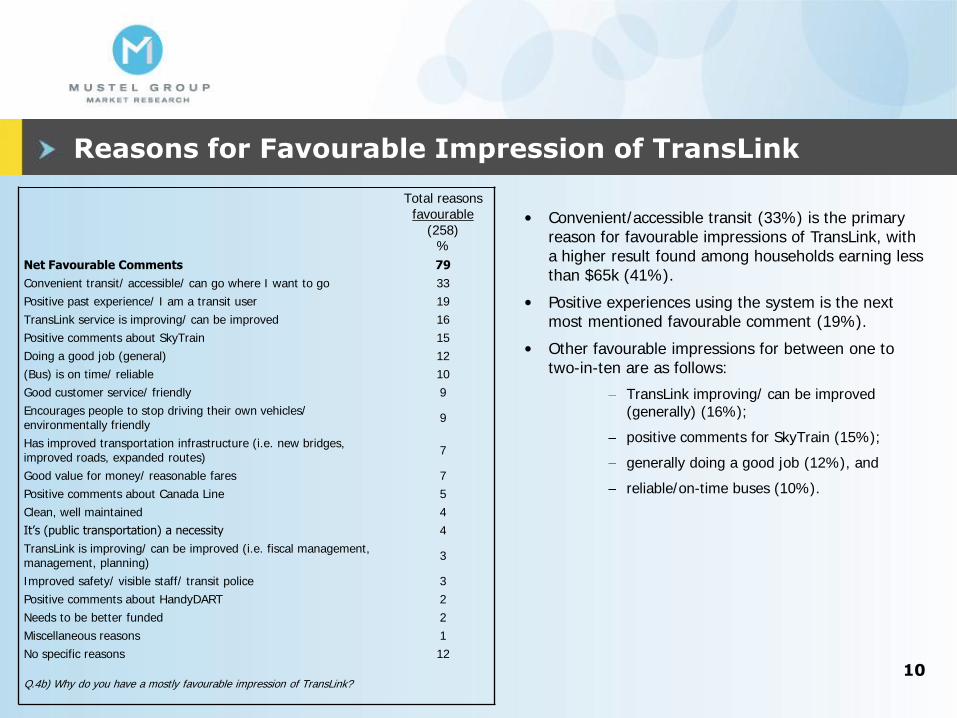
• Convenient/accessible transit (33%) is the primary reason for favourable impressions of TransLink, with a higher result found among households earning less than $65k (41%).
• Positive experiences using the system is the next most mentioned favourable comment (19%).
• Other favourable impressions for between one to two-in-ten are as follows:
TransLink improving/ can be improved (generally) (16%);
positive comments for SkyTrain (15%);
generally doing a good job (12%), and
reliable/on-time buses (10%).
Total reasons favourable
(258) %
Net Favourable Comments 79
Convenient transit/ accessible/ can go where I want to go 33
Positive past experience/ I am a transit user 19
TransLink service is improving/ can be improved 16
Positive comments about SkyTrain 15
Doing a good job (general) 12
(Bus) is on time/ reliable 10
Good customer service/ friendly 9
Encourages people to stop driving their own vehicles/ environmentally friendly
9
Has improved transportation infrastructure (i.e. new bridges, improved roads, expanded routes)
7
Good value for money/ reasonable fares 7
Positive comments about Canada Line 5
Clean, well maintained 4
It’s (public transportation) a necessity 4
TransLink is improving/ can be improved (i.e. fiscal management, management, planning)
3
Improved safety/ visible staff/ transit police 3
Positive comments about HandyDART 2
Needs to be better funded 2
Miscellaneous reasons 1
No specific reasons 12
Q.4b) Why do you have a mostly favourable impression of TransLink?
10
Reasons for Unfavourable Impression of TransLink
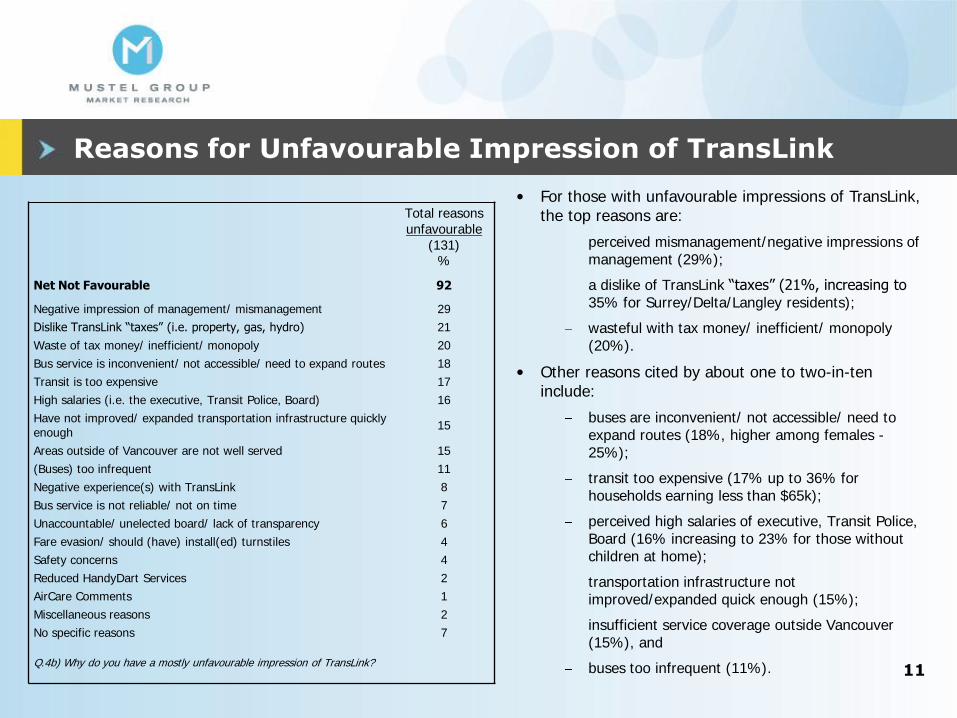
• For those with unfavourable impressions of TransLink, the top reasons are:
perceived mismanagement/negative impressions of management (29%);
a dislike of TransLink “taxes” (21%, increasing to 35% for Surrey/Delta/Langley residents);
wasteful with tax money/ inefficient/ monopoly (20%).
• Other reasons cited by about one to two-in-ten include:
buses are inconvenient/ not accessible/ need to expand routes (18%, higher among females -25%);
transit too expensive (17% up to 36% for households earning less than $65k);
perceived high salaries of executive, Transit Police, Board (16% increasing to 23% for those without children at home);
transportation infrastructure not improved/expanded quick enough (15%);
insufficient service coverage outside Vancouver (15%), and
buses too infrequent (11%).
Total reasons unfavourable
(131) %
Net Not Favourable 92
Negative impression of management/ mismanagement 29
Dislike TransLink “taxes” (i.e. property, gas, hydro) 21
Waste of tax money/ inefficient/ monopoly 20
Bus service is inconvenient/ not accessible/ need to expand routes 18
Transit is too expensive 17
High salaries (i.e. the executive, Transit Police, Board) 16
Have not improved/ expanded transportation infrastructure quickly enough
15
Areas outside of Vancouver are not well served 15
(Buses) too infrequent 11
Negative experience(s) with TransLink 8
Bus service is not reliable/ not on time 7
Unaccountable/ unelected board/ lack of transparency 6
Fare evasion/ should (have) install(ed) turnstiles 4
Safety concerns 4
Reduced HandyDart Services 2
AirCare Comments 1
Miscellaneous reasons 2
No specific reasons 7
Q.4b) Why do you have a mostly unfavourable impression of TransLink? 11
Trends in TransLink’s Approval Rating
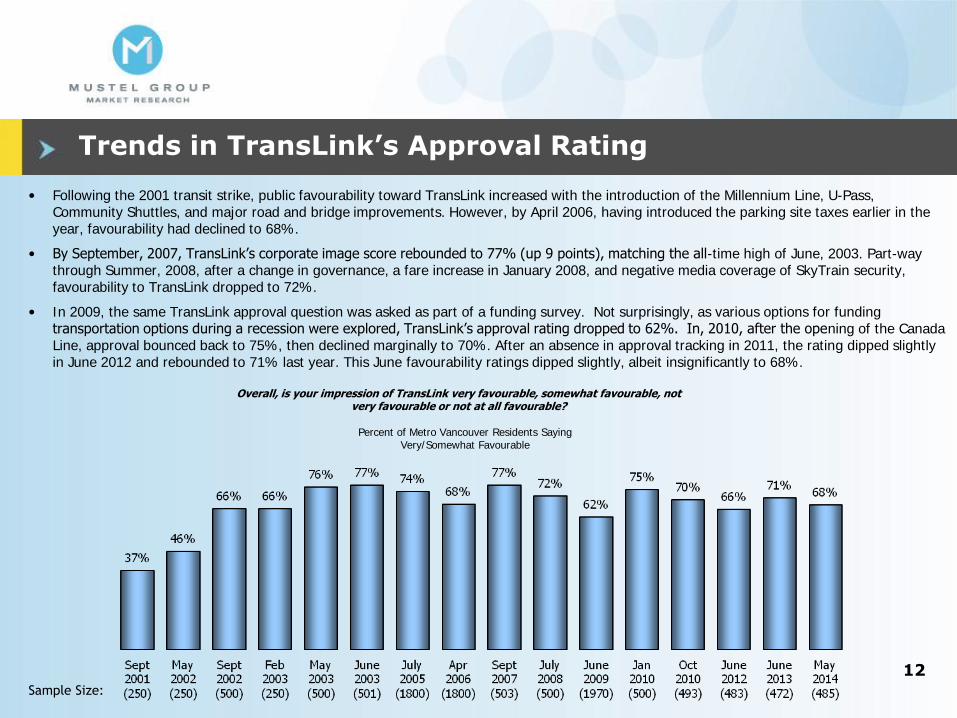
• Following the 2001 transit strike, public favourability toward TransLink increased with the introduction of the Millennium Line, U-Pass, Community Shuttles, and major road and bridge improvements. However, by April 2006, having introduced the parking site taxes earlier in the year, favourability had declined to 68%.
• By September, 2007, TransLink’s corporate image score rebounded to 77% (up 9 points), matching the all-time high of June, 2003. Part-way through Summer, 2008, after a change in governance, a fare increase in January 2008, and negative media coverage of SkyTrain security, favourability to TransLink dropped to 72%.
• In 2009, the same TransLink approval question was asked as part of a funding survey. Not surprisingly, as various options for funding transportation options during a recession were explored, TransLink’s approval rating dropped to 62%. In, 2010, after the opening of the Canada Line, approval bounced back to 75%, then declined marginally to 70%. After an absence in approval tracking in 2011, the rating dipped slightly in June 2012 and rebounded to 71% last year. This June favourability ratings dipped slightly, albeit insignificantly to 68%.
Percent of Metro Vancouver Residents Saying Very/Somewhat Favourable
Sample Size:
12
Overall, is your impression of TransLink very favourable, somewhat favourable, not very favourable or not at all favourable?
Change in Overall Impression of TransLink
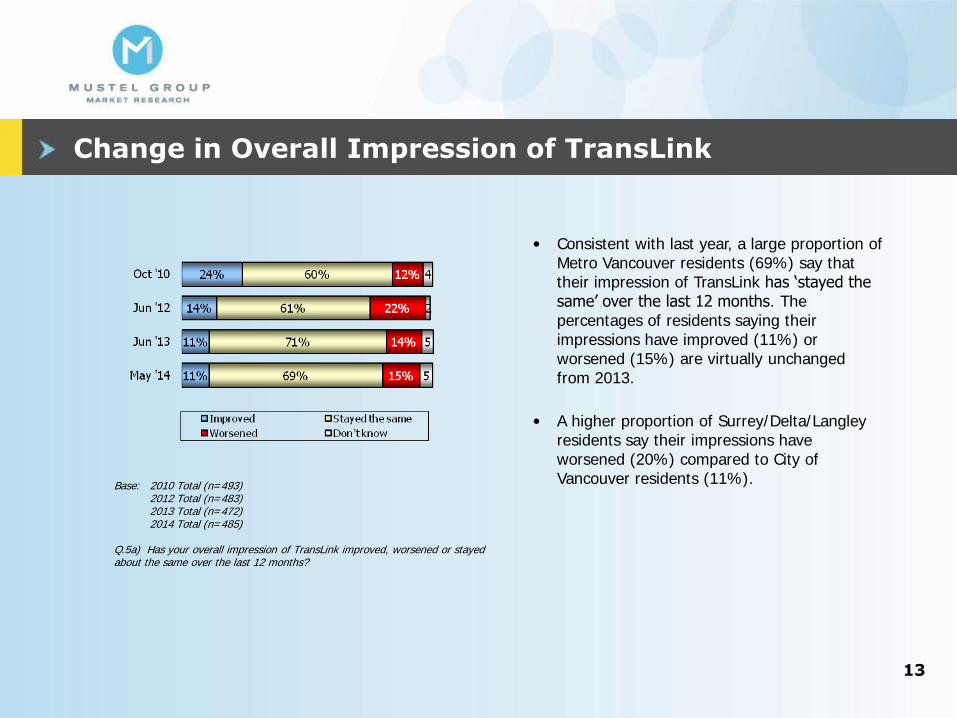
Base: 2010 Total (n=493) 2012 Total (n=483) 2013 Total (n=472) 2014 Total (n=485) Q.5a) Has your overall impression of TransLink improved, worsened or stayed about the same over the last 12 months?
• Consistent with last year, a large proportion of Metro Vancouver residents (69%) say that their impression of TransLink has ‘stayed the same’ over the last 12 months. The percentages of residents saying their impressions have improved (11%) or worsened (15%) are virtually unchanged from 2013.
• A higher proportion of Surrey/Delta/Langley residents say their impressions have worsened (20%) compared to City of Vancouver residents (11%).
13
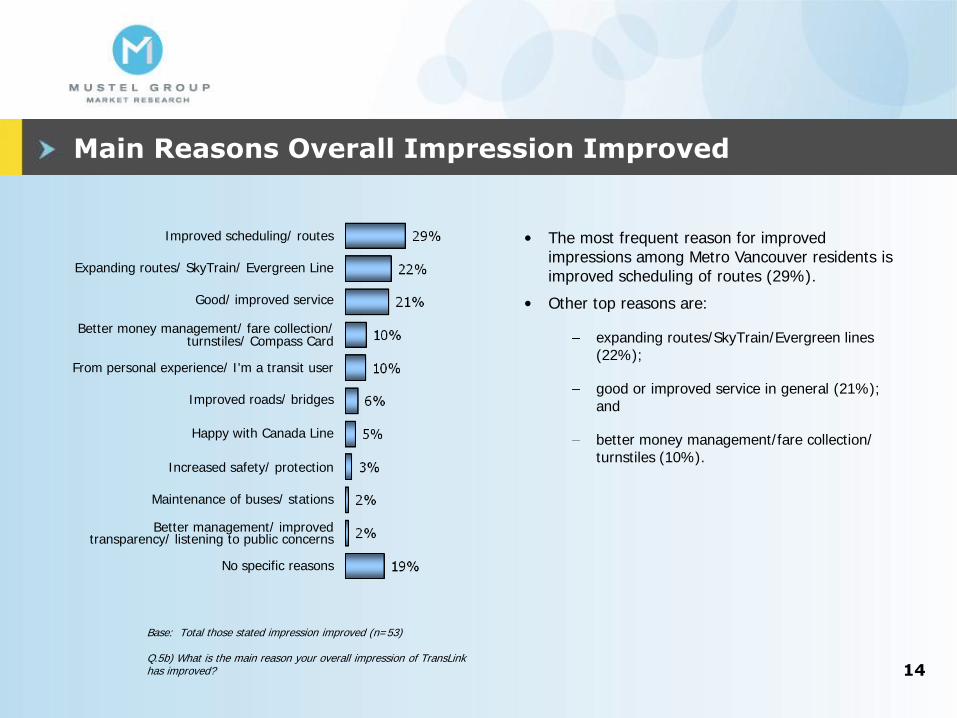
Main Reasons Overall Impression Improved
Base: Total those stated impression improved (n=53) Q.5b) What is the main reason your overall impression of TransLink has improved?
Improved scheduling/ routes
Expanding routes/ SkyTrain/ Evergreen Line
Good/ improved service
Better money management/ fare collection/ turnstiles/ Compass Card
From personal experience/ I'm a transit user
Improved roads/ bridges
Happy with Canada Line
Increased safety/ protection
Maintenance of buses/ stations
Better management/ improved transparency/ listening to public concerns
No specific reasons
• The most frequent reason for improved impressions among Metro Vancouver residents is improved scheduling of routes (29%).
• Other top reasons are:
expanding routes/SkyTrain/Evergreen lines (22%);
good or improved service in general (21%); and
better money management/fare collection/ turnstiles (10%).
14
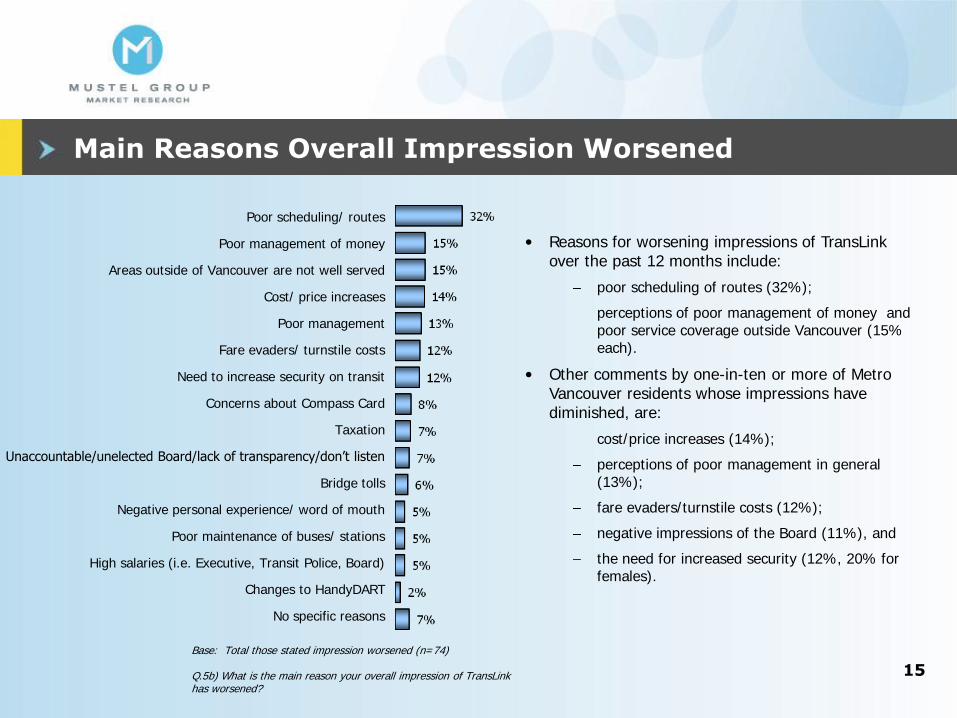
Main Reasons Overall Impression Worsened
• Reasons for worsening impressions of TransLink over the past 12 months include:
poor scheduling of routes (32%);
perceptions of poor management of money and poor service coverage outside Vancouver (15% each).
• Other comments by one-in-ten or more of Metro Vancouver residents whose impressions have diminished, are:
cost/price increases (14%);
perceptions of poor management in general (13%);
fare evaders/turnstile costs (12%);
negative impressions of the Board (11%), and
the need for increased security (12%, 20% for females).
Base: Total those stated impression worsened (n=74) Q.5b) What is the main reason your overall impression of TransLink has worsened?
Poor scheduling/ routes
Poor management of money
Areas outside of Vancouver are not well served
Cost/ price increases
Poor management
Fare evaders/ turnstile costs
Need to increase security on transit
Concerns about Compass Card
Taxation
Unaccountable/unelected Board/lack of transparency/don’t listen
Bridge tolls
Negative personal experience/ word of mouth
Poor maintenance of buses/ stations
High salaries (i.e. Executive, Transit Police, Board)
Changes to HandyDART
No specific reasons
15
Total ‘good job’
56%
69%
64%
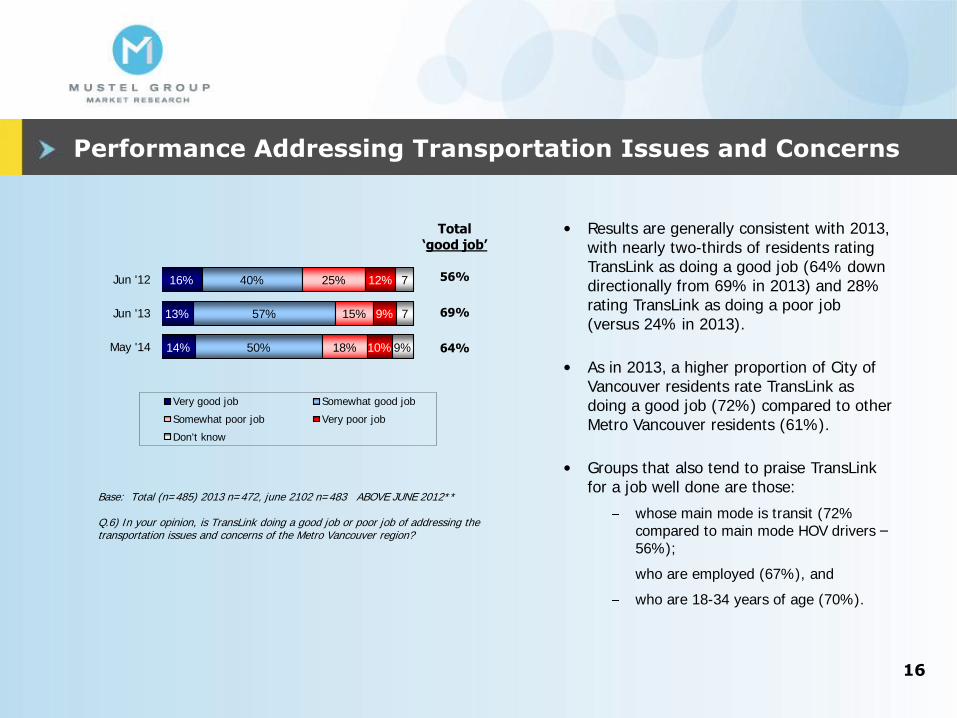
Performance Addressing Transportation Issues and Concerns
Base: Total (n=485) 2013 n=472, june 2102 n=483 ABOVE JUNE 2012** Q.6) In your opinion, is TransLink doing a good job or poor job of addressing the transportation issues and concerns of the Metro Vancouver region?
• Results are generally consistent with 2013, with nearly two-thirds of residents rating TransLink as doing a good job (64% down directionally from 69% in 2013) and 28% rating TransLink as doing a poor job (versus 24% in 2013).
• As in 2013, a higher proportion of City of Vancouver residents rate TransLink as doing a good job (72%) compared to other Metro Vancouver residents (61%).
• Groups that also tend to praise TransLink for a job well done are those:
whose main mode is transit (72% compared to main mode HOV drivers – 56%);
who are employed (67%), and
who are 18-34 years of age (70%).
16
16%
13%
14%
40%
57%
50%
25%
15%
18%
12%
9%
10%
7
7
9%
Jun '12
Jun '13
May '14
Very good job Somewhat good job
Somewhat poor job Very poor job
Don't know
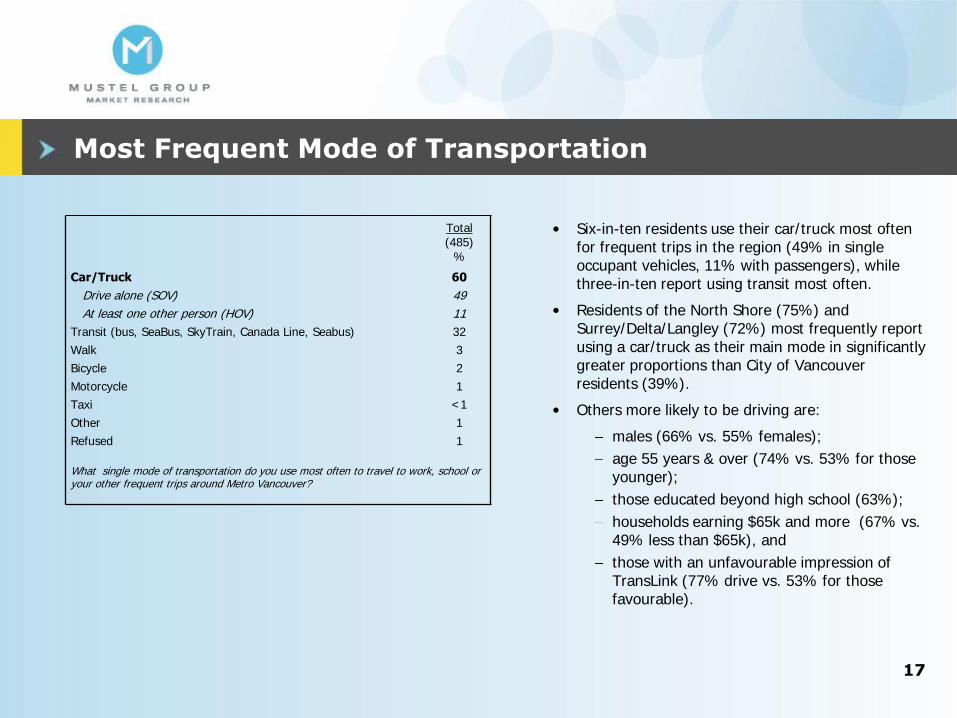
Most Frequent Mode of Transportation
Total (485)
%
Car/Truck 60
Drive alone (SOV) 49
At least one other person (HOV) 11
Transit (bus, SeaBus, SkyTrain, Canada Line, Seabus) 32
Walk 3
Bicycle 2
Motorcycle 1
Taxi <1
Other 1
Refused 1
What single mode of transportation do you use most often to travel to work, school or your other frequent trips around Metro Vancouver?
• Six-in-ten residents use their car/truck most often for frequent trips in the region (49% in single occupant vehicles, 11% with passengers), while three-in-ten report using transit most often.
• Residents of the North Shore (75%) and Surrey/Delta/Langley (72%) most frequently report using a car/truck as their main mode in significantly greater proportions than City of Vancouver residents (39%).
• Others more likely to be driving are:
males (66% vs. 55% females);
age 55 years & over (74% vs. 53% for those younger);
those educated beyond high school (63%);
households earning $65k and more (67% vs. 49% less than $65k), and
those with an unfavourable impression of TransLink (77% drive vs. 53% for those favourable).
17
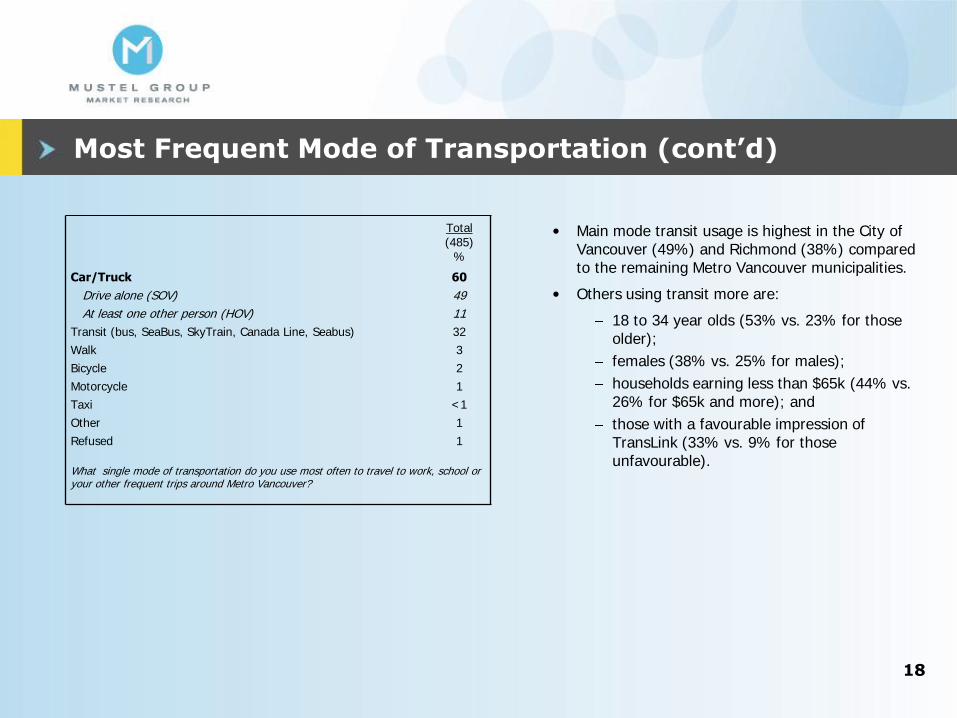
Most Frequent Mode of Transportation (cont’d)
Total (485)
%
Car/Truck 60
Drive alone (SOV) 49
At least one other person (HOV) 11
Transit (bus, SeaBus, SkyTrain, Canada Line, Seabus) 32
Walk 3
Bicycle 2
Motorcycle 1
Taxi <1
Other 1
Refused 1
What single mode of transportation do you use most often to travel to work, school or your other frequent trips around Metro Vancouver?
• Main mode transit usage is highest in the City of Vancouver (49%) and Richmond (38%) compared to the remaining Metro Vancouver municipalities.
• Others using transit more are:
18 to 34 year olds (53% vs. 23% for those older);
females (38% vs. 25% for males);
households earning less than $65k (44% vs. 26% for $65k and more); and
those with a favourable impression of TransLink (33% vs. 9% for those unfavourable).
18
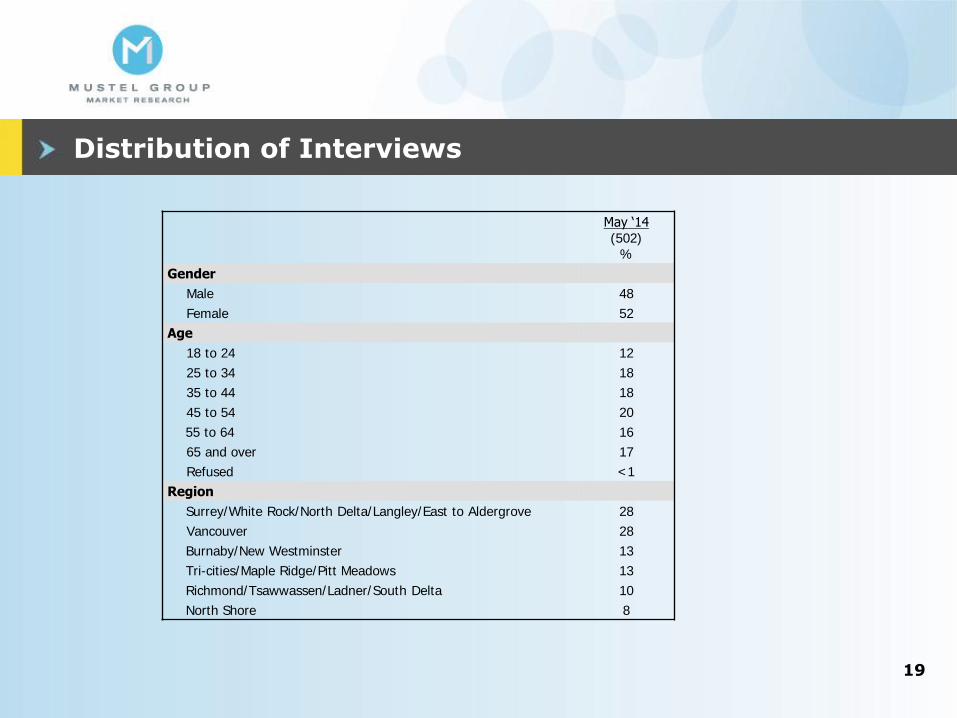
Distribution of Interviews
May ‘14 (502)
%
Gender
Male 48
Female 52
Age
18 to 24 12
25 to 34 18
35 to 44 18
45 to 54 20
55 to 64 16
65 and over 17
Refused <1
Region
Surrey/White Rock/North Delta/Langley/East to Aldergrove 28
Vancouver 28
Burnaby/New Westminster 13
Tri-cities/Maple Ridge/Pitt Meadows 13
Richmond/Tsawwassen/Ladner/South Delta 10
North Shore 8
19
Questionnaire
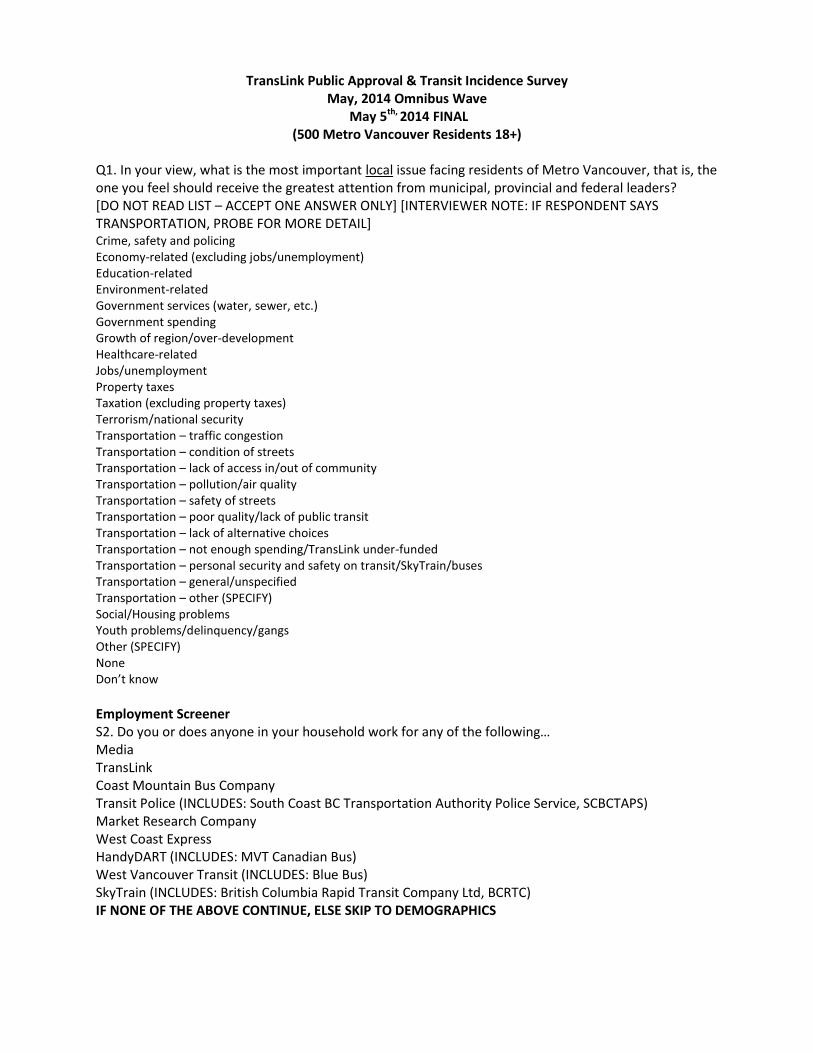
TransLink Public Approval & Transit Incidence Survey May, 2014 Omnibus Wave
May 5th, 2014 FINAL (500 Metro Vancouver Residents 18+)
Q1. In your view, what is the most important local issue facing residents of Metro Vancouver, that is, the one you feel should receive the greatest attention from municipal, provincial and federal leaders? [DO NOT READ LIST – ACCEPT ONE ANSWER ONLY] [INTERVIEWER NOTE: IF RESPONDENT SAYS TRANSPORTATION, PROBE FOR MORE DETAIL] Crime, safety and policing Economy-related (excluding jobs/unemployment) Education-related Environment-related Government services (water, sewer, etc.) Government spending Growth of region/over-development Healthcare-related Jobs/unemployment Property taxes Taxation (excluding property taxes) Terrorism/national security Transportation – traffic congestion Transportation – condition of streets Transportation – lack of access in/out of community Transportation – pollution/air quality Transportation – safety of streets Transportation – poor quality/lack of public transit Transportation – lack of alternative choices Transportation – not enough spending/TransLink under-funded Transportation – personal security and safety on transit/SkyTrain/buses Transportation – general/unspecified Transportation – other (SPECIFY) Social/Housing problems Youth problems/delinquency/gangs Other (SPECIFY) None Don’t know
Employment Screener S2. Do you or does anyone in your household work for any of the following… Media TransLink Coast Mountain Bus Company Transit Police (INCLUDES: South Coast BC Transportation Authority Police Service, SCBCTAPS) Market Research Company West Coast Express HandyDART (INCLUDES: MVT Canadian Bus) West Vancouver Transit (INCLUDES: Blue Bus) SkyTrain (INCLUDES: British Columbia Rapid Transit Company Ltd, BCRTC) IF NONE OF THE ABOVE CONTINUE, ELSE SKIP TO DEMOGRAPHICS
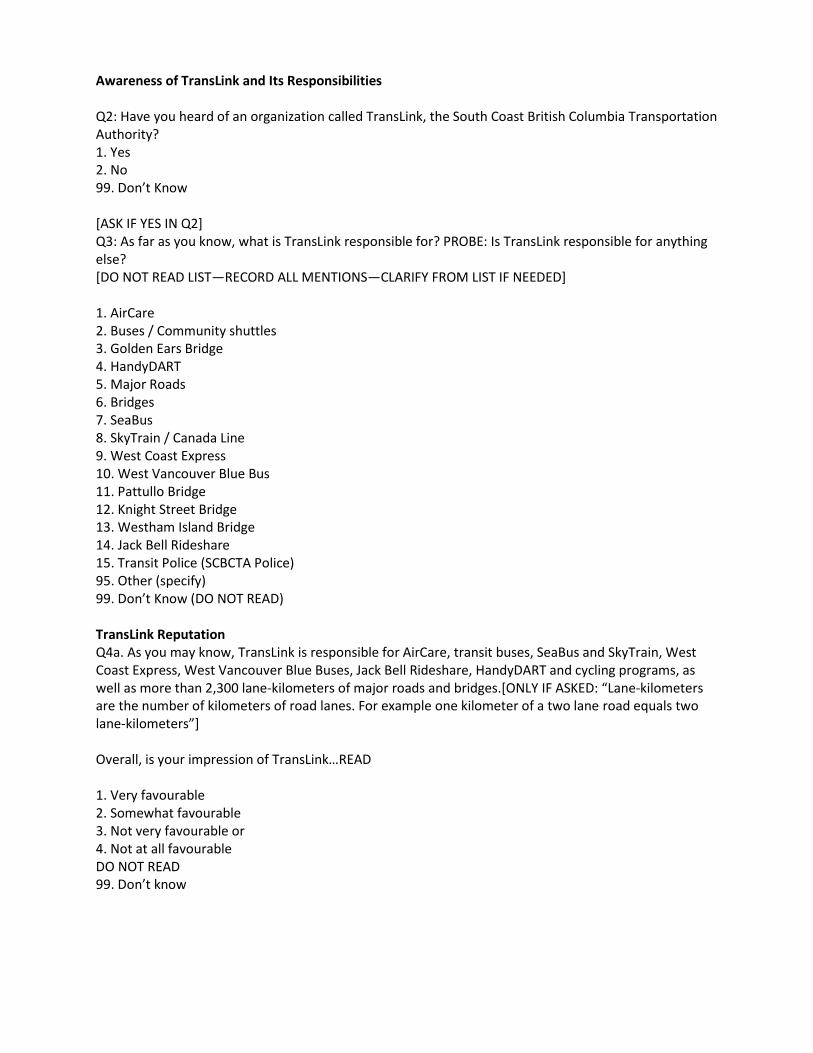
Awareness of TransLink and Its Responsibilities Q2: Have you heard of an organization called TransLink, the South Coast British Columbia Transportation Authority? 1. Yes 2. No 99. Don’t Know [ASK IF YES IN Q2] Q3: As far as you know, what is TransLink responsible for? PROBE: Is TransLink responsible for anything else? [DO NOT READ LIST—RECORD ALL MENTIONS—CLARIFY FROM LIST IF NEEDED] 1. AirCare 2. Buses / Community shuttles 3. Golden Ears Bridge 4. HandyDART 5. Major Roads 6. Bridges 7. SeaBus 8. SkyTrain / Canada Line 9. West Coast Express 10. West Vancouver Blue Bus 11. Pattullo Bridge 12. Knight Street Bridge 13. Westham Island Bridge 14. Jack Bell Rideshare 15. Transit Police (SCBCTA Police) 95. Other (specify) 99. Don’t Know (DO NOT READ) TransLink Reputation Q4a. As you may know, TransLink is responsible for AirCare, transit buses, SeaBus and SkyTrain, West Coast Express, West Vancouver Blue Buses, Jack Bell Rideshare, HandyDART and cycling programs, as well as more than 2,300 lane‐kilometers of major roads and bridges.[ONLY IF ASKED: “Lane‐kilometers are the number of kilometers of road lanes. For example one kilometer of a two lane road equals two lane‐kilometers”] Overall, is your impression of TransLink…READ 1. Very favourable 2. Somewhat favourable 3. Not very favourable or 4. Not at all favourable DO NOT READ 99. Don’t know
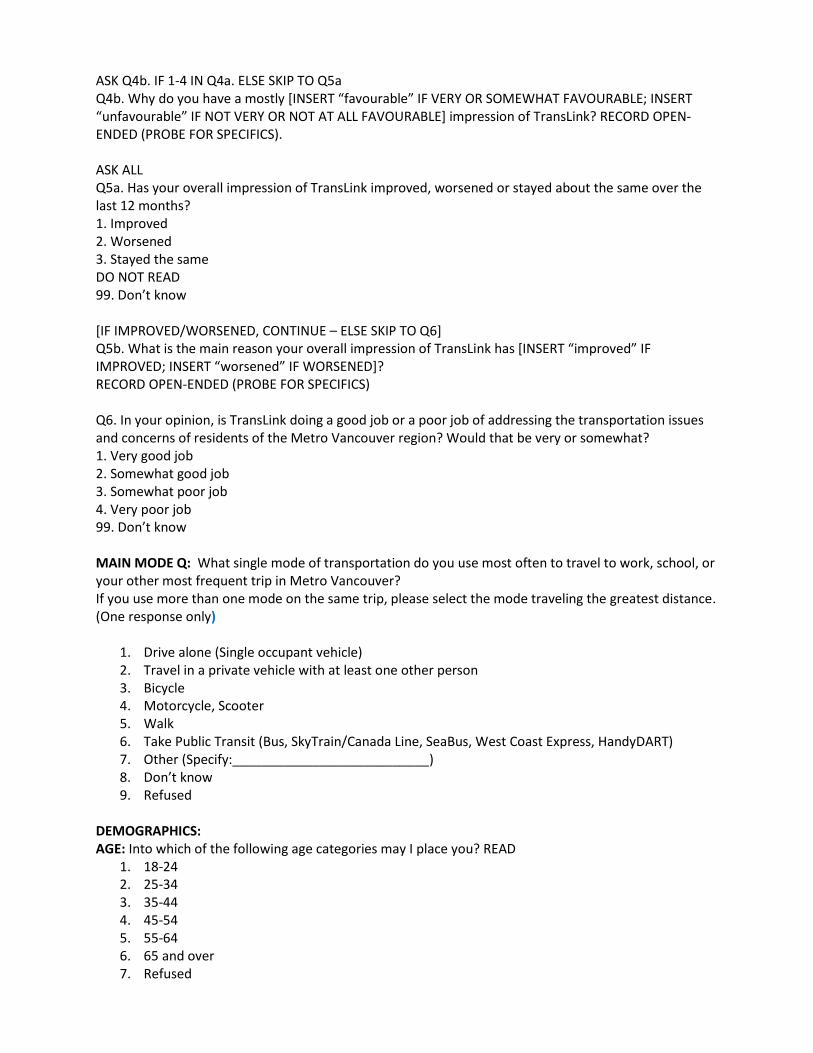
ASK Q4b. IF 1‐4 IN Q4a. ELSE SKIP TO Q5a Q4b. Why do you have a mostly [INSERT “favourable” IF VERY OR SOMEWHAT FAVOURABLE; INSERT “unfavourable” IF NOT VERY OR NOT AT ALL FAVOURABLE] impression of TransLink? RECORD OPEN‐ ENDED (PROBE FOR SPECIFICS). ASK ALL Q5a. Has your overall impression of TransLink improved, worsened or stayed about the same over the last 12 months? 1. Improved 2. Worsened 3. Stayed the same DO NOT READ 99. Don’t know [IF IMPROVED/WORSENED, CONTINUE – ELSE SKIP TO Q6] Q5b. What is the main reason your overall impression of TransLink has [INSERT “improved” IF IMPROVED; INSERT “worsened” IF WORSENED]? RECORD OPEN‐ENDED (PROBE FOR SPECIFICS) Q6. In your opinion, is TransLink doing a good job or a poor job of addressing the transportation issues and concerns of residents of the Metro Vancouver region? Would that be very or somewhat? 1. Very good job 2. Somewhat good job 3. Somewhat poor job 4. Very poor job 99. Don’t know MAIN MODE Q: What single mode of transportation do you use most often to travel to work, school, or your other most frequent trip in Metro Vancouver? If you use more than one mode on the same trip, please select the mode traveling the greatest distance. (One response only)
1. Drive alone (Single occupant vehicle) 2. Travel in a private vehicle with at least one other person 3. Bicycle 4. Motorcycle, Scooter 5. Walk 6. Take Public Transit (Bus, SkyTrain/Canada Line, SeaBus, West Coast Express, HandyDART) 7. Other (Specify:___________________________) 8. Don’t know 9. Refused
DEMOGRAPHICS: AGE: Into which of the following age categories may I place you? READ
1. 18-24 2. 25-34 3. 35-44 4. 45-54 5. 55-64 6. 65 and over 7. Refused
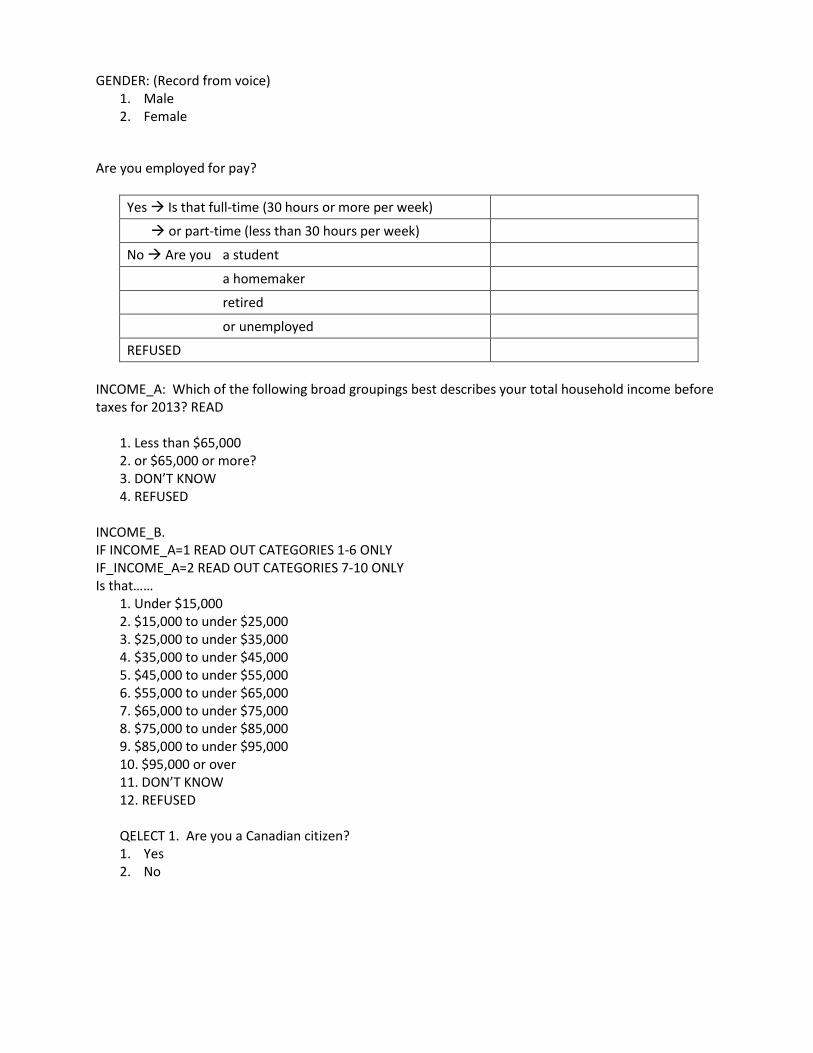
GENDER: (Record from voice) 1. Male 2. Female
Are you employed for pay?
Yes Is that full-time (30 hours or more per week)
or part-time (less than 30 hours per week)
No Are you a student
a homemaker
retired
or unemployed
REFUSED
INCOME_A: Which of the following broad groupings best describes your total household income before taxes for 2013? READ
1. Less than $65,000 2. or $65,000 or more? 3. DON’T KNOW 4. REFUSED
INCOME_B. IF INCOME_A=1 READ OUT CATEGORIES 1-6 ONLY IF_INCOME_A=2 READ OUT CATEGORIES 7-10 ONLY Is that……
1. Under $15,000 2. $15,000 to under $25,000 3. $25,000 to under $35,000 4. $35,000 to under $45,000 5. $45,000 to under $55,000 6. $55,000 to under $65,000 7. $65,000 to under $75,000 8. $75,000 to under $85,000 9. $85,000 to under $95,000 10. $95,000 or over 11. DON’T KNOW 12. REFUSED QELECT 1. Are you a Canadian citizen? 1. Yes 2. No