Embed Size (px)
Citation preview

745
Transmission Analysis of Optical Code Division Multiple Access (OCDMA)
Communication Systems in the Presence of Noise in Local Area Network
Applications
Ahmed Nabih Zaki Rashed1; Mohamed M. Zahra
2; Mohamed Yassin
3;
Ismail A. Abd El-Aziz4; Shreen A.El-Bheiry
5
1 Electronics and Electrical Communications Engineering Department
Faculty of Electronic Engineering, Menouf 32951, Menoufia University, EGYPT
2 Faculty of Engineering, El-ALzhar University, EGYPT
3, 4
Faculty of Engineering & Technology, Banha University, EGYPT
5 Faculty of Specific Education Mass Communication Department, Menoufia University, EGYPT
Abstrak – OCDMA is an essential part of the digital communication system now
days for long haul, high speed networks. The biggest challenge with Optical
CDMA system is to maintain the performance of the system and offer high
bandwidth in case of higher number of users at minimum cost. As the number of
users increase, the input requirements i.e. transmitted power, bit rate etc start
increasing sharply which contribute to the additional cost. It has recently attracted
significant research interest because of the advantages it offers in terms of the
flexibility in the management of the system resources. We have taken into account
the system design parameters are determined such as BER (bit error rate), signal
to noise ratio (SNR), transmission bit rates, and optical received power for
different code lengths. The Optical CDMA systems suffer from the problem of
multiple access interference (MAI).As the number of users increase the BER error
rate degrades because the effect of MAI (multiple access interference) increases.
So, there is a limitation in number of users, as the number of users increase SNR
decrease and probability of error increases.
Key Words – Shot noise; Thermal noise; BER; SNR; Received signal power; Code
length parameter
1 Introduction
The development of fiber optics communication in the last few years has made the optical fiber a
strong candidate for the future of telecommunication system. The optical fiber offers a vast amount of
bandwidth that can be utilized for communication. One of utilizing this is signal multiplexing. Due to
the large bandwidth and the associated high bit rates, the multiplexing process is beyond the
capabilities of pure electronic methods and has to be implemented optically as well. Code division
multiple access (CDMA) is a strong candidate for creating effective multiple methods for the optical
subscriber access network because of its asynchronous access and code multiplexing [1]. CDMA is a
strong candidate for creating effective multiple methods for the optical subscriber access network
because of its asynchronous access and code multiplexing. OCDMA system has attracted increasing

International Journal of Basic and Applied Science,
Vol 01, No. 04, April 2013, pp. 745-762
Rashed, et. al.
746 Insan Akademika Publications
attention in recent years due to the following advantages: asynchronous access capability, accurate
time of arrival measurements, flexibility of user allocation, ability to support variable bit rate, busty
traffic and security against unauthorized users. Moreover, the OCDMA method is preferable for
multiplexing in the optical domain because it uses broad bandwidths in optical devices for the
electrical CDMA method and the Electrical-to-Optical (E/O) conversion [2].
Optical networks provide higher capacity and reduced costs for new applications such as the internet,
video, multimedia, and advanced digital services. Fortunately, an alternative to optical time division
multiple access (OTDMA) and dense wavelength division multiple access (DWDMA) networking
schemes, optical CDMA communication systems, require neither the time nor the frequency
management systems. Optical CDMA can operate asynchronously, without centralized control, and it
does not suffer from packet collisions. As a result, optical CDMA systems have lower latencies than
OTDMA or DWDMA. Furthermore, since time and frequency (or wavelength) slots do not need to be
allocated to each individual user, significant performance gains can be achieved through multiplexing.
Also, OTDMA and DWDMA systems are limited by hardware because of the slot allocation
requirements. In contrast, CDMA systems are only limited by the tolerated bit error rate relationship to
the number of users, affording the designer a much more flexible network design [1, 2].
Code Division Multiple Access (CDMA) technique was originally investigated in radio frequency
communication systems [3]. This multiplexing technique consists to allow to each subscriber a
specific code word. This code word permits to the transmitter to modulate its data sequences. In order
to satisfy faster and more reliable optical communication system requirements and optimize the huge
optical bandwidth sharing, Optical CDMA presents an attractive solution. The advantages of this
technique are principally the asynchronous users emission and the possibility to emit at any time and
on any wavelength without generating more interference. In Optical CDMA technique, each bit is
divided up into L time periods, called chips. By sending a short optical pulse during some chips
intervals [4], and leaving the others to “0”, an optical signature sequence can be created. For this
particular case, specific optical codes have to be conceived because of the scrambling phase of the
optical channel, which not permit to use bipolar optical signals. An optical code is defined by its length
L (number of chips), its weight w (number of "1" chips), and its multiplexing capacity N (number of
users). In addition, for a useful optical code, the intercorrelation and asynchronous autocorrelation
levels have to be limited. Two important families of optical codes were previously developed: Optical
Orthogonal Codes (OOC) [2] and Prime Sequences (PS) [5].
In the present study, OCDMA scheme has been an increasing interest for fiber optic systems because it
allows multiple users to access the system asynchronously and simultaneously. OCDMA is expected
for further ultrahigh speed and real time computer communications where there is strong demand for
the systems to support several kinds of data with different traffic requirements. We have analyzed the
performance in terms of SNR and BER. We have taken into account several kinds of data (such as
code length parameter, number of active users) with different bit rates.
2 General Block diagram of Tx/Rx OCDMA Communication System
Code division multiple access (CDMA) scheme has been an increasing interest for fiber optic network
because it allows multiple users to access the network asynchronously and simultaneously. Optical
code-division multiple-access (CDMA) is expected for further ultra-high speed and real-time computer
communications where there is strong demand for the systems to support several kinds of data with
different traffic requirements. As shown in Fig. 1 that data are coming into the data conversation unit
which converted the data in electrical form. This converted data is driving the laser driver. This laser
light is passing through the optical fiber. Temperature controller controls the temperature of optical
fiber [6].

Rashed, et. al. International Journal of Basic and Applied Science,
Vol 01, No. 04, April 2013, pp. 745-762
www.insikapub.com 747
Fig. 1. Transmitter optical code division multiple access (OCDMA) communication system.
Figure 2 Shows that signals are received in photo detector block, preamplifier amplify signal because
it may be weaken during transmission time. Then it goes through filter it elements some noise. Finally
we get the output from decision circuit [7].
Fig. 2. Receiver optical code division multiple access (OCDMA) communication system.
Recently scientists propose multi code direct detection optical CDMA system is support several kinds
of data in different bit rates coping with a multimedia network. In this system each user is assign a set
of sequence code generated from time shifted version of optical orthogonal codes (OOC) to support
several kinds of such data. In this way we can achieve our expected bit rate [8].
3 Theoretical Model and Analysis
The system SNR can be further expressed as a function of number of active users as follows [9]:

International Journal of Basic and Applied Science,
Vol 01, No. 04, April 2013, pp. 745-762
Rashed, et. al.
748 Insan Akademika Publications
22
122
22
2 2
16
22
12
1
PsIRPPP
MM
SNR
dl
n
…(1)
Where M is the number of active users, P is the code length, Id is the dark current, s1=RdPreceived is the
signal current, where Rd is the detector resistance, Preceived is the received optical power and σn is the
total noise and can expressed as follows [10]:
222shthn …(2)
Where σth is the thermal noise and can be estimated as the following formula:
BR
TK
L
Bth
42
…(3)
Where KB is the boltzmann's constant (1.38x10⁻²³
J/K), T is the ambient temperature, RL is the load
resistance and B is the transmission bit rate with non-return to zero code (NRZ), which is given by the
following formula [10]:
PTB
7.0
…(4)
Where TP is the signal propagation delay through waveguide fiber which can be given by [11]:
c
LnTP
…(5)
Where L is the fiber length in km, c is the speed of light (3x10⁸ m/sec), and n is the refractive index of
the material based fiber link cable which can be expressed as the following formula:
26
2
25
24
2
23
22
2
211
A
A
A
A
A
An
…(6)
The empirical equation coefficients as a function of ambient temperature and room temperature for
pure silica fiber as: A1S=0.691663, A2S=0.03684043 (T/T0)2, A3S=0.4079426, A4S=0.0116241 (T/T0)
2,
A5S=0.8974749, A6S= 84.76543 (T/T0)2. Where T is ambient temperature in K, and T0 is the room
temperature and is considered as 300 K. For the plastic fiber material, the coefficients of the Sellmeier
equation are given as: A1P= 0.4963, A2P= 0.6965 (T/T0)2, A3P= 0.3223, A4P= 0.718 (T/T0)
2, A5P=
0.1174, and A6P= 9.237. Moreover, the Shot, σth, can be estimated as the following formula [11]:
psh IBe22 …(7)
Where e is the electron charge (1.6x10⁻¹⁹
C), and IP is the photocurrent. Optical orthogonal code
(OOC) is a family of 0, l sequences with good auto and cross correlation properties that are suitable for
CDMA in positive systems [5]. An (P, W, λa, λc) OOC code is sequences of length P, weight W with
autocorrelation constraint of λa [14], and cross-correlation constraint of λc. Here the code length has

Rashed, et. al. International Journal of Basic and Applied Science,
Vol 01, No. 04, April 2013, pp. 745-762
www.insikapub.com 749
taken to be 10 ≤ Code length, P ≤ 100, 2 ≤ Code weight, W ≤ 8 [15]. Therefore the maximum number
of user supported by OCDMA scheme is given by [12, 13]:
)1(
)1(
WW
PM
…(8)
Bit error rate (BER) performance is simulated with respect to signal to noise ratio (SNR), number of
users M, OOC length P, and threshold level Th. Each user transmits data at rate of B Gbit/sec with On-
Off Keying (OOK) modulated transmission average power of 0.5 W. Where the received power can be
estimated as [16]:
LTreceived
nePP …(9)
Where L is the transmission distance, PT is the transmitter power and is given by:
OOKT PP
WP
…(10)
Where POOK=0.5 Watt is the average power of OOK modulated signal and is given by [17]:
P
WTTSSystemThreshold h5.0
…(11)
Where Th is the threshold value, W is the code weight, and P is the code length. The bit error rate of
OCDMA communication system can be estimated as the following [18, 19]:
,8
exp..
2
SNR
SNRBER
…(12)
Because of the high quality of submarine cable circuits and the ease and convenience of international
Direct Dialing (IDD), which is becoming commonplace, the continued rapid growth in. demand will
likely continue. The cost of underwater cable system, relative to satellite links, depends on traffic and
density. Cables have an advantage over short; paths, especially if traffic is heavy. As distance increases
and/or density, decreases, satellites become economically more attractive. Therefore the estimated total
fiber cost (max. and min.) of submarine fiber cable OCDMA system can be expressed as a function of
number of active users (M), and transmission length (L), can be estimated as the following formula
[20]:
LM
CT
375max
M$ …(13)
LM
CT
282min
M$ …(14)

International Journal of Basic and Applied Science,
Vol 01, No. 04, April 2013, pp. 745-762
Rashed, et. al.
750 Insan Akademika Publications
4 Simulation Results and Performance Analysis
We have investigated the transmission analysis of OCDMA communication systems in the presence
and absence of noise under the set of the wide range of the operating parameters as shown in Table 1 is
listed below.
Table 1. Proposed operating parameters in OCDMA communication system [3, 5, 8, 13].
Operating parameters Value
Operating optical signal wavelength, λ 1.3 μm-1.55 μm
Threshold value, Th 15
Code length, P 10100
Code weight, W 210
Transmission distance, L 1 km10 km
Load resistance, RL 50 kΩ
Photo current, IP 10 μ A-100 μA
Ambient temperature, T 300 K350 K
Dark current, Id 10 nA
Detector resistance, Rd 50 kΩ
Based on the model equations analysis, assumed set of the operating parameters as listed in the Table 1
above, and based on the series of the figs. (3-23), the following facts are assured:
i) Figs. (3, 4) have assured that number of users increases with increasing code length and
decreasing code weight under the set of the operating parameters considerations.
ii) Fig. 5 has indicated that transmitted signal power increases with increasing code weight and
decreasing code length under the set of the operating parameters considerations.
Fig. 3. Variations of number of users against variations of both code length and weight at the
assumed set of the operating parameters
10 20 30 40 50 60 70 80 90 1000
5
10
15
20
25
30
35
40
45
50
code length - P
Nu
mb
er
of
user
- M
Number of user vs Code length with different weight length
W=2
W=5
W=8

Rashed, et. al. International Journal of Basic and Applied Science,
Vol 01, No. 04, April 2013, pp. 745-762
www.insikapub.com 751
Fig. 4. Variations of number of users against variations of both code weight and code length at the
assumed set of the operating parameters
Fig. 5. Variations of transmitted signal power against variations of both code length and code weight
at the assumed set of the operating parameters
2 3 4 5 6 7 8 9 100
5
10
15
20
25
30
35
40
45
50
Code Weight -W
Nu
mb
er
of
users
-M
Number of Users vs Code Weight with different code length
P=10
P=30
P=50
P=70
P=100
10 20 30 40 50 60 70 80 90 1000
0.05
0.1
0.15
0.2
0.25
0.3
0.35
0.4
Code Length - P
Tra
nsm
itte
d P
ow
er
(w
att
)
Transmitted Power vs Code Length
W=2
W=5
W=8

International Journal of Basic and Applied Science,
Vol 01, No. 04, April 2013, pp. 745-762
Rashed, et. al.
752 Insan Akademika Publications
Fig. 6. Variations of thermal noise against variations of both ambient temperature and operating
optical signal wavelength at the assumed set of the operating parameters.
Fig. 7. Maximum system cost in relation to both code length and code weight with transmission
distance (1 km) at the assumed set of the operating parameters.
300 305 310 315 320 325 330 335 340 345 35013.05
13.1
13.15
13.2
13.25
13.3
13.35
13.4
Temreture (k)
-LOG10( Thermal Noise) vs Tempreture
-LO
G10 (
Th
erm
al N
ois
e)
wavelength=1.3µm
wavelength=1.45µm
wavelength=1.55µm
10 20 30 40 50 60 70 80 90 1000
500
1000
1500
2000
2500
Code Length - P
MA
X. C
ost
(millio
n $
)
MAX.Cost vs Code Length for distance ( 1km)
W=2
W=5
W=8

Rashed, et. al. International Journal of Basic and Applied Science,
Vol 01, No. 04, April 2013, pp. 745-762
www.insikapub.com 753
Fig. 8. Minimum system cost in relation to both code length and code weight with transmission
distance (1 km) at the assumed set of the operating parameters.
Fig. 9. Maximum system cost in relation to both code length and code weight with transmission
distance (5 km) at the assumed set of the operating parameters.
10 20 30 40 50 60 70 80 90 1000
200
400
600
800
1000
1200
1400
1600
1800
Code Length - P
MIN
.Co
st
(Millio
n $
)
MIN.Cost vs Code Length with distance ( 1km)
W=2
W=5
W=8
10 20 30 40 50 60 70 80 90 1000
50
100
150
200
250
300
350
400
450
500
Code Length - P
MA
X. C
ost
(millio
n $
)
MAX.Cost vs Code Length for distance ( 5km)
W=2
W=5
W=8
International Journal of Basic and Applied Science,
Vol 01, No. 04, April 2013, pp. 745-762
Rashed, et. al.
754 Insan Akademika Publications
Fig. 10. Minimum system cost in relation to both code length and code weight with transmission
distance (5 km) at the assumed set of the operating parameters.
Fig. 11. Maximum system cost in relation to both code length and code weight with transmission
distance (10 km) at the assumed set of the operating parameters.
10 20 30 40 50 60 70 80 90 1000
50
100
150
200
250
300
350
400
Code Length - P
MIN
.Co
st
(Millio
n $
)
MIN.Cost vs P at distance equl 5km
W=2
W=5
W=8
10 20 30 40 50 60 70 80 90 1000
50
100
150
200
250
Code Length - P
MA
X. C
ost
(millio
n $
)
MAX.Cost vs Code Length for distance equal 10 km
W=2
W=5
W=8

Rashed, et. al. International Journal of Basic and Applied Science,
Vol 01, No. 04, April 2013, pp. 745-762
www.insikapub.com 755
Fig. 12. Minimum system cost in relation to both code length and code weight with transmission
distance (10 km) at the assumed set of the operating parameters.
Fig. 13. Variations of shot noise versus variations of operating optical signal wavelength and photo
current at the assumed set of the operating parameters.
10 20 30 40 50 60 70 80 90 1000
20
40
60
80
100
120
140
160
180
200
Code Length - p
MIN
.Co
st
(Millio
n $
)
MIN.Cost vs P at distance equl 10km
W=2
W=5
W=8
1.3 1.35 1.4 1.45 1.5 1.558.2
8.4
8.6
8.8
9
9.2
9.4
9.6
9.8
Wavelength ( µm)
-L
OG
10 (
sh
ot
no
ise)
- LOG10 (shot noise) vs wavelength
Ip=1µA
Ip=5µA
Ip=10µA

International Journal of Basic and Applied Science,
Vol 01, No. 04, April 2013, pp. 745-762
Rashed, et. al.
756 Insan Akademika Publications
Fig. 14. Received signal power in relation to both code length and code weight for pure silica fiber
with transmission distance (1 km) at the assumed set of the operating parameters.
Fig. 15. Received signal power in relation to both code length and code weight for pure silica fiber
with transmission distance (5 km) at the assumed set of the operating parameters.
10 20 30 40 50 60 70 80 90 1000
0.005
0.01
0.015
0.02
0.025
Code Length - P
Receiv
ed P
ow
er
(watt)
Received Power vs Code length for pure silica optical fiber -distance (1km )
W=2
W=5
W=8
10 20 30 40 50 60 70 80 90 100-56
-54
-52
-50
-48
-46
-44
-42
-40
-38
Code Length - P
Receiv
ed
Po
wer
(dB
m)
Received Power vs Code length for pure silica optical fiber -distance (5km )
W=2
W=5
W=8

Rashed, et. al. International Journal of Basic and Applied Science,
Vol 01, No. 04, April 2013, pp. 745-762
www.insikapub.com 757
Fig. 16. Received signal power in relation to both code length and code weight for pure silica fiber
with transmission distance (10 km) at the assumed set of the operating parameters
Fig. 17. Received signal power in relation to both code length and code weight for plastic optical
fiber with transmission distance (1 km) at the assumed set of the operating parameters
10 20 30 40 50 60 70 80 90 100-124
-122
-120
-118
-116
-114
-112
-110
-108
-106
Code Length - P
Receiv
ed
Po
wer
(dB
m)
Received Power vs Code length for pure silica optical fiber -distance (10km )
W=2
W=5
W=8
10 20 30 40 50 60 70 80 90 1000
0.005
0.01
0.015
0.02
0.025
Code Length - P
Re
ce
ive
d P
ow
er
(dB
m)
Received Power vs Code Length for plastic optical fiber - distance(1km)
W=2
W=5
W=8
International Journal of Basic and Applied Science,
Vol 01, No. 04, April 2013, pp. 745-762
Rashed, et. al.
758 Insan Akademika Publications
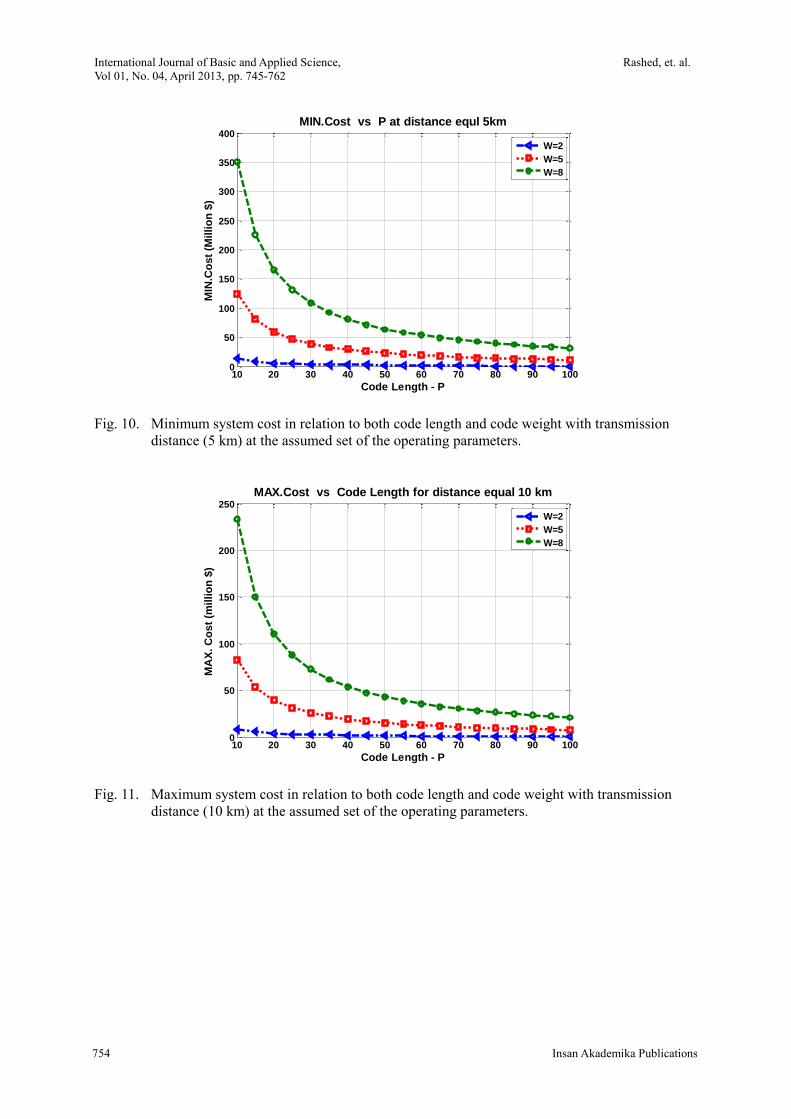
Fig. 18. Received signal power in relation to both code length and code weight for plastic optical
fiber with transmission distance (5 km) at the assumed set of the operating parameters
Fig. 19. Received signal power in relation to both code length and code weight for plastic optical
fiber with transmission distance (10 km) at the assumed set of the operating parameters
10 20 30 40 50 60 70 80 90 100-56
-54
-52
-50
-48
-46
-44
-42
-40
-38
Code Length - P
Receiv
ed
Po
wer
(dB
m)
Received Power vs Code Length for plastic optical fiber - distance ( 5km)
W=2
W=5
W=8
10 20 30 40 50 60 70 80 90 100-124
-122
-120
-118
-116
-114
-112
-110
-108
-106
Code Length - P
Receiv
ed
P
ow
er
(dB
m)
Received Power vs Code Length for plastic optical fiber - distance(10km)
W=2
W=5
W=8
Rashed, et. al. International Journal of Basic and Applied Science,
Vol 01, No. 04, April 2013, pp. 745-762
www.insikapub.com 759
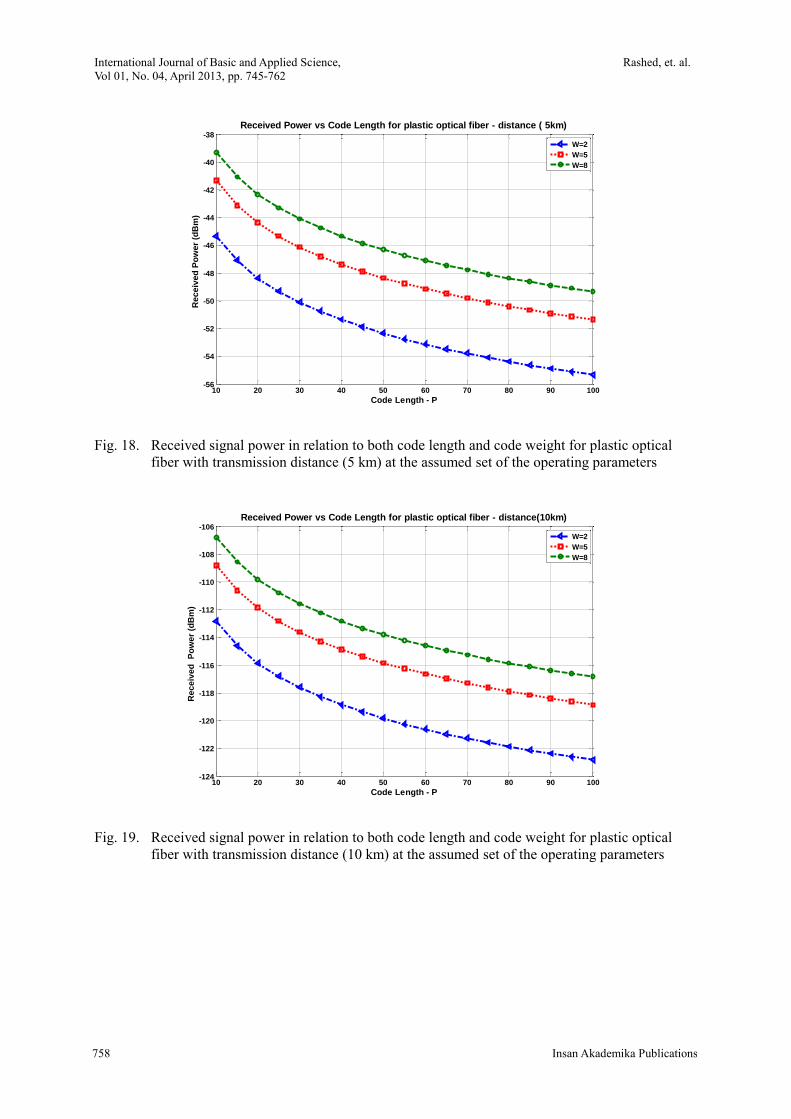
Fig. 20. Signal to noise ratio in relation to both code length and code weight for pure silica fiber at
the assumed set of the operating parameters
Fig. 21. Signal to noise ratio in relation to both code length and code weight for plastic optical fiber
at the assumed set of the operating parameters
10 20 30 40 50 60 70 80 90 1003
4
5
6
7
8
9
10
Code Length - P
SN
R (
dB
)
SNR vs Code Length for pure silica optical fiber
W=2
W=5
W=8
10 20 30 40 50 60 70 80 90 1003
4
5
6
7
8
9
10
Code Length -P
SN
R (
dB
)
SNR(dB) vs Code Length for plastic optical fiber
W=2
W=5
W=8

International Journal of Basic and Applied Science,
Vol 01, No. 04, April 2013, pp. 745-762
Rashed, et. al.
760 Insan Akademika Publications
Fig. 22. Bit error rate in relation to both code length and code weight for pure silica fiber at the
assumed set of the operating parameters
Fig. 23. Bit error rate in relation to both code length and code weight for plastic optical fiber at the
assumed set of the operating parameters
iii) Fig. 6 has proved that thermal noise decreases with increasing operating optical signal
wavelength and decreasing ambient temperature at the assumed set of the operating parameters.
iv) Figs. (7-12) have indicated that maximum and minimum system cost planning based on both
pure silica and plastic fibers decreases with decreasing both code length and code weight under
the assumed set of the operating parameters. It is also observed that system cost planning
decreases with increasing transmission distance for both fibers under sturdy considerations.
v) Fig. 13 has indicated that shot noise decreases with increasing both operating optical signal
wavelength and photo current under the assumed set of the operating parameters.
10 20 30 40 50 60 70 80 90 1001
2
3
4
5
6
7
8
9
10x 10
-9
Code Length - P
Bit
Err
or
Ra
te (
BE
R)
Bit Error Rate vs Code Length for pure silica optical fiber
W=2
W=5
W=8
10 20 30 40 50 60 70 80 90 1001
2
3
4
5
6
7
8
9
x 10-9
Code Length - P
Bit
Err
or
Ra
te (
BE
R)
Bit Error Rate vs Code Length for plastic optical fiber
W=2
W=5
W=8

Rashed, et. al. International Journal of Basic and Applied Science,
Vol 01, No. 04, April 2013, pp. 745-762
www.insikapub.com 761
vi) Figs. (14-19) have indicated that received signal power based on both pure silica and plastic
fibers decreases with decreasing both code length and code weight under the assumed set of the
operating parameters. It is also observed that received signal power decreases with increasing
transmission distance for both pure silica and plastic fibers under sturdy considerations.
vii) Figs. (20-23) have assured that signal to noise ratio increases and bit error rates decrease for
both pure silica and plastic optical fibers based OCDMA systems with increasing code length
and adjust increasing code weight at five step weight.
5 Conclusion
In a summary, the model has been investigated the transmission analysis of optical code division
multiple access (OCDMA) communication systems in the presence of noise in local area network
applications. It is theoretically found that the increased code length, this results in the increased
number of users at constant code weight at w=5 to get maximum signal to noise ratio and minimum bit
error rates. Thermal and shot noise have the dramatic effects on the OCDMA communication systems.
The suitable choice of code length and code weight have the great effects on the maximum and
minimum system cost planning and received signal power at different transmission distances for both
plastic and pure silica fibers based OCDMA communication systems.
References
[1] L. Tancevski, and I. Andonovic, “Hybrid Wavelength Hopping/Time Spreading Schemes for
Use in Massive Optical Networks With Increased Security,” Journal of Lightwave Technology,
Vol. 14, No.12, pp. 2636–2647, 1996.
[2] Ahmed Nabih Zaki Rashed, Abd El-Naser A. Mohammed, Mohamed M. E. El-Halawany, and
Mohammed S. F. Tabour “High Transmission Performance of Radio over Fiber Systems over
Traditional Optical Fiber Communication Systems Using Different Coding Formats for Long
Haul Applications,” Nonlinear Optics and Quantum Optics, Vol. 44, No. 1, pp. 41–63, 2012.
[3] T. Ohtsuki, K. Sato, I. Sasase, and S. Mori, “Direct Detection Optical Synchronous CDMA
Systems with Double Optical Hard-Limiters Using Modified Prime Sequence Codes,” IEEE
journal on selected areas in communications, Vol 14, No 9, pp. 2311-2319, 1996.
[4] Ahmed Nabih Zaki Rashed, “High reliability optical interconnections for short range
applications in high performance optical communication systems,” Optics and Laser
Technology, Elsevier Publisher, Vol. 48, pp. 302–308, 2013.
[5] X. Zhou, H. H. M. Shalaby, C. Lu, and T. Cheng, “Code for Spectral Amplitude Coding Optical
CDMA Systems,” Electronics Letters, Vol. 36, No. 8, pp. 321-328, 2000.
A. Stok, and E. H. Sargent, “The Role of Optical CDMA in Access Networks,” IEEE
Communications Magazine, 2002.
[6] Stok, and E. H. Sargent, “System Performance Comparison of Optical CDMA and WDMA in A
broadcast Local Area Network,” IEEE Communications Letters, Vol. 6, No. 9, pp. 876-884,
2002.
[7] H. M. H. Shalaby, “Performance Analysis of an Optical CDMA Random Access Protocol”
Journal of Lightwave Technology, Vol. 22, No. 5, pp. 5543-5550, 2004.
[8] B. Djordjevic, and B. Vasic, “Combinatorial Constructions of Optical Orthogonal Codes for
OCDMA Systems,” IEEE communications letters, Vol. 8, No. 6, pp. 365- 374, 2004.
[9] G. Brugeaud, A. J. Vergonjanne and J. P. Cances, “Prime Code efficiency in DS-OCDMA
Systems using Parallel Interference Cancellation,” Journal of communications, Vol. 2, No.3, pp.
243-249, 2007.
International Journal of Basic and Applied Science,
Vol 01, No. 04, April 2013, pp. 745-762
Rashed, et. al.
762 Insan Akademika Publications
[10] V. J. Hernandez, A. Mendez, C. V. Bennett, R. M. Gagliardi and William J. Lennon, “Bit-Error
Rate Analysis of a 16-User Gigabit Ethernet Optical-CDMA (OCDMA) Technology
Demonstrator Using Wavelength/Time Codes,” IEEE Photonics Technology Letters, Vol.17, No.
12, pp. 2784-2786, 2005.
[11] V. Baby, I. Glesk, R. J. Runser, R. Fisher, h. Yue-kai, C.S. Bres, W.C. Kwong, T.H. Curtis and
P.R. Prucnal, “Experimental Demonstration and Scalability Analysis of A four Node 102 chip/s
Fast Frequency Hopping Time Spreading Optical CDMA Network,” IEEE photonics
Technology Letter, Vol. 17, No. 1, pp. 253-255, 2005.
[12] Ahmed Nabih Zaki Rashed, “Performance signature and optical signal processing of high speed
electro-optic modulators,” accepted for publication in Optics Communications, Elsevier
Publisher, 2013.
[13] Simon Ayotte, Leslie A. Rusch, “Experimental Comparison of Coherent Sources in A four User
λ-t OCDMA System at 1.25 Gb/s,” IEEE Photonics Technology Letters, Vol. 17, No. 11, pp.
2493-2495, 2005.
[14] T. Eltaif, H. M. H. Shalaby, and S. Shaari, “A novel Successive Interference Cancellation
Scheme in OCDMA System,” in Proc. IEEE Conf. ICSE2006, pp. 299–303, 2006.
[15] T. Eltaif, H. M. H. Shalaby, S. Shaari, and M. M. N. Hamarsheh, “Proposal of Successive
Interference Cancellation Scheme in Optical Code Division Multiplexing Systems,” Opt. Eng.,
Vol. 47, No. 3, pp. 231-238, 2008.
[16] H. Shin, C. Park, and J. H. Lee, “Performance of Code Division Minltiple Non-Directed Diffuse
Optical Wireless Channel Access in,” IEEE J. Select. Areas Communcations., Vol. 11, No. 3, pp.
367-379, 1996.
[17] M. M. Karbassian and H. G. Shiraz, “Novel Channel Interference Reduction in Optical
Synchronous FSK CDMA Networks Using Aa datafree Reference,” J. Lightw. Technol., Vol. 26,
No. 8, pp. 977–985, 2008.
[18] M. M. Karbassian and H. G. Shiraz, “Frequency Shift Keying Optical Code Division Multiple
Access System With Novel Interference Cancellation,” Microw. Opt. Technol. Lett., Vol. 50,
No. 4, pp. 883–885, 2008.
[19] T. L. Lee, C. A. Burrus, A. G. Dentai, and K.Ogawa, "Small Area InGaAs/lnP p-i-n
Photodiodes: Fabrication, Characteristics and Performance of Devices in 274 Mb/s and 45 Mb/s
Lightwave Receivers at 1.31 μm Wavelength," Electron. Letters, Vol. 16, No. 3, pp. 155-156,
1990.