Embed Size (px)
Citation preview
NREL is a national laboratory of the U.S. Department of Energy Office of Energy Efficiency & Renewable Energy Operated by the Alliance for Sustainable Energy, LLC This report is available at no cost from the National Renewable Energy Laboratory (NREL) at www.nrel.gov/publications.
Contract No. DE-AC36-08GO28308
Transmission Line Jobs and Economic Development Impact (JEDI) Model User Reference Guide Marshall Goldberg MRG and Associates
David Keyser National Renewable Energy Laboratory
Technical Report NREL/TP-6A20-60250 October 2013

NREL is a national laboratory of the U.S. Department of Energy Office of Energy Efficiency & Renewable Energy Operated by the Alliance for Sustainable Energy, LLC This report is available at no cost from the National Renewable Energy Laboratory (NREL) at www.nrel.gov/publications.
Contract No. DE-AC36-08GO28308
National Renewable Energy Laboratory 15013 Denver West Parkway Golden, CO 80401 303-275-3000 • www.nrel.gov
Transmission Line Jobs and Economic Development Impact (JEDI) Model User Reference Guide Marshall Goldberg MRG and Associates
David Keyser National Renewable Energy Laboratory
Prepared under Task No. DRS8.4010
Technical Report NREL/TP-6A20-60250 October 2013

NOTICE
This report was prepared as an account of work sponsored by an agency of the United States government. Neither the United States government nor any agency thereof, nor any of their employees, makes any warranty, express or implied, or assumes any legal liability or responsibility for the accuracy, completeness, or usefulness of any information, apparatus, product, or process disclosed, or represents that its use would not infringe privately owned rights. Reference herein to any specific commercial product, process, or service by trade name, trademark, manufacturer, or otherwise does not necessarily constitute or imply its endorsement, recommendation, or favoring by the United States government or any agency thereof. The views and opinions of authors expressed herein do not necessarily state or reflect those of the United States government or any agency thereof.
This report is available at no cost from the National Renewable Energy Laboratory (NREL) at www.nrel.gov/publications.
Available electronically at http://www.osti.gov/bridge
Available for a processing fee to U.S. Department of Energy and its contractors, in paper, from:
U.S. Department of Energy Office of Scientific and Technical Information P.O. Box 62 Oak Ridge, TN 37831-0062 phone: 865.576.8401 fax: 865.576.5728 email: mailto:[email protected]
Available for sale to the public, in paper, from:
U.S. Department of Commerce National Technical Information Service 5285 Port Royal Road Springfield, VA 22161 phone: 800.553.6847 fax: 703.605.6900 email: [email protected] online ordering: http://www.ntis.gov/help/ordermethods.aspx
Cover Photos: (left to right) photo by Pat Corkery, NREL 16416, photo from SunEdison, NREL 17423, photo by Pat Corkery, NREL 16560, photo by Dennis Schroeder, NREL 17613, photo by Dean Armstrong, NREL 17436, photo by Pat Corkery, NREL 17721.
Printed on paper containing at least 50% wastepaper, including 10% post consumer waste.
iii This report is available at no cost from the National Renewable Energy Laboratory (NREL) at www.nrel.gov/publications.
Summary The Jobs and Economic Development Impact (JEDI) models, developed through the National Renewable Energy Laboratory (NREL), are freely available, user-friendly tools that estimate the potential economic impacts of constructing and operating power generation projects for a range of conventional and renewable energy technologies. The Transmission Line JEDI model can be used to examine questions about the economic impacts of transmission lines in a given state, region, or local community. This Transmission Line JEDI User Reference Guide was developed to provide basic instruction on operating the model and understanding the results. This guide also provides information on the model’s underlying methodology, as well as the parameters and references used to develop the cost data contained in the model.
Based on inputs from the user, JEDI estimates total economic activity—job creation, earnings, and output—for a given transmission line project. This includes the onsite, supply chain, and induced economic impacts associated with construction and maintenance. JEDI uses project cost and local1 content data gathered from actual transmission line projects, literature review, and input from industry professionals. Economic impacts are estimated using economic multipliers derived from IMPLAN software.
1 “Local” refers to the region of analysis. This is discussed in greater depth in sections 5 and 6.3.
iv This report is available at no cost from the National Renewable Energy Laboratory (NREL) at www.nrel.gov/publications.
List of Acronyms and Abbreviations AC Alternating Current
ACSR Aluminum Conductor Steel Reinforced (cable)
BLS Bureau of Labor Statistics
CREZ Competitive Renewable Energy Zone
Ft Feet
FTE Full-Time Equivalent
HVDC High Voltage Direct Current
IMPLAN Impact Analysis for Planning
JEDI Jobs and Economic Development Impact Model
Kcmil Thousand Circular Mils
kV kilovolts
MW Megawatt
NESC National Electrical Safety Code
NREL National Renewable Energy Laboratory
O&M Operations and Maintenance
ROW Right-of-way
SOC Standard Occupational Classifications
WREZ Western Renewable Energy Zones
$MM Millions of Dollars
v This report is available at no cost from the National Renewable Energy Laboratory (NREL) at www.nrel.gov/publications.
Table of Contents Summary ..................................................................................................................................................... iii List of Acronyms and Abbreviations ....................................................................................................... iv List of Figures ............................................................................................................................................ vi List of Tables .............................................................................................................................................. vi 1 Introduction ........................................................................................................................................... 1 2 Model Overview .................................................................................................................................... 2
2.1 Types of Impacts ........................................................................................................................... 2 2.2 Metrics: Jobs, Earnings, and Gross Economic Output .................................................................. 2 2.3 Impact Phases: Construction and Operation ................................................................................. 3
3 Entering Data and Running the Model ............................................................................................... 4 3.1 Getting Started ............................................................................................................................... 4 3.2 Entering Data: Simple and Advanced Options .............................................................................. 5 3.3 Viewing and Saving Results ......................................................................................................... 6 3.4 Accessing and Viewing JEDI Work Areas ................................................................................... 6
4 Understanding the Results .................................................................................................................. 7 4.1 Caveats .......................................................................................................................................... 9
5 Customizing the Geographic Area of Analysis .............................................................................. 10 6 Understanding JEDI Data and Cost Categories .............................................................................. 12
6.1 Developing Detailed Project Expenditures ................................................................................. 14 6.2 Adjusting Project Costs for Terrain and Population Density ..................................................... 15 6.3 Estimating Local Expenditure Share ........................................................................................... 16 6.4 Setting Labor and Wage Rates .................................................................................................... 17
7 Model Review and Testing ................................................................................................................. 19 Resources .................................................................................................................................................. 20
vi This report is available at no cost from the National Renewable Energy Laboratory (NREL) at www.nrel.gov/publications.
List of Figures Figure 1. JEDI model Start page ................................................................................................................... 4 Figure 2. JEDI model Project Data page ....................................................................................................... 5 Figure 3. Project data summary and local economic impacts summary results from transmission line
JEDI run ................................................................................................................................... 8 List of Tables Table 1. Transmission Line Standard Configuration Assumptions ............................................................ 13 Table 2. Terrain and Population Density Cost Adjustments ....................................................................... 16 Table 3. Summary of JEDI Construction and O&M Expenditure Local Share Values .............................. 17

vii This report is available at no cost from the National Renewable Energy Laboratory (NREL) at www.nrel.gov/publications.
Acknowledgements The authors would like to thank the U.S. Department of Energy Office of Electricity for supporting this work. Thanks also to Francisco Flores-Espino of NREL and Andy Rawlins of Black and Veatch for comments and review of prior versions of this report. The authors would also like to thank Andy Rawlins for supporting the development of the Transmission Line JEDI model.
1 This report is available at no cost from the National Renewable Energy Laboratory (NREL) at www.nrel.gov/publications.
1 Introduction The Transmission Line Jobs and Economic Development Impact (JEDI) model is designed to demonstrate the potential economic impacts associated with developing and maintaining transmission lines in the United States. Economic impacts are categorized into project development and onsite labor impacts, equipment and supply chain impacts, and induced impacts.
The model features a user-friendly format that can be easily modified to incorporate a wide range of project-specific information. Additionally, the model was designed to be transparent so that users can see how it generates impacts.
This document describes general use of the model, how to interpret output summaries, and technical assumptions and cost models contained in the model. In general, the model relies on historical cost data, estimates from transmission line projects in the United States, and transmission line engineering assumptions to develop default values. These data introduce uncertainty because there are many variables associated with developing transmission lines. Model data represent the best information available to NREL at the time of development. For additional questions regarding the JEDI models or model updates, please refer to the Jobs and Economic Development (JEDI) models home page at http://www.nrel.gov/analysis/jedi/.
2 This report is available at no cost from the National Renewable Energy Laboratory (NREL) at www.nrel.gov/publications.
2 Model Overview The Transmission Line JEDI model offers users the capability to analyze transmission line projects in the United States. JEDI uses an input-output model to estimate jobs, earnings, and gross economic output that could be supported by the project.
Input-output models were originally developed to trace supply linkages in the economy. For example, they show how purchases of transmission line equipment not only impact equipment manufacturers but also the metal industries and other businesses supplying inputs to those manufacturers. As of the time of this publication (2013), JEDI uses state level data from the IMPLAN input-output model.2
The impacts of expenditures for transmission lines depend upon the extent to which those expenditures are spent within the region of analysis and on the structure of the local economy. Consumers who purchase goods that are manufactured locally, for example, support more manufacturing jobs within the region of analysis than those who purchase imported goods.
2.1 Types of Impacts To determine the total effect of developing a transmission line, JEDI examines three separate impacts for each project scenario: project development and onsite labor impacts, equipment and supply chain impacts, and induced impacts. The sum of these three impacts is the total impact of the scenario. In order to provide intuitive results, these impacts are categorized as they relate to a project. .
Project development and onsite labor impacts refer to the onsite or immediate effects created by project expenditures. In constructing a transmission line, it refers to the onsite jobs of the contractors and crews hired to install the towers and run the overhead lines.
Equipment and supply chain impacts refer to the increase in economic activity that occurs when a contractor, vendor, or manufacturer receives payment for goods or services and in turn is able to pay others who support their business. For example, this impact includes the banker who finances the contractor who pays the foundation workers, and the steel mills and electrical manufacturers along the supply chain that provide necessary materials. The effects captured here also include the manufacturing of transmission line equipment, such as steel structures and poles, overhead wires, and circuits that are used in construction.
Induced impacts refer to the effects driven by spending of household earnings from project development and onsite labor impacts as well as supply chain impacts. Induced results are often associated with increased business at local restaurants, hotels, and retail establishments but also include activity at childcare providers, service providers, and any other entity affected by increased economic activity and spending occurring at the first two tiers.
2.2 Metrics: Jobs, Earnings, and Gross Economic Output JEDI reports three metrics: jobs, earnings, and gross economic output.
2 More information about IMPLAN can be found at http://www.implan.com.
3 This report is available at no cost from the National Renewable Energy Laboratory (NREL) at www.nrel.gov/publications.
JEDI reports all job figures as full time equivalent (FTE). One FTE is the equivalent of one person working full time for one year (2,080 hours). One FTE could represent two people working half time for one year, or two people who work full time for six months.
Earnings consist of wages or salaries and employer provided supplements. Retirement contributions and health care benefits are common supplements.
Gross output is a general measure of economic activity.3 It is the sum of all expenditures that are estimated to take place in an economy as a result of the specified project scenario. Output includes the portion of the project itself that was spent locally as well as all local expenditures for inputs, including business expenditures and commodities purchased by households.
2.3 Impact Phases: Construction and Operation JEDI produces results for two phases: construction and operation. Construction phase results are cumulative totals over the entire construction period, whereas operation phase results are annual over the operating life of the transmission line. JEDI analysis does not assume a set life span, nor does it consider potential impacts from line removal.
Construction phase results are not affected by the duration of the construction period. The results for a one-year project will be the same as a five-year project, assuming all costs are consistent. If desired, annual averages can be obtained by dividing construction results by the number of years it takes to build the transmission line. For example, if JEDI produces an estimate of 100 FTE construction jobs supported by a project that takes two years to build, the estimate can also be reported as an average of 50 jobs per year (100 / 2 = 50) during the two-year construction period.
To estimate the local jobs and other economic impacts associated with transmission line worker earnings, the JEDI model utilizes personal consumption expenditure patterns. These average spending patterns, derived from household commodity demand, provide the basis for reallocating worker earnings to industries that will likely supply the commodities that are purchased by consumers.4 For example, for each dollar of earnings received by a worker, a portion is spent on housing, transportation, food, and other goods or services. The model allocates this spending to those industries that produce the goods or services and then reports the associated impacts.
JEDI contains default values representative of “typical” transmission line projects constructed in various terrains and population densities. These values allow users with limited knowledge of a specific project to estimate potential economic impacts from a project or aggregation of projects. These default values represent a reasonable expenditure pattern for constructing and maintaining a transmission line in the United States. Resource characteristics, varied terrain, location, financing arrangements, developer preferences, and numerous site-specific factors influence economic impacts. Similarly, the availability of local resources, including labor and materials, and the availability of locally manufactured components can have a significant effect on the costs and the economic impacts that accrue to the state or local region.
3 Gross economic output is not the same as gross domestic product (GDP). GDP is a measure of the value of production. Gross output includes the value of production in addition to purchases of inputs. 4 Personal consumption expenditure patterns are based on analysis of household commodity demand derived from IMPLAN state data files.
4 This report is available at no cost from the National Renewable Energy Laboratory (NREL) at www.nrel.gov/publications.
3 Entering Data and Running the Model JEDI contains numerous comments that provide explanations and instructions about what type of data to enter in specific cells or what certain line items or categories mean. When available, the comments can be viewed by pointing the cursor to the red triangle in the corner of select cells.
User modified data can be entered and saved within the JEDI model. These changes can be undone by clicking the “Restore Default Values” button. JEDI defaults are protected; project data can be changed, but default data cannot.
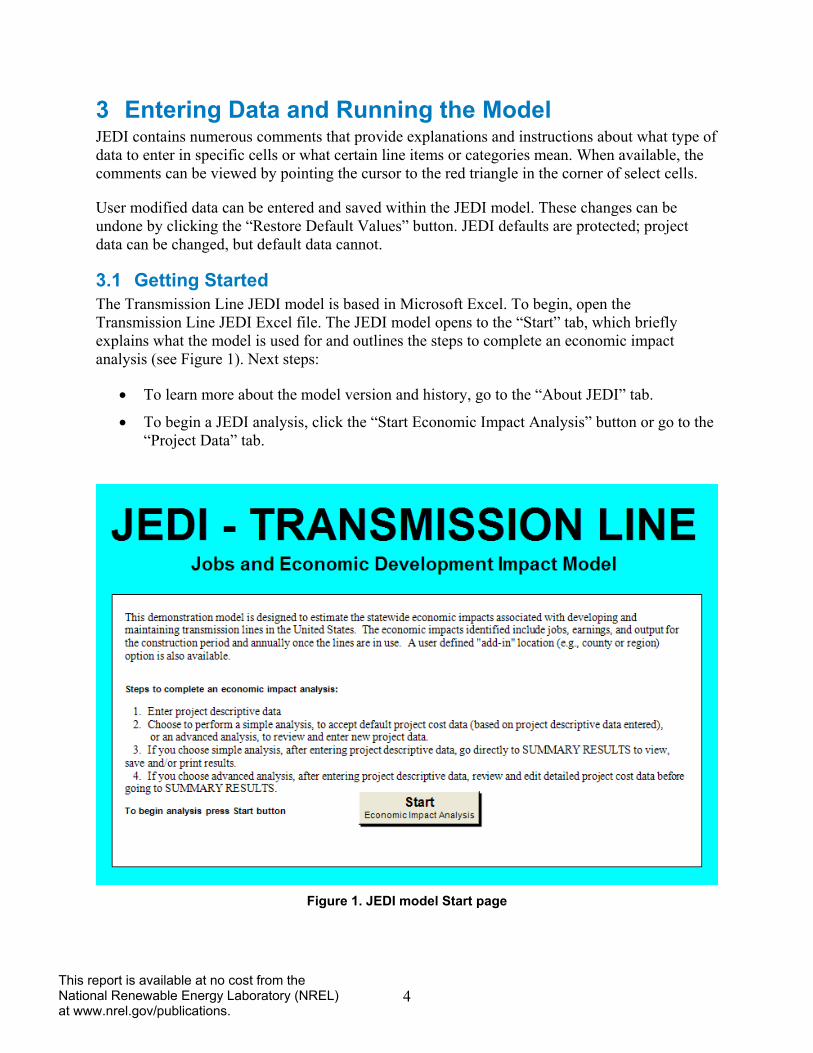
3.1 Getting Started The Transmission Line JEDI model is based in Microsoft Excel. To begin, open the Transmission Line JEDI Excel file. The JEDI model opens to the “Start” tab, which briefly explains what the model is used for and outlines the steps to complete an economic impact analysis (see Figure 1). Next steps:
• To learn more about the model version and history, go to the “About JEDI” tab.
• To begin a JEDI analysis, click the “Start Economic Impact Analysis” button or go to the “Project Data” tab.
Figure 1. JEDI model Start page
5 This report is available at no cost from the National Renewable Energy Laboratory (NREL) at www.nrel.gov/publications.
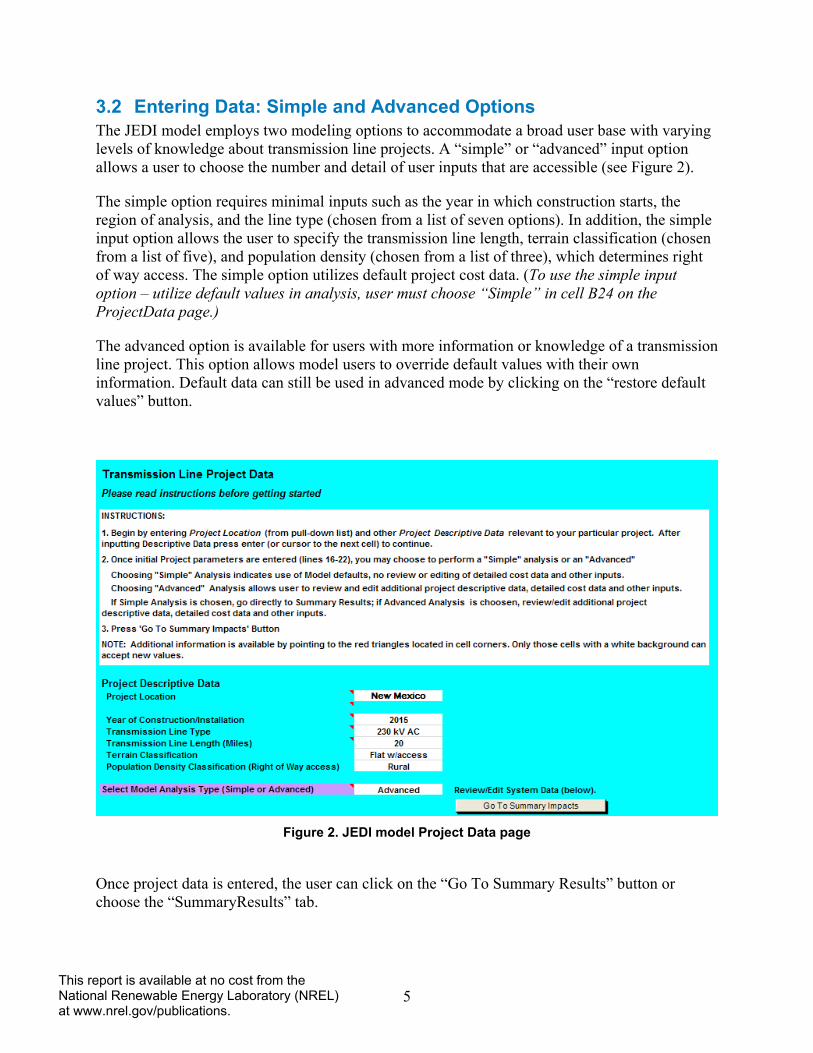
3.2 Entering Data: Simple and Advanced Options The JEDI model employs two modeling options to accommodate a broad user base with varying levels of knowledge about transmission line projects. A “simple” or “advanced” input option allows a user to choose the number and detail of user inputs that are accessible (see Figure 2).
The simple option requires minimal inputs such as the year in which construction starts, the region of analysis, and the line type (chosen from a list of seven options). In addition, the simple input option allows the user to specify the transmission line length, terrain classification (chosen from a list of five), and population density (chosen from a list of three), which determines right of way access. The simple option utilizes default project cost data. (To use the simple input option – utilize default values in analysis, user must choose “Simple” in cell B24 on the ProjectData page.)
The advanced option is available for users with more information or knowledge of a transmission line project. This option allows model users to override default values with their own information. Default data can still be used in advanced mode by clicking on the “restore default values” button.
Figure 2. JEDI model Project Data page
Once project data is entered, the user can click on the “Go To Summary Results” button or choose the “SummaryResults” tab.
6 This report is available at no cost from the National Renewable Energy Laboratory (NREL) at www.nrel.gov/publications.
3.3 Viewing and Saving Results To print data and results, click:
• “Print Project Data Summary and Summary Results” to print the summary data and results contained on the summary page
• “Print Detailed Project Data” to print a detailed version of all cost and expenditure data used in the analysis.
To export the data and results to a separate Excel file, click the “Export” button.
To save the entire model (with the user-modified data) for future use or reference, choose “Save As” from the Excel menu, rename the model, and choose a directory. Users with Excel 2007 or newer should save the file with a macro-enabled “.xlsm” extension, as the file uses macros. Changing the name ensures the original model (with model defaults) is kept intact for future analysis.
Users always have the option to “copy” and “paste” to another spreadsheet or document.
3.4 Accessing and Viewing JEDI Work Areas To help ensure the JEDI model is as transparent as possible, default data, calculations, deflators, and four additional work areas are contained within their own worksheets. All of these work areas are locked and cannot be changed. If desired, they can be viewed (but not edited) by clicking on the worksheet and scrolling to the right. Viewing the worksheets will not affect the operation of the model.
Multipliers and household expenditure patterns are also contained within their own worksheets. In order to adhere to licensing agreements that cover proprietary data, the multiplier and household expenditure worksheets are locked and cannot be viewed. Multiplier and household expenditure data can be changed with the “User Add-In Location” feature. Details about this feature and instructions are covered elsewhere in this report.
7 This report is available at no cost from the National Renewable Energy Laboratory (NREL) at www.nrel.gov/publications.
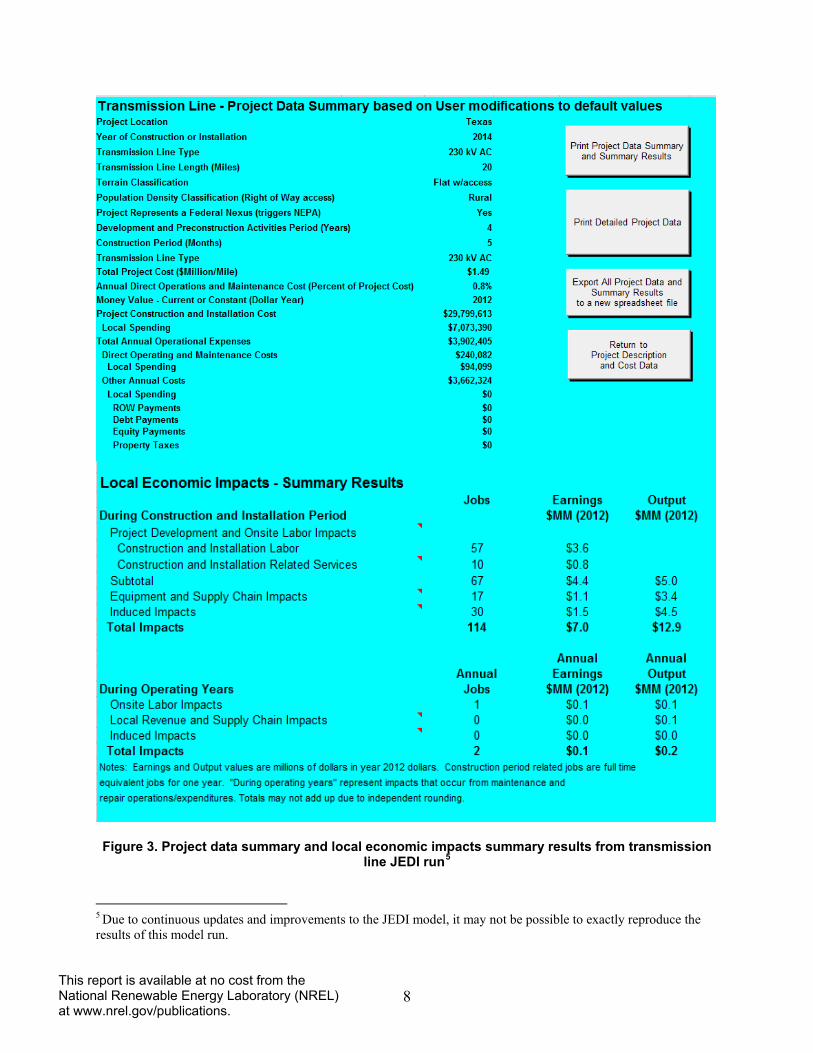
4 Understanding the Results JEDI results illuminate the magnitude of the economic impacts of transmission line projects. The model provides basic project information to help identify construction-related spending levels and ongoing O&M expenditures. The model also displays the portion of the spending assumed to occur locally (determined by the “local share” values—default or user-modified—used in the model for each of the expenditures). Similarly, the model displays local spending on debt and equity payments, property taxes, right of way payments, and purchase and land lease payments, if applicable.
The JEDI model analyzes and reports the local jobs, earnings and gross output that could be reasonably supported by the specified project for the construction phase and for the ongoing operations phase. For the construction phase, the impacts are broken out by project development and onsite labor impacts, including construction labor and construction related services, equipment and supply chain impacts, and induced impacts. Operation phase impacts are broken out as onsite, local revenue and supply chain, and induced.
Figure 3 shows the job and economic impact summary for a 230 kV AC transmission line (simple model option) constructed in 2015. The results from this example show that 114 full-time equivalent (FTE) jobs are supported generating $7.0 million in earnings and $12.9 million in total economic activity during project development and construction; these include a total of 67 FTE jobs from project development (57 construction and 10 construction related services), 17 from the equipment and supply chain, and 30 from induced impacts. Once the project is operational, the user finds that 1 full-time O&M job is created and sustained for the life of the transmission line, with fractions of an FTE job (rounded) through supply chain and induced impacts, for a total of 2 full-time jobs associated with line operations and maintenance.
8 This report is available at no cost from the National Renewable Energy Laboratory (NREL) at www.nrel.gov/publications.
Figure 3. Project data summary and local economic impacts summary results from transmission line JEDI run5
5 Due to continuous updates and improvements to the JEDI model, it may not be possible to exactly reproduce the results of this model run.
9 This report is available at no cost from the National Renewable Energy Laboratory (NREL) at www.nrel.gov/publications.
4.1 Limitations and Caveats The intent of the Transmission Line JEDI model is to construct a reasonable profile of expenditures (i.e., development services, materials and equipment costs, construction labor and maintenance costs) and demonstrate the magnitude of the gross economic impacts that could result, assuming a project occurs during the stated period of analysis. Given the unique nature of transmission lines and the many site specific factors that can impact the cost, the analysis is not intended to provide a precise projection of expected impacts. Rather, the analysis should be viewed as an estimate of the overall magnitude of the impacts.
Because JEDI models do not estimate the impacts (jobs, earnings, and output) related to alternative spending or increases or decreases in consumer utility bills, JEDI results should be viewed as gross rather than net. JEDI does not incorporate potential far-reaching impacts, such as changes in utility rates, taxes, property values, or displaced investment.
The JEDI model is a static model. As such, it relies on inter-industry relationships and household consumption patterns for the year that the multipliers were generated. Prices, technology, productivity, taxes, and consumer behavior are assumed to remain constant.
If users specify that certain activities will occur within the region of analysis, JEDI assumes that these activities are possible. JEDI also assumes that associated activities will also be “local.” For example, if a user specifies that steel towers will be manufactured locally and, within the input-output model, steel tower manufacturers purchase their raw material locally, JEDI results will reflect local manufacturing of the towers as well as locally procured raw materials. The model does not evaluate whether this is technically feasible.
JEDI was not designed to provide cash flow projections or to be used for cash flow analysis.
NREL is not responsible for how JEDI is used or how its results are interpreted.
10 This report is available at no cost from the National Renewable Energy Laboratory (NREL) at www.nrel.gov/publications.
5 Customizing the Geographic Area of Analysis Early JEDI models provided for state-level impact analysis only, but current models also facilitate analysis at different geographic levels within the United States or internationally. JEDI also allows use of multipliers from sources other than IMPLAN, such as those available from the Bureau of Economic Analysis.
The JEDI models’ User Add-in Location feature allows users to derive or obtain data to complete analysis for a specific region of interest. The necessary inputs include direct, indirect, and induced multipliers for employment; earnings and output (per million dollars change in final demand); and personal consumption expenditure patterns (i.e., average consumer expenditures on goods and services—calculated as a percentage, entered in decimal format, totaling 100 percent combined) for the 14 aggregated industries used in the model:
1. Agriculture
2. Construction
3. Electrical equipment
4. Fabricated metals
5. Finance, insurance, and real estate
6. Government
7. Machinery
8. Mining
9. Other manufacturing
10. Other services
11. Professional services
12. Retail trade
13. Transportation, communication, and public utilities
14. Wholesale trade.
To gather the necessary data using IMPLAN:
1. Purchase the desired county or state-level data files.
2. Using IMPLAN Version 3 software or newer, create a new model with the desired region (one county, group of counties, one state or group of states).
3. Construct the model through multipliers.
4. Aggregate the model. This step requires the user to create a new 14-industry aggregation scheme. The JEDI aggregation scheme template is available by request from NREL.7
7 Contact NREL at [email protected].
11 This report is available at no cost from the National Renewable Energy Laboratory (NREL) at www.nrel.gov/publications.
5. Reconstruct the model.
6. Export household local commodity demand (personal consumption expenditures) and multipliers for employment, employee compensation, and output to spreadsheet files.
7. Format data contained in each of these files and cut and paste) into the appropriate location (MyCounty for a single county or MyRegion for a group of counties or states) in the User Add-in Location worksheet.
All input data noted above must be in the exact order and format found in the User Add-in Location worksheet in the JEDI model. Any variations may invalidate the analysis and results.
Once the user data are entered, go to the project description section of the ProjectData worksheet and identify the location of the transmission line as MyCounty or MyRegion. Proceed with entering the necessary descriptive data for the analysis.
For non-IMPLAN users or those unfamiliar with input-output modeling, there are several options for gathering the necessary data to perform specific county or regional analysis.8 These include:
1. Follow a similar process as that noted above to derive the aggregated and disaggregated multipliers and consumer expenditure data (aggregated) from another input-output modeling tool.
2. Purchase the necessary data (aggregated and disaggregated multiplier and consumer commodity demand—see description above) from an input-output data provider.
3. Obtain desired updates from the model developer or some other person or organization skilled in input-output modeling.
All input data noted above must be in the exact order and format found in the User Add-in Location worksheet in the JEDI model. Any variations may invalidate the analysis and results.
Default project data are designed to reflect state-level projects in the United States. Users can choose to use default data with customized multipliers, although if the project scenario differs from what might occur in a U.S. state, users are encouraged to use the model in advanced mode and customize the project scenario. This is especially important if the region of analysis is outside of the United States.
8 As a federally funded research and development center, NREL cannot recommend or endorse particular products or services.
12 This report is available at no cost from the National Renewable Energy Laboratory (NREL) at www.nrel.gov/publications.
6 Understanding Transmission Line JEDI Data and Cost Categories
Analyzing the economic impacts of constructing and maintaining transmission lines requires a large amount of project- and location-specific data, such as capital costs, labor rates, local input-output multipliers, personal expenditure patterns, and price deflators.
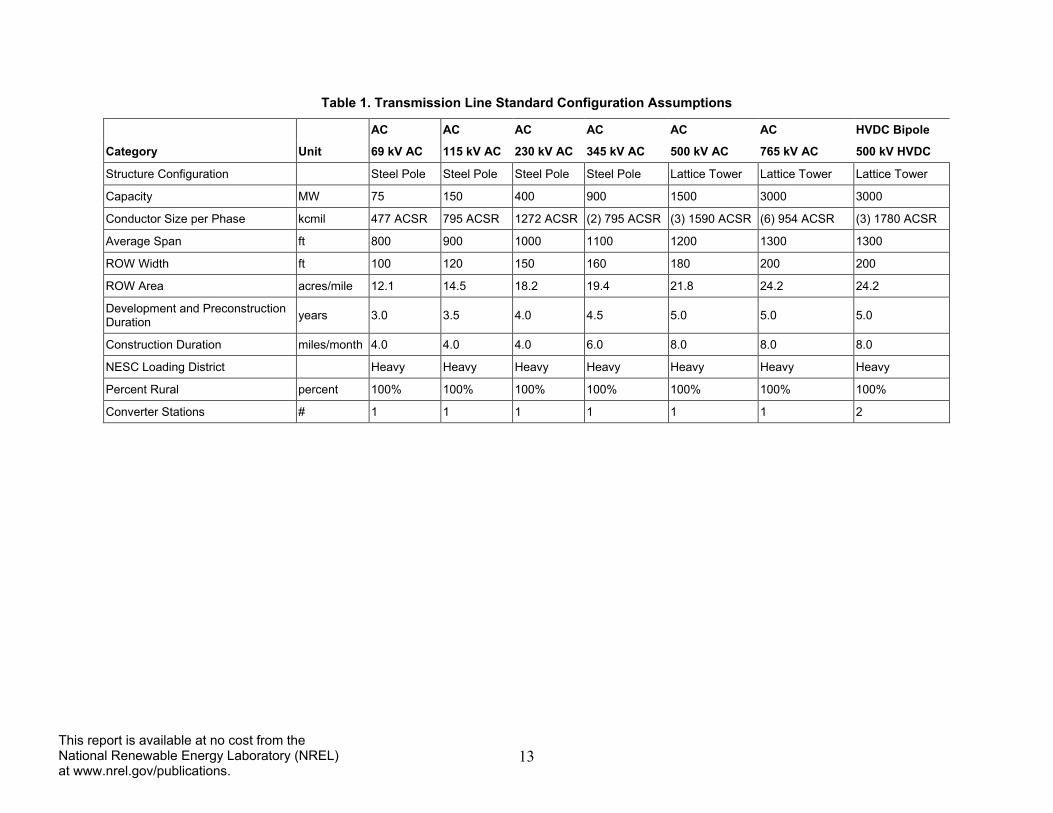
Before initiating formal model development, NREL defined representative projects for seven different line types. This was critical since the number and type of line components (e.g., bays/circuits, substations, etc.) and expenditures are highly sensitive to project parameters. Table 1 provides a summary of these assumptions.
Once the standard configurations were developed, the representative project cost estimates for each project type were derived based on the following process:
• Collect high level data for installed costs of substations and transmission lines (and detailed costs as available).
• Derive the anticipated total installed cost for each standard configuration.
• Develop estimates of “soft” (non Procurement & Construction) costs attributable to each configuration.
Building upon these basic parameters the model provides default values for all inputs necessary to perform an analysis. Black and Veatch developed project costs, including development and preconstruction activities, line construction, right-of-way costs, and O&M costs from actual projects, an engineering model, and engineering expertise. Black and Veatch surveyed expenditures for over 20 actual projects built between 2011 and 2013, including detailed expenditures for Competitive Renewable Energy Zone (CREZ) projects in Texas. Other projects surveyed were across the United States and southern Canada. Additional data came from the Western Renewable Energy Zones (WREZ) Transmission Model. 9 Black and Veatch engineers further refined cost data based on project experience and expertise. Inflation was estimated with the Bureau of Labor Statistics consumer price index for all urban consumers.
There can be considerable variation in reported transmission line costs. The default figures in JEDI represent a “middle of the road” scenario when compared with all projects surveyed. Table 1 lists Black and Veatch configuration assumptions used to develop default costs. Conductor size, in particular, can cause costs to deviate from JEDI defaults. Sizes listed in table 1 are typical for each line type, but can be changed due to utility standards, line length, and capacity requirements.
9 Information on the WREZ Transmission Model is available at http://www.westgov.org/index.php?option=com_content&view=article&catid=102%3Ainitiatives&id=220%3Awrez-transmission-model-page&Itemid=81.
13 This report is available at no cost from the National Renewable Energy Laboratory (NREL) at www.nrel.gov/publications.
Table 1. Transmission Line Standard Configuration Assumptions
AC AC AC AC AC AC HVDC Bipole
Category Unit 69 kV AC 115 kV AC 230 kV AC 345 kV AC 500 kV AC 765 kV AC 500 kV HVDC
Structure Configuration Steel Pole Steel Pole Steel Pole Steel Pole Lattice Tower Lattice Tower Lattice Tower
Capacity MW 75 150 400 900 1500 3000 3000
Conductor Size per Phase kcmil 477 ACSR 795 ACSR 1272 ACSR (2) 795 ACSR (3) 1590 ACSR (6) 954 ACSR (3) 1780 ACSR
Average Span ft 800 900 1000 1100 1200 1300 1300
ROW Width ft 100 120 150 160 180 200 200
ROW Area acres/mile 12.1 14.5 18.2 19.4 21.8 24.2 24.2
Development and Preconstruction Duration years 3.0 3.5 4.0 4.5 5.0 5.0 5.0
Construction Duration miles/month 4.0 4.0 4.0 6.0 8.0 8.0 8.0
NESC Loading District Heavy Heavy Heavy Heavy Heavy Heavy Heavy
Percent Rural percent 100% 100% 100% 100% 100% 100% 100%
Converter Stations # 1 1 1 1 1 1 2
14 This report is available at no cost from the National Renewable Energy Laboratory (NREL) at www.nrel.gov/publications.
6.1 Developing Detailed Project Expenditures Developing a JEDI model requires the disaggregation of total project costs or expenditures into individual line items that can be aligned with sectors in the IMPLAN model. This allows individual expenditures to be evaluated for their impact within their respective sectors and then summed to estimate the total impact. Functionally, a transmission line project must be broken down into its constituent industries including, for example, steel fabrication, circuit and wire manufacturing, and commercial construction. Labor and services expenditures are also isolated from capital or equipment expenditures wherever possible.
With the seven representative project types and high-level costs defined, NREL developed a detailed list of line item expenditures at a resolution high enough to allow a given expenditure to be assigned to its respective IMPLAN sector, but at low enough that the input data were known or could be estimated. Unfortunately, the level of data and cost resolution required by the JEDI model goes beyond the data that are typically available in the public sphere. To accomplish this breakdown, NREL worked with Black & Veatch to develop the detailed project costs contained in the ProjectData worksheet. Project costs, including development and preconstruction activities, line construction, right-of-way costs and O&M, were derived using known percentages of total cost for each of the items. These percentages were derived from the transmission line engineering assumptions contained in the WREZ Transmission Model and data from industry professionals.
Project expenditures include:10
• Development and preconstruction activities
o Land acquisition services and payments
o Engineering, surveying and geotechnical services, and environmental and permitting services
• Construction activities
o Materials and equipment costs – basic construction materials, steel structures and poles, overhead wires, converter stations, substations, etc.
o Labor costs – civil and heavy construction
• Infrastructure costs
o Materials and equipment costs – bays/circuits, substations, substation upgrades, transformers, converter stations
o Labor costs – positions, new substations and upgrades, transformers, converter stations
• Services/other costs
10 Development and preconstruction costs cover the cost of the ROW acquisition personnel. For public lands, the owner typically pays an annual license fee which JEDI includes in the annual O&M costs section. For private lands, JEDI assumes a one-time, up-front payment to the landowner
15 This report is available at no cost from the National Renewable Energy Laboratory (NREL) at www.nrel.gov/publications.
o Transmission line services – line management, legal, insurance, public relations, engineering, construction management, and environmental monitoring, etc.
o Infrastructure services – substation site management, legal, insurance, public relations, engineering, construction management and environmental monitoring, etc.
o Other costs – environmental mitigation, system operator and regulator fees, business services, substation construction insurance
• Annual operating and maintenance costs
o Transmission line and right of way (ROW) – operational labor, maintenance materials, insurance replacement parts and equipment
o Substation/converter – labor, insurance replacement parts and equipment
• Other parameters (debt and equity, taxes, and payroll).
Projects that deviate significantly from this set of expenditure types, including projects with voltages not included in the seven representative types, may not lend themselves to modeling in the Transmission Line JEDI model without revisions to inputs or the underlying model structure.
6.2 Adjusting Project Costs for Terrain and Population Density There are many factors that can consistently increase or decrease project costs, such as terrain, access to construction sites, ROW ownership, and economies of scale. Unlike project-specific costs, these are broadly applicable to projects across the country. Black & Veatch developed cost adjustments based on project experience, market data, and industry cost models.
Cost adjustments, shown in Table 2, are ratios that represent how specific factors influence construction and procurement costs or right-of-way costs. A ratio of 1.00 represents no change from average costs. Ratios greater than 1.00 reflect higher costs, and ratios less than 1.00 reflect lower costs.
16 This report is available at no cost from the National Renewable Energy Laboratory (NREL) at www.nrel.gov/publications.
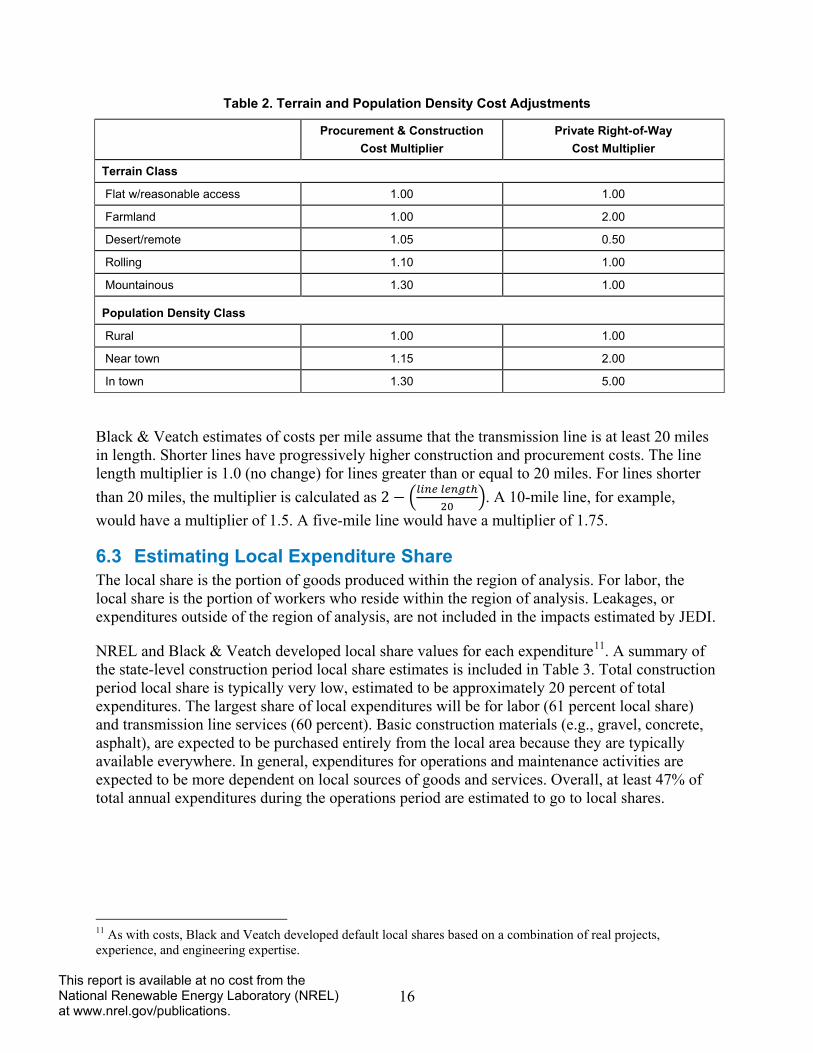
Table 2. Terrain and Population Density Cost Adjustments
Procurement & Construction Cost Multiplier
Private Right-of-Way Cost Multiplier
Terrain Class
Flat w/reasonable access 1.00 1.00
Farmland 1.00 2.00
Desert/remote 1.05 0.50
Rolling 1.10 1.00
Mountainous 1.30 1.00
Population Density Class
Rural 1.00 1.00
Near town 1.15 2.00
In town 1.30 5.00
Black & Veatch estimates of costs per mile assume that the transmission line is at least 20 miles in length. Shorter lines have progressively higher construction and procurement costs. The line length multiplier is 1.0 (no change) for lines greater than or equal to 20 miles. For lines shorter than 20 miles, the multiplier is calculated as 2 − �𝑙𝑖𝑛𝑒 𝑙𝑒𝑛𝑔𝑡ℎ
20�. A 10-mile line, for example,
would have a multiplier of 1.5. A five-mile line would have a multiplier of 1.75.
6.3 Estimating Local Expenditure Share The local share is the portion of goods produced within the region of analysis. For labor, the local share is the portion of workers who reside within the region of analysis. Leakages, or expenditures outside of the region of analysis, are not included in the impacts estimated by JEDI.
NREL and Black & Veatch developed local share values for each expenditure11. A summary of the state-level construction period local share estimates is included in Table 3. Total construction period local share is typically very low, estimated to be approximately 20 percent of total expenditures. The largest share of local expenditures will be for labor (61 percent local share) and transmission line services (60 percent). Basic construction materials (e.g., gravel, concrete, asphalt), are expected to be purchased entirely from the local area because they are typically available everywhere. In general, expenditures for operations and maintenance activities are expected to be more dependent on local sources of goods and services. Overall, at least 47% of total annual expenditures during the operations period are estimated to go to local shares.
11 As with costs, Black and Veatch developed default local shares based on a combination of real projects, experience, and engineering expertise.
17 This report is available at no cost from the National Renewable Energy Laboratory (NREL) at www.nrel.gov/publications.
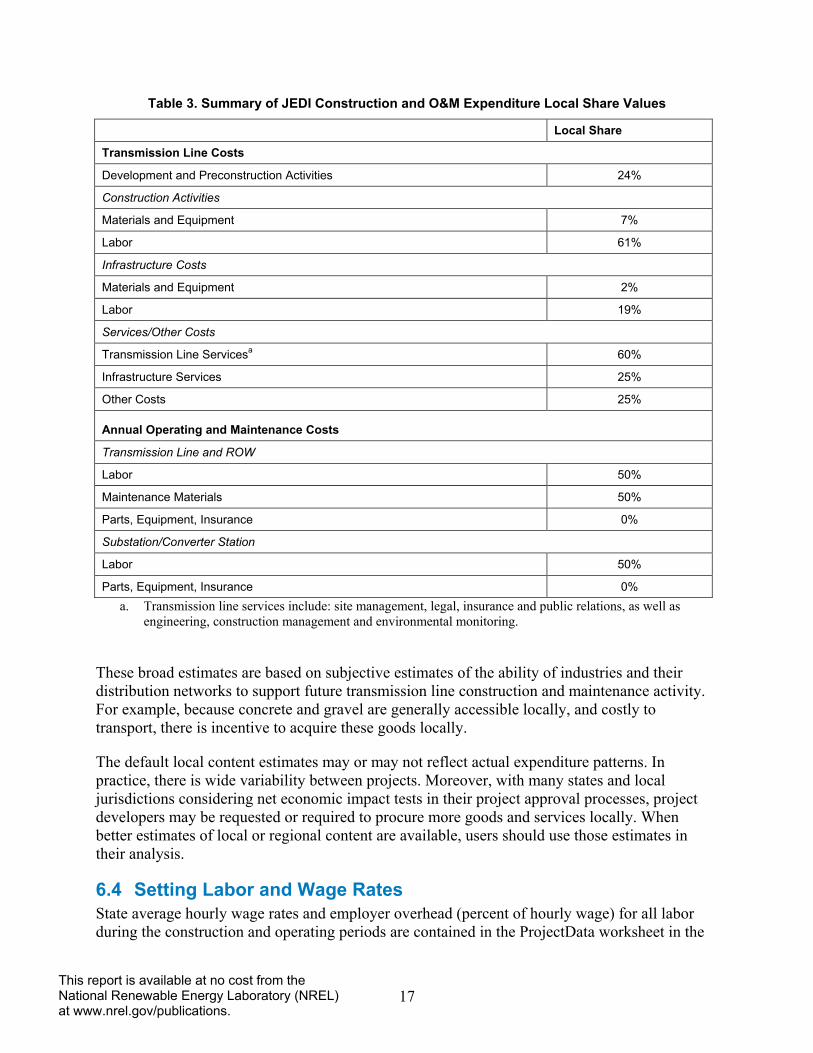
Table 3. Summary of JEDI Construction and O&M Expenditure Local Share Values
Local Share
Transmission Line Costs
Development and Preconstruction Activities 24%
Construction Activities
Materials and Equipment 7%
Labor 61%
Infrastructure Costs
Materials and Equipment 2%
Labor 19%
Services/Other Costs
Transmission Line Servicesa 60%
Infrastructure Services 25%
Other Costs 25%
Annual Operating and Maintenance Costs
Transmission Line and ROW
Labor 50%
Maintenance Materials 50%
Parts, Equipment, Insurance 0%
Substation/Converter Station
Labor 50%
Parts, Equipment, Insurance 0% a. Transmission line services include: site management, legal, insurance and public relations, as well as
engineering, construction management and environmental monitoring.
These broad estimates are based on subjective estimates of the ability of industries and their distribution networks to support future transmission line construction and maintenance activity. For example, because concrete and gravel are generally accessible locally, and costly to transport, there is incentive to acquire these goods locally.
The default local content estimates may or may not reflect actual expenditure patterns. In practice, there is wide variability between projects. Moreover, with many states and local jurisdictions considering net economic impact tests in their project approval processes, project developers may be requested or required to procure more goods and services locally. When better estimates of local or regional content are available, users should use those estimates in their analysis.
6.4 Setting Labor and Wage Rates State average hourly wage rates and employer overhead (percent of hourly wage) for all labor during the construction and operating periods are contained in the ProjectData worksheet in the
18 This report is available at no cost from the National Renewable Energy Laboratory (NREL) at www.nrel.gov/publications.
model under Payroll Parameters. Wage rates are based on the following Standard Occupational Classifications (SOC) derived from the U.S. Department of Labor, Bureau of Labor Statistics12:
• Electrical Power-Line Installers and Repairers (SOC code 49-9051)
• Electronics Repairers, Powerhouse, Substation, and Relay (SOC code 49-2095)
• Operating Engineers and Other Construction Equipment Operators (SOC code 47-2073).
Users may override the labor cost defaults in the advanced model option and input their own labor costs.
12 See Hourly Mean Wage Data, Bureau of Labor Statistics, http://data.bls.gov/oes/.
19 This report is available at no cost from the National Renewable Energy Laboratory (NREL) at www.nrel.gov/publications.
7 Model Review and Testing The Transmission Line JEDI Model has undergone both peer review and internal testing. Base default data (line items, costs, and local content) were reviewed both internally by NREL and Black & Veatch and externally by members of the academic community and transmission line industry. In each instance, feedback on both the inputs and preliminary results was solicited and incorporated into the model.
20 This report is available at no cost from the National Renewable Energy Laboratory (NREL) at www.nrel.gov/publications.
Resources Bureau of Labor Statistics, U.S. Department of Labor. (2012). “Occupational Employment and Wage Estimates.” Accessed Mary 2013: http://www.bls.gov/oes/current/oessrcst.htm.
Western Renewable Energy Zones (WREZ) Transmission Model. Western Governors’ Association. Accessed June 2013: http://www.westgov.org.