Embed Size (px)
Citation preview
Transmission Utilization Group
COI Utilization Report May 04, 2011
1
Executive Summary
In 2010 the Transmission Utilization Group (TUG), composed of owners of the California-Oregon
Intertie (COI), began work to determine how the COI has been utilized in the recent past. The joint
effort consisted of analyzing the past five years of usage data, transmission reservation and
scheduling timelines, and transmission rates associated with the COI. In addition, TUG held a public
COI user group meeting to receive input as to the factors influencing COI usage and the obstacles
preventing higher utilization.
Based on the analyses and observations identified below, TUG reached the following conclusions
regarding the potential for increasing COI transmission availability and usage:
Entities that need firm delivery will require new transmission capacity.
New long term transmission capacity would allow the generators and California utilities to
enter into power purchase agreements, obtain financing, and have certainty of power
deliveries.
Pacific Northwest and California entities should cooperate and consider moving forward with
an Open Season process to determine the demand and interest for additional transmission.
The COI has multiple owners and parties with scheduling rights on both sides of the California
Oregon Border (COB). Pacific Northwest (PNW) parties own and operate the COI north of COB and
Pacific Southwest (PSW) parties own and operate the COI south of COB. The California ISO
(CAISO) is the southern path operator and the Bonneville Power Administration (BPA) is the northern
path operator. Three balancing authorities, CAISO, BPA and Sacramento Municipal Utility District
intersect at the northern end of COI (Malin and Captain Jack substations). This regional diversity in
ownership and operational differences provide market opportunities/challenges and influence the
COI utilization.
The TUG analysis determined that the COI is fully subscribed on a long-term basis north of COB in
the north-to-south direction and is heavily utilized during peak months. Limited amounts of short-term
firm and non-firm transmission north of COB are available on a real-time basis. Specific conclusions
are:
2
COI utilization varies significantly year-to-year depending on seasonal and market factors.
Variability in the spring hydro run-off in terms of volume, shaping, and duration, produce
vastly different yearly profiles. Similarly, monthly variability in the summer months is driven by
California load, i.e., higher temperatures. COI usage increased each year from 2006 to 2008.
In 2009, the usage dropped back to the 2006 levels (likely driven by the recession and lower
than normal hydro run-off). The body of the report analyzes details of these trends.
Without additional transmission capacity to move energy into California during a high wind-
high water event such as occurred in June 2010, generation in the Pacific Northwest,
including wind resources, will have to be displaced or curtailed to maintain system reliability.
Analysis of the five-year usage data shows that the price spread between the PNW’s Mid-
Columbia (Mid-C) and California’s NP15 trading hubs appears to be the most significant
driver for the usage of the COI. As the price spread between the two hubs increases, usage
increases to the point that the COI is fully utilized.
Historical usage is highest in the summer months when the loads in California peak, and
during the spring months when high hydro runoff in the PNW make excess energy available.
During the five-year period, high utilization (90 percent or higher of the scheduling limit)
occurred in 30 percent of the “heavy load” hours (between hours ending 0700 and 2200)
during the summer season, and 32 percent of heavy load hours during the spring high hydro
runoff months.
The COI is frequently unavailable at the full 4800 MW scheduling limit due to various system
constraints over the five-year period. During the spring high hydro runoff months, the
scheduling limit on the COI was often reduced due to planned maintenance outages. COI
owners currently coordinate outages to generally occur in the spring because physical access
is easier and to prepare the lines for the critical summer months. The COI owners should
look at spreading the outages between the spring and fall, or other times of the year, to
maximize the available capacity and COI utilization during the spring high hydro runoff. Other
system constraints that limit the 4800 MW capacity include interaction with other WECC
Paths and northern California hydro generation. BPA is undertaking system improvement
projects that will boost reliability and allow more power transfers between Oregon and
California.
3
The public meeting held with COI users was informative. Participants gave the following
suggestions:
The users agreed that utilization of the COI is very seasonal, highly dependent on factors
such as weather, hydro conditions and loads within each region, and mainly driven by the
price spread between the two regions, which at a minimum must cover variable costs, e.g.
transmission wheeling and losses.
COI users also indicated that the transmission resale market is improving and recommended
that BPA remove its price cap for resale. BPA is actively examining how it can provide
market pricing flexibility for transmission resale in a manner that will also provide a
safety net for consumers. BPA has also posted its newly proposed Business Practice (BP)
for customers’ comments.
Although there are some disparities between the CAISO market and PNW transmission
providers’ reservation and scheduling timelines, most of the users said that neither
scheduling timelines nor transmission rates prevent market transactions. COI users also
indicated that there is sufficient access to the COI for short term transactions.
Some merchants expressed concern over unknown costs when doing business with the
CAISO market compared to bilateral markets, although market bids can limit their cost
exposure. Another observation from a merchant noted that energy prices at COB have been
much closer to Mid-C prices than NP-15 prices, indicating much smaller Mid-C to COB price
spreads compared to COB to NP-15 spreads. An in-depth market structure analysis would
be needed if the TUG desires to further understand the relationship between the energy
markets and COI utilization.
The users requested more dynamic transfer availability between the regions (both to John
Day and from John Day to COB), which may also increase the utilization of the COI. At
present BPA and CAISO are evaluating the potential for intra-hour scheduling on the COI as
a pilot project. The CAISO is now completing a stakeholder process to add dynamic
transfers to its existing market functionality. CAISO has included a technical study concluding
that the CAISO does not have limitations in its transmission capability to support dynamic
transfers of intermittent resources. BPA, CAISO, and other organizations in the PNW are
supporting recently initiated dynamic transfer capability studies, through the Dynamic
Transfer Capability Task Force convened by the Wind Integration Study Team.
COl users commented that more incentives are necessary (structurally) from the regulators
and policy makers for delivering renewable resources to California.
4
Merchants would like to use both firm and non-firm transmission equally for power purchase
agreements.
Pro-rata real-time curtailment at COI can result in further curtailments at COI, as COI OTC is
reduced, and curtailments are implemented. The COI users recommend that BAs and
operators should investigate changes in pro-rata tag curtailment procedures.
COl users asked Transmission Service Providers to remain vigilant to ensure that minimal
seams issues exist in the future.
5
Table of Contents
1. Introduction ..................................................................................................................................... 6
2. COI Description .............................................................................................................................. 6
a. PACI .......................................................................................................................................... 6
b. COTP ......................................................................................................................................... 6
c. Path Rating ................................................................................................................................ 6
i. Relationship between COI and COI/NW-Sierra SOL ............................................................ 8
ii. Hemingway - Summer Lake Flows ....................................................................................... 9
iii. Northern California Hydro Generation ................................................................................. 10
iv. Northern California Load ..................................................................................................... 11
d. COI Operation.......................................................................................................................... 11
e. COI Improvement Project ........................................................................................................ 11
3. COI Ownership and Entitlement ................................................................................................... 12
a. Ownership North of COB ......................................................................................................... 12
b. Ownership South of COB ........................................................................................................ 12
4. Data and Information .................................................................................................................... 14
a. Historical Usage Data .............................................................................................................. 14
b. Scheduling Timelines .............................................................................................................. 15
c. Transmission Rates ................................................................................................................. 15
d. Merchant Input ......................................................................................................................... 15
5. Results and Discussion ................................................................................................................ 16
a. Tabular Representation of Utilization ...................................................................................... 17
b. Graphical Representation of Utilization ................................................................................... 19
c. Variability in Utilization - Drivers and Sources ......................................................................... 21
d. Quantification of Relationship to Market Drivers ..................................................................... 26
e. Scheduling Timelines .............................................................................................................. 31
i. Transmission Reservations ................................................................................................. 31
ii. Release of Unused Transmission ....................................................................................... 31
f. Transmission Rates ................................................................................................................. 31
g. Discussion of Merchant Input .................................................................................................. 35
i. What factors do you consider when doing business on the COI? ...................................... 35
ii. What Barriers Keep You from Doing COI Business? ......................................................... 35
iii. What Changes Would Help You Use the COI More Efficiently?......................................... 36
iv. How do you feel about the quantity and quality of transmission available? ........................ 37
v. Other Comments ................................................................................................................. 37
6. Conclusion and Recommendations ............................................................................................. 37
6
1. Introduction
The California-Oregon Intertie (COI) owners and operators began meeting in early 2010 to discuss alternatives for increasing the transmission availability across the California Oregon Border (COB). The goal is to access renewable resource projects in the Pacific Northwest (PNW) and deliver that energy to northern and central California. The Steering Committee, representatives of the COI owners, established the Transmission Utilization Group (TUG) whose mission was to achieve an understanding of the current utilization of the COI transmission capability and to make recommendations on how to increase the utilization if possible. Long-term firm transmission in the North-to-South direction on the COI, north of COB, is fully subscribed. Limited amounts of short-term firm and non-firm transmission are made available on a real-time basis. TUG’s work principally consisted of an analysis of the historic usage of the COI going back to 2005, collection of rate information, scheduling timelines, and information from merchants on both how they currently use the COI and possible changes that could increase the usage of the COI. The joint TUG effort was conducted under the guidance of the Steering Committee and coordinated by the Western Area Power Administration (WAPA) with support from Bonneville Power Administration (BPA), California ISO (CAISO), BC Hydro, PacifiCorp (PAC), Portland General Electric (PGE), Pacific Gas and Electric (PG&E), Sacramento Municipal Utility District (SMUD), and Transmission Agency of Northern California (TANC).
2. COI Description
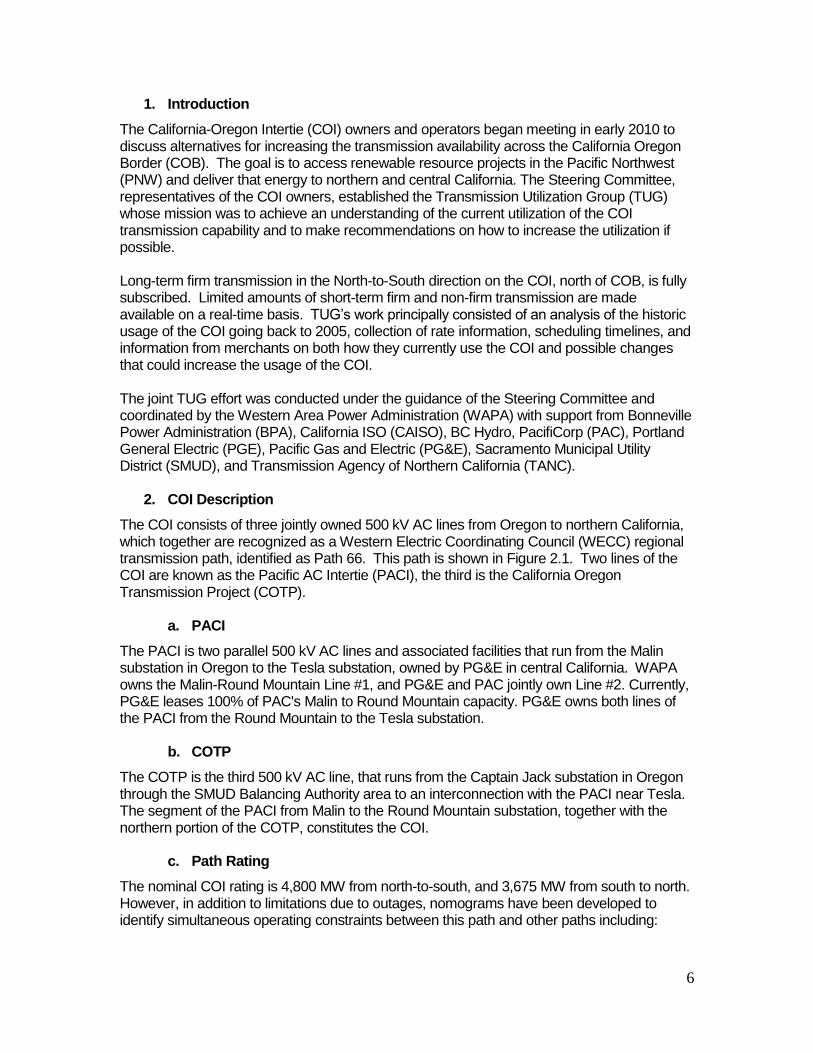
The COI consists of three jointly owned 500 kV AC lines from Oregon to northern California, which together are recognized as a Western Electric Coordinating Council (WECC) regional transmission path, identified as Path 66. This path is shown in Figure 2.1. Two lines of the COI are known as the Pacific AC Intertie (PACI), the third is the California Oregon Transmission Project (COTP).
a. PACI
The PACI is two parallel 500 kV AC lines and associated facilities that run from the Malin substation in Oregon to the Tesla substation, owned by PG&E in central California. WAPA owns the Malin-Round Mountain Line #1, and PG&E and PAC jointly own Line #2. Currently, PG&E leases 100% of PAC's Malin to Round Mountain capacity. PG&E owns both lines of the PACI from the Round Mountain to the Tesla substation.
b. COTP
The COTP is the third 500 kV AC line, that runs from the Captain Jack substation in Oregon through the SMUD Balancing Authority area to an interconnection with the PACI near Tesla. The segment of the PACI from Malin to the Round Mountain substation, together with the northern portion of the COTP, constitutes the COI.
c. Path Rating
The nominal COI rating is 4,800 MW from north-to-south, and 3,675 MW from south to north. However, in addition to limitations due to outages, nomograms have been developed to identify simultaneous operating constraints between this path and other paths including:
7
The Pacific DC Intertie (Path 65),
The North of John Day (Path 73),
Hemingway-Summer Lake (Path 75), and
Borah West (Path 17). Other factors that affect operating conditions are:
Northern California hydro generation,
Other northern California generation,
Northern California load,
Northwest hydro and thermal generation dispatch,
Northwest load levels, and
Reno-Alturas (Path 76 or NW-Sierra) flow.
Figure 2.1: The three COI lines, also known as Path 66.
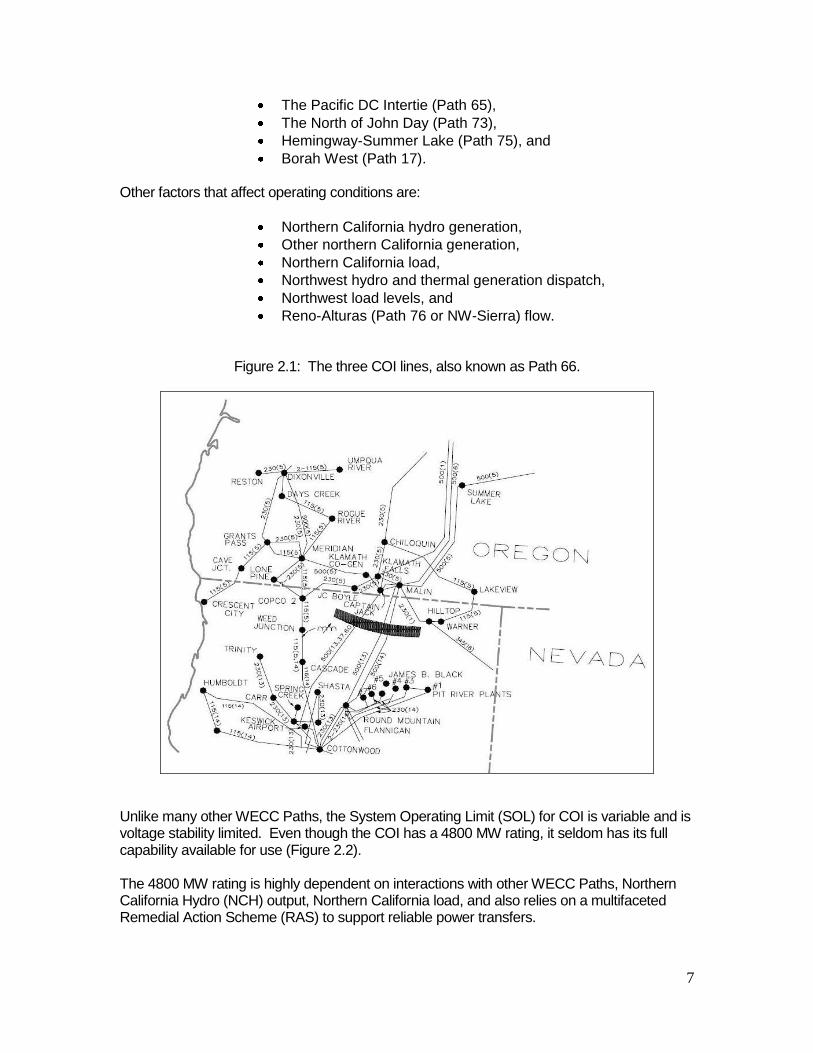
Unlike many other WECC Paths, the System Operating Limit (SOL) for COI is variable and is voltage stability limited. Even though the COI has a 4800 MW rating, it seldom has its full capability available for use (Figure 2.2). The 4800 MW rating is highly dependent on interactions with other WECC Paths, Northern California Hydro (NCH) output, Northern California load, and also relies on a multifaceted Remedial Action Scheme (RAS) to support reliable power transfers.
8
The Bonneville Power Administration (BPA) is responsible for monitoring system conditions in the Northwest. The California Independent System Operator (CAISO) is responsible for monitoring system conditions in California.
Figure 2.2 – 2009 Hourly COI Limits
i. Relationship between COI and COI/NW-Sierra SOL
Although commonly referred to as simply the “COI”, it is actually operated in conjunction with the parallel NW-Sierra 345 kV line1 (WECC Path 76). Both path operators on either side of COB, CAISO and BPA, have operating procedures that reference COI as “COI/NW-Sierra” and include the following statements:
The COI SOL (SW section of AC Intertie) and the COI/NW-Sierra SOL (NW section of AC Intertie) will be equal. Studies have shown that 1 MW on the NW-Sierra path is approximately equal to 1 MW on the COI. Consequently, for nomogram and outage conditions, the system is always operated safely if the sum of the COI and NW-Sierra path (COI/NW-Sierra) is operated within limits defined for COI prior to energization of the NW-Sierra path.
Since the NW-Sierra path has a maximum rating of 300 MW, the maximum capability of COI/ NW-Sierra is limited to 4800 MW. Whenever the NW-Sierra path is using its full 300 MW, the COI limit maximum is reduced to 4500 MW. Conversely, when the NW-Sierra path is out of service, COI can be scheduled up to its maximum seasonal SOL of 4800 MW.
1 Also known as the Reno- Alturas line.
9
ii. Hemingway - Summer Lake Flows
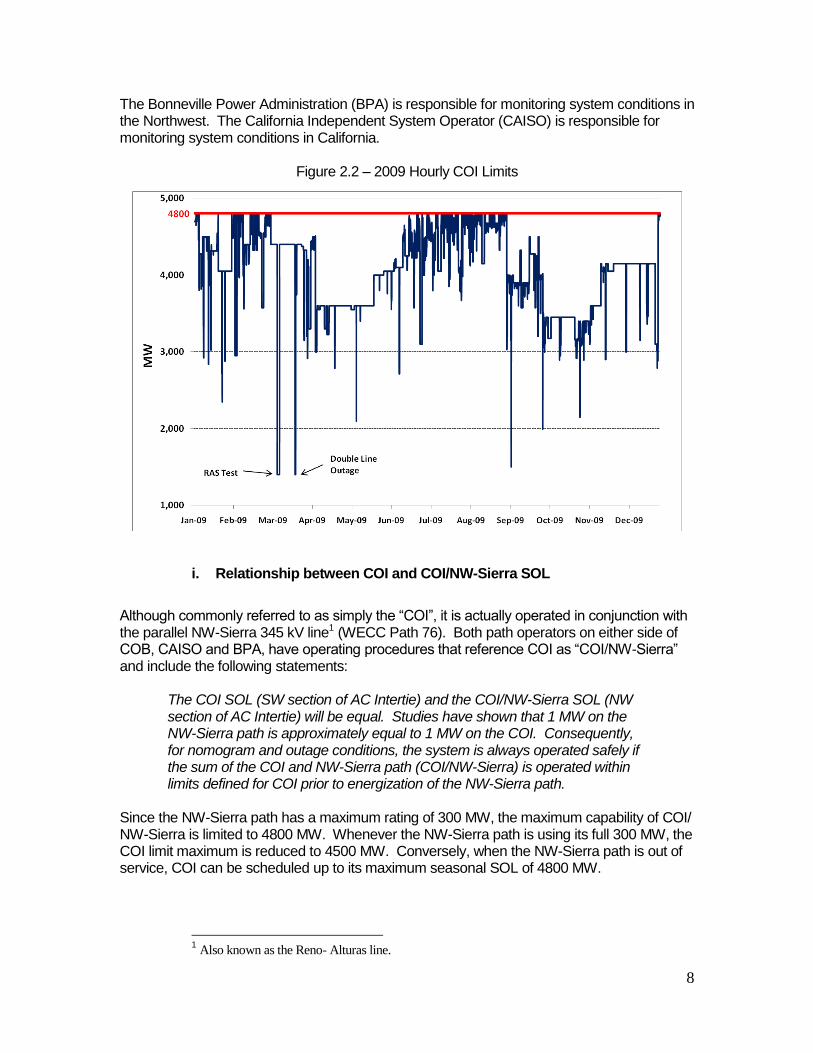
The COI/NW-Sierra SOL is also dependent on the actual flow from Hemingway2, a station in Idaho, to Summer Lake, located in southern Oregon (WECC Path 75). Based on the magnitude and flow direction, the CAISO may derate the COI/NW-Sierra by up to 100 MW. BPA also monitors the actual flow on Path 75 using the nomogram in Figure 2.3. BPA may also derate COI/NW-Sierra based on North of John Day (NJD) WECC Path 73 flow. As can be seen from the nomogram, COI/NW-Sierra cannot exceed 4225 MW when NJD reaches 7300 MW and Hemingway – Summer Lake is 400 MW west to east.
Figure 2.3: Path 75 Nomogram
2 Previous metering point was Midpoint
10
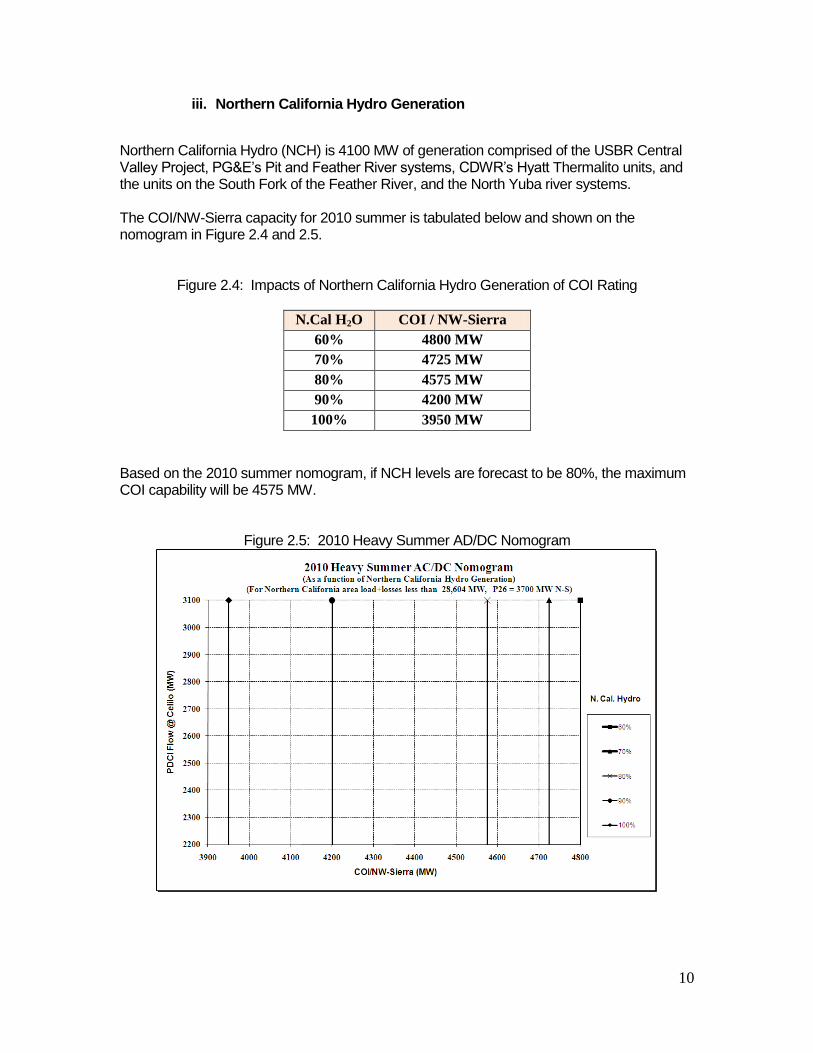
iii. Northern California Hydro Generation
Northern California Hydro (NCH) is 4100 MW of generation comprised of the USBR Central Valley Project, PG&E’s Pit and Feather River systems, CDWR’s Hyatt Thermalito units, and the units on the South Fork of the Feather River, and the North Yuba river systems. The COI/NW-Sierra capacity for 2010 summer is tabulated below and shown on the nomogram in Figure 2.4 and 2.5.
Figure 2.4: Impacts of Northern California Hydro Generation of COI Rating
N.Cal H2O COI / NW-Sierra
60% 4800 MW
70% 4725 MW
80% 4575 MW
90% 4200 MW
100% 3950 MW
Based on the 2010 summer nomogram, if NCH levels are forecast to be 80%, the maximum COI capability will be 4575 MW.
Figure 2.5: 2010 Heavy Summer AD/DC Nomogram
11
iv. Northern California Load
If Northern California Area Load (PG&E, SMUD and TID Balancing Authorities) is greater than 28,604 MW3, the COI/NW-Sierra limit is curtailed by 15 MW for every 100 MW that Northern California area Load is expected to exceed this level.
d. COI Operation
Coordinated operation of the COI is currently accomplished through the Owners’ Coordinated Operations Agreement (OCOA). Under the Agreement for Use of Transmission Capacity among PG&E, PacifiCorp, Southern California Edison Company, and San Diego Gas & Electric Company, PG&E has placed the entire eastern line under the operational control of the CAISO. This was pursuant to the Transmission Control Agreement between the CAISO and PG&E. The CAISO also manages a portion of the transmission rights on Western’s facilities, and Western receives rights from Round Mountain to Tesla, pursuant to the Transmission Exchange Agreement. Through the California-Oregon Intertie Path Operating Agreement, the CAISO is the southern path operator and BPA the Pacific Northwest (PNW) path operator. Three balancing authorities intersect at the northern end of COI (Malin and Captain Jack substations), with the BPA balancing authority area containing the lines north of Malin, the CAISO balancing authority area containing the PACI, and the SMUD balancing authority area containing COTP. Among other matters, the balancing authorities must:
approve, validate and confirm interchange schedules,
confirm ramping capabilities with Interchange Authorities,
make dispatch adjustments so as not to exceed transmission facility limits,
coordinate system restoration plans with transmission operators,
coordinate with generators and load-serving entities within their balancing authority areas regarding their operational status, plans, and availability,
receive real-time operating information from and provide real-time operating information to transmission operators and adjacent balancing authorities,
implement instructions from the applicable Reliability Coordinator,
direct resources to take action to manage congestion and ensure system balance,
implement emergency procedures and system restoration plans, and comply with NERC reliability standards.
e. COI Improvement Project
In response to a growing demand for the COI North to South transmission capacity, BPA and the Northwest COI owners decided to undertake system improvement projects that will boost the system’s overall reliability and allow more electricity to move between Oregon and California. Although the COI is rated at 4,800 MW, it frequently is not available at its full capacity due to various conditions that constrain the system. For these reasons BPA held out a certain amount of capacity from sale in order to avoid frequent curtailments. After conducting studies on the situation, it was concluded that installing new high-voltage equipment at several critical
3 Seasonal value; 2010 summer limit shown
12
bottlenecks in the transmission system would reinforce the COI so it can operate at full capacity more frequently and under a wider range of conditions. BPA began the construction of COI reinforcement project in 2008 and it is scheduled to be completed in the late spring of 2011. The estimated cost for this project is $63.5 million and each of the COI owners in the Northwest shared a portion of the total cost, based on their percentage of ownership of the system. Subsequently, this reinforcement project allowed BPA to offer additional long-term transmission service to its customers.
3. COI Ownership and Entitlement
The COI has multiple owners and parties with scheduling rights on both sides of the California Oregon Border (COB). Pacific Northwest parties own and operate the COI north of COB and Pacific Southwest parties own and operate the COI south of COB. The COI transmission capacity in the north-to-south (N>S) direction to COB is fully subscribed on a long-term basis.
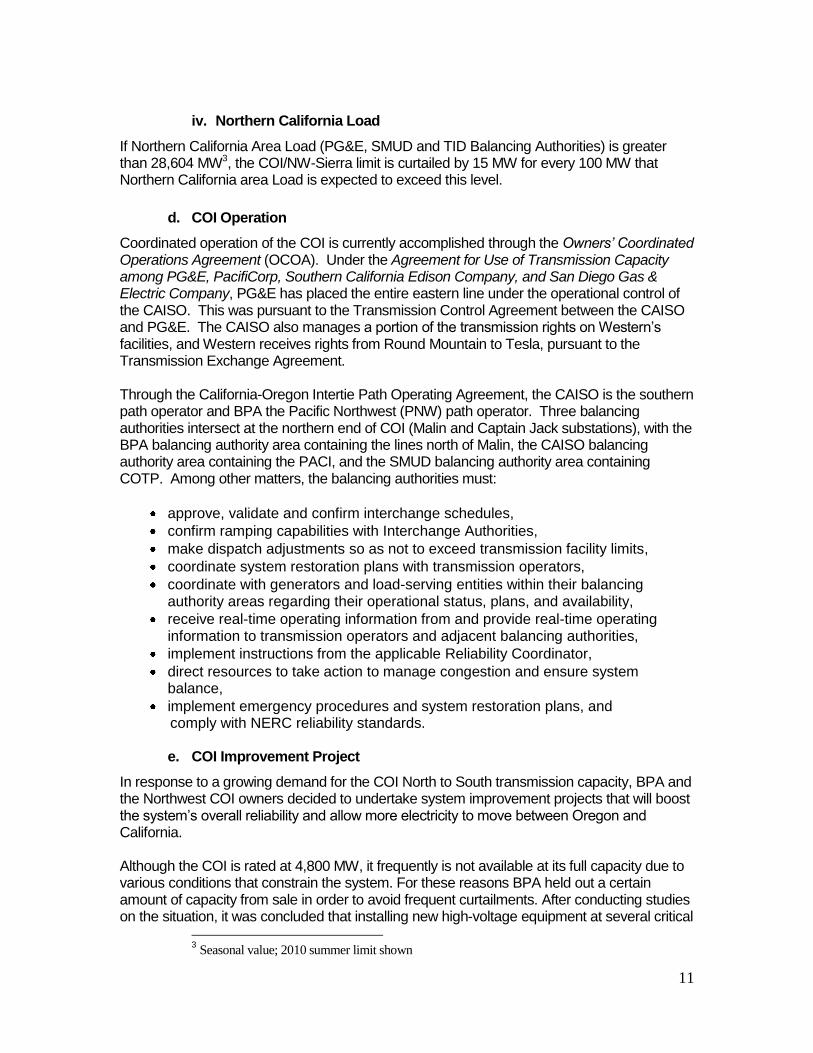
a. Ownership North of COB
The COI north of COB is shared by Facility and Capacity Owners. The Facility Owners are BPA, PAC and PGE. These parties jointly own both the physical facilities and capacity of the COI north of COB. Unlike the Facility Owners, Capacity Owners only have capacity rights on the COI. These owners include Puget Sound Energy (Puget), Seattle City Light (Seattle), Pacific Northwest Generating Cooperative (PNGC), Snohomish County PUD (Snohomish), Tacoma Power (Tacoma) and PAC. These capacity rights have been purchased from BPA’s capacity share. Both Facility and Capacity Owners retain their rights to their shares for the life of the COI facilities. Figure 3.1 below shows each party's percentage (ownership and/or capacity rights) on the COI north of COB. The BPA’s share is the amount remaining after 725 MW were sold to the Capacity Owners. Each party can re-sell their firm transmission rights on a long-term or short-term basis, or a combination of both. The majority of the firm capacity that is not scheduled by firm contract holders is available for sale as non-firm hourly via BPA and other transmission provider’s OASIS.
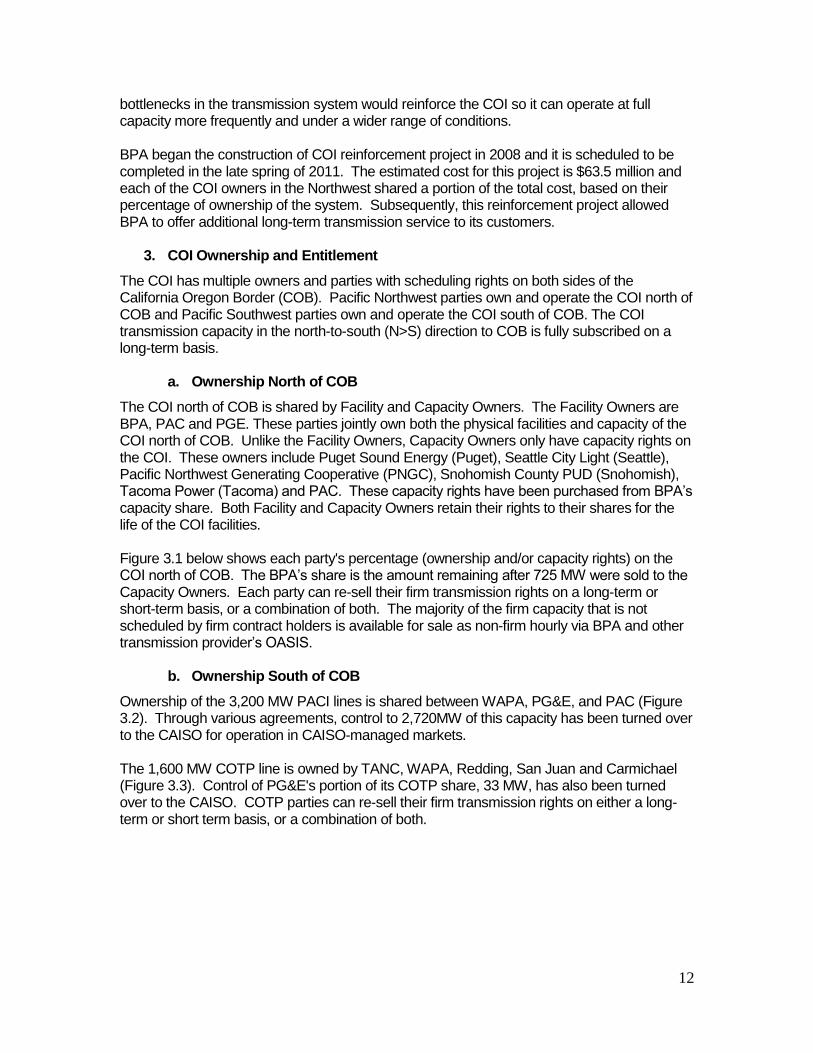
b. Ownership South of COB
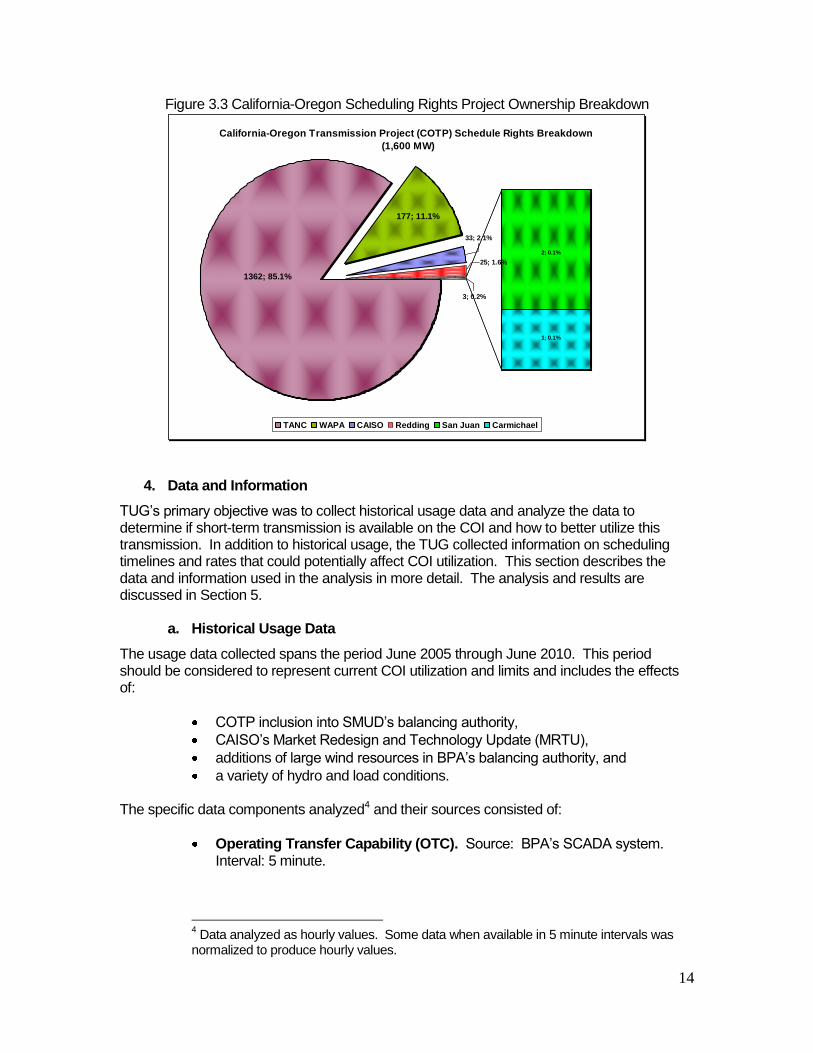
Ownership of the 3,200 MW PACI lines is shared between WAPA, PG&E, and PAC (Figure 3.2). Through various agreements, control to 2,720MW of this capacity has been turned over to the CAISO for operation in CAISO-managed markets. The 1,600 MW COTP line is owned by TANC, WAPA, Redding, San Juan and Carmichael (Figure 3.3). Control of PG&E's portion of its COTP share, 33 MW, has also been turned over to the CAISO. COTP parties can re-sell their firm transmission rights on either a long-term or short term basis, or a combination of both.
13
Figure 3.1 North of COB Ownership Breakdown
Figure 3.2 Pacific AC Intertie Scheduling Rights Breakdown
14
Figure 3.3 California-Oregon Scheduling Rights Project Ownership Breakdown
California-Oregon Transmission Project (COTP) Schedule Rights Breakdown
(1,600 MW)
177; 11.1%
3; 0.2%
1362; 85.1%
25; 1.6%
33; 2.1%
2; 0.1%
1; 0.1%
TANC WAPA CAISO Redding San Juan Carmichael
4. Data and Information
TUG’s primary objective was to collect historical usage data and analyze the data to determine if short-term transmission is available on the COI and how to better utilize this transmission. In addition to historical usage, the TUG collected information on scheduling timelines and rates that could potentially affect COI utilization. This section describes the data and information used in the analysis in more detail. The analysis and results are discussed in Section 5.
a. Historical Usage Data
The usage data collected spans the period June 2005 through June 2010. This period should be considered to represent current COI utilization and limits and includes the effects of:
COTP inclusion into SMUD’s balancing authority,
CAISO’s Market Redesign and Technology Update (MRTU),
additions of large wind resources in BPA’s balancing authority, and
a variety of hydro and load conditions. The specific data components analyzed4 and their sources consisted of:
Operating Transfer Capability (OTC). Source: BPA’s SCADA system. Interval: 5 minute.
4 Data analyzed as hourly values. Some data when available in 5 minute intervals was
normalized to produce hourly values.
15
Scheduling Limit. Source: BPA’s Real Time Operations and Dispatch and Scheduling (RODS) database. Interval: Hourly. The scheduling limit reflects operational constraints on the COI for that hour.
COI North-to-South Limit. Source: Derived value for the COI utilization analysis, TUG agreed to use this hourly value as a definition of limit. The value is the lower of the OTC or the Scheduling limit during that hour.
Scheduling Data. Source: BPA's RODS. Interval: Hourly. The sum of the scheduling data for the PACI, COTP, Dynamic Scheduling Capacity, Reno Alturas Transmission System (RATS) Intertie schedules. The individual hourly schedules are the net of north-to-south and south-to-north schedules.
Dynamic Schedules. Source: BPA's SCADA. Interval: 5 minute. The total scheduling value for dynamically scheduled generation.
Loop Flows. Source: BPA's RODS. Interval: Hourly.
Metered Data. Source: BPA's RODS. Interval: Hourly. Metered data on the COI is a measurement of the physical flows that occurred on that hour including all scheduled generation and loop flows.
COI North-to-South Usage. Source: Derived. Interval: Hourly. For the purposes of the utilization analysis, North-to-South Usage is defined as the greater of the Scheduling Data or the Metered Data during each hour. Hours that have a net S-N usage are excluded in the COI utilization analysis. On all other hours S-N schedules and flows were netted against N-S information.
Energy Prices. Source: Intercontinental Exchange (ICE), CAISO. Interval: Daily.
Load. Source: BPA’s RODS, CAISO. Interval: Hourly. Although California load data does not include load in the SMUD control area, it gives a reasonable load shape and characteristic for the analysis.
Streamflows. Source: BPA’s RODS. Interval: Hourly. Streamflow at The Dalles provides a good proxy for Northwest hydroelectric generation.
b. Scheduling Timelines
TUG gathered and compared information on the scheduling and transmission reservation timelines for each of the Transmission Service Providers (TSP) on COI including BPA, CAISO, PGE, SMUD, TANC, and WAPA. The specific timeline and scheduling information consisted of:
Daily and hourly requirements for firm and non-firm transmission
Release of unused transmission (both firm and non-firm)
E-tag submission timelines (pre-schedule and real-time submission)
c. Transmission Rates
The transmission rate information collected was limited to non-firm rates, since long-term firm service is fully subscribed.
d. Merchant Input
In conjunction with the historical data analysis, feedback was solicited from the merchant COI users regarding their experiences with the COI usage. A public meeting notice was
16
coordinated and posted on each of the COI TSP’s OASIS. In addition, a meeting notice was sent to the merchants via BPA Tech Forum. As part of these notices, a set of relevant questions relating to the COI usage was provided prior to the meeting. The merchant meeting took place on September 22, 2010 at the Portland Airport. Care was taking during the preparation and meeting to avoid potential FERC Standards of Conduct issues. A broad based audience participated in the meeting; including representatives from merchants, regional utilities, transmission providers, NW public agencies, IOUs, wind developers, FERC, Oregon Public Utilities Commission (OPUC), and consultants representing both developers and utilities.
5. Results and Discussion
To determine historical levels of COI utilization, analysis was performed on a five year plus one month data set. The analysis indicated that there is a high level of utilization on the COI when market conditions are favorable. These periods of high utilization tend to coincide with spring months, when the Pacific Northwest (PNW) is experiencing high levels of hydroelectric run-off; and with the summer months, when California loads are high. During these seasons increasingly high price spreads between CA and the PNW strongly correlated with increased COI utilization. The analyzed data spans the period June 1, 2005 through June 30, 2010. The data is organized and grouped in the following manner:
HLH = Heavy Load Hour between hour ending 0700 and 2200
LLH = Light Load Hour between hour ending 2300 and 0600
Sundays and WECC Holidays are excluded from the 24-hour utilization profiles
COI Reservations = Total Schedules over the AC Intertie + RATS
COI Actual Usage = Metered flow that includes actual Dynamic Schedule flows and Loop Flows + RATS
COI N-S Usage = Max (COI Actual Usage or COI Reservation)
COI N-S Limit = Min (COI OTC or N-S Schedule Limit)
COI N-S Availability = COI N-S Limit less COI N-S Usage
Hours of net south-to-north COI flows were excluded from the data Categories were established, with the amount of COI utilization based on the ratio of the hourly COI N-S Usage to hourly COI N-S Limit. The categories are:
High (90% or above),
Medium (between 50% to 90%), and
Low (50% or below). Finally, seasonal groupings were created and are defined as:
Summer (California summer from July to September)
Hydro Run-Off (Northwest hydro run-off from April to June)
Other (from October to March)
All (all hours, regardless of season)
17
a. Tabular Representation of Utilization
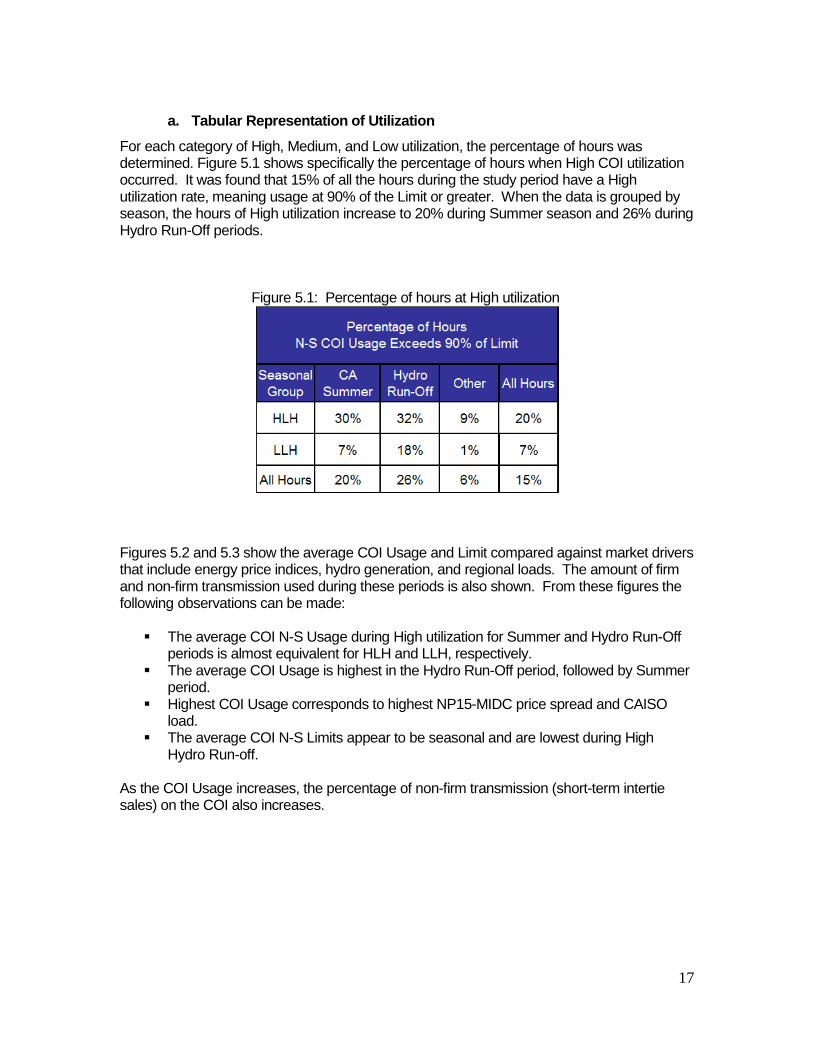
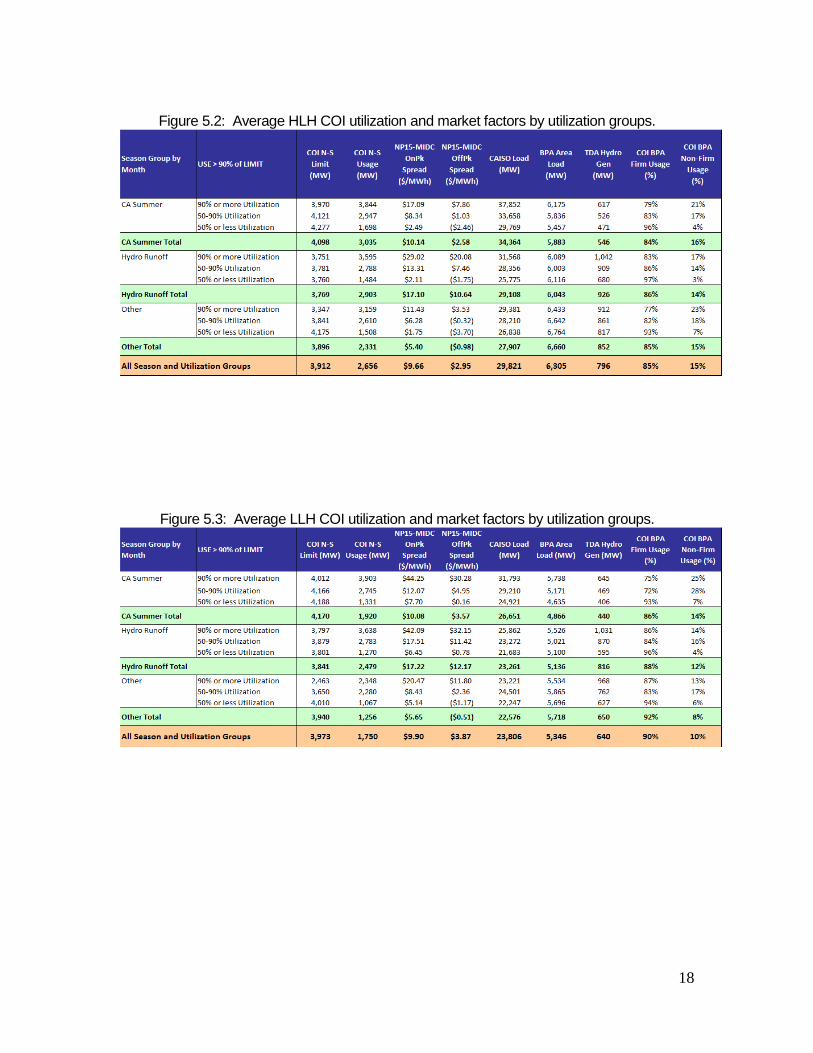
For each category of High, Medium, and Low utilization, the percentage of hours was determined. Figure 5.1 shows specifically the percentage of hours when High COI utilization occurred. It was found that 15% of all the hours during the study period have a High utilization rate, meaning usage at 90% of the Limit or greater. When the data is grouped by season, the hours of High utilization increase to 20% during Summer season and 26% during Hydro Run-Off periods.
Figure 5.1: Percentage of hours at High utilization
Figures 5.2 and 5.3 show the average COI Usage and Limit compared against market drivers that include energy price indices, hydro generation, and regional loads. The amount of firm and non-firm transmission used during these periods is also shown. From these figures the following observations can be made:
The average COI N-S Usage during High utilization for Summer and Hydro Run-Off periods is almost equivalent for HLH and LLH, respectively.
The average COI Usage is highest in the Hydro Run-Off period, followed by Summer period.
Highest COI Usage corresponds to highest NP15-MIDC price spread and CAISO load.
The average COI N-S Limits appear to be seasonal and are lowest during High Hydro Run-off.
As the COI Usage increases, the percentage of non-firm transmission (short-term intertie sales) on the COI also increases.
18
Figure 5.2: Average HLH COI utilization and market factors by utilization groups.
Figure 5.3: Average LLH COI utilization and market factors by utilization groups.
19
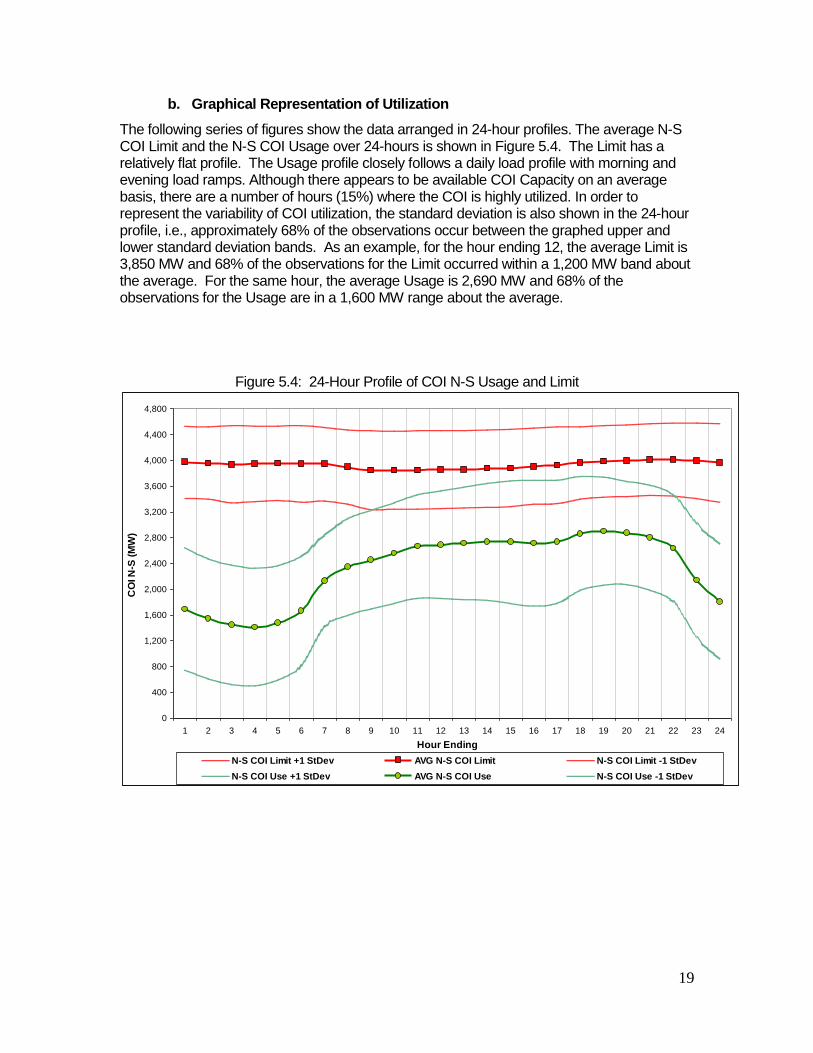
b. Graphical Representation of Utilization
The following series of figures show the data arranged in 24-hour profiles. The average N-S COI Limit and the N-S COI Usage over 24-hours is shown in Figure 5.4. The Limit has a relatively flat profile. The Usage profile closely follows a daily load profile with morning and evening load ramps. Although there appears to be available COI Capacity on an average basis, there are a number of hours (15%) where the COI is highly utilized. In order to represent the variability of COI utilization, the standard deviation is also shown in the 24-hour profile, i.e., approximately 68% of the observations occur between the graphed upper and lower standard deviation bands. As an example, for the hour ending 12, the average Limit is 3,850 MW and 68% of the observations for the Limit occurred within a 1,200 MW band about the average. For the same hour, the average Usage is 2,690 MW and 68% of the observations for the Usage are in a 1,600 MW range about the average.
Figure 5.4: 24-Hour Profile of COI N-S Usage and Limit
0
400
800
1,200
1,600
2,000
2,400
2,800
3,200
3,600
4,000
4,400
4,800
1 2 3 4 5 6 7 8 9 10 11 12 13 14 15 16 17 18 19 20 21 22 23 24
Hour Ending
CO
I N
-S (
MW
)
N-S COI Limit +1 StDev AVG N-S COI Limit N-S COI Limit -1 StDev
N-S COI Use +1 StDev AVG N-S COI Use N-S COI Use -1 StDev
20
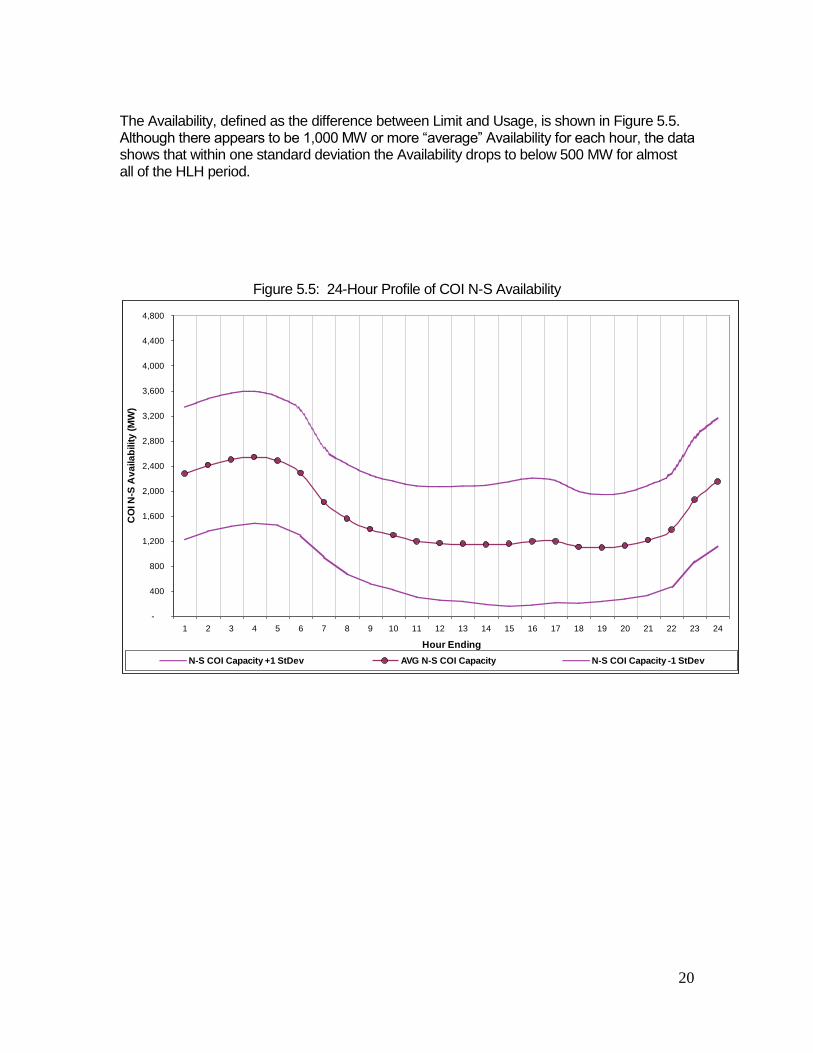
The Availability, defined as the difference between Limit and Usage, is shown in Figure 5.5. Although there appears to be 1,000 MW or more “average” Availability for each hour, the data shows that within one standard deviation the Availability drops to below 500 MW for almost all of the HLH period.
Figure 5.5: 24-Hour Profile of COI N-S Availability
-
400
800
1,200
1,600
2,000
2,400
2,800
3,200
3,600
4,000
4,400
4,800
1 2 3 4 5 6 7 8 9 10 11 12 13 14 15 16 17 18 19 20 21 22 23 24
Hour Ending
CO
I N
-S A
va
ila
bilit
y (
MW
)
N-S COI Capacity +1 StDev AVG N-S COI Capacity N-S COI Capacity -1 StDev
21
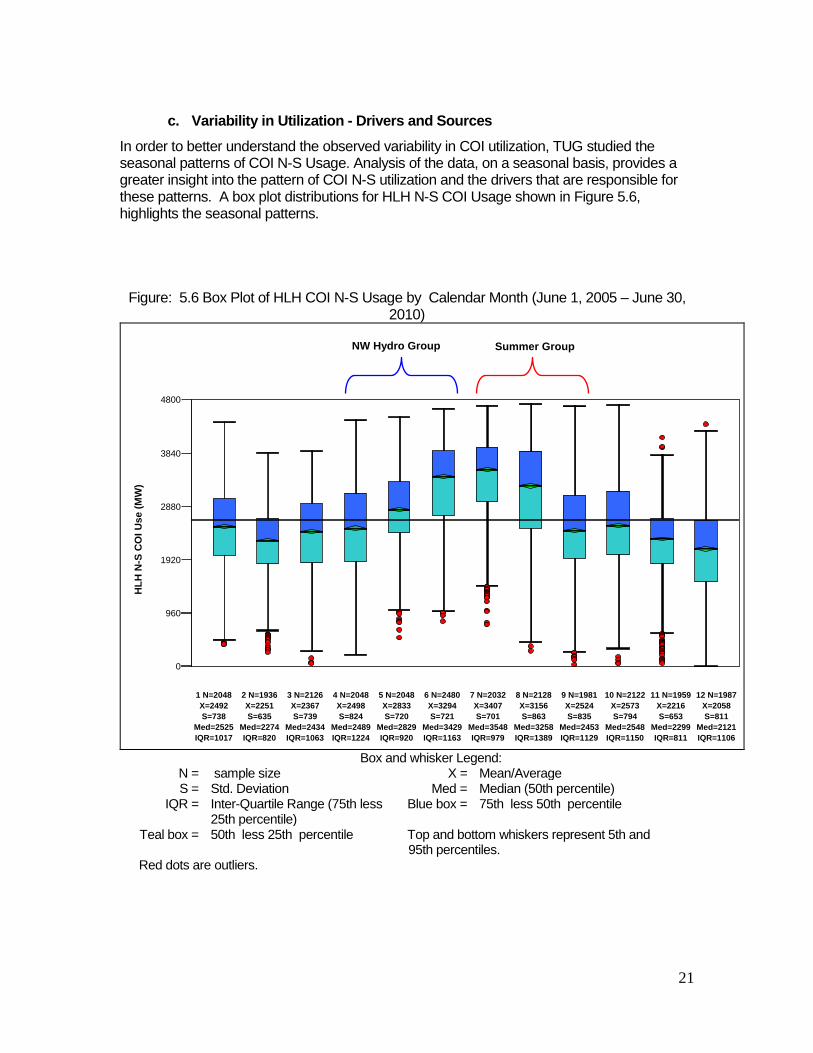
c. Variability in Utilization - Drivers and Sources
In order to better understand the observed variability in COI utilization, TUG studied the seasonal patterns of COI N-S Usage. Analysis of the data, on a seasonal basis, provides a greater insight into the pattern of COI N-S utilization and the drivers that are responsible for these patterns. A box plot distributions for HLH N-S COI Usage shown in Figure 5.6, highlights the seasonal patterns.
Figure: 5.6 Box Plot of HLH COI N-S Usage by Calendar Month (June 1, 2005 – June 30, 2010)
01000
2000
3000
4000
1 N=2048
X=2492
S=738
Med=2525
IQR=1017
2 N=1936
X=2251
S=635
Med=2274
IQR=820
3 N=2126
X=2367
S=739
Med=2434
IQR=1063
4 N=2048
X=2498
S=824
Med=2489
IQR=1224
5 N=2048
X=2833
S=720
Med=2829
IQR=920
6 N=2480
X=3294
S=721
Med=3429
IQR=1163
7 N=2032
X=3407
S=701
Med=3548
IQR=979
8 N=2128
X=3156
S=863
Med=3258
IQR=1389
9 N=1981
X=2524
S=835
Med=2453
IQR=1129
10 N=2122
X=2573
S=794
Med=2548
IQR=1150
11 N=1959
X=2216
S=653
Med=2299
IQR=811
12 N=1987
X=2058
S=811
Med=2121
IQR=1106
HL
H N
-S C
OI
Us
e (
MW
)
0
960
1920
2880
3840
4800
NW Hydro Group Summer Group
Box and whisker Legend:
N = sample size X = Mean/Average S = Std. Deviation Med = Median (50th percentile) IQR = Inter-Quartile Range (75th less
25th percentile) Blue box = 75th less 50th percentile
Teal box = 50th less 25th percentile Top and bottom whiskers represent 5th and 95th percentiles.
Red dots are outliers.
22
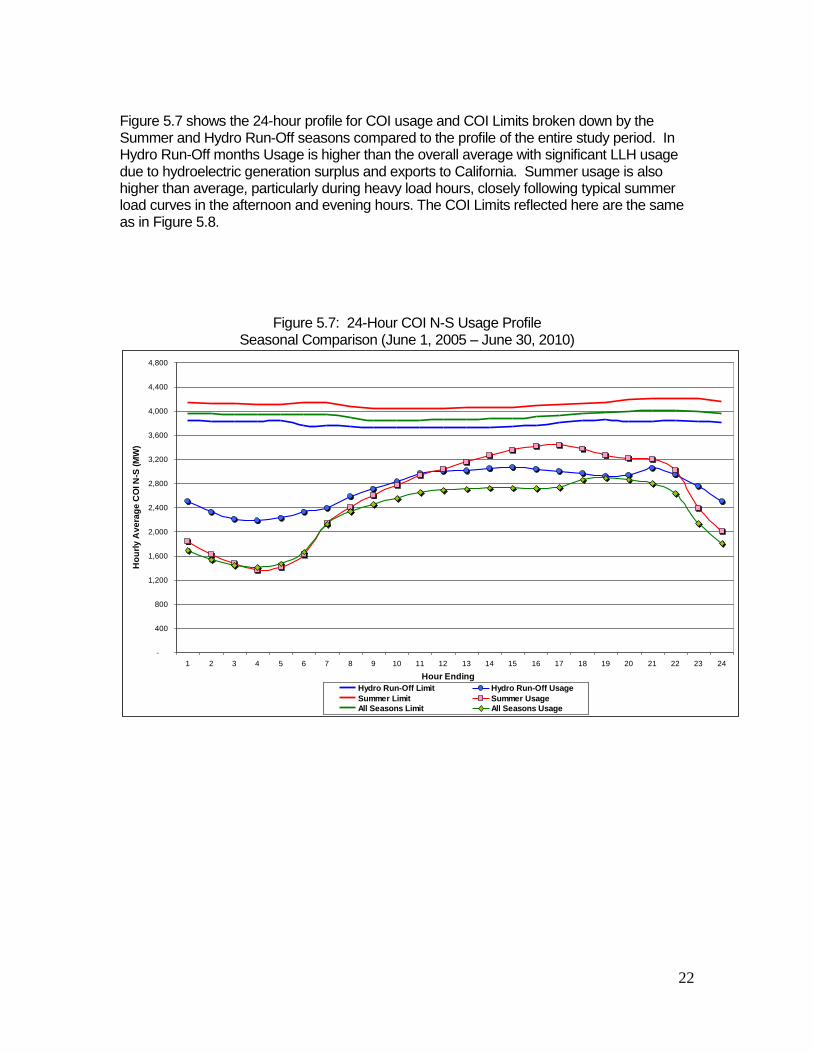
Figure 5.7 shows the 24-hour profile for COI usage and COI Limits broken down by the Summer and Hydro Run-Off seasons compared to the profile of the entire study period. In Hydro Run-Off months Usage is higher than the overall average with significant LLH usage due to hydroelectric generation surplus and exports to California. Summer usage is also higher than average, particularly during heavy load hours, closely following typical summer load curves in the afternoon and evening hours. The COI Limits reflected here are the same as in Figure 5.8.
Figure 5.7: 24-Hour COI N-S Usage Profile Seasonal Comparison (June 1, 2005 – June 30, 2010)
-
400
800
1,200
1,600
2,000
2,400
2,800
3,200
3,600
4,000
4,400
4,800
1 2 3 4 5 6 7 8 9 10 11 12 13 14 15 16 17 18 19 20 21 22 23 24
Hour Ending
Ho
url
y A
ve
rag
e C
OI N
-S (
MW
)
Hydro Run-Off Limit Hydro Run-Off Usage
Summer Limit Summer Usage
All Seasons Limit All Seasons Usage
23
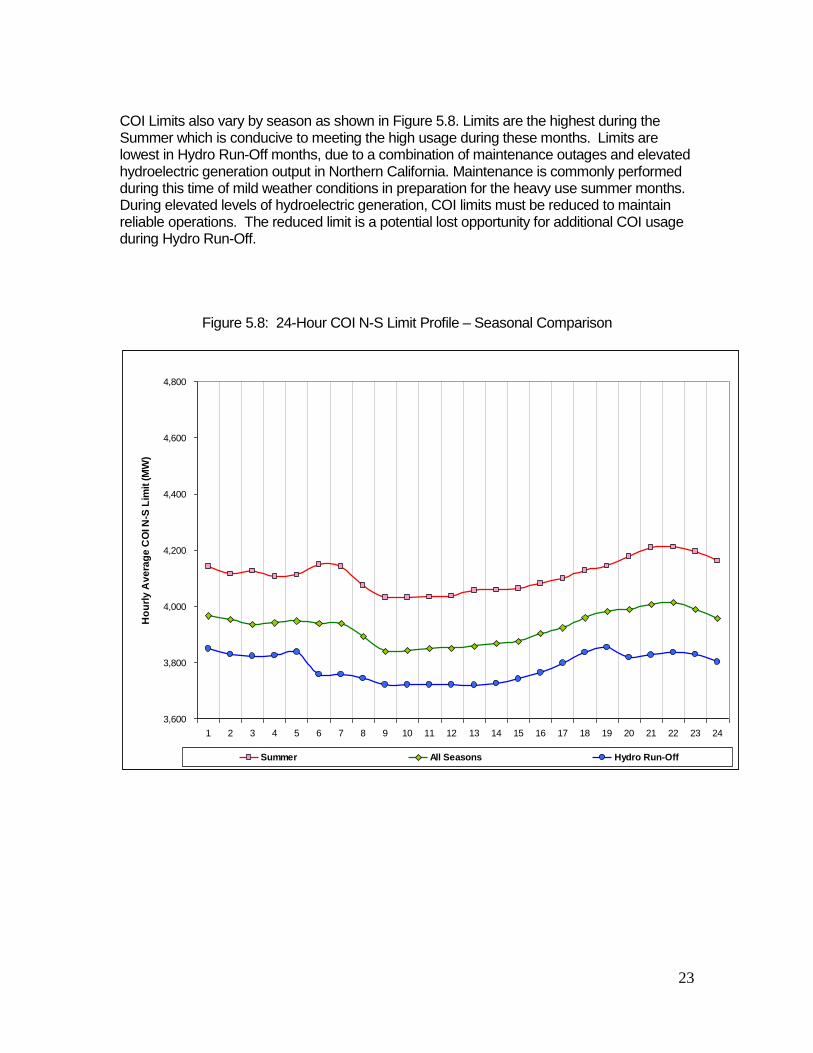
COI Limits also vary by season as shown in Figure 5.8. Limits are the highest during the Summer which is conducive to meeting the high usage during these months. Limits are lowest in Hydro Run-Off months, due to a combination of maintenance outages and elevated hydroelectric generation output in Northern California. Maintenance is commonly performed during this time of mild weather conditions in preparation for the heavy use summer months. During elevated levels of hydroelectric generation, COI limits must be reduced to maintain reliable operations. The reduced limit is a potential lost opportunity for additional COI usage during Hydro Run-Off.
Figure 5.8: 24-Hour COI N-S Limit Profile – Seasonal Comparison
3,600
3,800
4,000
4,200
4,400
4,600
4,800
1 2 3 4 5 6 7 8 9 10 11 12 13 14 15 16 17 18 19 20 21 22 23 24
Ho
url
y A
ve
rag
e C
OI N
-S L
imit
(M
W)
Summer All Seasons Hydro Run-Off
24
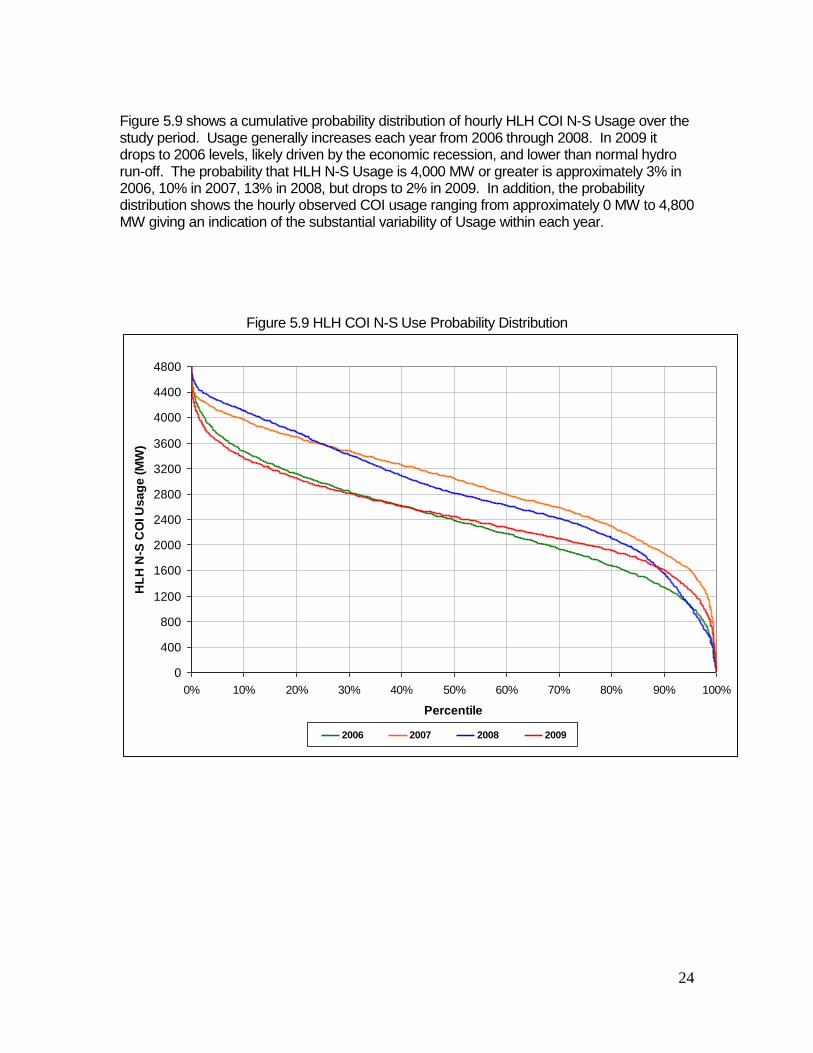
Figure 5.9 shows a cumulative probability distribution of hourly HLH COI N-S Usage over the study period. Usage generally increases each year from 2006 through 2008. In 2009 it drops to 2006 levels, likely driven by the economic recession, and lower than normal hydro run-off. The probability that HLH N-S Usage is 4,000 MW or greater is approximately 3% in 2006, 10% in 2007, 13% in 2008, but drops to 2% in 2009. In addition, the probability distribution shows the hourly observed COI usage ranging from approximately 0 MW to 4,800 MW giving an indication of the substantial variability of Usage within each year.
Figure 5.9 HLH COI N-S Use Probability Distribution
0
400
800
1200
1600
2000
2400
2800
3200
3600
4000
4400
4800
0% 10% 20% 30% 40% 50% 60% 70% 80% 90% 100%
Percentile
HL
H N
-S C
OI U
sa
ge
(M
W)
2006 2007 2008 2009
25
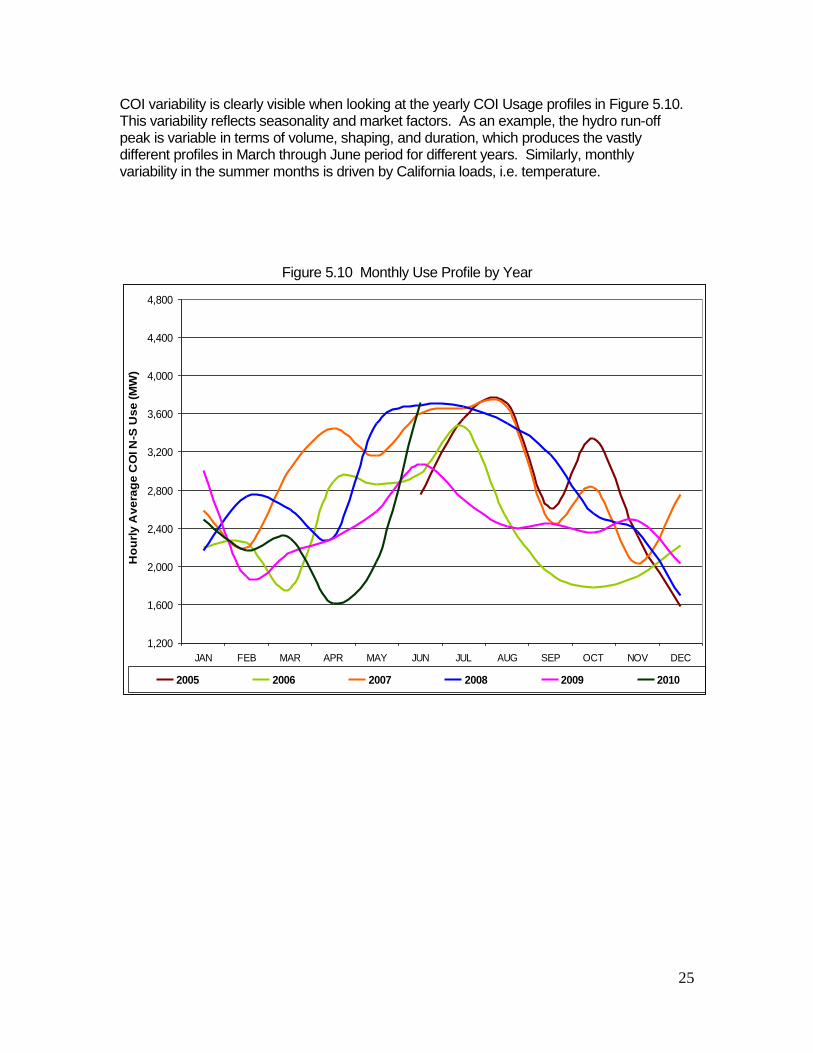
COI variability is clearly visible when looking at the yearly COI Usage profiles in Figure 5.10. This variability reflects seasonality and market factors. As an example, the hydro run-off peak is variable in terms of volume, shaping, and duration, which produces the vastly different profiles in March through June period for different years. Similarly, monthly variability in the summer months is driven by California loads, i.e. temperature.
Figure 5.10 Monthly Use Profile by Year
1,200
1,600
2,000
2,400
2,800
3,200
3,600
4,000
4,400
4,800
JAN FEB MAR APR MAY JUN JUL AUG SEP OCT NOV DEC
Ho
url
y A
ve
rag
e C
OI N
-S U
se
(M
W)
2005 2006 2007 2008 2009 2010
26
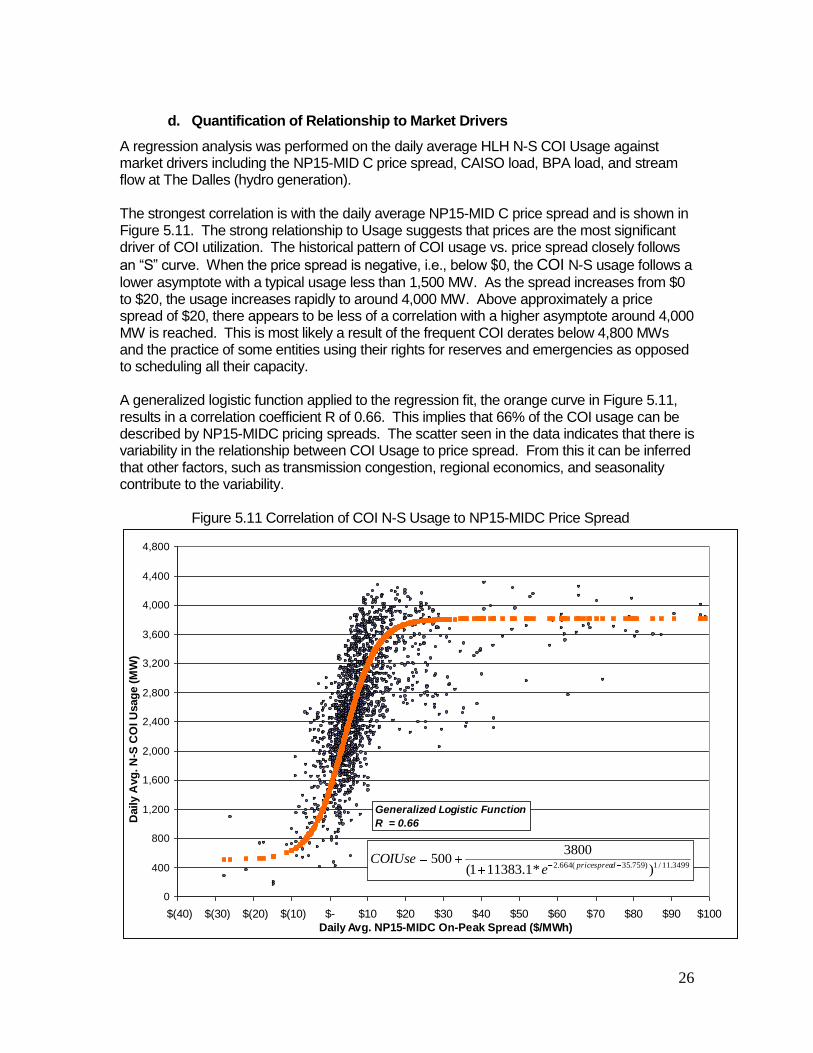
d. Quantification of Relationship to Market Drivers
A regression analysis was performed on the daily average HLH N-S COI Usage against market drivers including the NP15-MID C price spread, CAISO load, BPA load, and stream flow at The Dalles (hydro generation). The strongest correlation is with the daily average NP15-MID C price spread and is shown in Figure 5.11. The strong relationship to Usage suggests that prices are the most significant driver of COI utilization. The historical pattern of COI usage vs. price spread closely follows
an “S” curve. When the price spread is negative, i.e., below $0, the COI N-S usage follows a
lower asymptote with a typical usage less than 1,500 MW. As the spread increases from $0 to $20, the usage increases rapidly to around 4,000 MW. Above approximately a price spread of $20, there appears to be less of a correlation with a higher asymptote around 4,000 MW is reached. This is most likely a result of the frequent COI derates below 4,800 MWs and the practice of some entities using their rights for reserves and emergencies as opposed to scheduling all their capacity. A generalized logistic function applied to the regression fit, the orange curve in Figure 5.11, results in a correlation coefficient R of 0.66. This implies that 66% of the COI usage can be described by NP15-MIDC pricing spreads. The scatter seen in the data indicates that there is variability in the relationship between COI Usage to price spread. From this it can be inferred that other factors, such as transmission congestion, regional economics, and seasonality contribute to the variability.
Figure 5.11 Correlation of COI N-S Usage to NP15-MIDC Price Spread
0
400
800
1,200
1,600
2,000
2,400
2,800
3,200
3,600
4,000
4,400
4,800
$(40) $(30) $(20) $(10) $- $10 $20 $30 $40 $50 $60 $70 $80 $90 $100
Daily Avg. NP15-MIDC On-Peak Spread ($/MWh)
Daily A
vg
. N
-S C
OI U
sag
e (
MW
)
Generalized Logistic Function
R = 0.66
3499.11/1)759.35(664.2 )*1.113831(
3800500
dpricespreaeCOIUse
27
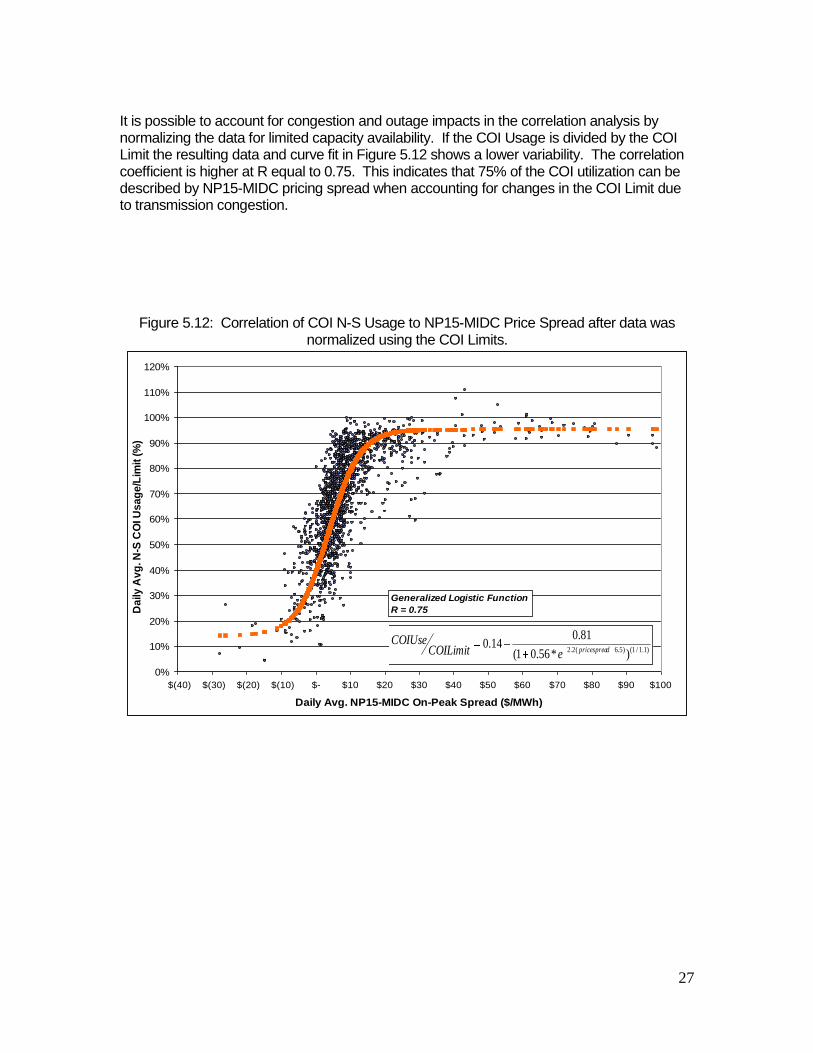
It is possible to account for congestion and outage impacts in the correlation analysis by normalizing the data for limited capacity availability. If the COI Usage is divided by the COI Limit the resulting data and curve fit in Figure 5.12 shows a lower variability. The correlation coefficient is higher at R equal to 0.75. This indicates that 75% of the COI utilization can be described by NP15-MIDC pricing spread when accounting for changes in the COI Limit due to transmission congestion.
Figure 5.12: Correlation of COI N-S Usage to NP15-MIDC Price Spread after data was normalized using the COI Limits.
0%
10%
20%
30%
40%
50%
60%
70%
80%
90%
100%
110%
120%
$(40) $(30) $(20) $(10) $- $10 $20 $30 $40 $50 $60 $70 $80 $90 $100
Daily Avg. NP15-MIDC On-Peak Spread ($/MWh)
Da
ily
Av
g. N
-S C
OI U
sa
ge
/Lim
it (
%)
Generalized Logistic Function
R = 0.75
)1.1/1()5.6(2.2 )*56.01(
81.014.0
dpricespreaeCOILimitCOIUse
28
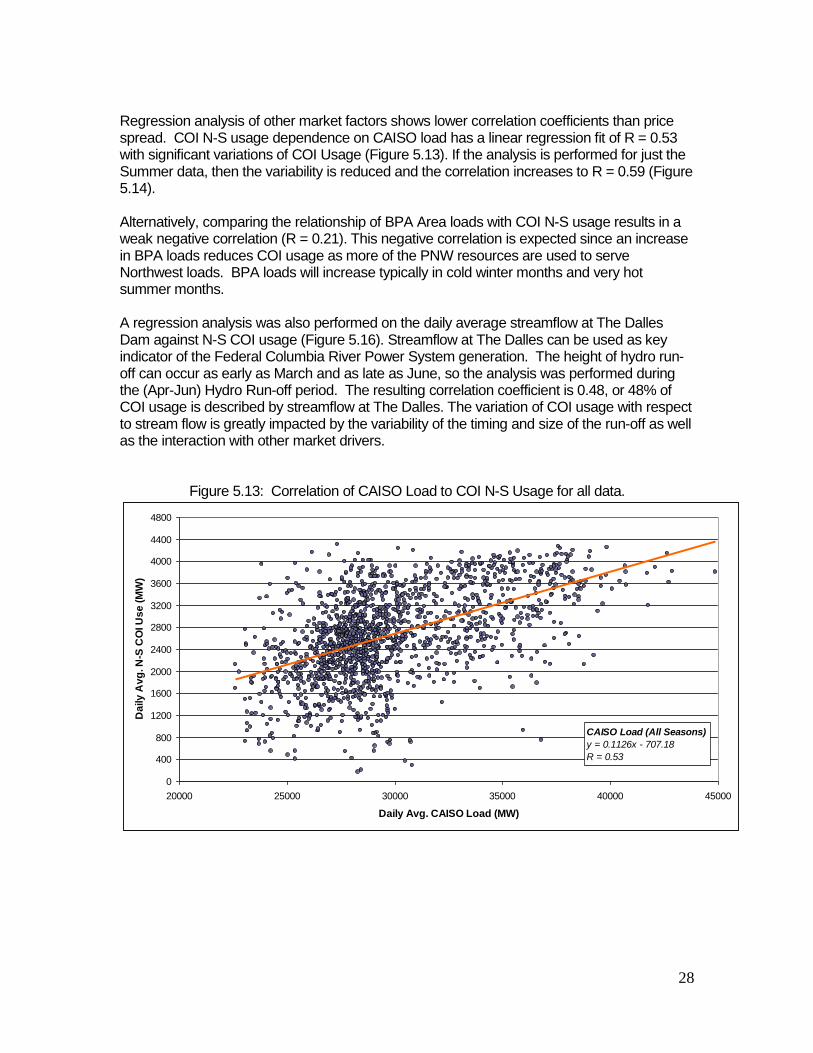
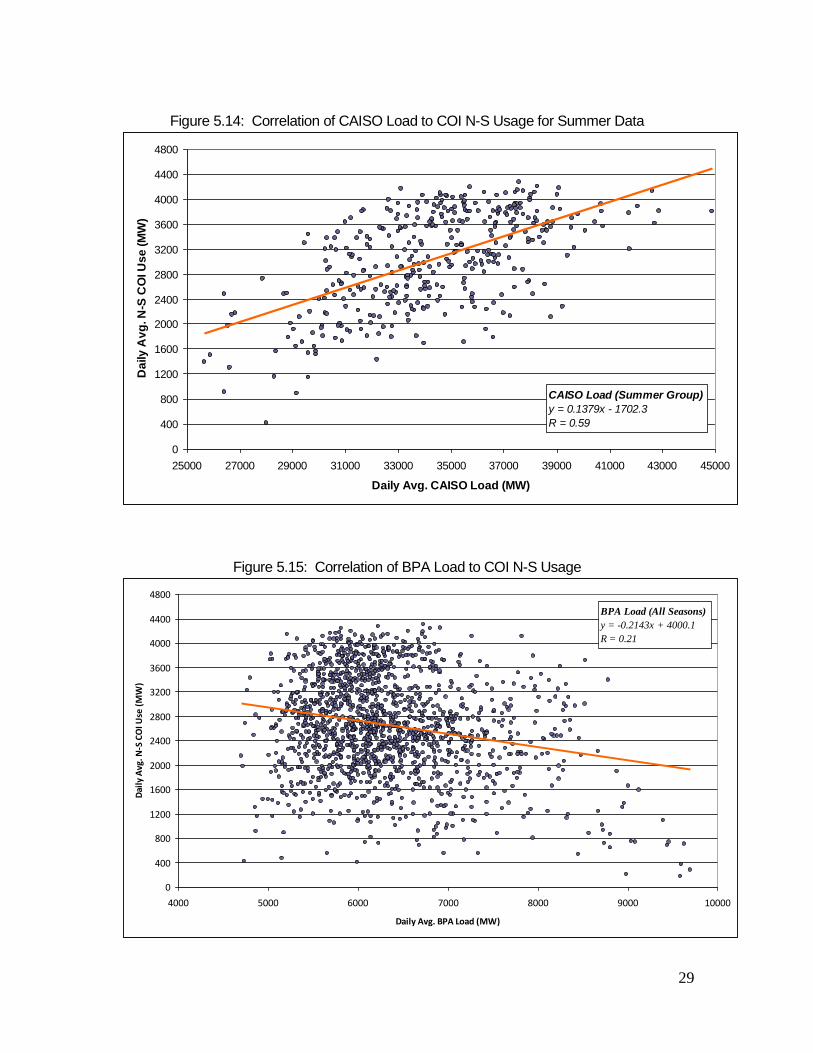
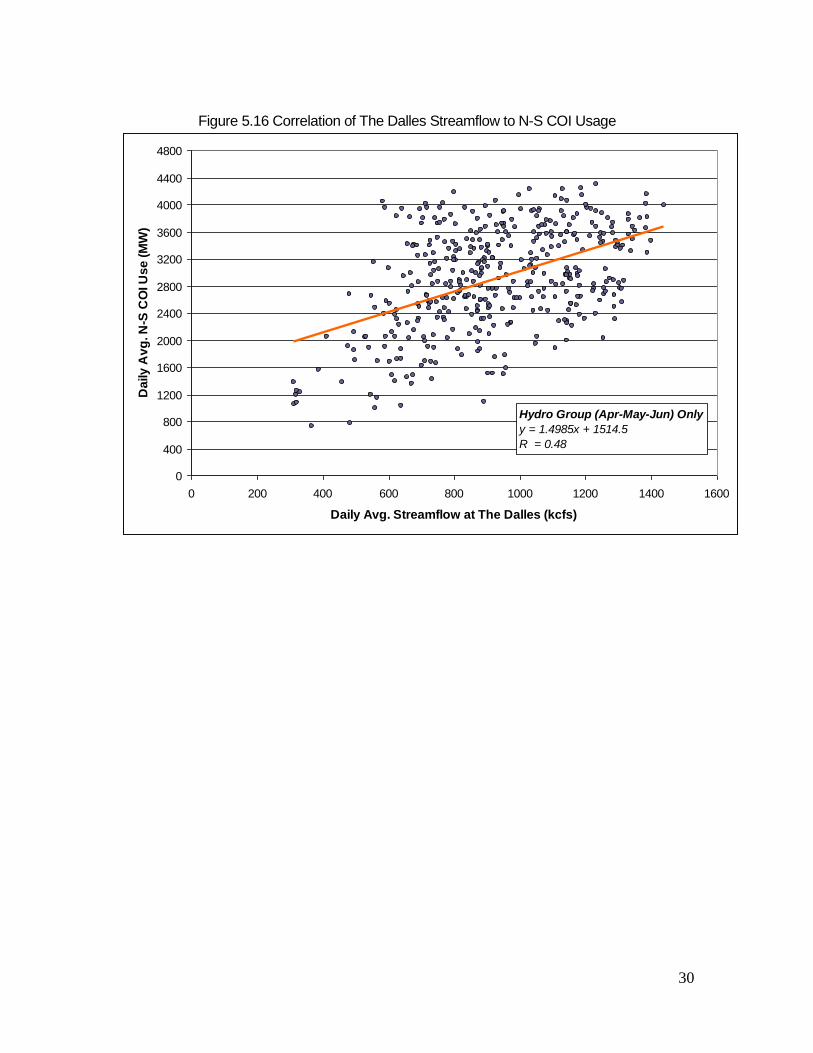
Regression analysis of other market factors shows lower correlation coefficients than price spread. COI N-S usage dependence on CAISO load has a linear regression fit of R = 0.53 with significant variations of COI Usage (Figure 5.13). If the analysis is performed for just the Summer data, then the variability is reduced and the correlation increases to R = 0.59 (Figure 5.14). Alternatively, comparing the relationship of BPA Area loads with COI N-S usage results in a weak negative correlation (R = 0.21). This negative correlation is expected since an increase in BPA loads reduces COI usage as more of the PNW resources are used to serve Northwest loads. BPA loads will increase typically in cold winter months and very hot summer months. A regression analysis was also performed on the daily average streamflow at The Dalles Dam against N-S COI usage (Figure 5.16). Streamflow at The Dalles can be used as key indicator of the Federal Columbia River Power System generation. The height of hydro run-off can occur as early as March and as late as June, so the analysis was performed during the (Apr-Jun) Hydro Run-off period. The resulting correlation coefficient is 0.48, or 48% of COI usage is described by streamflow at The Dalles. The variation of COI usage with respect to stream flow is greatly impacted by the variability of the timing and size of the run-off as well as the interaction with other market drivers.
Figure 5.13: Correlation of CAISO Load to COI N-S Usage for all data.
CAISO Load (All Seasons)
y = 0.1126x - 707.18
R = 0.53
0
400
800
1200
1600
2000
2400
2800
3200
3600
4000
4400
4800
20000 25000 30000 35000 40000 45000
Daily Avg. CAISO Load (MW)
Da
ily
Av
g. N
-S C
OI U
se
(M
W)
29
Figure 5.14: Correlation of CAISO Load to COI N-S Usage for Summer Data
CAISO Load (Summer Group)
y = 0.1379x - 1702.3
R = 0.59
0
400
800
1200
1600
2000
2400
2800
3200
3600
4000
4400
4800
25000 27000 29000 31000 33000 35000 37000 39000 41000 43000 45000
Daily Avg. CAISO Load (MW)
Da
ily
Av
g. N
-S C
OI U
se
(M
W)
Figure 5.15: Correlation of BPA Load to COI N-S Usage
BPA Load (All Seasons)
y = -0.2143x + 4000.1
R = 0.21
0
400
800
1200
1600
2000
2400
2800
3200
3600
4000
4400
4800
4000 5000 6000 7000 8000 9000 10000
Daily Avg. BPA Load (MW)
Dai
ly A
vg. N
-S C
OI U
se (
MW
)
30
Figure 5.16 Correlation of The Dalles Streamflow to N-S COI Usage
Hydro Group (Apr-May-Jun) Only
y = 1.4985x + 1514.5
R = 0.48
0
400
800
1200
1600
2000
2400
2800
3200
3600
4000
4400
4800
0 200 400 600 800 1000 1200 1400 1600
Daily Avg. Streamflow at The Dalles (kcfs)
Da
ily
Av
g. N
-S C
OI U
se
(M
W)
31
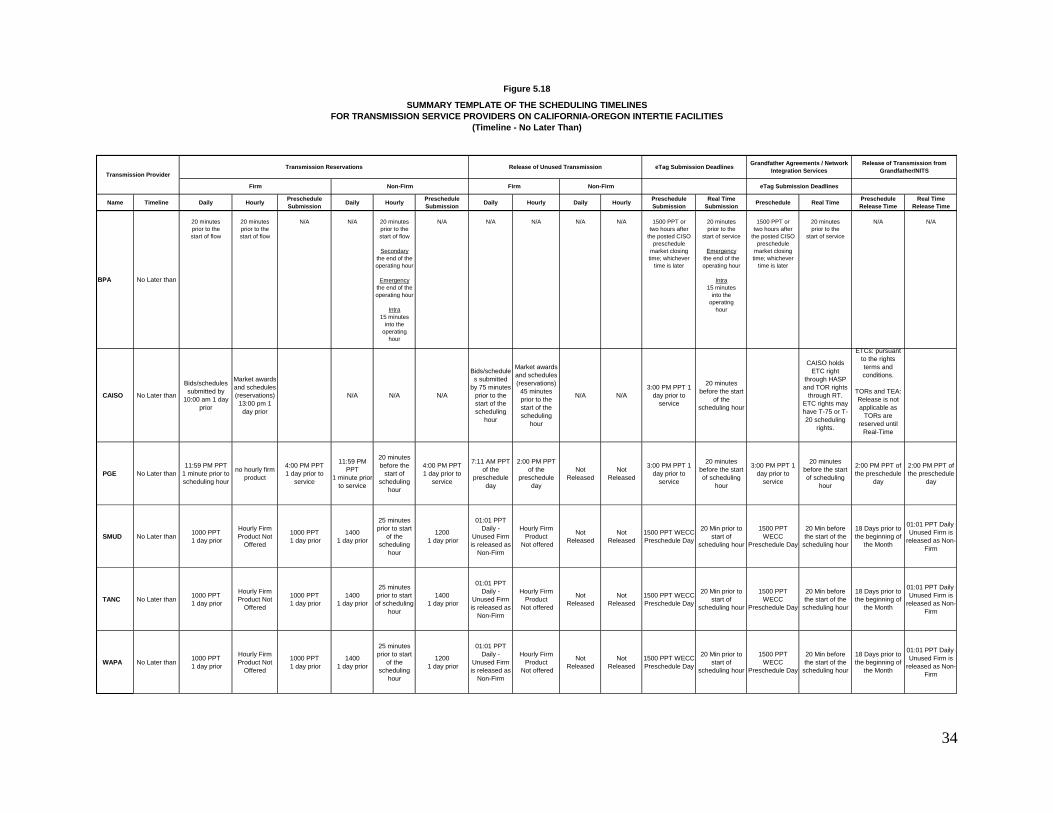
e. Scheduling Timelines
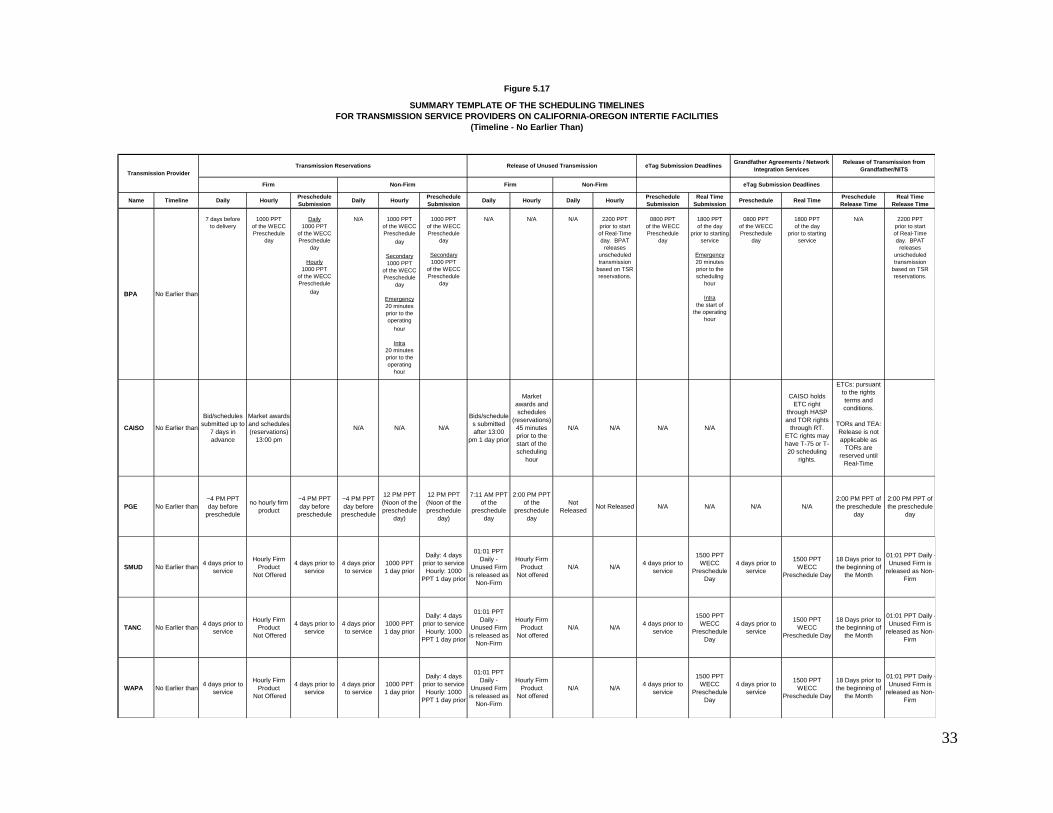
Despite the disparities in the scheduling and transmission reservation timelines, the information gathered by TUG and feedback provided by marketers and other market entities suggests that the varying scheduling timelines do not represent a significant obstacle in utilizing COI transmission facilities. The differences in scheduling timelines were expected to have an impact on the usage of the COI. As part of the overall process to gather and compare the scheduling and reservation timelines, specific emphasis was placed on the use of consistent terminology to ensure that any comparisons and conclusions related to the information would be appropriate and accurate. Thus, timelines were aligned based on the “top of the scheduling hour”. In addition, the TUG also highlighted the scheduling and transmission reservation timelines that are associated with any applicable existing transmission contracts and grandfather agreements. Furthermore, during the merchant meeting, comments were solicited to identify any issues or concerns that may be directly related to the timelines for scheduling. For the purpose of comparison, the scheduling and transmission reservation timeline information was compiled and summarized into two separate tables. The table in Figure 5.17 represents the “No Earlier Than” timeframe for which reservations can be made on COI transmission facilities for each TSP. The table in Figure 5.18 represents the “No Later Than” timeframe for which reservations can be made. The timelines clearly vary among the different TSPs. Transmission Reservations For firm transmission reservations timelines as reflected in the “No Earlier Than” category, daily reservation timelines vary from 10 AM one day prior to start of service to 1 minute prior to start of service. Hourly reservation timelines vary from 1 PM one day prior to start of service to 20 minutes prior to start of service. For Non-Firm Transmission Reservations, Daily reservation timelines vary from 2 PM one day before the start of service to 1 minute (11:59 PM) prior to start of service. Hourly reservation timelines vary from 20 minutes to 30 minutes prior to that start of service.
i. Release of Unused Transmission
For Firm Transmission in the “No Earlier Than” category, daily timelines vary from 7 AM one day prior to the start of service to 75 minutes prior to the start of service. Hourly timelines vary from 2 PM of the pre-schedule day (one day prior to service) to 45 minutes prior to the start of service. For Non-Firm Transmission, WAPA’s Daily timeline is 2 PM one day prior to the start of service (no other Transmission Service Provider (TSP) offered Daily Non-Firm transmission). Hourly timelines for BPA and WAPA are from 20 to 30 minutes prior to start of service, respectively (No information was provided by other TSP on hourly Non-Firm).
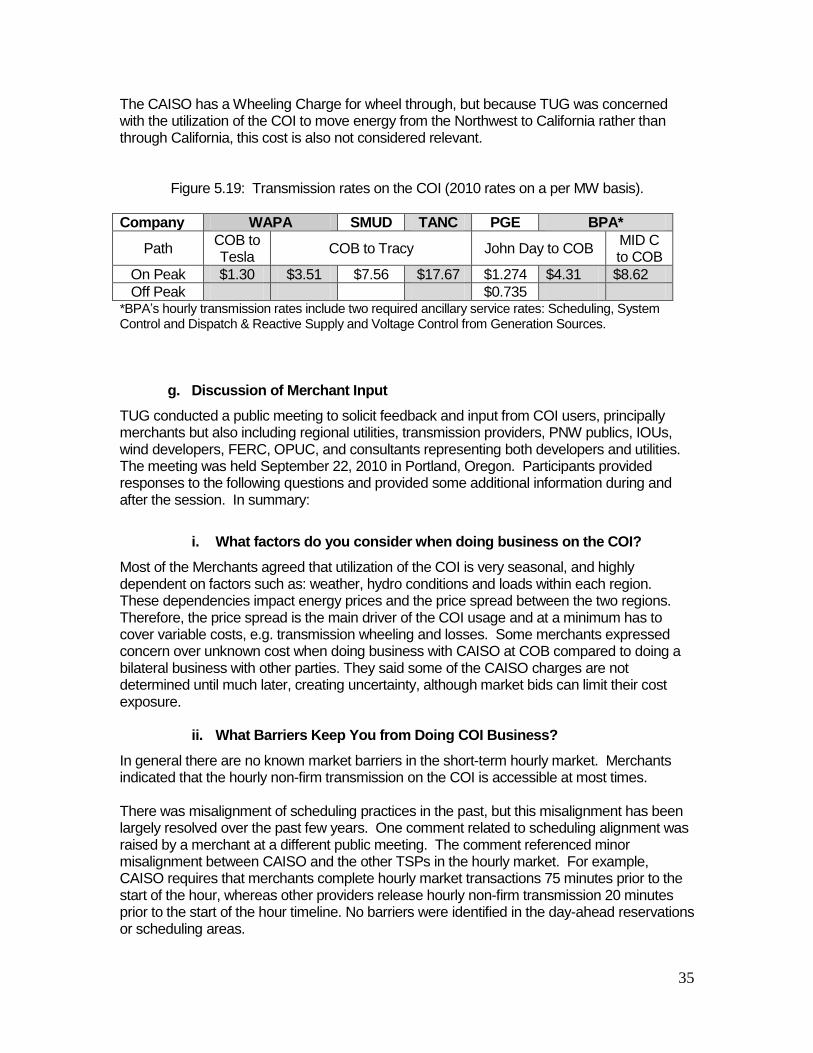
f. Transmission Rates
Transmission rates from the TSP are tabulated in Figure 5.19. Because no long-term service is available, only non-firm short-term service rates are shown. These range from 1.30 $/MW to 17.67 $/MW, which is a significant disparity between service providers. Transmission rates affect what the necessary price spread is to incentivize COI utilization.
32
One difference of the CAISO’s transmission service compared to other TSPs is that transmission costs are paid by the load in the form of the Transmission Access Charge (TAC). Since load pays TAC regardless of whether it is served by generation internal to the CAISO or by an import, this cost cannot be assigned to the import. There are some minimal Grid Management Charges (GMC) that are incurred when scheduling in the CAISO that add up to less than 0.1 $/MW. The CAISO has a Locational Marginal Pricing (LMP) market and import transaction cost will occur due to the price differential between the import point and the load service point. This differential is due to congestion and losses. The differential can be a charge or a credit depending on the direction of the congestion. Many Scheduling Coordinators will have Congestion Revenue Rights (CRR) that act as a hedge against these costs. It did not appear to make sense to quantify the congestion costs or credits.
33
Name Timeline Daily HourlyPreschedule
Submission Daily Hourly
Preschedule
Submission Daily Hourly Daily Hourly
Preschedule
Submission
Real Time
Submission Preschedule Real Time
Preschedule
Release Time
Real Time
Release Time
BPA No Earlier than
7 days before
to delivery
1000 PPT
of the WECC
Preschedule
day
Daily
1000 PPT
of the WECC
Preschedule
day
Hourly
1000 PPT
of the WECC
Preschedule
day
N/A 1000 PPT
of the WECC
Preschedule
day
Secondary
1000 PPT
of the WECC
Preschedule
day
Emergency
20 minutes
prior to the
operating
hour
Intra
20 minutes
prior to the
operating
hour
1000 PPT
of the WECC
Preschedule
day
Secondary
1000 PPT
of the WECC
Preschedule
day
N/A N/A N/A 2200 PPT
prior to start
of Real-Time
day. BPAT
releases
unscheduled
transmission
based on TSR
reservations.
0800 PPT
of the WECC
Preschedule
day
1800 PPT
of the day
prior to starting
service
Emergency
20 minutes
prior to the
scheduling
hour
Intra
the start of
the operating
hour
0800 PPT
of the WECC
Preschedule
day
1800 PPT
of the day
prior to starting
service
N/A 2200 PPT
prior to start
of Real-Time
day. BPAT
releases
unscheduled
transmission
based on TSR
reservations.
CAISO No Earlier than
Bid/schedules
submitted up to
7 days in
advance
Market awards
and schedules
(reservations)
13:00 pm
N/A N/A N/A
Bids/schedule
s submitted
after 13:00
pm 1 day prior
Market
awards and
schedules
(reservations)
45 minutes
prior to the
start of the
scheduling
hour
N/A N/A N/A N/A
CAISO holds
ETC right
through HASP
and TOR rights
through RT.
ETC rights may
have T-75 or T-
20 scheduling
rights.
ETCs: pursuant
to the rights
terms and
conditions.
TORs and TEA:
Release is not
applicable as
TORs are
reserved until
Real-Time
PGE No Earlier than
~4 PM PPT
day before
preschedule
no hourly firm
product
~4 PM PPT
day before
preschedule
~4 PM PPT
day before
preschedule
12 PM PPT
(Noon of the
preschedule
day)
12 PM PPT
(Noon of the
preschedule
day)
7:11 AM PPT
of the
preschedule
day
2:00 PM PPT
of the
preschedule
day
Not
ReleasedNot Released N/A N/A N/A N/A
2:00 PM PPT of
the preschedule
day
2:00 PM PPT of
the preschedule
day
SMUD No Earlier than4 days prior to
service
Hourly Firm
Product
Not Offered
4 days prior to
service
4 days prior
to service
1000 PPT
1 day prior
Daily: 4 days
prior to service
Hourly: 1000
PPT 1 day prior
01:01 PPT
Daily -
Unused Firm
is released as
Non-Firm
Hourly Firm
Product
Not offered
N/A N/A4 days prior to
service
1500 PPT
WECC
Preschedule
Day
4 days prior to
service
1500 PPT
WECC
Preschedule Day
18 Days prior to
the beginning of
the Month
01:01 PPT Daily -
Unused Firm is
released as Non-
Firm
TANC No Earlier than4 days prior to
service
Hourly Firm
Product
Not Offered
4 days prior to
service
4 days prior
to service
1000 PPT
1 day prior
Daily: 4 days
prior to service
Hourly: 1000
PPT 1 day prior
01:01 PPT
Daily -
Unused Firm
is released as
Non-Firm
Hourly Firm
Product
Not offered
N/A N/A4 days prior to
service
1500 PPT
WECC
Preschedule
Day
4 days prior to
service
1500 PPT
WECC
Preschedule Day
18 Days prior to
the beginning of
the Month
01:01 PPT Daily -
Unused Firm is
released as Non-
Firm
WAPA No Earlier than4 days prior to
service
Hourly Firm
Product
Not Offered
4 days prior to
service
4 days prior
to service
1000 PPT
1 day prior
Daily: 4 days
prior to service
Hourly: 1000
PPT 1 day prior
01:01 PPT
Daily -
Unused Firm
is released as
Non-Firm
Hourly Firm
Product
Not offered
N/A N/A4 days prior to
service
1500 PPT
WECC
Preschedule
Day
4 days prior to
service
1500 PPT
WECC
Preschedule Day
18 Days prior to
the beginning of
the Month
01:01 PPT Daily -
Unused Firm is
released as Non-
Firm
Non-Firm
SUMMARY TEMPLATE OF THE SCHEDULING TIMELINES
FOR TRANSMISSION SERVICE PROVIDERS ON CALIFORNIA-OREGON INTERTIE FACILITIES
(Timeline - No Earlier Than)
Firm eTag Submission Deadlines
Figure 5.17
Transmission Provider
Transmission Reservations Release of Unused Transmission eTag Submission DeadlinesGrandfather Agreements / Network
Integration Services
Release of Transmission from
Grandfather/NITS
Firm Non-Firm
34
Name Timeline Daily HourlyPreschedule
Submission Daily Hourly
Preschedule
Submission Daily Hourly Daily Hourly
Preschedule
Submission
Real Time
Submission Preschedule Real Time
Preschedule
Release Time
Real Time
Release Time
BPA No Later than
20 minutes
prior to the
start of flow
20 minutes
prior to the
start of flow
N/A N/A 20 minutes
prior to the
start of flow
Secondary
the end of the
operating hour
Emergency
the end of the
operating hour
Intra
15 minutes
into the
operating
hour
N/A N/A N/A N/A N/A 1500 PPT or
two hours after
the posted CISO
preschedule
market closing
time; whichever
time is later
20 minutes
prior to the
start of service
Emergency
the end of the
operating hour
Intra
15 minutes
into the
operating
hour
1500 PPT or
two hours after
the posted CISO
preschedule
market closing
time; whichever
time is later
20 minutes
prior to the
start of service
N/A N/A
CAISO No Later than
Bids/schedules
submitted by
10:00 am 1 day
prior
Market awards
and schedules
(reservations)
13:00 pm 1
day prior
N/A N/A N/A
Bids/schedule
s submitted
by 75 minutes
prior to the
start of the
scheduling
hour
Market awards
and schedules
(reservations)
45 minutes
prior to the
start of the
scheduling
hour
N/A N/A
3:00 PM PPT 1
day prior to
service
20 minutes
before the start
of the
scheduling hour
CAISO holds
ETC right
through HASP
and TOR rights
through RT.
ETC rights may
have T-75 or T-
20 scheduling
rights.
ETCs: pursuant
to the rights
terms and
conditions.
TORs and TEA:
Release is not
applicable as
TORs are
reserved until
Real-Time
PGE No Later than
11:59 PM PPT
1 minute prior to
scheduling hour
no hourly firm
product
4:00 PM PPT
1 day prior to
service
11:59 PM
PPT
1 minute prior
to service
20 minutes
before the
start of
scheduling
hour
4:00 PM PPT
1 day prior to
service
7:11 AM PPT
of the
preschedule
day
2:00 PM PPT
of the
preschedule
day
Not
Released
Not
Released
3:00 PM PPT 1
day prior to
service
20 minutes
before the start
of scheduling
hour
3:00 PM PPT 1
day prior to
service
20 minutes
before the start
of scheduling
hour
2:00 PM PPT of
the preschedule
day
2:00 PM PPT of
the preschedule
day
SMUD No Later than1000 PPT
1 day prior
Hourly Firm
Product Not
Offered
1000 PPT
1 day prior
1400
1 day prior
25 minutes
prior to start
of the
scheduling
hour
1200
1 day prior
01:01 PPT
Daily -
Unused Firm
is released as
Non-Firm
Hourly Firm
Product
Not offered
Not
Released
Not
Released
1500 PPT WECC
Preschedule Day
20 Min prior to
start of
scheduling hour
1500 PPT
WECC
Preschedule Day
20 Min before
the start of the
scheduling hour
18 Days prior to
the beginning of
the Month
01:01 PPT Daily -
Unused Firm is
released as Non-
Firm
TANC No Later than1000 PPT
1 day prior
Hourly Firm
Product Not
Offered
1000 PPT
1 day prior
1400
1 day prior
25 minutes
prior to start
of scheduling
hour
1400
1 day prior
01:01 PPT
Daily -
Unused Firm
is released as
Non-Firm
Hourly Firm
Product
Not offered
Not
Released
Not
Released
1500 PPT WECC
Preschedule Day
20 Min prior to
start of
scheduling hour
1500 PPT
WECC
Preschedule Day
20 Min before
the start of the
scheduling hour
18 Days prior to
the beginning of
the Month
01:01 PPT Daily -
Unused Firm is
released as Non-
Firm
WAPA No Later than1000 PPT
1 day prior
Hourly Firm
Product Not
Offered
1000 PPT
1 day prior
1400
1 day prior
25 minutes
prior to start
of the
scheduling
hour
1200
1 day prior
01:01 PPT
Daily -
Unused Firm
is released as
Non-Firm
Hourly Firm
Product
Not offered
Not
Released
Not
Released
1500 PPT WECC
Preschedule Day
20 Min prior to
start of
scheduling hour
1500 PPT
WECC
Preschedule Day
20 Min before
the start of the
scheduling hour
18 Days prior to
the beginning of
the Month
01:01 PPT Daily -
Unused Firm is
released as Non-
Firm
Non-Firm
SUMMARY TEMPLATE OF THE SCHEDULING TIMELINES
FOR TRANSMISSION SERVICE PROVIDERS ON CALIFORNIA-OREGON INTERTIE FACILITIES
(Timeline - No Later Than)
Firm Non-Firm Firm
Figure 5.18
eTag Submission Deadlines
Transmission Provider
Transmission Reservations Release of Unused Transmission eTag Submission DeadlinesGrandfather Agreements / Network
Integration Services
Release of Transmission from
Grandfather/NITS
35
The CAISO has a Wheeling Charge for wheel through, but because TUG was concerned with the utilization of the COI to move energy from the Northwest to California rather than through California, this cost is also not considered relevant.
Figure 5.19: Transmission rates on the COI (2010 rates on a per MW basis).
Company WAPA SMUD TANC PGE BPA*
Path COB to Tesla
COB to Tracy John Day to COB MID C to COB
On Peak $1.30 $3.51 $7.56 $17.67 $1.274 $4.31 $8.62
Off Peak $0.735 *BPA’s hourly transmission rates include two required ancillary service rates: Scheduling, System Control and Dispatch & Reactive Supply and Voltage Control from Generation Sources.
g. Discussion of Merchant Input
TUG conducted a public meeting to solicit feedback and input from COI users, principally merchants but also including regional utilities, transmission providers, PNW publics, IOUs, wind developers, FERC, OPUC, and consultants representing both developers and utilities. The meeting was held September 22, 2010 in Portland, Oregon. Participants provided responses to the following questions and provided some additional information during and after the session. In summary:
i. What factors do you consider when doing business on the COI?
Most of the Merchants agreed that utilization of the COI is very seasonal, and highly dependent on factors such as: weather, hydro conditions and loads within each region. These dependencies impact energy prices and the price spread between the two regions. Therefore, the price spread is the main driver of the COI usage and at a minimum has to cover variable costs, e.g. transmission wheeling and losses. Some merchants expressed concern over unknown cost when doing business with CAISO at COB compared to doing a bilateral business with other parties. They said some of the CAISO charges are not determined until much later, creating uncertainty, although market bids can limit their cost exposure.
ii. What Barriers Keep You from Doing COI Business?
In general there are no known market barriers in the short-term hourly market. Merchants indicated that the hourly non-firm transmission on the COI is accessible at most times. There was misalignment of scheduling practices in the past, but this misalignment has been largely resolved over the past few years. One comment related to scheduling alignment was raised by a merchant at a different public meeting. The comment referenced minor misalignment between CAISO and the other TSPs in the hourly market. For example, CAISO requires that merchants complete hourly market transactions 75 minutes prior to the start of the hour, whereas other providers release hourly non-firm transmission 20 minutes prior to the start of the hour timeline. No barriers were identified in the day-ahead reservations or scheduling areas.
36
An observation was made that there are now more day-ahead markets than hourly markets. Merchants pointed out that they use COI as a relief valve by procuring more power on a day-ahead basis, then adjusting it in real-time to match the demand. Merchants indicated that PSW thermals are low cost and less flexible and that PNW hydro resources are more flexible to turn on or off. Another observation from a merchant noted that energy prices at COB have been much closer to Mid-Columbia (Mid-C) prices than NP-15 prices, indicating much smaller Mid-C to COB price spreads compared to COB to NP-15 spreads. For the purpose of this analysis the TUG members decided to review Mid-C to NP-15 price spreads. This method was to capture the total spread for the entire length of the COI even though the transmission line and the energy markets are operated as two different zones (north and south of COB). In depth market/structure analysis will be needed if the TUG desires to further understand the relationship between the energy markets and COI utilization.
iii. What Changes Would Help You Use the COI More Efficiently?
Merchants asked that if and when a 30 min market gets underway, NW transmission providers should monitor how CAISO implements intra-hourly scheduling through the Joint Initiative to help identify and address potential seams issues. BPA customers also raised concerns specific to BPA related to its recent reinstatement of the price cap for transmission resale. They would like to see a more robust secondary transmission market, and said that the resale will help increase COI utilization. They said that the price cap could be detrimental to the resale transmission market because it would prevent them from receiving sufficient compensation for the increased risk resulting from reducing their scheduling rights on the COI. There was one dissenting voice indicating that the price cap allows non-wind entities to be more competitive since they aren’t given the advantage of the Production Tax Credit (PTC). BPA has since posted its newly proposed Business Practice (Resale of Transmission Service) for customers’ comments. Some merchants felt that the BPA’s proposed Firm Contingent e-Tags for intermittent resources could be a barrier. During the spring of 2010 BPA discussed the concept of requiring the use of the Western Electricity Coordinating Council "Firm Contingent" Energy Product code on e-Tags for transmission of variable generation located in BPA's balancing authority area. This concept was discussed in response to the BPA’s Dispatch Standing Order (DSO 216), which requires that intermittent resources located inside the BPA balancing authority respond when directives are given to maintain system reliability. This tagging requirement has not yet been implemented by BPA. Some merchants also commented that BPA should continue its effort to scope, develop, and offer a Conditional Firm (CF) product on the COI, provided that such product does not undermine the rights of existing contract holders of COI capacity. There were also oppositions to this CF product development as some merchants felt that this product will negatively impact the existing firm contract holders. BPA intends to seek customer input when and if this product is developed.
37
iv. How do you feel about the quantity and quality of transmission
available?
After looking at the 5-year data analysis, general consensus of the group was that the historical utilization of the COI looks reasonable. For most hours, on an average basis, merchants are using most of what is available during peak seasons. Merchants indicated that there are no apparent systems issues between the transmission provider, however, they advised that all providers should remain diligent to ensure that no seams issues exist or occur in the future between the PNW/BPA and the CAISO that may limit short-term usage of the COI capacity. Merchants requested that BPA and other TSPs coordinate to ensure that the COI OTC (or Scheduling Limit) is as high as possible. Merchants commented that there will be a more robust secondary transmission market in the future for unused capacity on the COI. Merchants said that up until now system development has caused a delay in participation in the resale transmission market on the COI but believe that the resale market will increase over time. Merchants also would like to have additional Dynamic Transfer Capability (DTC) both to John Day (network transmission) and from John Day to COB (COI). CAISO has 13 Dynamic Transfers on their system, with two on the COI.
v. Other Comments
One of the meeting participants said more incentives are necessary (structurally) from the regulators and policy makers for delivering renewable resources to California. Merchants would like to use both firm and non-firm transmission equally for Power Purchase Agreements (PPAs). This comment was based on some California utilities requiring only the firm transmission for their PPAs. This requirement limits interest in non-firm transmission which is often the only transmission available for sale on the COI. It would also leave renewable resources stranded in the Northwest since there is not sufficient firm transmission access to California. Merchants pointed out that current RPS rules in California are also restricting how developers are allowed to bring in renewable resources to California. Under the proposed RPS, California utilities are allowed to separate the energy and Renewable Energy Credit (REC) for a certain percentage of their RPS requirement. These rules allow the utilities to sell the energy in the Northwest rather than wheel it to California via COI.
6. Conclusion and Recommendations
The analysis performed by the TUG showed that economics drives COI usage. As the price spread between northern California and the Mid-C hub rose, the usage increased. This occurred during summer periods when the loads in California are high, and during the high runoff period in the PNW when surplus hydro energy is available at attractive prices. Except for the high run-off period, there is adequate transmission from the PNW to northern California for short term sales, mostly transacted in the real-time market. However, the long term transmission between the regions is fully subscribed. If renewable projects are to be built in the PNW to serve the California load, additional
38
transmission (long-term firm service) will have to be built. The PNW and California entities should investigate some type of intertie open season to determine the interest in building the necessary transmission.
Although COI utilization is high during the high runoff season in the PNW, the analysis showed that the scheduling limits are reduced during those months. The scheduling limits are often reduced due to planned maintenance outages. Typically, the high run-off months in the PNW coincide with the times when COI owners are taking transmission line or equipment maintenance outages. The outages are coordinated between the PNW and California parties generally to occur between the times the rainy season ends (so utilities can get trucks into the field) and the summer peak season begins. The COI owners should look at spreading the outages out between the spring and fall or other times of the year to maximize the available capacity during this high usage period.
The analysis also showed that there is an interest in more dynamic transfers between the regions, so that the regulating burden for the renewables can be shared between the two regions. At present BPA and CAISO are evaluating the potential for intra-hour scheduling on the COI as a pilot project. The CAISO is now completing a stakeholder process to add to its existing market functionality for dynamic transfers, which has included a technical study concluding that the CAISO does not have limitations in its transmission capability to support dynamic transfers of intermittent resources. BPA, CAISO, and other organizations in the PNW are supporting recently initiated dynamic transfer capability studies through the Dynamic Transfer Capability Task Force convened by the Wind Integration Study Team. In summary:
Economics / price differential drives COI usage (there is available transmission space in the real-time market). Recommendations: Consider a study to better understand the PNW and PSW energy market structure and in relationship (i.e. MRTU, COB, Mid-C, NP-15) to COI utilization.
During runoff periods / summer months, utilization is very high. Recommendations: Consider moving maintenance outages to some other times of the year in order to maximize COI scheduling limit.
No long-term firm transmission capacity is available. Recommendation: Explore possible open season to determine demand for long-term transmission service, encourage firm transmission holders for resale, and/or possible recommendation for BPA to relieve price caps.
For short-term, no structural impediments were found (in all but a few cases). Recommendation: TSPs need to remain diligent to ensure that minimal seams issues exist or occur in the future.
Pro-rata real-time curtailment at COI results in further curtailments at COI (OTC). Recommendation: BAs and Operators to investigate change in pro-rata tag curtailments.
Maintenance in spring lowers the OTC level, limiting flows where biggest price differential occurs. Recommendation: Better regional outage coordination is needed for maximum COI utilization.
Merchants desire for additional dynamic transfer capability. Recommendation: BPA/CAISO to look into the additional dynamic transfer possibility.