Embed Size (px)
Citation preview
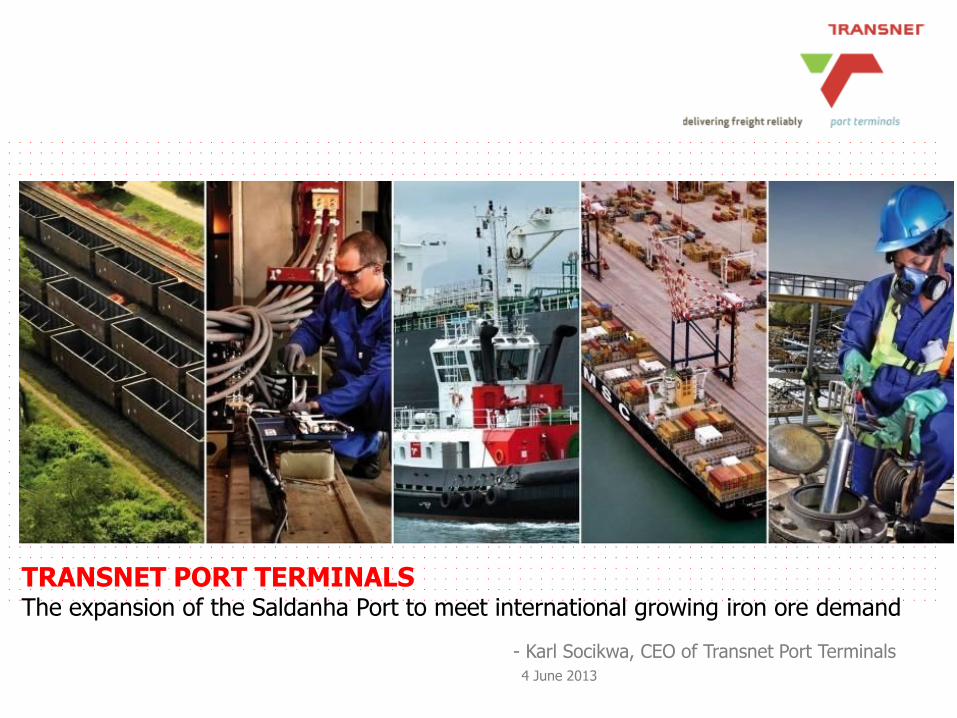
TRANSNET PORT TERMINALS The expansion of the Saldanha Port to meet international growing iron ore demand
- Karl Socikwa, CEO of Transnet Port Terminals
4 June 2013
PAGE PAGE
TABLE OF CONTENTS
SALDANHA IRON ORE TERMINAL
TRANSNET STATE OWNED COMPANY LIMITED
GROWING DEMAND FOR IRON ORE
FROM 60 TO 82MT BY 2018/19
YEAR ONE OF THE MARKET DEMAND STRATEGY
2
PAGE PAGE
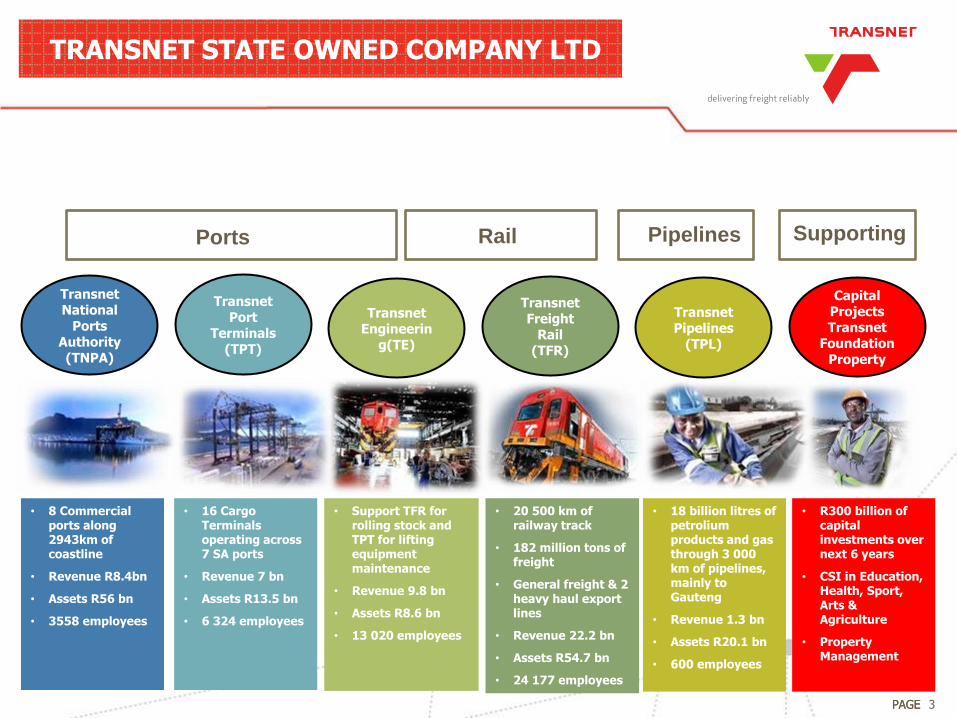
• 16 Cargo Terminals operating across 7 SA ports
• Revenue 7 bn
• Assets R13.5 bn
• 6 324 employees
Supporting
3
• 8 Commercial ports along 2943km of coastline
• Revenue R8.4bn
• Assets R56 bn
• 3558 employees
• 20 500 km of railway track
• 182 million tons of freight
• General freight & 2 heavy haul export lines
• Revenue 22.2 bn
• Assets R54.7 bn
• 24 177 employees
• Support TFR for rolling stock and TPT for lifting equipment maintenance
• Revenue 9.8 bn
• Assets R8.6 bn
• 13 020 employees
• 18 billion litres of petrolium products and gas through 3 000 km of pipelines, mainly to Gauteng
• Revenue 1.3 bn
• Assets R20.1 bn
• 600 employees
• R300 billion of capital investments over next 6 years
• CSI in Education, Health, Sport, Arts & Agriculture
• Property Management
Capital Projects Transnet
Foundation Property
Transnet Pipelines
(TPL)
Transnet Engineerin
g(TE)
Transnet Freight
Rail (TFR)
Transnet Port
Terminals (TPT)
Transnet National
Ports Authority (TNPA)
Pipelines Rail Ports
TRANSNET STATE OWNED COMPANY LTD
PAGE PAGE 4
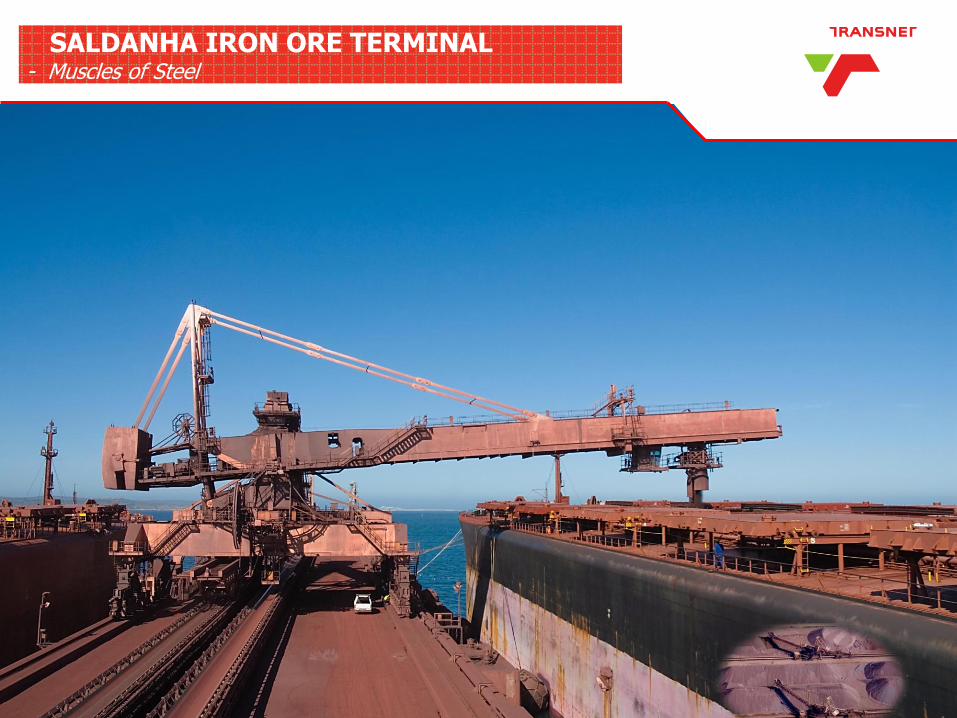
SALDANHA IRON ORE TERMINAL - Muscles of Steel
4
PAGE PAGE
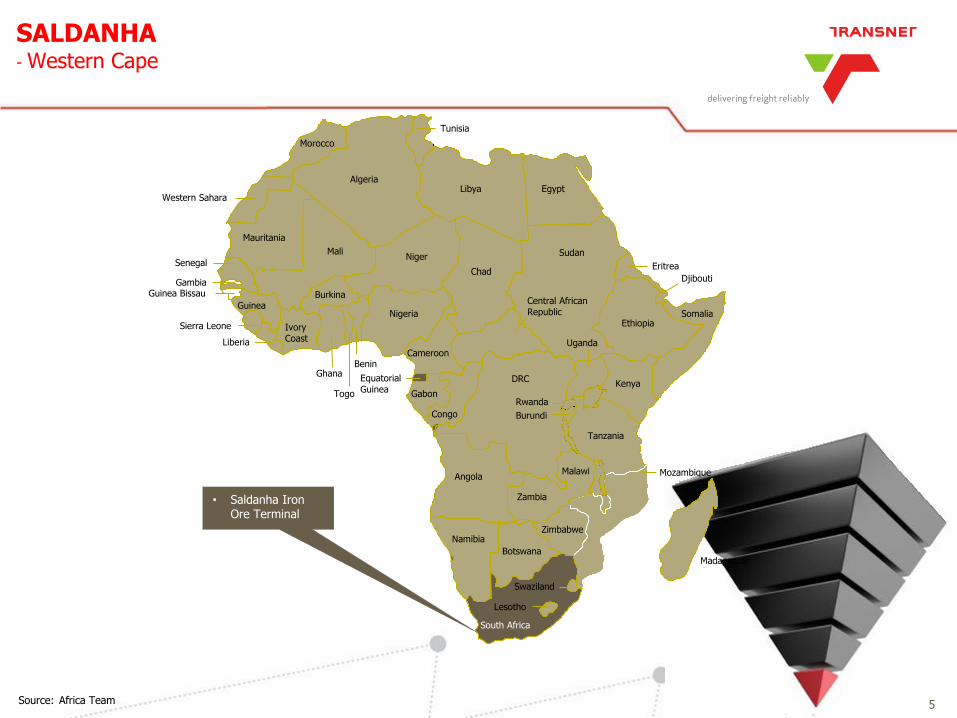
SALDANHA - Western Cape
Libya
Tunisia
Algeria
Morocco
Western Sahara
Guinea Bissau
Mauritania
Egypt
Chad
Niger Eritrea
Sudan
Central African Republic Nigeria
Mali
Senegal
Liberia
Togo
Cameroon
Ethiopia Somalia
Djibouti Gambia
Sierra Leone
Guinea
Ivory Coast
Benin
DRC
Uganda
Gabon Kenya
Burkina
Equatorial Guinea
Congo
Rwanda
Tanzania
Mozambique Angola
Zambia
Burundi
Malawi
Madagascar Botswana
Zimbabwe Namibia
South Africa
Lesotho
Swaziland
Source: Africa Team
• Saldanha Iron Ore Terminal
Ghana
5
PAGE PAGE 6
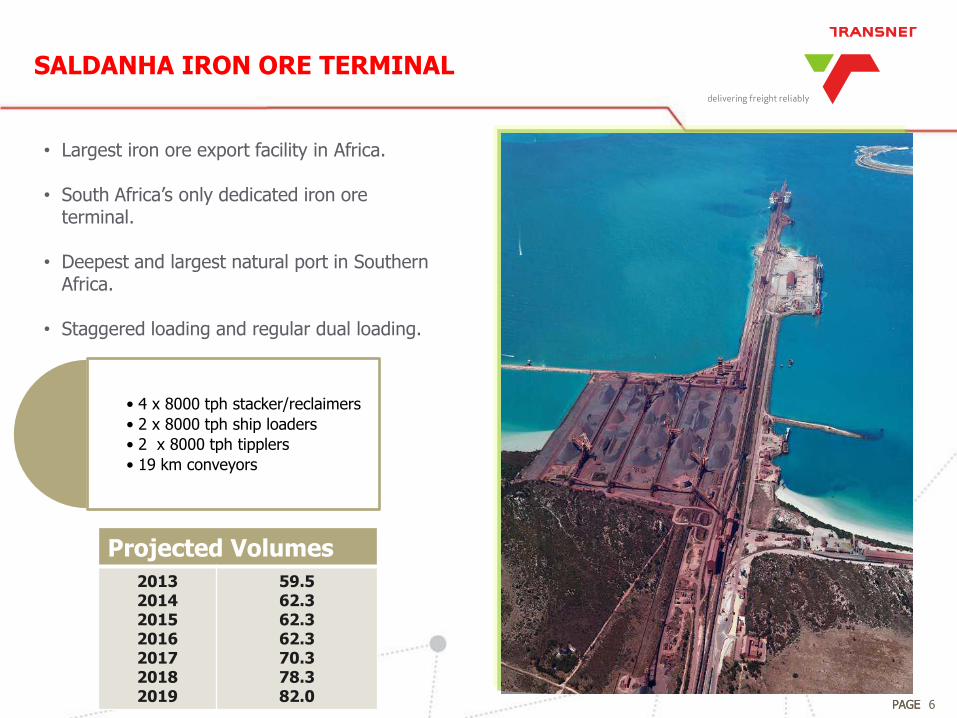
SALDANHA IRON ORE TERMINAL
• Largest iron ore export facility in Africa.
• South Africa’s only dedicated iron ore terminal.
• Deepest and largest natural port in Southern
Africa.
• Staggered loading and regular dual loading.
• 4 x 8000 tph stacker/reclaimers
• 2 x 8000 tph ship loaders
• 2 x 8000 tph tipplers
• 19 km conveyors
Projected Volumes
2013 2014 2015 2016 2017 2018 2019
59.5 62.3 62.3 62.3 70.3 78.3 82.0

PAGE PAGE 7
SALDANHA BREAK-BULK TERMINAL
Infrastructure Number Comments
Quays 1 Draft max, 13,5-14m, 3 berths, e.g. 201,202,203,
Cape Size, Panamax (250m)
Stockyard O/head Cranes 8 Load Capacity=40/35tons
Forklifts 7 Load Capacity=12/42 tons
Spreaders 2 Load Capacity=40/40 tons
Tractors 14 Load Capacity=30/60 tons
Trailers 14 Load Capacity=30/60 tons
Hoppers 4 Capacity = 20tons
Ware houses 1 Primarily used for coil storage, fitted 4 off
overhead cranes, load cap=36 tons/ 3 157m^2
Rail infrastructure 1 Rail Line split(3), connection to Salkor, potential
CAPECOR
PAGE PAGE 8
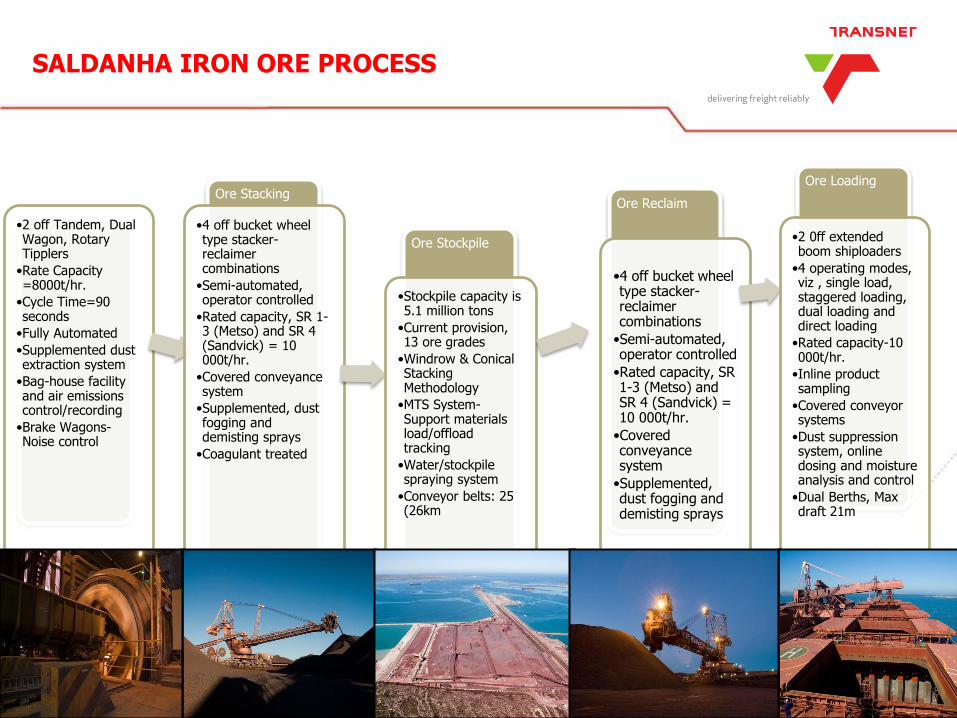
SALDANHA IRON ORE PROCESS
Ore Offloading •2 off Tandem, Dual Wagon, Rotary Tipplers
•Rate Capacity =8000t/hr.
•Cycle Time=90 seconds
•Fully Automated
•Supplemented dust extraction system
•Bag-house facility and air emissions control/recording
•Brake Wagons-Noise control
Ore Stacking
•4 off bucket wheel type stacker-reclaimer combinations
•Semi-automated, operator controlled
•Rated capacity, SR 1-3 (Metso) and SR 4 (Sandvick) = 10 000t/hr.
•Covered conveyance system
•Supplemented, dust fogging and demisting sprays
•Coagulant treated
Ore Stockpile
•Stockpile capacity is 5.1 million tons
•Current provision, 13 ore grades
•Windrow & Conical Stacking Methodology
•MTS System-Support materials load/offload tracking
•Water/stockpile spraying system
•Conveyor belts: 25 (26km
Ore Reclaim
•4 off bucket wheel type stacker-reclaimer combinations
•Semi-automated, operator controlled
•Rated capacity, SR 1-3 (Metso) and SR 4 (Sandvick) = 10 000t/hr.
•Covered conveyance system
•Supplemented, dust fogging and demisting sprays
Ore Loading
•2 0ff extended boom shiploaders
•4 operating modes, viz , single load, staggered loading, dual loading and direct loading
•Rated capacity-10 000t/hr.
•Inline product sampling
•Covered conveyor systems
•Dust suppression system, online dosing and moisture analysis and control
•Dual Berths, Max draft 21m
8 8
PAGE PAGE
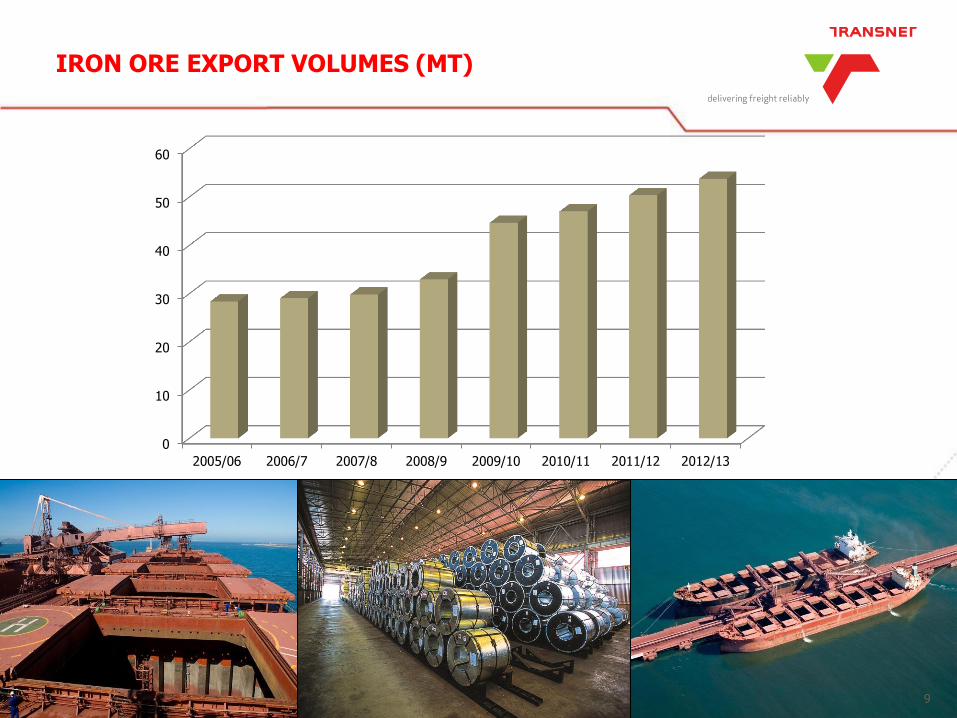
IRON ORE EXPORT VOLUMES (MT)
9
0
10
20
30
40
50
60
2005/06 2006/7 2007/8 2008/9 2009/10 2010/11 2011/12 2012/13
PAGE
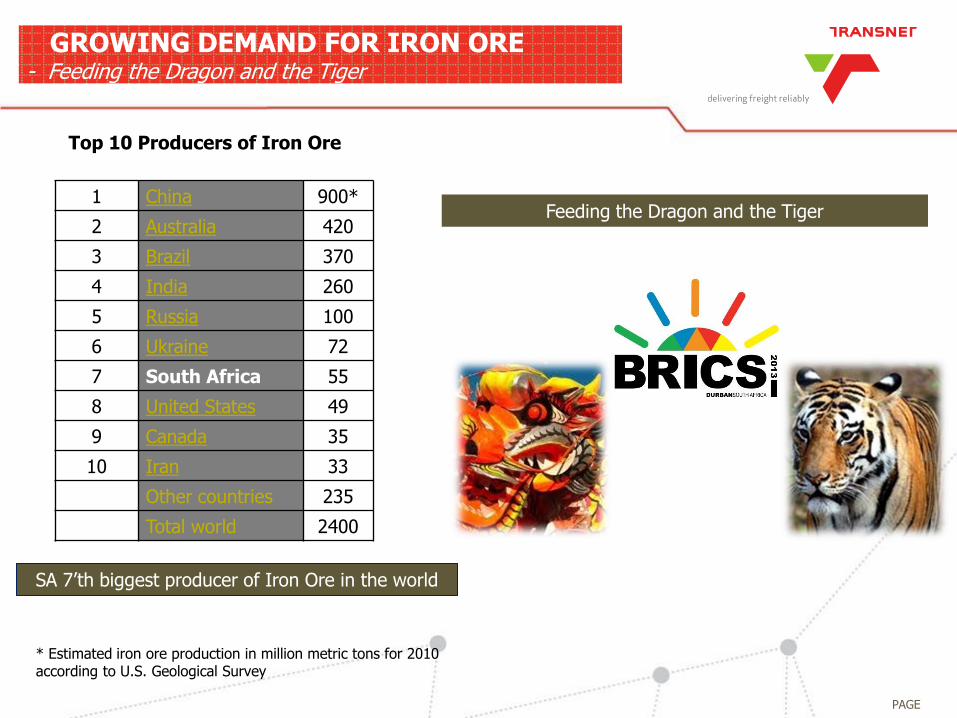
Top 10 Producers of Iron Ore
SA 7’th biggest producer of Iron Ore in the world
Feeding the Dragon and the Tiger 1 China 900*
2 Australia 420
3 Brazil 370
4 India 260
5 Russia 100
6 Ukraine 72
7 South Africa 55
8 United States 49
9 Canada 35
10 Iran 33
Other countries 235
Total world 2400
* Estimated iron ore production in million metric tons for 2010 according to U.S. Geological Survey
GROWING DEMAND FOR IRON ORE - Feeding the Dragon and the Tiger
10

PAGE
BRICS - Southern Hub for World Shipping Routes
The position of South Africa’s ports system enables it to access to South-South trade, Far East trade, Europe & USA, East & West Africa regional trade
11
Shortest Trade Route between Shanghai and Santos is via South Africa 11,270nm = 22 days @ 21 knots via Panama Canal13,130nm = 26 days + transit fee via Suez Canal 13,590nm = 27 days + transit fee
11
PAGE 12
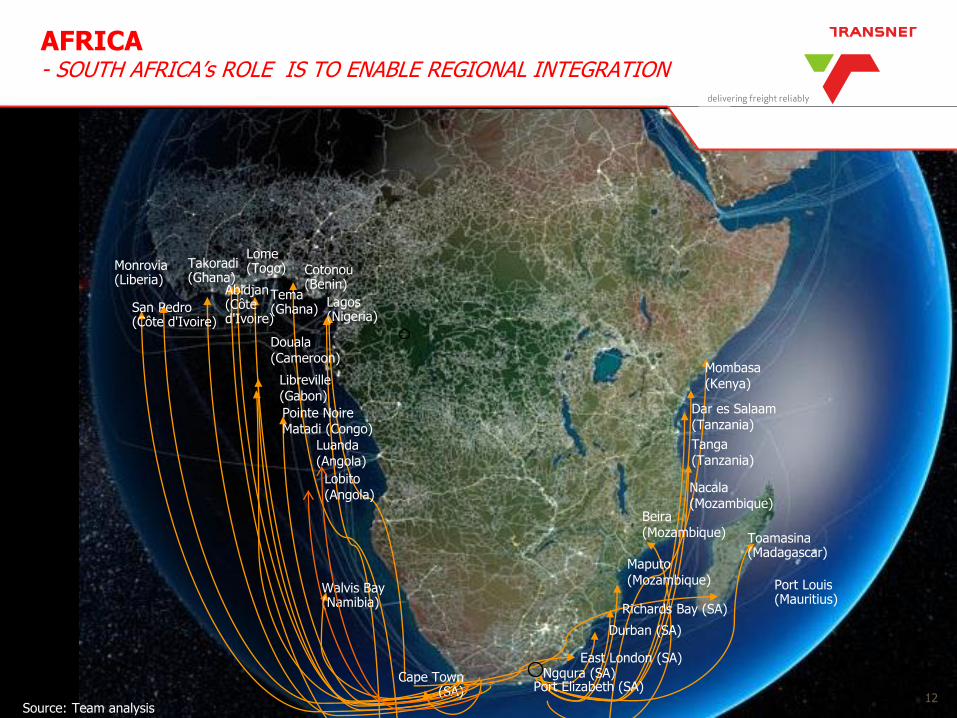
AFRICA - SOUTH AFRICA’s ROLE IS TO ENABLE REGIONAL INTEGRATION
Monrovia (Liberia)
Lome (Togo)
Port Louis (Mauritius)
Toamasina (Madagascar)
Takoradi (Ghana)
San Pedro (Côte d'Ivoire)
Lagos (Nigeria)
Cotonou (Benin)
Walvis Bay (Namibia)
Tema (Ghana)
Abidjan (Côte d'Ivoire)
Cape Town (SA)
Dar es Salaam (Tanzania)
Tanga (Tanzania)
Mombasa (Kenya)
Nacala (Mozambique)
Beira (Mozambique)
Maputo (Mozambique)
Richards Bay (SA)
Durban (SA)
East London (SA) Ngqura (SA)
Libreville (Gabon)
Pointe Noire Matadi (Congo)
Douala (Cameroon)
Source: Team analysis
Port Elizabeth (SA)
Lobito (Angola)
Luanda (Angola)
12
PAGE 13
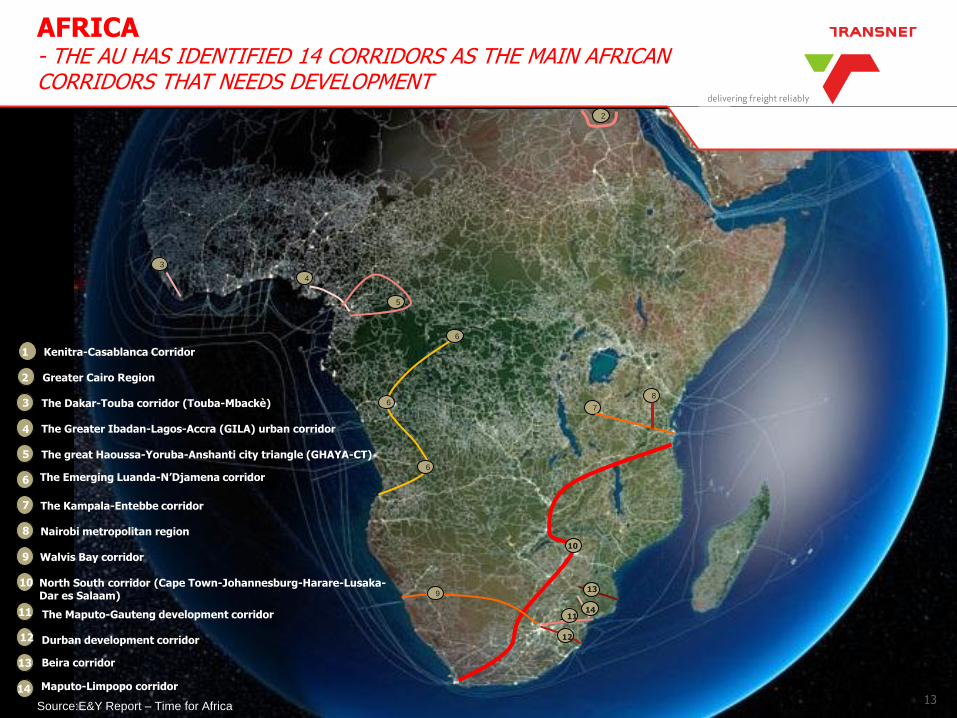
AFRICA - THE AU HAS IDENTIFIED 14 CORRIDORS AS THE MAIN AFRICAN CORRIDORS THAT NEEDS DEVELOPMENT
1 Kenitra-Casablanca Corridor
2 Greater Cairo Region
3 The Dakar-Touba corridor (Touba-Mbackѐ)
4 The Greater Ibadan-Lagos-Accra (GILA) urban corridor
5 The great Haoussa-Yoruba-Anshanti city triangle (GHAYA-CT)
6 The Emerging Luanda-N’Djamena corridor
7 The Kampala-Entebbe corridor
8 Nairobi metropolitan region
9 Walvis Bay corridor
10 North South corridor (Cape Town-Johannesburg-Harare-Lusaka-Dar es Salaam)
11 The Maputo-Gauteng development corridor
12 Durban development corridor
13 Beira corridor
14 Maputo-Limpopo corridor
Source:E&Y Report – Time for Africa
3
4
2
13
10
12
11 14
9
6
5
7
8 6
6
13
PAGE PAGE
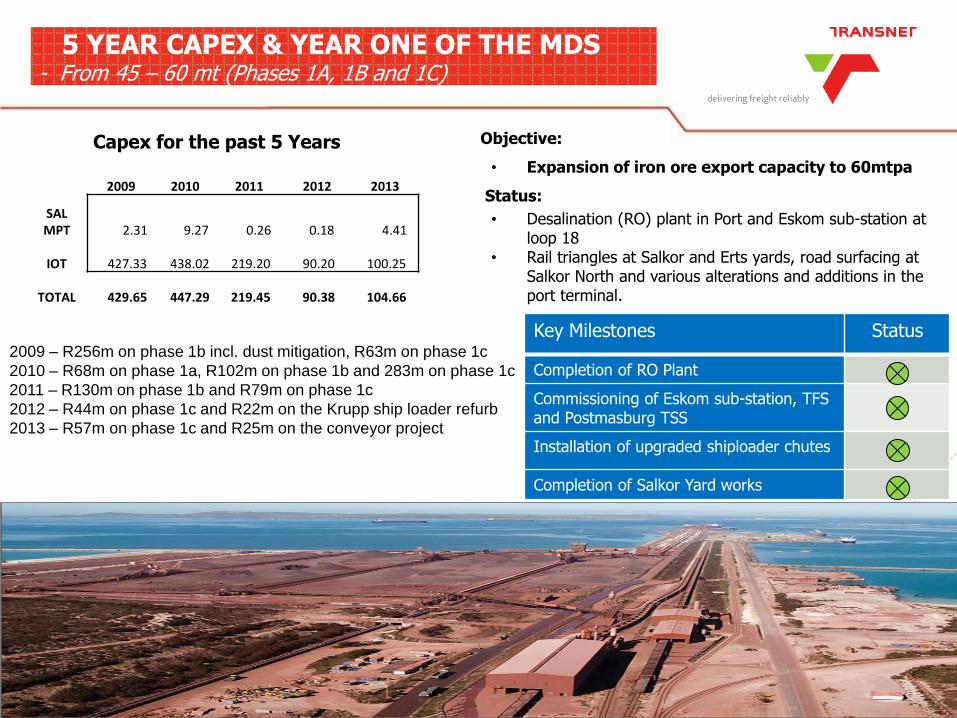
5 YEAR CAPEX & YEAR ONE OF THE MDS - From 45 – 60 mt (Phases 1A, 1B and 1C)
14
Objective:
• Expansion of iron ore export capacity to 60mtpa
Status:
• Desalination (RO) plant in Port and Eskom sub-station at loop 18
• Rail triangles at Salkor and Erts yards, road surfacing at Salkor North and various alterations and additions in the port terminal.
Key Milestones Status
Completion of RO Plant
Commissioning of Eskom sub-station, TFS and Postmasburg TSS
Installation of upgraded shiploader chutes
Completion of Salkor Yard works
2009 2010 2011 2012 2013
SAL MPT
2.31
9.27
0.26
0.18
4.41
IOT 427.33
438.02
219.20
90.20
100.25
TOTAL 429.65
447.29
219.45
90.38
104.66
2009 – R256m on phase 1b incl. dust mitigation, R63m on phase 1c
2010 – R68m on phase 1a, R102m on phase 1b and 283m on phase 1c
2011 – R130m on phase 1b and R79m on phase 1c
2012 – R44m on phase 1c and R22m on the Krupp ship loader refurb
2013 – R57m on phase 1c and R25m on the conveyor project
Capex for the past 5 Years
PAGE PAGE
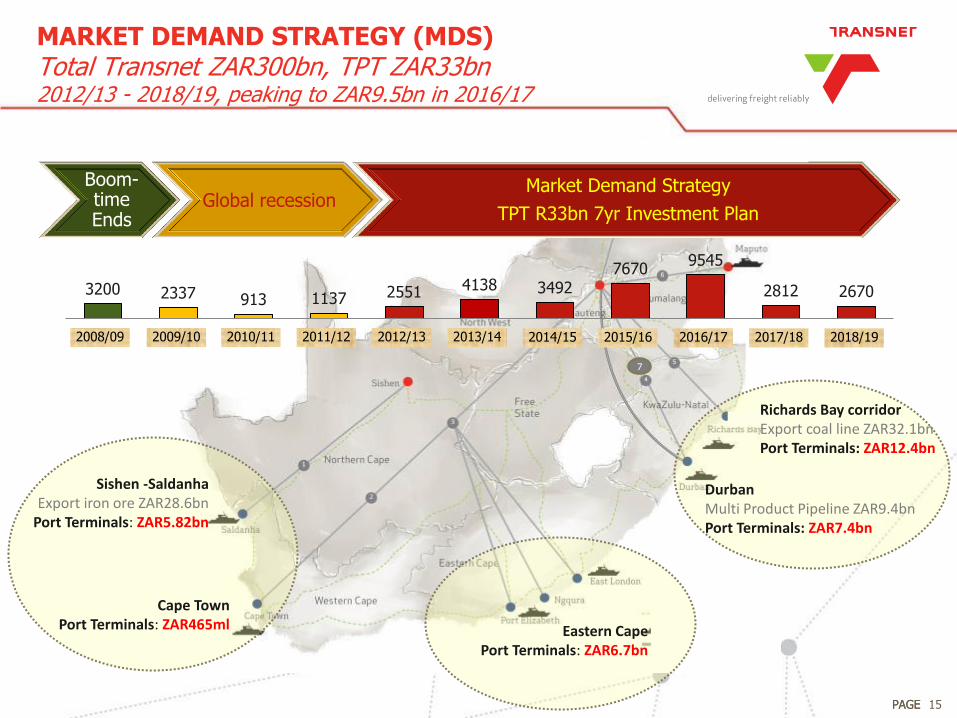
MARKET DEMAND STRATEGY (MDS) Total Transnet ZAR300bn, TPT ZAR33bn 2012/13 - 2018/19, peaking to ZAR9.5bn in 2016/17
Sishen -Saldanha Export iron ore ZAR28.6bn
Port Terminals: ZAR5.82bn
Cape Town Port Terminals: ZAR465ml
7
Durban Multi Product Pipeline ZAR9.4bn Port Terminals: ZAR7.4bn
Richards Bay corridor Export coal line ZAR32.1bn Port Terminals: ZAR12.4bn
2012/13 2011/12 2010/11 2008/09 2013/14 2017/18 2016/17 2015/16 2014/15 2018/19
3200 2337 913 1137 2551 4138 3492 7670
9545
2812 2670
2009/10
Boom-time Ends
Global recession Market Demand Strategy
TPT R33bn 7yr Investment Plan
Eastern Cape Port Terminals: ZAR6.7bn
15
PAGE PAGE
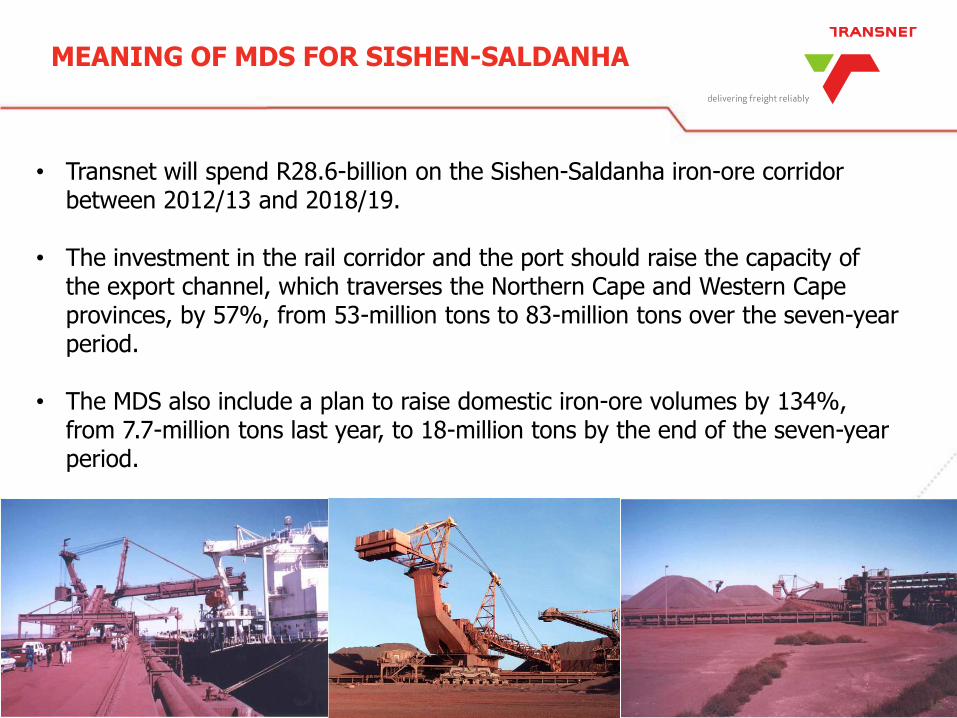
• Transnet will spend R28.6-billion on the Sishen-Saldanha iron-ore corridor between 2012/13 and 2018/19.
• The investment in the rail corridor and the port should raise the capacity of the export channel, which traverses the Northern Cape and Western Cape provinces, by 57%, from 53-million tons to 83-million tons over the seven-year period.
• The MDS also include a plan to raise domestic iron-ore volumes by 134%, from 7.7-million tons last year, to 18-million tons by the end of the seven-year period.
MEANING OF MDS FOR SISHEN-SALDANHA
16

PAGE PAGE 17
FROM 60 TO 82MT BY 2018/19
Initial Bulk Terminal Operations, 1976
Targeted capacity = 27mtpa
1 tippler, 2 stacker Reclaimers, 2 ship loaders
Bulk Terminal Expansion, Phase 1 A
Capacity - 45mtpa
Completed June 2005
2 tipplers, 3 stacker Reclaimers, 2 ship loaders
Bulk Terminal Expansion, Phase 1B
Capacity-55mtp
Completed , May 2009
2 tipplers, 4 stacker Reclaimers, 2 ship loaders),
Bulk terminal Expansion, Phase 1C
Capacity = 60mtpa
Completed July 2012
Improvement on phase 1B
Port Expansion, Phase 2A
FEL 2 in progress
Targeted commissioning 2018 onward
Targeted capacity = 82mtpa
3 tipplers, 6 stacker Reclaimers, 3 ship loaders
17
Project 2012/13 Budget R m
2013/14 Projected R m
2014/15 Projected R m
2015/16 Projected R m
2016/17 Projected R m
2017/18 Projected R m
2018/19 Projected R m
7y Plan Total R m
Iron Ore Expansion (60 to 80mtpa) 20 205 1 200 1 950 900 4 275
PAGE
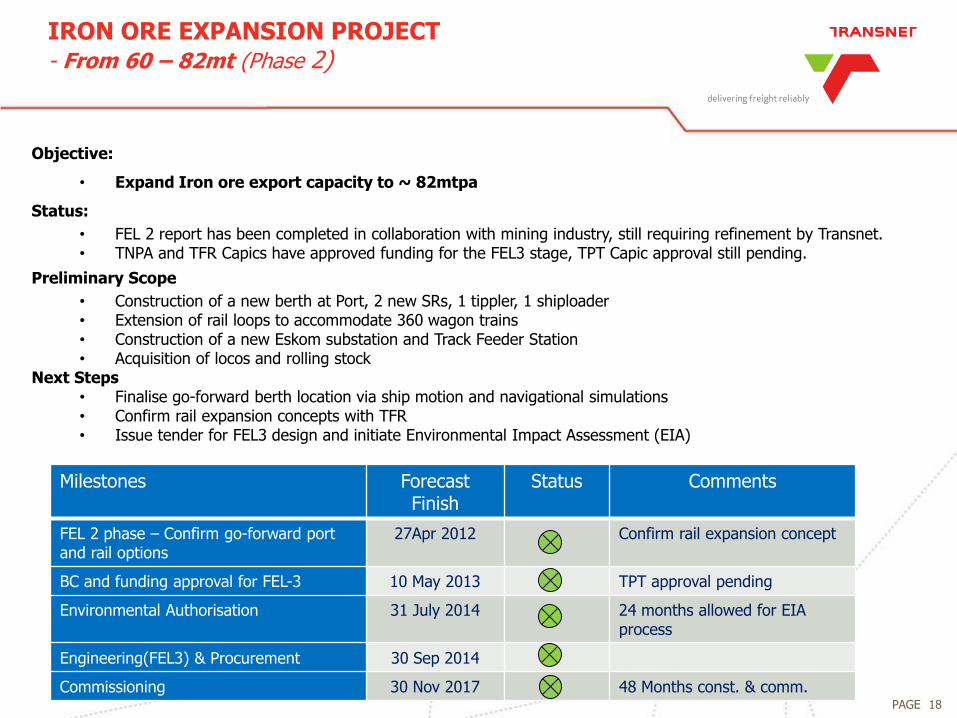
Milestones Forecast Finish
Status Comments
FEL 2 phase – Confirm go-forward port and rail options
27Apr 2012 Confirm rail expansion concept
BC and funding approval for FEL-3 10 May 2013 TPT approval pending
Environmental Authorisation 31 July 2014 24 months allowed for EIA process
Engineering(FEL3) & Procurement 30 Sep 2014
Commissioning 30 Nov 2017 48 Months const. & comm.
Objective:
• Expand Iron ore export capacity to ~ 82mtpa
Status:
• FEL 2 report has been completed in collaboration with mining industry, still requiring refinement by Transnet. • TNPA and TFR Capics have approved funding for the FEL3 stage, TPT Capic approval still pending.
Preliminary Scope
• Construction of a new berth at Port, 2 new SRs, 1 tippler, 1 shiploader • Extension of rail loops to accommodate 360 wagon trains • Construction of a new Eskom substation and Track Feeder Station • Acquisition of locos and rolling stock
Next Steps • Finalise go-forward berth location via ship motion and navigational simulations • Confirm rail expansion concepts with TFR • Issue tender for FEL3 design and initiate Environmental Impact Assessment (EIA)
IRON ORE EXPANSION PROJECT - From 60 – 82mt (Phase 2)
18