Embed Size (px)
Citation preview

47
TRANSNET’S STRATEGY IS DESIGNED TO MEET SYSTEMIC CHALLENGES BY:
• Operating the ports in a complementary manner to make the port system more efficient, increase maritime connectivity and reduce ocean freight rates.
• Implementing a high performance rail corridor backbone for the country that will alleviate corridor congestion and provide the capacity to meet long- term demand for freight in the economy.
• Integrating physical, financial and information flows along the supply chain to ease the administrative burden of trade and create greater visibility and responsiveness within industry supply chains.
• Formulating and implementing integrated service strategies for key customer segments to realise the synergies of the port, rail and pipeline systems.
• Enhancing the connectivity of the South African freight system with the regional freight system.
• Growing the skills base and supplier base for the broader industry.
• Identifying opportunities for black economic empowerment.

48
TRANSNET’S JOURNEY OF TRANSFORMATION
Transformation horizons for a networked organisation
•Boost HC
•Professionalise commercial management
•Invest in long-term capacity
•Manage across businesses
•Improve cross-divisional capital projects and financial planning
•Sharpen management system•Funding strategy
• Develop new customer services (e,g,. capacity management and supply chain integration products)
• Strategic organisational initiatives
• Develop and implement long term network improvement concepts
• Achieve world-class performance levels
• Build long term stakeholder relationships
• Explore international expansion
•‘Stabilise the core’
•‘Optimise and extend growth’
•‘Expand competitive advantage’Current
position
•‘Stop the bleeding’
• Financial restructuring
• New freight strategy and disposal of non-core assets
• Restructure corporate centre
• Create HC strategy
• Risk and governance
• Implement critical infrastructure projects
• Launch Vulindlela to stabilise key operational functions and capture productivity
• Implement critical capability building
• Complete disposals
2004 2009

49
TRANSNET’S TURNAROUND STRATEGY RESTED ON FOUR PILLARS
To establish a focused and integrated freight logistics business (Ports, Rail and Pipelines)Productivity and efficiency improvement through re-engineering programme (Vulindlela)Reorient company towards its customersRestructure and redefine role of Corporate Head Office to lead and support the turnaround Investment plan to address backlog and create capacity
Business Re-engineering
Strategic Balance Sheet Management
Dispose of non-core assets to release cash locked-upImprove the returns on assets (>WACC)Optimise cash flow and cash management Strategic asset/liability management to improve gearing
Corporate Governance & Risk Management
To enhance internal control environment Improved risk management with focus on safety Enhance corporate governance and risk management and establish a compact with Shareholder on service delivery
Human Capital
Transform culture and behaviour of staff to support new strategyIdentify and manage critical skills and refocus trainingTrain and establish accountability at all levels in the companyEstablish sound union relationships to assist with transformation of company

50
Investment plans
Governance and performance management
Client orientated planning and execution through integrated commercial management
•
Focusing on
5 key corridors,
providing
end-to-end logistics services to customers
•
Focus on key commodities
•
Productivity and efficiency improvements
•
Financial strength and sustainability
•
Enterprise-wide performance management linked to benchmarked operating KPIs
•
Risk and safety management
•
Transnet culture charter
•
Replacement and expansion of existing infrastructure to support growth. Investment of R80,5 billion across rail, ports and pipelines. Maintenance of core asset base
Reengineering, integration, productivity and efficiency
Capital optimisation and financial management
Safety, risk and effective governance
Human capital optimisation
Key elements for growth
GROWTH STRATEGY
Growth Strategy still relevant >> Transnet still committed despite slowdown >> Positioned for growth

51
Investment vs Capacity vs Volume Growth
0
10
20
30
40
50
60
0
5
10
15
20
08/09
18.1%
07/08
13.8%
06/07
9.2%
05/06
4.6%
%
18.3
34.1
6.6
R bn
53.5
Cumulative capacity growth
Cumulative Capex
INTRODUCTION TO TRANSNET INVESTMENT OVER THE PAST 4 YEARS
Created 18% additional capacity since 2005/06Total investment over period = R53.5bn
52
TRANSNET PLANNING HIERARCHY
Transnet National Infrastructure Plan
National Ports Plan
National Rail Plan
Pipeline Master Plan
Port Development Framework Plans:
DurbanRichards BayEast London
NgquraPort Elizabeth
Mossel BayCape TownSaldanha
Gauteng Freight Ring
Port / Rail Corridor Plans
Inland Corridor Plans
Hubs and Terminals Plan
Transnet Freight Demand Model
NMPP
Specific Commodity
Development Plans

53
CAPITAL INVESTMENT: FIVE-YEAR PLAN R80.5 BILLION
9 071
12 841
21 912
09/10
8 121
11 321
19 442
10/11
7 180
9 156
16 336
11/12
9 439
3 892
13 331
12/13
7 718
1 762
9 480
13/14
58%
42%
OtherTNPA TPLTPTTFR TRE
Sustaining
Projected Capex by nature (R million)
Projected Capex by Division
(R billion)
Expansion
Possible rescheduling of cash flows
over the 5 years
43.5
16.3
6.311.1
2.1 1.2

54
CAPITAL INVESTMENTS: MAJOR PROJECTS
Spending (R million)
Approved ETC
Spending since inception 2008/09 actual
8 769 4 583 1 389
• Expansion Phase 1A to 41mtpa: Project is almost complete with only the dust mitigation component remaining. This is due to the EIA delay relating to the Reverse Osmosis plant.
• Expansion Phase 1B to 47mtpa: Contracted with clients to increase throughput capacity.
• Commissioning of Stacker Reclaimer No. 4 is a major milestone of the project, completed during Q1 of 2009 and is performing at a rate of 10 000 tons/hour.
• Includes acquisition of 44 locomotives.• Ore volume capacity is expected to meet contractual
volumes by end of 2009. • Staggered loading of ore vessels has been initiated.
• Expansion Phase 1C to 60mtpa: In principle approval obtained to proceed with R4.3 billion project.
Iron Ore Channel Expansion: Phase 1A&B

55
Expansion above 71mtpa:
• Rail and power infrastructure work has progressed well and is 35% complete.
• The project team has been strengthened with the introduction of HMG to provide specialist engineering, procurement and construction management skills.
CAPITAL INVESTMENTS: MAJOR PROJECTS
Spending (R million)
Approved ETC
Spending since inception 2008/09 actual
5 011 1 736 487
Coal Line

56
Acquisition of 50 “Like New”
locomotives (ETC R887 million)
•
Production and manufacturing problems were experienced resulting
in a 12-month delay•
5 units have been delivered to TFR for testing•
Based on the latest delivery schedule the last locomotive will be delivered by December 2009
•
Similar production issues as experienced with the dual voltage locomotives for the Coal Line resulting in an 8-month delay
•
Supplier has committed to deliver testing units by August 2009
Acquisition of
100 “Fast Track”
Locomotives for General Freight Business
• Main aim is to service the General Freight Business and transport magnetite, copper, vermiculite and rock phosphate
• In November 2008 a confined tender was issued to acquire 100 “commercial off the shelf”
locomotives
• Three tenders were received and are currently being evaluated• Planned delivery is scheduled for the latter part of 2010.
CAPITAL INVESTMENTS: MAJOR PROJECTS
Acquisition of 44 Locomotives for the Iron Ore
Line (ETC*
R1.4 billion)
Average planned rate of delivery is:
7 in 2009 25 in 2010 12 in 2011
Acquisition of
110 Dual Voltage Locomotives (19E)
(ETC R3.4 billion)
*ETC amount included in the Iron Ore Channel Expansion
as reflected previously
•
Project undertaken to support the increase in capacity that will
be created by the Coal Line expansion above 71mtpa.
•
Behind schedule by 12 months but no impact on volume throughput is expected as latest projections indicate lower volumes.
•
Three locomotives have been delivered to TFR for testing and a further 6 are expected by June 2009.
•
Average delivery rate going forward will be between 6 and 8 units per quarter.•
Assembling of the units has commenced at Union Carriage Works in
Nigel.
Locomotive Acquisition Update

57
Construction of a new container handling facility next to Durban Container Terminal creating additional capacity of 720 000 TEUs per annum.
• The terminal has been operating since August 2007 and has reached full functionality during the year.
• Project is due for completion by August 2009.
CAPITAL INVESTMENTS: MAJOR PROJECTS
Spending (R million)
Approved ETC
Spending since inception 2008/09 actual
1 989 1 377 167
New Container Terminal at Pier 1 Durban
58
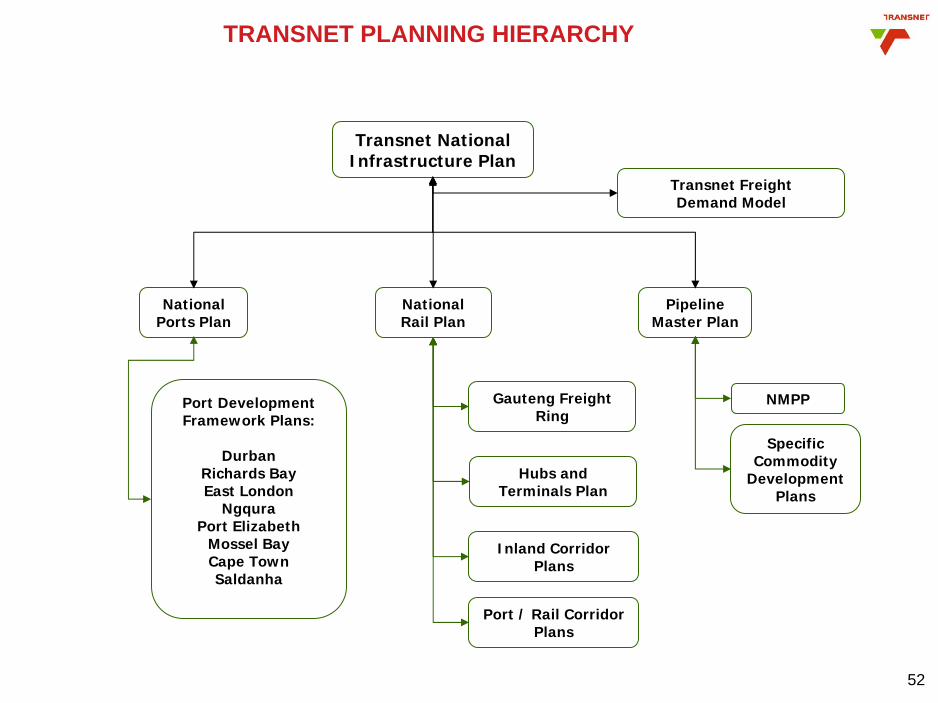
Creation of additional annual capacity of 1 million TEUs.
• Quayside work at berth 204 has been completed.
• Entrance gate facility is in progress and expected completion by September 2009.
• Concrete surfacing and new facilities at Y-site are progressing well.
• 200 000 TEUs capacity has already become available.
CAPITAL INVESTMENTS: MAJOR PROJECTS
Spending (R million)
Approved ETC
Spending since inception 2008/09 actual
1 489 690 599
Reengineering of Durban Container Terminal

59
CAPITAL INVESTMENTS: MAJOR PROJECTS
Objective is to improve the safety of navigation and enable larger vessels to enter the port. When complete the entrance channel will be 225m wide with depth ranging from 16m to 19m.
• Dredging in the temporary north channel is progressing well and was completed in May 2009.
• Stockpiling of rock at A-berth has progressed well and placement has since commenced.
• Armouring of the south breakwater is progressing well, however sea conditions are causing the occasional shut down.
• Commissioning of the temporary sand bypass system is planned for July 2009.
• Study for the permanent sand bypass system has been completed.
Spending (R million)
Approved ETC
Spending since inception 2008/09 actual
3 359 1 855 1 090
Durban Harbour Entrance Channel Widening

60
Aim of the project is to increase capacity to service the Western Cape region.
• The first 300m of a 1 200m new quay wall has been constructed and dredged to a depth of 15.5m. Handover to operations of this component is expected towards the end of July 2009.
• The first 4 of 16 RTG cranes have been delivered and will be operational by end of 2009.
• Geotechnical surveys revealed risks around the stability of the quay wall which led to delays in the schedule and additional costs of R220 million.
• Completion of the project is expected in 2013.
CAPITAL INVESTMENTS: MAJOR PROJECTS
Spending (R million)
Approved ETC
Spending since inception 2008/09 actual
4 126 1 461 892
Cape Town Container Expansion

61
Construction of a full service container terminal to service the new generation container vessels.
• Port infrastructure completed to date includes the completion of 630m of quay wall.
• 30ha of paved surfacing for the stacking of containers.• High mast lights, reefer points, admin facilities and access
roads.• Rail infrastructure completed thus far includes a marshalling
yard, 3 rail mounted gantry cranes and a link to the main line to Gauteng.
• Operating equipment installed to date includes 6 STS cranes, 22 RTG cranes, 30 haulers and 45 trailers.
• The terminal will commence commercial operations in October 2009 (expect 50 000 TEUs in 2009/10).
CAPITAL INVESTMENTS: MAJOR PROJECTS
Spending (R million)
Approved ETC
Spending since inception 2008/09 actual
7 885 3 065 2 230
Ngqura Container Terminal

62
The aim of this project is to build a 550km new trunk line from Durban to Gauteng 24” in diameter, addressing the increased demand for fuel in Gauteng and surrounding areas. Completion is expected towards the end of 2011.
• Transnet was granted a licence to construct the NMPP by NERSA.
• In May 2008 a R3.3 billion contract was awarded to Spiecapag Group 5, a South African French Consortium for the construction of the NMPP.
• Manufacturing for the 16” pipe commenced in April 2008 and all 105 000 tons of steel for the main 24” pipe has arrived in South Africa. The first 6 out of a total of 170km of 16” pipe has been laid in the Kendall/Waltloo area.
CAPITAL INVESTMENTS: MAJOR PROJECTS
Spending (R million)
Latest ETC Spending since inception 2008/09 actual
12.6 3 278 2 565
New Multi-Product Pipeline (NMPP)

63
FIVE-YEAR CAPITAL INVESTMENT PLAN
• Latest approved Five-year Investment Plan (2009/10) amounts to R80.5 billion.
• Changes in economic conditions necessitate the review of projects and the re-prioritising thereof as well as rescheduling of cash flows over 5 years to:
• remain within the financial parameters;
• ensure that revised customer demands are still met; and
• create capacity ahead of demand to meet future volume requirements.
• Of the planned Capital Investment of R80.5 billion, spending will be as follows:
• 59% in infrastructure related projects (R47.5 billion)
• 32% in rolling stock (R25.8 billion)
• 9% in acquisition of machinery and equipment and floating craft (R7.2 billion)
Transnet remains committed to implement the five-year capital investment plan to create appropriate and cost-effective capacity

64
REENGINEERING THE BUSINESS
• Enterprise Performance Management focusing on improving key performance indicators (KPIs) and to ensure alignment to primary value drivers as well as the effective management thereof. The project is receiving high priority and driven throughout the Company.
• The Corridor approach to business is yielding visible benefits on the main corridors:
• Coal Line (RBayCor) – railed average of 1.48mt per week compared to previous average of 1.2mt per week
• Iron Ore Line – weekly rail record (880 000 tons) in Feb 09 and monthly shipping record of 4.45mt in April 09
• NatCor – reduced average standing time in Kings Rest from 6 hrs to 2 hrs
• A Group commercial function was established to introduce an integrated port-rail service offering to our customers with a view to improving our customers’ experience of Transnet’s supply chain solutions.
• Business services integrate supply chain management, information technology and business intelligence with a view to develop a shared services centre.
Functions
Network
Touwsrivier
Mid Ilovo
Plaston
Kelso
Eshowe
Utrecht
Hawerklip
Naboomspruit
Middelwit
Vierfontein
S
i
s
h
e
n
Saldanha
Cape Town
East London
Port Elizabeth
Mosselbaai
Bredasdorp
ProtemStrandSimonstad
StellenboschFranschhoek
Bitterfontein
Porterville
Atlantis
Prins Al
fredHamlet
RiversdaleKnysna
C
a
l
i
t
z
d
o
r
p
George
Ladysmith
AvontuurPatensie
Klipplaat
Oudtshoorn
Rosmead
Kirkwood
AlexandriaPort Alfred
CookhouseSomerset East
Noupoort
De Aar
Prieska
Upington
Kakamas
Naroegas
Worcester
Sakrivier
CalviniaHutchinson
Kootjieskolk
Beaufort West
Belmont
Douglas
Hotazel
Warrenton
Pudimoe Makwassie
Mafikeng
Ottosdal
Vermaas
Schweizer-RenekeK
l
e
r
k
s
d
o
r
p
Orkney
Coligny
Bultfontein
Whites
Westleigh
Bloemfontein
Aliwal North
Sannaspos
Dreunberg
Springfontein
Koffiefontein
HofmeyerSchoombee
JamestownBarkley East
Maclear
Tarkastad QamataQueenstown
Blaney
Bethulie
Seymour
Umtata
FortBeaufort
Amabele
Maseru
Marquard
Ladybrand
Bethlehem
Wolwehoek
Lichtenburg
Warden
Harrismith
Bergville
Kokstad
Matatiele
HardingPort Shepstone
Durban
Kranskop
RichmondUnderberg
Stanger
NkwaliniRichards Bay
VryheidHlobane
Moorleigh
Ladysmith
Roossenekal
SteelpoortGraskop
MachadodorpBelfast
Lothair
Komatipoort
Baberton
Phalaborwa
Messina
L
o
u
i
s
T
r
i
c
h
a
r
d
t
Soekmekaar
ZebedielaVaalwater
Nylstroom
J’burg
Pretoria
O/fontein
E
l
l
i
s
r
a
s
Northam
CharlestownVrede
Potchestroom
Empangeni
Donnybrook
Greytown
Franklin
Kimberley
Marble Hall
Standerton
BethalB
/
p
l
a
a
s
Simuma
Mandonela
Winburg
Theunisen
ChroomvalleiDrummondlea
VirginiaGlen H
HiltonCopperton
C
u
l
l
i
n
a
n
R
a
y
t
o
n
Ui
t
enhage
K
l
a
w
e
r
T
h
a
b
a
z
i
m
b
i
P
i
e
t
e
r
s
b
u
r
g
B
e
i
t
B
r
i
d
g
e
H
o
w
i
c
k
N
a
k
o
p
Postmasburg
E
r
t
sManganore
Palingpan
Rustenburg
Hoedspruit
Glencoe
Newcastle
A
r
l
i
n
g
t
o
n
WitbankOgies
Breyten
Krugersdorp
WelverdiendS
e
n
t
r
a
r
a
n
d
Welgedag
K
r
o
o
n
s
t
a
d
G
o
l
e
l
a
Ancona
Sentrarand
DCT
PortNewcastle
Durban
YardDepot
Danskraal
Kaserne
Corridors
Exam
ple
CommercialProjects
Corridors
EPMBusiness services

65
Re-engineering integration, productivity and efficiency
Capital optimisation and financial management
Safety, risk and effective governance
Human capital execution
Growth through
WHILST THE GROWTH STRATEGY REMAINS APPROPRIATE, TACTICAL CHANGES HAVE BEEN MADE IN THE SHORT TERM
•
Capital expenditure has been reviewed to be aligned with latest volume projections•
Aggressive cost cutting has been effected to cater for lower revenues•
Procurement processes have been reviewed to lower input costs•
Greater focus on protecting volumes and preserving cash (iron ore and coal exports)•
Drive to explore growth opportunities in domestic markets (domestic coal and containers)•
Funding risk has increased and is receiving greater focus and using increasing flexibility

66
CONTENTS
Agenda
LOGISTICS AND MARKET ENVIRONMENT
ECONOMIC CHALLENGES GOING FORWARD
CONCLUSION
INTRODUCTION
ECONOMIC REGULATION
TRANSNET’S STRATEGY AND INFRASTRUCTURE PLAN
FINANCING THE INVESTMENTS
TRANSNET’S CORPORATE SOCIAL INVESTMENT

67
CORPORATE PLAN: 2009/10 INTEGRATED PLANNING AND EXECUTION
All assets in the Group must:• Be optimally utilised and managed in an integrated way• Generate returns greater than WACC of the company and thereby ensure a fair
return on investment• Cash flows are optimally managed to reduce financial risk
• Supply chain integration between port, rail and pipeline interface across the Group• Coordinated and integrated capital plan to optimise asset portfolio
- To meet customer demands and future requirements
Strategic financial and funding planning are managed and executed centrally
CORPORATE PLAN OBJECTIVES

68
Net cash (shortfall)/surplus*
Funding strategy
•
More than 50% of the funding requirements for 2009/10 already raised
•
Diversify sources of funding between the domestic and international market
•
Optimal mix between fixed/floating financial instruments
•
Cost-effective funding options
13/14
6 790
12/1311/12
(5 596)
10/11
(9 441)
09/10
(12 866)
2009/10 FUNDING PLAN: ENABLING THE ROLLOUT OF THE STRATEGY
Funding environment
•
Widening credit spread since global financial crisis
•
Increased cost of funding
•
Capacity of domestic market in context of Government and other large corporations accessing market
•
Low funding appetite in domestic and international market
Funding requirement (R million)
334
* Excluding current debt redemptions

69
ECATN27 15E
loco’s
TN23TN17Club loan
1 150*
CP
1 400
Funding activities to date
• A loan facility of 35 billion ¥en was signed with Japan Bank of International Cooperation (JBIC) during the latter part of May. This loan has a two year drawdown and a 10-year amortising repayment (Widening and deepening of the Durban harbour).
• The first ECA supported funding was signed with Finnvera on 17 April to finance port equipment. The first drawdown of R521 million occurred on 29 May 2009.
Funding raised since 1 April 2009 to date(R million)
*Excluding R6 billion raised during March 2009
FUNDING PLAN – PROGRESS TO DATE AND ACTIVITIES FOR 2009/10
642 587485
213
521

70
Possible funding sources
• Domestic bonds (TN17, TN23 and T27 Bonds)Currently drawing down R1 billion per month and plan to launch at least 1 new bond to increase the size as liquidity increases
• Development Finance InstitutionsAFDB at due diligence stage is expected to be concluded in due course
• Domestic LoansRand Bilateral loans from banks (8) and other financial institutions (2)
• Other International InitiativesAFLAC Loan – legal documentation finalised but still negotiating pricing levels
• Commercial Paper Bi-weekly issues of Commercial Paper varying between R500 million and R750 million, but the plan is to replace maturities with bonds
• Global Medium Term Note (GMTN)Last year this programme was postponed due to the state of the global debt capital marketsClose to concluding documentation and update with year-end financials, if not implemented will replace with domestic bonds (Plans are progressing well for the listing of the GMTN)
• Export Credit Agencies (ECA)For imports ECA will form an important source of funding
FUNDING PLAN: ENABLING THE ROLLOUT OF THE STRATEGY

71
CONTENTS
Agenda
LOGISTICS AND MARKET ENVIRONMENT
ECONOMIC CHALLENGES GOING FORWARD
CONCLUSION
INTRODUCTION
ECONOMIC REGULATION
TRANSNET’S STRATEGY AND INFRASTRUCTURE PLAN
FINANCING THE INVESTMENTS
TRANSNET’S CORPORATE SOCIAL INVESTMENT

72
NEW POLICY THINKING ON SOE’S
• Extract from Minister Hogan’s budget speech• The current regulatory system was established during a period of minimal investment, and
has not been adequately revised. • Given the accumulated backlog of investment in infrastructure, it is critical that we create an
environment where the private sector can participate in the system alongside SOEs, rather than as an alternative to them.
• It is absolutely critical that funding models for our enterprises be finalised as soon as possible.
• In the present worldwide economic recession and in the light of the huge backlog in infrastructural investment, the SOEs must massively expand the rollout of their infrastructure programmes.
• Extract from Minister Ndebele’s budget speech• We should be forward-looking and start investing in a manner that will meet future transport
requirements.• We are also working towards a framework for the creation of a single Transport Regulator.
South Africa needs a shared vision for the freight transport system that responds to the unique challenges confronting the country and the region.
Regulatory reform should then be targeted towards realising this vision.

73
EXISTING POLICY AND REGULATORY TRENDS ARE MISALIGNED WITH NEW POLICY THINKING
• Current port and pipeline Regulators’ mandates encourage:• tariffs to be set low at the expense of long-term infrastructure investment;• inconsistent and discretionary regulatory rules, creating uncertainty and risk for
investment planning;• Regulators to take on policy-making roles that impact on Transnet’s mandate.
• Other government stated port, rail and pipeline policy assumes that: • competition to Transnet operations is a pre-requisite for freight system optimization;• separating infrastructure ownership from operations is necessary for operational
improvements;• the state should own and invest in infrastructure and allow private sector to operate; and• splitting Transnet into separate state-owned enterprises will benefit the economy.
• This policy thinking does not always recognize that Transnet’s integrated infrastructure ownership, combined with its revenue from operations, enables it to borrow optimally in the capital markets for long-term investments.
Without a strategic SOE role, the freight network will depend on project-specific state revenue allocations and short-horizon, costly private sector investment.

74
IMPACT OF REGULATION ON REVENUES
Transnet Pipelines
In its 2009/10 tariff determination for Transnet Pipelines, NERSA decided not to allow a recovery of costs associated with borrowings for the construction of the NMPP, leaving Transnet with approximately R1 billion revenue shortfall in 2009/10. This will also result in a significant spike in tariffs when the NMPP is commissioned in 2011/12.
Transnet National Ports Authority
The Ports Regulator’s Directives to be published shortly, provide for a cap to be imposed on TNPA tariffs from 2010/11 at “CPIX minus x”, where “x” is an “efficiency factor determined by the Regulator”, and a tariff level re-basing exercise every five years. This will significantly constrain port infrastructure investment going forward.
The key risks confronting Transnet are revenue risk and the fragmentation of the existing network.

75
CONTENTS
Agenda
LOGISTICS AND MARKET ENVIRONMENT
ECONOMIC CHALLENGES GOING FORWARD
CONCLUSION
INTRODUCTION
ECONOMIC REGULATION
TRANSNET’S STRATEGY AND INFRASTRUCTURE PLAN
FINANCING THE INVESTMENTS
TRANSNET’S CORPORATE SOCIAL INVESTMENT
76
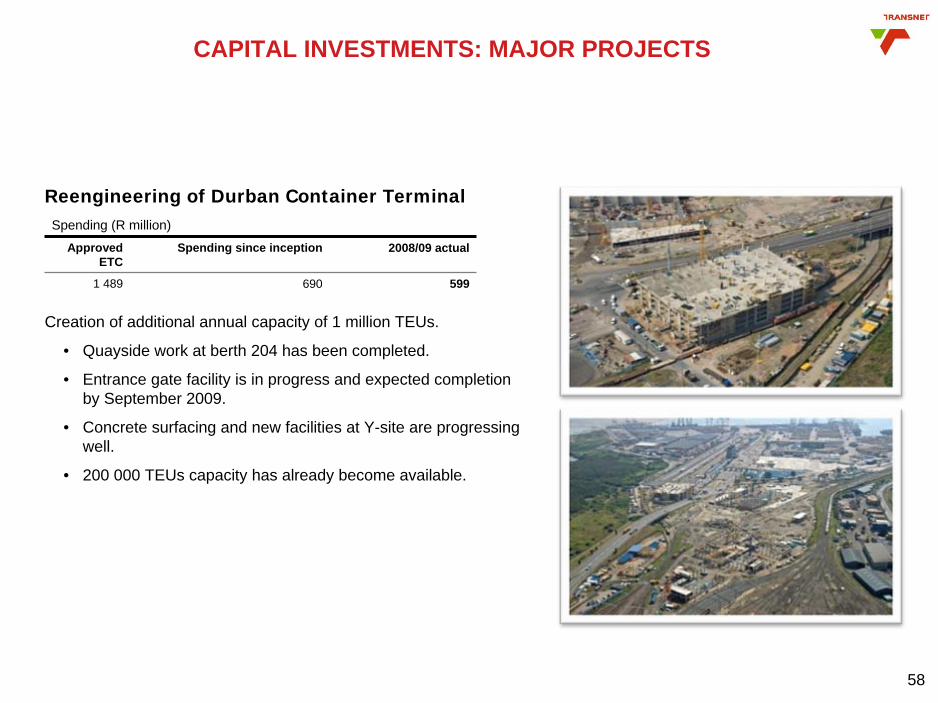
THE ECONOMIC CRISIS: BUSINESS LEADERS BELIEVE THAT SCENARIO 2 AND 3 ARE MOST LIKELY
SOURCE: Centre for Managing Uncertainty; McKinsey Quarterly Executive Survey, March 2009; McKinsey Global Institute
Global credit, capital and trade markets reopen and recover
Severe global recession
Very severe global
recession
Scenario 2: Battered, but
resilientProlonged recession
through mid-2010 and sub-trend
growth through 2012
40%
Scenario 4: Long freeze
Recession lasts for more than five years
'Japan-style'
12%
Scenario 1: Relatively quick recoveryPolicy makers succeed; rebound by end of 2009
14%
Scenario 3: Modest recovery but stalled globalisationModerate recession of one to two years followed by structurally slower global growth
34%
% Executives view of
scenario likelihood
Global credit, capital and trade markets close down and remain volatile

77
Revenue and volume growth
Non-compliance with safety and standard operating procedures (SOPs)
Economic regulation (Ports and Pipelines)
Funding and liquidity risk
Delivery of capital projects on time and within budgets and affordability
Asset performance and maintenance regime
Human resources capability to deliver on growth strategy
Environmental risks
Input costs – energy (electricity and fuel), steel, pricing and supply
Commodity and concentration risks
E
D
C
B
A
7 6 5 4 3 2 1
3
1
26
587
49
Consequence Rating
Like
lihoo
d R
atin
g
Strategic residual risks heat map
10
Priority I risk
–
Transnet Group CE and Board levelPriority II risk
–
Operating Divisions’
CEOs levelPriority III risk
–
General Managers’
levelPriority IV risk
–
Managers’
levelPriority V risk
–
Employees’
level
3
1
2
6
5
8
7
4
9
GROUP KEY RISKS
Mitigating plans are in place to manage the key risks and are monitored by the appropriate governance structures

78
CONTENTS
Agenda
LOGISITICS AND MARKET ENVIRONEMENT
ECONOMIC CHALLENGES GOING FORWARD
CONCLUSION
INTRODUCTION
ECONOMIC REGULATION
TRANSNET’S STRATEGY AND INFRASTRUCTURE PLAN
FINANCING THE INVESTMENTS
TRANSNET’S CORPORATE SOCIAL INVESTMENT

79
CORPORATE SOCIAL INVESTMENT
• Transnet invests more than R141 million in the following initiatives to:-
-
Grow its own skills and those to serve the market in general;
-
Improve access to quality primary health care;
-
Develop sports;
-
Develop and improve access to arts and culture;
-
Provide containerised infrastructure assistance.

80
• Like many organisations, Transnet, faces the skills challenges of:-
• Retaining experienced technical staff in light of the current economic growth in the country.
• Shortage of critical staff accentuated by the lack of “feeder pipelines” within companies.
• Companies opt to “buy” skills at attractive remuneration packages rather than invest in development pipelines.
• In light of the above Transnet has developed a skills resource plan that is supported by a comprehensive “grow your own” strategy. The strategy focuses on nurturing young talent and strengthening the ‘engineering management and commercial skills pipeline’.
GROWING OUR OWN SKILLS

81
• In line with our ‘Grow your Own’ strategy the following initiatives are currently in progress:
• To build an adequate ‘engineering skills pipeline’ we currently have 310 Engineering bursars and 341 Technician bursars receiving financial support and training from Transnet to the tune of R40 Million.
• To increase Maths and Science throughput at a schools level, Transnet is presently supporting 7 Dinaledi Schools.
• Transnet’s Graduate in Training (GIT) targets commercial graduates and provides them with relevant and valuable workplace experience. Currently have 38 GITs.
• These initiatives will be maintained for the next three years.
GROWING OUR OWN SKILLS
82
THE TRANSNET FOUNDATION: EDUCATION
Improved quality of education in Maths, Science, Technology & English at target sites so that learners achieve outstanding results in these learner areas, and can contribute to alleviating the challenge of scarce skills. Develop sound curriculum knowledge amongst educators to improve teaching and learning in these fields.
Sharp Minds! Get Ahead in Life – Maths & ScienceTransnet Sharp Minds Learner DevelopmentTransnet Sharp Minds Educator DevelopmentTransnet Sharp Minds Infrastructure DevelopmentTransnet Sharp Minds After-care Learner Support
The Transnet Sharp Minds programme will contribute towards addressing the critical skills shortage within the country and also impact positively on the skills requirements of Transnet’s human resources.
Strategic focus of Portfolio
Projects delivered to
achieve strategy
Business fit - Alignment

83
TRANSNET FOUNDATION HEALTH: PHELOPHEPA
An 18 coach primary health care train
Eye, dental, health, counseling and pharmaceutical clinics on board.Also offers health education outreach programmes.
36 stops a year and delivers health care to 43 000 patients annually
The Transnet-Phelophepa health care train became the first South African Corporate Social Investment project to receive the United Nations Public Service Award for excellence in public service delivery. The United Nations Public Service Awards Programme is the most prestigious international recognition of excellence in public service. It rewards the creative achievements and contributions of public service institutions to development in countries around the world.

84
TRANSNET FOUNDATION: SPORT
The sports portfolio is aimed at identifying and developing excellence in sport amongst the youth of South Africa. This is achieved by providing access to sporting opportunities for youth who fall outside of the regular net of sporting bodies.
Rural & Farm School Sport GamesTransnet Soccer School of Excellence
Creating an enabling sport environment to harnesses the talent of the participating youth, and, through the positive impact, strengthen the social fabric of the targeted communities. Access to sporting excellence is aimed at a professional career in sport and resultant economic sustainability
Strategic focus of Portfolio
Projects delivered to achieve strategy
Business fit - Alignment

85
TRANSNET FOUNDATION: ARTS & CULTURE
Access to the Arts – Theatre Trucks
Five horse and trailor pantechnicons converted into performance stages
Fully equipped with sound and lighting stage facilities
Implemented in partnership with Theatres across the country
Aimed at moving the arts to the people, especially rural communities
Theatres can implement an outreach programme, and artists can take their productions beyond Theatres in a cost effective way

86
TRANSNET FOUNDATION: CONTAINERISED ASSISTANCE PROGRAMME
The containerised assistance programme of the Transnet Foundation is an innovative way of addressing the shortage of infrastructure and capacity in rural communities.
SAPS Kagisho (Northern Cape) Satellite Police StationSAPS Dundee (Kwa-Zulu Natal) Satellite Police StationNkomazi (Mpumalanga) Multi Purpose Centre
Containers are an integral part of Transnet freight business. At the end of their lifecycle these containers are used by Transnet Foundation, renovated and made available for social investment projects specifically in the areas of social development and safety and security.
Strategic focus of Portfolio
Projects delivered to achieve strategy
Business fit - Alignment

87
Transnet’s Training Outside Public Practice Programme “TOPP”
Approved Training
Organisation
Thuthuka Programme
TOPP Programme
Transnet is affiliated with the South African Institute of Chartered Accountants as an Approved Training Organisation since 1997.
Currently 30 bursars are supported on the Thuthuka programme which aims to place African and Coloured students at selected accredited universities on special undergraduate BComm accounting programmes.
• Transnet has 11 Learners on the TOPP programme.• TOPP is a 3 year learnership programme for candidates that have a Certificate in Theory
of Accounting/ BCompt Honours or equivalent who wish to pursue a career as Chartered Accountants.
• Since the inception of the TOPP programme Transnet has trained 65 candidates of which 30 qualified as Chartered Accountants.
88
CONTENTS
Agenda
LOGISITICS AND MARKET ENVIRONEMENT
ECONOMIC CHALLENGES GOING FORWARD
CONCLUSION
INTRODUCTION
ECONOMIC REGULATION
TRANSNET’S STRATEGY AND INFRASTRUCTURE PLAN
FINANCING THE INVESTMENTS
TRANSNET’S CORPORATE SOCIAL INVESTMENT

89
CONCLUSION
The slowdown in economic activity is a set back to the growth path. Transnet will however, proceed with the roll out of the growth strategy and bolster the impact of lower economic growth by:
Focussing on identified growth opportunities in domestic market (container and domestic coal)
and for exports (iron ore and coal);
Productivity/efficiency improvements to improve competitiveness and lowering operational costs
as well as to drive performance to KPI benchmarks;
Embedding lower cost structures on a wide front within the company;
Continuing planned infrastructure investments to create capacity in line with customer demand;
Being nimble and proactively assess key cash drivers to ensure that gearing and cash interest
cover metrics are not breached.
Transnet has created a solid foundation to withstand the current economic downturn and is therefore able to meet the 5-year growth targets whilst maintaining a strong balance sheet.

90
THANK YOU

91
95
133137155
220230
302
10710410590
160158
211234
Lime Chrome ore export
Ferro-chrome
173-185
110-148
Steel
500
Manga- nese crude
export
450-600
150-219
Coal Manga- nese
domestic
284-528
252-355
Lime-stone
284-528
252-355
Iron ore Cement, coal,
dolomite, iron ore,
lime
Raw materials
Ferro Manga-
nese Silicon
19.80-20.4011.67-13.05
Pulp-wood, paper, reels,
woodpulp
229
157
EXAMPLES FROM CUSTOMERSR/tonne
46%
Source: Transnet
Road tariff
Rail tariff
Rail ave.
Road ave.
FREIGHT RAIL TARIFFS ARE VERY COMPETITIVE AND BULK EXPORT LINES OPERATE AT WORLD CLASS LEVELS
BACK-UP SLIDES

92
South Africa’s Coal Export rail costs are competitive against major exporting
countries, second only to EC’s (Columbia) rail rates at more than thrice the distance in SA
Country OperatorNo of
Colleries ATD (km)Avg Rail Rate(US cents/tonkm) Rank
Australia
PN 35 110 4.28 7
QR 39 228 2.88 6
Colombia
EC 5 150 0.80 1
FdA 10 202 3.57 7
Canada
CNR 7 1019 1.39 3
CPR 6 1183 1.53 4
China National 92 630 1.64 5
SATransnet
Freight Rail 43 530 1.31 2
Source : International Freight Rates Report : Barlow Jonker : 2005
OUR COAL LINE OPERATES AT WORLD CLASS STANDARDS

93
Measure/CategoryRanking System: 1 – Best, 2 – Mid, 3 – Worst
South Africa Western Australia
Central Qld Coal
Mine-Rail Loading Rate 2 1 3
Cycle Times 3 2 1
Train Length 2 1 3
Ship loading Rate 2 1 3
Train path utilisation 3 2 1
Net tonnes per train 2 1 3
Locomotive crew cost per hour 1 2 3
Electric energy 1 - 2
Train set cost 2 3 1
Rail Line Haul Pricing 1 2 3
ZAR / tonne 31 – 41 26 – 32 30 – 36
Line Haul (km) 860.00 322.00 200
ZAR / ntk (above rail) - 0.05 – 0.06 0.10 – 0.12
ZAR / ntk (below rail) - 0.03 – 0.04 0.05 – 0.06
ZAR / ntk (total) 0.04 – 0.05 0.08 – 0.10 0.15 – 0.18
Transnet’s
cost per ton is higher than Australian supply chains however on
a net tonne km basis, Transnet’s
pricing is much lower
EXPORT IRON ORE BENCHMARKS
94
CONTEXT OF THE NATIONAL INFRASTRUCTURE PLAN
• Transnet owns, manages & operates a national freight transport system consisting of Port, Rail & Pipeline infrastructure
• To optimise benefits, this system needs to be developed and operated in a coordinated and integrated manner
• The National Infrastructure Plan (“NIP”) provides the basis for the holistic infrastructure development of the freight transport system.
• The NIP is Transnet’s strategic long-term infrastructure planning framework

95
PLANNING PRINCIPLES OF THE NIP
• Provide capacity ahead of demand
• Ensure sustainability of development plans
• Integrate port, rail and pipeline planning
• Alignment with national road and electricity supply planning
• Provide capacity through operational efficiencies before infrastructure provision
• Provide reliable, safe and cost-effective freight handling services of world class standards
• Benchmark all developments internationally

96
ECONOMIC REGULATION: PORTS
National Ports Act, 2005 (Act No. 12 of 2005)
• The Act became effective 26 November 2006.
• Ports Regulator Board was appointed in December 2006 and the Ports Regulator’s CEO commenced work in mid-2008.
• The Act makes Transnet National Ports Authority (“TNPA”) responsible for ensuring the safe, efficient and effective functioning of the ports.
• It provides for the corporatisation of TNPA and for competition to Transnet Port Terminals. Steps to corporatise TNPA were stalled by government in 2008 in light of Transnet’s investment commitments.
• Ports Regulator’s functions are annually to approve TNPA tariffs; promote competition in ports; and adjudicate complaints and appeals from port users.
• Directives setting out the manner in which the Ports Regulator will perform its statutory functions are, however, still outstanding with deadlines on their finalisation consistently moving.
• In accordance with draft Directives issued by the Regulator, TNPA’s tariff application for 2009/10 was submitted on 1 August 2008. No response was received from the Ports Regulator, and in the light of the Directives not being finalised in time for the commencement of the 2009/10 financial year, TNPA had no choice but to proceed with inflation-linked adjustments to its tariffs in the normal course. These adjustments are however, inadequate to recover port investments going forward.
• In regulations issued by the Minister of Transport in November 2007, the Ports Regulator was tasked, within one year, to review the current participation in port operations of public entities, private entities and public-private partnerships and make recommendations to the Minister. To date, this review has not commenced.

97
ECONOMIC REGULATION: PIPELINES
Petroleum Pipelines Act, 2003 (Act No. 60 of 2003)
• NERSA’s powers under the Pipelines Act are: – to licence petroleum pipelines and storage facilities, and – to set and approve tariffs as a condition of licence
• Transnet Limited submitted the 2009/10 petroleum pipeline and storage tariff applications to the NERSA on 11 November 2008.
• Due to the revised implementation schedule of the NMPP and Transnet’s proposed treatment of the F-factor (as borrowing costs) and the correction of an error regarding the capitalisation of an asset, the required revenue is R 2,043m, or a tariff increase of 74%.
• History of NERSA decisions on Transnet Pipelines’ tariffs to date:
Tariff period Transnet’s proposed tariff increase
NERSA decision
2007/08 5.6% 0%
2008/09 15% 4.43%
2009/10 82.50% Pending (current draft decision for public comment – 77%)

98
ECONOMIC REGULATION: PIPELINES
The Gas Act, 2001 (Act No. 48 of 2001)
• NERSA’s powers under the Gas Act are:
– to regulate prices, monitor and approve, and
– if necessary, regulate gas transmission and storage tariffs.
• NERSA published the draft methodology for piped-gas industry in June 2008.
• Transnet submitted detailed comments on 14 August 2008 to the draft methodology for piped- gas industry . To date, NERSA has not finalised the methodology.
• No licence received as yet for the Gas Pipeline. New contract with Sasol is in place based on 80% ship-or pay arrangement.