Embed Size (px)
Citation preview

Transparency, Protest and Political (In)Stability∗
James R. Hollyer†1, B. Peter Rosendorff2, and James Raymond Vreeland3
1Department of Political Science, University of Minnesota2Wilf Family Department of Politics, New York University
3Mortara Center for International Studies, Georgetown University
May 30, 2013
Abstract
The collapse of political regimes – both democratic and autocratic – is often brought about
through large-scale mobilization and collective action by elements of the populace. The will-
ingness of any given member of the public to participate in such actions against her leaders
is contingent upon her beliefs about others’ willingness to similarly mobilize. In this paper,
we examine the effect of a specific form of transparency – the disclosure of economic data
by the government to the populace – on citizen belief-formation, and consequently on col-
lective mobilization. We present a theoretical model in which disclosure, under autocratic
rule, (1) for a range of parameter values, increases the frequency of mobilization, and, for
all parameter values, (2) increases the extent to which mobilization is correlated with incum-
bent performance. In democracies, by contrast, disclosure increases voter discrimination with
respect to government performance, thereby increasing the effectiveness of elections in ad-
dressing agency problems in representative government. Because voting and mobilization
act as substitute mechanisms in disciplining democratic governments, the risk of mobilization
falls in transparency. We empirically test these claims and find that all enjoy robust support.
Transparency destabilizes autocracies even as it stabilizes democracies.
∗We would like to thank Christina Bodea, José Fernández-Albertos, Sebastian Saiegh, and participants in theLeitner Political Economy Seminar at Yale University, the 2012 MPSA panel on Transparency, Monitoring and Democ-racy, the 2012 EPSA panel on Democratization, the 2013 MPSA panel on the Determinants of Transparency andCorruption, the 2013 Mini-IPE Conference at Georgetown University, the 2013 Alexander Hamilton Center Gradu-ate Conference at NYU, and the Stanford University Methods Workshop for helpful comments and suggestions. Allremaining errors are our own.†Corresponding author. 1414 Social Sciences Building, 267 19th Ave. S, Minneapolis, MN 55455.
More than petards or stilettoes, therefore, words – uncontrolled words, circulating
freely, underground, rebelliously, not gotten up in dress uniforms, uncertified – frighten
tyrants. But sometimes it is the official, uniformed, certified words that bring about
the revolution.
– Ryszard Kapuscinski, Shah of Shahs1
Governments, regardless of the form of political regime, live in the shadow of mass politi-
cal unrest. At any given moment in time, the public may reject the existing political order and –
through action in the streets – unseat their rulers or even upend the prevailing political regime.
Under autocratic rule, this is one of two forms of threat that sitting leaders must negotiate in their
decision-making: Mass mobilization constitutes the threat from below. Autocratic leaders must
also be concerned with threats to the existing regime emerging from within their own ruling coali-
tion.2 In democracies, mass mobilization may serve to enforce the existing political order – the
threat of mass protests may ensure leaders comply with unfavorable electoral results and step
down from office (Fearon, 2011; Little, Tucker and LaGatta, 2013). Alternatively, mass mobiliza-
tion – particularly by extremist groups – may threaten continued democratic rule (Lipset, 1959).
However, those who would participate in mass unrest against their political leadership face a
critical problem: While protests that draw universal (or near universal) participation are capable
forcing the hand of nearly any form of political leadership, protests that do not pass this threshold
may be put down, often quite violently and at considerable cost to participants. The willingness of
any one citizen to participate in anti-regime mobilizations is therefore contingent on the willingness
of others to similarly participate (Kuran, 1991; Lohmann, 1993). Participation in mobilization is
thus subject to strategic complementarities – a given citizen grows more willing to engage in
protest as she believes others are similarly willing to mobilize. But what then allows citizens to
form shared beliefs in a manner that allows for coordinated protest?
In this paper, we examine the role the informational environment plays in facilitating or inhibit-
ing collective action, and how information thus translates into the stability of political regimes. In
particular, we focus on the presence or absence of publicly observable information on govern-
ments’ economic performance. Publicly observable information plays an outsized role in interac-
tions characterized by strategic complementarities, since such information allows citizens to not
only update their beliefs about government performance, but also to update their higher order
1p. 1032Svolik (2012) characterizes these threats as ‘the problem of authoritarian control’ and ‘the problem of autocratic
power sharing.’
1

beliefs – their beliefs about the beliefs held by other citizens (Morris and Shin, 2002).3 Pub-
licly observable economic information thus facilitates the formation of shared expectations about
the likely success of mass mobilization, rendering such mobilization feasible where absent such
information it would be impossible.
We contend that, under autocratic rule, the availability of public economic information – which
we term transparency – facilitates collective action and so renders autocratic regimes more vul-
nerable to threats from below.4 In particular, transparency eases mobilization under economically
under-performing autocrats – increasing the role economic growth plays in determining autocratic
stability. For plausible parameter values in our model, the increased provision of information more
generally increases the ability of citizens to mobilize, directly reducing the stability of autocratic
regimes.
Under democratic rule, transparency plays a very different role. Citizens in democracies al-
ready encounter an information rich environment, due to the role elections play in informing citi-
zens of the level of popular discontent (Fearon, 2011; Little, Tucker and LaGatta, 2013). Rather
than directly influencing the ease of mass mobilization, therefore, transparency indirectly influ-
ences this probability through its effects on the electoral process. As more information is made
available to citizens, they become better able to electorally sanction under-performing leaders
(and reward over-performing leaders). Transparency therefore enhances the efficiency of the vot-
ing process as a mechanism for redressing agency problems in representative government. As
elections become more efficient, the incentive for citizens to engage in mass protest against the
current regime declines. Mobilization and voting act as substitute mechanisms for disciplining
under-performing leaders. Since transparency improves the efficacy of elections, it reduces the
necessity of unrest, stabilizing democratic regimes.
To anticipate our empirical results, we find support for our main theoretical predictions: trans-
parency is associated with an increased risk of autocrat removal (via mass revolt or democratiza-
tion) and a reduced risk of democratic collapse (transition to autocracy). These findings are asso-
ciational – they do not demonstrate that transparency causes increased protests under autocracy
or reduced instability under democracy. Given relatively the relative infrequency of such events
and the cross-national nature of these data, proof of causality is extraordinarily difficult. However,
we do conduct a number of additional analyses which serve to strengthen our contention that the
mechanisms we describe are, in fact, at work.
First, note that the nature of our two main hypotheses helps to reinforce our results against
3For an early application of higher order beliefs in a different setting, see Przeworski (1998).4For reasons of analytical crispness, we adopt a narrowly tailored definition of transparency throughout. We
recognize that the term can be used more broadly or defined along other lines. We return to this issue below.
2
omitted variable bias. For any variable that is correlated with transparency to systematically bias
our results, it must have opposing effects on the stability of autocratic and democratic regimes.
We further examine the relationship between transparency, growth, and forms of autocratic
instability not involving mass unrest. We find that highly transparent autocrats face a reduced
risk of removal via a coup (conceived of a as plot involving the military or other elites and backed
by the threat of force). If we examine all forms of autocratic regime removal, transparency’s
contrasting associations with coups and unrest offset, such that there is no association between
transparency and the risk of regime collapse overall. The relationship between autocratic stability
and transparency only holds for forms of instability mediated by mass unrest. This finding belies
the notion that only weak autocrats – who are vulnerable to all forms of instability – provide
information to the public.
We additionally test the association between transparency and various forms of opposition to
autocratic regimes – both forms of opposition that entail mass unrest (anti-government demon-
strations, strikes) and those that do not (assassinations, guerrilla movements, revolutions). We
find that transparency increases the frequency of the former and is broadly uncorrelated with the
latter. In these tests, we accomplish several aims. First, we assess model mechanisms more
directly than our results with regards to democratic and autocratic collapse allow. Second, we
guard against a form of selection bias. If autocratic regimes liberalize information provision in
order to buy civil peace, we would not expect to find a robust (positive) relationship between
transparency and the frequency of demonstrations or strikes. Third, we further guard against a
spurious relationship between transparency and autocratic stability. If omitted factors correlate
with both transparency and threats to autocratic regimes, it is unlikely that these factors would
only correlate with forms of instability involving mass unrest. Rather, we would expect similar
findings with respect to assassinations, coups, guerrilla movements, and revolutions.
These results cannot fully insulate our findings from the threat of endogeneity. They do, how-
ever, lend considerable credence to our claims regarding the mechanisms linking transparency
and regime stability. Our theory posits that all of the above findings should hold. Few alternative
mechanisms can credibly explain this pattern of results.
The paper proceeds as follows: We first outline our argument in greater detail. We then
formalize these intuitions using a game theoretic model of collective action, political regimes, and
transparency. This model predicts (1) that transparency strengthens the relationship between
growth and autocratic instability, (2) that – for a broad range of parameter values – transparency
is associated with a greater risk of autocratic collapse (due to pressures from below), (3) that
transparency is specifically associated with mass mobilization (strikes, demonstrations) and not
3

other forms of regime instability (assassinations, coups), and (4) that transparency is associated
with the stability of democratic regimes. We then empirically test all four implications, using a
measure of transparency that reflects the reporting/non-reporting of economic data to the World
Bank.
Argument
Political regimes must be self-enforcing. Actors in the political system – the leadership, opposition
and citizens – cannot usually appeal to external enforcement bodies to ensure compliance with
constitutional provisions; compliance with institutional rules must emerge rationally in response
to the strategies of other players in the political game – institutions must be an equilibrium (Grief,
2006; Przeworski, 2005; Weingast, 1997). The compliance of all actors is ensured by the threat
of punishment by other political actors. In some instances, compliance will be ensured by the
threat of retaliation by political leaders or parties against other elites that transgress institutional
rules (Myerson, 2008; Przeworski, 2005; Wantchekon, 2004). This possibility represents a threat
to leaders from within the political system. In other instances, compliance with political rules
is enforced by the threat of unrest from below (Fearon, 2011; Weingast, 1997; Wood, 2000).
Citizens’ threat to remove sitting political leaders – or even to upend the existing political system
– by taking to the streets serves as a constraint on government actions.5 Variation in the ability of
the citizenry to so-mobilize thus plays a critical role in the stability and form of political institutions.
Mass political mobilization has therefore been given a prominent place in explanations for the
ousting of political leaders and instability of political regimes. Nowhere is this more true than in
the literature on democratization. Theoretical accounts of democratization often stress the role
of revolutionary threats on the part of the masses in securing the extension of suffrage (e.g.,
Acemoglu and Robinson, 2006; Boix, 2003; Rosendorff, 2001), a claim given weight by empirical
research (e.g., Przeworski, 2009). The threat that mass mobilization poses for autocratic leaders
and ruling cliques – and the importance of attempts to repress or co-opt the masses – has played
a prominent role in writings on authoritarian regimes more generally (e.g., Gandhi, 2008; Svolik,
2012; Wintrobe, 1998). Similarly, under democratic rule, mass mobilization poses a potential
threat to both particular political leaders and the established political order. Lipset (1959) in
particular notes that mobilization may lead to the upending of democratic rule and the transition
5This conception of threats from below is not confined to formal models of political institutions. Notions of thethreat citizen mobilization poses to entrenched regimes relate to the concept of ‘tacit consent’ dating back to Locke(1980/1690).
4

to autocracy. More recent works stress that the threat of mass unrest may make democracy self-
enforcing – the threat of mass protest may induce incumbent leaders who are voted out of office
to step down from power (Fearon, 2011; Little, Tucker and LaGatta, 2013). In these models, the
actual manifestation of unrest is indicative of a democratic breakdown – non-compliance by one
or more parties with the democratic equilibrium.
If mass unrest plays such a critical role in political stability, what factors make unrest more or
less feasible? How do these factors, in turn, influence the stability of ruling cliques and political
regimes? We address one such factor – government transparency – in this paper.
Our conception of mass unrest begins with the observation – attributable to Kuran (1991)
and Lohmann (1993) – that protest is subject to a collective action problem. The costs any citizen
faces from engaging in protest are falling in the number of her fellow citizens who similarly choose
to protest – mass unrest is subject to strategic complementarities. These complementarities may
arise from the simple logistics of repression – for a given level of government response, the
probability that a particular protester is arrested or physically harmed falls as the number of her
fellow protesters rises. Or, it may be that the police/military will be unwilling to respond with
force to a sufficiently large mass of civilians on the streets. Regardless, the costs of protests
decline, and the odds of meeting the objective of unseating or forcing compromises from the
sitting leadership rise, with turnout.
The willingness of any given citizen to turn out in the streets is therefore dependent on her
beliefs about whether her fellow citizens will similarly mobilize. In such an environment, publicly
observable information will play a particularly important role in citizen behavior. We particularly
focus on the role of publicly observable information on the economic performance of the sitting
government. We contend that citizens are more likely to mobilize when they perceive that the
ruling clique is mismanaging the economy, either as a result of its attempts to extract rents for
members of the ruling elite or simply as the result of incompetence. Publicly available information
plays a critical role as it can (1) confirm or refute citizen perceptions of economic mismanagement
and, critically, (2) it can also inform citizens of others’ beliefs regarding the extent of mismanage-
ment. As citizens become more aware of one another’s perceptions, they become better able to
judge the willingness of others to mobilize in protest. Public information thus plays an outsize role
in shaping the incentives for mobilization (Morris and Shin, 2002).
The role played by the dissemination of economic data – a form of governmental transparency
– hinges on political institutions.6
Under autocratic rule, elections are either altogether absent or are so heavily manipulated as
6We define transparency in detail in the next section.
5

to ensure the victory of incumbents. Mass unrest is therefore the only mechanism through which
pressure from below can unseat incumbent leaders. The incentives to engage in such unrest
are highest when the sitting regime has revealed itself to be either predacious or incompetent –
i.e., when its economic performance is poor. As greater amounts of public information on eco-
nomic performance are made available, citizens are better able to assess the performance of
the government. Citizen perceptions align more closely with economic reality. Moreover, when
the government’s performance is in fact poor, government transparency helps to ensure that cit-
izens share a perception of this poor performance – and that they are aware these beliefs are
shared. Consequently, as transparency rises, the economic performance of the sitting govern-
ment will translate more readily into manifestations of popular unrest. Transparency conditions
the relationship between economic outcomes and unrest – making this correlation stronger.
If successfully unseating the sitting government via mass unrest is sufficiently ‘difficult’ – i.e.,
if the costs to unrest are sufficiently large relative to the benefits of success, or the threshold of
participation necessary to unseat the incumbent is sufficiently high – citizens will only engage
in protest when highly certain of the government’s under-performance. Moreover, they must be
similarly certain that this perception is widely shared. Without public disclosure of economic infor-
mation, this level of certainty is unlikely to be attained – even when the leadership does perform
poorly. As the level of transparency rises, the threshold level of certainty necessary to facilitate un-
rest – certainty both with regards to individual perceptions of government performance and higher
order beliefs that these perceptions are shared – is more likely to be attained. Consequently, the
unconditional probability of unrest – and of autocratic instability – rises with transparency.
Under democratic rule transparency plays a quite different role. This is, in part, because the
electoral process ensures that democracies are information rich environments.7 Citizens are able
to act upon their perceptions of government performance by voting for or against the incumbent
regime, implying that vote returns provide valuable information as to the distribution of discontent
in the populace (Fearon, 2011; Little, Tucker and LaGatta, 2013). The disclosure of economic
information is therefore likely to play little role in shaping perceptions about the likelihood (or
likely success) of mass unrest – this information is already made available through the electoral
7Our theory requires two prerequisites of democracy: First, it must be possible to remove incumbents throughelectoral means. Second, the voting process must be informative – i.e., publicly disclosed vote returns must reflectlevels of popular support. These theoretical requirements are in keeping with the definition of our empirical measureof democracy, which is drawn from the Democracy and Development (DD) dataset (Cheibub, Gandhi and Vreeland,2010, 69). It is worth noting that elections may play an informational role even if they fail to meet typical standardsof fairness. In models of electoral fraud, Little (2012) and Simpser (2004) demonstrate that election returns may beinformative – even perfectly so – in the presence of fraud. So long as citizens correctly anticipate fraud and discountelection returns appropriately, elections will serve the information generating role stressed below.
6

process.
Transparency instead serves to shape voters’ decisions at the ballot box itself. Information
on the government’s economic performance will shape citizens’ incentives to vote for or against
the incumbent leadership.8 As more information is made available, under-performing leaders are
more likely to be voted out of office, while over-performing leaders are more likely to be retained.
In essence, the provision of information to the voters increases the efficiency of elections as a
mechanism for addressing agency problems in representative government.
In a democracy, mass unrest and elections act as substitute mechanisms through which the
public may sanction the performance of their leaders. The incentives to engage in mass unrest
reach their highest when the public perceives that elections were ineffective at removing under-
performing incumbents. Since higher levels of transparency ensure that such underachieving
incumbents are voted out of office with greater frequency, they also ensure that the frequency of
unrest declines. Transparency thus serves to reinforce the stability of democratic rule, even as it
undermines that of autocratic leaders.
Defining Transparency
The definition of transparency used here pertains to the collection and disclosure of credible
economic data. Such data must be publicly disclosed – and known to be publicly disclosed – if
citizens are to update their beliefs not only about government behavior, but also their higher order
beliefs about the perceptions of their fellow citizens. These data must be credible if citizens are
to update their beliefs about government actions based upon the disclosed information. And they
must be aggregated such that the experiences of a broad swath of the population are reflected in
the numbers that are presented.
We draw our empirical measure of transparency from the HRV Index (Hollyer, Rosendorff and
Vreeland, 2013) – a continuous measure of data disclosure that accurately captures these three
aspects of our theoretical notion of transparency. This index is based upon the reporting/non-
reporting of data to the World Bank’s World Development Indicators (WDI) data series (World
Bank, N.d.). It summarizes the reporting of 240 variables selected from across the WDI. The
reporting of these variables is summarized on a single dimension, through the use of an item
response model – where transparency is treated as the latent tendency to report data. The result
is a continuous transparency measure (which is unique up to an affine transformation), that covers
8This contention relates to the notion of sociotropic voting in the American electoral behavior literature. Fordebates on sociotropic voting see Hibbs (2000), Kramer (1983) and Markus (1988).
7

125 countries from 1980-2010.
Because the WDI contains aggregate economic data which are collected by national statis-
tical agencies and provided to international organizations, it constitutes a direct measure of the
collection and dissemination of aggregate economic data. The disclosure of such data to the
World Bank proxies for public disclosure more generally. (In recent years, the World Bank has
provided these data directly to the public.) Finally, these data are credible insofar as they survive
the scrutiny of the World Bank’s review. Observations that are deemed ‘questionable’ are deleted
from the WDI.9
Both the notion and measure of transparency that we employ here are thus narrowly defined.
We conceive of transparency simply as the disclosure of data, not as a general conception of
‘openness,’ which may pertain to any aspect of information transmission in a given polity. Broader
conceptions of transparency may encompass the structure of political institutions (Broz, 2002;
Dahl, 1971), the role of the media (Adserà, Boix and Payne, 2003; Besley and Burgess, 2002;
Djankov et al., 2003), the presence or absence of freedom of information laws (Berliner, 2011;
Islam, 2006), or even the role of social or ethnic ties in disseminating information (Grief, 2006;
Habyarimana et al., 2009). Alternative measures and conceptions of transparency may be well-
suited to address other specific questions. We prefer our measure in this instance because it
neatly conforms to the notion of transparency developed in our theoretical model. Our hypotheses
concern the extent to which economic data are common knowledge, so data dissemination is the
appropriate measure of transparency for this analysis.
Existing Literature
Our paper thus most clearly relates to the literature on protest an mass mobilization – starting
with Kuran’s (1991) observation of collective action problems in mass mobilization. Lohmann
(1993) explicitly deals with the importance of information in such interactions, and with the im-
portance of costly signaling in solving collective action problems. A more recent literature on
mass protest and collective action similarly emphasizes the importance informational problems in
protests (Bueno de Mesquita, 2010; Shadmehr and Bernhardt, 2011).
Like these more recent works, our theoretical treatment of transparency and mass unrest
builds on the mechanics of global games (Carlsson and van Damme, 1993; Morris and Shin,
9See the World Bank statements regarding the WDI: http://data.worldbank.org/about/data-programs,accessed March 7, 2011. In some instances, these data are weeded out by the World Bank itself. In others, inter-national organizations that act as intermediaries between the World Bank and national statistical agencies conducttheir own quality review.
8

1998, 2001). Our depiction of the role of transparency owes particularly to Morris and Shin
(2002), who emphasize that – in the presence of strategic complementarities – public information
plays a dual role, causing observers to update their own beliefs as well as their higher order
beliefs about the beliefs of other players.
Our approach differs from existing treatments of protest in that: (1) We explicitly focus on the
role of publicly available economic information which is informative of leaders’ performance. (2)
We incorporate political institutions into our model of protest. Existing findings either assume the
only outlet for citizens’ discontent is via the streets (Bueno de Mesquita, 2010; Shadmehr and
Bernhardt, 2011), or focus only on democratic governments and the possibility of protests in the
wake of elections (Fearon, 2011; Little, Tucker and LaGatta, 2013).
Our findings with respect to democracy rely on the insight that electoral returns are informa-
tive of levels of citizen discontent, and thus may serve to foster protests. This insight owes heavily
to Fearon (2011), who demonstrates that the informational role of elections may make democ-
racy self-enforcing. Little, Tucker and LaGatta (2013) build upon this argument, and stress the
importance of the informativeness of (absence of fraud from) electoral returns for the existence
of a self-enforcing democratic equilibrium – an argument that is given empirical support (with an
application to election monitoring) by Hyde and Marinov (forthcoming). A related empirical liter-
ature has stressed the importance of elections in mobilizing unrest, particularly in the ‘colored
revolutions’ that hit much of post-Soviet Europe in the early 2000s (Bunce and Wolchik, 2006,
2011; Tucker, 2007).
Our findings also speak to an expansive literature on mass unrest and regime stability. Mod-
els of autocratic rule (Gandhi, 2008; Svolik, 2012; Wintrobe, 1998) often assume that leaders are
constrained by the threat of mass unrest, and must employ co-optation or repression to deal with
this threat. Our results suggest when such pressures may be more or less acute. The literature
on the stability of political regimes also often assumes the importance of mass (or revolutionary)
threats from the populace. This is most obvious in models of democratization, wherein revolution-
ary activities on the part of the citizenry – or the threat thereof – may give rise either to the direct
usurpation of authoritarian regimes or the extension of suffrage (Acemoglu and Robinson, 2006;
Boix and Svolik, 2011; Rosendorff, 2001; Przeworski, 2008).10 While our results speak to broader
forms of autocratic instability than democratization (i.e., we are more concerned with the removal
of autocratic leaders via mass unrest than explicitly with the regime that follows); our findings
are suggestive as to when this revolutionary threat may be more or less powerful.11 We speak
10Bermeo (1997) examines the competing evidence for the role of mass mobilization in promoting or inhibitingdemocratization.
11Our paper does not speak to the expansive literature on other pressures for regime transition – e.g., structuralist
9

still more directly to the role that mobilization may play in stabilizing or destabilizing democratic
regimes (Lipset, 1959).
Finally, we note that our paper closely relates to an account of autocratic stability and trans-
parency within autocratic regimes put forth by Boix and Svolik (2011). Like us, Boix and Svolik
examine collective action problems in unseating autocratic leaders, and the role the informational
environment plays in shaping these interactions. Unlike our paper, however, Boix and Svolik con-
centrate on threats that emerge from within the ruling regime – i.e., the threat of coups. Their
concern is with the contest for power between a dictator and members of his winning coalition, in
which the dictator may seek to secretly accrue power at the winning coalition’s expense. Other
elites constrain this behavior via the threat of coup. Boix and Svolik’s conception of transparency
differs radically from ours – in their paper, transparency (which is operationalized as the level
of institutionalization of the autocratic regime) consists of clear rules of behavior, the violation of
which may mobilize a coup. They conclude that this form of transparency stabilizes autocracies by
reducing the frequency of coups. We, by contrast, focus on transparency as the public disclosure
of economic information, and on the role this disclosure plays in coordinating mass unrest by the
populace. We conclude that transparency destabilizes autocracies by increasing the frequency
of revolt and democratization.12
Model
We offer a model of political protest and mass mobilization in polities where the opportunity to vote
in consequential elections is either absent (which we label “autocracies”) or present (“democra-
cies”). While we borrow from the literature on global games (Carlsson and van Damme, 1993;
Morris and Shin, 2001, 2002), the model we present is not a global game, as it does not satisfy
two-sided ‘limit dominance (Bueno de Mesquita, 2010, 450). Our approach most closely resem-
bles that of Bueno de Mesquita (2010), which also depicts mass unrest.
Our chief innovation is the introduction of a commonly observed signal of government policy,
here meant to depict the disclosure of aggregate economic data. This information is assumed to
be unbiased and to be a more precise signal of government policies than individual economic out-
accounts (Huber, Rueschemeyer and Stephens, 1993; Lipset, 1959; Moore, 1966), or the voluntary extension of thefranchise (e.g., Lizzeri and Persico, 2004).
12In empirical models in which we constrain our attention to autocratic regime failures resulting from coups, we findthat transparency is associated with a reduction in coup frequency, in keeping with Boix and Svolik (2011). Resultsare available from the authors on request. Information may thus play radically different roles in inspiring mass unrestand intra-regime violence.
10

comes. We treat the variance of this public signal as a measure of (the inverse of) transparency.
All comparative statics are with respect to this variance.
Transparency in Autocracies
Consider an interaction between an autocratic leader L and a mass of citizens. Each citizen is
denoted i where i is indexed over the unit interval i ∈ [0, 1].
Citizens seek to infer the leader’s type, which may be either ‘good’ or ‘bad.’ Our model is one
of adverse selection in government. A leader’s type may refer to his level of skill, competence,
or honesty. ‘Good’ leaders will therefore return better economic performance than ‘bad’ leaders.
Citizens may therefore seek to remove ‘bad’ leaders from office, while retaining ‘good’ types.
So, L may be of one of two types, θ ∈ {0, 1}. Nature chooses L’s type θ where θ = 1 with
probability p and θ = 0 with probability 1−p. In each period during which she is in office in office,
L chooses whether or not to provide a public good Gt ∈ {0, 1}, where t ∈ {1, 2} denotes the
period of play. L’s utility from doing so is a function of her type, such that in each period:13
uL,t(Gt; θ) =
{1 if Gt = θ
0 otherwise
uL =2∑t=1
uL,t(Gt, θ)
L’s choice regarding public goods provision Gt ∈ {0, 1} has implications for economic out-
comes in the following manner: Each citizen i receives an income yi,t = Gtg + εi,t, where
εi,t ∼iidN(0, σ2
y) ∀ i, t, and g is a strictly positive constant. The standard deviation of individual
outcomes, σy > 0, captures all factors exogenous to government policies that may shift a given
citizen’s economic welfare. Each citizen observes yi,t, but goes not observe the value of Gt. In
observing first period income, yi,1, the citizen is also receiving a signal about the type of gov-
ernment it is facing, which informs its decision about whether to engage in protest to induce the
leader’s potential removal.
In the first period of play, all citizens also receive a publicly observable signal of the state of
the economy s. We assume that s = G1g + ρ, where ρ ∼ N(0, σ2s) and E[ρεi,t] = 0 ∀ i, t,
where σs > 0 is the standard deviation of this publicly observed signal. s is meant to depict the
role of publicly disclosed aggregate economic data, which enable citizens to form beliefs about
government performance. As more information is made available, citizens are better able to
13Actors do not discount over time. The results would be unchanged by including a discount factor.
11

discern the role of government policies in shaping economic outcomes – consequently σs shrinks.
σs is thus a measure of the inverse of transparency (i.e., of opacity). As σs declines, transparency
rises.14 Since s depicts the public disclosure of aggregate economic data, we further assume that
σs < σy.
After receiving her signals (both public and private) of government performance, each citizen i
may mobilize in an attempt to overthrow the sitting government, ai ∈ {0, 1}. Let the total number
of citizens engaged in collective action be A ≡∫ 1
0aidi. If A exceeds some exogenous threshold
T ∈ (0, 1), the sitting government will be removed and replaced by a new L, whose type is drawn
with the same prior distribution as the prior leader. We define an indicator functionR(A) to denote
removal, such that:
R(A) =
{1 if A ≥ T
0 otherwise.
If a leader is removed, a new one is drawn from the same prior distribution. The model makes
no assumption that democracy emerges.15
Engaging in mobilization entails a cost of κ > 0 for each citizen. However, if the collective
protest is successful in removing the sitting leader, each citizen that participates in these protests
gains a benefit β > κ. These benefits may be thought of as the psychological returns from
participating in the successful overthrow of the ancien regime, or as material benefits owing to
the likelihood of favors from any new regime that replaces the old. In either case, β represents a
form of ‘selective incentive’ for mobilization (Olson, 1971). Each citizen’s utility function is:
ui(yi,1, yi,2, ai;A) = yi,1 + yi,2 + ai[R(A)β − κ].
The order of play proceeds as follows:
14Transparency, and hence disclosure is an exogenous parameter in the model, rather than a choice variablefor the government. Our focus here is on the role transparency plays in fostering mobilization – i.e., on citizenbelief formation and collective action. We model government’s decisions to disclose – assuming its implications forleader survival – elsewhere (Hollyer, Rosendorff and Vreeland, 2011a). Other work has explored the adoption andimportation of transparency-enhancing institutional innovations - such as joining international organizations (IOs)with monitoring and adjudicatory devices (Hollyer and Rosendorff, 2012; Mansfield, Milner and Rosendorff, 2002).A general theory endogenizing the level of transparency conditional on its effects of autocrat survival remain part ofthis broader research agenda.
15The assumption that the threat or realization of protests can lead to leader removal and consequently to regimetransition and/or alternation in power is common to several pieces in the recent theoretical literature (Fearon, 2011;Little, Tucker and LaGatta, 2013). Empirically, Miller (2012) finds that the irregular removal of autocratic leaders isassociated with democratic transitions while Bermeo (1997) finds that popular protests are frequently associated withdemocratization.
12

1. Nature chooses L’s type θ ∈ {0, 1}. The value of θ is revealed to L, but not to any citizen.
2. L chooses whether or not to provide the public good G1 ∈ {0, 1}.
3. Nature chooses εi,1 ∀ i. Nature additionally chooses the value of ρ. yi,1 is revealed to each
citizen i, but not to any other citizen. s is revealed to all citizens.
4. Each citizen chooses whether or not to engage in collective action ai ∈ {0, 1}.
5. If R(A) = 1, L is replaced and Nature draws the type of its replacement θ ∈ {0, 1}, where
Pr(θ = 1) = p.
6. The sitting L chooses the value of G2 ∈ {0, 1}.
7. Nature chooses εi,2 ∀ i. yi,2 is realized for all citizens and the game ends.
While this resembles a global games approach to regime change (Angeletos, Hellwig and
Pavan, 2007; Casper and Tyson, 2013) the game presented here does not satisfy the two-sided
“limit dominance” condition (Morris and Shin, 1998) - there is no type of government for which
political action is a dominant strategy for any signal (in fact there are only two types in our model).
Consequently, multiple equilibria exist. In particular, two equilibria in which citizens do not condi-
tion their behavior on any information revealed during the game co-exist: one in which all citizens
always mobilize, the other in which no citizen ever mobilizes. In the former instance, given the
strategies of all other players, each i prefers to set ai = 1, and thus obtain the benefits β−κ > 0
of participating in the successful mobilization – regardless of her beliefs about the government’s
type. Similarly, in the latter, given the strategies of all other citizens, each i prefers to set ai = 0
– and thus avoid the cost κ > 0 of participating in an inevitably failed mobilization, regardless of
her beliefs. We view these equilibria as implausible and/or as uninteresting. It is infeasible for
all citizens to believe, with certainty, that their countrymen will all either engage or not-engage in
political mobilization; and to believe that this will be the case regardless of the of the performance
of the incumbent government.
We instead focus on a third equilibrium. Specifically, we focus on a pure strategy perfect
Bayesian equilibrium (PBE) in which each citizen i conditions her mobilization strategy on both
her signals yi,1 and s. We also restrict attention to monotone equilibria in which higher signals are
interpreted weakly as corresponding to a higher likelihood of a high type leader, and furthermore
we restrict attention to equilibria in which each i employs a cut-point strategy: i sets ai = 1 if and
only if yi,1 is less than some threshold value y (Bueno de Mesquita, 2010). This threshold value
y will be a function of the publicly observable signal (denoted y(s)).
13

An equilibrium involving cut-point strategies has several desirable properties relative to the
two “pooling” equilibria.16 The cut-point equilibrium involves citizens acting upon all available
information, and the the cut-point equilibrium probabilities of mass mobilization and of regime
survival are conditional upon economic performance, which would not be true in the pooling
equilibria. This contention enjoys substantial support in the empirical literature (Alesina et al.,
1996; Haggard and Kaufman, 1995; Przeworski et al., 2000).
A PBE requires that beliefs of the citizens be consistent with the strategy profile and Bayes’
rule, and that the strategy of any citizen and the leader be sequentially optimal given all the
beliefs and the strategies of the other citizens (Fudenberg and Tirole, 1991). A cut-point PBE
in monotone strategies is characterized by: (1) A threshold y(s) : R → R ∪ {−∞,∞}, where
political action occurs whenever yi,1 < y(s) for all i. Where y(s) = −∞, no citizen will ever
mobilize; where y(s) = ∞, all citizens mobilize. (2) A strategy for L from type- to action-space,
Gt : {0, 1} → {0, 1}. (3) Posterior beliefs Pr(θ = 0|yi,1, s). We characterize each of these in
turn; but first some preliminary definitions are necessary.
Definition 1. Define y∗(s) implicitly by the value of yi,1 that solves
Pr(θ = 0|yi,1, s)β = κ. (1)
This is the value of the private signal, given a public signal, that would yield posterior beliefs
about the type of the leader such that the citizen is indifferent between taking political action and
not, given that all the other citizens are behaving the same way. In the appendix, we show that
this is well-defined. Using the definition of y∗(s) we can now specify y(s) as follows (where Φ is
the CDF of the standard normal):
Definition 2. Define
y(s) =
∞ if Φ( y
∗(s)−gσy
) ≥ T
y∗(s) if Φ( y∗(s)σy
) ≥ T > Φ( y∗(s)−gσy
)
−∞ if Φ( y∗(s)σy
) < T
(2)
The value of y(s) is the cut-point that characterizes the equilibrium, in which all citizens re-
ceiving a private signal below the cut-point choose to engage in political action; those with signals
16This is not “pooling” in the traditional sense - where actors of different “types” take the same action. In theequilibria to this game where the voters take the same action, they may do so holding differing posterior beliefs. Thisis not a signaling game; while the first mover has private information, their action is hidden, and only a noisy signal ofthat action is observed; nevertheless there are some similarities - the citizens do form posteriors on the type of thefirst mover, and actions and beliefs must be consistent in equilibrium.
14
higher than y(s) stay off the streets. The equilibrium is simply stated as:
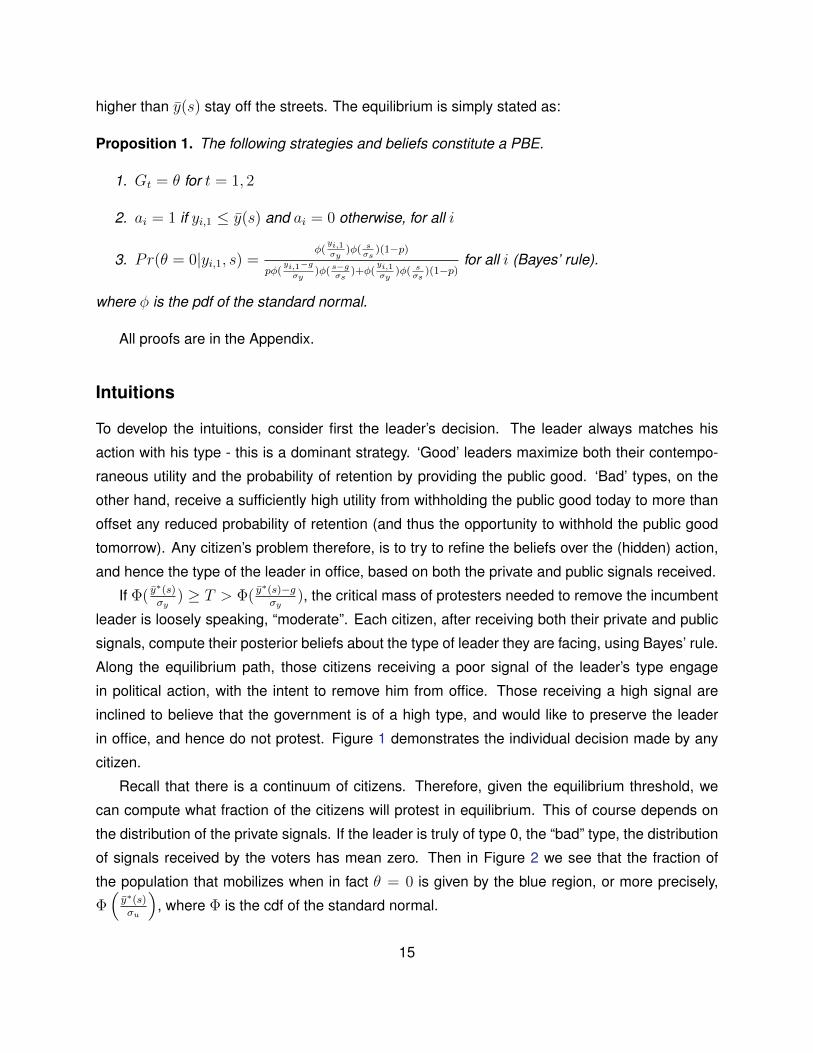
Proposition 1. The following strategies and beliefs constitute a PBE.
1. Gt = θ for t = 1, 2
2. ai = 1 if yi,1 ≤ y(s) and ai = 0 otherwise, for all i
3. Pr(θ = 0|yi,1, s) =φ(yi,1σy
)φ( sσs
)(1−p)
pφ(yi,1−gσy
)φ( s−gσs
)+φ(yi,1σy
)φ( sσs
)(1−p)for all i (Bayes’ rule).
where φ is the pdf of the standard normal.
All proofs are in the Appendix.
Intuitions
To develop the intuitions, consider first the leader’s decision. The leader always matches his
action with his type - this is a dominant strategy. ‘Good’ leaders maximize both their contempo-
raneous utility and the probability of retention by providing the public good. ‘Bad’ types, on the
other hand, receive a sufficiently high utility from withholding the public good today to more than
offset any reduced probability of retention (and thus the opportunity to withhold the public good
tomorrow). Any citizen’s problem therefore, is to try to refine the beliefs over the (hidden) action,
and hence the type of the leader in office, based on both the private and public signals received.
If Φ( y∗(s)σy
) ≥ T > Φ( y∗(s)−gσy
), the critical mass of protesters needed to remove the incumbent
leader is loosely speaking, “moderate”. Each citizen, after receiving both their private and public
signals, compute their posterior beliefs about the type of leader they are facing, using Bayes’ rule.
Along the equilibrium path, those citizens receiving a poor signal of the leader’s type engage
in political action, with the intent to remove him from office. Those receiving a high signal are
inclined to believe that the government is of a high type, and would like to preserve the leader
in office, and hence do not protest. Figure 1 demonstrates the individual decision made by any
citizen.
Recall that there is a continuum of citizens. Therefore, given the equilibrium threshold, we
can compute what fraction of the citizens will protest in equilibrium. This of course depends on
the distribution of the private signals. If the leader is truly of type 0, the “bad” type, the distribution
of signals received by the voters has mean zero. Then in Figure 2 we see that the fraction of
the population that mobilizes when in fact θ = 0 is given by the blue region, or more precisely,
Φ(y∗(s)σu
), where Φ is the cdf of the standard normal.
15

Each individual compares their own private signal yi,1 with the thresholdy(s), and protests if yi,1 ≤ y(s).
Figure 1: Individual Citizen’s Decision
If instead, the leader is actually the “good" type, θ = 1, then the mean of this distribution is
given by g > 0. The the distribution is shifted to the right, and the fraction of the population that is
mobilized to protest is smaller. In Figure 3 we see that the fraction of the population that mobilizes
when in fact θ = 1 is given by the red region, or more precisely, Φ(y∗(s)−gσu
).
If the number protesting when the leader is bad (the blue region) is larger than T , the threshold
for leader removal, but the number protesting when the leader is good (the red region) is smaller
than T , then under the equilibrium strategies of the citizens, good types are retained and bad
types are removed. More precisely, leaders of type θ = 1 are retained, and leaders of type θ = 0
are removed in equilibrium if Φ(y∗(s)−gσu
)≤ T ≤ Φ
(y∗(s)σu
).
To ensure that each citizen is playing a best response, we need only check that the threshold
is chosen to make recipient of that signal at the threshold indifferent between mobilization and
16

The blue region is the fraction of population that mobilizes, Φ(y∗(s)σu
)when
in fact θ = 0, where Φ is the cdf of the standard normalFigure 2: Political action when Leader is “bad”
not. Then ai = 1 if and only if
Pr(θ = 1|yi,1, s)g + Pr(θ = 0|yi,1, s)[pg + β]− κ ≥ Pr(θ = 1|yi,1, s)g + Pr(θ = 0|yi,1, s)pg
Pr(θ = 0|yi,1, s)β ≥ κ
That is if the type is “good", θ = 1, then the leader will be retained, and in the second period the
leader will choose G2 = g, hence the first term on the left hand side. In the instance that the
leader is a bad type, θ = 0, the leader is removed in equilibrium. With probability p, a “good”
type enters, and chooses G2 = g; otherwise G2 = 0. In addition, there is benefit of joining a
successful insurrection, of an amount β, but protest costs κ in any case. On the other hand, if
the citizen chooses not to protest, recall that there is a continuum of citizens and hence no citizen
is pivotal. Hence good leaders are still retained, and poor ones are removed. If the leader is
good, the citizen will still receive g if she does not protest; if the leader is bad, the leader is still
17
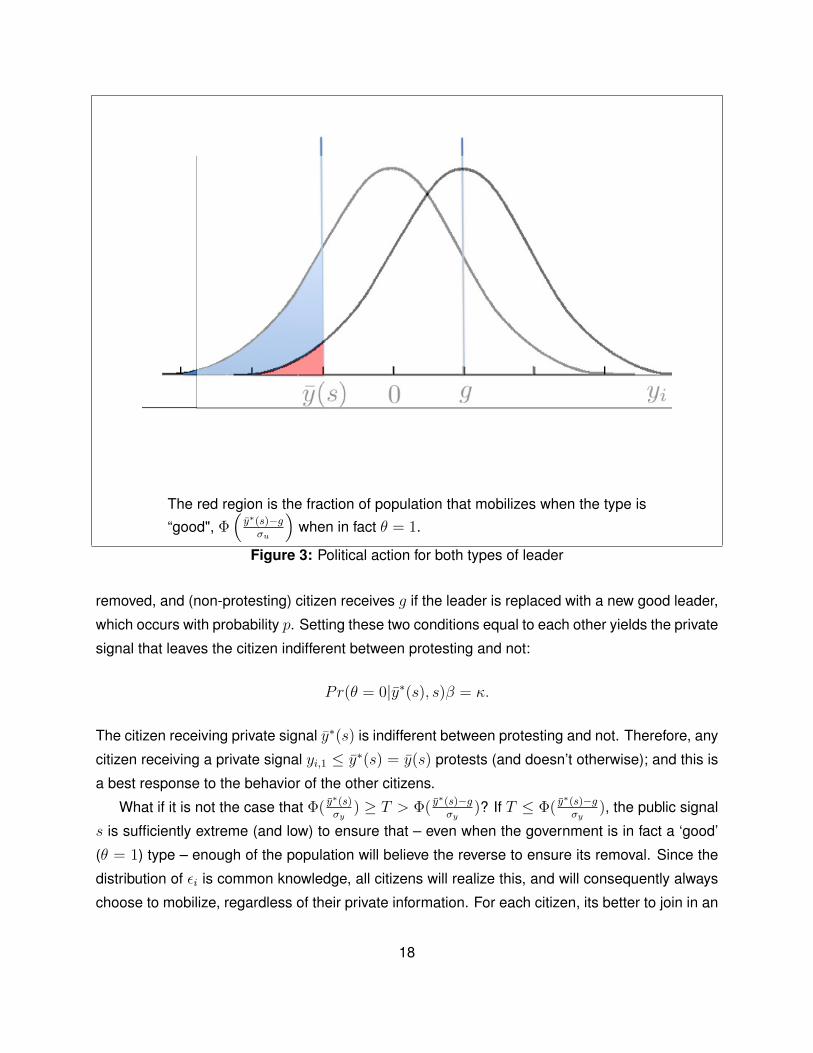
The red region is the fraction of population that mobilizes when the type is
“good", Φ(y∗(s)−gσu
)when in fact θ = 1.
Figure 3: Political action for both types of leader
removed, and (non-protesting) citizen receives g if the leader is replaced with a new good leader,
which occurs with probability p. Setting these two conditions equal to each other yields the private
signal that leaves the citizen indifferent between protesting and not:
Pr(θ = 0|y∗(s), s)β = κ.
The citizen receiving private signal y∗(s) is indifferent between protesting and not. Therefore, any
citizen receiving a private signal yi,1 ≤ y∗(s) = y(s) protests (and doesn’t otherwise); and this is
a best response to the behavior of the other citizens.
What if it is not the case that Φ( y∗(s)σy
) ≥ T > Φ( y∗(s)−gσy
)? If T ≤ Φ( y∗(s)−gσy
), the public signal
s is sufficiently extreme (and low) to ensure that – even when the government is in fact a ‘good’
(θ = 1) type – enough of the population will believe the reverse to ensure its removal. Since the
distribution of εi is common knowledge, all citizens will realize this, and will consequently always
choose to mobilize, regardless of their private information. For each citizen, its better to join in an
18

uprising that is guaranteed to be successful than not to do so.
Conversely, if T > Φ( y∗(s)σy
), even when the government is in fact a ‘bad’ type (θ = 0), an
insufficient portion of the population will believe this to be the case to ensure its removal. The
public signal s is sufficiently high that it will be impossible for a group of requisite size to coordinate
an uprising. All citizens will realize this, and will never choose to mobilize, regardless of their
private information. This leads to the definition of y(s) as in Definition 2 above, and the complete
specification of the equilibrium in Proposition 1 above.
Comparative Statics: Enhancing Transparency
Notice that the crucial equilibrium threshold y(s) is a function of the public signal, s. Recall that
we have an interior equilibrium (where some protest,and some do not) when Φ( y∗(s)σy
) ≥ T >
Φ( y∗(s)−gσy
). It will simplify matters if we make use of the following two definitions:
Definition 3. Define s implicitly by T = Φ(y∗(s)−gσu
)and s by T = Φ
(y∗(s)σu
)In the Appendix, we demonstrate that y(s) is monotonic and decreasing in s and that lims→∞ y(s) =
−∞ and lims→−∞ = ∞. These s and s are well-defined such that y(s) = −∞ if s ≥ s and
y(s) =∞ if s ≤ s.
For a sufficiently extreme and positive public signal of the government’s type (s ≥ s), all
citizens will disregard their private information never mobilize. This is true regardless of their
beliefs about the government’s type. Even if a given citizen strongly believes that θ = 0, given
this extreme and positive public signal, she knows that it is impossible for enough of her fellow
citizens to share this belief for mobilization to ever be successful. Conversely, for a sufficiently
extreme and negative signal (s ≤ s), all citizens will always mobilize, even if some strongly believe
the government to be a ‘good’ type. Each citizen knows, given the extreme value of the public
signal, that enough of her fellow citizens believe the government to be adopting poor policies
that its removal is inevitable. Given that this is the case, each citizen would rather jump on the
bandwagon (and gain the benefits of joining the insurrection), rather than holding firm to her
beliefs. Public information thus plays a disproportionate role in shaping citizen behavior. For a
similar result, see Morris and Shin (2002).
Notice that, for any s ≥ s, governments of all types are retained. For any s ≤ s, all govern-
ments are removed. For any s ∈ (s, s), governments are removed if they are of type θ = 0 and
retained if they are of type θ = 1. Some mobilization will always take place when the public signal
is in this interval, but it is only sufficient to overthrow the government when θ = 0.
19

We can thus characterize the probability of government removal, conditional on its type. When
θ = 0, the government will be removed if s ≤ s, which will occur with probability Φ( sσs
). When
θ = 1, the government will only be removed if s ≤ s, which will occur with probability Φ( s−gσs
).
We can thus define the degree to which the public en masse effectively separates good from bad
types as the discrimination = Φ( sσs
)− Φ( s−gσs
).
Proposition 2. Discrimination is strictly increasing in transparency (falling in σs).
As σs rises, y∗ shifts to the right while both the probability density functions depicted grow
more tightly distributed around their respective means. The net effect of these two forces is such
that the blue region unambiguously increases in size. The size of the red region may either rise
or fall. But, the increase in the size of the blue region always outpaces any increase in the size of
the red region. Hence the difference between the numbers protesting when the leader is a bad
type relative to the number of protestors when the leader is good grows with transparency. The
“improved” public signal increases the difference in the turnout for protest when leaders are bad
relative to when they are good.
Note that the blue region is always larger than the red – under-performing leaders always
attract higher levels of protest than over-performing ones (where under- and over-performing
refers to the leader type θ). We interpret this equilibrium effect as implying that autocratic leaders
who experience poor economic outcomes are always more likely to be removed than those that
experience good outcomes. Proposition 2 tells us that this difference should be rising in levels of
transparency. That is, transparency moderates the relationship between economic performance
and autocratic collapse.
Corollary 1. In equilibrium, poor economic performance is associated with autocratic removal;
and poor economic performance in more transparent environments leads to even higher likelihood
of autocratic collapse in equilibrium.
For a range of parameter values, we can also derive predictions about the unconditional re-
lationship between transparency and leader survival. This unconditional probability can be ex-
pressed as (1− p)Φ( sσs
) + pΦ( s−gσs
). With probability 1− p, the government is of type θ = 0, and
it will be removed with probability Φ( sσs
). With probability p, the government is of type θ = 1, and
it will be removed with probability Φ( s−gσs
). For a range of parameter values, increasing values of
transparency will increase this unconditional probability of successful mobilization:
Proposition 3. If −σygln( pκ
(1−p)[β−κ]) < Φ−1(T ), then there exists a level of σs ≡ σs such that, the
unconditional probability of leader removal is increasing for low levels of transparency (σs ≥ σs).
20

Proposition 3 characterizes a sufficient, not a necessary, condition for transparency to have
this effect. Transparency increases the risk of leader removal so long as mass mobilization is not
too ‘easy’ – i.e., the threshold for removing the autocrat T is not too low relative to the benefits
of successful leader removal. Under these circumstances, the public requires a sufficiently com-
pelling signal of poor government performance in order to mobilize. Remark 1 serves to clarify
this requirement:
Remark 1. As β → κ the probability of leader removal is rising in transparency for all σs ∈ R+
and for all T ∈ (0, 1).
In the Appendix we show that as β → κ, we can be sure that s < 0. Recall that s defines
the level of the signal such that all citizens mobilize, regardless of their individual posterior beliefs
about the leader’s type. (Consequently, the leader is removed with certainty.) In other words, as
β → κ, citizens require a sufficiently poor signal of economic performance to ensure mobilization.
If, on the other hand, s > 0 (which occurs when β � κ or T is low), then all citizens mobilize even
when the public signal indicates that the economy is performing relatively well. Then the prob-
ability (and hence frequency) of a successful mass demonstration is thus very high. Our model
doesn’t allow us to determine the effect of transparency on leader removal unambiguously in this
case. Since incidences of successful mass protest are relatively rare, it therefore seems safe to
assume that – at least in the vast majority of cases – the conditions of Proposition 3 are satisfied,
and transparency will empirically be associated with an increase in the unconditional probability
of autocratic collapse. Similarly, it seems reasonable that the private benefits of participating in a
successful insurrection are not that large (relative to the benefits of putting a “good” type in office
in the next period), suggesting that the conditions of Remark 1 are satisfied, and transparency is
associated with increased autocratic leader removal.
Transparency in Democracies
We now turn our attention to the role of transparency under democratic rule. The approach is
similar to the autocratic case above, except that citizens can vote before resorting to unrest, and
voting returns are publicly disclosed. Just as in the prior model, the political action, which in this
case is a vote, is fully informative of incumbent’s type θ, regardless of the level of transparency.
Hence in equilibrium, citizens engage in political action if and only if a “bad” type is retained via
elections, and since the incumbent’s type is fully known at the time the decision to mobilize is
made, any political protest is successful at removing the incumbent.
21

More precisely, the set of actors, L’s type space, the action spaces and utilities are un-
changed. Citizen actions and utilities during the mobilization period of the game are also identical
to the above.
However, prior to the decision to mobilize, each citizen i may cast a vote for or against the
incumbent vi ∈ {0, 1}, where vi = 1 denotes a vote for removal. Let the mass of citizens voting
for removal be V ≡∫ 1
0vidi. If V ≥ 1
2, L is removed from office; if V < 1
2, L is retained. Citizens
suffer no direct cost, nor enjoy any direct benefit, from their voting decision. After voting takes
place V is revealed to all citizens and to L. If L is retained, citizens may engaged in collective
action to bring about her ouster.
The order of play is:
1. Nature chooses L’s type, θ ∈ {0, 1}. The value of θ is revealed to L, but not to any citizen.
2. L chooses whether or not to provide the public good G1 ∈ {0, 1}.
3. Nature chooses εi,1 ∀ i. Nature also chooses ρ. yi,1 is revealed to each citizen i, but not to
any other citizen. s is revealed to all citizens.
4. Each citizen chooses vi ∈ {0, 1}. V =∫ 1
0vidi is revealed to all citizens. If V ≥ 1
2, L is
removed and replaced by another government, whose type θ is chosen by Nature.
5. If V < 12, each citizen may choose whether or not to engage in collective action ai ∈ {0, 1}.
If A ≥ T , L is removed and replaced by another government, whose type θ is chosen by
Nature.
6. The sitting L chooses the value of G2 ∈ {0, 1}.
7. Nature chooses εi,2 ∀ i. yi,2 is revealed to each citizen and the game ends.
This game gives rise to multiple pure strategy perfect Bayesian equilibria. With a continuum of
citizens i ∈ [0, 1], voting decisions may be non-strategic. And, as before, the mobilization stage
of the game can give rise to equilibria in which all citizens disregard their information and either
always choose to mobilize or always choose not to do so.
As before, we will focus on strategies in which citizens employ all available information in their
decision-making. Citizen voting and mobilization strategies will thus be a function of their private
signal yi,1, the public signal s, and – in the mobilization stage – of the share of the public voting
to remove the incumbent V .
Specifically, we assume that citizen i will vote to remove the incumbent (set vi = 1) if Pr(θ =
1|yi,1, s) ≤ p, and will set vi = 0 otherwise – i.e., citizens vote sincerely. This requirement implies
22
that citizens will vote to remove the incumbent when they believe a replacement is more likely to
be a ‘good’ type θ = 1, and that they will vote to retain otherwise. This strategy is commonly
assumed in games of retrospective voting involving adverse selection and a continuum of voters,
and is analogous to a continuum of voters each choosing their most preferred candidate in games
of prospective voting (Cox, 1987; Downs, 1957).
As before, we explore a pure strategy perfect Bayes equilibrium in which citizens employ a
cut-point monotone strategy in both the voting and the political action phase of the game. Before
we characterize the equilibrium, a definition is necessary.
Definition 4. Define y(s) implicitly by Pr(θ = 1|y(s), s) = p, and define
V (s; θ) =
{Φ( y(s)
σy) if θ = 0
Φ( y(s)−gσy
) if θ = 1.
where Φ is the cdf of the standard normal distribution.
In the appendix we show that y(s) is well defined.
Proposition 4. The following strategies and beliefs constitute a PBE. For the leader, Gt = θ for
t = 1, 2. For the citizens, their voting and mobilization strategies are
vi =
{1 if yi,1 ≤ y(s)
0 otherwise.
ai =
{1 if V > V (s; 1)
0 otherwise.
Beliefs are Pr(θ = 0|yi,1, s) as in Proposition 1, posteriors after both the private and public
signals but before the vote, and after the vote, but before political action:
Pr(θ = 1|V, s) =
{0 if V > V (s, 1)
1 otherwise.
Along the equilibrium path, each citizen makes a voting decision conditional on their beliefs
about the type of leader they face - based on both their private and public signals. If the posterior
beliefs are low - in that the current leader is unlikely to be a “good” type, the citizen votes to
remove the leader from office. After the vote, each citizen sees how many voted to remove; since
23

there is a continuum of citizens, and each citizen is using the same cut-point strategy, the number
of votes to remove is either V (s, 0) = Φ( y(s)σy
) or V (s, 1) = Φ( y(s)−gσy
), with V (s; 1) < V (s; 0)
for all s. That is the number of votes to remove a bad type is always larger than the number of
votes to remove a good type. If the voter observes the former, she knows the leader is of the bad
type, θ = 0; on observing the latter, the voter infers perfectly that θ = 1. The outcome of the vote
however maybe that a “bad” leader is reelected if the combination of private and public signals
happened to be good draws. In which case, the voters all mobilize to remove the (bad) leader
from office. Voters do not mobilize against a good leader should he be reelected.
As before, the leader has a dominant strategy to take an action that matches his type. The
voters are assumed to vote sincerely, and mobilization occurs because once it is clear that the
leader is to be removed, it is better to be among the protesters than not - in order to receive the
benefits of joining a successful insurrection, β − κ. Hence each voter is best-responding to both
the actions of the other voters and their information about the type of leader they face. Finally, of
course, beliefs are determined by Bayes’ rule, and the actions are consistent with those beliefs -
hence we have a perfect Bayesian equilibrium.
Analogous to the autocratic case, we would like to explore the effect of transparency on the
degree to which the political institutions are able to discriminate between the survival in office of
“good” versus “bad” types. In the democratic case, the institution in question is the election; does
transparency enhance the likelihood that “bad” types are removed via the electoral process? The
answer is yes.
Definition 5. Define s implicitly by Φ( y(s)σy
) = 12
and define s˜ implicitly by Φ(y(s˜)−gσy
) = 12.
As before, we show in the appendix that s and s˜ are well defined. We can now analyze
electoral survival much as we treated mobilization above. If s ≥ s, governments of all types
will be reelected. If s ≤ s˜, governments of all types are voted out of office. If s ∈ (s˜, s), then
governments are voted out of office if and only if θ = 0. We can thus define the probability that a
government of type θ = 0 is voted out of office as Φ( sσs
). And we can define the probability that a
government of type θ = 1 is voted out of office as Φ(s˜−gσs ). The extent to which electoral survival
is conditioned on policy decisions or, equivalently, a government’s type is thus Φ( sσs
) − Φ(s˜−gσs ).
We term this quantity the level of electoral discrimination.
Proposition 5. The level of electoral discrimination is strictly rising in transparency (falling in σs).
As transparency rises, the probability that a government of type θ = 0 is voted out of office
rises; while the probability that a government of type θ = 1 is voted out falls. Empirically, as
24

transparency rises, the extent of economic voting also rises.
In equilibrium, if a low type leader survives in office, the voters mobilize for his “non-conventional”
removal. We will use the shorthand “democratic collapse” to describe the instance where a
leader is removed by means other than the electoral process. Since mass mobilization to re-
move the incumbent only takes place when poor leaders are reelected, this probability is given
by (1 − p)[1 − Φ( sσs
)] – i.e., the ex ante probability that L is a ‘bad’ type θ = 0 multiplied by the
probability that such a type survives the electoral process.
Increases in transparency – reductions in σs – will reduce the likelihood of democratic col-
lapse. Since the probability such a government is retained via an election is falling in trans-
parency, so too is the risk of democratic collapse. Transparency improves the role of elections
in addressing adverse selection problems in government. And, because protests and elections
are substitute mechanisms for addressing such problems, the risk to democracy fall as elections
grow more effective.
Proposition 6. The probability of mass unrest is strictly falling in transparency (rising in σs).
Empirics
We test these claims in the section that follows. After describing our data, we first examine the as-
sociation between transparency, economic performance, and the collapse of autocratic regimes.
We then examine the association between transparency, performance and mass unrest under
autocratic rule and compare these results to similar models in which the outcome variable are
forms of instability not involving mass mobilization. We finally examine the relationship between
transparency and the risk of democratic collapse.
Data Description
Our theoretical model depicts authoritarian collapse as the removal (via mass protest) of the
authoritarian regime or ruling clique. Empirically, we define such instances of collapse using
Svolik’s (2012) dataset on the duration of authoritarian regimes. Following Svolik, we define an
instance of authoritarian collapse as the removal of an autocratic leader by an alternative leader or
coalition not politically affiliated with the sitting clique. Since our theoretical mechanism operates
via mass unrest, we focus particularly on instances of leader removal brought about by mass
revolt or that lead to democratization. Svolik codes incidents of regime collapse brought about
via “mass protest, uprising[s], strike[s] or riot[s]” as revolts, and those leading to democratization
25
as ‘stepdowns.’ These are in contrast to alternative forms of leader removal – notably coups, in
which “the leader was deposed by an elite or military-led conspiracy that involved the threat or
use of force.”17 Our results do not pertain to the regime collapses brought about through coups
or via civil war.
Since the upending of democratic rule via street protest, by definition, entails the replacement
of elected by un-elected leaders (for some period of time), we treat democratic collapse as the
transition from democratic to autocratic rule. Our definition of democracy for this purpose is drawn
from the Democracy and Development Revisited (DD) dataset compiled by Cheibub, Gandhi and
Vreeland (2010). The DD dataset uses the coding scheme pioneered in Alvarez et al. (1996),
in which democracy is coded as a binary {0, 1} indicator equal to 1 if both the legislative and
executive branches are selected via competitive elections between contesting political parties. For
a country to be considered a democracy, there must be at least one change in the party in power.
All years under the same constitutional regime prior to this transfer of power are retroactively
coded as democratic.
In addition to the democracy indicator, we draw several control variables from the DD data.
In all specifications examining autocratic regimes, we control for an indicator variable Party ∈{0, 1} equal to one if multiple parties hold positions in the legislature.18 We include this control
given evidence that autocratic regimes that consist of multiple parties face substantially different
risks, and exhibit different behaviors, than those that do not (Gandhi and Przeworski, 2006, 2007;
Svolik, 2012). We also draw upon an indicator Military ∈ {0, 1}, equal to one if the head of
government is a representative of the military, given that autocracies headed by the military ex-
hibit differential behaviors from those controlled by civilians (Svolik, 2012; Wright, 2008).19 In all
specifications involving democracies, we control for whether the government is run via a parlia-
mentary system, and another indicator equal to one if the political regime involves a mixed par-
17While Svolik (2012) notes a variety of means through which leaders may be removed from power, he does notexplicitly code whether democratization occurs through the threat of unrest or due to some other cause. Given theexpansive literature that treats democratization as the result of the manifestation of unrest, or the threat thereof, wecode democratization and revolts analogously as examples of autocratic collapse. For further details on Svolik’scoding of regime removal, see pages 3 and 4 of http://publish.illinois.edu/msvolik/files/2012/12/leader-and-ruling-coalition-data-codebook.pdf.
18This variable is a recoding of an analogous trichotomous indicator {0, 1, 2} that appears in the DD dataset,which is equal to 0 if no parties exist, 1 if one (governing) party exists, and 2 if multiple competing parties exist. Aswe (1) are skeptical that the movement from zero to one party has the same marginal effect as moving from oneto multiple parties and (2) believe that the relevant theoretical distinction is between political regimes that allow forpolitical contestation and those that do not, we prefer to recode this variable.
19Given the correlation between these institutional features and the method with which the regime represses andco-opts the populace (Gandhi, 2008), we also help to adjust for the possibility that the repressive nature of theautocratic regime induces a spurious correlation between transparency and the risk of protest and collapse.
26

liamentary/presidential style system. These controls are necessary given that parliamentary and
presidential governments have been shown to exhibit different behaviors – and exhibit different
properties with respect to accountability (Cheibub, 2007; Gerring and Thacker, 2004; Kunicová
and Rose-Ackerman, 2005; Samuels and Shugart, 2003).
In all specifications involving incidents of mass mobilization and unrest, we draw our outcome
variables from the Cross National Time Series Archive (Banks, 1979), as made available by
Bueno de Mesquita et al. (2003). These data consist of counts of the number of anti-government
demonstrations, strikes, riots, guerrilla movements, revolutions, assassinations and coups in a
given country in a given year. The Banks dataset derives these counts from archives of the New
York Times. We consider anti-government demonstrations and strikes to be clear manifestations
of mass mobilization directed at the government. And we consider coups and assassinations to
be clear examples of instability not requiring popular mobilization.20
Transparency enters into our theoretical model as the (inverse of) the standard deviation of the
publicly observable signal of government performance witnessed by all citizens σs. Transparency
thus pertains to information that is (1) publicly observable – and known to be publicly observ-
able by all actors – and (2) allows citizens to draw accurate inferences regarding government
performance. Our empirical measure of this parameter is the HRV Index (Hollyer, Rosendorff
and Vreeland, 2013), which measures the extent to which governments collect and disseminate
aggregate economic data. The HRV Index is based on the reporting/non-reporting of information
to the World Bank’s World Development Indicators (WDI) data series. In recent years, these data
are made publicly available by the World Bank and, throughout our sample, the disclosure of
economic information to the Bank proxies the public dissemination of such data more generally.21
These data allow citizens to make more nuanced inferences about government performance than
would be possible in their absence. As more aggregate economic data are made available, cit-
izens will be better able to discern the performance of the economy beyond their given circle of
friends, family and acquaintances; to assess the distributional consequences of this performance;
and to assess the government’s role relative to that of cyclical fluctuations. While these inferences
will always be imperfect (σs > 0), increases in the dissemination of aggregate economic data im-
ply that these inferences will improve (σs will fall). Finally, it is appropriate to concentrate on the
government’s disclosure of such data, given that public goods problems in information markets
20Riots may also be considered a form of mass mobilization, but often the government is not the target of riot-ing. Often riots involve clashes between communities and ethnic groups (Scacco, 2008). Consequently, we do notconsider rioting to be a manifestation of the type of unrest documented in our model.
21We do not expect that many members of the public access such data directly. However, we do expect citizens,absent such disclosures, to be relatively uninformed of aggregate economic performance.
27

tend to inhibit private dissemination of such aggregated data series.22
The HRV index treats transparency as a latent term that determines whether or not a given
variable (of 240 variables in the model) is reported to the WDI in a given year – measures of
this latent term are extracted based on a item response (IRT) model. The IRT model provides a
continuous measure of transparency (which is unique up to an affine transformation) along this
scale – which reflects a given government’s tendency to disclose the type of data predominant
in the WDI. Observations of this index are available at the country-year level for 125 countries
over the 1980-2010 interval. For a complete description of our transparency variable, see Hollyer,
Rosendorff and Vreeland (2013).
We additionally control for a variety of economic factors. Importantly, we control for GDP per
capita, measured in thousands of purchasing power parity 2005 US Dollars. This measure is
included given the significant debate over modernization theory – the role of economic develop-
ment in facilitating democratization (see, for instance Acemoglu et al., 2007; Ansell and Samuels,
2010; Boix, 2003; Przeworski and Limongi, 1997; Przeworski et al., 2000). Additionally, we include
this term due to the possibility that states’ capacity to collect and disseminate data may increase
with economic development, so per capita income may act as a confound in our specifications.
We additionally include measures of economic growth (the percentage change in real GDP per
capita) in all models as a measure of government’s economic performance. Finally, we include
a measure of economic openness (Exports+ImportsGDP
) to control for the potential linkage between
economic and political liberalization.
These measures are all drawn from the Penn World Table (PWT) version 6.3 (Heston, Sum-
mers and Aten, 2009). The PWT offers several advantages as a measure of economic perfor-
mance for this study: First, the PWT data are adjusted and interpolated by external researchers
with no affiliation to reporting governments (though, the underlying data are still based on national
accounts). The PWT can thus be seen as a proxy for true economic performance (Gt or – equiva-
lently – the incumbent’s type θ in our model) rather than as a realization of the public signal s. The
PWT draws pricing and national accounts data for benchmark countries from the United Nations
International Comparisons Program (ICP). The ICP collects pricing data for 400 to 700 items in
each benchmark country, in addition to detailed national expenditures data for 150 categories
22Elsewhere, Hollyer, Rosendorff and Vreeland (2013), we note that this measure of transparency is a reflectionof both states’ ability (capacity) and their willingness to disclose data. In this instance, our theoretical interest isonly in the amount of information available to citizens, not in the rationale for its provision. (We examine suchquestions elsewhere, e.g. Hollyer, Rosendorff and Vreeland, 2011b). Since, however, state capacity may influencethe likelihood of regime collapse, we control for GDP per capita in our specification. We note, however, that capableautocratic regimes are more prone to collapse, while capable democratic regimes are less so.
28

of spending (Summers and Heston, 1991).23 These values are aggregated to compute national
accounts data measured in purchasing power parity (PPP) terms for the benchmark countries in
the benchmark year (2005 for PWT 6.3). Statistical models are then used to compute data for
non-benchmark countries in non-benchmark years. Pricing data for non-benchmark countries are
obtained by surveys conducted by the United Nations International Civil Service Commission and
the US State Department (Summers and Heston, 1991). Thus, while PWT data build upon the
input of national statistical offices, they also rely heavily on the input of external entities and are
distinct from the reported figures of governments.
Second, country time-series included in the PWT are uninterrupted. This is important when
employing a measure of data missingness – such as the HRV index – as an explanatory variable.
Were missing data present in the PWT, it is likely that missing values would correlate with trans-
parency levels. Listwise deletion would therefore censor variation in a key explanatory variable,
potentially inflating standard errors and understating measures of model fit.
Finally, we include a control for fuel exporters, drawn from (Easterly and Sewadeh, 2001). This
control is included given the resource curse hypothesis, which finds that fuel exports are strongly
negatively correlated with democracy and may promote autocratic longevity (Ross, 1999; Jensen
and Wantchekon, 2004).
Transparency, Mass Unrest and Autocratic Instability
In this section of the paper, we test our claims that (1) transparency is associated with an in-
creased probability of the collapse of autocratic leaders and (2) that transparency enhances the
association between growth and regime instability. Economic growth maps into the parameter Gt
(or, equivalently, the leader’s type θ) in our model. In equilibrium, leaders of low-type who perform
more poorly in office are more likely to removed – poor growth should predict regime collapse.
Proposition 2 establishes that this relationship between growth and collapse should grow stronger
as transparency rises. And Proposition 3 establishes that transparency should have a direct effect
on increasing the risk of regime removal.
Our empirical interest is in the threat autocratic leaders face from below – the danger that
mass mobilization will lead to removal of the ruling clique. Our model does not speak to the
threat leaders face from within their own ranks – i.e., the threat of coups or military interventions,
nor does it speak to the risks of intervention by foreign powers or resulting from civil wars.24
23There are 146 benchmark countries in the PWT 6.3, and 189 countries in the dataset as a whole. See “Whatis New in PWT 6.3” http://pwt.econ.upenn.edu/Documentation/PWT_63webac_final.doc, last accessedApril 16, 2013.
24We obtain analogous results, in which coefficients are estimated somewhat more precisely, if we instead focus
29

Our analysis therefore relies on a Cox competing hazards model of regime removal. Our model
estimates the hazard that a regime collapses due to pressures from below – the probability that
the ruling clique is unseated by a revolt or transitions to democracy in year t conditional on not
already having done so25 – conditional on covariates. Since authoritarian regimes may also be
unseated by other methods, these alternatives act as competing risks. We estimate our model
on all autocratic regimes in Svolik’s (2012) dataset, but those regimes that exit via other methods
are treated as censored after their death.26 The unit of observation is the autocratic regime-year,
where autocratic regimes are defined in accordance with Svolik (2012). (For simplicity, we refer
to instances of failure as autocratic collapse below. Except when explicitly noted otherwise, these
references are to collapse via revolt or democratization.)
More precisely, our model assumes that covariates shift the baseline hazard up or down
according to the function hl(t) = h0(t)eXl,tβ where l denotes autocratic regime l, t denotes
time, ho(t) is the baseline hazard function, and Xl,tβ is the product of the data matrix and a
corresponding vector of coefficients.27 Time, in this instance, is defined as the number of years
the autocratic regime has served in office.28
The Cox model estimates the baseline hazard function h0(t) non-parametrically based upon
the fraction of members of the risk pool who exit at time t, under the constraint that∫∞
0h0(t)dt =
1. Since we have no theoretical expectations regarding the relationship between the duration of
autocratic spells and the probability of autocratic removal, we let the data speak regarding this
issue. Time is, in essence, reduced to a nuisance parameter (Beck, Katz and Tucker, 1998).29
on autocratic to democratic transitions, as defined by the DD dataset (Cheibub, Gandhi and Vreeland, 2010). Resultsare available from the authors on request.
25Let f(t) denote the probability density function of autocratic regime failure (via revolt or democratization) as afunction of time t and let F (t) denote the corresponding cumulative distribution function. The hazard rate is definedas f(t)
1−F (t) .26For an empirical application and discussion of the competing hazards model see Goemans (2008). This model
assumes that hazard of one form of removal is conditionally independent of other forms of removal, an assumptionanalogous to the IIA assumption in multinomial logit specifications (Gordon, 2002).
27We test the assumption that covariates alter the level, but not the shape, of the baseline hazard using Grambsch-Thorneau and Harrell’s rho tests of the Schoenfeld residuals. Where these tests indicate violations of the proportionalhazards assumption, we adjust the model according to the recommendations of Box-Steffensmeier and Jones (2004)and Keele (2010).
28The duration in office is actually recorded to the day. We divide the number of days served in office by 365.25 torescale time in a more meaningful fashion.
29We prefer the Cox specification over alternatives (e.g., logit models with parametric controls for time, or otherparametric survival models) for two reasons: First, unlike logit models, the Cox model readily incorporates censoringin a manner that is particularly critical given the competing hazards faced by autocratic regimes. Second, unlike para-metric methods, the Cox specification deals with time dependence in highly (non-parametric) manner. In essence,time is reduced to a nuisance parameter. Note finally that the binary nature of our outcome variable argues stronglyagainst the use of fixed-effects or a conditional logit model. Such a model would only be identified off of regimes thatexperienced failures in the data – which constitute less than 25 percent of our sample. All other regimes (75 percent
30

Our analysis is complicated by the presence of autocratic regimes that have experienced prior
instances of instability in the data. Past instability may well influence current stability. Our pre-
ferred approach to dealing with this issue is to employ conditional gap time models, in which the
baseline hazard is estimated separately for autocratic regimes in states that experienced prior
autocratic collapses and those in states that have not (Box-Steffensmeier and Zorn, 2002). In
so-doing, we allow both the level and the shape of the baseline hazard to vary depending on
past experiences of instability, thereby flexibly modeling the non-Markovian nature of changes
in regimes.30 In one set of models, we separately estimate the baseline hazard conditional on
whether or not there has been a prior autocratic collapse; in another, we estimate separate base-
line hazards based on the number of instances of collapse;31 and in a final specification we simply
control for whether or not there has been a prior collapse. Prior collapses are coded as any in-
stance of regime removal (by any method) as coded by Svolik (2012) – i.e., the removal of one
autocratic leader and his replacement by another leader unaffiliated with the incumbent regime.
Our theoretical expectations are as follows: (1) The probability of collapse (via mobilization)
will be higher in more transparent than in less transparent autocracies. (2) Regime collapse
grows more likely as economic performance worsens. (3) Economic performance is likely to play
a greater role in autocratic survival in transparent, as opposed to opaque, autocracies. We thus
fit a model of the form:
hi(t) = h0(t)exp(γTransparencyi,t−1 + δGrowthi,t−1 + µTransparencyi,t−1 ×Growthi,t−1 + Xi,t−1β)
(3)
where Xβ is a matrix of controls and associated coefficients. All errors are clustered by autocratic
regime, to allow for inter-temporal correlation of the error term within autocratic regime spells.
Results from the model described by equation 3 are presented in Table 1. The table reports
coefficient values – not hazard ratios – so a positive coefficient indicates that a given covariate
increases the risk of autocratic collapse (via revolt or democratization); while a negative coeffi-
cient indicates the reverse. The three first columns contain the results from conditional gap time
models where the baseline hazard is estimated separately for autocratic-spells that experienced
a prior regime collapse (as defined above) and those that did not. The results in the next three
of the sample) would be dropped from any fixed-effects estimation.30For an empirical application of conditional gap time models in a different context, see Tiernay (2011).31Given the substantial variation in the history of instability in our sample, we collapse the number of past regime
removals into a categorical variable. This variable takes the value 1 if there has never been a prior collapse, 2 ifthere has been one collapse, 3 if there have been between 2 and 4 collapses, and 4 if there have been more than 4collapses.
31

columns present coefficients from conditional gap time models where the baseline hazard is sep-
arately estimated based on the number of prior regime collapses. And, results in the final three
columns are from models simply control for whether or not there was a prior instance of regime
collapse. In all models, we include controls for higher order polynomials of economic open-
ness (Ec.Openness2
100, Ec.Openness3
10,000) to adjust for violations of the proportional hazards assumption,
in keeping with the recommendations of Keele (2010).
The estimated coefficient on Transparency is large and positive in all models. While the
coefficient on this term is not statistically significant in every specification, all estimates place the
bulk of the posterior probability mass above zero – p-values range from a high of 0.17 to a low of
.05 across all specifications. Our point estimates suggest that a one standard deviation increase
in the level of Transparency increases the hazard of autocratic collapse by between 33 and 39
percent.
The coefficient on economic growth is negative and significant in all models. In keeping with
theoretical expectations, autocratic governments that inspire rapid economic growth are at lower
risk of collapse than those that do not achieve economic success. A one standard deviation
increase in the growth rate is associated with a reduction in the risk of revolt of between 20 and
40 percent.
Our theoretical expectations, as outlined in Proposition 2, further contend that the relationship
between growth and the hazard of regime collapse should be conditional on the level of trans-
parency. We thus include interactions of growth and transparency in all models. This estimate is
negative in nine of the ten models estimated, and is substantively meaningful. Point estimates in-
dicate that a shift in transparency from its median to its maximum values is predicted increase the
marginal effect of growth by between 25 and 100 percent based on the models that condition on
past removals (in the leftmost three columns of Table 1). However, this coefficient is imprecisely
estimated and never reaches levels of statistical significance.
Note, however, that the functional form of the Cox model implies an interactive effect of trans-
parency and growth. Because the covariate values shift the hazard rate according to the function
eXl,tβ, a change in a given covariate k has a marginal effect equal to βkeXl,tβ – i.e., the marginal
effect of a change in any given covariate is conditional on the values of all other covariates. Be-
cause the coefficient on Transparency is positive, this implies that a change in Growth will have
a larger effect on the probability of collapse as Transparency rises.32 That is, even without the
interactive term, the functional form of our model assumes that the relationship between growth
32More precisely, a change in the growth rate will have a roughly constant effect on the percentage change in therisk of autocratic collapse. Because that risk is elevated when Transparency is high, the absolute value of thechange in the risk of collapse for a given change in Growth will rise with Transparency.
32

Tabl
e1:
Cox
Mod
els,
Aut
ocra
tRem
oval
from
Bel
ow
Con
d.P
astC
olla
pse
Con
d.H
ist.
Inst
abili
tyC
ontr
olP
astC
olla
pse
Tran
spar
ency
0.16
80.
203*
0.19
2**
0.16
70.
168
0.16
80.
159
0.19
3*0.
193*
[-0.0
61,0
.397
][-0
.020
,0.4
25]
[0.0
03,0
.381
][-0
.058
,0.3
92]
[-0.0
48,0
.383
][-0
.041
,0.3
77]
[-0.0
70,0
.387
][-0
.033
,0.4
18]
[-0.0
07,0
.393
]G
row
th-0
.032
**-0
.029
**-0
.024
**-0
.050
**-0
.047
**-0
.038
**-0
.035
**-0
.030
**-0
.026
**[-0
.057
,-0.0
07]
[-0.0
51,-0
.006
][-0
.045
,-0.0
04]
[-0.0
95,-0
.005
][-0
.089
,-0.0
04]
[-0.0
73,-0
.003
][-0
.062
,-0.0
08]
[-0.0
54,-0
.007
][-0
.048
,-0.0
04]
Tran
spar
ency
-0.0
01-0
.004
-0.0
030.
001
-0.0
01-0
.004
-0.0
00-0
.003
-0.0
03×
Gro
wth
[-0.0
31,0
.028
][-0
.033
,0.0
26]
[-0.0
28,0
.021
][-0
.032
,0.0
34]
[-0.0
36,0
.033
][-0
.031
,0.0
24]
[-0.0
32,0
.031
][-0
.035
,0.0
29]
[-0.0
30,0
.025
]
GD
Ppe
rcap
ita0.
195
0.09
50.
144
[-0.3
25,0
.716
][-0
.467
,0.6
57]
[-0.2
84,0
.571
]E
c.O
penn
ess
-0.0
33-0
.031
-0.0
43*
[-0.0
78,0
.011
][-0
.074
,0.0
12]
[-0.0
90,0
.003
]E
c.O
penn
ess2
0.02
60.
023
0.03
4[-0
.013
,0.0
66]
[-0.0
16,0
.061
][-0
.008
,0.0
77]
Ec.
Ope
nnes
s3-0
.006
-0.0
05-0
.007
[-0.0
14,0
.003
][-0
.013
,0.0
03]
[-0.0
17,0
.002
]P
arty
0.00
6-0
.095
-0.2
00-0
.269
0.12
10.
006
[-0.8
97,0
.910
][-0
.993
,0.8
03]
[-1.2
25,0
.824
][-1
.256
,0.7
18]
[-0.8
01,1
.042
][-0
.927
,0.9
39]
Mili
tary
0.70
1*0.
612
0.52
50.
498
0.68
20.
589
[-0.1
22,1
.524
][-0
.169
,1.3
92]
[-0.2
94,1
.345
][-0
.267
,1.2
63]
[-0.1
40,1
.504
][-0
.180
,1.3
57]
Eve
rCol
laps
e0.
614
0.56
40.
723
[-0.3
87,1
.616
][-0
.421
,1.5
48]
[-0.2
11,1
.658
]#
ofS
ubje
cts
137
137
143
137
137
143
137
137
143
#of
Failu
res
3030
3130
3031
3030
31
Cox
com
petin
gha
zard
sre
gres
sion
sof
the
haza
rdof
auto
crat
icre
mov
alvi
are
volt
orde
moc
ratiz
atio
n.Th
em
odel
sde
pict
edin
the
first
thre
eco
lum
ns,
the
mid
dle
thre
eco
lum
ns,a
ndth
ela
stth
ree
colu
mns
diffe
rin
the
man
ner
inw
hich
they
deal
with
coun
trie
sth
atex
perie
nced
mul
tiple
auto
crat
icfa
ilure
s.Th
ose
inth
efir
stth
ree
colu
mns
repo
rta
cond
ition
alga
ptim
em
odel
whe
rein
the
base
line
haza
rdis
sepa
rate
lyes
timat
edfo
rreg
imes
that
expe
rienc
ea
prio
rreg
ime
failu
rean
dfo
rtho
seth
atdi
dno
t.Th
ose
inth
ene
xttw
oco
lum
nses
timat
ese
para
teba
selin
eha
zard
sba
sed
ona
cate
goric
alm
easu
reth
atre
flect
sth
enu
mbe
rof
prio
rco
llaps
es.
Thos
ein
the
final
thre
eco
lum
nssi
mpl
yco
ntro
lfor
prio
rco
llaps
es,
rath
erth
anst
ratif
ying
the
base
line
haza
rd.
Inal
lmod
els,
∗de
note
ssi
gnifi
canc
eat
the
10pe
rcen
tlev
el,∗
∗de
note
ssi
gnifi
canc
eat
the
5pe
rcen
tlev
el,a
nd∗∗
∗de
note
ssi
gnifi
canc
eat
the
1pe
rcen
tlev
el.9
5pe
rcen
tcon
fiden
cein
terv
als
are
pres
ente
din
brac
kets
.A
llst
anda
rder
rors
have
been
clus
tere
dby
auto
crat
icre
gim
e.
33

Smoothed estimates of the hazard rate as derived from the Cox Model inColumn 8 of Table 1. The figure to the left depicts the change in the hazardrate when growth moves from the 10th percentile to the 90th percentile inthe sample when the transparency score is at the 10th percentile observedin the sample. The figure to the right depicts the change in the hazardrate when growth changes from the 10th to the 90th percentile when trans-parency is at the 90th percentile. All other covariates are held at their meanvalues – save the Party and Military variables, which are held at 0; andthe Ever Collapse variable, which is held at 1.
Figure 4: Hazard Rates as a Function of Transparency and Growth
and regime removal is conditional on transparency in the manner expected theoretically. For
this reason, it is important to note that a significant coefficient on an interaction term is neither
“necessary nor sufficient” to imply a conditional relationship in a nonlinear model (Berry, DeMeritt
and Esarey, 2010, 248).33 To better grasp the relationship between transparency, growth, and
autocratic collapse, we plot smoothed estimates of the hazard function – based on Model 8 –
for different values of growth and transparency in Figure 4, holding all other variables (with the
exception of Party and Military, which are held at 0, and Ever Collapse, which is held at 1) at
their means.
As can be seen in Figure 4, a shift from the 10th to the 90th percentile of growth reduces the
33On this point, also see Ai and Norton (2003), Greene (2010), and Nagler (1991).
34

risk of collapse both when transparency levels are high and low. And a shift from the 10th to the
90th percentile of transparency increases the risk of collapse for all values of growth. And the
gap between the hazard of autocratic collapse when growth is poor and when it is high increases
in magnitude as transparency rises, as is consistent with the prediction of Proposition 2.
The effects of the control variables, by and large, are not statistically significant at conventional
levels. We find some limited evidence that economically open autocracies are less subject to
removal from below, and some evidence that (former) military leaders are more susceptible, but
neither finding is robust across all models.
Transparency and Other Forms of Autocratic Instability
Are relatively weak autocratic regimes – those most prone to removal via any method – simply
more likely to be transparent? Might the above results be explained by the reform efforts of
relatively weak regimes attempting to stave off their ouster?
We assess this possibility below. We do so by examining the relationship between trans-
parency, economic growth, and autocratic instability resulting from threats not involving mass
unrest or democratization. Our methods are broadly similar to those described above. Table 2
presents the results of a Cox competing hazards model of the hazard autocratic regimes face
from removal via a coup. In contrast to the results in the prior section, a regime fails if a sitting
autocratic leader is removed via a coup (which, in Svolik’s (2012) data involves a plot by either the
military or other elites involving the threat or use of force). Regimes removed via other methods
enter the dataset until they collapse, after which they are treated as censored. Table 3 presents
the results of Cox regressions of autocratic regime removal (via any method) on transparency,
growth and their interaction. As in the above section, we fit conditional gap time models in which
the baseline hazard is stratified by whether or not their has been a prior regime collapse, on the
number of prior regime collapses, and a final model in which we simply control for prior collapse.
Tables 2 and 3 show starkly contrasting results from those in Table 1, which examines removal
via mass unrest or democratization. Table 2 demonstrates that transparency is associated with
a reduced threat of coups. The coefficient on transparency is negative and large in all specifica-
tions, and significant at the 90 percent level or above in all specifications that do not control for
GDP per capita and economic openness. Furthermore, the coefficient on growth (and its interac-
tion with transparency) is consistently positive in all specifications. That is, growth, transparency,
and their interaction have the opposite association with instability as brought about via coups as
with instability brought about via unrest.
Table 3 shows that these starkly contrasting results offset one another when one considers
35

Tabl
e2:
Cox
Mod
els,
Aut
ocra
tRem
oval
via
Cou
p
Con
d.P
astC
olla
pse
Con
d.H
ist.
Inst
abili
tyC
ontr
olP
astC
olla
pse
Tran
spar
ency
-0.1
27-0
.226
*-0
.185
**-0
.201
-0.2
52*
-0.2
47*
-0.1
53-0
.222
**-0
.181
**[-0
.369
,0.1
14]
[-0.4
52,0
.000
][-0
.348
,-0.0
21]
[-0.5
92,0
.191
][-0
.534
,0.0
30]
[-0.5
21,0
.027
][-0
.399
,0.0
93]
[-0.4
39,-0
.004
][-0
.336
,-0.0
27]
Gro
wth
0.04
30.
032
0.03
20.
055*
0.03
90.
042
0.02
80.
029
0.02
8[-0
.013
,0.0
98]
[-0.0
17,0
.082
][-0
.009
,0.0
73]
[-0.0
10,0
.120
][-0
.013
,0.0
91]
[-0.0
09,0
.092
][-0
.015
,0.0
71]
[-0.0
17,0
.074
][-0
.011
,0.0
66]
Tran
spar
ency
0.00
00.
011
0.01
20.
019
0.02
30.
019
0.00
10.
007
0.01
0times
Gro
wth
[-0.0
33,0
.034
][-0
.021
,0.0
43]
[-0.0
05,0
.028
][-0
.034
,0.0
71]
[-0.0
16,0
.062
][-0
.014
,0.0
53]
[-0.0
31,0
.033
][-0
.023
,0.0
37]
[-0.0
05,0
.025
]
GD
Ppe
rcap
ita-1
.401
-1.4
10-1
.321
[-3.0
72,0
.269
][-3
.114
,0.2
93]
[-3.0
05,0
.363
]E
c.O
penn
ess
0.03
30.
039
0.02
2[-0
.031
,0.0
98]
[-0.0
22,0
.101
][-0
.039
,0.0
83]
Ec.
Ope
nnes
s2-0
.011
-0.0
13-0
.004
[-0.0
62,0
.040
][-0
.060
,0.0
34]
[-0.0
57,0
.048
]E
c.O
penn
ess3
0.00
10.
001
-0.0
01[-0
.010
,0.0
12]
[-0.0
08,0
.010
][-0
.012
,0.0
11]
Par
ty-0
.141
0.03
1-0
.410
0.04
2-0
.183
-0.0
05[-1
.234
,0.9
53]
[-1.1
42,1
.204
][-1
.537
,0.7
16]
[-1.0
14,1
.098
][-1
.379
,1.0
14]
[-1.2
32,1
.222
]M
ilita
ry0.
393
0.67
20.
369
0.66
00.
402
0.68
2[-0
.582
,1.3
67]
[-0.3
19,1
.664
][-0
.527
,1.2
65]
[-0.2
67,1
.588
][-0
.629
,1.4
32]
[-0.3
65,1
.729
]E
verC
olla
pse
0.48
60.
323
0.47
4[-0
.546
,1.5
17]
[-0.6
75,1
.321
][-0
.551
,1.4
98]
#of
Sub
ject
s13
713
714
313
713
714
313
713
714
3#
ofFa
ilure
s16
1618
1616
1816
1618
Cox
com
petin
gha
zard
sre
gres
sion
sof
the
haza
rdof
auto
crat
icre
mov
alvi
aco
up.
The
mod
els
depi
cted
inth
efir
stth
ree
colu
mns
,the
mid
dle
thre
eco
lum
ns,
and
the
last
thre
eco
lum
nsdi
fferi
nth
em
anne
rin
whi
chth
eyde
alw
ithco
untr
ies
that
expe
rienc
edm
ultip
leau
tocr
atic
failu
res.
Thos
ein
the
first
thre
eco
lum
nsre
port
aco
nditi
onal
gap
time
mod
elw
here
inth
eba
selin
eha
zard
isse
para
tely
estim
ated
for
regi
mes
that
expe
rienc
ea
prio
rre
gim
efa
ilure
and
for
thos
eth
atdi
dno
t.Th
ose
inth
ene
xttw
oco
lum
nses
timat
ese
para
teba
selin
eha
zard
sba
sed
ona
cate
goric
alm
easu
reth
atre
flect
sth
enu
mbe
rof
prio
rco
llaps
es.
Thos
ein
the
final
thre
eco
lum
nssi
mpl
yco
ntro
lfor
prio
rco
llaps
es,
rath
erth
anst
ratif
ying
the
base
line
haza
rd.
Inal
lmod
els,
∗de
note
ssi
gnifi
canc
eat
the
10pe
rcen
tle
vel,
∗∗de
note
ssi
gnifi
canc
eat
the
5pe
rcen
tle
vel,
and
∗∗∗
deno
tes
sign
ifica
nce
atth
e1
perc
ent
leve
l.95
perc
ent
confi
denc
ein
terv
als
are
pres
ente
din
brac
kets
.A
llst
anda
rder
rors
have
been
clus
tere
dby
auto
crat
icre
gim
e.
36

Tabl
e3:
Cox
Mod
els,
Aut
ocra
tRem
oval
via
All
Met
hods
Con
d.P
astC
olla
pse
Con
d.H
ist.
Inst
abili
tyC
ontr
olP
astC
olla
pse
Tran
spar
ency
0.01
40.
003
0.03
30.
010
-0.0
20-0
.005
0.01
20.
004
0.03
5[-0
.117
,0.1
45]
[-0.1
34,0
.141
][-0
.086
,0.1
52]
[-0.1
27,0
.147
][-0
.163
,0.1
24]
[-0.1
38,0
.129
][-0
.125
,0.1
49]
[-0.1
41,0
.149
][-0
.092
,0.1
61]
Gro
wth
-0.0
15-0
.014
-0.0
13-0
.014
-0.0
14-0
.016
-0.0
18-0
.016
-0.0
14[-0
.041
,0.0
11]
[-0.0
38,0
.011
][-0
.035
,0.0
09]
[-0.0
50,0
.022
][-0
.049
,0.0
21]
[-0.0
46,0
.013
][-0
.046
,0.0
10]
[-0.0
42,0
.011
][-0
.037
,0.0
08]
Tran
spar
ency
0.01
20.
009
0.00
50.
011
0.00
90.
005
0.01
30.
009
0.00
4×
Gro
wth
[-0.0
08,0
.032
][-0
.010
,0.0
29]
[-0.0
07,0
.017
][-0
.013
,0.0
34]
[-0.0
14,0
.032
][-0
.009
,0.0
20]
[-0.0
08,0
.034
][-0
.011
,0.0
30]
[-0.0
08,0
.017
]G
DP
perc
apita
-0.2
70-0
.334
-0.2
78[-0
.708
,0.1
69]
[-0.7
98,0
.130
][-0
.712
,0.1
56]
Ec.
Ope
nnes
s-0
.040
***
-0.0
32**
-0.0
46**
*[-0
.066
,-0.0
14]
[-0.0
57,-0
.006
][-0
.071
,-0.0
21]
Ec.
Ope
nnes
s20.
034*
**0.
027*
*0.
038*
**[0
.009
,0.0
59]
[0.0
04,0
.050
][0
.015
,0.0
62]
Ec.
Ope
nnes
s3-0
.008
**-0
.006
**-0
.009
***
[-0.0
15,-0
.002
][-0
.012
,-0.0
01]
[-0.0
15,-0
.003
]P
arty
0.38
40.
357
0.26
60.
256
0.40
80.
366
[-0.1
07,0
.875
][-0
.129
,0.8
44]
[-0.2
43,0
.775
][-0
.230
,0.7
43]
[-0.1
00,0
.916
][-0
.130
,0.8
61]
Mili
tary
0.05
70.
093
0.02
20.
075
0.06
80.
096
[-0.4
09,0
.522
][-0
.361
,0.5
46]
[-0.4
29,0
.474
][-0
.365
,0.5
15]
[-0.4
00,0
.537
][-0
.362
,0.5
55]
Eve
rCol
laps
e0.
285
0.28
90.
356
[-0.2
25,0
.795
][-0
.236
,0.8
15]
[-0.1
44,0
.856
]#
ofS
ubje
cts
137
137
143
137
137
143
137
137
143
#of
Failu
res
8787
9387
8793
8787
93
Cox
regr
essi
ons
ofth
eha
zard
ofau
tocr
atic
rem
oval
via
any
met
hod.
The
mod
els
depi
cted
inth
efir
stth
ree
colu
mns
,the
mid
dle
thre
eco
lum
ns,a
ndth
ela
stth
ree
colu
mns
diffe
rin
the
man
ner
inw
hich
they
deal
with
coun
trie
sth
atex
perie
nced
mul
tiple
auto
crat
icfa
ilure
s.Th
ose
inth
efir
stth
ree
colu
mns
repo
rta
cond
ition
alga
ptim
em
odel
whe
rein
the
base
line
haza
rdis
sepa
rate
lyes
timat
edfo
rreg
imes
that
expe
rienc
ea
prio
rreg
ime
failu
rean
dfo
rtho
seth
atdi
dno
t.Th
ose
inth
ene
xttw
oco
lum
nses
timat
ese
para
teba
selin
eha
zard
sba
sed
ona
cate
goric
alm
easu
reth
atre
flect
sth
enu
mbe
rofp
riorc
olla
pses
.Th
ose
inth
efin
alth
ree
colu
mns
sim
ply
cont
rolf
orpr
iorc
olla
pses
,rat
hert
han
stra
tifyi
ngth
eba
selin
eha
zard
.In
allm
odel
s,∗
deno
tes
sign
ifica
nce
atth
e10
perc
entl
evel
,∗∗
deno
tes
sign
ifica
nce
atth
e5
perc
entl
evel
,and
∗∗∗
deno
tes
sign
ifica
nce
atth
e1
perc
entl
evel
.95
perc
entc
onfid
ence
inte
rval
sar
epr
esen
ted
inbr
acke
ts.
All
stan
dard
erro
rsha
vebe
encl
uste
red
byau
tocr
atic
regi
me.
37
the risk autocratic regimes face from all possible threats. Coefficients on transparency, growth
and their interaction are never significant. Moreover, the point estimate of the coefficient on
transparency is consistently small – approximately equal to zero – and switches signs across the
various specifications. Transparency is associated with increased autocratic instability only via
threats from below – its relationship to threats emerging from within the regime follows starkly
different patterns.
Transparency and Unrest
We have thus established that (1) more transparent autocracies are more likely to experience
regime failures (in the form of revolts or democratization) than less transparent autocracies and
(2) the magnitude of the relationship between growth on the hazard of regime collapse is greater
under more transparent regimes. These findings are consistent with theoretical predictions re-
garding the role of data dissemination, but they constitute only indirect evidence that transparency
can lead to mass unrest under autocracy – via revolt or democratization.
To more directly test model mechanisms, we examine the relationship between transparency,
economic growth and the frequency of various forms of domestic unrest under autocratic rule:
namely, general strikes and anti-government demonstrations. If the theoretical mechanisms we
posit are correct, we should observe that mass mobilization is (1) more common in relatively
transparent autocracies, and (2) more strongly related to growth when levels of transparency are
high.
We also examine the relationship between transparency and forms of unrest not involving
mass mobilization, such as assassinations, coups, guerrilla warfare, and revolutions, which tend
to be executed by a small elite or counter-elite. Confidence that our results are driven by the
posited mechanism should be reinforced if we do not find similar relationships between these
forms of instability – the frequency of assassinations, coups and guerrilla movements – as we do
between transparency and mass mobilization. Were similar relationships to hold across all forms
of domestic unrest, it is probable that alternative mechanisms may link transparency to regime
instability. If we are able to rule out a relationship between transparency and forms of unrest not
involving mass mobilization, we will also rule out a variety of possible mechanisms that might
confound our results.
It is particularly important to examine this relationship given the danger of a form of selection
bias in our results. One could imagine a competing theoretical account, which holds that citi-
zens demand transparency from autocratic governments. When these governments are relatively
weak, they may capitulate to these demands in exchange for greater citizen support. Increases in
38

transparency may be part of more general reform efforts launched by weak autocrats in an effort
to buy the complacency of the masses. If these relatively weak autocrats are also more prone
to collapse, one might imagine that our results from the previous section were driven by omitted
variable bias.
Our results in this section speak to this concern in two ways. First, if weak governments ca-
pitulate to citizen demands by granting transparency, the relationship between mass mobilization
and transparency may be negative. Governments only increase levels of transparency to drive
down the risk of citizen unrest and would presumably cease such reform efforts if these prove
systematically ineffective. Second, weak autocrats are likely to be prone to a variety of forms of
instability – such as coups, guerrilla movements, and revolutions – not just to protests and strikes.
Consequently, if we do not observe a relationship between transparency and these other forms
of unrest, we can say with increased confidence that the relationship between transparency and
democratization is mediated by mobilization and is not confounded by the bargaining power of
incumbent autocrats.
To test the relationship between transparency, growth and the incidence of unrest, we rely
on country fixed-effects negative binomial regressions of the Banks measures of unrest on the
previously described measures of transparency, growth, and their interaction, as well as a host
of controls. We employ a negative binomial because the Banks data are measured as count
variables (they can assume non-negative integer values only), and because the data are likely to
be over-dispersed due to the large number of zero-valued observations. The negative binomial
functional form is (close to) a generalization of the Poisson count model. The Poisson constrains
the conditional mean of the distribution and its variance to assume the same value λ = eXc,tβ;
whereas, the negative binomial permits the value of the variance (1 +αλ)λ, α ∈ (0, 1) to exceed
that of the conditional mean λ.34
A fixed-effects negative binomial regression allows the value of the over-dispersion parameter
to vary across panels – i.e., αc replaces α. Consequently, the expected number of instances of
unrest for a given set of covariate values is constant across countries, but the variance around
that expectation will differ. Note that this type of ‘fixed-effects’ model differs from typical settings
in which each panel is assumed to have its own intercept term, such that the conditional mean
varies across panels (for instance, across countries).
34Note that the negative binomial does not truly nest the Poisson as the value of α is constrained to be positive.
39

Our empirical model is thus:
unresti,t = FENegBin(ρunresti,t−1 + ηTransparencyi,t−1 + ζGrowthi,t−1
+ ξTransparencyi,t−1 ×Growthi,t−1 + Xi,t−1ν + Tι) (4)
where c denotes country c, t denotes year t, T denotes a cubic polynomial of time and ι is a
vector of associated coefficients, Xc,t−1 is a matrix of controls and ν is a vector of associated
coefficients. We include a cubic polynomial of time to control for the potential confounding effects
of time trends using a very general functional form. And we include a lagged dependent variable
in all specifications to adjust for the dynamics of the data generating process (Beck and Katz,
2011).
Results from the model specified in equation 4 are reported in Table 4. Our regressions
alternatively use the number of general strikes, riots, demonstrations, revolutions, guerrilla move-
ments, coups, and assassinations as the outcome variable.
As is evident from these results, increased levels of transparency are robustly associated with
more frequent general strikes and demonstrations. The direct association between transparency
and the frequency of revolutions, guerrilla movements, coups and assassinations, however, is not
significantly different from zero. Transparency seems to therefore have the greatest influence on
the frequency of mass protest – and little direct influence on forms of unrest that do not involve
similar types of collective action.
As noted above, the interpretation of transparency’s role in conditioning the effect of growth
on unrest is not straightforward in non-linear models. More precisely, when the estimated coeffi-
cient on the Transparency term is large and positive, the functional form of the model contains
an implicit interactive effect in which the marginal effect of a change in Growth will be large
when values of Transparency are high. Given these difficulties of interpretation, we plot the
contemporaneous association between a change in growth rates and unrest at different levels of
Transparency in Figures 5-8 below.35
As is evident from Figures 5 and 6, transparency plays an important conditioning role with
respect to the association between growth rates and the frequency of general strikes and demon-
strations. Both strikes and demonstrations are more substantially more frequent under transpar-
ent regimes. The role of growth in predicting these forms of unrest is also accentuated when
35These are contemporaneous marginal associations. Note that the inclusion of the lagged dependent variableensures that the long-term equilibrium associations between unrest and covariates of interest will be several multiplesof those depicted in the figures below. Any differences in the marginal effect of growth between highly transparentand highly non-transparent country-years will thus grow in absolute magnitude.
40

Tabl
e4:
Fixe
d-E
ffect
sN
egat
ive
Bin
omia
lMod
els,
Unr
est
Gen
eral
Str
ikes
Rio
tsD
emon
stra
tions
Rev
olut
ions
Gue
rrill
aC
oups
Ass
assi
natio
nsLa
gU
nres
t0.
217*
*0.
082*
**0.
097*
**0.
181*
**0.
557*
**-0
.157
0.03
0[0
.002
,0.4
32]
[0.0
37,0
.127
][0
.063
,0.1
31]
[0.1
02,0
.260
][0
.359
,0.7
56]
[-1.0
35,0
.720
][-0
.050
,0.1
09]
Tran
spar
ency
0.49
6***
0.14
2**
0.24
9***
0.02
00.
008
-0.1
450.
049
[0.1
23,0
.868
][0
.006
,0.2
78]
[0.1
24,0
.375
][-0
.062
,0.1
02]
[-0.0
84,0
.100
][-0
.496
,0.2
06]
[-0.1
19,0
.217
]G
row
th-0
.019
0.00
7-0
.012
-0.0
000.
004
-0.0
35*
-0.0
34**
*[-0
.048
,0.0
09]
[-0.0
12,0
.027
][-0
.030
,0.0
05]
[-0.0
11,0
.011
][-0
.008
,0.0
16]
[-0.0
75,0
.005
][-0
.054
,-0.0
14]
Tran
spar
ency
-0.0
13-0
.004
0.00
10.
002
0.00
2-0
.015
**-0
.009
*×
Gro
wth
[-0.0
34,0
.007
][-0
.013
,0.0
05]
[-0.0
07,0
.010
][-0
.003
,0.0
06]
[-0.0
03,0
.007
][-0
.028
,-0.0
01]
[-0.0
18,0
.000
]
GD
Ppe
rcap
ita0.
464
0.52
30.
318
1.00
6*0.
241
-5.6
260.
885*
[-1.2
41,2
.170
][-0
.327
,1.3
72]
[-0.4
29,1
.065
][-0
.015
,2.0
27]
[-1.0
34,1
.515
][-1
7.02
5,5.
773]
[-0.1
19,1
.889
]E
c.O
penn
ess
0.00
1-0
.007
*-0
.001
-0.0
05**
-0.0
030.
003
-0.0
08[-0
.018
,0.0
20]
[-0.0
16,0
.001
][-0
.008
,0.0
06]
[-0.0
10,-0
.000
][-0
.008
,0.0
03]
[-0.0
14,0
.019
][-0
.019
,0.0
03]
Par
ty0.
802*
0.00
9-0
.095
-0.0
140.
222
1.16
0***
0.76
4***
[-0.0
17,1
.621
][-0
.428
,0.4
46]
[-0.4
90,0
.300
][-0
.336
,0.3
08]
[-0.2
14,0
.658
][0
.385
,1.9
35]
[0.2
14,1
.314
]M
ilita
ry0.
339
-0.2
19-0
.139
-0.3
47*
-0.4
95*
-0.2
620.
036
[-0.5
32,1
.209
][-0
.712
,0.2
74]
[-0.5
94,0
.317
][-0
.743
,0.0
48]
[-1.0
52,0
.062
][-1
.170
,0.6
46]
[-0.6
53,0
.726
]Fu
elE
xpor
ts-1
.502
0.47
7-0
.313
1.47
80.
282
1.43
7-0
.807
[-3.9
77,0
.973
][-0
.692
,1.6
45]
[-1.2
25,0
.600
][-1
51.4
12,1
54.3
67]
[-209
.599
,210
.163
][-1
210.
348,
1213
.222
][-2
.053
,0.4
39]
Con
stan
t-3
.346
***
-0.8
34-1
.050
**9.
487
10.4
969.
219
0.05
5[-5
.626
,-1.0
67]
[-1.9
70,0
.301
][-2
.077
,-0.0
23]
[-47.
107,
66.0
80]
[-55.
296,
76.2
88]
[-164
.458
,182
.896
][-1
.744
,1.8
54]
Cub
icTi
me
Poly
nom
ial
XX
XX
XX
X#O
bs59
098
610
1410
0267
151
463
5#C
ount
ries
4266
7065
4333
41
Fixe
d-ef
fect
sne
gativ
ebi
nom
ialr
egre
ssio
nsof
leve
lsof
unre
stas
afu
nctio
nof
trans
pare
ncy
and
grow
th.
Mea
sure
sof
unre
star
edr
awn
from
(Ban
ks,1
979)
.A
llm
odel
sin
clud
ea
lagg
edde
pend
entv
aria
ble,
the
coef
ficie
nton
whi
chis
repo
rted
inth
efir
stro
wof
the
tabl
e.∗
deno
tes
sign
ifica
nce
atth
e10
perc
entl
evel
,∗∗
deno
tes
sign
ifica
nce
atth
e5
perc
entl
evel
,and∗∗∗
deno
tes
sign
ifica
nce
atth
e1
perc
entl
evel
.95
perc
entc
onfid
ence
inte
rval
sar
epr
esen
ted
inbr
acke
ts.
41

levels of transparency are high. This is most notably true for the frequency of strikes. Demon-
strations grow more frequent as transparency rises, but they are not more highly sensitive to
economic performance.
By contrast, transparency seems to play little or no conditioning role with respect to the rela-
tionship between economic growth and the frequency of riots or assassinations. Assassinations
occur with similar frequency in both transparent and non-transparent autocracies. And while as-
sassinations are more common when growth is poor, this is true to a nearly equal extent under
both transparent and opaque autocracies.
Riots, on the other hand, appear to grow slightly (though far from significantly) more frequent
as transparency rises. However, these effects are small in magnitude – particularly when com-
pared to the large shift in the frequency of demonstrations and strikes. As noted above, though
riots involve some degree of collective action on the part of the public, the mechanisms driving
riots differ systematically from those driving forms of unrest more explicitly directed at the regime
in power.
These findings are broadly in keeping with the mechanisms posited by our theory. Trans-
parency appears to increase the frequency of – and to enhance the role of economic outcomes in
driving – mass mobilization, as manifested in the number of strikes and demonstrations. By con-
trast, transparency plays little role in predicting the number of assassinations or guerrilla move-
ments and coups.
Transparency and the Stability of Democracies
Proposition 6 contends that transparency should be associated with the stabilization of demo-
cratic regimes. Transparent democracies should face a lower hazard of collapse (and transition
to authoritarianism) than opaque democracies, due to transparency’s role in enhancing the effec-
tiveness of the electoral system. Since mass unrest to unseat democratically elected leaders is
driven by the perception that electoral rules fail to unseat rent-seeking or incompetent politicians,
enhancing the effectiveness of elections serves to decrease the likelihood of unrest. We test this
claim below, using methods broadly similar to our regressions pertaining to autocracies.
In addition to testing comparative statics that emerge from our theoretical model, these mod-
els help to reinforce the validity of our other empirical results. If our empirics are biased by the
omission of a variable correlated with both transparency and the risk of autocratic collapse, that
variable would have to have the opposite association with the risk of democratic collapse to sys-
tematically bias results in our favor. Any alternative mechanism that functions identically in both
democracies and autocracies would bias one set of results or the other in a direction opposed to
42
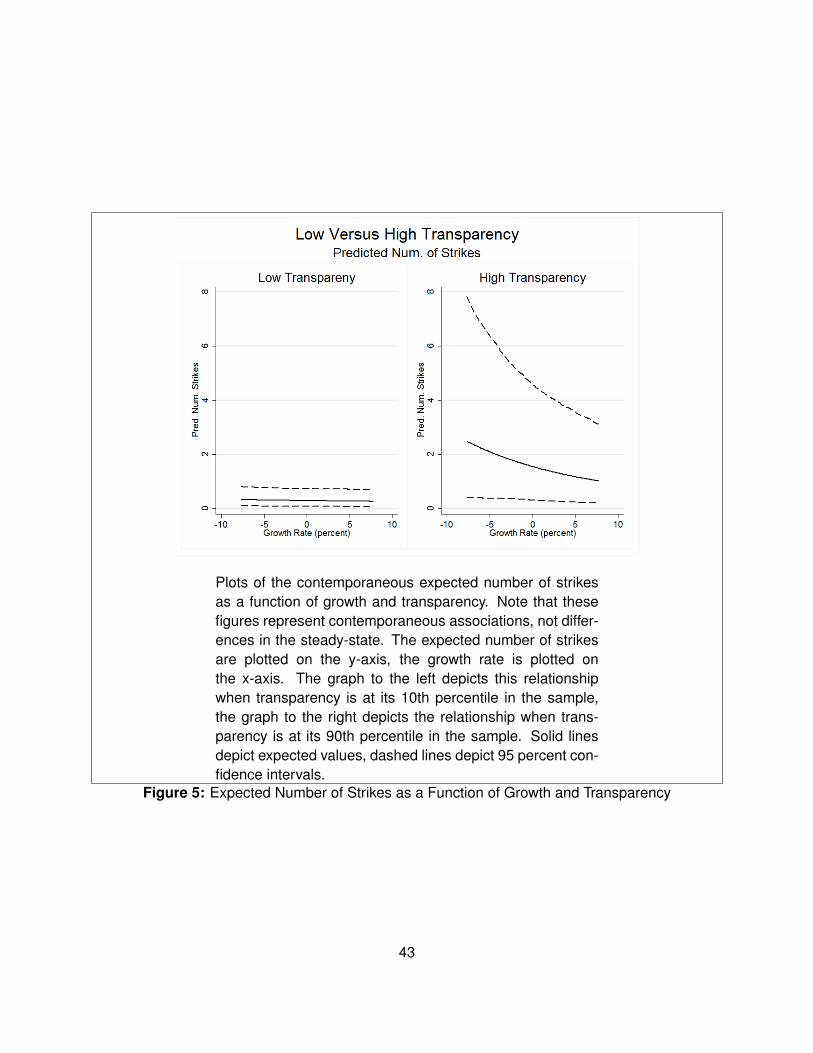
Plots of the contemporaneous expected number of strikesas a function of growth and transparency. Note that thesefigures represent contemporaneous associations, not differ-ences in the steady-state. The expected number of strikesare plotted on the y-axis, the growth rate is plotted onthe x-axis. The graph to the left depicts this relationshipwhen transparency is at its 10th percentile in the sample,the graph to the right depicts the relationship when trans-parency is at its 90th percentile in the sample. Solid linesdepict expected values, dashed lines depict 95 percent con-fidence intervals.
Figure 5: Expected Number of Strikes as a Function of Growth and Transparency
43

Plots of the contemporaneous expected number of anti-government demonstrations as a function of growth andtransparency. Note that these figures represent contempo-raneous associations, not differences in the steady-state.The expected number of anti-government demonstrationsare plotted on the y-axis, the growth rate is plotted onthe x-axis. The graph to the left depicts this relationshipwhen transparency is at its 10th percentile in the sample,the graph to the right depicts the relationship when trans-parency is at its 90th percentile in the sample. Solid linesdepict expected values, dashed lines depict 95 percent con-fidence intervals.
Figure 6: Expected Number of Demonstrations as Function of Growth and Transparency
44

Plots of the contemporaneous expected number of riots as afunction of growth and transparency. Note that these figuresrepresent contemporaneous associations, not differences inthe steady-state. The expected number of riots are plottedon the y-axis, the growth rate is plotted on the x-axis. Thegraph to the left depicts this relationship when transparencyis at its 10th percentile in the sample, the graph to the rightdepicts the relationship when transparency is at its 90th per-centile in the sample. Solid lines depict expected values,dashed lines depict 95 percent confidence intervals.
Figure 7: Expected Number of Riots as a Function of Growth and Transparency
45

Plots of the contemporaneous expected number of assassi-nations as a function of growth and transparency. Note thatthese figures represent contemporaneous associations, notdifferences in the steady-state. The expected number ofassassinations are plotted on the y-axis, the growth rate isplotted on the x-axis. The graph to the left depicts this re-lationship when transparency is at its 10th percentile in thesample, the graph to the right depicts the relationship whentransparency is at its 90th percentile in the sample. Solidlines depict expected values, dashed lines depict 95 percentconfidence intervals.
Figure 8: Expected Number of Assassinations as a Function of Growth and Transparency
46

our theoretical predictions. We thus boost confidence that our theoretical mechanisms have em-
pirical purchase by testing a variety of propositions with suggest that our key explanatory variable
has wildly different implications for regime survival in different institutional settings.
We begin by examining the relationship between the survival of democratic spells and levels
of transparency. In contrast to our models pertaining to autocracies, where we consider the
removal of a government through mass revolt or democratization, our outcome of interest here
is a democratic-to-autocratic transition, which we define using the DD dataset (Cheibub, Gandhi
and Vreeland, 2010). The unit of observation is the democratic spell-year, where a democratic
spell is defined as one or more continuous years of democratic rule.
As before, we test this relationship using Cox proportional hazards regressions, where the
baseline hazard rate is estimated using conditional gap time models. However, because the only
means of democratic collapse is an autocratic transition, we do not employ competing hazards
models. Moreover, because all democracies have multiple legislative parties, we drop the Party
indicator from our regressions. We instead add two indicators for the type of democracy: An
indicator equal to 1 for parliamentary democracies, and another indicator equal to 1 for mixed
presidential/parliamentary systems. Both variables are also drawn from the DD dataset.
Results from these regressions are presented in Table 5. The first two columns present coeffi-
cient estimates from a conditional gap time model in which the baseline hazard rate is stratified by
whether or not there was a prior transition, the next two present similar models stratified based on
the number of prior transitions, and the final two present estimates from a model run on democ-
racies that did not experience a prior transition to autocracy between 1870 and 2008. Table 5
presents estimates of coefficient values, not hazard ratios.
As can be seen from Table 5, the coefficient on transparency is consistently negative, large,
and significant at the 10 percent level or above. The point estimates suggest that a one standard
deviation increase in transparency serves to reduce the hazard of democratic collapse by between
roughly 70 to 95 percent. Even with the small number of democratic-to-autocratic transitions in
our sample, these estimates are significant at the 90 percent level or above in every specification.
Figure 9 presents estimates of the smoothed hazard function from the model in column 5 of
Table 5. The figure to the left presents estimates from when transparency is at its 10th percentile
in the sample; while, the figure to the right presents the smoothed hazard when transparency
is at its 90th percentile. Dashed lines depict the estimated hazard when growth is at its 10th
percentile; solid lines depict the same when growth is at its 90th percentile. As can be readily
seen, an increase in transparency is associated with a marked decline in the estimated hazard
rate.
47

Smoothed estimates of the hazard rate as derived from the Cox Modelin Column 5 of Table 5. The figure to the left depict the change in thehazard rate when growth moves from the 10th percentile to the 90th per-centile in the sample when the transparency score is at the 10th percentile.The figure to the right depicts the change in the hazard rate when growthchanges from the 10th to the 90th percentile when transparency is at the90th percentile. All other covariates are held at their mean values – savethe Parliamentary and Parliamentary × t variables, which are held at0.Figure 9: Dem. Hazard Rates as a Function of Transparency and Growth
These results thus offer support for Proposition 6 – as levels of transparency rise, the risk of
democratic collapse sharply declines. Transparency reinforces democracy even as it destabilizes
autocracies. Moreover, these results lend increased plausibility to the mechanisms we discuss
throughout the paper. While we cannot claim to test any causal relationships, for any mecha-
nism to systematically confound our results, it must have opposing effects in democracies and
autocracies.
48

Conclusion
Increased transparency – in the form of data dissemination – is thus robustly associated with
the reduced stability of autocratic regimes. Transparent autocracies experiencing low levels of
economic growth are particularly likely to be subject to collapse brought about either via mass
revolt or transition to democracy. This association between transparency and regime instability
appears to be driven by increased levels of mass mobilization. Transparency is associated with
more frequent demonstrations and strikes under autocratic rule, but is not associated with more
frequent coups, assassinations, or guerrilla movements.
Contrastingly, transparency is associated with the increased stability of democratic regimes.
More transparent democratic regimes face a far lower risk of collapse than do opaque democra-
cies.
These empirical findings are supportive of our theoretical account, which stresses the impor-
tance of data disclosure in coordinating citizen beliefs. Following the collective action accounts of
mass mobilization pioneered by Kuran (1991), we argue that unrest is facilitated by focal mech-
anisms that coordinate citizen beliefs. Without such information, citizens are likely to be highly
uncertain not only of the performance of their leaders, but also of other citizens’ willingness to
mobilize. The information contained in publically available aggregate economic data can serve to
coordinate beliefs under autocratic rule. In democracies, vote returns can play this role. But, data
disclosure still serves to better inform voters of government behavior, facilitating the sanctioning
of poorly performing rulers through constitutional methods.
These findings have implications for three literatures. First, they reinforce collective action-
based accounts of mass mobilization – as opposed to those stressing the importance of structural
factors or popular dissatisfaction with the incumbent government alone. Second, they have impli-
cations for a substantial literature on democratic transitions. Finally, we contribute to a growing
literature on the role of transparency. We stress a novel mechanism by which transparency may
affect political processes and government accountability (on transparency and accountability see
also Adserà, Boix and Payne, 2003). And our work offers suggestive implications for existing find-
ings that democracies tend to be more transparent than autocracies (Bueno de Mesquita et al.,
2003; Hollyer, Rosendorff and Vreeland, 2011a).
49

References
Acemoglu, Daron and James A. Robinson. 2006. Economic Origins of Dictatorship and Democ-
racy. Cambridge University Press.
Acemoglu, Daron, Simon Johnson, James A. Robinson and Pierre Yared. 2007. “Reevaluating
the Modernization Hypothesis.” NBER Working Paper.
Adserà, Alícia, Carles Boix and Mark Payne. 2003. “Are You Being Served? Political Accounata-
bility and Quality of Government.” The Journal of Law, Economics & Organization 19(2):445–
490.
Ai, Chunrong and Edward C. Norton. 2003. “Interaction Terms in Logit and Probit Models.” Eco-
nomic Letters 80:123–129.
Alesina, Alberto, Sule Ozler, Nouriel Roubini and Phillip Swagel. 1996. “Political Instability and
Economic Growth.” Journal of Economic Growth 1(2):189–211.
Alvarez, Mike, Jose Antonio Cheibub, Fernando Limongi and Adam Przeworski. 1996. “Classify-
ing Political Regimes.” Studies in Comparative International Development 31:3–36.
Angeletos, George-Marios, Christian Hellwig and Alessandro Pavan. 2007. “Dynamic Global
Games of Regime Change: Learning, Multiplicity, and the Timing of Attacks.” Econometrica
75(3):711–756.
Ansell, Ben and David Samuels. 2010. “Inequality and Democratization: A Contractarian Ap-
proach.” Comparative Political Studies 43(12):1543–1574.
Banks, Arthurs S. 1979. “Cross-National Time-Series Data Archive.” Center for Social Analysis,
State University of New York at Binghampton.
Beck, Nathaniel and Jonathan N. Katz. 2011. “Modeling Dynamics in Time-Series-Cross-Section
Political Economy Data.” Annual Review of Political Science 14:331–352.
Beck, Nathaniel, Jonathan N. Katz and Richard Tucker. 1998. “Taking Time Seriously: Time-
Series-Cross-Section Analysis with a Binary Dependent Variable.” American Journal of Political
Science 42(4):1260–1288.
Berliner, Daniel. 2011. “The Political Origins of Transparency.”.
50
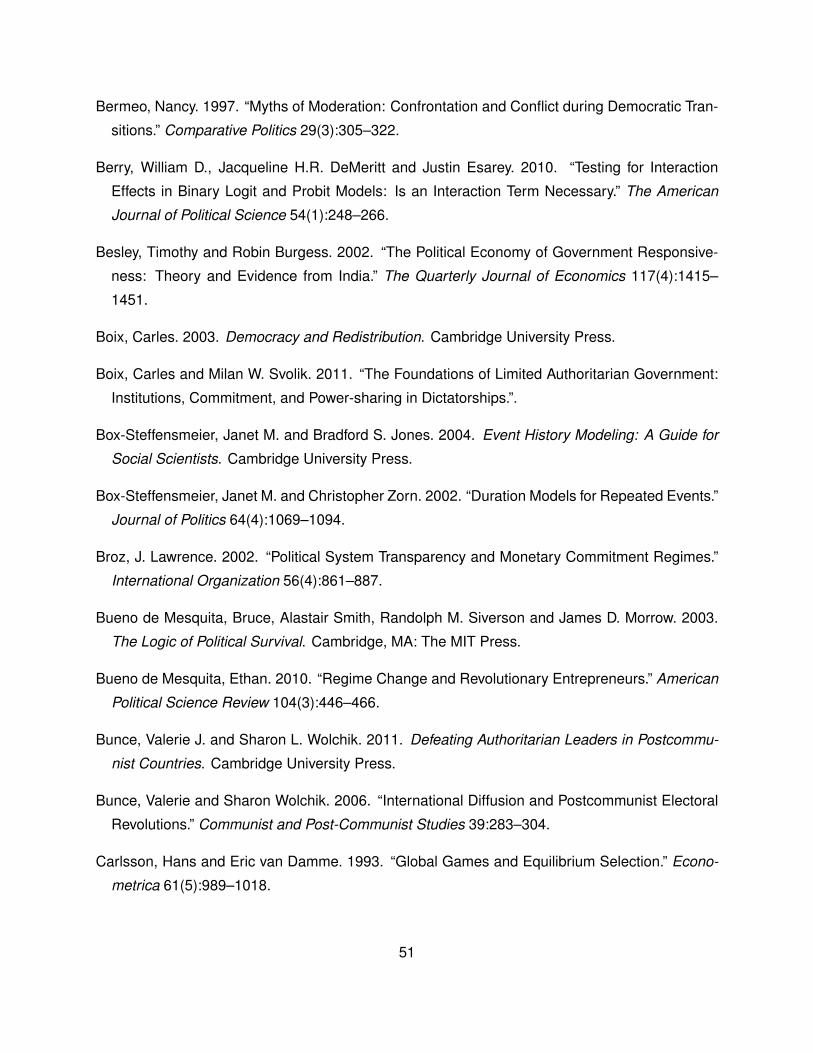
Bermeo, Nancy. 1997. “Myths of Moderation: Confrontation and Conflict during Democratic Tran-
sitions.” Comparative Politics 29(3):305–322.
Berry, William D., Jacqueline H.R. DeMeritt and Justin Esarey. 2010. “Testing for Interaction
Effects in Binary Logit and Probit Models: Is an Interaction Term Necessary.” The American
Journal of Political Science 54(1):248–266.
Besley, Timothy and Robin Burgess. 2002. “The Political Economy of Government Responsive-
ness: Theory and Evidence from India.” The Quarterly Journal of Economics 117(4):1415–
1451.
Boix, Carles. 2003. Democracy and Redistribution. Cambridge University Press.
Boix, Carles and Milan W. Svolik. 2011. “The Foundations of Limited Authoritarian Government:
Institutions, Commitment, and Power-sharing in Dictatorships.”.
Box-Steffensmeier, Janet M. and Bradford S. Jones. 2004. Event History Modeling: A Guide for
Social Scientists. Cambridge University Press.
Box-Steffensmeier, Janet M. and Christopher Zorn. 2002. “Duration Models for Repeated Events.”
Journal of Politics 64(4):1069–1094.
Broz, J. Lawrence. 2002. “Political System Transparency and Monetary Commitment Regimes.”
International Organization 56(4):861–887.
Bueno de Mesquita, Bruce, Alastair Smith, Randolph M. Siverson and James D. Morrow. 2003.
The Logic of Political Survival. Cambridge, MA: The MIT Press.
Bueno de Mesquita, Ethan. 2010. “Regime Change and Revolutionary Entrepreneurs.” American
Political Science Review 104(3):446–466.
Bunce, Valerie J. and Sharon L. Wolchik. 2011. Defeating Authoritarian Leaders in Postcommu-
nist Countries. Cambridge University Press.
Bunce, Valerie and Sharon Wolchik. 2006. “International Diffusion and Postcommunist Electoral
Revolutions.” Communist and Post-Communist Studies 39:283–304.
Carlsson, Hans and Eric van Damme. 1993. “Global Games and Equilibrium Selection.” Econo-
metrica 61(5):989–1018.
51

Casper, Brett A. and Scott A. Tyson. 2013. “Popular Protest and Elite Coordination in a Coup
d’Etat.” Working Paper, NYU.
Cheibub, José Antonio. 2007. Presidentialism, Parliamentarism, and Democracy. Cambridge
University Press.
Cheibub, José Antonio, Jennifer Gandhi and James Raymond Vreeland. 2010. “Democracy and
Dictatorship Revisited.” Public Choice 143:67–101.
Cox, Gary W. 1987. “Electoral Equilibrium Under Alternative Voting Institutions.” The American
Journal of Political Science 31(1):82–108.
Dahl, Robert A. 1971. Polyarchy: Participation and Opposition. Yale University Press.
Djankov, Simeon, Caralee McLiesh, Tatiana Nenova and Andrei Shleifer. 2003. “Who Owns the
Media?” Journal of Law and Economics 46(2):341–381.
Downs, Anthony. 1957. An Economic Theory of Democracy. Harper & Row.
Easterly, William and Mirvat Sewadeh. 2001. “Global Development Network Growth Database.”
World Bank Economic and Development Research Group, Washington, D.C.
Fearon, James D. 2011. “Self-Enforcing Democracy.” Quaterly Journal of Economics
126(4):1661–1708.
Fudenberg, Drew and Jean Tirole. 1991. Game Theory. The MIT Press.
Gandhi, Jennifer. 2008. Political Institutions Under Dictatorship. Cambridge University Press.
Gandhi, Jennifer and Adam Przeworski. 2006. “Cooperation, Cooptation, and Rebellion Under
Dictatorships.” Economics and Politics 18(1):1–26.
Gandhi, Jennifer and Adam Przeworski. 2007. “Authoritarian Institutions and the Survival of Au-
tocrats.” Comparative Political Studies 40:1279–1301.
Gerring, John and Strom C. Thacker. 2004. “Political Institutions and Corruption: The Role of
Unitarism and Parliamentarism.” British Journal of Political Science 34:295–330.
Goemans, Hein E. 2008. “Which Way Out? The Manner and Consequences of Losing Office.”
Journal of Conflict Resolution 52(6):771–794.
52

Gordon, Sanford C. 2002. “Stochastic Dependence in Competing Risks.” American Journal of
Political Science 46(1):200–217.
Greene, William. 2010. “Testing Hypothesis About Interaction Terms in Nonlinear Models.” Eco-
nomic Letters 107:291–296.
Grief, Avner. 2006. Institutions and the Path to the Modern Economy: Lessons from Medieval
Trade. Cambridge University Press.
Habyarimana, James, Macartan Humphreys, Daniel N. Posner and Jeremy M. Weinstein. 2009.
Coethnicity: Diversity and the Dilemmas of Collective Action. Russell Sage Foundation.
Haggard, Stephan and Robert R. Kaufman. 1995. The Political Economy of Democratic Transi-
tions. Princeton University Press.
Heston, Alan, Robert Summers and Bettina Aten. 2009. Penn World Table Version 6.3. Tech-
nical report Center of International Comparisons at the University of Pennsylvania. Center of
International Comparisons at the University of Pennsylvania.
Hibbs, Jr., Douglas A. 2000. “Bread and Peace Voting in U.S. Presidential Elections.” Public
Choice 104:149–180.
Hollyer, James R. and B. Peter Rosendorff. 2012. “Leadership Survival, Regime Type, Policy
Uncertainty and PTA Accession.” International Studies Quarterly 56(4):748–764.
Hollyer, James R., B. Peter Rosendorff and James R. Vreeland. 2011a. “Democracy and Trans-
parency.” Journal of Politics 73(4):1–15.
Hollyer, James R., B. Peter Rosendorff and James R. Vreeland. 2011b. “Democracy and Trans-
parency.”.
Hollyer, James R., B. Peter Rosendorff and James Raymond Vreeland. 2013. “Measuring Trans-
parency.”.
Huber, Evelyne, Dietrich Rueschemeyer and John D. Stephens. 1993. “The Impact of Economic
Development on Democracy.” Journal of Economic Perspectives 7(3):71–86.
Hyde, Susan and Nikolay Marinov. forthcoming. “Information and Self-Enforcing Democracy: The
Role of International Election Observers.” International Organization .
53

Islam, Roumeen. 2006. “Does More Transparency Go Along with Better Governance?” Eco-
nomics and Politics 18(2):121–167.
Jensen, Nathan and Leonard Wantchekon. 2004. “Resource Wealth and Political Regimes in
Africa.” Comparative Political Studies 37.7:816–841. compartive F06.
Kapuscinski, Ryszard. 1992. Shah of Shahs. Vintage International.
Keele, Luke. 2010. “Proportionally Difficult: Testing for Nonproportional Hazards in Cox Models.”
Political Analysis 18(2):189–205.
Kramer, Gerald H. 1983. “The Ecological Fallacy Revisited: Aggregate- versus Individual-level
Findings on Economics and Elections, and Sociotropic Voting.” The American Political Science
Review 77.1:92–111.
Kunicová, Jana and Susan Rose-Ackerman. 2005. “Electoral Rules and Constitutional Structures
as Constraints on Corruption.” British Journal of Political Science 35.4.
Kuran, Timur. 1991. “Now Out of Never: The Element of Surprise in the East European Revolution
of 1989.” World Politics 44(1):7–48.
Lipset, Seymor Martin. 1959. “Some Social Requisites of Democracy: Economic Development
and Political Legitimacy.” American Political Science Review 53(1):69–105.
Little, Andrew T. 2012. “Elections, Fraud and Election Monitoring in the Shadow of Revolution.”
Quarterly Journal of Political Science 7:249–283.
Little, Andrew T., Joshua A. Tucker and Tom LaGatta. 2013. “Elections, Protest and Alternation
of Power.”.
Lizzeri, Alessandro and Nicola Persico. 2004. “Why Did the Elites Extend the Suffrage? Democ-
racy and the Scope of Government, with and Application to Britain’s “Age of Reform”.” The
Quarterly Journal of Economics pp. 707–764.
Locke, John. 1980/1690. Second Treatise of Government. Hackett Publishing Co.
Lohmann, Susanne. 1993. “A Signaling Model of Informative and Manipulative Political Action.”
American Political Science Review 87(2):319–333.
54

Mansfield, Edward D., Helen V. Milner and B. Peter Rosendorff. 2002. “Why Democracies Coop-
erate More: Electoral Control and International Trade Agreements.” International Organization
56(3):477–513.
Markus, Gregory B. 1988. “The Impact of Personal and National Conditions on the Presidential
Vote: A Pooled Cross-Sectional Analysis.” American Journal of Political Science 32(1):137–
154.
Miller, Michael K. 2012. “Economic Development, Violent Leader Removal and Democratization.”
American Journal of Political Science 56(4):1002–1020.
Moore, Jr., Barrington. 1966. Social Origins of Dictatorship and Democracy: Lord and Peasant in
the Making of the Modern World. Beacon Press.
Morris, Stephen and Hyun Song Shin. 1998. “Unique Equilibrium in a Model of Self-Fulfilling
Currency Attacks.” American Economic Review 88(3):587–597.
Morris, Stephen and Hyun Song Shin. 2001. “Global Games: Theory and Application.” Cowles
Foundation Discussion Paper No. 1275R.
Morris, Stephen and Hyun Song Shin. 2002. “Social Value of Public Information.” American Econ-
mic Review 92(5):1521–1534.
Myerson, Roger B. 2008. “The Autocrat’s Credibility Problem and Foundations of the Constitu-
tional State.” The American Political Science Review 102(1):125–139.
Nagler, Jonathan. 1991. “The Effect of Registration Laws and Education on U.S. Voter Turnout.”
The American Political Science Review 85:1393–1405.
Olson, Jr., Mancur. 1971. The Logic of Collective Action: Public Goods and the Theory of Groups.
Harvard University Press.
Przeworski, Adam. 1998. Deliberative Democracy. Cambridge Studies in the Theory of Democ-
racy Cambridge University Press chapter Deliberation and Ideological Domination, pp. 140–
160.
Przeworski, Adam. 2005. “Democracy as an Equilibrium.” Public Choice 123:253–273.
Przeworski, Adam. 2008. “Conquered or Granted? A History of Suffrage Extensions.”.
55

Przeworski, Adam. 2009. “Conquered or Granted? A History of Suffrage Extensions.” British
Journal of Political Science 39(2):291–321.
Przeworski, Adam and Fernando Limongi. 1997. “Modernization: Theories and Facts.” World
Politics 49.2:155–183.
Przeworski, Adam, Michael E. Alvarez, José Antonio Cheibub and Fernando Limongi. 2000.
Democracy and Development: Political Institutions and Well-Being in the World, 1950-1990.
Cambridge University Press.
Rosendorff, B. Peter. 2001. “Choosing Democracy.” Economics & Politics 13(1):1–29.
Ross, Michael L. 1999. “The Political Economy of the Resource Curse.” World Politics 51:297–
322.
Samuels, David J. and Matthew Soberg Shugart. 2003. “Presidentialism, Elections, and Repre-
sentation.” Journal ofTheoretical Politics 15(1):33–60.
Scacco, Alexandra. 2008. “Who Riots? Explaining Individual Participation in Ethnic Violence.”.
Shadmehr, Mehdi and Dan Bernhardt. 2011. “Collective Action with Uncertain Payoffs: Co-
ordination, Public Signals, and Punishment Dilemmas.” American Political Science Review
105(4):829–851.
Simpser, Alberto. 2004. “Making Votes Not Count: Strategic Incentives for Electoral Corruption.”.
Summers, Robert and Alan Heston. 1991. “The Penn World Table (Mark 5): An Expanded Set of
International Comparisons, 1950-1988.” Quarterly Journal of Economics 106(2):327–368.
Svolik, Milan W. 2012. The Politics of Authoritarian Rule. Cambridge University Press.
Tiernay, Michael. 2011. “Battle Outcomes and Peace Agreements.”.
Tucker, Joshua A. 2007. “Enough! Electoral Fraud, Collective Action Problems, and Post-
Communist Colored Revolutions.” Perspectives on Politics 5(3):535–551.
Wantchekon, Leonard. 2004. “The Paradox of “Warlord” Democracy: A Theoretical Investigation.”
The American Political Science Review 98.1:17–33.
Weingast, Barry R. 1997. “The Political Foundations of Democracy and the Rule of Law.” The
American Political Science Review 91(2):245–263.
56

Wintrobe, Ronald. 1998. The Political Economy of Dictatorship. Cambridge University Press.
Wood, Elisabeth Jean. 2000. Forging Democracy from Below: Insurgent Transitions in South
Africa and el Salvador. Ca.
World Bank. N.d. “World Development Indicators.” Washington, DC: The World Bank.
Wright, Joseph. 2008. “Do Authoritarian Institutions Constrain? How Legislatures Affect Eco-
nomic Growth and Investment.” American Journal of Political Science 52:322–343.
Appendix: Proofs of Theoretical Propositions
Transparency in Autocracies
Lemma 1. y∗(s) is well-defined and monotone in s.
Proof. Definition 2 gives us Pr(θ = 0|y∗(s), s)β = κ. Substituting the posterior probability,
conditional on signals s and y∗(s), generated by Bayes’ rule, yields
φ( y∗(s)σy
)φ( sσs
)(1− p)
pφ( y∗(s)−gσy
)φ( s−gσs
) + φ( y∗(s)σy
)φ( sσs
)(1− p)β = κ
where φ is the pdf of the standard normal. Rearranging yields y∗(s) = g2(1 +
σ2y
σ2s) − sσ2
y
σ2s−
σ2y
gln( pκ
(1−p)[β−κ]) which is monotone in s.
Proof of Equilibrium Existence
Proof of Proposition 1. The leader has a dominant strategy to match his type. Since uL,t(G; θ) =
1 if Gt = θ, zero otherwise, for t ∈ {1, 2}, it is always optimal to set Gt = θ in each period
t ∈ {1, 2} of the game. Following these equilibrium strategies, citizen i sets ai = 1 if yi,1 ≤ y∗(s).
Since there is a continuum of citizens, the proportion of citizens that mobilize, i.e. set ai = 1 is
either Pr{yi,1 ≤ y∗(s)|θ = 0} or Pr{yi,1 ≤ y∗(s)|θ = 1} depending on the type of leader. That
is the proportion of citizens that protest is either Φ( y∗(s)σy
) or Φ( y∗(s)−gσy
) where Φ is the cdf of the
standard normal. If Φ( y∗(s)σy
) ≥ T > Φ( y∗(s)−gσy
), L is removed if and only if θ = 0. Then for any
57

citizen i, given the actions of other citizens, and the leader, i will prefer to set ai = 1 iff:
Pr(θ = 1|yi,1, s)g + Pr(θ = 0|yi,1, s)[pg + β]− κ ≥ Pr(θ = 1|yi,1, s)g + Pr(θ = 0|yi,1, s)pg
Pr(θ = 0|yi,1, s)β ≥ κ
The left hand side is the expected earnings to citizen i of protesting after receiving both her
private and public signals. If the leader is a good type, in equilibrium he will survive the protest
and implement policies that yield the citizen payoff g in expectation in the second period (the first
term). If, on the other hand the leader is a bad type, he is removed for sure, and replaced with a
good type with probability p that implements g (a bad type would implement 0). There is also a
benefit of β for participating in a successful protest (the second term). Of course political action
incurs fixed costs κ. If the citizen does not protest, her payoffs are as on the right hand side.
Since there is a continuum of citizens, no citizen is pivotal. Hence a good leader will survive the
protest and implement g in the second period; a poor leader will fall, and be replaced with a good
leader with probability p who will institute good policy g.
Therefore, when Φ( y∗(s)σy
) ≥ T > Φ( y∗(s)−gσy
), each citizen optimally protests (given the other
citizens and the leader’s actions) when yi,1 ≤ y∗(s). If, on the other hand, Φ( y∗(s)σy
) < T , and
each citizen i is adopting a strategy of ai = 1 if and only if yi,1 ≤ y∗(s), then L would never
be removed. Given that this is the case, the utility from setting ai = 1 is −κ < 0, and so this
cannot be a best response. Thus, ai = 0 ∀ i if Φ( y∗(s)σy
) < T . We write this as y(s) = −∞ when
Φ( y∗(s)σy
) < T .
Conversely, if Φ( y∗(s)−gσy
) ≥ T , and each citizen i is adopting a strategy of ai = 1 if an only
if yi,1 ≤ y∗(s), then L would always be removed, regardless of type. Given that this is the case,
the utility from setting ai = 1 is β − κ > 0, the return from not participating. Hence ai = 1 ∀ i if
Φ( y∗(s)−gσy
) ≥ T is a best response. We write this as y(s) =∞ when Φ( y∗(s)−gσy
) ≥ T .
Together these yield a best response for any citizen as yi,1 ≤ y(s) where y(s) is as defined in
Definition 2.
Finally, beliefs follow directly from Bayes’ rule.
Lemma 2. s and s are well-defined
Proof. Recall from Lemma 1 that y∗(s) is monotonic (and decreasing) in s. Further lims→∞ y∗(s) =
−∞ and lims→−∞ y∗(s) =∞. Since Φ( y
∗(s)σy
) (Φ( y∗(s)−gσy
)) are monotonic and increasing in y∗(s)
and limited below by zero and above by 1, it follows that there exist two values of s, which we
define as s and s, such that T = Φ( y∗(s)−gσy
) and T = Φ( y∗(s)σy
).
58

Transparency Improves Discrimination
Proof of Proposition 2. Discrimination = Φ( sσs
) − Φ( s−gσs
). Firstly, recall that Φ( y∗(s)σy
) = T .
Substituting y∗(s) from Lemma 1, and solving we get s = g2(σ
2s
σ2y
+ 1) − σ2s
gln( pκ
(1−p)[β−κ]) −
σ2s
σyΦ−1(T ). Similarly, since Φ( y
∗(s)−gσy
) = T , substituion and rearranging leads to s = g2(1 −
σ2s
σ2y) − σ2
s
gln( pκ
(1−p)[β−κ]) − σ2
s
σyΦ−1(T ). Then ∂
∂σs( sσs
) = g2( 1σ2y− 1
σ2s) − 1
gln( pκ
(1−p)[β−k]) − 1
σyΦ−1(T )
and ∂∂σs
( s−gσs
) = g2( 1σ2s− 1
σ2y)− 1
gln( pκ
(1−p)[β−κ])− 1
σyΦ−1(T ). To conserve on notation, we will label
Z ≡ 1gln( pκ
(1−p)[β−κ]) + 1
σyΦ−1(T ), and hence
∂
∂σs(s
σs) =
g
2(
1
σ2y
− 1
σ2s
)− Z
∂
∂σs(s− gσs
) =g
2(
1
σ2s
− 1
σ2y
)− Z
while g2( 1σ2s− 1
σ2y) > 0 > g
2( 1σ2y− 1
σ2s), given that σs < σy. Notice too that
g
2(
1
σs+σsσ2y
)− σsZ =s
σs
−g2
(1
σs+σsσ2y
)− σsZ =s− gσs
Since φ(.) is the pdf of a standard normal, we can also notice that
φ(s
σs) T φ(
s− gσs
)⇔ Z T 0. (5)
Now consider a change in discrimination due to a change in σs:
∂
∂σs[Φ(
s
σs)− Φ(
s− gσs
)] < 0⇔
φ(s
σs)[∂
∂σs(s
σs)] < φ(
s− gσs
)[∂
∂σs(s− gσs
)] (6)
Having defined these preliminaries, we can now evaluate condition 6. Let us first assume∂∂σs
( sσs
) > 0. Notice that, since g2( 1σ2y− 1
σ2s) < 0, this implies that Z < 0. Condition 6 can thus be
expressed as:
φ( sσs
)
φ( s−gσs
)<
g2( 1σ2s− 1
σ2y)− Z
g2( 1σ2y− 1
σ2s)− Z
59

Since Z < 0, we know from equation (5) that the LHS of this inequality is strictly less than one.
We similarly know that the RHS of this inequality must be strictly greater than one, given that
σs < σy and the denominator is positive. Thus, this inequality must hold.
Let us now consider the case where ∂∂σs
( sσs
) < 0. Then condition 6 can be rewritten as:
φ( sσs
)
φ( s−gσs
)>
g2( 1σ2s− 1
σ2y)− Z
g2( 1σ2y− 1
σ2s)− Z
When ∂∂σs
( sσs
) < 0, ∂∂σs
( s−gσs
) may be either positive or negative. If it is positive, it is immediately
apparent that this inequality must hold – the RHS will be strictly negative, while the LHS (by the
definition of a pdf) is strictly positive.
Let us now consider the final possible case, in which ∂∂σs
( s−gσs
) < 0. Since g2( 1σ2s− 1
σ2y) > 0, this
implies that Z > 0 andg2
( 1
σ2s− 1
σ2y
)−Zg2
( 1
σ2y− 1
σ2s
)−Z ∈ (0, 1). Z > 0 implies thatφ( sσs
)
φ( s−gσs
)> 1. Thus, the inequality
holds.
Hence condition 6 holds for all possible parameter values. Discrimination is therefore be rising
in transparency.
Corollary 1 follows directly from the strategies identified in the equilibrium in Proposition 1.
Proof of Proposition 3
Proof of Proposition 3. The unconditional probability of autocratic removal is given by (1−p)Φ( sσs
)+
pΦ( s−gσs
). This probability is increasing in transparency if the quantity above is decreasing in σs.
Thus, the unconditional probability of democratization is rising in transparency iff
(1− p)φ(s
σs)[∂
∂σs(s
σs)] + pφ(
s− gσs
)[∂
∂σs(s− gσs
)] < 0. (7)
As we saw in the proof of Proposition 2 above, ∂∂σs
( s−gσs
) > ∂∂σs
( sσs
). Thus, a sufficient condition
for condition 7 to hold is that ∂∂σs
( s−gσs
) ≤ 0. Recall that
∂
∂σs(s− gσs
) =g
2(
1
σ2s
− 1
σ2y
)− Z
which is monotonic and decreasing in σs and converges to −Z as σs → σy. Thus, if Z > 0, there
exists a value σs such that this expression is negative for all σs ≥ σs. Finally, Z > 0 implies that1gln( pκ
(1−p)[β−κ]) + 1
σyΦ−1(T ) > 0 or Φ−1(T ) > −σy
gln( pκ
(1−p)[β−κ]).
60

Proof of Remark 1
Proof of Remark 1. From the proof of Proposition 3 above, a sufficient condition for the uncondi-
tional probability of autocratic removal to be rising in transparency (falling in σs) is ∂∂σs
( s−gσs
) ≤ 0.
Now ∂∂σs
( s−gσs
) = g2( 1σ2s− 1
σ2y) − Z and Z = 1
gln( pκ
(1−p)[β−κ]) + 1
σyΦ−1(T ). Then limβ→κ Z =
∞ ∀ T > 0 and hence limβ→κ∂∂σs
( s−gσs
) < 0 ∀σs, T > 0.
Transparency in Democracies
Lemma 3. y(s) is well defined
Proof. Recall Pr(θ = 1|y(s), s) = p. From Bayes rule,
Pr(θ = 1|y(s), s) =pφ( y(s)−g
σy)φ( s−g
σs)
pφ( y(s)−gσy
)φ( s−gσs
) + (1− p)φ( y(s)σy
)φ( sσs
).
Then y(s) = g2(σ2y
σ2s
+ 1)− sσ2y
σ2s
.
Proof of Equilibrium Existence
Proof of Proposition 4. As before the leader has a dominant strategy to match her type: L’s best
response is to set Gt = θ in t ∈ {1, 2}. In the voting stage, given the equilibrium strategies
of the leader and the other voters, voter i votes against the incumbent (set vi = 1) if and only
if Pr(θ = 1|yi,1, s) ≤ p. Substituting the equilibrium interim beliefs and simplifying yields the
condition that vi = 1 iff yi,1 < y(s). So the voter is playing a best response and consistent with
beliefs. After the voting is complete, and given these strategies by the voters, the number of
votes to remove L is given by V (θ; s), as defined in Definition 4. Notice that, for any value of s,
V (1, s) < V (0, s) – the vote share of the incumbent is strictly lower if she is of type θ = 0 than if
she is of type θ = 1. This then implies that – given the public signal – each citizen i can deduce
L’s type with certainty based on her vote share. More precisely, each citizen i’s posterior beliefs
will be given by:
Pr(θ = 1|V, s) =
{0 if V > V (1, s)
1 otherwise.
Given these posterior beliefs, in equilibrium, all voters will mobilize if V > V (1, s). If all other vot-
ers are mobilizing it is optimal for the i′th voter to mobilize too in order to benefit from participating
61

in a successful uprising; if the other voters are not mobilizing (which happens when V ≤ V (1, s)),
then there is no benefit to protesting. Hence for voter i a best response is ai = 1 if V > V (1, s)
and 0 otherwise. Finally both interim and posterior beliefs follow Bayes’ rule.
Democratic Discrimination and Transparency
Lemma 4. s and s˜ are well-defined
Proof. Φ( y(s)−gσy
) = 12
and y(s) = g2(σ2y
σ2s
+ 1)− sσ2y
σ2s
from Lemma 3. Substituting and solving yieldsg2(1 + σ2
s
σ2y) = s. Similarly, Φ(
y(s˜)−gσy) = 1
2. Substituting and solving yields g
2(1− σ2
s
σ2y) = s˜.
Proof of Proposition 5. Electoral discrimination = Φ( sσs
) − Φ(s˜−gσs ). ∂
∂σs[Φ( s
σs) − Φ(
s˜−gσs )] =
φ( sσs
) ∂∂σs
[ sσs
] − φ(s˜−gσs ) ∂
∂σs[s˜−gσs ]. Now the first term φ( s
σs) ∂∂σs
[ sσs
] = φ( sσs
)g2( 1σ2y− 1
σ2s) < 0 since
σs < σy. The second term φ(s˜−gσs ) ∂
∂σs[s˜−gσs ] = φ(
s˜−gσs )g2( 1σ2s− 1
σ2y) > 0 again since σs < σy. Hence
∂∂σs
[Φ( sσs
)− Φ(s˜−gσs )] < 0.
Proof of Proposition 6. Mass unrest takes place in equilibrium if and only if an incumbent of type
θ = 0 survives the electoral stage of the game. From the proof of Proposition 5, this probability
is 1 − Φ( sσs
). Then ∂∂σs
[1− Φ( s
σs)]
= −φ( sσs
)[ ∂∂s
sσs
]. From the proof of Proposition 5 above,
∂∂s
sσs< 0. Since φ is the pdf of the standard normal (and hence positive), ∂
∂σs
[1− Φ( s
σs)]> 0.
The probability of unrest under democracy is falling in transparency.
62

Tabl
e5:
Tran
spar
ency
and
the
Haz
ard
ofD
emoc
ratic
Col
laps
e
Con
d.P
rior
Tran
sitio
nC
ond.
Num
.Tra
nsiti
ons
No
Pri
orTr
ansi
tion
Tran
spar
ency
-0.4
91**
-0.5
28**
*-0
.413
*-0
.478
***
-1.1
62**
*-1
.135
***
[-0.9
39,-0
.042
][-0
.848
,-0.2
09]
[-0.8
30,0
.003
][-0
.773
,-0.1
82]
[-1.9
53,-0
.371
][-1
.838
,-0.4
31]
Gro
wth
-0.1
58**
*-0
.130
***
-0.1
62**
*-0
.135
***
-0.0
82-0
.077
*[-0
.234
,-0.0
82]
[-0.1
91,-0
.069
][-0
.237
,-0.0
87]
[-0.1
96,-0
.074
][-0
.183
,0.0
19]
[-0.1
67,0
.014
]Tr
ansp
aren
cy0.
023
0.02
70.
045*
**0.
040*
*0.
127*
*0.
131*
*×
Gro
wth
[-0.0
36,0
.081
][-0
.045
,0.0
98]
[0.0
11,0
.078
][0
.002
,0.0
79]
[0.0
20,0
.234
][0
.023
,0.2
38]
GD
Ppe
rcap
ita-2
.062
*-1
.558
-0.9
62[-4
.291
,0.1
68]
[-3.9
59,0
.844
][-7
.763
,5.8
38]
Ec.
Ope
nnes
s-0
.001
-0.0
04-0
.022
[-0.0
21,0
.019
][-0
.025
,0.0
16]
[-0.0
76,0
.032
]P
arlia
men
tary
2.11
2***
1.97
0***
0.95
5[0
.841
,3.3
83]
[0.8
54,3
.086
][-0
.194
,2.1
04]
Mix
edS
yste
m0.
690
0.62
60.
115
[-0.5
86,1
.967
][-0
.699
,1.9
51]
[-1.3
69,1
.598
]#
ofS
ubje
cts
8888
8888
5353
#of
Failu
res
1919
1919
88
Cox
prop
ortio
nalh
azar
dsre
gres
sion
sof
the
haza
rdof
dem
ocra
ticco
llaps
e.Th
em
odel
sde
pict
edin
the
first
two
colu
mns
,th
em
iddl
etw
oco
lum
ns,
and
the
last
two
colu
mns
diffe
rin
the
man
ner
inw
hich
they
deal
with
coun
trie
sth
atex
perie
nce
mul
tiple
auto
crat
icsp
ells
.Tho
sein
the
first
two
colu
mns
repo
rta
con-
ditio
nalg
aptim
em
odel
whe
rein
the
base
line
haza
rdis
sepa
rate
lyes
timat
edfo
rreg
imes
that
expe
rienc
ea
prio
rtra
nsiti
onan
dfo
rth
ose
that
did
not.
Thos
ein
the
next
two
colu
mns
estim
ate
sepa
rate
base
line
haza
rds
base
don
the
num
bero
fprio
rtra
nsiti
ons.
Thos
ein
the
final
two
colu
mns
exam
ine
only
auto
crat
icsp
ells
that
did
note
xper
ienc
ea
prio
rtra
nsiti
on.
Inal
lmod
els,∗
deno
tes
sign
ifica
nce
atth
e10
perc
ent
leve
l,∗∗
deno
tes
sign
ifica
nce
atth
e5
perc
entl
evel
,and∗∗∗
deno
tes
sign
ifica
nce
atth
e1
perc
entl
evel
.95
perc
ent
confi
denc
ein
terv
als
are
pres
ente
din
brac
kets
.A
llst
anda
rder
rors
have
been
clus
tere
dby
dem
ocra
ticsp
ell.
63