Embed Size (px)
Citation preview

Earth Surface Processes and LandformsEarth Surf. Process. Landforms 26, 1087–1102 (2001)DOI: 10.1002/esp.256
TRANSPORT AND DISPERSAL OF ORGANIC DEBRIS (PEAT BLOCKS)IN UPLAND FLUVIAL SYSTEMS
MARTIN EVANS1 AND JEFF WARBURTON2*1 Department of Geography, University of Manchester, Oxford Road, Manchester, M13 9PL, UK
2 Department of Geography, University of Durham, Science Laboratories, South Road, Durham, DH1 3LE, UK
Received 24 July 2000; Revised 9 March 2001; Accepted 6 April 2001
ABSTRACT
This paper assesses the mechanisms and pathways by which peat blocks are eroded and transported in upland fluvialsystems. Observations and experiments from the north Pennines (UK) have been carried out on two contrasting riversystems. Mapping of peat block distributions and appraisal of reach-based sediment budgets clearly demonstrates thatmacro-size peat is an important stream load component. In small streams block sizes can approximate the channelwidth and much of the peat is transported overbank. Local ‘peat jams’ and associated mineral deposition may providean important component of channel storage. In larger systems peat blocks rapidly move down-channel and undergofrequent exchanges between bed and bank storage. Results of peat block tracing using painted blocks indicate that oncesubmerged, blocks of all sizes are easily transported and blocks break down rapidly by abrasion. Vegetation and bars playan important role in trapping mobile peat. In smaller streams large block transport is limited by channel jams. Smallerblocks are transported overbank but exhibit little evidence of downstream fining. In larger rivers peat blocks are moreactively sorted and show downstream reduction in size from source. A simple model relating peat block diameter (Dp)to average flow depth (d) suggests three limiting transport conditions: flotation (Dp < d), rolling (d < Dp > d/2) anddeposition (Dp > d/2). Experiments demonstrate that peat block transport occurs largely by rolling and floating and thetransport mechanism is probably controlled by relative flow depth (d/Dp ratio). Transport velocity varies with transportmechanism (rolling is the slowest mode) and transport lengths increase as flow depth increases. Abrasion rates vary withthe transport mechanism. Rolling produces greater abrasion rates and more rounded blocks. Abrasion rates vary from 0to 10 g m�1 for blocks ranging in mass from 10 to 6000 g. Copyright 2001 John Wiley & Sons, Ltd.
KEY WORDS: peat; sediment transport; deposition; flotation; abrasion
INTRODUCTION
Peatlands cover a significant proportion of many northern hemisphere countries. In the UK blanket peatcovers almost 8 per cent of the total land surface and is probably the single largest landcover type in theupland regions. Peatlands are susceptible to erosion (DoE, 1995) which has increased in intensity over thelast 200 years (Tallis, 1985, 1998). The breakdown and dispersal of peat in stream systems is a fundamentalgeomorphological process; it is vital to understanding nutrient cycling in upland rivers, and important indelivering sediment to upland reservoirs (Francis, 1990; Labadz et al. 1991; Tallis et al., 1997).
Compared to other ecosystems, peatlands are a major carbon pool (Gorham, 1991; Malmer, 1992). Peaterosion is significant in supplying particulate organic carbon and dissolved organic carbon to the geochemicalcarbon flux of upland rivers (Crisp and Robson, 1979; Meybeck and Vorosmarty, 1999). Climate changescenarios predicting increases in winter precipitation and increased seasonality could lead to increased erosionand destabilization of blanket peat (Heathwaite, 1993; Evans et al., 1999). Coupling of increased peat erosionto upland stream channels by lateral unstable flood channels and bank erosion (Figure 1), gully development
* Correspondence to: J. Warburton, Department of Geography, University of Durham, Science Laboratories, South Road, Durham, DH13LE, UK. E-mail: [email protected]/grant sponsor: University of Durham.Contract/grant sponsor: University of Manchester.Contract/grant sponsor: Royal Society.
Copyright 2001 John Wiley & Sons, Ltd.

1088 M. EVANS AND J. WARBURTON
Figure 1. Photograph showing the main source of peat blocks in the Trout Beck study reach. Erosion of the left riverbank has produceda series of peat blocks which have been transported downstream (Figure 5)
and mass movements (peat slides) will result in increased delivery of large organic matter to stream channels.Understanding of these erosion processes is vital to attempts to predict and mitigate these impacts.
Flow characteristics and the availability of sediment govern sediment transport in upland streams (Diet-rich and Dunne, 1978, 1993). Generally speaking large particles move as bedload and smaller particles aretransported as suspended or washload. Techniques for monitoring these different transport modes have beenrefined over time such that we now possess a useful array of methods, e.g. continuously monitoring bedloadtraps, sophisticated automatic liquid samplers and turbidity meters. These methods have allowed us to gainuseful measurements of sediment transfer in a range of fluvial environments (Reid and Dunne, 1996). Suchtechniques have been applied to fluvial systems where peat forms an important part of the streamload (e.g.Crisp, 1966; Labadz et al., 1991).
Attempts to measure erosion of upland blanket peat catchments have been relatively few. Crisp (1966) madeone of the earliest attempts to measure the organic outputs from the small Rough Sike catchment at MoorHouse in the north Pennines. Crisp estimated the annual load to be approximately 100 t km�2 a�1 identifyingbank erosion as a major source of this material. Labadz et al. (1991) in a two-year study in the southernPennines of the heavily eroded Wessen Head Moor catchment recorded values of 50 t km�2 a�1 for a channeldraining exclusively from peat. Reservoirs have also been used to estimate the erosion from several smallpeatland catchments (McManus and Duck, 1985; Labadz et al., 1991, 1995). This has produced yields of 4 to205 t km�2 a�1. However, comparison with other upland catchments in the UK, where yields are typically ofthe order of 101 to 102 t km�2 a�1, is difficult because of the low density of peat in comparison to mineral sed-iments. Volumetric peat yields can be an order of magnitude greater than equivalent mineral weight yields. Thetechniques used to obtain these estimates of suspended sediment yield have not always been able to adequatelymonitor the transport of macro-scale organic matter, peat blocks and soil turf. This is surprising because theprocesses delivering such material to upland stream channels are widespread (Figure 1) and the breakdownand dispersal of peat in stream systems is not only an important geomorphological process but is vital tounderstanding nutrient cycling in upland gravel-bed rivers (Crisp and Robson, 1979; Mulholland and Kuenzler,1979). Ignoring the macro-scale peat component can potentially result in an underestimation of the transfer oforganic sediment from upland catchments. Observation during floods reveals that substantial volumes of coarseorganic matter are transported at or near the surface of the flow (Wilson et al., 1996). The fact that so littlelarge-scale organic material is found in sediment traps strongly suggests that most of this bypasses such traps.
Copyright 2001 John Wiley & Sons, Ltd. Earth Surf. Process. Landforms 26, 1087–1102 (2001)

TRANSPORT OF PEAT BLOCKS IN FLUVIAL SYSTEMS 1089
The aim of this project is to assess the mechanisms and pathways by which peat is eroded and transportedin upland fluvial systems. The specific objectives are to:
1. describe, using a series of simple field experiments, how peat is entrained and transported;2. define the sources and characteristics of peat blocks;3. determine sites of temporary and final deposition;4. measure weight loss of transported blocks to estimate channel abrasion rates.
These objectives are allied to a long-term aim which is to measure the sediment yield from eroding peatareas more accurately. This study also has some similarities with studies of other low density streamloadcomponents such as large woody debris and ice blocks (Shields and Gippel, 1995; Koutaniemi, 1984).
STUDY AREA
In order to address the aims identified above, measurement and monitoring of peat block transport hasbeen undertaken on the Moor House National Nature Reserve, in upper Teesdale, UK. Work has focusedon the Trout Beck catchment (Figure 2). This 11Ð4 km2 catchment lies almost entirely within the naturereserve. Trout Beck is a tributary of the River Tees. Discharge from Trout Beck is monitored as part ofthe Environmental Change Network (Sykes and Lane, 1996) at a compound crump weir maintained by
Figure 2. Location of Moor House National Nature Reserve and detail of the study catchments and experimental river reaches
Copyright 2001 John Wiley & Sons, Ltd. Earth Surf. Process. Landforms 26, 1087–1102 (2001)

1090 M. EVANS AND J. WARBURTON
the Environment Agency. Discharge from Rough Sike, a tributary of Trout Beck (catchment area 83 ha)has been monitored at a rectangular weir installed in the 1960s (Crisp, 1966), and recently refurbished andreinstrumented in 1997. The bedrock geology of the catchments is part of the Carboniferous series composed ofinterbedded sandstone, shale and limestone. The surficial geology consists of periglacial deposits of reworkedtill and overbank deposits which are overlain by blanket peat varying in depth from 1 to 3 m. The clay-richnature of the periglacial sediments allows development of the blanket peat even on the areas of limestonebedrock. Approximately 17 per cent of the blanket peat cover is eroded (Garnett and Adamson, 1997), withdendritic Bower type I gullying dominating on lower angled slopes and linear type II gullying on the steeperslopes (Bower, 1961).
Detailed study of the role of peat blocks in the sediment system has been undertaken at two locations inthe catchment. These are a 100 m reach of Trout Beck upstream from the weir and a 250 m reach on lowerRough Sike (Figure 2). The upstream boundary of the Trout Beck reach is the apex of a meander bend wherethe river is actively undercutting the bank which comprises gravels and overbank fines overlain by thick peatdeposits. Erosion of the gravels and fines produces cantilever failures which input large quantities of peatinto the stream (Figure 1). Similarly, peat block input to Rough Sike is from large undercut peat banks onthe outside of meander bends.
METHODS
Mapping of peat block deposition
In order to characterize patterns of peat block dispersal at the two study sites, block locations were mapped.Channel width in Rough Sike is generally less than 1 m so large peat blocks, b axis 50–100 cm, are movedonly short distances before jamming in narrow sections of the stream. These jams become relatively permanentfeatures leading to a step–pool type long profile. Consequently, the major flux of peat blocks on Rough Sikeis of smaller blocks, which are deposited overbank at high flow. On Rough Sike the study reach was mappedon 27 July 1998. Size and location of blocks deposited overbank on the floodplain were recorded. During theprevious week, five distinct storm hydrograph peaks were recognized. The first of these reached a maximumstage of 46 cm whilst subsequent storm peaks were less than 25 cm. Observation during storm events suggeststhat significant overbank flow in the study reach occurs only at stages above 25 cm. Only freshly depositedpeat blocks were mapped so that the resulting distribution is assumed to be an approximation of depositionassociated with the large storm (20 July 1998). Older blocks are clearly distinguishable as they are lighter incolour and show clear evidence of surface weathering. In total 1022 blocks were measured.
On the Trout Beck reach, large peat blocks litter the channel and bars downstream of the eroding peatsection (Figure 1). Location and size of these blocks were mapped initially on 27 July 1998, again on 26September 1998 and at approximately monthly intervals thereafter including 2 February 1999. During thetwo-month period between the first two survey dates there were nine flood event exceeding 5 m3 s�1; twoof these exceeded 10 m3 s�1, the largest being a storm on 10 September 1998 which had a peak dischargeof 21 m3 s�1. Weekly observations during this period demonstrated that virtually all peat block movementoccurred during the largest event. A total of 74 blocks was mapped. All blocks were marked with smallnumbered wooden pegs so that they could be identified in subsequent surveys. New blocks had pegs addedto them as they were found. In this way the exchange of blocks in the reach could be determined. Blockswith axes less than 10 cm were rare and therefore not measured.
Field experiments
Experiments to determine transport mechanisms and abrasion rates of peat blocks were carried out oncubes of moderately well humified Eriophorum–calluna–sphagnum peat cut on the Moor House reserve.Under saturated conditions peat consists of approximately 95 per cent water and 5 per cent solids (the solidscomprising partly decomposed vegetation) (Clymo, 1983). The peat blocks used in the experiments weredeliberately cut from local sources adjacent to the channel where the physical properties of the material arewell known. Three sets of experiments were undertaken. In an initial experiment, peat blocks varying in sizebetween 90 and 180 mm, were spray painted with fluorescent paint and placed in a grid of 48 blocks on the
Copyright 2001 John Wiley & Sons, Ltd. Earth Surf. Process. Landforms 26, 1087–1102 (2001)
TRANSPORT OF PEAT BLOCKS IN FLUVIAL SYSTEMS 1091
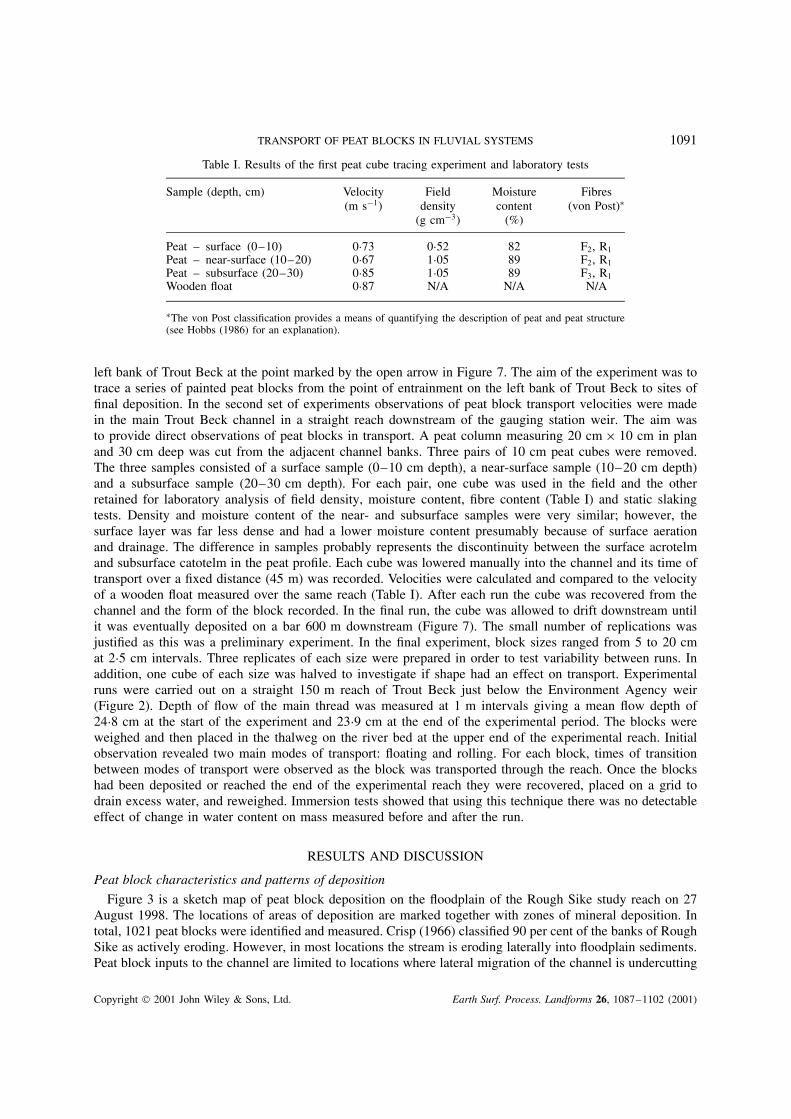
Table I. Results of the first peat cube tracing experiment and laboratory tests
Sample (depth, cm) Velocity Field Moisture Fibres(m s�1) density content (von Post)Ł
(g cm�3) (%)
Peat – surface (0–10) 0Ð73 0Ð52 82 F2, R1Peat – near-surface (10–20) 0Ð67 1Ð05 89 F2, R1Peat – subsurface (20–30) 0Ð85 1Ð05 89 F3, R1Wooden float 0Ð87 N/A N/A N/A
ŁThe von Post classification provides a means of quantifying the description of peat and peat structure(see Hobbs (1986) for an explanation).
left bank of Trout Beck at the point marked by the open arrow in Figure 7. The aim of the experiment was totrace a series of painted peat blocks from the point of entrainment on the left bank of Trout Beck to sites offinal deposition. In the second set of experiments observations of peat block transport velocities were madein the main Trout Beck channel in a straight reach downstream of the gauging station weir. The aim wasto provide direct observations of peat blocks in transport. A peat column measuring 20 cm ð 10 cm in planand 30 cm deep was cut from the adjacent channel banks. Three pairs of 10 cm peat cubes were removed.The three samples consisted of a surface sample (0–10 cm depth), a near-surface sample (10–20 cm depth)and a subsurface sample (20–30 cm depth). For each pair, one cube was used in the field and the otherretained for laboratory analysis of field density, moisture content, fibre content (Table I) and static slakingtests. Density and moisture content of the near- and subsurface samples were very similar; however, thesurface layer was far less dense and had a lower moisture content presumably because of surface aerationand drainage. The difference in samples probably represents the discontinuity between the surface acrotelmand subsurface catotelm in the peat profile. Each cube was lowered manually into the channel and its time oftransport over a fixed distance (45 m) was recorded. Velocities were calculated and compared to the velocityof a wooden float measured over the same reach (Table I). After each run the cube was recovered from thechannel and the form of the block recorded. In the final run, the cube was allowed to drift downstream untilit was eventually deposited on a bar 600 m downstream (Figure 7). The small number of replications wasjustified as this was a preliminary experiment. In the final experiment, block sizes ranged from 5 to 20 cmat 2Ð5 cm intervals. Three replicates of each size were prepared in order to test variability between runs. Inaddition, one cube of each size was halved to investigate if shape had an effect on transport. Experimentalruns were carried out on a straight 150 m reach of Trout Beck just below the Environment Agency weir(Figure 2). Depth of flow of the main thread was measured at 1 m intervals giving a mean flow depth of24Ð8 cm at the start of the experiment and 23Ð9 cm at the end of the experimental period. The blocks wereweighed and then placed in the thalweg on the river bed at the upper end of the experimental reach. Initialobservation revealed two main modes of transport: floating and rolling. For each block, times of transitionbetween modes of transport were observed as the block was transported through the reach. Once the blockshad been deposited or reached the end of the experimental reach they were recovered, placed on a grid todrain excess water, and reweighed. Immersion tests showed that using this technique there was no detectableeffect of change in water content on mass measured before and after the run.
RESULTS AND DISCUSSION
Peat block characteristics and patterns of deposition
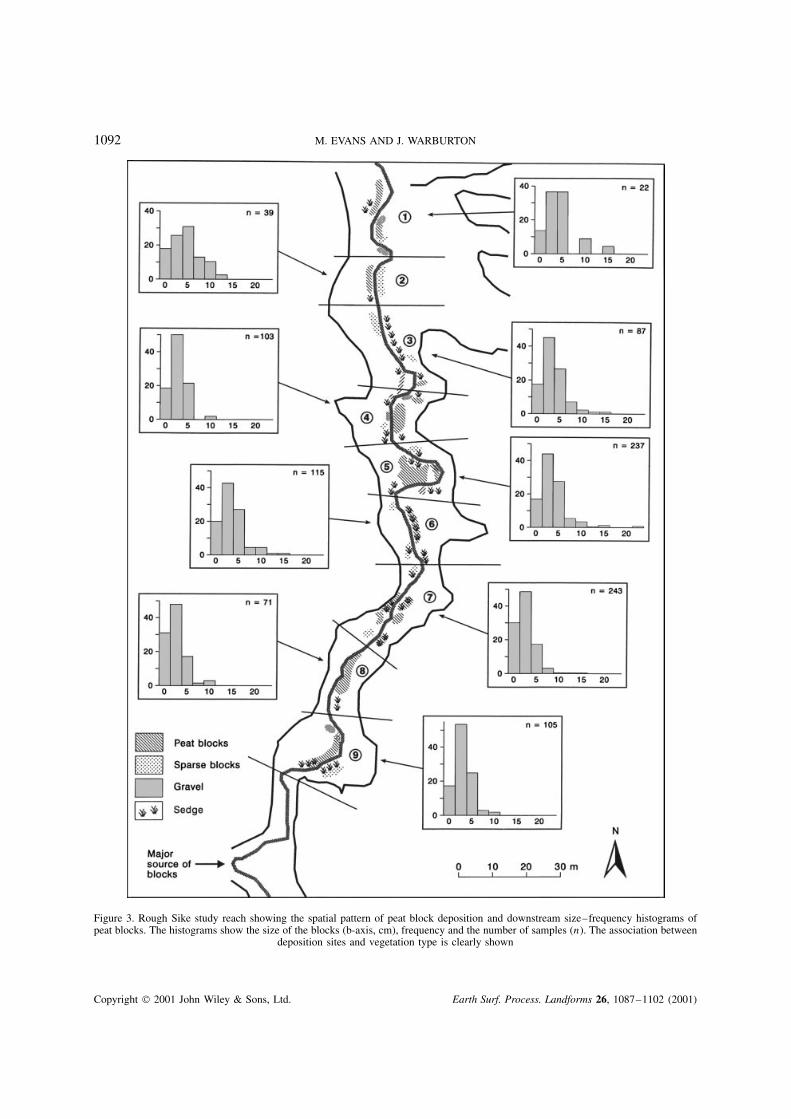
Figure 3 is a sketch map of peat block deposition on the floodplain of the Rough Sike study reach on 27August 1998. The locations of areas of deposition are marked together with zones of mineral deposition. Intotal, 1021 peat blocks were identified and measured. Crisp (1966) classified 90 per cent of the banks of RoughSike as actively eroding. However, in most locations the stream is eroding laterally into floodplain sediments.Peat block inputs to the channel are limited to locations where lateral migration of the channel is undercutting
Copyright 2001 John Wiley & Sons, Ltd. Earth Surf. Process. Landforms 26, 1087–1102 (2001)
1092 M. EVANS AND J. WARBURTON
Figure 3. Rough Sike study reach showing the spatial pattern of peat block deposition and downstream size–frequency histograms ofpeat blocks. The histograms show the size of the blocks (b-axis, cm), frequency and the number of samples (n). The association between
deposition sites and vegetation type is clearly shown
Copyright 2001 John Wiley & Sons, Ltd. Earth Surf. Process. Landforms 26, 1087–1102 (2001)

TRANSPORT OF PEAT BLOCKS IN FLUVIAL SYSTEMS 1093
the blanket peat at the edge of the floodplain. The channel banks of Rough Sike are strongly undercut inmany places and cantilever-type bank failures (Thorne and Tovey, 1981) are common. Large bank failureblocks are observed directly below failure scars on the channel floor, but are mobilized at the highest flows.Large peat blocks are occasionally found in the weir pool at the lower end of the system. ‘Drawdown’ bankfailures (Frydman and Beasley, 1976) are characteristic of channels with flashy hydrograph forms (Lawler,1992). One major sediment source at the head of the study reach is marked with an arrow on Figure 3. Atthis location, monitoring over a four-month period (17 November 1998 to 15 March 1999) yielded a totalinput of 17 m3 of peat. The location of patches of tall sedge, which are interspersed with the shorter grassesand mosses of the floodplain, are shown in Figure 3. Peat block deposition on the floodplain appears to beassociated with local topographic controls and sedge patches. Blocks are trapped in sedge areas or depositedin the lee of sedge clusters. This suggests that deposition of the blocks is associated with flow diversion andlocal velocity reduction (Newall and Hughes, 1995) Figure 3 also shows the size distribution of floodplainpeat blocks for ten sections of the study reach. There is no obvious downstream pattern of block size. The peatblocks on Rough Sike tend to be smaller fragments transported via floating and deposited overbank. Largerblocks, similar in size to those on Trout Beck, are transported in-channel only short distances. Typically theyform jams in narrow channel sections. These were not measured. The distribution of b-axis lengths for allmeasured blocks is positively skewed, reflecting the dominance of smaller block sizes. The modal block sizeclass is 2Ð5–5 cm and the measured blocks range from 1 to 32 cm b-axis length. Shape indices calculated forthe peat fragments also show little variation downstream. Figure 4 shows the distributions of block shapes forRough Sike and Trout Beck. Given the stratified (layered) nature of the peat deposits it might be expected thatblocks would tend to split along layers of weakness producing mainly platy clasts. However, there appearsto be no preferred shape for either the small Rough Sike blocks (0Ð01–0Ð32 m) or the Trout Beck blocks(0Ð1–2Ð5 m). This is somewhat surprising and might suggest that abrasion of blocks in motion (tending toproduce more spherical or rod-shaped blocks) is as important as splitting in determining block erosion.
The Trout Beck fluvial system is best characterized as a wandering gravel-bed channel. It is an order ofmagnitude larger than Rough Sike in virtually all respects, including channel width, catchment area, floodplainwidth and discharge. The peat blocks which were transported and dispersed along the river corridor are alsomuch larger. Figure 5 shows the distribution of peat blocks mapped on 28 July 1998 (open circles) and 26September 1998 (closed circles). A clear pattern is obvious. Firstly, most of the peat blocks are derived from a
Figure 4. Peat block shape classification for the small peat blocks on Rough Sike (�) and the much larger blocks on Trout Beck (ž).Terms a, b and c refer to the large, intermediate and small axes, respectively, of the peat blocks. Many different shapes are present at
both sites
Copyright 2001 John Wiley & Sons, Ltd. Earth Surf. Process. Landforms 26, 1087–1102 (2001)

1094 M. EVANS AND J. WARBURTON
Figure 5. Trout Beck study reach showing the size distribution of peat blocks on 28 July (open symbols) and 26 September (closedsymbols) 1998
single point source where the channel undercuts a peat deposit on the left margin of the floodplain (Figures 1and 5). Large blocks are concentrated at this point and are then dispersed downstream, being deposited onbars or shallow riffles. The blocks show a distinct downstream fining and clustering (Figure 6). Blocks areclustered on bars and show general decrease in size and frequency downstream. This presumably reflects activeabrasion and erosion of blocks in transit. Furthermore rapid downstream reduction in block size increases thelikelihood of continued transport as the dimensions of the blocks decrease and the roundness increases.
The reach shown in Figure 5 is typical of many upland river reaches in as much as peat blocks can usuallybe traced to discrete eroding river banks. An assessment of the dynamics of these blocks can be made byobserving their distribution before and after a major flood event. A flood on 10 September 1998 had apeak discharge of 21 m3 s�1 and was responsible for erosion of the peat source and major reorganization ofthe in-channel peat blocks (Figure 5). Weekly observations confirm that virtually all peat block movementsrelate to this one event. Many of the pre-existing peat blocks are still present on the floodplain and in thechannel. Major new accumulations of blocks occur just downstream of the cutbank source, on the first barheaddownstream and at the major in-channel riffle sites. Two isolated blocks occur upstream of the main source.One is derived from a local bank collapse and the other is of a relatively small size. This confirms theassumption, based on reconnaissance, that there are no other major inputs of peat material from upstream intothe reach. This observation enables a volumetric peat block sediment budget to be estimated for the reachshown in Figure 5. Results indicate that on 28 July 1998 the total volume of stored peat blocks was 38Ð3 m3;by 26 September 1998 peat block storage had increased to 40Ð5 m3 consisting of 31Ð1 m3(77 per cent) oldblocks and 9Ð4 (23 per cent) new material. It is estimated that the loss of material from the main cutbankwas approximately 8Ð5 m3. Therefore the coarse peat block flux within the reach can largely be explained bydownstream loss of in-channel blocks and supply from local streambank collapse. Wash of fine peat was notdirectly quantified but suspended sediment sampling downstream demonstrates this flux is very low.
Copyright 2001 John Wiley & Sons, Ltd. Earth Surf. Process. Landforms 26, 1087–1102 (2001)

TRANSPORT OF PEAT BLOCKS IN FLUVIAL SYSTEMS 1095
Figure 6. Downstream fining of peat blocks in the Trout Beck study reach. Observation on 2 February 1999 showed the blocks areclustered at sites of deposition on the main gravel bars
Figure 7. Distribution of marked peat fragments on Trout Beck and the River Tees. Observations were made two weeks after deploymentof painted peat cubes at the position marked by the open arrow
Initial experiments–tracing of marked peat blocks
Figure 7 shows the results of the preliminary peat block tracing experiment. After a two-week period, 22of the 48 blocks had moved from the bank, up to a level corresponding roughly with the trash lines of thehighest flow (4 m3 s�1, 11 November 1997). This is consistent with the measured bulk density of saturatedpeat, which is close to 1 g cm�3, implying that the critical depth for block entrainment is low. A search ofthe channel at low flow found fragments of marked peat along the channel banks and bars. Figure 7 showsthe dispersal of the marked peat fragments after transport. No intact blocks were found but small (millimetresized) coloured peat fragments eroded from the surface of the blocks were deposited along the channel marginand on downstream bars. In the main Trout Beck channel, fragments are confined to the left bank margin.After the confluence with the River Tees, marked peat was found on the right bank channel margin and on bothsides of a downstream bar. The maximum observed transport distance was just over 600 m and the amount ofsurface fragments recovered suggests active abrasion of the tracer blocks. The distribution of blocks along theleft margin of the channel, where the blocks originated, is consistent with transport by rolling, probably in a
Copyright 2001 John Wiley & Sons, Ltd. Earth Surf. Process. Landforms 26, 1087–1102 (2001)

1096 M. EVANS AND J. WARBURTON
shallow depth of water. On entering the confluence with the River Tees water depth increases and the blocksprobably became suspended and were swept across to the right bank. Further downstream as the channelwidens and water depth decreases, especially around the bar, blocks revert to rolling. The observed patternof peat fragments is consistent with the breakdown of blocks by rolling and abrasion. Elongate blocks up to15 cm intermediate axis were found on the bar together with marked peat fragments. These may representthe core remains of the original tracer blocks.
Although the above results raised some important hypotheses regarding the mechanisms of peat blocktransport, a limitation of the approach was that transport was not observed directly. Therefore a secondexperiment, using three types of 10 cm peat cubes, was undertaken to provide direct observations of peatblocks in transport. Results show the velocities of the peat cubes are similar and are only slightly less thanthe velocity of a surface float (Table I). Small differences arise due to the length of time in contact with thebed. The surface cube on entering the stream channel was seen to visibly expand as it became saturated. Thecube was transported with its upper face flush with the water surface, although it appeared to sink slowlydeeper into the water column as time elapsed. After colliding with a large rock at the end of the run, theblock split into two. On retrieval from the flow the surface of the block appeared more fibrous (due to loss offines from the matrix) and had limited corner rounding. The near-surface cube was transported in the samemanner as the surface cube but did not appear to expand or sink in the water column. In shallow sections ofthe channel the cube tended to roll and on impact with large boulders it expelled trapped air bubbles. Thesurface of the cube appeared more fibrous and limited corner rounding had occurred. The subsurface blockbehaved in the same manner as the near-surface cube but following the timed section was allowed to traveluntil it eventually became deposited. This allowed the effects of prolonged contact with the flow and bed tobe evaluated in more detail. The cube was transported over 600 m and was deposited on the downstream barshown in Figure 7. The form of the cube was rough and fibrous and the corners and edges showed clear signsof rounding. Despite these modifications the clast retained much of its original shape and had lost little of itsinitial mass. This suggests that under suitable flow conditions peat blocks may be transported considerabledistances in stream channels without appreciable breakdown. There is scope for further experiments to testthe consistency of these findings and the behaviour of different peat types.
These observations allow a conceptual model of peat block transport to be proposed (Figure 8). This simplemodel shows the four principal phases of peat block transport in coarse bed fluvial systems and proposescritical flow depths at which these occur. Where flow depth exceeds the diameter of the peat block, flotationoccurs. The main changes affecting the block during this phase are swelling and slaking (breakdown of theblock structure). Once the flow depth is less than the diameter of the block the peat comes into contact withthe bed and begins to roll or slide, often only partially submerged in the flow. Rolling will continue as longas the depth is sufficient to transport the block. During this phase abrasion and splitting occur. When the flowreaches a depth of approximately half the diameter of the block, the block begins to ‘stall’ and will eventuallybecome lodged or deposited. Blocks in this phase may remain immobile for long periods and will be subjectto surface weathering. This relationship would differ with the roundness and density of the peat blocks andthe roughness of the bed relative to the size of the blocks.
Figure 8. Hypothetical model of phases of peat block transport in gravel-bed channels
Copyright 2001 John Wiley & Sons, Ltd. Earth Surf. Process. Landforms 26, 1087–1102 (2001)

TRANSPORT OF PEAT BLOCKS IN FLUVIAL SYSTEMS 1097
Peat block tracking and abrasion experiments
Data from the experimental insertion of blocks into the flow allow some testing of the conceptual modeloutlined above. Figure 9A records the distances blocks were transported before being deposited. Blocks werenot allowed to travel beyond the study reach so that distances recorded as 150 m are truncated. The datasuggest that transport lengths for blocks are related to block size. Transport length appears to increase linearlywith decreasing block size. This is consistent with the hypothesis developed from the preliminary work that theratio of flow depth (d) to block size (Dp) is the dominant control on the deposition of blocks. Figure 9B plotsthis ratio directly against transport distance. The linear regression line fitted through the points extrapolatesto zero distance at a d/Dp value of 1Ð15, being considerably higher than the value of 0Ð5 hypothesized as thecritical value for movement. However, this is not a good estimate of the initial entrainment condition becausemean flow depth is used in the calculation of d/Dp. This value will be considerably less if local specificdepths are used.
The observed pattern of transport for blocks of varying size is illustrated in Figure 10A and B. For theequiaxial blocks there is a transition from predominantly rolling behaviour to predominantly floating at ablock size of 14 cm which is a mean flow depth to block size ratio of 1Ð75. One-hundred per cent rolling isexhibited at a ratio of 1Ð4 and 100 per cent floating at a ratio of 4Ð9. For the range of half block sizes run,the transition from predominantly rolling to predominantly floating is not apparent in the range of sizes run.It should, however, be noted that the half blocks show a much greater propensity to roll than cubes with axesequivalent to the short axis of the half block. Half blocks with a 7Ð5 cm Dp axis rolled for 30 per cent of thetime whereas 7Ð5 cm cubes rolled only 8 per cent of the time.
Figure 9. Relationships between peat block size and transport distance determined from experimental observation in Trout Beck.(A) Relationship between block size and transport distance. (B) Relationship between relative block size (flow depth/block size) and
transport distance
Copyright 2001 John Wiley & Sons, Ltd. Earth Surf. Process. Landforms 26, 1087–1102 (2001)

1098 M. EVANS AND J. WARBURTON
Figure 10. Relationship between transport mechanism and block size for the experiments at Trout Beck. The graphs show the percentagesof time blocks were rolling, floating or stopped. (A) Cubes; (B) half cubes
Table II. Relationship between effective flow depth, expressed as a per-centile of the spatial variation in flow depth, and the dominant transportmodes identified in the field experiments. The values in the table areratios of flow depth/block size for the observed transitions between
transport modes
Flow depth Transport by Transport by Transport bypercentile 100% floating 100% rolling 50% rolling/
50% floating
10 3Ð6 1Ð0 1Ð320 4Ð0 1Ð1 1Ð430 4Ð3 1Ð2 1Ð540 4Ð6 1Ð3 1Ð650 4Ð8 1Ð4 1Ð760 5Ð2 1Ð5 1Ð970 5Ð5 1Ð6 2Ð080 6Ð0 1Ð7 2Ð190 6Ð4 1Ð8 2Ð3
100 9Ð4 2Ð7 3Ð4
Measured critical values of d/Dp for the initiation of movement and for the transition from floating torolling are significantly different from those envisaged in our hypothetical model. One possible reason forthis is our use of mean depth values. It is likely that block movement is affected by bed roughness, and inparticular by protruding elements of the bed. Table II shows critical values of d/Dp for initiation of movementand for the transition between floating and rolling calculated using the percentiles of the cumulative depthdistribution as an estimate of different effective depths. Table II demonstrates that even using the tenthpercentile of spatial variation in flow depth (the shallowest depth) critical values are still well in excess of
Copyright 2001 John Wiley & Sons, Ltd. Earth Surf. Process. Landforms 26, 1087–1102 (2001)

TRANSPORT OF PEAT BLOCKS IN FLUVIAL SYSTEMS 1099
those hypothesized and indicate that the true critical value for initiation of motion is likely to be close to1. This suggests that flotation dominates over pivot and lift forces in the initiation of movement (given adensity of 1 for peat). Further work in controlled flume conditions will be required to further assess thesepossibilities.
The average virtual velocities associated with block transport are presented in Figure 11 as a proportion ofthe mean free stream velocity over the reach as measured by a wooden float. The plot shows a rapid decreasein velocity as d/Dp approaches 1Ð5. Decreased virtual velocities at lower d/Dp values are interpreted asindicative of a lower characteristic transport velocity of rolling blocks since this transport mechanism wasdominant when d/Dp was less than 1Ð75.
Figure 12 shows measured rates of abrasion per metre of block transport normalized by block surfacearea. The data suggest a logarithmic increase in specific abrasion rate as block size increases linearly. Theexplanation for this phenomenon is that abrasion rates vary significantly with transport mechanism which isalso a function of d/Dp (block size as river stage was effectively constant during the experiment). Rates ofbreakdown for blocks that moved predominantly by floating are low. This is consistent with the field mapping(Figures 5 and 6) where significant downstream fining is observed in Trout Beck, where larger blocks areliable to move by rolling and hence abrade, whereas in Rough Sike smaller blocks moving overbank byflotation exhibit no marked downstream differences (Figure 3).
Breakdown and weathering of blocks
Many peat blocks in upland channel systems lie on the margins of channels or exposed on bars for longperiods. These include large slumped blocks from bank collapse, and smaller eroded blocks. Natural weath-ering cycles such as wetting and drying, freeze–thaw, and rainfall events progressively break down the peat.
Figure 11. Relative peat block velocity (mean velocity/free velocity) and relative depth (flow depth/block size)
Figure 12. Scattergraph of the relation between peat block size and log specific abrasion rate for peat blocks used in theexperimental runs
Copyright 2001 John Wiley & Sons, Ltd. Earth Surf. Process. Landforms 26, 1087–1102 (2001)

1100 M. EVANS AND J. WARBURTON
Rates of peat block degradation are important for comparison with in-channel fluvial erosion mechanismsand also as a mechanism for releasing fine organic matter into the river system. Weathering of peat priorto transport is assumed to be a major factor in determining the travel distance of entrained blocks and theresistance of blocks to abrasion and splitting during rolling and with impacts. Observations of peat blocks leftout in the open for over five months (November 1997 to May 1998) on the margin of Trout Beck indicatethat although blocks show signs of weathering they retain their overall form. The most noticeable changesinvolve the surface of the blocks becoming rougher, minor slumping on some of the faces and abrasion ofupstream (and windward) faces.
In order to observe the behaviour of peat block submerged in water, a simple laboratory test was carried outon the three sample described in Table I: surface, near-surface and subsurface cubes. All three samples weresubmerged in water in large settling tubes and observed over a 24-hour period. During this time all the blocksexpanded and the surface became visibly much more fibrous. Small organic particles rained down from thefloating samples. The surface sample showed the greatest change and produced a layer of organic detritus inthe base of the settling tube. The near-surface sample produced some organic rain and the subsurface sampleproduced very little organic material on the base of the tube. When removed from the water at the end ofthe experiment the surface-weathered sample fell apart whilst the other two samples had weak surface coats,which fell off revealing a more intact core. Although these results are specific to this particular type of peatand are abstracted from the natural environment, they nevertheless demonstrate that the surface sample whensubmerged in water yielded the greatest amounts of organic rain. The fine material appears to consist of smallparticles which sink, and fibres which float. In a stream channel it is expected that due to turbulence and therough bed, rates of breakdown will be faster and the fine particles will not be deposited but transported assuspended load instead.
CONCLUSION
We have highlighted the importance of peat block transport in upland fluvial systems. The field observationsand empirical experiments reported here clearly demonstrate the following points.
(1) Peat blocks are an important and under-reported load component in peatland streams and are activelyredistributed forming important channel bed features.
(2) In smaller streams (e.g. Rough Sike), large block transport is limited by channel jams. Smaller blocksare transported overbank but exhibit little evidence of downstream fining. In larger rivers such as TroutBeck, peat blocks are more actively sorted and show downstream reduction in size from source. This ispresumably due to the dominance of transport by rolling and consequent abrasion.
(3) Experiments demonstrate that peat block transport occurs largely by rolling and floating and the transportmechanism is probably controlled by relative flow depth (d/Dp ratio).
(4) Transport velocity varies with transport mechanism (rolling is the slowest mode) and transport lengthsincrease as flow depth increases.
(5) Abrasion rates vary with the transport mechanism. Rolling produces greater abrasion rates and morerounded blocks. Release of fines to the fluvial system is therefore controlled by in-channel processes aswell as hillslope sediment delivery.
This paper examines in a systematic fashion, peat block transport in upland fluvial systems. There isconsiderable scope for further work but three areas are worthy of particular attention. Firstly, the materialproperties of peat must be considered more carefully in the experiments. For example, the fabric and structureof peat are largely determined by its vegetation constituents and the compression history (Landva and Pheeney,1980; Hogg et al., 1992; Gavrilchik et al., 1996). This has implications for variations in the material propertiessuch as the bulk density which is generally low but variable (Hobbs, 1986). Secondly, critical conditions forthe entrainment of peat blocks need to be defined under controlled flume conditions where the precise relationd/Dp can be defined. Finally, continued field observations are required to assess the overall contribution ofpeat block transport to the fluvial sediment load and the impact of large blocks on river channel sedimentation.
Copyright 2001 John Wiley & Sons, Ltd. Earth Surf. Process. Landforms 26, 1087–1102 (2001)

TRANSPORT OF PEAT BLOCKS IN FLUVIAL SYSTEMS 1101
ACKNOWLEDGEMENTS
This work has been supported by financial assistance from the University of Durham and the Royal Societyto J.W., and from the University of Manchester and the Royal Society to M.G.E.
REFERENCES
Bower MM. 1961. The distribution of erosion in blanket peat bogs in the Pennines. Transactions of the Institute of British Geographers29: 17–30.
Clymo RS. 1983. Peat. In Ecosystems of the World 4A. Mires: Swamp, Bog, Fen and Moor. General Studies , Gore AJP (ed.). Elsevier:Amsterdam; 159–224.
Crisp DT. 1966. Input and output of minerals for an area of Pennine moorland: the importance of precipitation, drainage, peat erosionand animals. Journal of Applied Ecology 3: 327–348.
Crisp DT, Robson S. 1979. Some effects of discharge upon the transport of animals and peat in a North Pennine headstream. Journalof Applied Ecology 16: 721–736.
DOE (Department of the Environment) 1995. The Occurrence and Significance of Erosion, Deposition and Flooding in Great Britain .HMSO: London.
Dietrich WE, Dunne T. 1978. Sediment budget for a small catchment in mountainous terrain. Zeitschrift fur Geomorphologie Supple-mentband 29: 191–206.
Dietrich WE, Dunne T. 1993. The channel head. In Channel Network Hydrology , Beven K, Kirkby MJ (eds). Wiley: Chichester;175–219.
Evans MG, Burt TP, Holden J, Adamson JK. 1999. Runoff generation and water table fluctuations in blanket peat: evidence from U.K.data spanning the dry summer of 1995. Journal of Hydrology 221: 141–160.
Francis I. 1990. Blanket peat erosion in a Mid-Wales catchment during two drought years. Earth Surface Processes and Landforms 15:445–456.
Frydman S, Beasley DH. 1976. Centrifugal modelling of riverbank failure. Journal of Geotechnical Engineering Division. Proceedingsof the American Society of Civil Engineers 102: 395–409.
Garnett M, Adamson JK. 1997. Blanket mire monitoring and research at Moor House National Nature Reserve. In Blanket MireDegradation: Causes and Consequences , Tallis JH, Meade R, Hulme PD (eds). Proceedings of the Mire Research Group of theBritish Ecological Society: 116–117.
Gavrilchik AP, Kashinskaya TY, Savin YI, Piskunova TA. 1996. Changes of physical-technical properties and chemical composition ofpeat under anthropogenic influence. In Peatlands Use Past, Present and Future, Luttig GW (ed.). Proceedings of 10th InternationalPeat Congress, Volume 2. E. Schweizenbartsche Verlagsbuchandlug: Stuttgart; 316–320.
Gorham E. 1991. Northern peatlands; role in the carbon cycle and probable responses to climate change. Ecological Applications 1:182–195.
Heathwaite AL. 1993. Disappearing peat – regenerating peat? The impact of climate change on the British peatlands. The GeographicalJournal 159: 203–208.
Hobbs NB. 1986. Mire morphology and the properties and behaviour of some British and foreign peats. Quarterly Journal of EngineeringGeology London 19: 7–80.
Hogg EH, Lieffers VJ, Wein,RW. 1992. Potential carbon losses from peat profiles – effects of temperature, drought cycles and fire.Ecological Applications 2: 298–306.
Koutaniemi L. 1984. The role of ground frost, snow cover, ice break-up and flooding in fluvial processes of the Oulanka river, NEFinland. Fennia 162: 127–161.
Labadz JC, Burt TP, Potter AWR. 1991. Sediment yield and delivery in the blanket peat moorlands of the southern Pennines. EarthSurface Processes and Landforms 16: 255–271.
Labadz JC, Butcher DP, Potter AWR, White P. 1995. The delivery of sediment in upland reservoir systems. Physics and Chemistry ofthe Earth 20: 191–197.
Landva AO, Pheeney PE. 1980. Peat fabric and structure. Canadian Geotechnical Journal 17: 416–435.Lawler DM. 1992. Process dominance in bank erosion systems. In Lowland Floodplain Rivers , Carling PA, Petts GE (eds). Wiley:
Chichester.Malmer N. 1992. Peat accumulation and the global carbon cycle. In Greenhouse impact on cold-climate ecosystems and landscapes ,
Boer M, Koster E. (eds). Catena Supplement 22: 97–110.McManus J, Duck RW. 1985. Sediment yield estimated from reservoir siltation in the Ochil Hills, Scotland. Earth Surface Processes
and Landforms 10: 193–200.Meybeck M, Vorosmarty C. 1999. Global transfer of carbon by rivers. International Geosphere-Biosphere Program. Newsletter 37:
18–20.Mulholland PR, Kuenzler EJ. 1979. Organic carbon export from upland and forested wetland watersheds. Limnology Oceanography 24:
960–966.Newall AM, Hughes JMR. 1995. Microflow environments of aquatic plants in flowing water wetlands. In Hydrology and Hydrochemistry
of British Wetlands , Hughes JMR, Heathwaite AL (eds). Chichester: Wiley.Reid LM, Dunne T. 1996. Rapid Evaluation of Sediment Budgets . Catena: Reiskirchen.Shields Jr FD, Gippel CJ. 1995. Prediction of effects of woody debris removal on flow resistance. Journal of Hydraulic Engineering
12: 341–354.Sykes JM, Lane AMJ (eds). 1996. The United Kingdom Environmental Change Network: Protocols for standard measurements of ter-
restrial sites . Natural Environmental Research Council: London.Tallis JH. 1985. Erosion of blanket peat in the southern Pennines: new light on an old problem. In The Geomorphology of North-West
England , Johnson RH (ed.). Manchester University Press: Manchester; 313–336.
Copyright 2001 John Wiley & Sons, Ltd. Earth Surf. Process. Landforms 26, 1087–1102 (2001)

1102 M. EVANS AND J. WARBURTON
Tallis JH. 1998. Growth and degradation of British and Irish blanket mires. Environmental Review 6: 81–122.Tallis JH, Meade R, Hulme PD (eds). 1997. Blanket Mire Degradation: Causes, Consequences and Challenges Proceedings of the
Conference at the University of Manchester, April 1997, Mires Research Group, British Ecological Society.Thorne CR, Tovey NK. 1981. Stability of composite river banks. Earth Surface Processes and Landforms 6: 469–484.Wilson P, Griffiths D, Carter C. 1996. Characteristics, impacts and causes of the Carntogher bog-flow, Sperrin Mountains, Northern
Ireland. Scottish Geographical Magazine 112: 39–46.
Copyright 2001 John Wiley & Sons, Ltd. Earth Surf. Process. Landforms 26, 1087–1102 (2001)