Embed Size (px)
Citation preview
Transport Economics and Infrastructure: An Empirical Analysis of the Port Sector
Marta Gonzalez Aregall
ADVERTIMENT. La consulta d’aquesta tesi queda condicionada a l’acceptació de les següents condicions d'ús: La difusió d’aquesta tesi per mitjà del servei TDX (www.tdx.cat) i a través del Dipòsit Digital de la UB (diposit.ub.edu) ha estat autoritzada pels titulars dels drets de propietat intel·lectual únicament per a usos privats emmarcats en activitats d’investigació i docència. No s’autoritza la seva reproducció amb finalitats de lucre ni la seva difusió i posada a disposició des d’un lloc aliè al servei TDX ni al Dipòsit Digital de la UB. No s’autoritza la presentació del seu contingut en una finestra o marc aliè a TDX o al Dipòsit Digital de la UB (framing). Aquesta reserva de drets afecta tant al resum de presentació de la tesi com als seus continguts. En la utilització o cita de parts de la tesi és obligat indicar el nom de la persona autora. ADVERTENCIA. La consulta de esta tesis queda condicionada a la aceptación de las siguientes condiciones de uso: La difusión de esta tesis por medio del servicio TDR (www.tdx.cat) y a través del Repositorio Digital de la UB (diposit.ub.edu) ha sido autorizada por los titulares de los derechos de propiedad intelectual únicamente para usos privados enmarcados en actividades de investigación y docencia. No se autoriza su reproducción con finalidades de lucro ni su difusión y puesta a disposición desde un sitio ajeno al servicio TDR o al Repositorio Digital de la UB. No se autoriza la presentación de su contenido en una ventana o marco ajeno a TDR o al Repositorio Digital de la UB (framing). Esta reserva de derechos afecta tanto al resumen de presentación de la tesis como a sus contenidos. En la utilización o cita de partes de la tesis es obligado indicar el nombre de la persona autora. WARNING. On having consulted this thesis you’re accepting the following use conditions: Spreading this thesis by the TDX (www.tdx.cat) service and by the UB Digital Repository (diposit.ub.edu) has been authorized by the titular of the intellectual property rights only for private uses placed in investigation and teaching activities. Reproduction with lucrative aims is not authorized nor its spreading and availability from a site foreign to the TDX service or to the UB Digital Repository. Introducing its content in a window or frame foreign to the TDX service or to the UB Digital Repository is not authorized (framing). Those rights affect to the presentation summary of the thesis as well as to its contents. In the using or citation of parts of the thesis it’s obliged to indicate the name of the author.
PhD in Economics
Mar
ta G
onza
lez
Are
gall
PhD
in E
cono
mic
s
Marta Gonzalez Aregall
Transport Economics and Infrastructure: An Empirical Analysis of the Port Sector
2015

Thesis title:
PhD student:
Marta Gonzalez Aregall
Advisor:
Xavier Fageda
Date:November 2015
PhD in Economics
Transport Economics and Infrastructure: An Empirical Analysis of the Port Sector


Chapter 2- Do all transport modes impact on industrial employment? Empirical evidence from the Spanish regions
17
Figure 2.1 depicts the regional allocation of employment in manufacturing
industry.8 Of the twelve Spanish provinces presenting the highest
manufacturing employment figures (accounting for more than half the
country’s total), nine are located on the coast and three in the interior. These
twelve provinces can be grouped in three geographical areas: the
Mediterranean coast (including Barcelona and Valencia), the Ebro Valley
(including Bilbao and Zaragoza), and Madrid. On the other hand, with the
exception of Madrid, the provinces with the lowest employment values are
located in the interior.
Figure 2 1 Distribution of manufacturing employment
Source: Own elaboration based on the data on manufacturing employment
In terms of transport infrastructure, maritime and air transport services are
more competitive on medium and long-haul routes, while road and railways
may be better suited to short-haul routes. Figure 2.2 shows freight traffic
distribution in Spain considering different modes of transportation at national
and international levels. Data for the considered period are only available for
2007 and 2008.
8 Stata software provides us with the map of the distribution of employment in the manufacturing industry by quantile measures grouped in four different intervals of values.

Transport Economics and Infrastructure: An Empirical Analysis of the Port Sector
18
As can be seen, road transportation dominates freight traffic distribution at
the national level; whereas maritime transportation handles the majority of
cargo movements at the international level. In contrast, rail freight traffic and
air cargo are not relevant in the overall freight traffic distribution. Thus, the
international accessibility of the regions in Spain in terms of cargo seems to be
based on ports.
Figure 2 2 Freight transportation in Spain (thousand tones)
Source: Own elaboration based on Transportation and Logistics Observatory (OTLE-Ministry of Transportation).
An examination of the infrastructure variables reveals the geographical
distribution of network modes (railways and motorways) to be quite similar.
As one of Spain’s transport objectives has been to improve connections
between the political capital and the provincial capitals (Albalate et al., 2012),
the region of Madrid has the highest density of motorways and railways in
Spain — more than twice that of the regions with the next largest
endowments, namely Catalonia, Valencia and the Basque Country. The density
figures are quite similar in the case of railways.9 Note also that in the period
9 Since 2000, one of Spain’s main transport objectives has been to provide a high-speed rail link between the political capital and all provincial capitals. The specific objective is that Madrid should be reached from all provincial capitals in a journey time of less than four hours.
0
500000
1000000
1500000
2000000
2500000
Road2007
Road2008
Rail2007
Rail2008
Airport2007
Airport2008
Maritime2007
Maritime2008
National International


Transport Economics and Infrastructure: An Empirical Analysis of the Port Sector
20
2.3. The Empirical strategy
In this section we outline the methodology used for estimating the
determinants of employment in the manufacturing sector. Given that the
spatial spillovers between provinces may be especially relevant to our study,
the regressions are conducted using spatial econometric techniques.10
According to LeSage and Pace (2009), the spatial Durbin model (SDM) is
the most suitable specification for modeling spatial effects. This model is
characterized by including a spatially lagged dependent variable and spatially
lagged explanatory variables (Elhorst, 2010a; 2010b; LeSage and Pace, 2009).
Thus, in order to analyze the spatial interaction effects of the dependent
variable and all the explanatory variables, we specified the equation for
estimating the determinants of employment for the corresponding province i
in year t using a spatial Durbin regression as follows:
Ind_employment� = α� + α�W∗Ind_employment� + α�Motorways�
+α�Railways� + α�Port� + α!Airport�
+α#PopDens� + α%Education� + α)W∗Motorways�
+α*W∗Railways� + α��W
∗Port� + α��W∗Airport�
+α��W∗PopDens� + α��W
∗Education� +μ´-./012
ε�
where, the dependent variable (Ind_employment) corresponds to the
number of employees in the industrial sector in province i at time t. As
discussed above, we include as the main explanatory variables measures of the
respective endowments of transport infrastructure (motorways, railways, port
and airports) and two control variables: density of population and education.
Furthermore, in this equation we include the spatial lag of the dependent
variable and the spatial lag of the explanatory variables where W (N x N) is a
spatial weight matrix that defines dependence across N regions.11 By
10 We also estimated dynamic regressions with the GMM estimator. The results are disappointing because the only significant variable is the lag of the endogenous variable and the variable Motorway. One explanation might be that the sample does not have enough time variability to identify the relevant effects of the growth rates. Note also that the GMM estimator does not capture the heterogeneity between regions and, more importantly, it does not allow us to identify the spatial effects (one of this chapter’s main concerns). 11According to Hughes (2011), when the number of time periods is higher than ten, it is reasonable to estimate a model with a spatially lagged dependent variable. In our case, the number of time periods is fourteen.


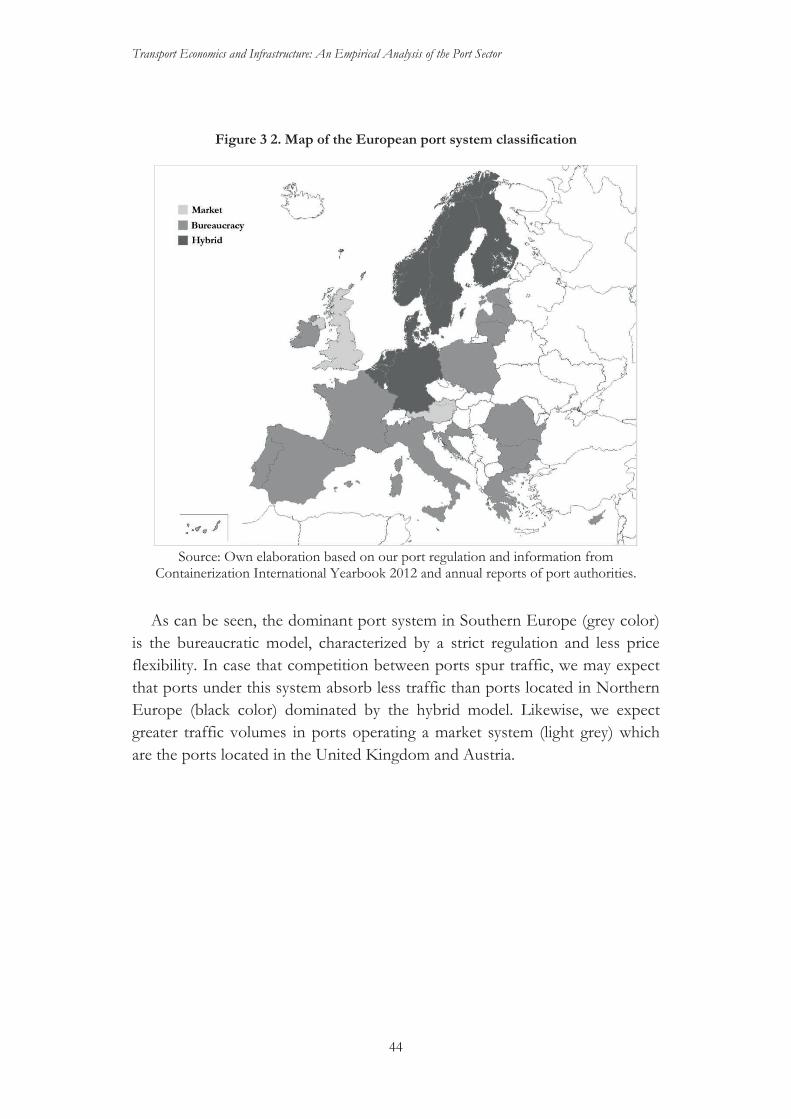


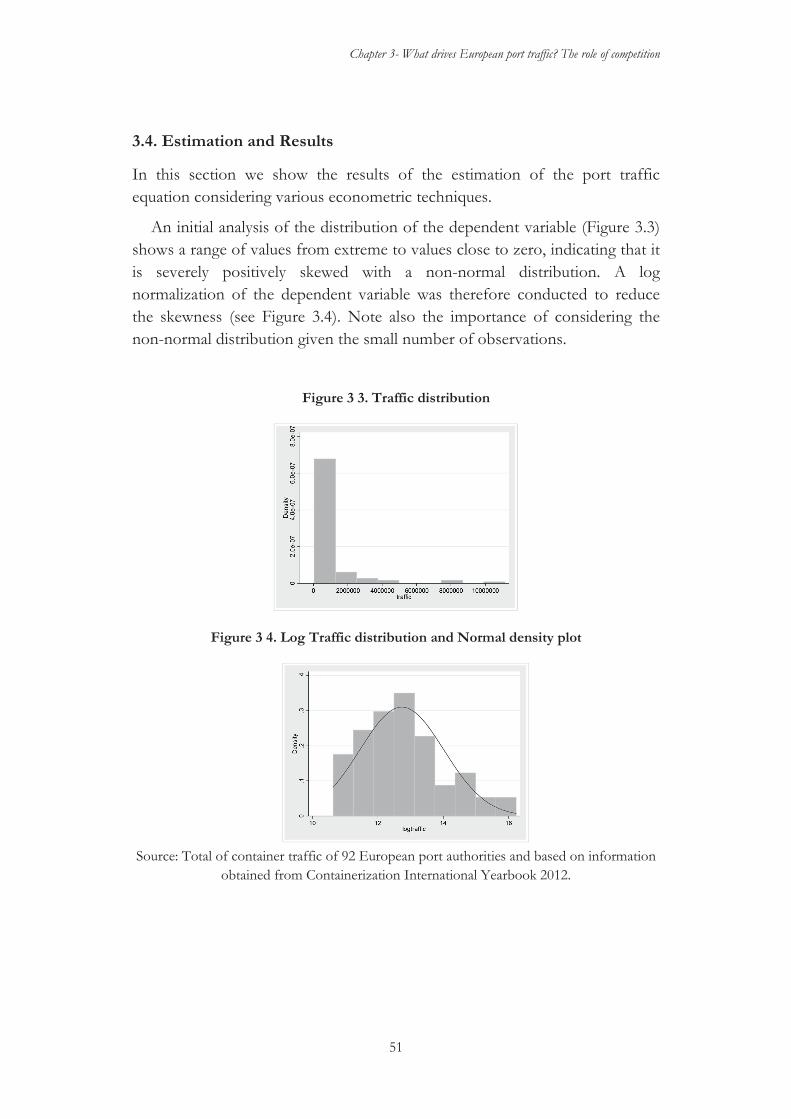
Chapter 3- What drives European port traffic? The role of competition
49
First, as economic and geographic attributes of the region, we include
Gross Domestic Product (GDP), location variables, and dummies for inland
navigation channels and islands. The expected sign of the GDP variable is
positive, since wealthier regions should generate more container traffic due to
more demand from maritime transport services. In contrast, the expected sign
for the location variables is unclear. On the one hand, the largest ports are
located in the North-West of Europe but, on the other, ports located in the
Mediterranean Sea (South-East) absorb part of the international trade that
originates in Asia and passes through the Suez Canal. We also consider inland
port authorities for which the expected sign is negative reflecting smaller
regions and smaller local demand.13 Finally, the expected sign of the island
variable is not clear as the traffic to these peripheral locations is captive so that
it is totally dependent on the size of local demand14.2
Second, in the case of port attributes, we consider a dummy variable for
ports that act as large hubs. Here, we include ports that can hold more than 2
million TEUs and which have a higher than 50% share of transshipment. The
expected sign of the variable is positive since these ports should handle more
traffic than is predicted by local demand. According to Heaver et al. (2000),
shipping line alliances in hubs will have a greater presence and a greater market
influence on the decision-making of port authorities in the future.
We also consider a ‘no multiuser’ variable that takes a value of one in the
case of those ports in which at least one terminal is managed and monopolized
by a single shipping line. The expected sign of this variable is a priori unclear.
On the one hand, such a scenario could weaken competition as one of the
port’s terminals would be free from any competitive pressure; on the other, a
positive sign might be expected as the shipping line would guarantee a certain
volume of port traffic.
In addition, we consider a variable for the volume of traffic in neighboring
ports, taking into account the number of nearby ports located in a radius of
between one hundred and five hundred miles. We then sum the total amount
of port traffic for each traffic threshold. The expected sign of this variable is a
priori unclear. In the literature, Yap and Lam (2006) reported that port
competition only benefits the largest seaports in East Asia that are located in
the same hinterland. Likewise, Notteboom (2009), in a study of shipping-line
decisions, observed a tendency towards concentration in the Rhine-Scheldt
13 See table in the Annex for a list of all inland port authorities in our database. 14 Because of its size, we do not consider the United Kingdom as an island.


Transport Economics and Infrastructure: An Empirical Analysis of the Port Sector
54
Table 3 3. Variance Inflation Factor
VIF
Log Traffic 1.66
GDP 2009 1.26
Longitude 1.70
Latitude 3.04
Island 1.49
Inland 1.16
Hub 1.44
Traffic200 1.43
No_multiuser 1.49
Motorways 1.75
Rail facility 1.57
Hybrid 2.94
Bureaucracy 3.90
MEAN VIF 1.91
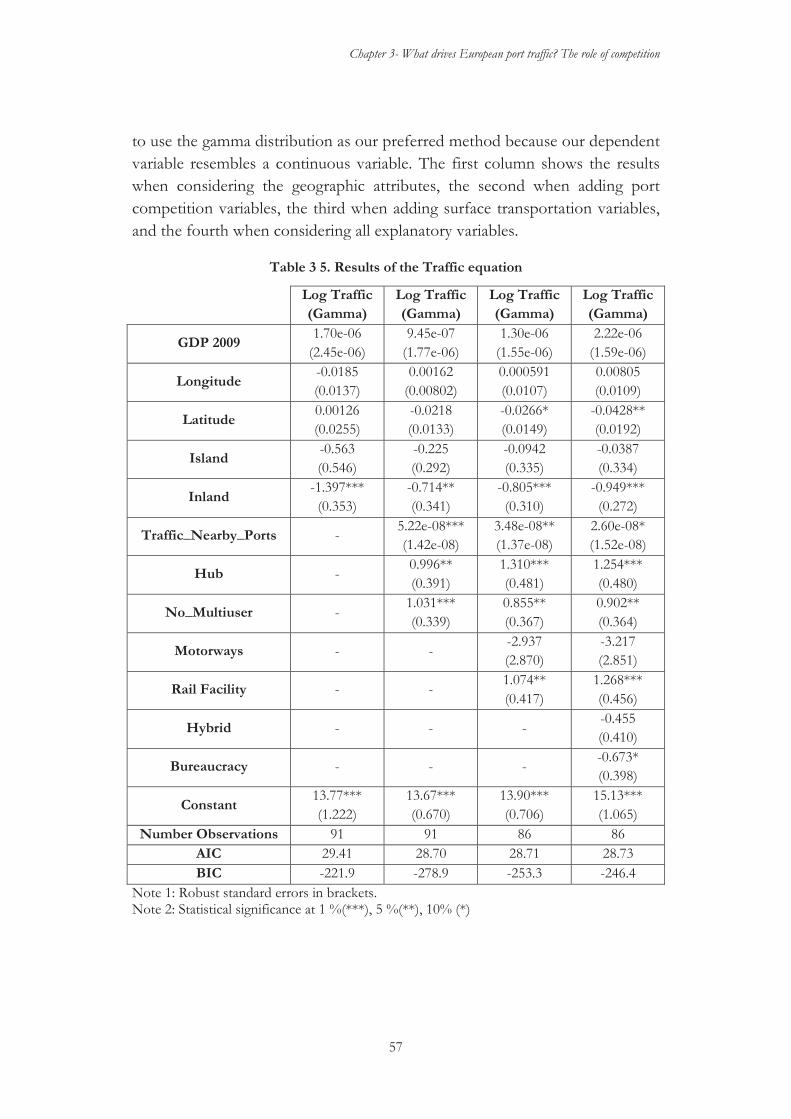
We estimated the GLM with a gamma distribution for different distances of
nearby ports in order to select which is most appropriate for our analysis15.3 In
order to select one nearby port distance threshold as explanatory variable, we
used different information criteria using goodness-of-fit statistics. Generally,
there are two standard measures for a selection test for different estimations,
namely, Akaike’s information criterion (AIC) and Schwarz’s Bayesian
information criterion (BIC), where a smaller AIC and BIC are preferred
(Cameron and Trivedi, 2009). However, and according to Hilbe (2007), most
statisticians today prefer to use the AIC, BIC, or other model-specific fit
statistics to the deviance. For this reason, we do not consider deviance
goodness-of-fit statistics here. As a result, in the gamma distribution model
using all thresholds for nearby port distances, the variable of port traffic in a
400-mile radius presents the lowest AIC and BIC values and so we have opted
to consider this distance threshold in our preferred regressions. In any case,
only the GDP and traffic in the nearby port variables are affected by the
consideration of one or other of the measures of traffic handled in nearby
ports.
15 The details of the gamma distribution model using all thresholds for nearby port distances are available from the authors.


3 (3), 211-220


Transport Economics and Infrastructure: An Empirical Analysis of the Port Sector
76
3) Population in region i during year t (POPULATION). These data are
available at the provincial level (NUTS 3) and again are provided by the INE.
We expect the coefficient of this variable to present a positive sign since the
demand for maritime transport services should be higher in more highly
populated cities.
4) We capture the industrial activity (INDUSTRIAL) as the total number of
employees in the industry sector (data from the INE) at the autonomous
region level (NUTS 2). The demand for maritime transport services should be
higher in industrial areas with a more intense import/export activity, so we
expect to find a positive relation between industrial activity and the amount of
traffic.
5) Due to its geography, namely a Peninsula jutting out into the
Mediterranean and the Atlantic Seas, Spain makes an interesting case study.
We, therefore, employ two variables of location. On the one hand, the
(LONGITUDE) variable indicates whether the port is situated in the East
(positive sign) or the West (negative sign); and, on the other hand, the
(LATITUDE) variable is positive when the port is in the North and negative
when located in the South. Spain’s largest ports lie in the Mediterranean Sea
and absorb part of the international trade originating from Asia since the
shipping companies use the Suez Canal. As such, we expect a positive sign for
the longitude variable and a negative sign for the latitude variable.
6) CAR: We also construct a dummy variable to account for a particularly
important industrial sector in Spain.9 We consider a dummy variable that takes
a value of 1 for a region with an automobile production plant and 0 otherwise.
In assigning this variable we consider if the production plant is located within
a specific provincial level (NUTS 3). Here, we expect a positive sign, on the
understanding that if an automobile production plant is located in the region,
then the port should benefit from more traffic because of the increased
amount of imports and exports in that region.
7) PERCINTERNA: The percentage of international regular lines among
the total number of regular lines. Ports that have a higher number of
international regular lines should generate more traffic than is generated by
national lines; so, we expect the coefficient of this variable to be positive.
9 According to the Bank of Spain (Banco de España, Boletin Economico May 2011), the exports of the automotive industry accounted for 22.2% of total exports (in terms of medium value) for the period 1999-2009.
Chapter 4- Port Charges in Spain: The role of regulation and market forces
77
8) Finally, we consider six dummy variables, one for each year in the study,
in order to take into account the time effect. We estimate this time effect from
2005 to 2010 with 2004 serving as the year of reference.
- Pricing Equation
The dependent variable is the total revenue per tonne that the port
authority charges to its concessionaires and to the shipping companies
(REVENUES PER TONNE). The explanatory variables are the following:
A) LOG (TRAFFIC): We consider the total amount of traffic handled by
each port authority. As above, we use logs because the relationship between
traffic and revenue per tonne is not linear. We expect the coefficient of this
variable to present a negative sign as some components of the port charges are
fixed and the regulations establish that ports generating higher profits (i.e.,
handling more traffic) have to reduce their prices (regulation of maximum
profit).
B) Some ports move a substantial number of passengers. Thus, we
construct a dummy variable (PAX) that takes a value of 1 for ports handling
more than a million passengers during 2009.10 The information is available
from the “Puertos del Estado”. While the variable may capture the fact that a
higher number of passengers will generate more income, the number of
tonnes transported will not be affected. Thus, in consequence we expect the
coefficient of this variable to present a positive sign.
C) Spain has 28 port authorities that manage 44 ports of general interest.
Given this number, several ports may be located very close to each other; in
some instances we even find more than one port in the same province (NUTS
3). Thus, we consider the intensity of local competition by including a variable
that measures the number of ports within a one-hundred mile (NUMBER
NEARBY PORTS). The information is available from the “Puertos del
Estado”. We expect the intensity of competition for a port authority to
increase with the number of nearby ports. Hence, we expect this variable to
present a negative sign as the port authority may have more incentives to apply
discounts due to more intense local competition.
10 The ports are Almeria, Bahía de Algeciras, Baleares, Barcelona, Ceuta, Las Palmas and Santa Cruz de Tenerife.

Transport Economics and Infrastructure: An Empirical Analysis of the Port Sector
78
D) We consider the market power of the shipping companies by including a
variable of concentration at the port level.11 To do this, we count all the regular
lines that the shipping companies provide in each port. Note that, especially in
the largest ports, some regular services are operated by more than one regular
shipping line. We construct a Herfindahl-Hirschman Index (HHI) based on
the sum of the square shares enjoyed by the shipping companies operating in
the port.12 To calculate the HHI we take the total number of companies that
operate a regular line and their respective shares among the total regular lines.
We create our own database from the annual reports of all the port authorities.
We expect shipping companies with a larger share in the port’s traffic to
have a higher bargaining power in negotiations with the port authority since
the port’s total traffic will be more dependent on the decisions of those
specific shipping lines. Thus, port authorities may have more incentives to
offer discounts if just a few shipping lines concentrate the supply of regular
lines. Thus, we expect this coefficient to present a negative sign associated
with the HHI variable. In ports in which the shipping lines present low levels
of concentration, shippers may also play a key role in choosing the port to
handle their goods.
The most accurate measure of the shipping companies’ share of traffic
would be the total cargo loaded and unloaded, but unfortunately this
information is not available. Furthermore, data have had to be collected
manually using the annual reports or websites of each port authority. Thus, we
only have data for 2010.
E) As an indicator of the level of operation of the terminal operator, we
create a dummy variable (MULTINATIONAL) that takes a value of 1 if the
terminal operator is a multinational company and 0 otherwise. This variable
seeks to measure the presence of multinational companies among terminal
operators. The port authority could have incentives to apply discounts to firms
that operate at the global level because these firms may offer greater potential
for investment than public firms or private firms that operate at a local level.
In this regard, the bargaining power of the terminal operators could be
weakened by the fact that they have already incurred major investments with
11 The liner shipping industry is dominated by few large operators. However, Lun and Marlow (2011) show that non-mega operators can be very efficiently too. 12 Some values are missing for Aviles, Huelva, Las Palmas, Motril and Santa Cruz de Tenerife.

Chapter 4- Port Charges in Spain: The role of regulation and market forces
79
high sunk costs.13 By contrast, multinational operators tend to manage
specialized container terminals that may well be associated with higher costs
than other terminals (due, for example, to more expensive cranes). Thus, a
priori, the sign of the coefficient associated with this variable is unclear. Note
that the higher costs associated with facilities required to handle containers
could also be captured by a variable that accounts for the percentage of total
traffic transported by containers.
F) The percentage of international regular lines among the total number of
regular lines (PERCINTERNA). Port authorities may have incentives to apply
more discounts when traffic is restricted to a higher percentage of
international regular lines, which may be subject to global competition.
However, international regular lines are less subject to intermodal competition
from rail and road to serve shippers than national lines. Thus, a priori, the sign
of the coefficient associated with this variable is unclear.
G) Charges to shipping companies according to the category of the good. A
(BULK) good is charged as a “cheaper” good, so this should have a direct
impact on revenue per tonne. Thus, we expect the coefficient associated with
this variable to present a negative sign.
H) At the same time, we can consider the degree of containerization
(CONTE) of a port though the percentage of containerized traffic over total
traffic. The classification of goods in terms of the level of charges does not
clearly distinguish between containerized and general traffic. However,
container traffic may be associated with capital costs due to a need for more
specialized assets but yielding heightened productivity. In any case, a priori,
the sign of the coefficient associated with this variable is unclear because it
might be the case that goods belonging to the general traffic category (such as
cars) are more expensive than container traffic.
I) The regulation grants peripheral or isolated regions some specific
advantages. To take this into account, we construct two dummy variables.
(ISLAND) takes a value of 1 for ports located in Spanish Islands (Balearics
and Canaries). We also include a variable (CEUMEL) that takes a value of 1 if
the ports are located in the two Spanish cities in North Africa: Ceuta and
13 For example, in Barcelona the multinational company Hutchison Port Holdings Group opened a new container terminal in September 2012. The new terminal occupies a 100-hectare site, boasts a quay that is 1,500 meters long and has the capacity to handle 2.65 million TEUs each year. The total investment in the new terminal amounts to about 500 million Euros.


Transport Economics and Infrastructure: An Empirical Analysis of the Port Sector
84
more traffic but lower revenues per tonne than most of the other ports.14
However, revenues per tonne are higher in Barcelona than in several smaller
ports. It is clear, therefore, that the charges in operation in Algeciras (which
serves as a hub) are lower than those in Barcelona and Valencia (which
operates as a gateway). In addition, revenues per tonne are especially low in a
group of large ports that specialize in bulk traffic (namely, Bilbao, Cartagena
and Tarragona).
It seems that below certain traffic limit (around 10 million tonnes),
revenues per tonne become higher. A possible explanation for this might be
that some components of port charges are fixed regardless of the level of
traffic. Furthermore, the correction coefficient (which imposes a regulation of
maximum profit) might also account for the lower charges made by the large
ports.
4.5. Estimation and Results
The data used for estimating the equations considered herein have a time-
series, cross-sectional structure (data panel). Various techniques and estimation
models are available for estimating equations with data panels of this nature.
The random effects model, however, is not a suitable alternative in our
context because the random effects may be correlated with some of the
explanatory variables. Likewise, the Hausman test is not useful for testing the
suitability of the random effects because several explanatory variables are time-
invariant, which means that results for the random and fixed effects models
will differ. Here, the use of the fixed effects means that we may fail to identify
the effect of the time-invariant variables, such as a port with an island location.
This shortcoming of the fixed effects model is particularly grave in the case of
the pricing equation because our variables designed to capture competition do
not vary over time. This is the case of the dummy variable for multinationals
that operate at least one terminal in the port, the number of nearby ports and
the concentration index based on the shares of shipping companies operating
regular lines in the port. Thus, here we have opted to present the results of the
demand equation using the pooled model and the fixed effects model, but in
the case of the latter we have excluded the time-invariant variables. The results
of the pricing equation are based on the pooled model, taking into account
14 Note that only four of the 28 ports reported losses in the period under review.


Transport Economics and Infrastructure: An Empirical Analysis of the Port Sector
90
We find that more traffic is associated with lower revenues per tonne.
Indeed, the coefficient associated with the traffic variable is negative and
statistically significant. This result can be justified in terms of scale economies
(i.e., costs per tonne fall as traffic volume rises) provided some charges remain
fixed. Moreover, the regulations governing port charges place a limit on the
maximum amount of profits. So, the ports with most traffic have a greater
probability of making more extraordinary profits and this regulation imposes a
reduction in their prices.
In addition, the coefficient associated with the island variable is negative
and statistically significant. This result can also be explained by the regulations
governing port charges whereby ports located on islands issue lower charges,
even though their traffic is largely captive. By contrast, the coefficient
associated with the variables of Ceuta and Melilla is positive. In these port
cities, higher prices may well reflect the higher amount of captive traffic.
The coefficient of the number of nearby ports variable is negative and
statistically significant. This finding has two possible interpretations. First, it
seems that the discount system functions in the case of local competition.
Second, the existence of a higher number of nearby ports would seem to have
a detrimental impact on each port authority’s income per tonne.
The coefficients associated with the containerization and bulk variables are
negative and statistically significant, but while the passenger variable is also
negative it does not reach statistically significant levels. In this sense, and
based on Spanish legislation and the good’s rate, bulk traffic is cheaper than
the containerized merchandise. Here, it would seem that non-containerized
general merchandise, such as cars, is more expensive to ship than
containerized merchandise. The containerization variable, therefore, does not
seem to capture the possible higher costs associated with the specific assets
required to handle containers. It could be also that the efficiency of container
systems in supply chains explains the negative sign of the containerization
variable15.2
The coefficient associated with the variable of multinational companies
serving as the terminal operator presents a positive sign and is statistically
significant. Thus, we find that terminal operators do not benefit from
discounts. Here, we can conclude that such a situation negatively affects the
15 See Quaresma Dias et al. (2009) for a study of the efficiency of container terminals applied to the Iberian seaports.


Transport Economics and Infrastructure: An Empirical Analysis of the Port Sector
94
References
Banco de España (2011) “Boletín Económico 05/2011”, May 2011.
Bel, G. and Fageda, X. (2010) “Privatization, regulation and airport pricing: An
empirical analysis for Europe”, Journal of Regulatory Economics, 37 (2), 142-
161.
Bilotkach, V., Clougherty, J.A., Muller, J. and Zhang, A. (2012) “Regulation,
privatization, and airport charges: panel data evidence from European
airports”, Journal of Regulatory Economics, 42(1), 73–94.
Castillo-Manzano,J.I. (2010).“El sistema portuario español: buscando un
nuevo rumbo”. Economistas, 123, 290-295.
Castillo-Manzano, J. I., López-Valpuesta, L. and Pérez, J. J. (2008) “Economic
analysis of the Spanish port sector reform during the 1990s”, Transportation
Research Part A: Policy and Practice, 42 (8), 1056-1063.
Cheon, S., Dowall, D. and Song, D. (2010) “Evaluating impacts of institutional
reforms on port efficiency changes: Ownership, corporate structure, and
total factor productivity changes of world container ports”, Transport
Research Part E: Logistics and Transportation Review, 46 (4), 546-561.
De Borger, Proost, S. and Van Dender, K. (2008) ‘”Private Port Pricing and
Public Investment in Port and Hinterland Capacity”, Journal of Transport
Economics and Policy, 42,(3), 527-561.
Fung, M.K., Cheng, L.K. and Qiu, L.D. (2003) “The impact of terminal
handling charges on overall shipping charges: an empirical study”. Transport
Research Part A: Policy and Practice, 37 (8), 703-716.
González, M. and Trujillo, L. (2008) “Reforms and infrastructure efficiency in
Spain’s container ports”, Transportation Research Part A: Policy and Practice, 42,
(1), 243-257.
González, M. and Trujillo, L. (2009) “Efficiency Measurement in the Port
Industry: A Survey of the Empirical Evidence”, Journal of Transport Economic
and Policy, 43 (2), 157-192.
Liu, Q. and Medda, F. (2009) “Port infrastructure efficiency: The Euro-
Mediterranean case”, International Journal of Shipping and Transport Logistics, 1
(4), 361-385.

Chapter 4- Port Charges in Spain: The role of regulation and market forces
95
Lun, V.Y.H and Marlow, P. (2011) “The impact of capacity on firm
performance: A study of the liner shipping industry”, International Journal of
Shipping and Transport Logistics, 3 (1), 57-71.
Núñez-Sánchez, R., Jara-Díaz,S and Coto-Millán,P. (2011) “Public regulation
and passengers importance in port infrastructure costs”, Transport Research
Part A: Policy and Practice, 45 (7), 653-666.
Quaresma Dias, J.C, Garrizo Azevedo, S., Ferreira, J. and Palma, S.F. (2009)
“A comparative benchmarking analysis of main Iberian container terminals:
A DEA approach”, International Journal of Shipping and Transport Logistics, 1
(3), 260-275.
Steven, A. and Corsi, T. (2012): “Choosing a port: An analysis of containerized
imports into the US”, Transport Research Part E: Logistics and Transportation
Review, 48 (4), 881-895.
Stojstrom, W. (1989) “Collusion in Ocean Shipping: A test of Monopoly and
Empty Core Models”, Journal of Political Economy, 97 (5), 1160-1179.
Tongzon, J.L. (1995) “Determinants of port performance and efficiency·,
Transport Research Part A: Policy and Practice, 29 (3), 245-252.
Tongzon,J. and Heng,W. (2005) “Port privatization, efficiency and
competitiveness: Some empirical evidence from container ports
(terminals)”, Transport Research Part A: Policy and Practice, 39 (5), 405-424.
Tongzon, J.L. and Sawant, L. (2007) “Port choice in a competitive
environment: from the shipping lines’ perspective”, Applied Economics, 39
(4), 477-492.
Van Dender, K. (2007) “Determinants of fares and operating revenues at US
airports”, Journal of Urban Economics, 62 (2), 317-336.
Van Reeven, P. (2010) “The effect of Competition on Economic Rents in
Seaports”, Journal of Transport Economics and Policy, 44 (1), 79–92.
Vanden Boosche, M., Gujar, G. (2010) “Competition, excess capacity and
pricing of dry ports in India: Some policy implications”, International Journal
of Shipping and Transport Logistics, 2 (2), 151-167.


![RESEARCHARTICLE Seabirdbycatchmitigationtrialsinartisanal ...diposit.ub.edu/dspace/bitstream/2445/130325/1/684037.pdfshearwaters appeartobethemostaffected seabirds bythisfishery[2,3].Combined](https://img.pdfslide.net/doc/110x75/60c15d9b0c7fb41dda2cd567/researcharticle-seabirdbycatchmitigationtrialsinartisanal-shearwaters-appeartobethemostaffected.jpg)