Embed Size (px)
Citation preview
Warrington Local Development Framework Modelling Tests for Core Strategy Scenarios
December 2011

Contents
1 Introduction 1
1.1 Purpose 1
1.2 Document Structure 1
1.3 LDF Core Strategy Scenario and Testing Process 1
2 Background and Context 2
2.1 Introduction 2
2.2 Planning Context 2
2.3 Transport Context 2
2.4 Warrington Multi Modal Transport Model 4
3 Transport Impacts of LDF Scenarios 6
3.1 Introduction 6
3.2 Core Strategy modelling Scenarios 6
3.3 Population and Employment 14
3.4 Headline Findings from Scenario Tests 15
3.5 New Journeys and Travel Patterns 15
3.6 Journey Lengths 16
3.7 Mode Share 18
3.8 Impacts on Highway Network 18
4 Conclusions and Next Steps 34
4.1 Summary of key impacts 34
4.2 Next Steps 34

11560089 Warrington LDF - Core Strategy Scenarios 1
1 Introduction
1.1 PURPOSE
1.1.1 This document summarises the findings of transport modelling undertaken using the Warrington Multi Modal Transport Model (MMTM) as part of Warrington’s Local Development Framework (LDF) process. A range of future land use options have been identified and assessed within the Warrington MMTM and the implications of each scenario on transport demand identified.
1.1.2 The Warrington MMTM was developed by WSP on behalf of Warrington Borough Council in partnership with the Highways Agency, North West Development Agency, Homes and Communities Agency and Peel Holdings.
1.1.3 This document has been prepared by WSP Group on behalf of Warrington Borough Council (WBC) as a non-technical summary of the work undertaken, to support the LDF process.
1.2 DOCUMENT STRUCTURE
1.2.1 This document is structured into 4 sections as follows:
Section 1 - An overview of the purpose of the public domain document.
Section 2 - Background information on Warrington, in terms of transportation, land use planning, demographics and the development of the Warrington MMTM.
Section 3 - Model running and results, including description of the LDF -scenarios, assumptions assessed within the Warrington MMTM, and the results.
Section 4 – Summary of key outputs and commentary on the MMTM results, how these are informing the LDF, and anticipated future use of the Warrington MMTM for the LDF process.
1.3 LDF CORE STRATEGY SCENARIO AND TESTING PROCESS
1.3.1 Following a number of formal and informal consultations and the collection of an extensive evidence base, a draft Core Strategy for Warrington will be published in 2011 for public consultation. Once adopted the draft Core Strategy will largely replace the Unitary Development Plan which was adopted in 2006.
1.3.2 As part of the extensive evidence base, the MMTM will help WBC and partners understand the transport implications of differing land use scenarios. This will feed into the Core Strategy’s Sustainability Appraisal and help to draw conclusions as to whether traffic movements created by the level of growth envisaged by the Core Strategy can be accommodated on the existing highway network. Future tests will look to identify whether transport interventions can alleviate any impacts of growth. All modelling results will also be used as evidence when the Council looks to produce a more site specific Allocations Development Plan Document to support the Core Strategy.
1.3.3 For the LDF Core Strategy, a series of strategic land use options were developed for testing in the MMTM, each relating to a different focus and therefore level of development within Warrington. The scenarios were specified by WBC and tested by WSP Group using the MMTM.
2 Warrington LDF - Core Strategy Scenarios 11560089
2 Background and Context
2.1 INTRODUCTION
2.1.1 This section sets out the past, current and predicted future transportation and land use planning challenges for the borough. It also describes the Warrington MMTM, providing information on the use of the model and its outputs for the LDF process.
2.2 PLANNING CONTEXT
Background and Trends
2.2.1 Warrington has been shaped by major growth, which has largely taken place since the 1960s when it became a New Town.
2.2.2 As a result, Warrington has evolved, from being a medium-sized industrial town to being a large town that is the home of major national and international companies, attracting working people from a wide area across the region.
2.2.3 The population living in Warrington has grown, with the spread of the town into new areas such as Birchwood and Westbrook. It now stands at around 196,000, having risen from 120,000 in 1973.
2.2.4 Warrington attracts more journeys to work (97,078) each day than it generates (85,813) and is the 8th largest attractor of work trips in Greater Manchester, Merseyside & Cheshire1.
2.2.5 The population is presently forecast to change by less than 1% over the next 20 years if current population trends continue, with a decrease in the population under 45 and a substantial increase in the population of 65 and over2. The Borough’s Local Economic Strategy sets out that an ageing population is part of a nationwide trend, but this trend is more noticeable in Warrington because of a “New Town Demographic” where residents who moved to the town in the 1960s and 1970s are now reaching retirement age.
2.2.6 This demographic shift presents particular challenges for planning in Warrington. In particular, the predicted lack of growth in population of employment age may result in further rises in in-commuting.
2.2.7 This issue has been particularly considered in the construction of the scenarios tested. Additional housing in each scenario has been assumed to attract residents with a demographic mix similar to 2008 levels, hence improving the balance of retired and working age population. Section 3.2.19 illustrates this in more detail.
2.3 TRANSPORT CONTEXT
Background and Trends
2.3.1 Warrington benefits from excellent motorway and rail links and a central location within the North West of England; this has made the town very attractive to businesses and residents. 1 Source: Warrington Borough Council Local Transport Plan 3, March 2011 2 Source: WBC figures published at http://www.warrington.gov.uk/content_documents/Documents/Statistics/Demographic_factsheet_2010.pdf
11560089 Warrington LDF - Core Strategy Scenarios 3
2.3.2 However, this attractiveness has to some extent caused the demand for transport to grow faster than the road space and transport services available. In particular, major highway infrastructure projects intended to support the development of the New Town were not delivered in the scale initially envisaged. As a result delays and travel difficulties are now experienced in parts of the town.
2.3.3 It is not the same picture everywhere in Warrington; some places are more prone to experience problems than others. Conditions vary not only by location but also by time of day, by day of the week, month of the year, or by season. It is possible to live or work in Warrington and not encounter travelling difficulties. This needs to be considered when interpreting modelling results, which necessarily represent ‘average’ conditions at each location.
2.3.4 Some statistics reveal the complexity of the transport growth in Warrington:
Between 1998 and 2003 there was peak traffic growth across the borough of 2.1% per annum with larger increases at out of town locations3;
Between 2004 and 2008 there has been has been little evidence of an increase in traffic levels across the borough. Figures in fact show a slight reduction of AM peak traffic into the town centre of 4% between 2005 and 20084;
This trend is confirmed by separate work carried out by the Department for Transport, suggesting an overall reduction in traffic of 3.9% from 1998 to 2008 5;
Since 2004/5, annual passenger numbers on Warrington buses have risen by 28%, compared to national growth of 13% during the same period 6.
Car Use in Warrington
2.3.5 As a result of dispersed New Town development patterns Warrington is a car dependant town; it has a lower percentage of households without access to a vehicle (21%) than the rest of the UK (27%) or North West (30%) and has a higher percentage of households with more than one vehicle. Further figures illustrate Warrington’s car dependency6:
Warrington has a higher percentage of people commuting over 20km to work in (17%) or out (18%) of the borough than the rest of the North West (10% & 14%)6.
A larger percentage of children (34.6%) travel to school by car in Warrington than nationally (25.9%). Fewer use public transport (14.4% compared to 17.6%) and fewer walk (44.7% compared to 50.9%) – this being despite the fact that 84% of young people aged 11-16 years are within 20 minutes travel time by bus of the nearest secondary school6.
2.3.6 A significant factor is the projected increase in car ownership across the North-West, continuing trends which have been in place for many years. The 3 Source from Warrington Borough Council traffic count sites. LTP1 Annual Progress Report 2003 4 Source from Warrington Borough Council traffic count sites across an inner cordon during AM Peak into Warrington Town Centre 5 Average Annual Daily Flow (AADF) - DfT Statistics for DfT sites in Warrington 6 Source: From One Warrington: One Future Making it happen Warrington Borough Council Local Transport Plan 3 Strategy March 2011 and 2011 school census.

4 Warrington LDF - Core Strategy Scenarios 11560089
number of cars owned per household is projected to rise by 5% for the region as a whole and 4% for Warrington itself between 2008-20267.
2.3.7 A major challenge for Warrington is therefore to address this car dependency, whilst at the same time recognising that the ageing population may lead to more in-commuting, itself likely to be heavily car-based.
2.4 WARRINGTON MULTI MODAL TRANSPORT MODEL
2.4.1 The Warrington MMTM was commissioned in the autumn of 2008 by Warrington Borough Council (WBC), in partnership with the Highways Agency, North West Development Agency (NWDA), Homes and Communities Agency (HCA) and Peel Holdings. The primary reason for developing the transport model was to provide an evidence base to support and aid decision making regarding spatial development, transport infrastructure and services.
2.4.2 A model such as the Warrington MMTM uses the predicted future growth in employment, population and trends in travel choices to assess where people will work and live and what mode of transport they are likely to use in the future for their journeys. The design and validation of the model is based on the WebTAG guidance produced by the Department for Transport (DfT).
2.4.3 The development of the base year model (2008) used a comprehensive highway and public transport data collection process, combined with 2001 Census data and additional information provided by both WBC and the Highways Agency. This information enabled a robust representation of Warrington’s transport demand and transportation network in 2008.
2.4.4 In order to test transport demand in future years, housing, population and employment forecasts were input into the model. These forecasts are produced using information from WBC planning team (drawing on planned or anticipated new housing and employment site data) and the DfT’s National Trip End Model (NTEM) forecasts of growth in population and employment across the UK.
2.4.5 The Warrington MMTM considers transport demand in the following stages:
The number of trips generated by residents in each location, divided between work trips, education and ‘other’ (discretionary trips including shopping, personal business and leisure) trip purposes;
The mode of travel selected for the trip, including car, public transport and walk/cycle modes;
The trip destinations, i.e. the employment location, school, shopping area or other activity which ‘attracts’ the trips;
Finally, the routing of the trip from origin-destination if there is more than one option available for a given mode.
7 NTEM dataset 6.1
11560089 Warrington LDF - Core Strategy Scenarios 5
2.4.6 The routing of a trip is particularly important for the highway mode, where multiple routes are often available, and the preference for one route over another will be affected by traffic congestion as well as journey length. Other aspects of travel behaviour may also change because of high traffic congestion (e.g. drivers may switch work location or use public transport). The MMTM takes these aspects into account so that the tendency to change behaviour to adapt to congestion is reflected in the model.
2.4.7 Key outputs that can be extracted from the Warrington MMTM for each model run are the:
Number of trips generated by a residential development;
Number of trips attracted to employment areas;
Mode of travel and demand patterns for journeys to/from each location;
Information about predicted impacts on the highway network, such as changes in traffic flows, the amount of queuing on roads within and around Warrington, journey times and trip lengths.
2.4.8 This information helps to inform as to whether the amounts of development proposed will have significant impacts on transport infrastructure and travel times, and also which development locations or land uses have the least impact overall. Further tests can also be carried out to test potential improvements to the transport system to address and potentially mitigate issues caused by the development scenarios.
6 Warrington LDF - Core Strategy Scenarios 11560089
3 Transport Impacts of LDF Scenarios
3.1 INTRODUCTION
3.1.1 This section explains the future Local Development Framework strategic options and modelling scenarios that have been modelled by Warrington Borough Council. It explains each scenario tested and gives details of the transportation impacts as predicted by the Warrington MMTM.
3.2 CORE STRATEGY MODELLING SCENARIOS
3.2.1 A total of eight land use scenarios for Warrington’s future development were modelled. These scenarios were designed to test the impact of:
Alternative possible future development locations - comparing development at key strategic locations identified in the Core Strategy namely the Town Centre, Omega, Appleton Cross, Grappenhall Heys, Pewterspear Green and Peel Hall and as illustrated in Figure 3.1.
The total amount of development: ranging from modest residential and employment expansion to large scale development
Balance of residential and commercial development: This balance impacts on economic growth of the town, and the traffic in and around Warrington
Differing land use options on specific sites
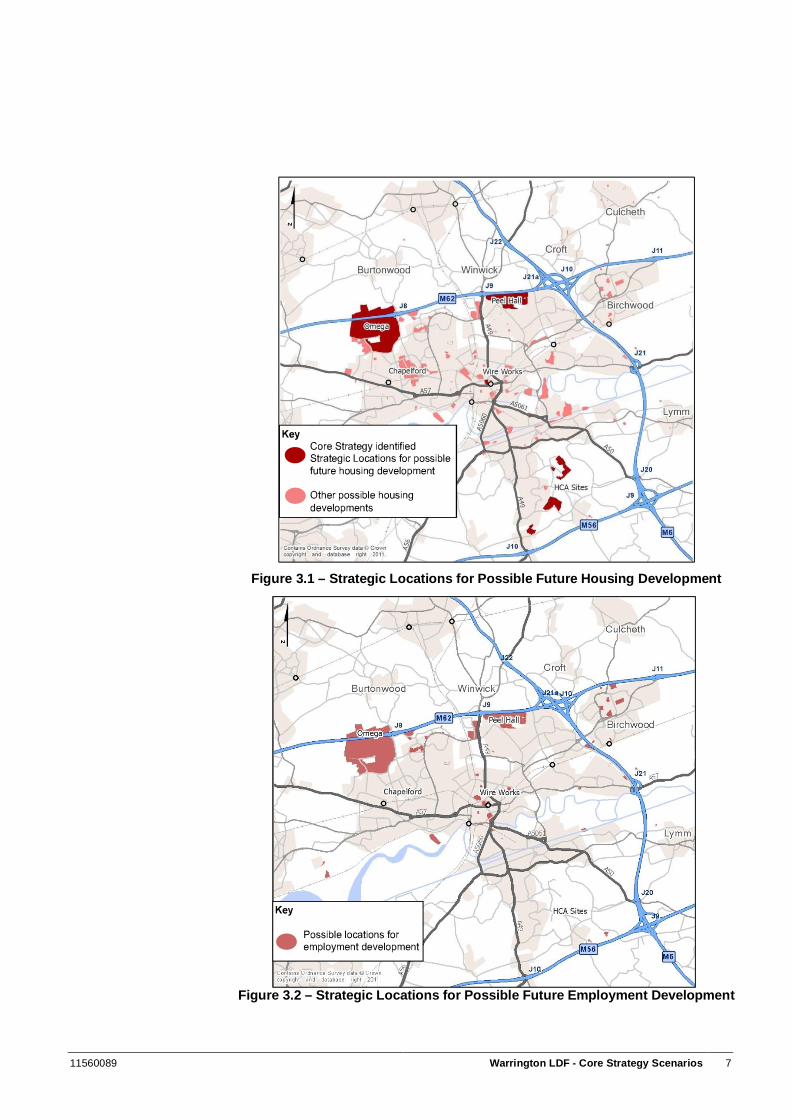
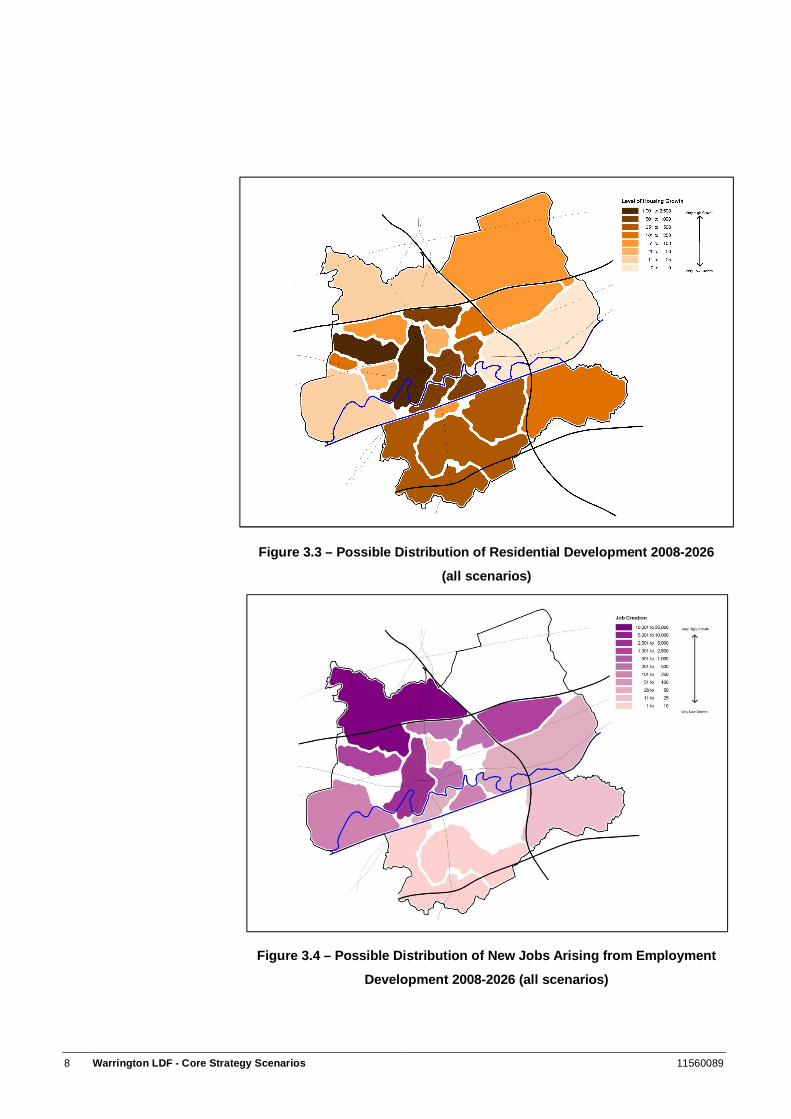
3.2.2 Figures 3.1 and 3.2 below show the locations of development sites being considered for housing and employment. However, the density of development varies a great deal; to give a better picture of the variations in development level, Figures 3.3 and 3.4 indicate the scale of development in terms of housing and jobs across the Borough. Each of these diagrams illustrates the total potential development, which would occur only if all sites considered in the scenario tests were developed within the period between 2011 and 2026.
11560089 Warrington LDF - Core Strategy Scenarios 7
Figure 3.1 – Strategic Locations for Possible Future Housing Development
Figure 3.2 – Strategic Locations for Possible Future Employment Development
8 Warrington LDF - Core Strategy Scenarios 11560089
Figure 3.3 – Possible Distribution of Residential Development 2008-2026
(all scenarios)
Figure 3.4 – Possible Distribution of New Jobs Arising from Employment
Development 2008-2026 (all scenarios)
11560089 Warrington LDF - Core Strategy Scenarios 9
Development Scenarios
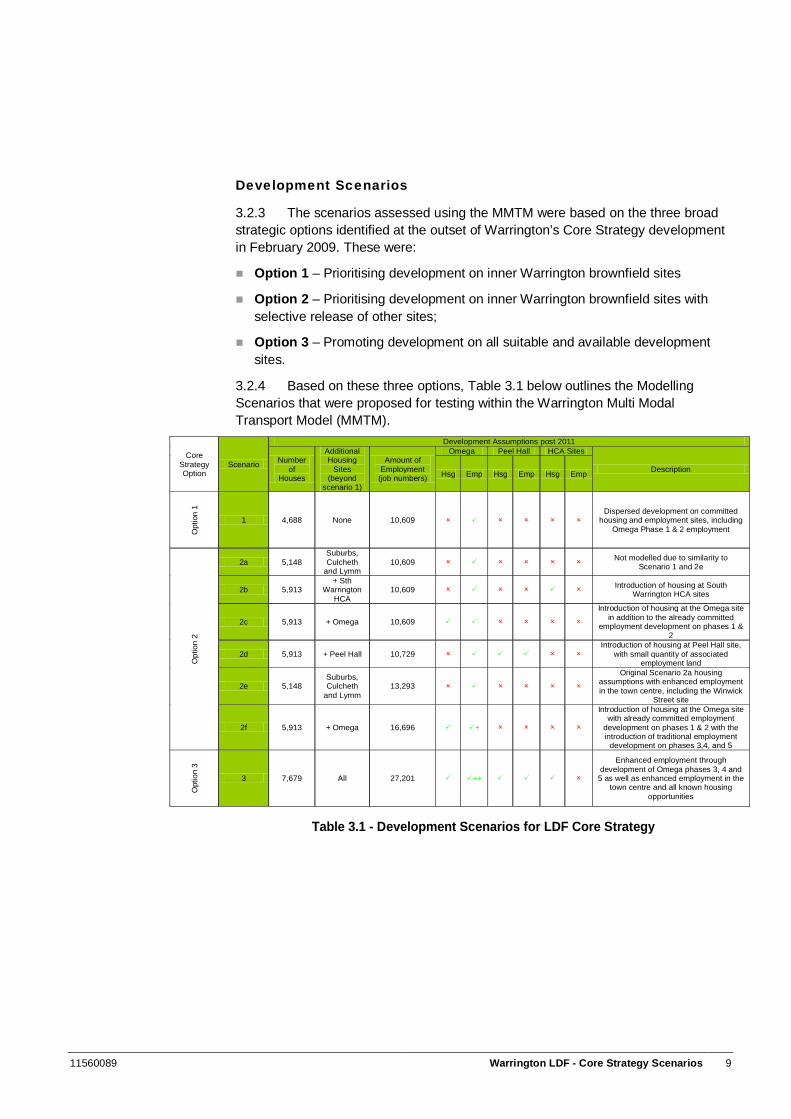
3.2.3 The scenarios assessed using the MMTM were based on the three broad strategic options identified at the outset of Warrington’s Core Strategy development in February 2009. These were:
Option 1 – Prioritising development on inner Warrington brownfield sites
Option 2 – Prioritising development on inner Warrington brownfield sites with selective release of other sites;
Option 3 – Promoting development on all suitable and available development sites.
3.2.4 Based on these three options, Table 3.1 below outlines the Modelling Scenarios that were proposed for testing within the Warrington Multi Modal Transport Model (MMTM).
Table 3.1 - Development Scenarios for LDF Core Strategy
Core Strategy Option
Scenario
Development Assumptions post 2011
Number of
Houses
Additional Housing
Sites (beyond
scenario 1)
Amount of Employment
(job numbers)
Omega Peel Hall HCA Sites
Description Hsg Emp Hsg Emp Hsg Emp
Opt
ion
1
1 4,688 None 10,609 Dispersed development on committed
housing and employment sites, including Omega Phase 1 & 2 employment
Opt
ion
2
2a 5,148 Suburbs, Culcheth
and Lymm 10,609 Not modelled due to similarity to
Scenario 1 and 2e
2b 5,913 + Sth
Warrington HCA
10,609 Introduction of housing at South Warrington HCA sites
2c 5,913 + Omega 10,609
Introduction of housing at the Omega site in addition to the already committed
employment development on phases 1 & 2
2d 5,913 + Peel Hall 10,729 Introduction of housing at Peel Hall site,
with small quantity of associated employment land
2e 5,148 Suburbs, Culcheth
and Lymm 13,293
Original Scenario 2a housing assumptions with enhanced employment in the town centre, including the Winwick
Street site
2f 5,913 + Omega 16,696 +
Introduction of housing at the Omega site with already committed employment
development on phases 1 & 2 with the introduction of traditional employment
development on phases 3,4, and 5
Opt
ion
3
3 7,679 All 27,201 ++
Enhanced employment through development of Omega phases 3, 4 and
5 as well as enhanced employment in the town centre and all known housing
opportunities
10 Warrington LDF - Core Strategy Scenarios 11560089
3.2.5 A brief description of each scenario is given below, followed by an overview of the strategic locations identified for possible future development in the Core Strategy. All scenarios were assessed for the year 2026 with only committed transport improvements included within the assessment, plus the minimum access arrangements required for each site
3.2.6 Scenario 1 considers only the housing and employment sites which are already committed to be delivered within Warrington (as at 2010), (i.e. those with planning permission) alongside the potential from previously developed land within the Inner Area which has been deemed to be deliverable or developable through the Council’s Strategic Housing Land Availability Assessment process8. From an employment perspective only Phases 1 and 2 of the Omega development are included.
3.2.7 In all of the remaining scenarios, additional housing developments in the suburbs of Warrington Town and the villages of Culcheth and Lymm are included as shown in Figure 3.1. This adds a further 460 households, with a population of just over 1,000. The Scenario 2a was originally proposed for testing to include only these additions. However, it was subsequently decided that this scenario would not justify modelling in this process, due to strong similarities to Scenarios 1 and 2e.
3.2.8 Each of Scenarios 2b, 2c and 2d adds additional housing development at a scale, which (based on recent intelligence) could be delivered on one large site between 2010 and 2026. Consequently a figure of 765 houses has been derived and attributed to the identified strategic locations for possible development around Warrington, including the HCA land in the south of the borough (Appleton Cross, Grappenhall Heys and Pewterspear Green) (Scenario 2b), Omega (Scenario 2c) and Peel Hall (Scenario 2d). Applying the same number of houses in each case allows the sites to be easily compared. The increase in population is expected to vary according to the site selected and the types of houses built but would range from 1,600-1,850.
3.2.9 Scenario 2e tests an alternative development focus with no housing at the identified strategic locations, but with enhanced Town Centre employment development and hence job creation. This includes 1,600 extra jobs at the Winwick Street site, and an additional 1,000 at other town centre locations.
3.2.10 Scenarios 2f and 3 test two alternative approaches to additional employment development at Omega than currently committed in Phase 1 and 2, as discussed in 3.2.15 below. Scenario 3 also includes additional residential development, by factoring in all greenfield potential from other outer lying settlements and Green Belt conversions not considered elsewhere, totalling a further 236 dwellings.
8 8 The Council’s Strategic Housing Land Availability Assessment can be found here: http://www.warrington.gov.uk/home/transport_planning_and_environment/Planning/planning_policy_homepage/ldf_evidence_base/Housing_local_evidence/
11560089 Warrington LDF - Core Strategy Scenarios 11
Strategic Locations
3.2.11 Figures 3.1 and 3.2 identify the three strategic locations for potential employment and housing development within Warrington: Omega, Peel Hall and the south Warrington HCA sites (Appleton Cross, Grappenhall Heys and Pewterspear Green). The main components of each site are outlined below.
Omega
3.2.12 Situated on the north of Warrington just west of the m62 Junction 8, the Omega site covers land both north and south of the M62, Omega is identified in the Core Strategy as a strategic locations for employment development. As part of creating a sustainable business community and ancillary to the employment development the site also has the potential to fulfil a housing role within the Core Strategy period. Pursuing a wider mix of uses on the site would require an amendment in the current policy approach set out in Regional Planning Policy and the Unitary Development Plan.
3.2.13 To date Omega Phases 1 and 2 have planning permission to build 276,700sq/m of B1, B2 and B8 development, which is estimated to generate around 6,300 jobs. Of this, employment to the site north of the M62 could generate up to 1,700 jobs from warehouse and distribution (B8) uses. The remaining office-based employment, 4,600 jobs, is located south of the M62.
3.2.14 All modelled scenarios contain this amount of development and it is assumed for modelling purposes that only the warehouse and distribution land use (B8) could be in place before 2016, with the office (B1) employment developing between 2016 and 2026. Phases 3, 4 and 5 of Omega do not have planning permission and the definitive land use mix of these phases is yet to be decided.9
9 These assumptions regarding Omega were identified for modelling purposes.

12 Warrington LDF - Core Strategy Scenarios 11560089
Figure 3.5–Omega Phase 1-5
3.2.15 In addition to phases 1 &2 three land use scenarios for development at Omega on phases 3, 4 and 5 were assessed:
Introduction of Housing only (Scenario 2c): Introduction of 765 houses at the Omega site, with no further employment development within the plan period beyond phases 1 and 2.
Traditional employment uses (Scenario 2f): Introduction of the same level of housing as in Scenario 2c, with a mixture of office use, light industrial and warehousing, judged to be deliverable between 2016 and 2026 in phases 3, 4 and 5 which equates to just over 6,000 additional jobs. This leaves part of the site undeveloped by the end of the Core Strategy period.
Mixed Use development (Scenario 3): Introduction of the same level of housing as in Scenario 2C with the development of Phases 3, 4 & 5 in line with the aspirations set out in the developer’s recent masterplan. These aspirations include developing a hospital and university, along with office employment. This is estimated to generate an additional 13,800 jobs, with 8,700 students. On the advice of the developer it has been assumed that the site would be completely developed with the hospital, university and office development delivered between 2016 and 2026.
3.2.16 All of these additional developments are located to the south of the M62, as shown in Figure 3.5.
South Warrington HCA Sites
3.2.17 The South Warrington HCA sites are located near to the existing residential areas of Grappenhall Heys, Appleton Thorn and Pewterspear Green (see locations marked in Figure 3.1). This option is considered in Scenario 2b, with 765 houses built across these sites with no associated employment. The assumptions in this scenario leaves residual capacity within these sites that could be built out after the Core Strategy period.
11560089 Warrington LDF - Core Strategy Scenarios 13
Peel Hall
3.2.18 Situated to the north of Warrington, south east of M62 Junction 9 (see location marked in Figure 3.1), the Peel Hall site is modelled to be predominantly residential with a small element of employment. The scenario test includes 765 houses to be built on this site along with 6,187 sq/m of industrial development which equates to generating around 120 jobs. This option is considered in Scenario 2d. The assumptions in this scenario leaves residual capacity within this site that could be built out after the Core Strategy period.
Transport Enhancements
3.2.19 In all scenarios the following transportation interventions were included within the Warrington MMTM, as either having been delivered since the base model in 2008, or committed through planning agreements:
Work on M62 J8 to be carried out under Section 278 agreement for Omega, this includes lane widening at the approaches to the roundabout and the eventual relocation of the Charon Way approach from M62 Junction 8 to Burtonwood Road;
Cromwell Avenue/ Calver Road junction improvements already completed. This included making the Calver Road a left turn only movement onto Cromwell Avenue along with improved signage and lane allocation;
Signalised junction at OMEGA north. The junction between Burtonwood Road, M62 Junction 8 service exit and Omega North, currently a roundabout junction, becomes a signalised junction;
Sankey Street/ Parker Street/ Liverpool Road Option K junction improvement.
Road widening A49 Winwick Road Longford Street to Haydock Street. These improvements include additional pedestrian crossings and an additional lane on A49 Winwick Road for vehicles in the southbound direction by Bluecoat Street;
Bus route from centre of town to OMEGA. A bus service stopping at the Town Centre, Omega and Omega North was assumed to operate at a frequency ofevery 20 minutes.
3.2.20 In addition, the Omega South Westbrook Way roundabout with Burtonwood Road improvement was included which involves increasing the circulation capacity approach lane pockets at the roundabout. This highway improvement was added to Scenario 2F and 3 only.
3.2.21 The current planning permission for Omega phases 1 and 2 includes a trigger at a certain level of generated traffic, to provide widening on the M62 eastbound between Junctions 7 and 8. As it is currently not clear in what timescales this trigger point would be met, the widening is not included in any of the modelled scenarios.
3.2.22 Further transport interventions designed to mitigate the impacts arising from specific developments will be tested during the next phase of modelling – see Section 4.2.
14 Warrington LDF - Core Strategy Scenarios 11560089
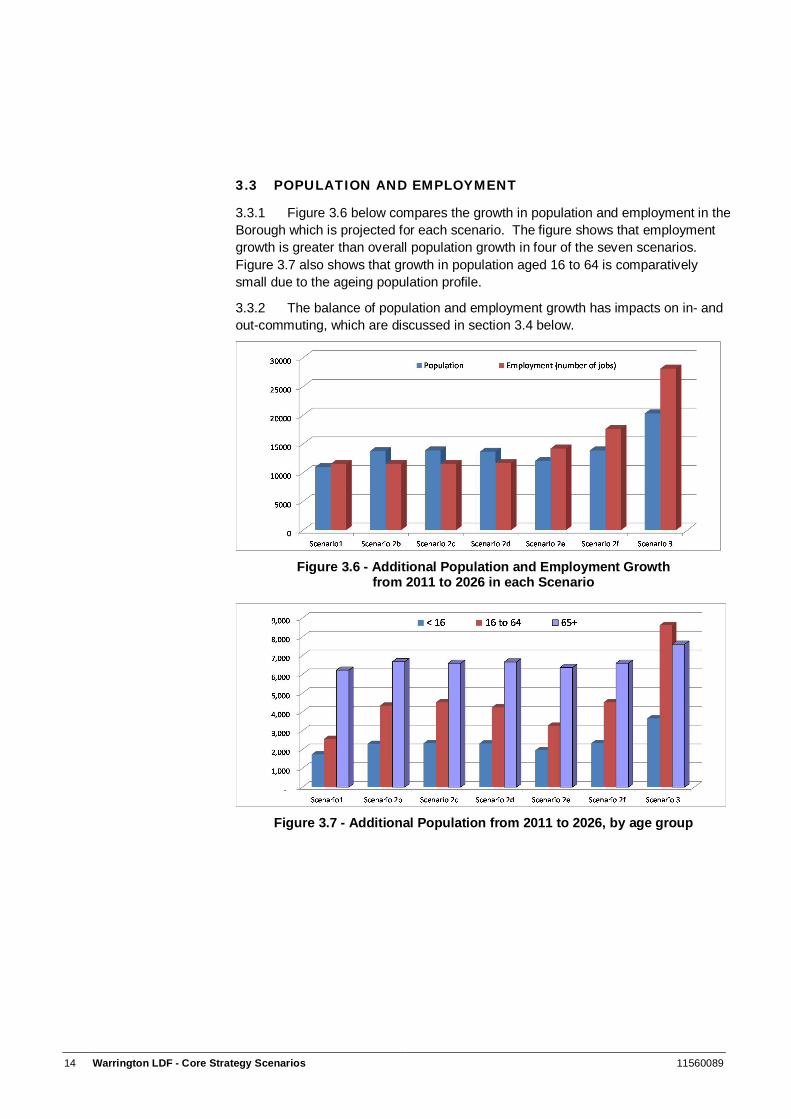
3.3 POPULATION AND EMPLOYMENT
3.3.1 Figure 3.6 below compares the growth in population and employment in the Borough which is projected for each scenario. The figure shows that employment growth is greater than overall population growth in four of the seven scenarios. Figure 3.7 also shows that growth in population aged 16 to 64 is comparatively small due to the ageing population profile.
3.3.2 The balance of population and employment growth has impacts on in- and out-commuting, which are discussed in section 3.4 below.
Figure 3.6 - Additional Population and Employment Growth
from 2011 to 2026 in each Scenario
Figure 3.7 - Additional Population from 2011 to 2026, by age group
11560089 Warrington LDF - Core Strategy Scenarios 15
3.4 HEADLINE FINDINGS FROM SCENARIO TESTS
3.4.1 The Warrington MMTM provides a tool to assess the relative impacts of the different development scenarios and their effect on travel demand, and hence Warrington’s road network. The model predicts for each scenario:
How many new journeys are created;
The overall travel patterns, i.e. how the destinations of trips by Warrington residents may change, and where employees are travelling from to reach employment.
The proportion of trips made by car, public transport or walk/cycle;
The routes chosen for these new journeys, and any negative impacts on congestion and journey times.
3.4.2 It should be noted however, what the modelling does not illustrate. The output does not infer that traffic levels on roads within the model network are appropriate or comment on any impact that the change in travel patterns may have on residential or public amenity and hence quality of life. Neither, at this stage does it include an assessment of environmental impact, for example from a noise or air quality perspective.
3.4.3 In the following text each of these aspects is considered in turn, highlighting the performance of the various scenarios.
3.5 NEW JOURNEYS AND TRAVEL PATTERNS
3.5.1 From Figure 3.6 it can be seen that Scenarios 2b-2e are similar in overall growth to Scenario 1, adding only relatively small amounts of trip generation in the context of the borough. The main difference is that Scenarios 2b-d add further residential development, causing population to grow more rapidly than employment, whereas 2e has higher employment growth with little change in population. Scenarios 2f and 3 have the highest overall development, and therefore can be expected to create the most demand for travel.
3.5.2 This balance between housing and employment growth is reflected in the overall movements to and from Warrington for each Scenario. Scenarios 2e, 2f and 3 all result in significantly more trips being attracted to Warrington from the surrounding areas, increasing the net inflow of traffic. The employment in Scenario 2e attracts approaching 300 additional trips to the Town Centre from outside Warrington in the AM peak hour (8-9am). Scenarios 2f and 3, attract 700 and 1,600 respectively.
3.5.3 Improving the balance of household and employment growth has clear benefits for sustainable transport, as it has the potential to reduce the proportion of trips within Warrington which start outside the borough. This increases the number of shorter distance trips within Warrington, which may be more easily undertaken by public transport walking and cycling. The increased Warrington population in Scenario 3 reduces the proportion of trips to Omega originating from outside the area from 61% of all additional trips to only 53%. This effect can also be seen in Scenarios 2b-2d, but to a lesser extent.
16 Warrington LDF - Core Strategy Scenarios 11560089
3.5.4 Considering the more detailed travel patterns for each scenario:
The Omega development has a strong attraction for trips from across the wider North-West, in all directions. However, the highest number of ‘in-commuting’ trips are attracted from St Helens and Merseyside.
Within Warrington, Omega attracts most trips from the north-west, including Chapelford and other adjacent residential areas. Analysis has shown that the potential for Omega to attract trips from south and east Warrington is currently limited. In particular, trips from the HCA sites are either largely contained in south Warrington, or alternatively travel by motorway to or in the direction of Manchester.
Other travel patterns within Warrington remain very stable. Just under 70% of trips to the town centre originate within the town for all scenarios, and the concentrations of trips to/from parts of the town remain similar.
3.6 JOURNEY LENGTHS
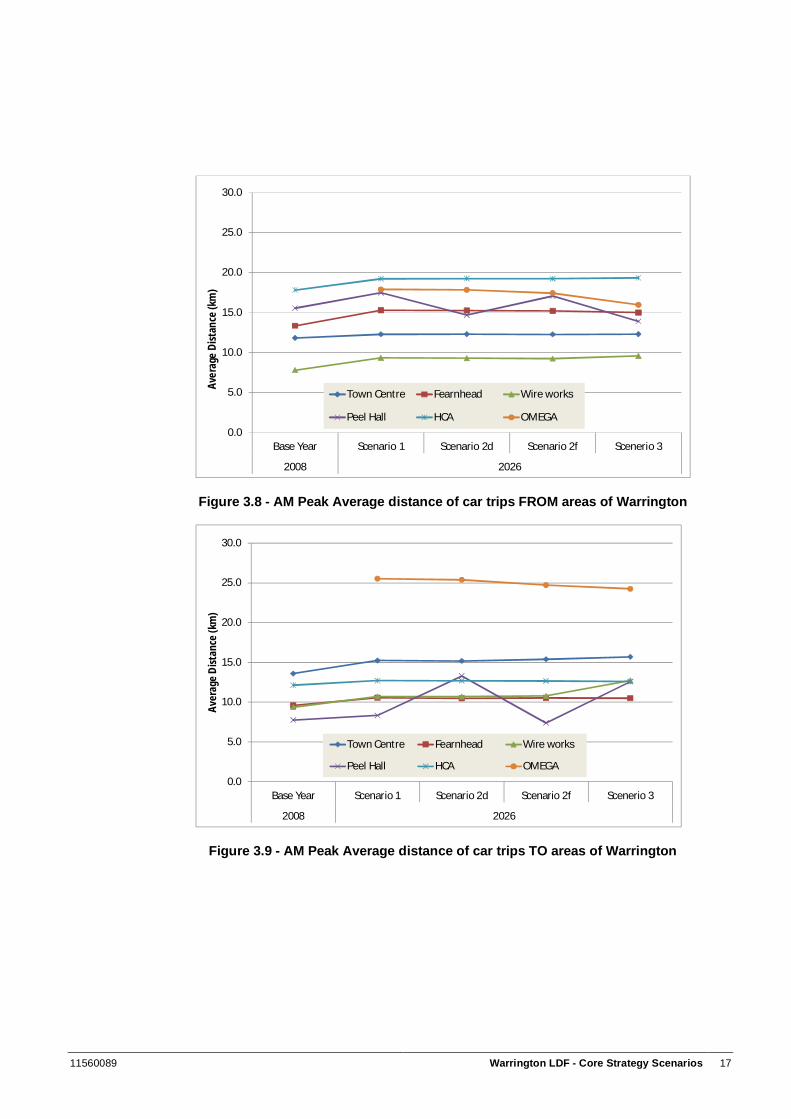
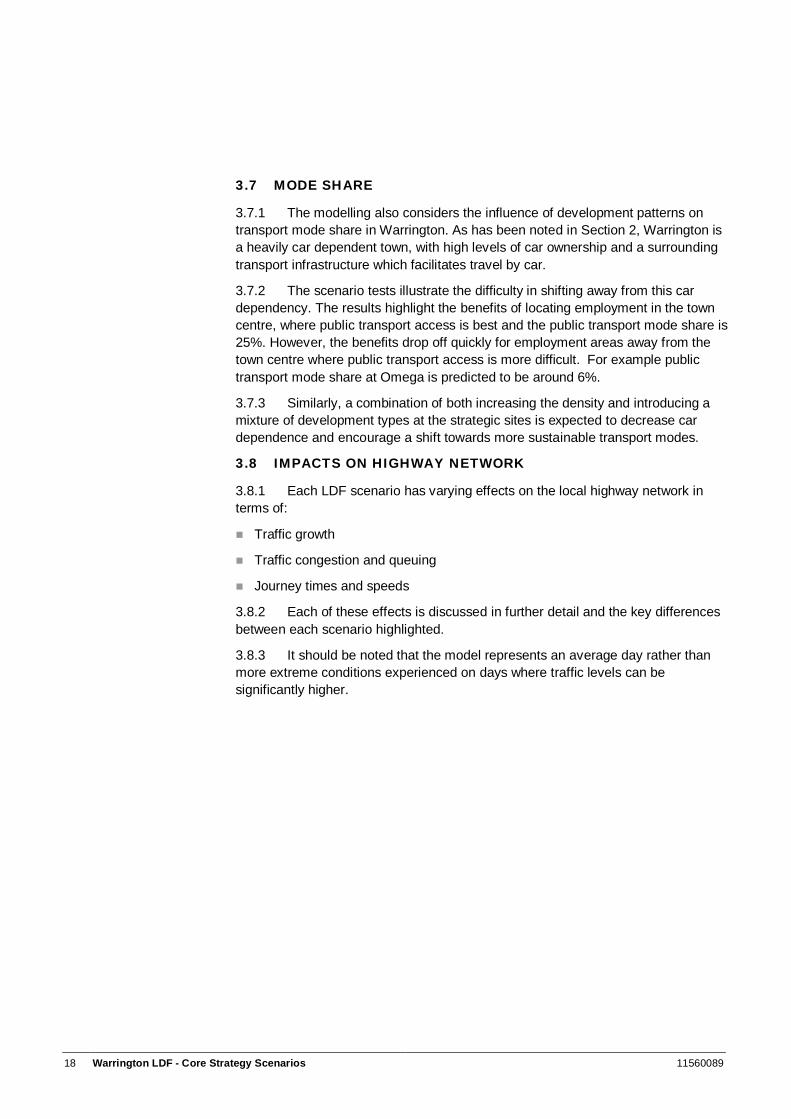
3.6.1 The effects of development scenarios on journey patterns are further demonstrated in the varying lengths of car trips to and from different areas of Warrington. Figure 3.8 and Figure 3.9 below show the average distance travelled to and from the Town Centre, Fearnhead (a residential area of NE Warrington chosen for illustrative purposes), the Winwick Street site, Peel Hall, the South Warrington HCA Sites and Omega respectively. Journey lengths in general are expected to increase slightly from the start year of 2008, this is a consequence of increased car ownership and more dispersed commuting patterns. Other significant changes in journey lengths reflect:
Development at Peel Hall in Scenarios 2d and 3 shortening trip lengths from this area, but lengthening trips TO the area;
The increasing size of the Omega development in Scenarios 2f and 3 leading to shorter trips for residents of the site, as they are able to take up more local work and leisure opportunities.
Omega attracting trips from further away than other parts of Warrington. However, the increased residential population in Scenarios 2c, 2d, 2f and 3 goes some way to alleviate this.
Residents of the HCA area travelling further than those in other parts of Warrington, mainly to Manchester as noted above.
11560089 Warrington LDF - Core Strategy Scenarios 17
Figure 3.8 - AM Peak Average distance of car trips FROM areas of Warrington
Figure 3.9 - AM Peak Average distance of car trips TO areas of Warrington
0.0
5.0
10.0
15.0
20.0
25.0
30.0
Base Year Scenario 1 Scenario 2d Scenario 2f Scenerio 3
2008 2026
Aver
age
Dist
ance
(km
)
Town Centre Fearnhead Wire works
Peel Hall HCA OMEGA
0.0
5.0
10.0
15.0
20.0
25.0
30.0
Base Year Scenario 1 Scenario 2d Scenario 2f Scenerio 3
2008 2026
Aver
age
Dist
ance
(km
)
Town Centre Fearnhead Wire works
Peel Hall HCA OMEGA
18 Warrington LDF - Core Strategy Scenarios 11560089
3.7 MODE SHARE
3.7.1 The modelling also considers the influence of development patterns on transport mode share in Warrington. As has been noted in Section 2, Warrington is a heavily car dependent town, with high levels of car ownership and a surrounding transport infrastructure which facilitates travel by car.
3.7.2 The scenario tests illustrate the difficulty in shifting away from this car dependency. The results highlight the benefits of locating employment in the town centre, where public transport access is best and the public transport mode share is 25%. However, the benefits drop off quickly for employment areas away from the town centre where public transport access is more difficult. For example public transport mode share at Omega is predicted to be around 6%.
3.7.3 Similarly, a combination of both increasing the density and introducing a mixture of development types at the strategic sites is expected to decrease car dependence and encourage a shift towards more sustainable transport modes.
3.8 IMPACTS ON HIGHWAY NETWORK
3.8.1 Each LDF scenario has varying effects on the local highway network in terms of:
Traffic growth
Traffic congestion and queuing
Journey times and speeds
3.8.2 Each of these effects is discussed in further detail and the key differences between each scenario highlighted.
3.8.3 It should be noted that the model represents an average day rather than more extreme conditions experienced on days where traffic levels can be significantly higher.
11560089 Warrington LDF - Core Strategy Scenarios 19
Traffic Growth in Warrington
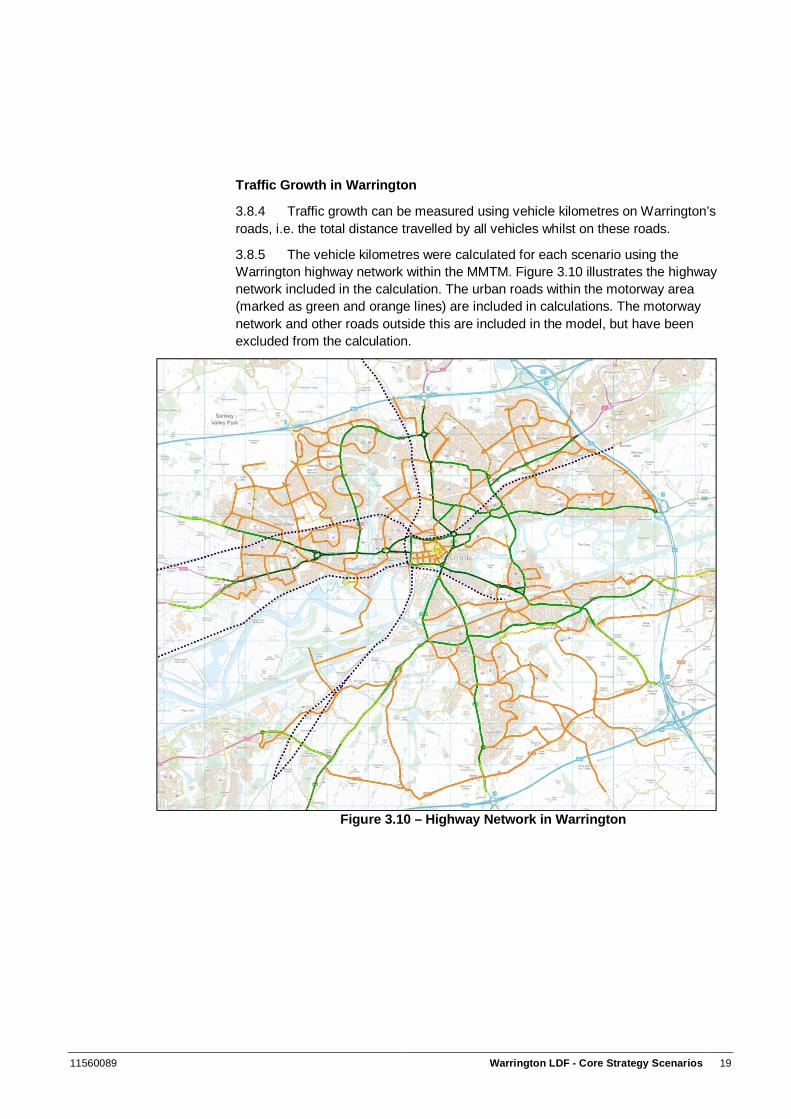
3.8.4 Traffic growth can be measured using vehicle kilometres on Warrington’s roads, i.e. the total distance travelled by all vehicles whilst on these roads.
3.8.5 The vehicle kilometres were calculated for each scenario using the Warrington highway network within the MMTM. Figure 3.10 illustrates the highway network included in the calculation. The urban roads within the motorway area (marked as green and orange lines) are included in calculations. The motorway network and other roads outside this are included in the model, but have been excluded from the calculation.
Figure 3.10 – Highway Network in Warrington
20 Warrington LDF - Core Strategy Scenarios 11560089
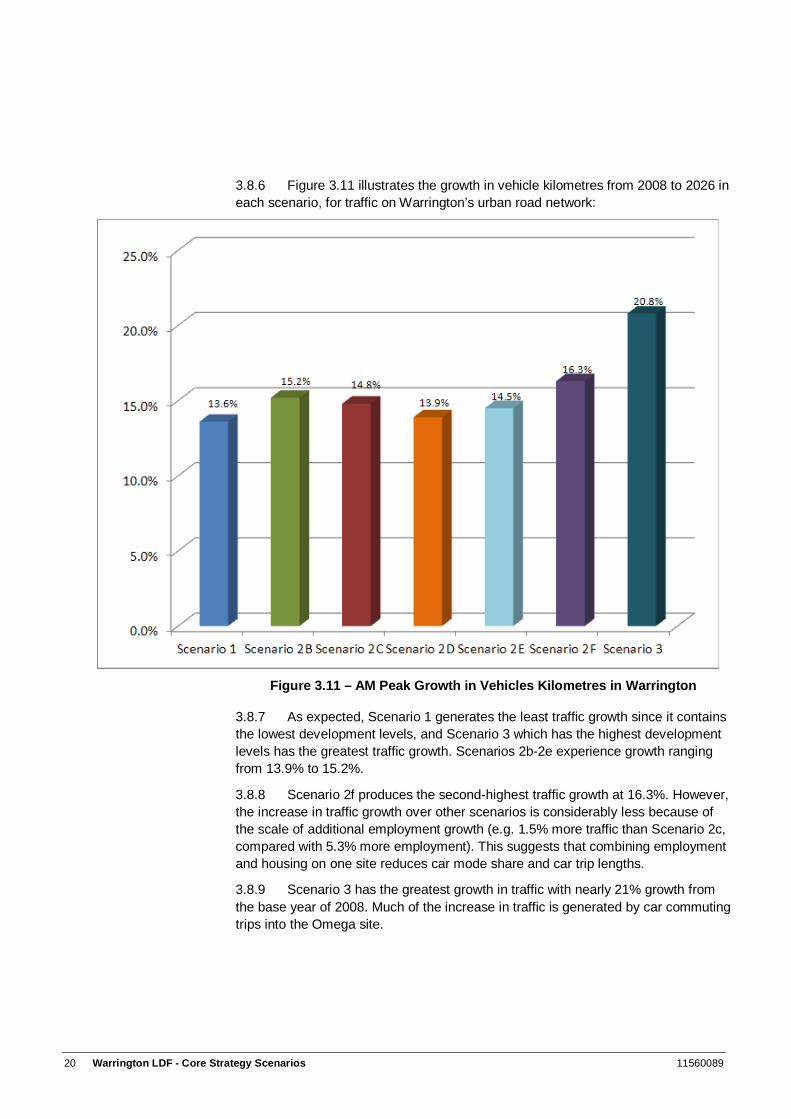
3.8.6 Figure 3.11 illustrates the growth in vehicle kilometres from 2008 to 2026 in each scenario, for traffic on Warrington’s urban road network:
Figure 3.11 – AM Peak Growth in Vehicles Kilometres in Warrington
3.8.7 As expected, Scenario 1 generates the least traffic growth since it contains the lowest development levels, and Scenario 3 which has the highest development levels has the greatest traffic growth. Scenarios 2b-2e experience growth ranging from 13.9% to 15.2%.
3.8.8 Scenario 2f produces the second-highest traffic growth at 16.3%. However, the increase in traffic growth over other scenarios is considerably less because of the scale of additional employment growth (e.g. 1.5% more traffic than Scenario 2c, compared with 5.3% more employment). This suggests that combining employment and housing on one site reduces car mode share and car trip lengths.
3.8.9 Scenario 3 has the greatest growth in traffic with nearly 21% growth from the base year of 2008. Much of the increase in traffic is generated by car commuting trips into the Omega site.
11560089 Warrington LDF - Core Strategy Scenarios 21
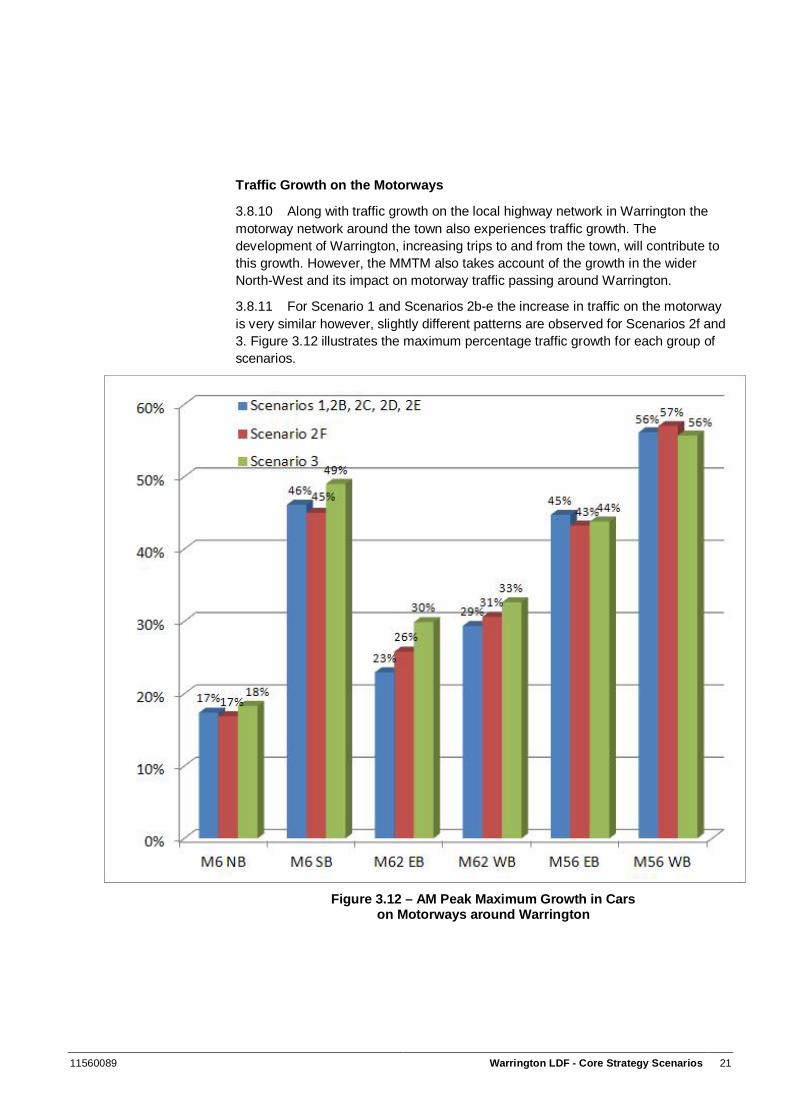
Traffic Growth on the Motorways
3.8.10 Along with traffic growth on the local highway network in Warrington the motorway network around the town also experiences traffic growth. The development of Warrington, increasing trips to and from the town, will contribute to this growth. However, the MMTM also takes account of the growth in the wider North-West and its impact on motorway traffic passing around Warrington.
3.8.11 For Scenario 1 and Scenarios 2b-e the increase in traffic on the motorway is very similar however, slightly different patterns are observed for Scenarios 2f and 3. Figure 3.12 illustrates the maximum percentage traffic growth for each group of scenarios.
Figure 3.12 – AM Peak Maximum Growth in Cars
on Motorways around Warrington
22 Warrington LDF - Core Strategy Scenarios 11560089
3.8.12 The graph above shows that on the M6 the growth in traffic is very similar between all scenarios, with a greater increase in southbound traffic compared to northbound. The model shows that in the AM peak the M6 Southbound has more capacity available for traffic growth compared to the M6 Northbound which is closer to full capacity. On the M62 in both directions the maximum traffic growth in the eastbound direction occurs between junctions 7 and 8 and in the westbound direction between junctions 8 and 9.
3.8.13 As expected, Scenario 3 results in the greatest motorway traffic growth compared to the other scenarios. However growth in traffic on the M56 is very similar between scenarios with 43-44% growth at junction 9 in the eastbound direction and 56-57% growth in the westbound direction. The strong similarity in traffic growth between scenarios is to be expected, because a significant proportion of growth is strategic and not related to Warrington as an origin or destination However, the potential operational impacts of these increases will be examined in the future stages of modelling work.
Traffic Congestion and Queuing
3.8.14 Traffic congestion and queuing were assessed in each scenario to examine whether significant problems were generated on the local highway network. The queues represented below are at the downstream locations where traffic demand exceeds the capacity of the road section. This queuing is more severe than, for example, stop-start or slow moving traffic experienced in heavy traffic conditions or conditions typical to those experienced at traffic signal controlled junctions. In addition the levels of queuing shown are average during the peak hour and as such could be expected to exceed the levels shown at periods within the peak hour.
11560089 Warrington LDF - Core Strategy Scenarios 23
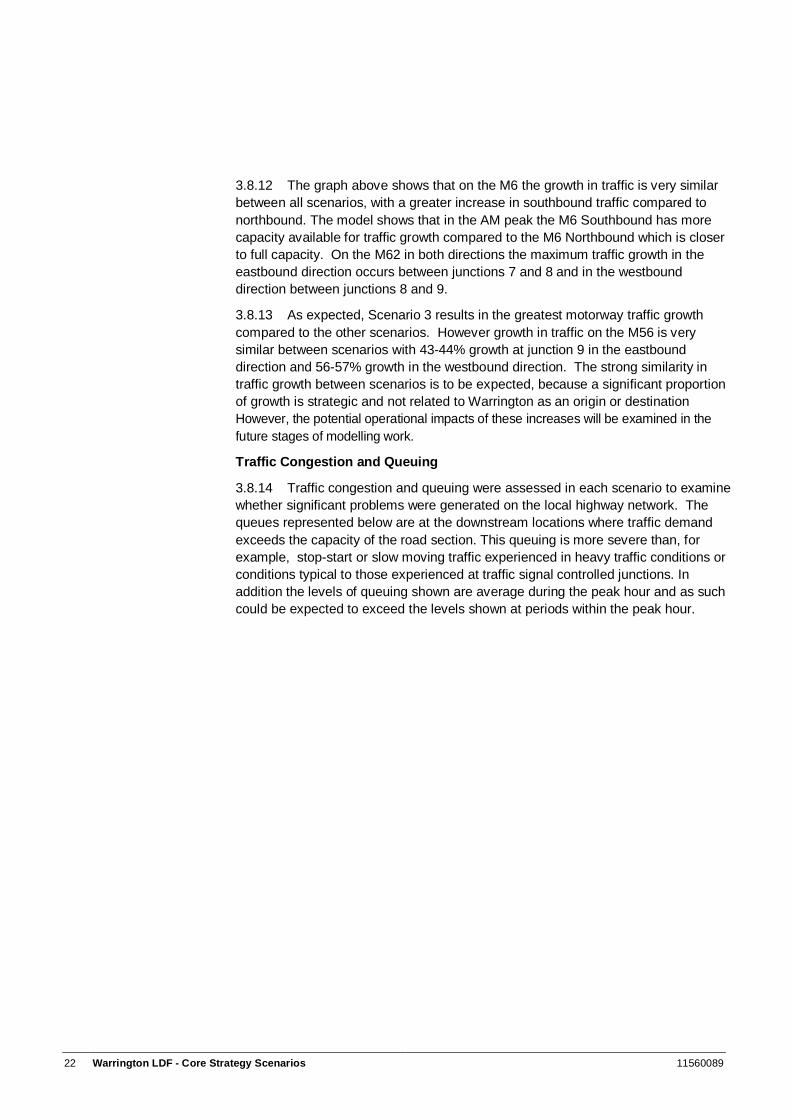
3.8.15 The most significant congestion occurs in Scenario 3 when Phases 3, 4 and 5 of Omega come forward in their totality as a mixed use site, comprising housing, employment, hospital and University, as opposed to the partial development of the phases for only housing and employment uses modelled in Scenario 2f. As a result traffic queuing occurs in the AM peak (8:00-9:00) along A57 Liverpool Road as well as on Burtonwood Road, Whittle Avenue and Lingley Green Avenue. The queues of traffic are predicted to be up to 80 vehicles long (see Figure 3.13). It should be noted that site access and internal highway networks have not been considered in detail in this scenario testing.
Figure 3.13 – AM Peak Scenario 3 Traffic Queues (in vehicles)
24 Warrington LDF - Core Strategy Scenarios 11560089
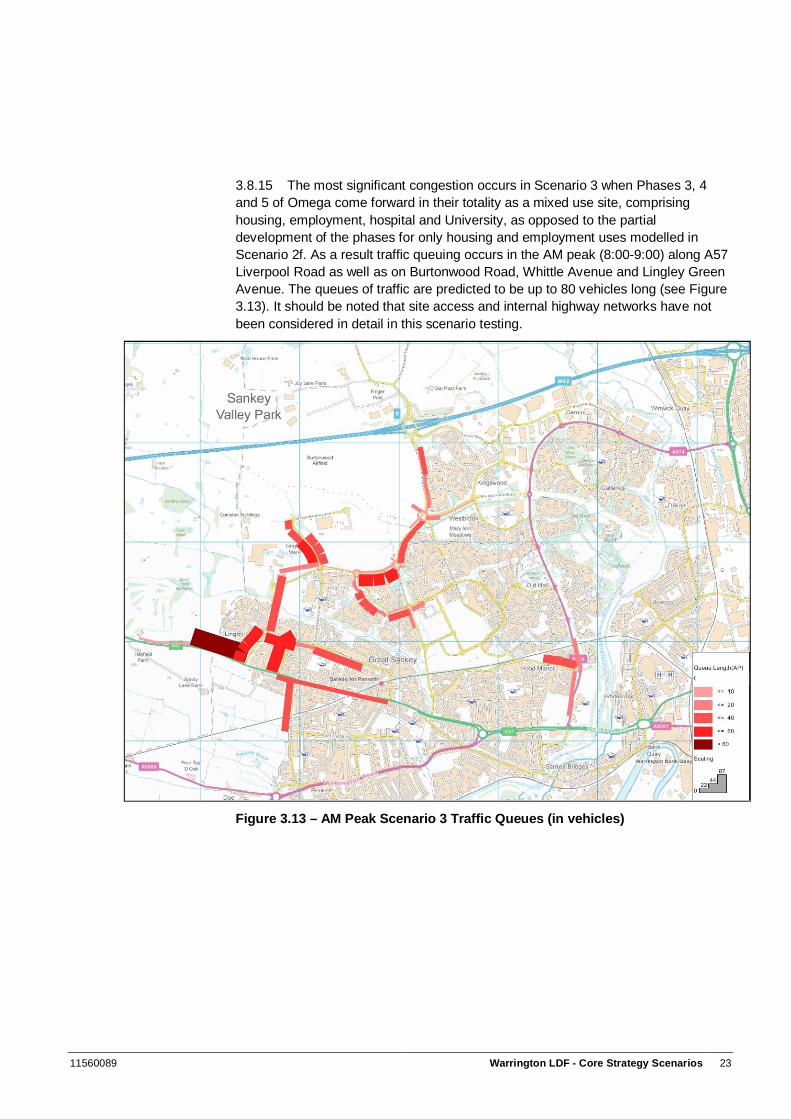
3.8.16 Figure 3.14 illustrates the traffic queues generated around Omega in Scenario 2f, where a more traditional employment land use pattern for Omega Phase 3, 4 and 5 is assumed. In this scenario traffic queuing around Omega is less severe than scenario 3, but there is still queuing along the A57,(55 vehicles), and on Lingley Green Avenue, Whittle Avenue and Burtonwood Road. In Scenario 2c, where there is residential development at Omega but no further employment, the queues are again less severe.
Figure 3.14 – AM Peak Scenario 2f Traffic Queues (in vehicles)
3.8.17 The figure above shows that queues of up to 55 vehicles are experienced along A57 Liverpool Road and there are around 30 vehicles queuing on Whittle Avenue.
11560089 Warrington LDF - Core Strategy Scenarios 25
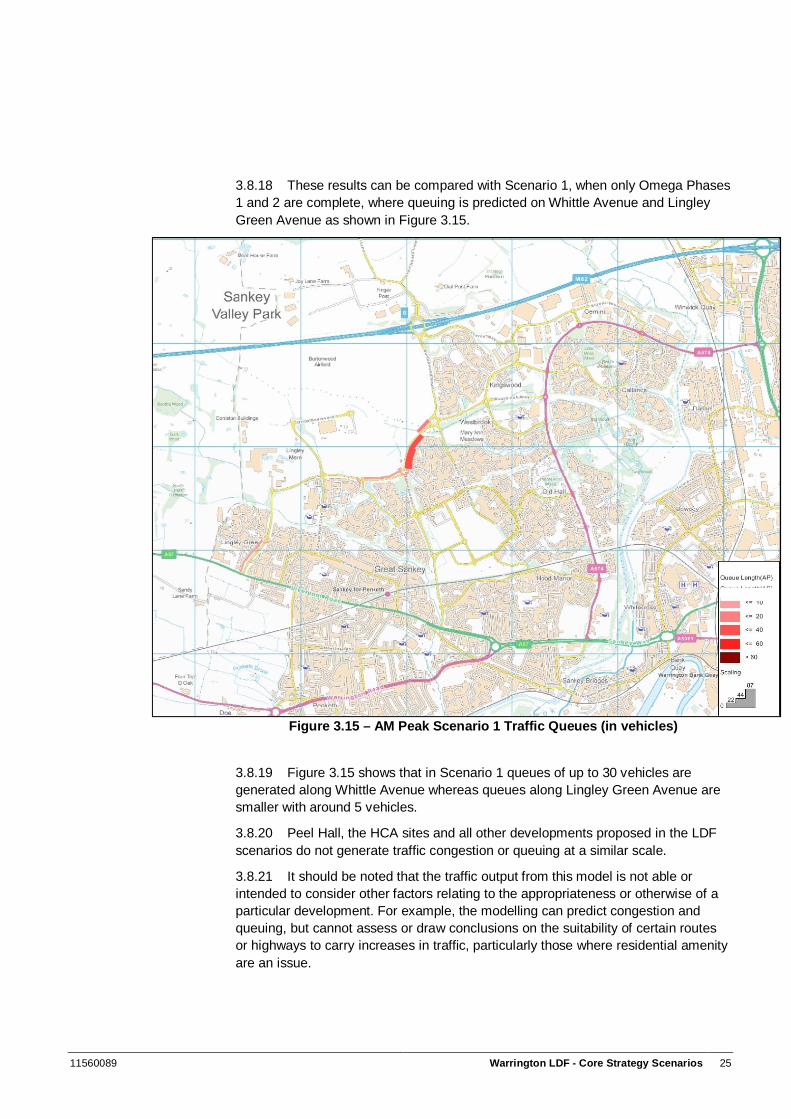
3.8.18 These results can be compared with Scenario 1, when only Omega Phases 1 and 2 are complete, where queuing is predicted on Whittle Avenue and Lingley Green Avenue as shown in Figure 3.15.
Figure 3.15 – AM Peak Scenario 1 Traffic Queues (in vehicles)
3.8.19 Figure 3.15 shows that in Scenario 1 queues of up to 30 vehicles are generated along Whittle Avenue whereas queues along Lingley Green Avenue are smaller with around 5 vehicles.
3.8.20 Peel Hall, the HCA sites and all other developments proposed in the LDF scenarios do not generate traffic congestion or queuing at a similar scale.
3.8.21 It should be noted that the traffic output from this model is not able or intended to consider other factors relating to the appropriateness or otherwise of a particular development. For example, the modelling can predict congestion and queuing, but cannot assess or draw conclusions on the suitability of certain routes or highways to carry increases in traffic, particularly those where residential amenity are an issue.
26 Warrington LDF - Core Strategy Scenarios 11560089
Traffic flow and highway classification
3.8.22 As well as calculating levels of congestion and journey time, it is informative to establish the change in traffic flow on certain key roads within the model. In particular, roads adjacent to key development sites are likely to experience significant increases in traffic flows, which may change their character.
3.8.23 Table 3.2 to Table 3.7 below, provides examples for each scenario of changes in AM peak (8:00-9:00) traffic flow for roads in the immediate vicinity of the strategic locations considered.
3.8.24 To illustrate this, the tables below show the traffic flow changes on links adjacent to key development sites for each scenario, compared to the Base Year and Scenario 1.
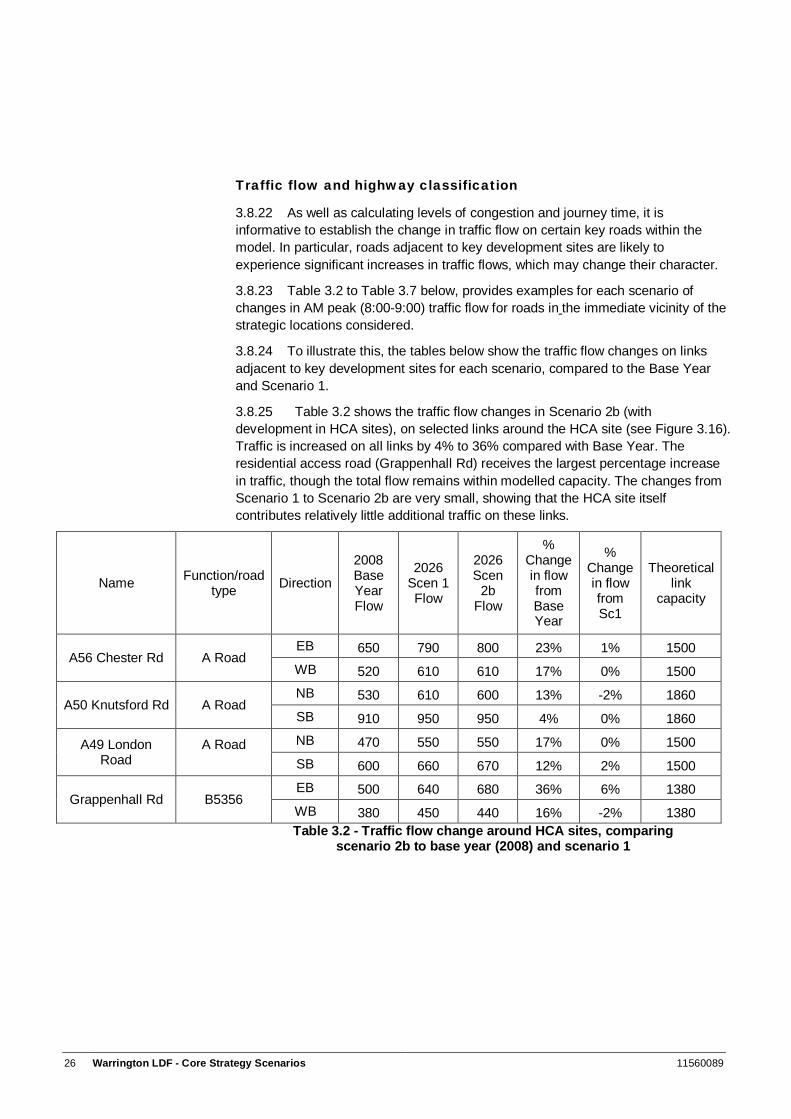
3.8.25 Table 3.2 shows the traffic flow changes in Scenario 2b (with development in HCA sites), on selected links around the HCA site (see Figure 3.16). Traffic is increased on all links by 4% to 36% compared with Base Year. The residential access road (Grappenhall Rd) receives the largest percentage increase in traffic, though the total flow remains within modelled capacity. The changes from Scenario 1 to Scenario 2b are very small, showing that the HCA site itself contributes relatively little additional traffic on these links.
Name Function/road type Direction
2008 Base Year Flow
2026 Scen 1 Flow
2026 Scen
2b Flow
% Change in flow from Base Year
% Change in flow from Sc1
Theoretical link
capacity
A56 Chester Rd A Road EB 650 790 800 23% 1% 1500 WB 520 610 610 17% 0% 1500
A50 Knutsford Rd A Road NB 530 610 600 13% -2% 1860 SB 910 950 950 4% 0% 1860
A49 London Road
A Road
NB 470 550 550 17% 0% 1500 SB 600 660 670 12% 2% 1500
Grappenhall Rd B5356 EB 500 640 680 36% 6% 1380 WB 380 450 440 16% -2% 1380 Table 3.2 - Traffic flow change around HCA sites, comparing
scenario 2b to base year (2008) and scenario 1
11560089 Warrington LDF - Core Strategy Scenarios 27
Figure 3.16 – Selected links (red) adjacent to site HCA
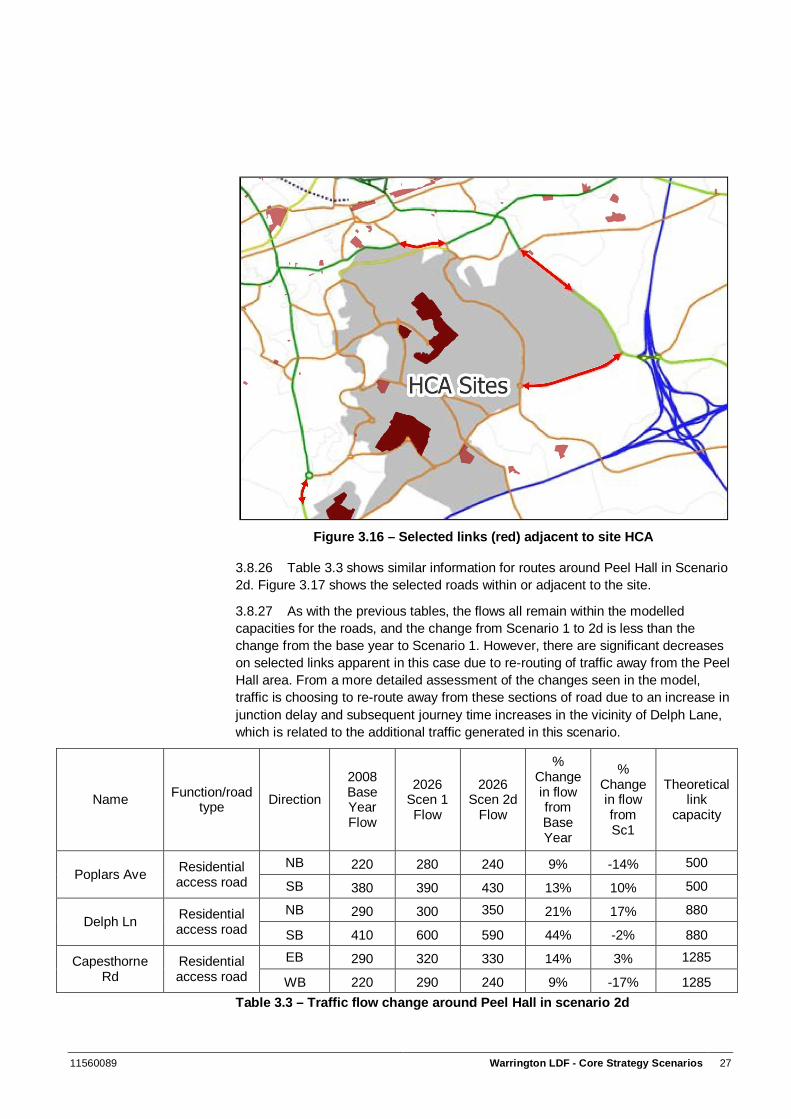
3.8.26 Table 3.3 shows similar information for routes around Peel Hall in Scenario 2d. Figure 3.17 shows the selected roads within or adjacent to the site.
3.8.27 As with the previous tables, the flows all remain within the modelled capacities for the roads, and the change from Scenario 1 to 2d is less than the change from the base year to Scenario 1. However, there are significant decreases on selected links apparent in this case due to re-routing of traffic away from the Peel Hall area. From a more detailed assessment of the changes seen in the model, traffic is choosing to re-route away from these sections of road due to an increase in junction delay and subsequent journey time increases in the vicinity of Delph Lane, which is related to the additional traffic generated in this scenario.
Name Function/road type Direction
2008 Base Year Flow
2026 Scen 1 Flow
2026 Scen 2d
Flow
% Change in flow from Base Year
% Change in flow from Sc1
Theoretical link
capacity
Poplars Ave Residential access road
NB 220 280 240 9% -14% 500
SB 380 390 430 13% 10% 500
Delph Ln Residential access road
NB 290 300 350 21% 17% 880
SB 410 600 590 44% -2% 880
Capesthorne Rd
Residential access road
EB 290 320 330 14% 3% 1285
WB 220 290 240 9% -17% 1285 Table 3.3 – Traffic flow change around Peel Hall in scenario 2d
28 Warrington LDF - Core Strategy Scenarios 11560089
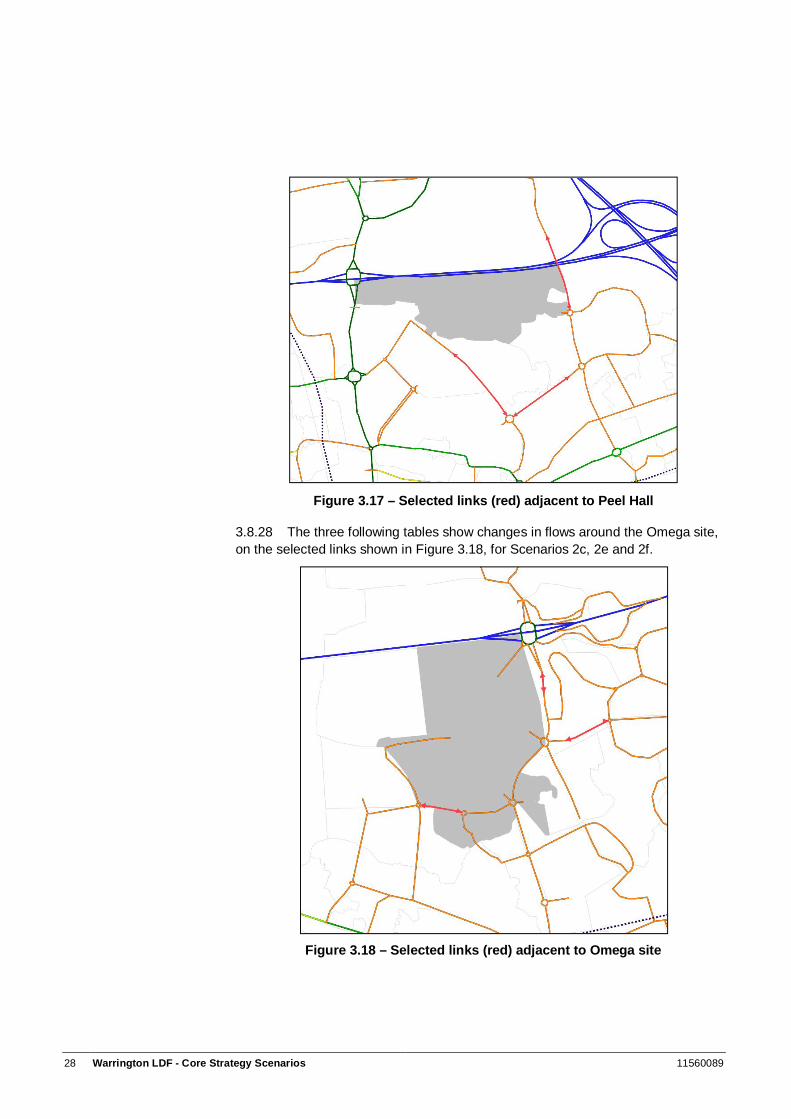
Figure 3.17 – Selected links (red) adjacent to Peel Hall
3.8.28 The three following tables show changes in flows around the Omega site, on the selected links shown in Figure 3.18, for Scenarios 2c, 2e and 2f.
Figure 3.18 – Selected links (red) adjacent to Omega site
11560089 Warrington LDF - Core Strategy Scenarios 29
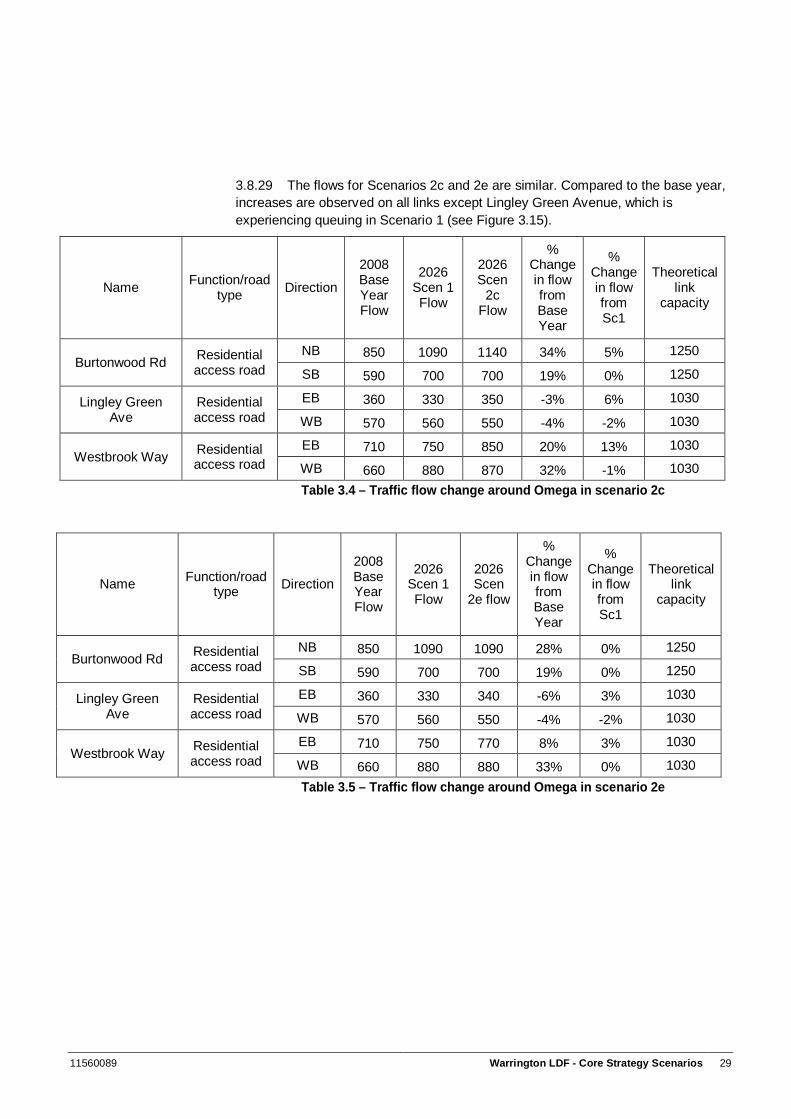
3.8.29 The flows for Scenarios 2c and 2e are similar. Compared to the base year, increases are observed on all links except Lingley Green Avenue, which is experiencing queuing in Scenario 1 (see Figure 3.15).
Name Function/road type Direction
2008 Base Year Flow
2026 Scen 1 Flow
2026 Scen
2c Flow
% Change in flow from Base Year
% Change in flow from Sc1
Theoretical link
capacity
Burtonwood Rd Residential access road
NB 850 1090 1140 34% 5% 1250
SB 590 700 700 19% 0% 1250
Lingley Green Ave
Residential access road
EB 360 330 350 -3% 6% 1030
WB 570 560 550 -4% -2% 1030
Westbrook Way Residential access road
EB 710 750 850 20% 13% 1030
WB 660 880 870 32% -1% 1030 Table 3.4 – Traffic flow change around Omega in scenario 2c
Name Function/road type Direction
2008 Base Year Flow
2026 Scen 1 Flow
2026 Scen
2e flow
% Change in flow from Base Year
% Change in flow from Sc1
Theoretical link
capacity
Burtonwood Rd Residential access road
NB 850 1090 1090 28% 0% 1250
SB 590 700 700 19% 0% 1250
Lingley Green Ave
Residential access road
EB 360 330 340 -6% 3% 1030
WB 570 560 550 -4% -2% 1030
Westbrook Way Residential access road
EB 710 750 770 8% 3% 1030
WB 660 880 880 33% 0% 1030 Table 3.5 – Traffic flow change around Omega in scenario 2e
30 Warrington LDF - Core Strategy Scenarios 11560089
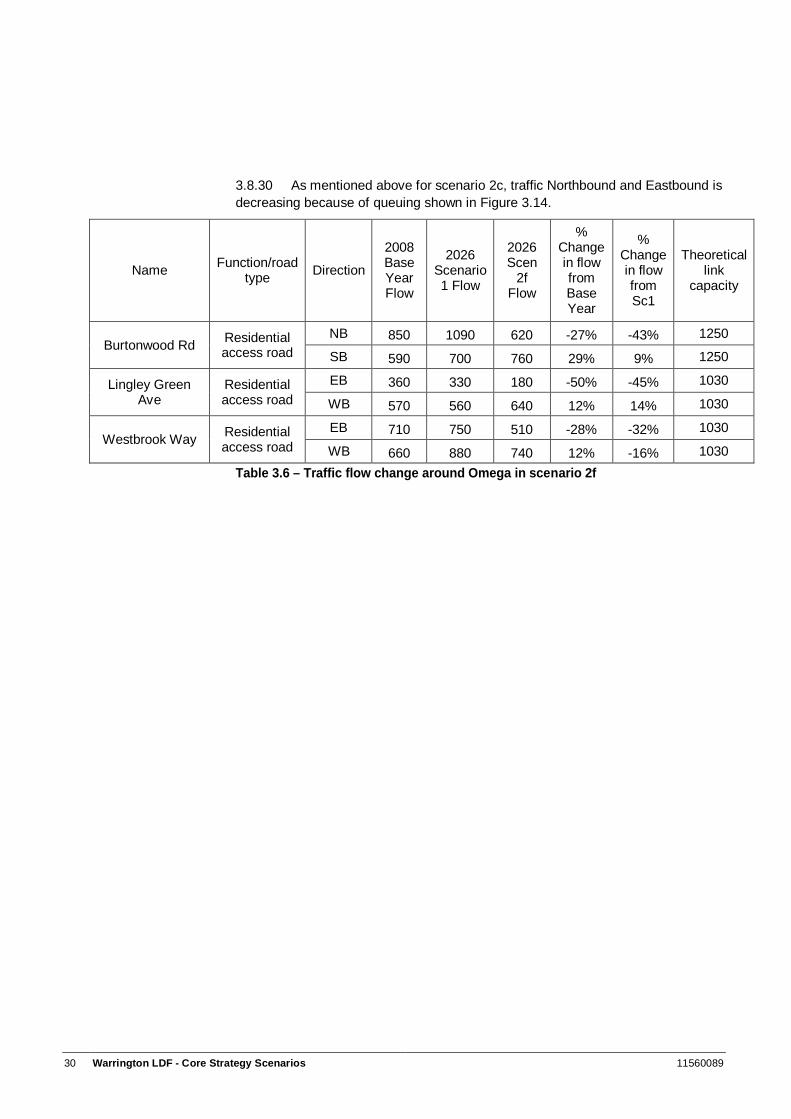
3.8.30 As mentioned above for scenario 2c, traffic Northbound and Eastbound is decreasing because of queuing shown in Figure 3.14.
Name Function/road type Direction
2008 Base Year Flow
2026 Scenario 1 Flow
2026 Scen
2f Flow
% Change in flow from Base Year
% Change in flow from Sc1
Theoretical link
capacity
Burtonwood Rd Residential access road
NB 850 1090 620 -27% -43% 1250
SB 590 700 760 29% 9% 1250
Lingley Green Ave
Residential access road
EB 360 330 180 -50% -45% 1030
WB 570 560 640 12% 14% 1030
Westbrook Way Residential access road
EB 710 750 510 -28% -32% 1030
WB 660 880 740 12% -16% 1030 Table 3.6 – Traffic flow change around Omega in scenario 2f
11560089 Warrington LDF - Core Strategy Scenarios 31
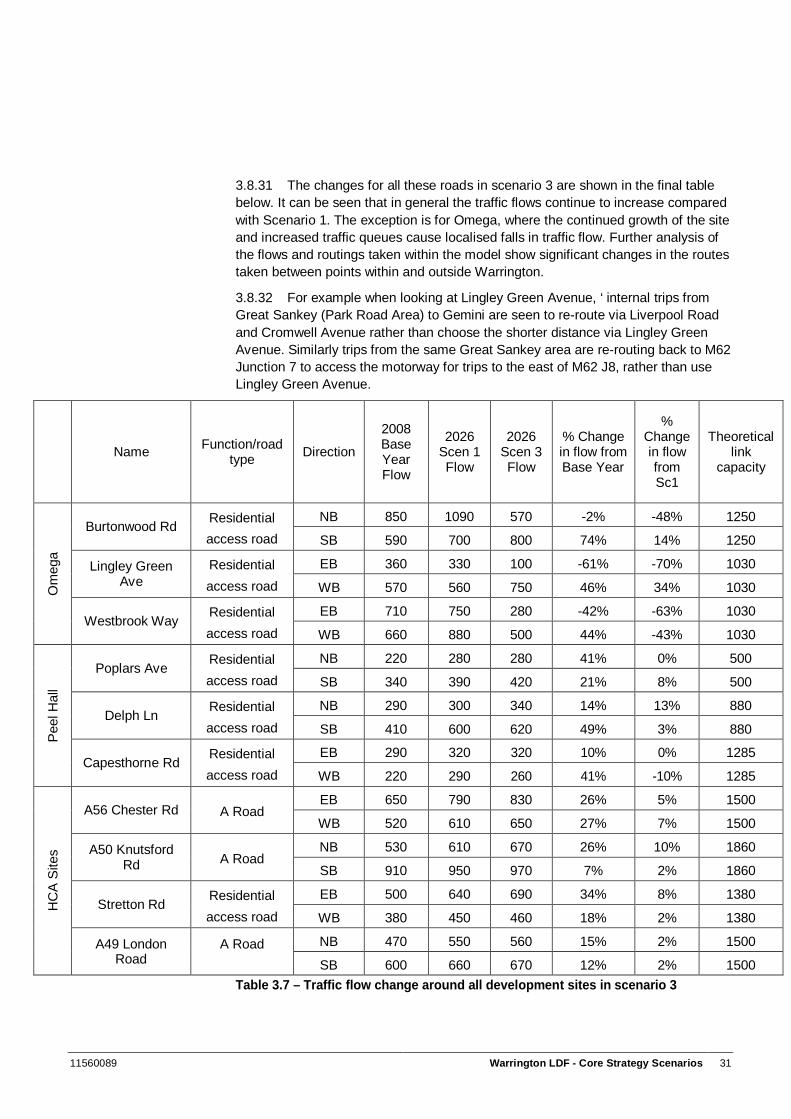
3.8.31 The changes for all these roads in scenario 3 are shown in the final table below. It can be seen that in general the traffic flows continue to increase compared with Scenario 1. The exception is for Omega, where the continued growth of the site and increased traffic queues cause localised falls in traffic flow. Further analysis of the flows and routings taken within the model show significant changes in the routes taken between points within and outside Warrington.
3.8.32 For example when looking at Lingley Green Avenue, ‘ internal trips from Great Sankey (Park Road Area) to Gemini are seen to re-route via Liverpool Road and Cromwell Avenue rather than choose the shorter distance via Lingley Green Avenue. Similarly trips from the same Great Sankey area are re-routing back to M62 Junction 7 to access the motorway for trips to the east of M62 J8, rather than use Lingley Green Avenue.
Name Function/road type Direction
2008 Base Year Flow
2026 Scen 1 Flow
2026 Scen 3 Flow
% Change in flow from Base Year
% Change in flow from Sc1
Theoretical link
capacity
Om
ega
Burtonwood Rd Residential access road
NB 850 1090 570 -2% -48% 1250
SB 590 700 800 74% 14% 1250
Lingley Green Ave
Residential access road
EB 360 330 100 -61% -70% 1030
WB 570 560 750 46% 34% 1030
Westbrook Way Residential access road
EB 710 750 280 -42% -63% 1030
WB 660 880 500 44% -43% 1030
Pee
l Hal
l
Poplars Ave Residential access road
NB 220 280 280 41% 0% 500
SB 340 390 420 21% 8% 500
Delph Ln Residential access road
NB 290 300 340 14% 13% 880
SB 410 600 620 49% 3% 880
Capesthorne Rd Residential access road
EB 290 320 320 10% 0% 1285
WB 220 290 260 41% -10% 1285
HC
A S
ites
A56 Chester Rd A Road EB 650 790 830 26% 5% 1500
WB 520 610 650 27% 7% 1500
A50 Knutsford Rd A Road
NB 530 610 670 26% 10% 1860
SB 910 950 970 7% 2% 1860
Stretton Rd Residential access road
EB 500 640 690 34% 8% 1380
WB 380 450 460 18% 2% 1380
A49 London Road
A Road
NB 470 550 560 15% 2% 1500
SB 600 660 670 12% 2% 1500 Table 3.7 – Traffic flow change around all development sites in scenario 3
32 Warrington LDF - Core Strategy Scenarios 11560089
Journey Times and Speeds
3.8.33 This section considered the effect that each scenario has on the time it takes to travel around Warrington on both the local and strategic highway network.
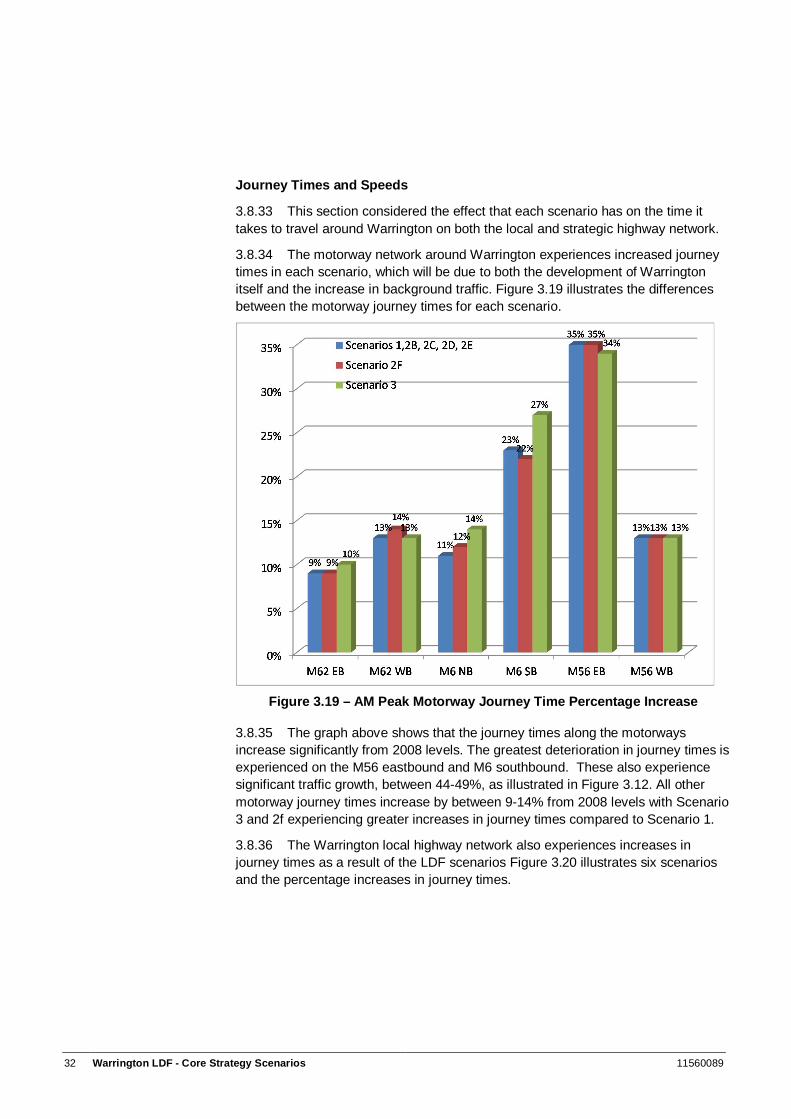
3.8.34 The motorway network around Warrington experiences increased journey times in each scenario, which will be due to both the development of Warrington itself and the increase in background traffic. Figure 3.19 illustrates the differences between the motorway journey times for each scenario.
Figure 3.19 – AM Peak Motorway Journey Time Percentage Increase
3.8.35 The graph above shows that the journey times along the motorways increase significantly from 2008 levels. The greatest deterioration in journey times is experienced on the M56 eastbound and M6 southbound. These also experience significant traffic growth, between 44-49%, as illustrated in Figure 3.12. All other motorway journey times increase by between 9-14% from 2008 levels with Scenario 3 and 2f experiencing greater increases in journey times compared to Scenario 1.
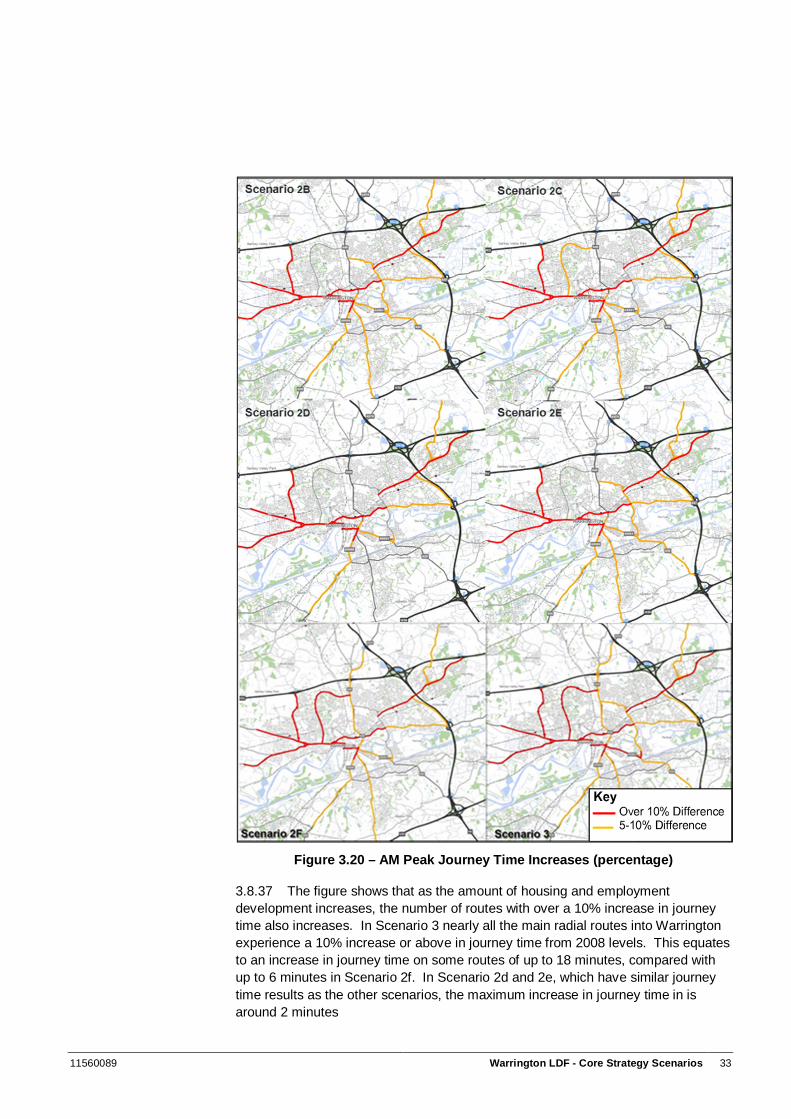
3.8.36 The Warrington local highway network also experiences increases in journey times as a result of the LDF scenarios Figure 3.20 illustrates six scenarios and the percentage increases in journey times.
11560089 Warrington LDF - Core Strategy Scenarios 33
Figure 3.20 – AM Peak Journey Time Increases (percentage)
3.8.37 The figure shows that as the amount of housing and employment development increases, the number of routes with over a 10% increase in journey time also increases. In Scenario 3 nearly all the main radial routes into Warrington experience a 10% increase or above in journey time from 2008 levels. This equates to an increase in journey time on some routes of up to 18 minutes, compared with up to 6 minutes in Scenario 2f. In Scenario 2d and 2e, which have similar journey time results as the other scenarios, the maximum increase in journey time in is around 2 minutes
34 Warrington LDF - Core Strategy Scenarios 11560089
4 Conclusions and Next Steps
4.1 SUMMARY OF KEY IMPACTS
4.1.1 The construction of the modelling scenarios and testing within the MMTM has been extremely helpful in clarifying the development options and their overall impacts on Warrington’s transport system.
4.1.2 It is evident from the results that both the scale and location of development will impact on the future transport demand, and on the ability of the transport system to cope with this demand.
4.1.3 The balance of household and employment growth, both overall and at specific sites, requires careful consideration. The development of Phases 3, 4 and 5 of the Omega scheme, as represented in Scenario 3, contains elements of mixed land use but the effects are dominated by high employment growth. The tests illustrate that the levels of employment growth have the potential to cause very high levels of car-based in-commuting to Warrington. This is mitigated to some extent in Scenario 2f where a more traditional employment land use pattern is tested.
4.2 NEXT STEPS
4.2.1 Following the review of these results, it is planned to use the MMTM to test specific interventions which will mitigate transport impacts. This will include measures related to specific developments such as Omega, as well as more general enhancements to Warrington’s transport infrastructure and services. These tests will be used to further inform the Local Development Framework, specifically by providing the evidence necessary to safeguard land for routes for transport infrastructure considered necessary to support development through an Allocations Development Plan Document.
4.2.2 A further document will be published dealing with the results of these tests.


![in Metal-Organic Coordination Networks arXiv:1412.6898v1 ... · arXiv:1412.6898v1 [physics.chem-ph] 22 Dec 2014 Modelling Ferro- and Antiferromagnetic Interactions in Metal-Organic](https://img.pdfslide.net/doc/110x75/608cdd9bbb36bf42a6109ee9/in-metal-organic-coordination-networks-arxiv14126898v1-arxiv14126898v1-.jpg)