Embed Size (px)
Citation preview
TRANSPORT
STATISTICS
2002
National Statistics Office - Malta 2002
Published by the National Statistics Office
Lascaris Valletta Malta
Tel.: (+356) 21223221/5 Fax:(+356) 21249841/ 21248483
e-mail: [email protected] website: http://www.nso.gov.mt
CIP Data Transport Statistics 2002. – Valletta: National Statistics Office, 2002 vi, 40p. ISBN 99909-81-85-X ISSN 1681-780X For further information, please contact: Transport Statistics Unit National Statistics Office Lascaris Valletta CMR 02 Malta Tel: (+356) 21239450 / 25597610 Our publications are available from: The Data Shop Department of Information National Statistics Office 3 Castille Place Lascaris Valletta Valletta CMR 02 Tel.: (+356) 21239225 / (+356) 25997210 Tel.: (+356) 21224901 Fax: (+356) 21249841 Fax: (+356) 21237170 Printed in Malta by the Government Printing Press
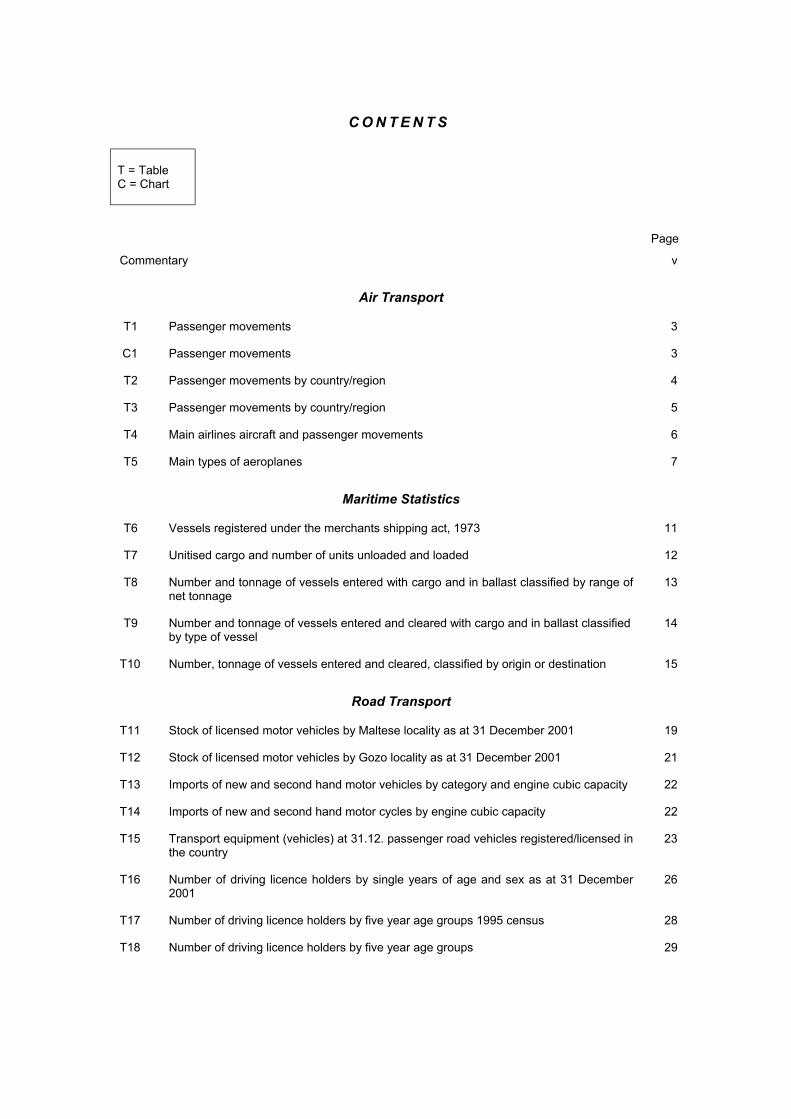
C O N T E N T S
T = Table C = Chart Page
Commentary v
Air Transport
T1 Passenger movements 3
C1 Passenger movements 3
T2 Passenger movements by country/region 4
T3 Passenger movements by country/region 5
T4 Main airlines aircraft and passenger movements 6
T5 Main types of aeroplanes 7
Maritime Statistics
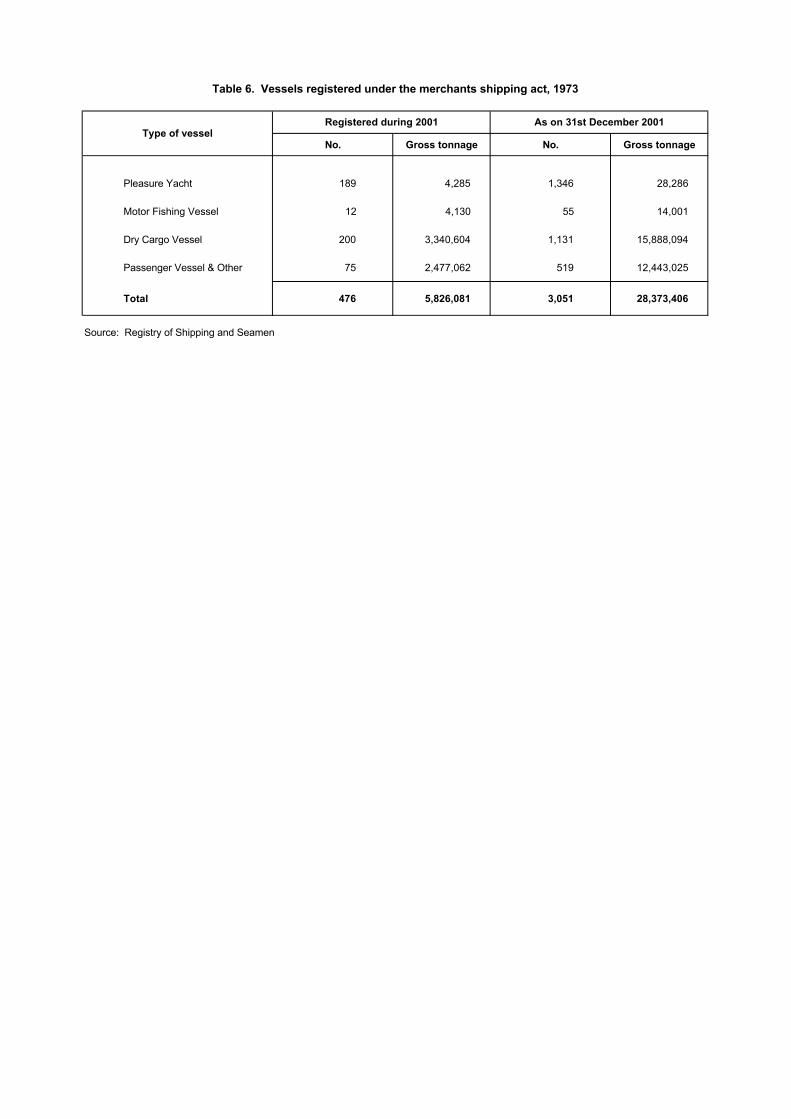
T6 Vessels registered under the merchants shipping act, 1973 11
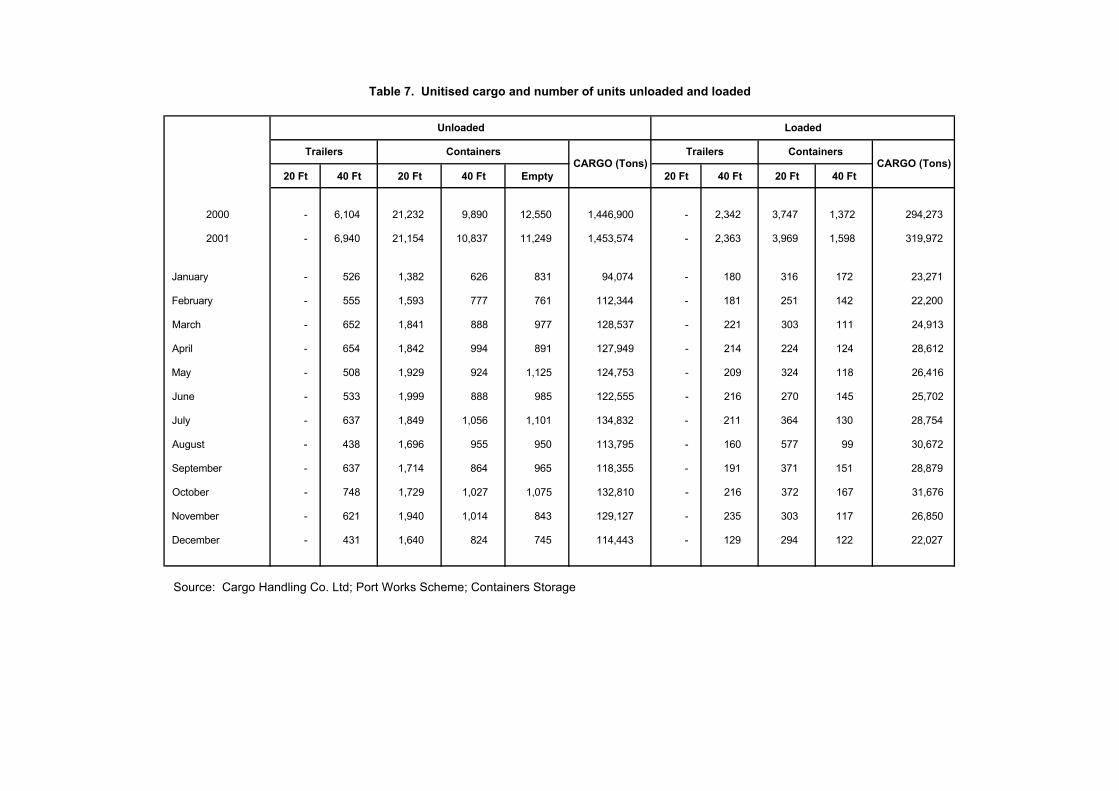
T7 Unitised cargo and number of units unloaded and loaded 12
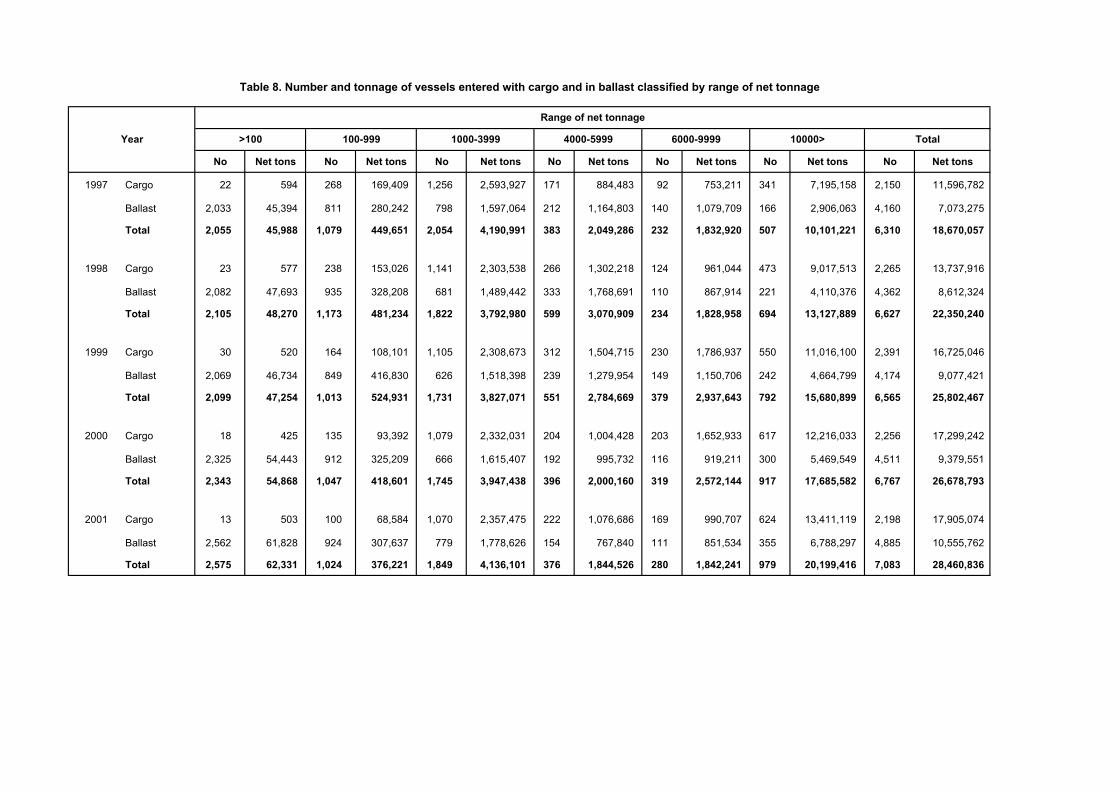
T8 Number and tonnage of vessels entered with cargo and in ballast classified by range of net tonnage
13
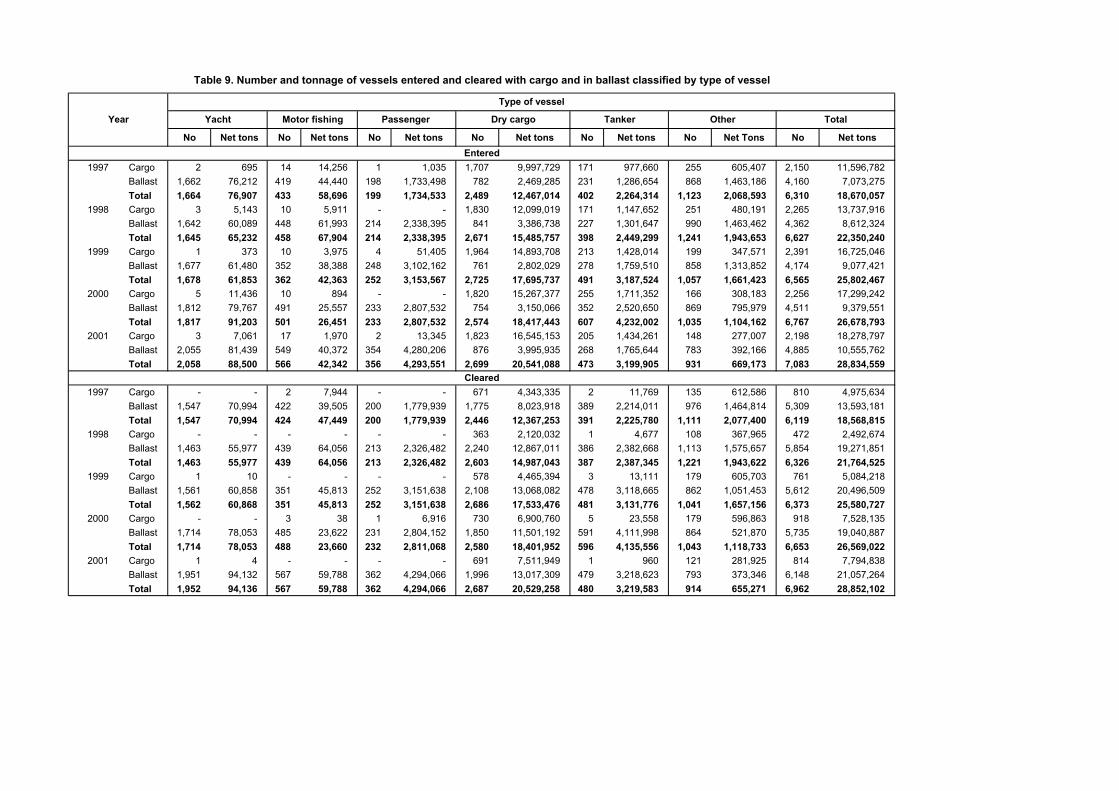
T9 Number and tonnage of vessels entered and cleared with cargo and in ballast classified by type of vessel
14
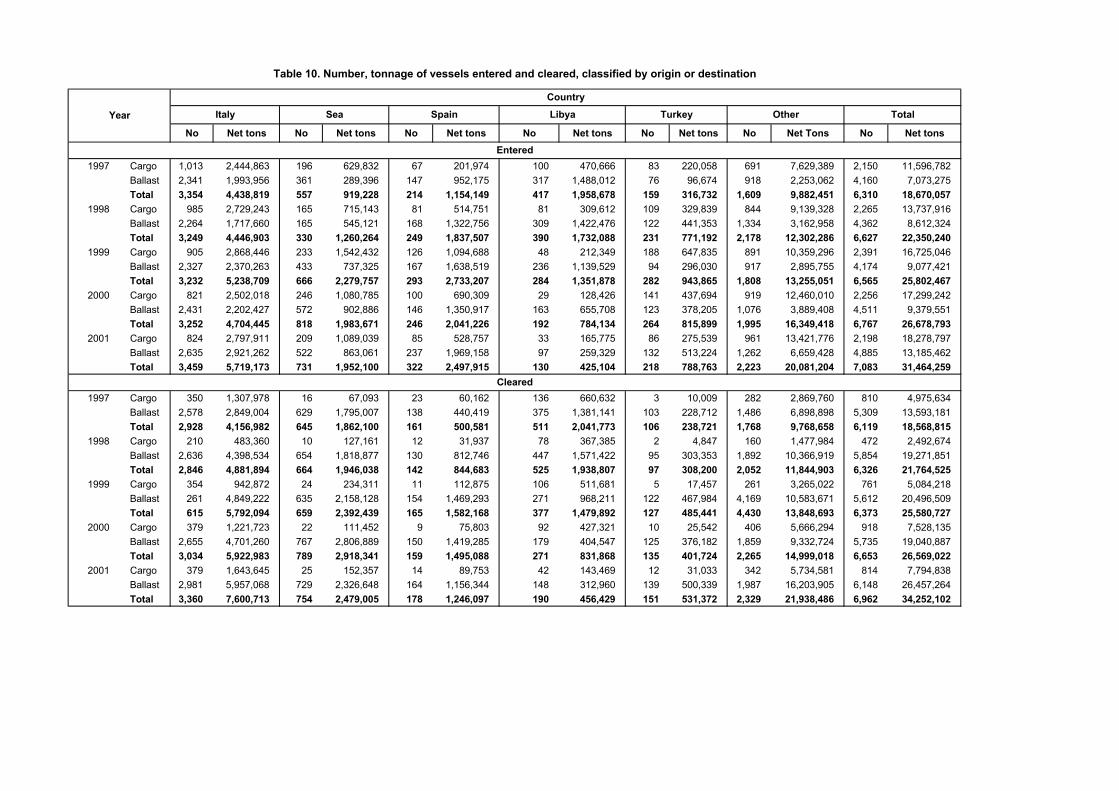
T10 Number, tonnage of vessels entered and cleared, classified by origin or destination 15
Road Transport
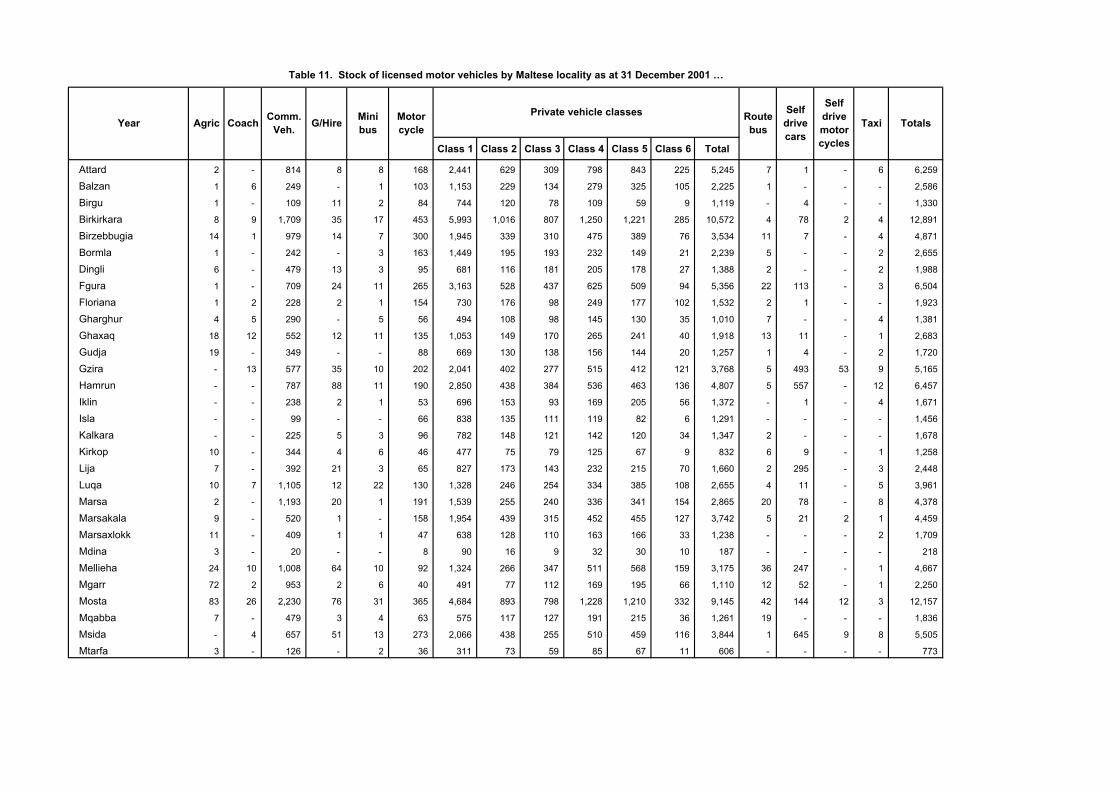
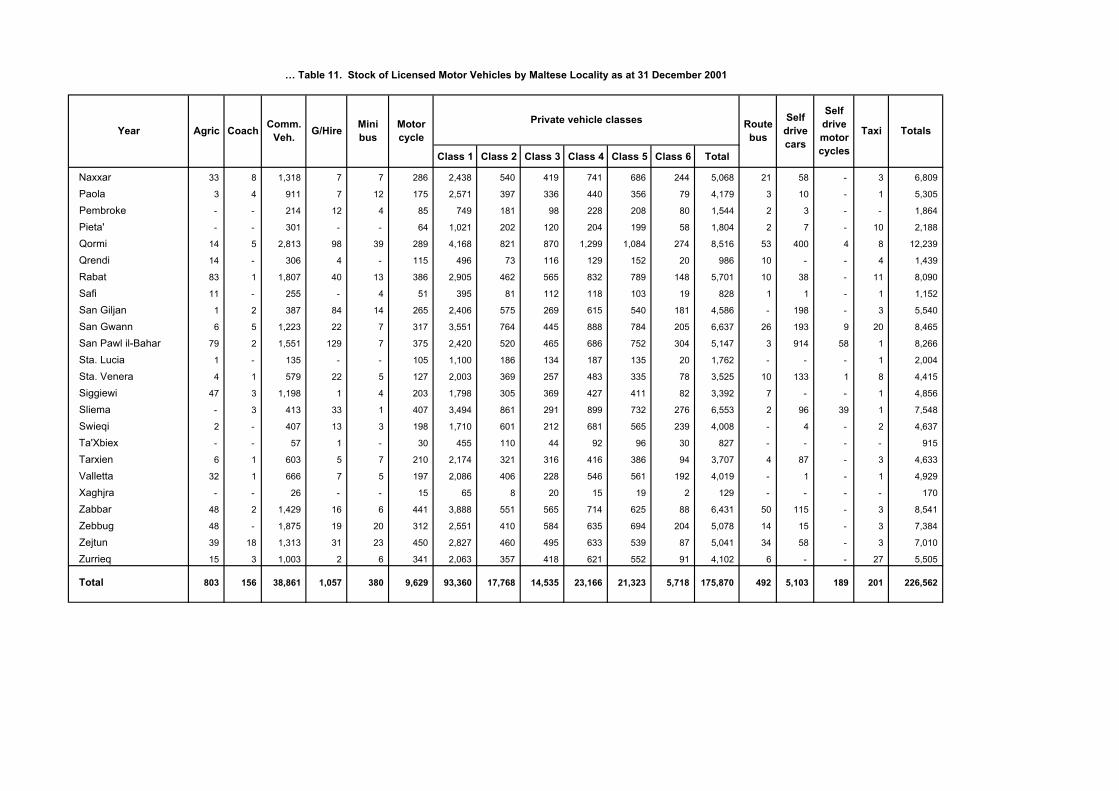
T11 Stock of licensed motor vehicles by Maltese locality as at 31 December 2001 19
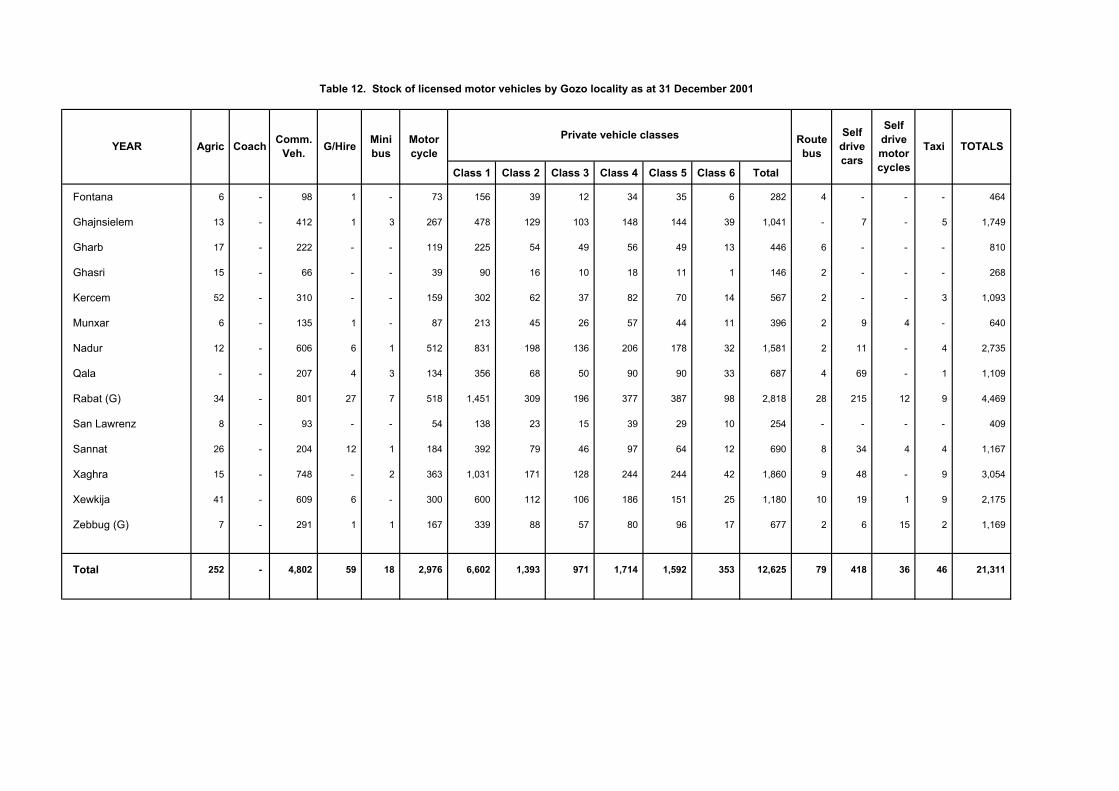
T12 Stock of licensed motor vehicles by Gozo locality as at 31 December 2001 21
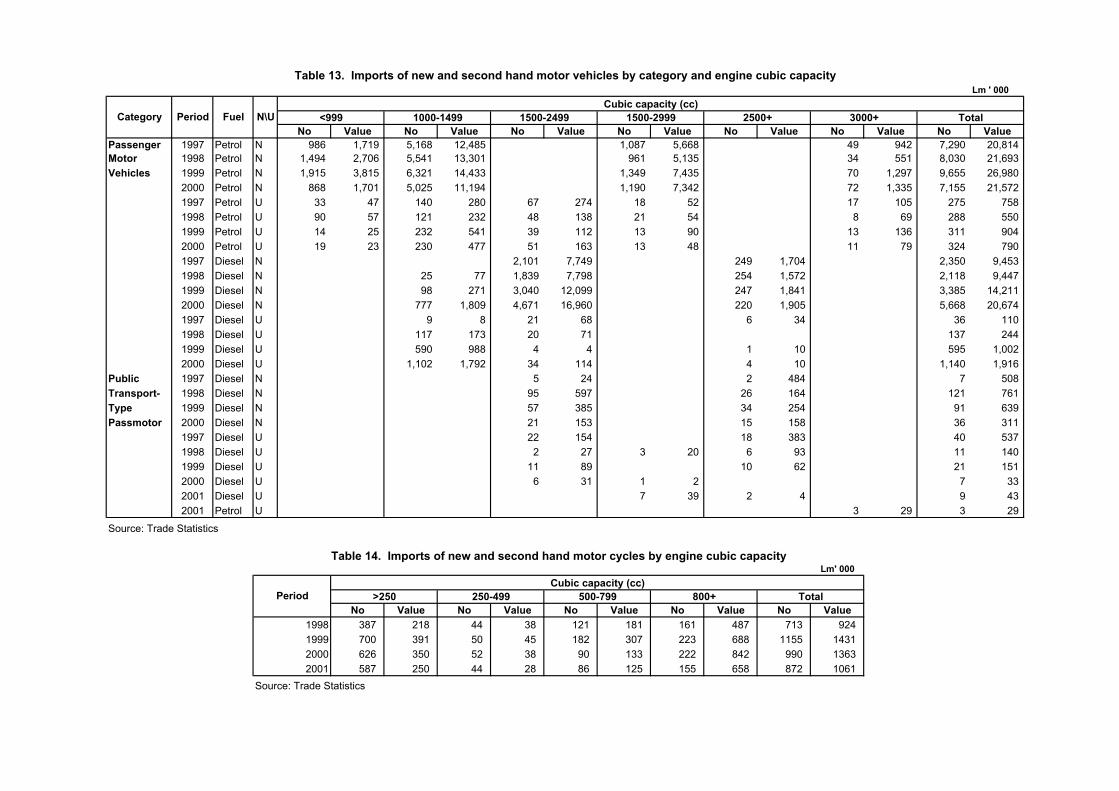
T13 Imports of new and second hand motor vehicles by category and engine cubic capacity 22
T14 Imports of new and second hand motor cycles by engine cubic capacity 22
T15 Transport equipment (vehicles) at 31.12. passenger road vehicles registered/licensed in the country
23
T16 Number of driving licence holders by single years of age and sex as at 31 December 2001
26
T17 Number of driving licence holders by five year age groups 1995 census 28
T18 Number of driving licence holders by five year age groups 29
Page
Other Transport
T19 Sea transport between Malta and Gozo 33
C3 Quarterly total vehicles and passengers, January to December 2000-2001 33
T20 Sea transport between Malta and Gozo 34
C4 Quarterly total vehicles, passengers and trips: March 1999 - December 2001 34
T21 Casualties by gender and age in Malta: 2001 35
T22 Total casualties by means of transport and age in Malta, Comino and Gozo: January - December 2001
36
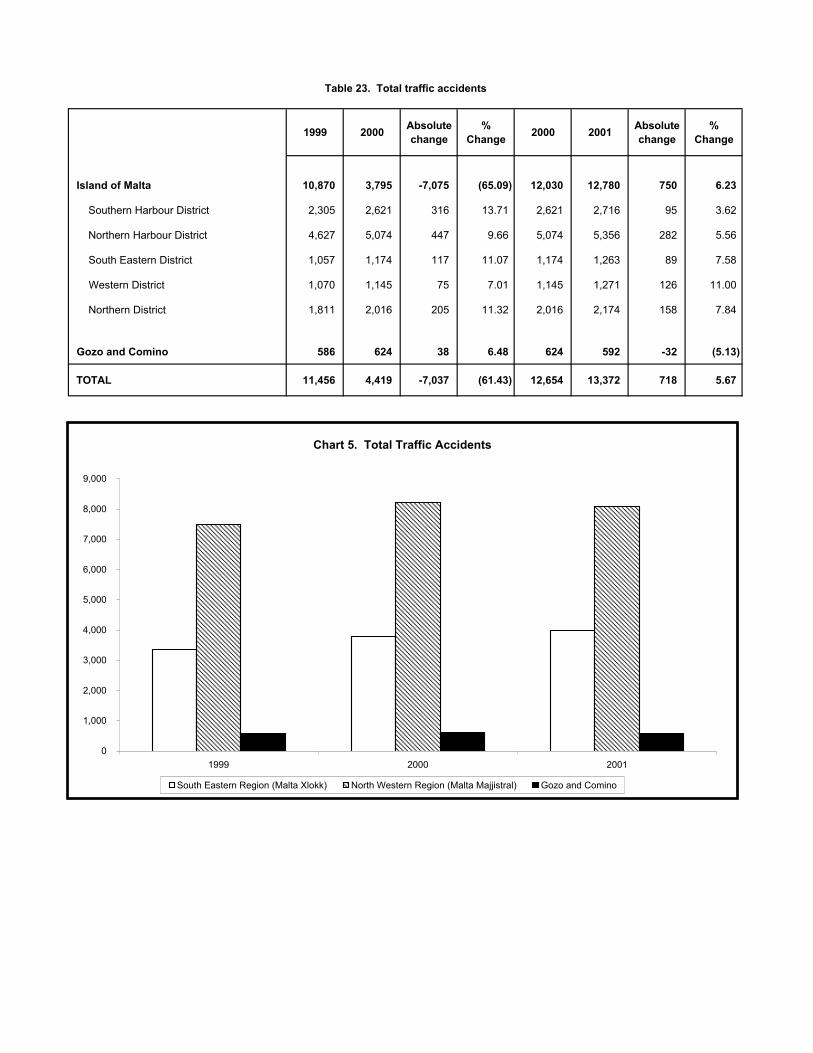
T23 Total traffic accidents 37
C5 Total traffic accidents 37
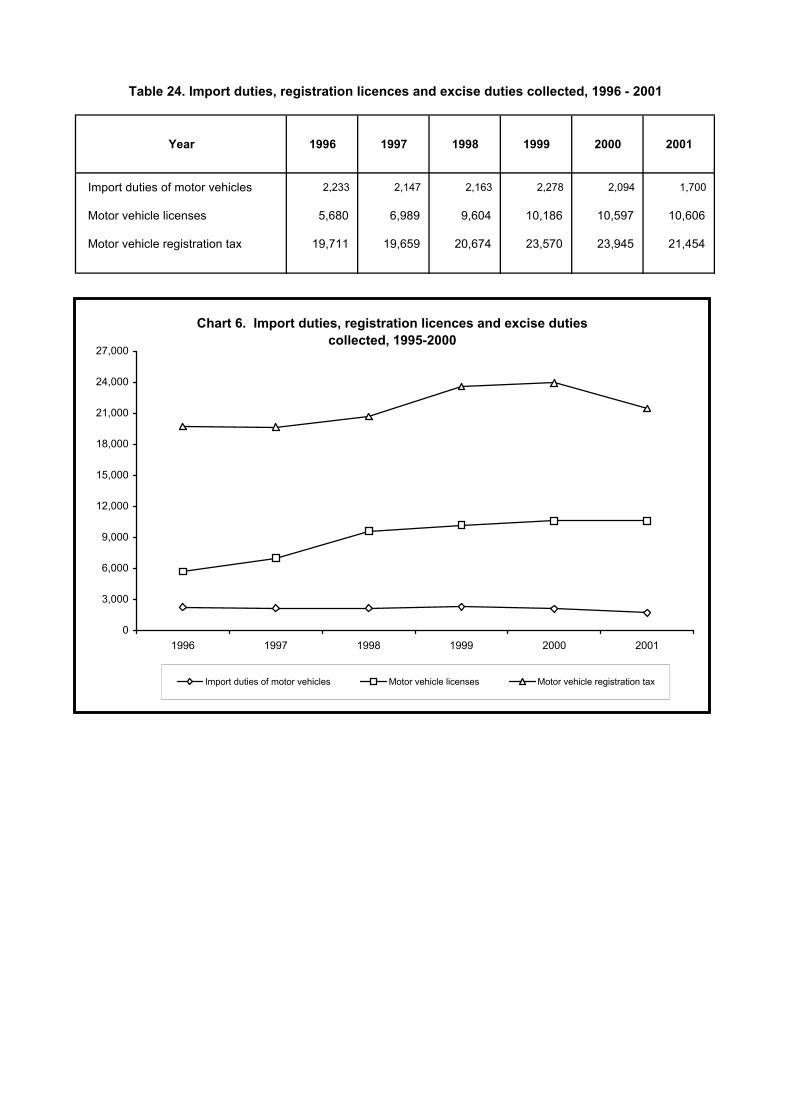
T24 Import duties, registration licences and excise duties collected, 1996 -2001 38
C6 Import duties, registration licences and excise duties collected, 1996 - 2001 38
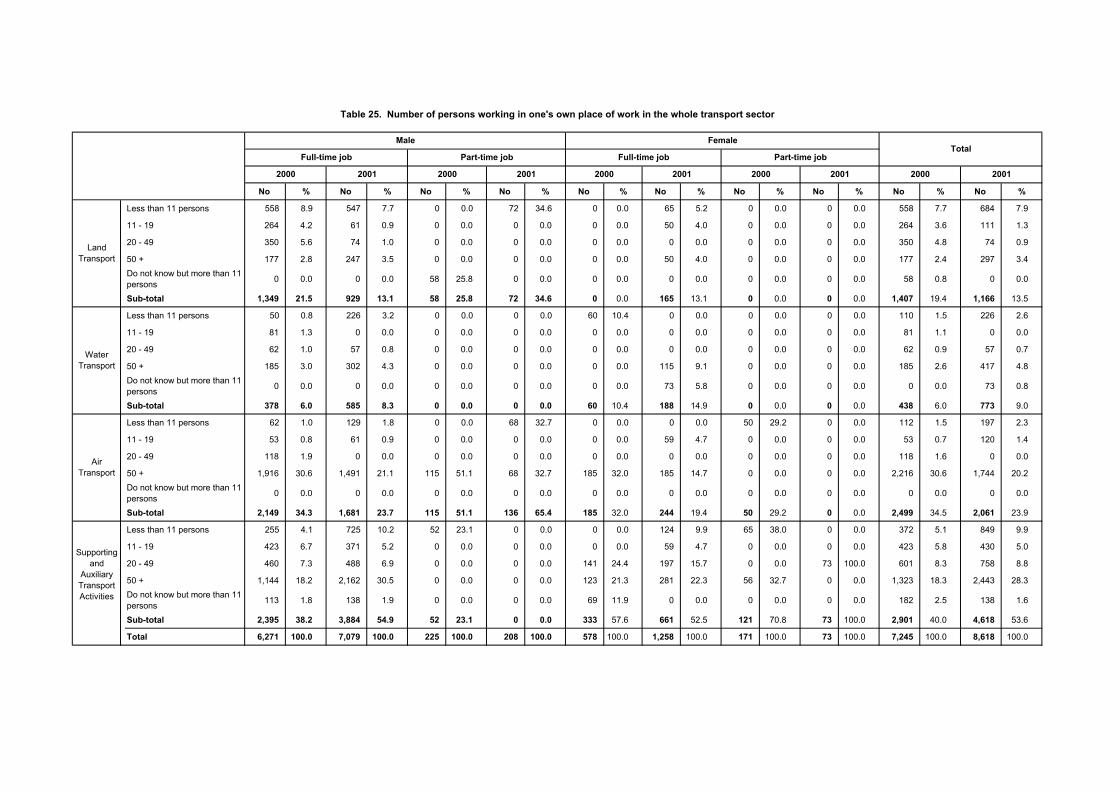
T25 Number of persons working in one's own place of work in the whole transport sector 39
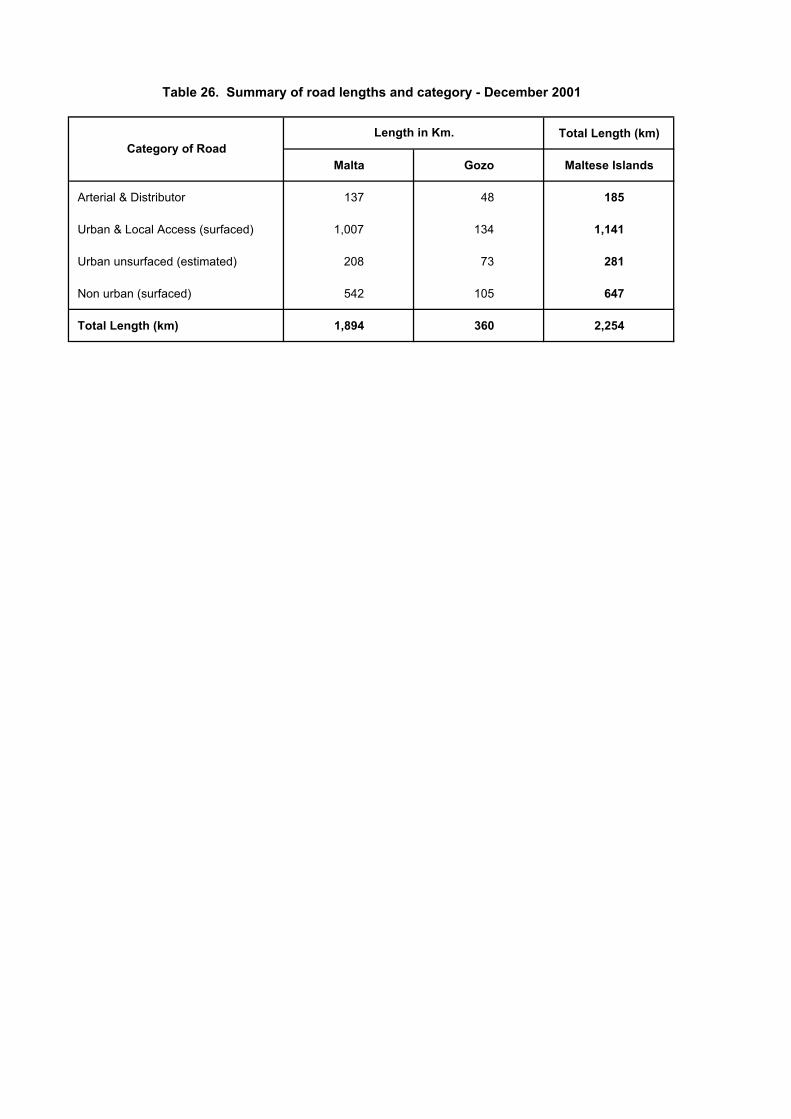
T26 Summary of road lengths and category - December 2001 40
v
C O M M E N T A R Y
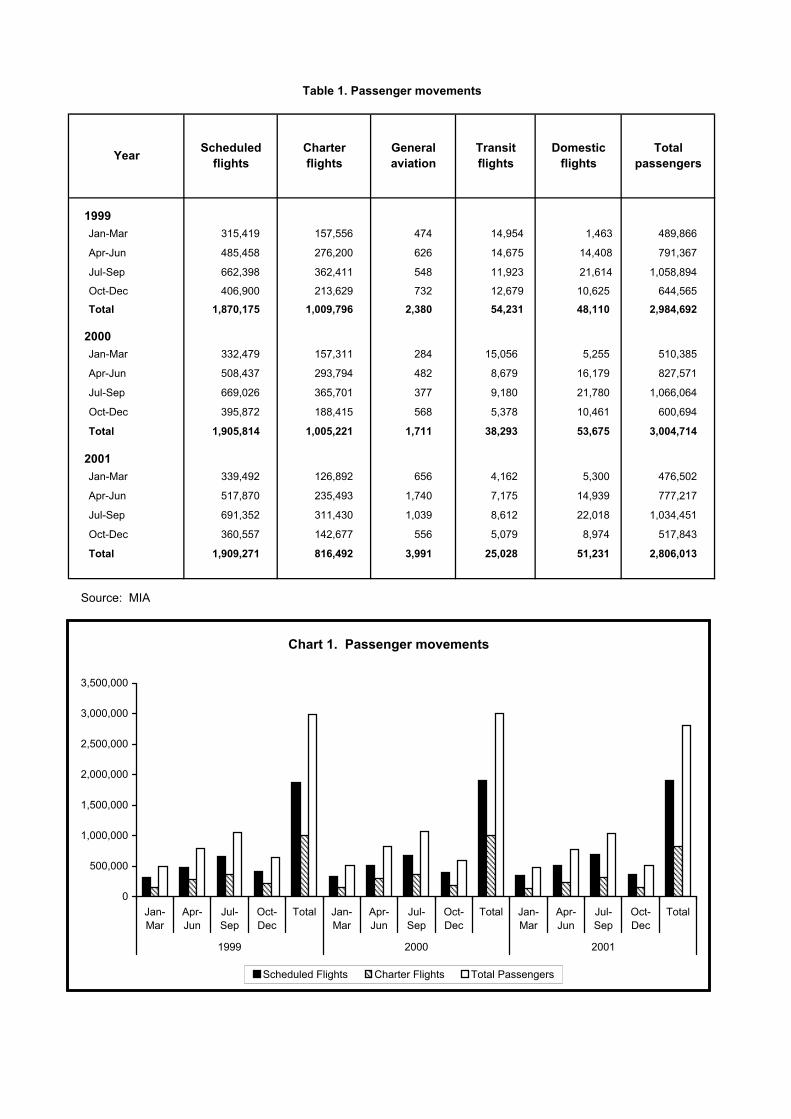
AIR TRANSPORT There was an overall decrease of 198,701 or 6.6 per cent passengers for 2001 who used the Malta International Airport. The constant decrease was spread throughout the year as follows:
January - March - 6.6 per cent
April - June - 6.1 per cent
July - September - 3.0 per cent
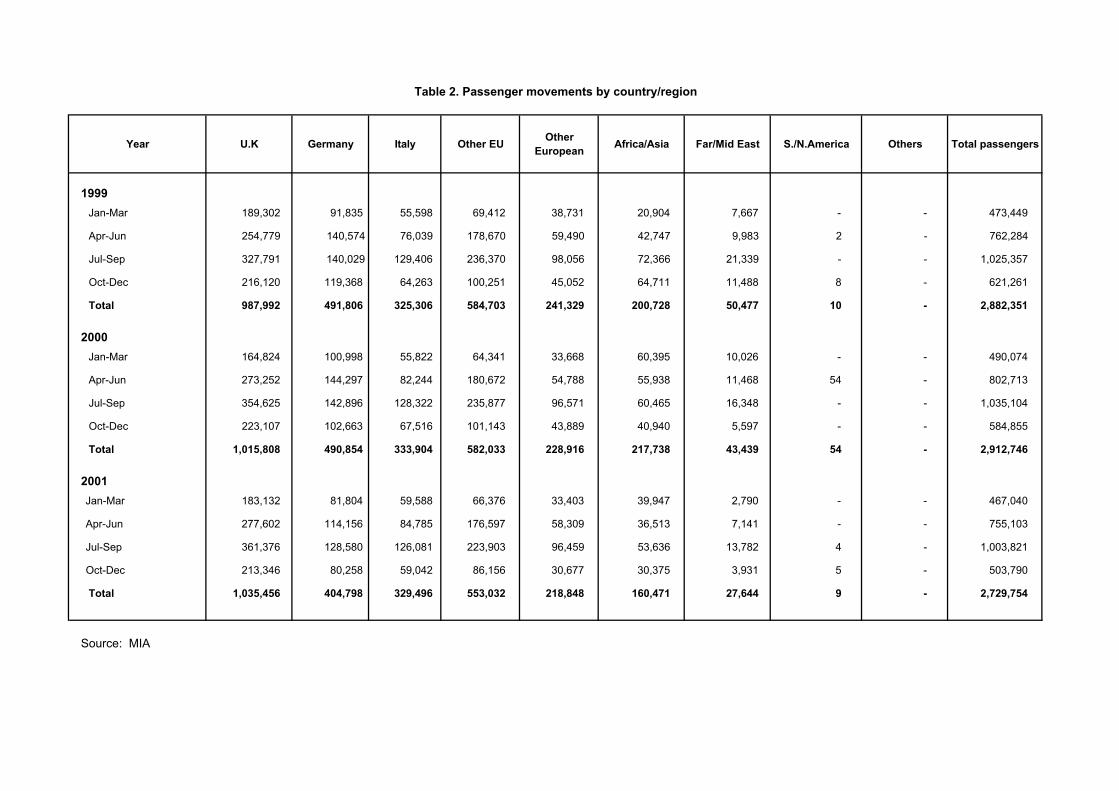
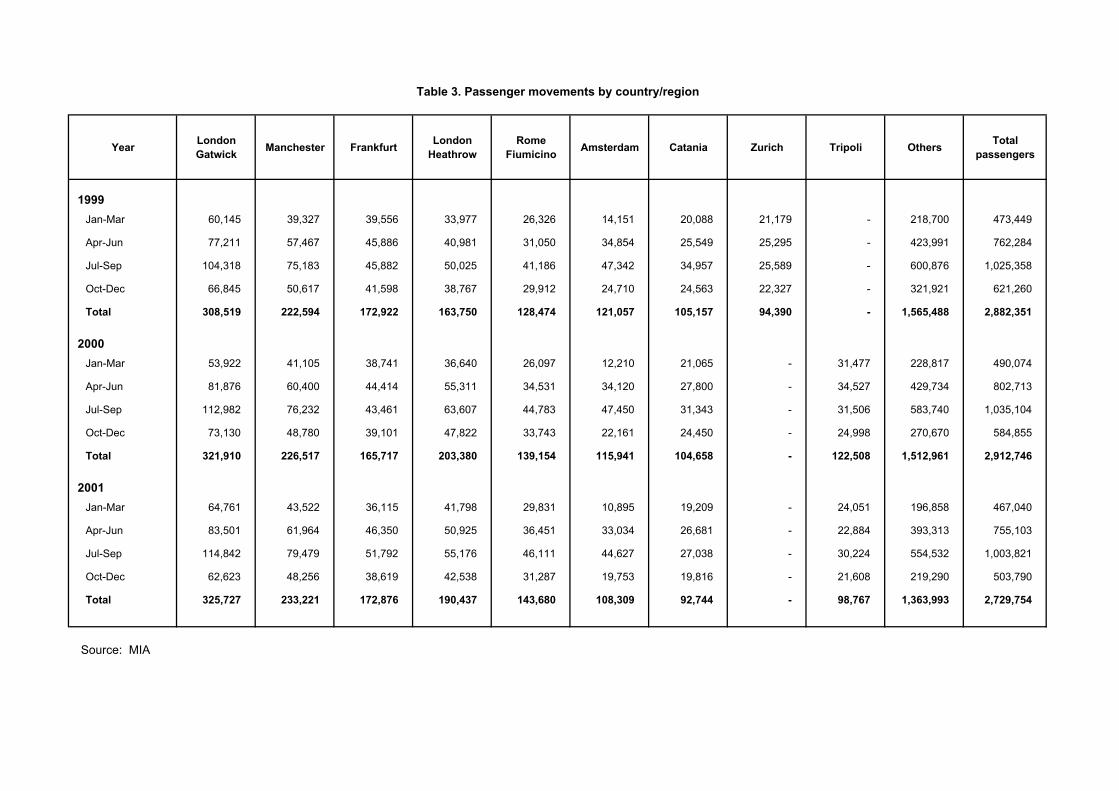
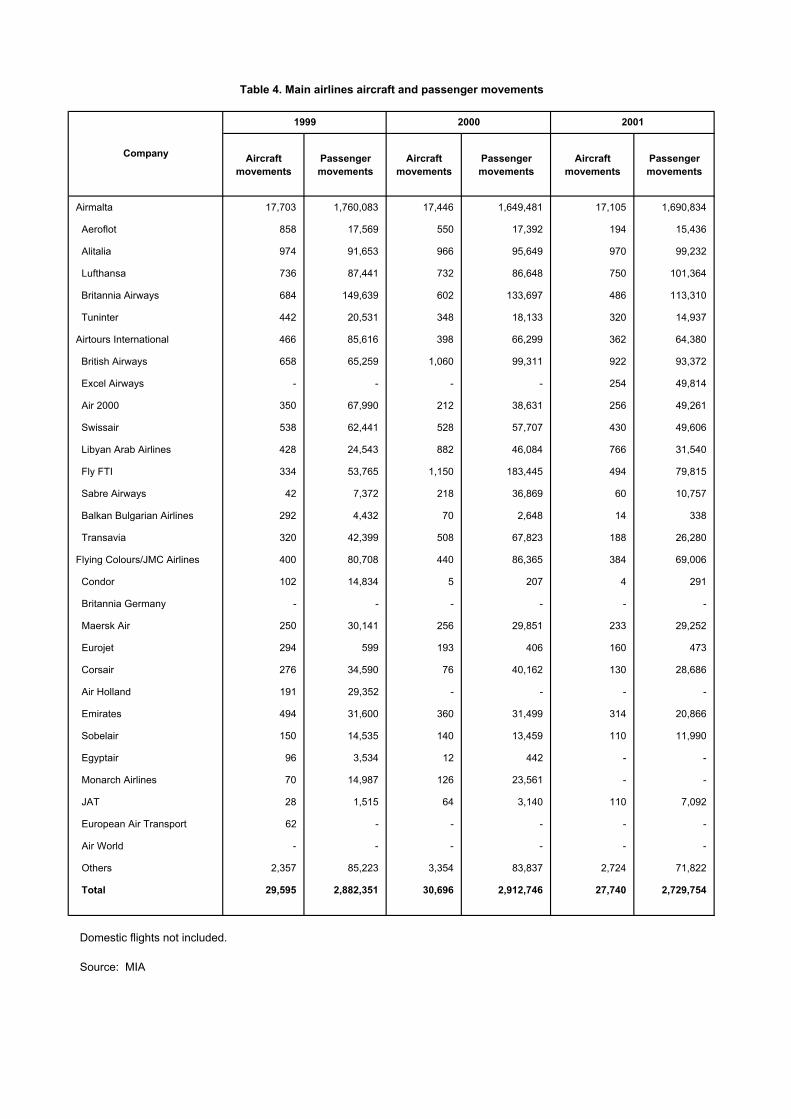
October - December - 13.8 per cent (see table 1) The number of passenger movements from the U.K. increased by 19,648 whilst all the other major countries or regions registered a drop. Passenger movement from Germany registered the highest decrease of 86,056 to 404,798 from the previous year (see table 2). British airports remained the most sought by the passengers traveling to and from Malta with Gatwick and Manchester showing a slight increase of 1.0 and 3.0 per cent. Tripoli airport registered a decrease of 23,741 passengers or 19.4 per cent over the same period under review (see table 3). Air Malta remained to be the major carrier, taking up 61.7 per cent of the total aircraft movements and 61.9 per cent of the total passenger movements. The Maltese company carried 1,690,834 passengers, an increase of 2.5 per cent. Britannia Airways carried 113,310 passengers (showed a decrease of 15.2 per cent) whilst Lufthansa carried 101,364 passengers, registering an increase of 17.0 per cent over the previous year (see table 4). The most common used aircraft was the Boeing 737-300 Series totaling 10,544 flights. This 70-5- passenger range aircraft took 38.0 per cent of the total flights whilst the bigger Airbus A320 (100-70 passenger range) took 15.7 per cent of the market share (see table 5). MARITIME STATISTICS There was an increase of 6,674 tons of unloaded units when compared with year 2000. The number of 20 foot containers decreased marginally by 78 whilst that of the 40-foot containers increased by 947 to 10,837 or 9.6 per cent. The total number of loaded units was 319,972 tons; an increase of 25,699 tons or 8.7 per cent (see table 7).
vi
The total number of vessels entered with cargo registered a small decrease of 58 vessels, down to 2,198 but these vessels carried 979,555 more net tons than the previous year. Furthermore, the number of vessels in ballast increased by 8.3 per cent with a total net tonnage of 10,555,762 resulting an increase of 1,176,211 net tons (see table 8). In the year 2001, the number of yachts entering the Maltese Islands was 2,055, a yearly increase of 238. The number of cleared yachts was 1,951 with a total net tonnage of 94,132 tons; an increase of 20.6 per cent over the previous year. There was a big increase of 52.5 per cent in the passenger vessels which entered the Maltese ports. With regards to dry cargo and tanker vessels there was not much difference from the year 2000 (see table 9). Italy remained the major country that had vessels entering and clearing into the Maltese ports. The total net tons coming from Italian ports took 19.8 per cent of the total entered net tons. This was followed up by Spain who took 8.7 per cent of the market share (see table 10.) ROAD TRANSPORT The total number of private vehicles in Malta amounted to 175,870 with Birkirkara registering the highest number of vehicles i.e. 10,572. Mosta and Qormi followed with 9.145 and 8,516 respectively. Victoria has 2,818 licensed private vehicles in its locality, resulting into the biggest locality in Gozo (see tables 11 & 12). Malta imported 2,728 new petrol vehicles in the 1000-1499 cc category in 2001. This resulted in a decrease of 2,297 vehicles or 45.7 per cent when compared to the previous year. However there was a 48.7 per cent increase in the 1500 - 2999cc petrol category. There was a total of 1,745 imported diesel vehicles in 2001; an increase of 605 to 1,745 up from 1,140 from the previous year. There was a drop of 11.9 per cent in the importation of motor cycles (see tables 13 & 14). OTHER TRANSPORT There was an increase of 109,597 passengers or 3.6 per cent who crossed the Maltese Islands. The total number of vehicles was 796,720; an increase of 8.0 per cent over the previous year (see table 19). In 2001 there was a total of 1,231 persons who sustained injuries, with 750 being males and 481 being females. Out of the reported 559 male slight injuries 165 cases were in the 15-24 years category. In the same category, 135 females were injured. In the Maltese Islands there where 16 fatal casualties; 14 being males and 2 being females. In respect of casualties by means of transport there were 728 accidents which occurred by passenger cars. Again the highest number was recorded in the 15-24 years category. Furthermore there were 220 pedestrians who suffered an accident. The total number of traffic accidents was 13,372, an increase of 718 with the highest number being recorded in the North Harbour District where 5,356 cases being reported (see tables 21-23).
Air Transport
1999 Jan-Mar 315,419 157,556 474 14,954 1,463 489,866
Apr-Jun 485,458 276,200 626 14,675 14,408 791,367
Jul-Sep 662,398 362,411 548 11,923 21,614 1,058,894
Oct-Dec 406,900 213,629 732 12,679 10,625 644,565
Total 1,870,175 1,009,796 2,380 54,231 48,110 2,984,692
2000 Jan-Mar 332,479 157,311 284 15,056 5,255 510,385
Apr-Jun 508,437 293,794 482 8,679 16,179 827,571
Jul-Sep 669,026 365,701 377 9,180 21,780 1,066,064
Oct-Dec 395,872 188,415 568 5,378 10,461 600,694
Total 1,905,814 1,005,221 1,711 38,293 53,675 3,004,714
2001 Jan-Mar 339,492 126,892 656 4,162 5,300 476,502
Apr-Jun 517,870 235,493 1,740 7,175 14,939 777,217
Jul-Sep 691,352 311,430 1,039 8,612 22,018 1,034,451
Oct-Dec 360,557 142,677 556 5,079 8,974 517,843
Total 1,909,271 816,492 3,991 25,028 51,231 2,806,013
Source: MIA
Table 1. Passenger movements
Year Scheduled flights
Charter flights
General aviation
Transit flights
Domestic flights
Total passengers
Chart 1. Passenger movements
0
500,000
1,000,000
1,500,000
2,000,000
2,500,000
3,000,000
3,500,000
Jan-Mar
Apr-Jun
Jul-Sep
Oct-Dec
Total Jan-Mar
Apr-Jun
Jul-Sep
Oct-Dec
Total Jan-Mar
Apr-Jun
Jul-Sep
Oct-Dec
Total
1999 2000 2001
Scheduled Flights Charter Flights Total Passengers
Year U.K Germany Italy Other EU Other European Africa/Asia Far/Mid East S./N.America Others Total passengers
1999 Jan-Mar 189,302 91,835 55,598 69,412 38,731 20,904 7,667 - - 473,449
Apr-Jun 254,779 140,574 76,039 178,670 59,490 42,747 9,983 2 - 762,284
Jul-Sep 327,791 140,029 129,406 236,370 98,056 72,366 21,339 - - 1,025,357
Oct-Dec 216,120 119,368 64,263 100,251 45,052 64,711 11,488 8 - 621,261
Total 987,992 491,806 325,306 584,703 241,329 200,728 50,477 10 - 2,882,351
2000 Jan-Mar 164,824 100,998 55,822 64,341 33,668 60,395 10,026 - - 490,074
Apr-Jun 273,252 144,297 82,244 180,672 54,788 55,938 11,468 54 - 802,713
Jul-Sep 354,625 142,896 128,322 235,877 96,571 60,465 16,348 - - 1,035,104
Oct-Dec 223,107 102,663 67,516 101,143 43,889 40,940 5,597 - - 584,855
Total 1,015,808 490,854 333,904 582,033 228,916 217,738 43,439 54 - 2,912,746
2001 Jan-Mar 183,132 81,804 59,588 66,376 33,403 39,947 2,790 - - 467,040
Apr-Jun 277,602 114,156 84,785 176,597 58,309 36,513 7,141 - - 755,103
Jul-Sep 361,376 128,580 126,081 223,903 96,459 53,636 13,782 4 - 1,003,821
Oct-Dec 213,346 80,258 59,042 86,156 30,677 30,375 3,931 5 - 503,790
Total 1,035,456 404,798 329,496 553,032 218,848 160,471 27,644 9 - 2,729,754
Source: MIA
Table 2. Passenger movements by country/region
Year London Gatwick Manchester Frankfurt London
HeathrowRome
Fiumicino Amsterdam Catania Zurich Tripoli Others Total passengers
1999 Jan-Mar 60,145 39,327 39,556 33,977 26,326 14,151 20,088 21,179 - 218,700 473,449
Apr-Jun 77,211 57,467 45,886 40,981 31,050 34,854 25,549 25,295 - 423,991 762,284
Jul-Sep 104,318 75,183 45,882 50,025 41,186 47,342 34,957 25,589 - 600,876 1,025,358
Oct-Dec 66,845 50,617 41,598 38,767 29,912 24,710 24,563 22,327 - 321,921 621,260
Total 308,519 222,594 172,922 163,750 128,474 121,057 105,157 94,390 - 1,565,488 2,882,351
2000 Jan-Mar 53,922 41,105 38,741 36,640 26,097 12,210 21,065 - 31,477 228,817 490,074
Apr-Jun 81,876 60,400 44,414 55,311 34,531 34,120 27,800 - 34,527 429,734 802,713
Jul-Sep 112,982 76,232 43,461 63,607 44,783 47,450 31,343 - 31,506 583,740 1,035,104
Oct-Dec 73,130 48,780 39,101 47,822 33,743 22,161 24,450 - 24,998 270,670 584,855
Total 321,910 226,517 165,717 203,380 139,154 115,941 104,658 - 122,508 1,512,961 2,912,746
2001 Jan-Mar 64,761 43,522 36,115 41,798 29,831 10,895 19,209 - 24,051 196,858 467,040
Apr-Jun 83,501 61,964 46,350 50,925 36,451 33,034 26,681 - 22,884 393,313 755,103
Jul-Sep 114,842 79,479 51,792 55,176 46,111 44,627 27,038 - 30,224 554,532 1,003,821
Oct-Dec 62,623 48,256 38,619 42,538 31,287 19,753 19,816 - 21,608 219,290 503,790
Total 325,727 233,221 172,876 190,437 143,680 108,309 92,744 - 98,767 1,363,993 2,729,754
Source: MIA
Table 3. Passenger movements by country/region
Aircraft movements
Passenger movements
Aircraft movements
Passenger movements
Aircraft movements
Passenger movements
Airmalta 17,703 1,760,083 17,446 1,649,481 17,105 1,690,834
Aeroflot 858 17,569 550 17,392 194 15,436
Alitalia 974 91,653 966 95,649 970 99,232
Lufthansa 736 87,441 732 86,648 750 101,364
Britannia Airways 684 149,639 602 133,697 486 113,310
Tuninter 442 20,531 348 18,133 320 14,937
Airtours International 466 85,616 398 66,299 362 64,380
British Airways 658 65,259 1,060 99,311 922 93,372
Excel Airways - - - - 254 49,814
Air 2000 350 67,990 212 38,631 256 49,261
Swissair 538 62,441 528 57,707 430 49,606
Libyan Arab Airlines 428 24,543 882 46,084 766 31,540
Fly FTI 334 53,765 1,150 183,445 494 79,815
Sabre Airways 42 7,372 218 36,869 60 10,757
Balkan Bulgarian Airlines 292 4,432 70 2,648 14 338
Transavia 320 42,399 508 67,823 188 26,280
Flying Colours/JMC Airlines 400 80,708 440 86,365 384 69,006
Condor 102 14,834 5 207 4 291
Britannia Germany - - - - - -
Maersk Air 250 30,141 256 29,851 233 29,252
Eurojet 294 599 193 406 160 473
Corsair 276 34,590 76 40,162 130 28,686
Air Holland 191 29,352 - - - -
Emirates 494 31,600 360 31,499 314 20,866
Sobelair 150 14,535 140 13,459 110 11,990
Egyptair 96 3,534 12 442 - -
Monarch Airlines 70 14,987 126 23,561 - -
JAT 28 1,515 64 3,140 110 7,092
European Air Transport 62 - - - - -
Air World - - - - - -
Others 2,357 85,223 3,354 83,837 2,724 71,822
Total 29,595 2,882,351 30,696 2,912,746 27,740 2,729,754
Domestic flights not included.
Source: MIA
Company
Table 4. Main airlines aircraft and passenger movements
2000 20011999
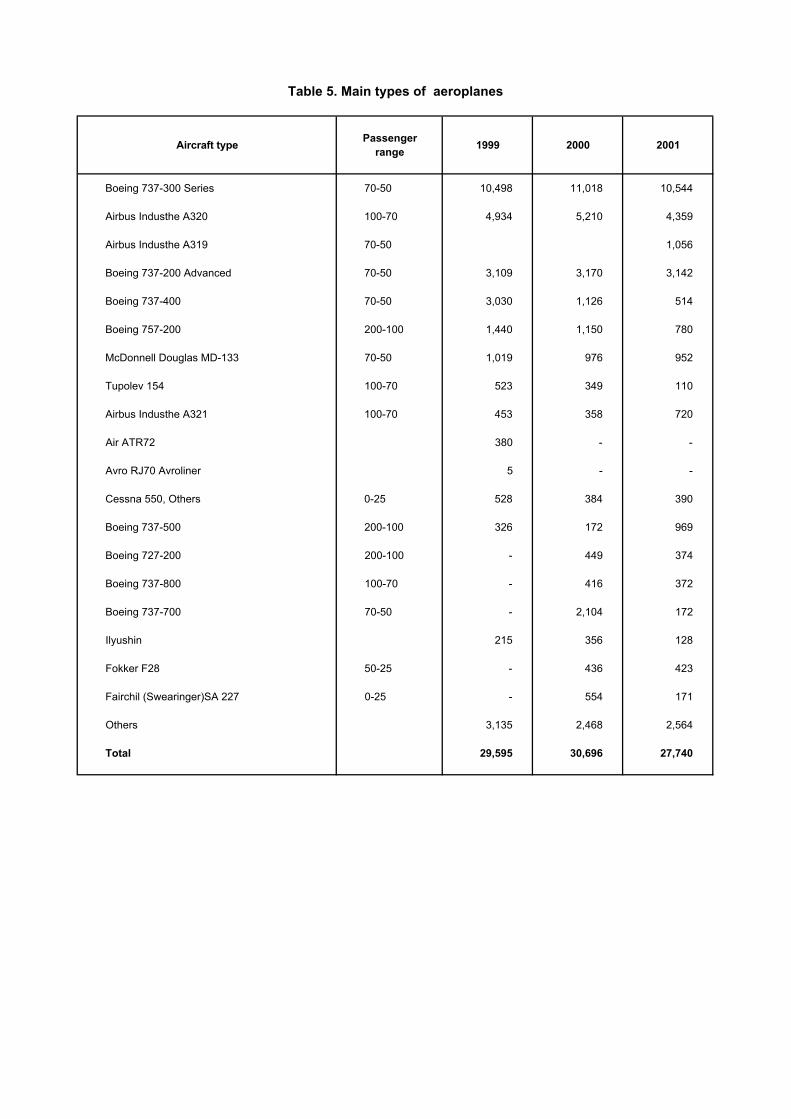
Aircraft type Passenger range 1999 2000 2001
Boeing 737-300 Series 70-50 10,498 11,018 10,544
Airbus Industhe A320 100-70 4,934 5,210 4,359
Airbus Industhe A319 70-50 1,056
Boeing 737-200 Advanced 70-50 3,109 3,170 3,142
Boeing 737-400 70-50 3,030 1,126 514
Boeing 757-200 200-100 1,440 1,150 780
McDonnell Douglas MD-133 70-50 1,019 976 952
Tupolev 154 100-70 523 349 110
Airbus Industhe A321 100-70 453 358 720
Air ATR72 380 - -
Avro RJ70 Avroliner 5 - -
Cessna 550, Others 0-25 528 384 390
Boeing 737-500 200-100 326 172 969
Boeing 727-200 200-100 - 449 374
Boeing 737-800 100-70 - 416 372
Boeing 737-700 70-50 - 2,104 172
Ilyushin 215 356 128
Fokker F28 50-25 - 436 423
Fairchil (Swearinger)SA 227 0-25 - 554 171
Others 3,135 2,468 2,564
Total 29,595 30,696 27,740
Table 5. Main types of aeroplanes
Maritime Statistics
No. Gross tonnage No. Gross tonnage
Pleasure Yacht 189 4,285 1,346 28,286
Motor Fishing Vessel 12 4,130 55 14,001
Dry Cargo Vessel 200 3,340,604 1,131 15,888,094
Passenger Vessel & Other 75 2,477,062 519 12,443,025
Total 476 5,826,081 3,051 28,373,406
Source: Registry of Shipping and Seamen
Type of vessel
Table 6. Vessels registered under the merchants shipping act, 1973
Registered during 2001 As on 31st December 2001
20 Ft 40 Ft 20 Ft 40 Ft Empty 20 Ft 40 Ft 20 Ft 40 Ft
2000 - 6,104 21,232 9,890 12,550 1,446,900 - 2,342 3,747 1,372 294,273
2001 - 6,940 21,154 10,837 11,249 1,453,574 - 2,363 3,969 1,598 319,972
January - 526 1,382 626 831 94,074 - 180 316 172 23,271
February - 555 1,593 777 761 112,344 - 181 251 142 22,200
March - 652 1,841 888 977 128,537 - 221 303 111 24,913
April - 654 1,842 994 891 127,949 - 214 224 124 28,612
May - 508 1,929 924 1,125 124,753 - 209 324 118 26,416
June - 533 1,999 888 985 122,555 - 216 270 145 25,702
July - 637 1,849 1,056 1,101 134,832 - 211 364 130 28,754
August - 438 1,696 955 950 113,795 - 160 577 99 30,672
September - 637 1,714 864 965 118,355 - 191 371 151 28,879
October - 748 1,729 1,027 1,075 132,810 - 216 372 167 31,676
November - 621 1,940 1,014 843 129,127 - 235 303 117 26,850
December - 431 1,640 824 745 114,443 - 129 294 122 22,027
Source: Cargo Handling Co. Ltd; Port Works Scheme; Containers Storage
Table 7. Unitised cargo and number of units unloaded and loaded
Unloaded
Trailers Containers Trailers Containers
Loaded
CARGO (Tons)CARGO (Tons)
No Net tons No Net tons No Net tons No Net tons No Net tons No Net tons No Net tons
1997 Cargo 22 594 268 169,409 1,256 2,593,927 171 884,483 92 753,211 341 7,195,158 2,150 11,596,782
Ballast 2,033 45,394 811 280,242 798 1,597,064 212 1,164,803 140 1,079,709 166 2,906,063 4,160 7,073,275
Total 2,055 45,988 1,079 449,651 2,054 4,190,991 383 2,049,286 232 1,832,920 507 10,101,221 6,310 18,670,057
1998 Cargo 23 577 238 153,026 1,141 2,303,538 266 1,302,218 124 961,044 473 9,017,513 2,265 13,737,916
Ballast 2,082 47,693 935 328,208 681 1,489,442 333 1,768,691 110 867,914 221 4,110,376 4,362 8,612,324
Total 2,105 48,270 1,173 481,234 1,822 3,792,980 599 3,070,909 234 1,828,958 694 13,127,889 6,627 22,350,240
1999 Cargo 30 520 164 108,101 1,105 2,308,673 312 1,504,715 230 1,786,937 550 11,016,100 2,391 16,725,046
Ballast 2,069 46,734 849 416,830 626 1,518,398 239 1,279,954 149 1,150,706 242 4,664,799 4,174 9,077,421
Total 2,099 47,254 1,013 524,931 1,731 3,827,071 551 2,784,669 379 2,937,643 792 15,680,899 6,565 25,802,467
2000 Cargo 18 425 135 93,392 1,079 2,332,031 204 1,004,428 203 1,652,933 617 12,216,033 2,256 17,299,242
Ballast 2,325 54,443 912 325,209 666 1,615,407 192 995,732 116 919,211 300 5,469,549 4,511 9,379,551
Total 2,343 54,868 1,047 418,601 1,745 3,947,438 396 2,000,160 319 2,572,144 917 17,685,582 6,767 26,678,793
2001 Cargo 13 503 100 68,584 1,070 2,357,475 222 1,076,686 169 990,707 624 13,411,119 2,198 17,905,074
Ballast 2,562 61,828 924 307,637 779 1,778,626 154 767,840 111 851,534 355 6,788,297 4,885 10,555,762
Total 2,575 62,331 1,024 376,221 1,849 4,136,101 376 1,844,526 280 1,842,241 979 20,199,416 7,083 28,460,836
Table 8. Number and tonnage of vessels entered with cargo and in ballast classified by range of net tonnage
Total
Range of net tonnage
Year >100 100-999 1000-3999 4000-5999 6000-9999 10000>
No Net tons No Net tons No Net tons No Net tons No Net tons No Net Tons No Net tons
1997 Cargo 2 695 14 14,256 1 1,035 1,707 9,997,729 171 977,660 255 605,407 2,150 11,596,782 Ballast 1,662 76,212 419 44,440 198 1,733,498 782 2,469,285 231 1,286,654 868 1,463,186 4,160 7,073,275 Total 1,664 76,907 433 58,696 199 1,734,533 2,489 12,467,014 402 2,264,314 1,123 2,068,593 6,310 18,670,057
1998 Cargo 3 5,143 10 5,911 - - 1,830 12,099,019 171 1,147,652 251 480,191 2,265 13,737,916 Ballast 1,642 60,089 448 61,993 214 2,338,395 841 3,386,738 227 1,301,647 990 1,463,462 4,362 8,612,324 Total 1,645 65,232 458 67,904 214 2,338,395 2,671 15,485,757 398 2,449,299 1,241 1,943,653 6,627 22,350,240
1999 Cargo 1 373 10 3,975 4 51,405 1,964 14,893,708 213 1,428,014 199 347,571 2,391 16,725,046 Ballast 1,677 61,480 352 38,388 248 3,102,162 761 2,802,029 278 1,759,510 858 1,313,852 4,174 9,077,421 Total 1,678 61,853 362 42,363 252 3,153,567 2,725 17,695,737 491 3,187,524 1,057 1,661,423 6,565 25,802,467
2000 Cargo 5 11,436 10 894 - - 1,820 15,267,377 255 1,711,352 166 308,183 2,256 17,299,242 Ballast 1,812 79,767 491 25,557 233 2,807,532 754 3,150,066 352 2,520,650 869 795,979 4,511 9,379,551 Total 1,817 91,203 501 26,451 233 2,807,532 2,574 18,417,443 607 4,232,002 1,035 1,104,162 6,767 26,678,793
2001 Cargo 3 7,061 17 1,970 2 13,345 1,823 16,545,153 205 1,434,261 148 277,007 2,198 18,278,797 Ballast 2,055 81,439 549 40,372 354 4,280,206 876 3,995,935 268 1,765,644 783 392,166 4,885 10,555,762 Total 2,058 88,500 566 42,342 356 4,293,551 2,699 20,541,088 473 3,199,905 931 669,173 7,083 28,834,559
1997 Cargo - - 2 7,944 - - 671 4,343,335 2 11,769 135 612,586 810 4,975,634 Ballast 1,547 70,994 422 39,505 200 1,779,939 1,775 8,023,918 389 2,214,011 976 1,464,814 5,309 13,593,181 Total 1,547 70,994 424 47,449 200 1,779,939 2,446 12,367,253 391 2,225,780 1,111 2,077,400 6,119 18,568,815
1998 Cargo - - - - - - 363 2,120,032 1 4,677 108 367,965 472 2,492,674 Ballast 1,463 55,977 439 64,056 213 2,326,482 2,240 12,867,011 386 2,382,668 1,113 1,575,657 5,854 19,271,851 Total 1,463 55,977 439 64,056 213 2,326,482 2,603 14,987,043 387 2,387,345 1,221 1,943,622 6,326 21,764,525
1999 Cargo 1 10 - - - - 578 4,465,394 3 13,111 179 605,703 761 5,084,218 Ballast 1,561 60,858 351 45,813 252 3,151,638 2,108 13,068,082 478 3,118,665 862 1,051,453 5,612 20,496,509 Total 1,562 60,868 351 45,813 252 3,151,638 2,686 17,533,476 481 3,131,776 1,041 1,657,156 6,373 25,580,727
2000 Cargo - - 3 38 1 6,916 730 6,900,760 5 23,558 179 596,863 918 7,528,135 Ballast 1,714 78,053 485 23,622 231 2,804,152 1,850 11,501,192 591 4,111,998 864 521,870 5,735 19,040,887 Total 1,714 78,053 488 23,660 232 2,811,068 2,580 18,401,952 596 4,135,556 1,043 1,118,733 6,653 26,569,022
2001 Cargo 1 4 - - - - 691 7,511,949 1 960 121 281,925 814 7,794,838 Ballast 1,951 94,132 567 59,788 362 4,294,066 1,996 13,017,309 479 3,218,623 793 373,346 6,148 21,057,264 Total 1,952 94,136 567 59,788 362 4,294,066 2,687 20,529,258 480 3,219,583 914 655,271 6,962 28,852,102
Table 9. Number and tonnage of vessels entered and cleared with cargo and in ballast classified by type of vessel
Year
Type of vessel
Yacht Motor fishing Passenger Dry cargo Tanker Other Total
Entered
Cleared
No Net tons No Net tons No Net tons No Net tons No Net tons No Net Tons No Net tons
1997 Cargo 1,013 2,444,863 196 629,832 67 201,974 100 470,666 83 220,058 691 7,629,389 2,150 11,596,782 Ballast 2,341 1,993,956 361 289,396 147 952,175 317 1,488,012 76 96,674 918 2,253,062 4,160 7,073,275 Total 3,354 4,438,819 557 919,228 214 1,154,149 417 1,958,678 159 316,732 1,609 9,882,451 6,310 18,670,057
1998 Cargo 985 2,729,243 165 715,143 81 514,751 81 309,612 109 329,839 844 9,139,328 2,265 13,737,916 Ballast 2,264 1,717,660 165 545,121 168 1,322,756 309 1,422,476 122 441,353 1,334 3,162,958 4,362 8,612,324 Total 3,249 4,446,903 330 1,260,264 249 1,837,507 390 1,732,088 231 771,192 2,178 12,302,286 6,627 22,350,240
1999 Cargo 905 2,868,446 233 1,542,432 126 1,094,688 48 212,349 188 647,835 891 10,359,296 2,391 16,725,046 Ballast 2,327 2,370,263 433 737,325 167 1,638,519 236 1,139,529 94 296,030 917 2,895,755 4,174 9,077,421 Total 3,232 5,238,709 666 2,279,757 293 2,733,207 284 1,351,878 282 943,865 1,808 13,255,051 6,565 25,802,467
2000 Cargo 821 2,502,018 246 1,080,785 100 690,309 29 128,426 141 437,694 919 12,460,010 2,256 17,299,242 Ballast 2,431 2,202,427 572 902,886 146 1,350,917 163 655,708 123 378,205 1,076 3,889,408 4,511 9,379,551 Total 3,252 4,704,445 818 1,983,671 246 2,041,226 192 784,134 264 815,899 1,995 16,349,418 6,767 26,678,793
2001 Cargo 824 2,797,911 209 1,089,039 85 528,757 33 165,775 86 275,539 961 13,421,776 2,198 18,278,797 Ballast 2,635 2,921,262 522 863,061 237 1,969,158 97 259,329 132 513,224 1,262 6,659,428 4,885 13,185,462 Total 3,459 5,719,173 731 1,952,100 322 2,497,915 130 425,104 218 788,763 2,223 20,081,204 7,083 31,464,259
1997 Cargo 350 1,307,978 16 67,093 23 60,162 136 660,632 3 10,009 282 2,869,760 810 4,975,634 Ballast 2,578 2,849,004 629 1,795,007 138 440,419 375 1,381,141 103 228,712 1,486 6,898,898 5,309 13,593,181 Total 2,928 4,156,982 645 1,862,100 161 500,581 511 2,041,773 106 238,721 1,768 9,768,658 6,119 18,568,815
1998 Cargo 210 483,360 10 127,161 12 31,937 78 367,385 2 4,847 160 1,477,984 472 2,492,674 Ballast 2,636 4,398,534 654 1,818,877 130 812,746 447 1,571,422 95 303,353 1,892 10,366,919 5,854 19,271,851 Total 2,846 4,881,894 664 1,946,038 142 844,683 525 1,938,807 97 308,200 2,052 11,844,903 6,326 21,764,525
1999 Cargo 354 942,872 24 234,311 11 112,875 106 511,681 5 17,457 261 3,265,022 761 5,084,218 Ballast 261 4,849,222 635 2,158,128 154 1,469,293 271 968,211 122 467,984 4,169 10,583,671 5,612 20,496,509 Total 615 5,792,094 659 2,392,439 165 1,582,168 377 1,479,892 127 485,441 4,430 13,848,693 6,373 25,580,727
2000 Cargo 379 1,221,723 22 111,452 9 75,803 92 427,321 10 25,542 406 5,666,294 918 7,528,135 Ballast 2,655 4,701,260 767 2,806,889 150 1,419,285 179 404,547 125 376,182 1,859 9,332,724 5,735 19,040,887 Total 3,034 5,922,983 789 2,918,341 159 1,495,088 271 831,868 135 401,724 2,265 14,999,018 6,653 26,569,022
2001 Cargo 379 1,643,645 25 152,357 14 89,753 42 143,469 12 31,033 342 5,734,581 814 7,794,838 Ballast 2,981 5,957,068 729 2,326,648 164 1,156,344 148 312,960 139 500,339 1,987 16,203,905 6,148 26,457,264 Total 3,360 7,600,713 754 2,479,005 178 1,246,097 190 456,429 151 531,372 2,329 21,938,486 6,962 34,252,102
Sea Spain Libya Turkey
Cleared
Table 10. Number, tonnage of vessels entered and cleared, classified by origin or destination
Other Total
Entered
Year
CountryItaly
Road Transport
Class 1 Class 2 Class 3 Class 4 Class 5 Class 6 Total
Attard 2 - 814 8 8 168 2,441 629 309 798 843 225 5,245 7 1 - 6 6,259
Balzan 1 6 249 - 1 103 1,153 229 134 279 325 105 2,225 1 - - - 2,586
Birgu 1 - 109 11 2 84 744 120 78 109 59 9 1,119 - 4 - - 1,330
Birkirkara 8 9 1,709 35 17 453 5,993 1,016 807 1,250 1,221 285 10,572 4 78 2 4 12,891
Birzebbugia 14 1 979 14 7 300 1,945 339 310 475 389 76 3,534 11 7 - 4 4,871
Bormla 1 - 242 - 3 163 1,449 195 193 232 149 21 2,239 5 - - 2 2,655
Dingli 6 - 479 13 3 95 681 116 181 205 178 27 1,388 2 - - 2 1,988
Fgura 1 - 709 24 11 265 3,163 528 437 625 509 94 5,356 22 113 - 3 6,504
Floriana 1 2 228 2 1 154 730 176 98 249 177 102 1,532 2 1 - - 1,923
Gharghur 4 5 290 - 5 56 494 108 98 145 130 35 1,010 7 - - 4 1,381
Ghaxaq 18 12 552 12 11 135 1,053 149 170 265 241 40 1,918 13 11 - 1 2,683
Gudja 19 - 349 - - 88 669 130 138 156 144 20 1,257 1 4 - 2 1,720
Gzira - 13 577 35 10 202 2,041 402 277 515 412 121 3,768 5 493 53 9 5,165
Hamrun - - 787 88 11 190 2,850 438 384 536 463 136 4,807 5 557 - 12 6,457
Iklin - - 238 2 1 53 696 153 93 169 205 56 1,372 - 1 - 4 1,671
Isla - - 99 - - 66 838 135 111 119 82 6 1,291 - - - - 1,456
Kalkara - - 225 5 3 96 782 148 121 142 120 34 1,347 2 - - - 1,678
Kirkop 10 - 344 4 6 46 477 75 79 125 67 9 832 6 9 - 1 1,258
Lija 7 - 392 21 3 65 827 173 143 232 215 70 1,660 2 295 - 3 2,448
Luqa 10 7 1,105 12 22 130 1,328 246 254 334 385 108 2,655 4 11 - 5 3,961
Marsa 2 - 1,193 20 1 191 1,539 255 240 336 341 154 2,865 20 78 - 8 4,378
Marsakala 9 - 520 1 - 158 1,954 439 315 452 455 127 3,742 5 21 2 1 4,459
Marsaxlokk 11 - 409 1 1 47 638 128 110 163 166 33 1,238 - - - 2 1,709
Mdina 3 - 20 - - 8 90 16 9 32 30 10 187 - - - - 218
Mellieha 24 10 1,008 64 10 92 1,324 266 347 511 568 159 3,175 36 247 - 1 4,667
Mgarr 72 2 953 2 6 40 491 77 112 169 195 66 1,110 12 52 - 1 2,250
Mosta 83 26 2,230 76 31 365 4,684 893 798 1,228 1,210 332 9,145 42 144 12 3 12,157
Mqabba 7 - 479 3 4 63 575 117 127 191 215 36 1,261 19 - - - 1,836
Msida - 4 657 51 13 273 2,066 438 255 510 459 116 3,844 1 645 9 8 5,505
Mtarfa 3 - 126 - 2 36 311 73 59 85 67 11 606 - - - - 773
Taxi Totals
Table 11. Stock of licensed motor vehicles by Maltese locality as at 31 December 2001 …
Year Agric Coach Comm. Veh. G/Hire Mini
busMotor cycle
Private vehicle classes Self drive cars
Self drive motor cycles
Route bus
Class 1 Class 2 Class 3 Class 4 Class 5 Class 6 Total
Naxxar 33 8 1,318 7 7 286 2,438 540 419 741 686 244 5,068 21 58 - 3 6,809
Paola 3 4 911 7 12 175 2,571 397 336 440 356 79 4,179 3 10 - 1 5,305
Pembroke - - 214 12 4 85 749 181 98 228 208 80 1,544 2 3 - - 1,864
Pieta' - - 301 - - 64 1,021 202 120 204 199 58 1,804 2 7 - 10 2,188
Qormi 14 5 2,813 98 39 289 4,168 821 870 1,299 1,084 274 8,516 53 400 4 8 12,239
Qrendi 14 - 306 4 - 115 496 73 116 129 152 20 986 10 - - 4 1,439
Rabat 83 1 1,807 40 13 386 2,905 462 565 832 789 148 5,701 10 38 - 11 8,090
Safi 11 - 255 - 4 51 395 81 112 118 103 19 828 1 1 - 1 1,152
San Giljan 1 2 387 84 14 265 2,406 575 269 615 540 181 4,586 - 198 - 3 5,540
San Gwann 6 5 1,223 22 7 317 3,551 764 445 888 784 205 6,637 26 193 9 20 8,465
San Pawl il-Bahar 79 2 1,551 129 7 375 2,420 520 465 686 752 304 5,147 3 914 58 1 8,266
Sta. Lucia 1 - 135 - - 105 1,100 186 134 187 135 20 1,762 - - - 1 2,004
Sta. Venera 4 1 579 22 5 127 2,003 369 257 483 335 78 3,525 10 133 1 8 4,415
Siggiewi 47 3 1,198 1 4 203 1,798 305 369 427 411 82 3,392 7 - - 1 4,856
Sliema - 3 413 33 1 407 3,494 861 291 899 732 276 6,553 2 96 39 1 7,548
Swieqi 2 - 407 13 3 198 1,710 601 212 681 565 239 4,008 - 4 - 2 4,637
Ta'Xbiex - - 57 1 - 30 455 110 44 92 96 30 827 - - - - 915
Tarxien 6 1 603 5 7 210 2,174 321 316 416 386 94 3,707 4 87 - 3 4,633
Valletta 32 1 666 7 5 197 2,086 406 228 546 561 192 4,019 - 1 - 1 4,929
Xaghjra - - 26 - - 15 65 8 20 15 19 2 129 - - - - 170
Zabbar 48 2 1,429 16 6 441 3,888 551 565 714 625 88 6,431 50 115 - 3 8,541
Zebbug 48 - 1,875 19 20 312 2,551 410 584 635 694 204 5,078 14 15 - 3 7,384
Zejtun 39 18 1,313 31 23 450 2,827 460 495 633 539 87 5,041 34 58 - 3 7,010
Zurrieq 15 3 1,003 2 6 341 2,063 357 418 621 552 91 4,102 6 - - 27 5,505
Total 803 156 38,861 1,057 380 9,629 93,360 17,768 14,535 23,166 21,323 5,718 175,870 492 5,103 189 201 226,562
Taxi Totals
… Table 11. Stock of Licensed Motor Vehicles by Maltese Locality as at 31 December 2001
Year Agric Coach Comm. Veh. G/Hire Mini
busMotor cycle
Private vehicle classes Self drive cars
Self drive motor cycles
Route bus
Class 1 Class 2 Class 3 Class 4 Class 5 Class 6 Total
Fontana 6 - 98 1 - 73 156 39 12 34 35 6 282 4 - - - 464
Ghajnsielem 13 - 412 1 3 267 478 129 103 148 144 39 1,041 - 7 - 5 1,749
Gharb 17 - 222 - - 119 225 54 49 56 49 13 446 6 - - - 810
Ghasri 15 - 66 - - 39 90 16 10 18 11 1 146 2 - - - 268
Kercem 52 - 310 - - 159 302 62 37 82 70 14 567 2 - - 3 1,093
Munxar 6 - 135 1 - 87 213 45 26 57 44 11 396 2 9 4 - 640
Nadur 12 - 606 6 1 512 831 198 136 206 178 32 1,581 2 11 - 4 2,735
Qala - - 207 4 3 134 356 68 50 90 90 33 687 4 69 - 1 1,109
Rabat (G) 34 - 801 27 7 518 1,451 309 196 377 387 98 2,818 28 215 12 9 4,469
San Lawrenz 8 - 93 - - 54 138 23 15 39 29 10 254 - - - - 409
Sannat 26 - 204 12 1 184 392 79 46 97 64 12 690 8 34 4 4 1,167
Xaghra 15 - 748 - 2 363 1,031 171 128 244 244 42 1,860 9 48 - 9 3,054
Xewkija 41 - 609 6 - 300 600 112 106 186 151 25 1,180 10 19 1 9 2,175
Zebbug (G) 7 - 291 1 1 167 339 88 57 80 96 17 677 2 6 15 2 1,169
Total 252 - 4,802 59 18 2,976 6,602 1,393 971 1,714 1,592 353 12,625 79 418 36 46 21,311
Self drive cars
Self drive motor cycles
Taxi TOTALSPrivate vehicle classes
Table 12. Stock of licensed motor vehicles by Gozo locality as at 31 December 2001
YEAR Agric Coach Comm. Veh. G/Hire Mini
busMotor cycle
Route bus
Lm ' 000
No Value No Value No Value No Value No Value No Value No ValuePassenger 1997 Petrol N 986 1,719 5,168 12,485 1,087 5,668 49 942 7,290 20,814Motor 1998 Petrol N 1,494 2,706 5,541 13,301 961 5,135 34 551 8,030 21,693Vehicles 1999 Petrol N 1,915 3,815 6,321 14,433 1,349 7,435 70 1,297 9,655 26,980
2000 Petrol N 868 1,701 5,025 11,194 1,190 7,342 72 1,335 7,155 21,5721997 Petrol U 33 47 140 280 67 274 18 52 17 105 275 7581998 Petrol U 90 57 121 232 48 138 21 54 8 69 288 5501999 Petrol U 14 25 232 541 39 112 13 90 13 136 311 9042000 Petrol U 19 23 230 477 51 163 13 48 11 79 324 7901997 Diesel N 2,101 7,749 249 1,704 2,350 9,4531998 Diesel N 25 77 1,839 7,798 254 1,572 2,118 9,4471999 Diesel N 98 271 3,040 12,099 247 1,841 3,385 14,2112000 Diesel N 777 1,809 4,671 16,960 220 1,905 5,668 20,6741997 Diesel U 9 8 21 68 6 34 36 1101998 Diesel U 117 173 20 71 137 2441999 Diesel U 590 988 4 4 1 10 595 1,0022000 Diesel U 1,102 1,792 34 114 4 10 1,140 1,916
Public 1997 Diesel N 5 24 2 484 7 508Transport- 1998 Diesel N 95 597 26 164 121 761Type 1999 Diesel N 57 385 34 254 91 639Passmotor 2000 Diesel N 21 153 15 158 36 311
1997 Diesel U 22 154 18 383 40 5371998 Diesel U 2 27 3 20 6 93 11 1401999 Diesel U 11 89 10 62 21 1512000 Diesel U 6 31 1 2 7 332001 Diesel U 7 39 2 4 9 432001 Petrol U 3 29 3 29
Source: Trade Statistics
Lm' 000
No Value No Value No Value No Value No Value1998 387 218 44 38 121 181 161 487 713 9241999 700 391 50 45 182 307 223 688 1155 14312000 626 350 52 38 90 133 222 842 990 13632001 587 250 44 28 86 125 155 658 872 1061
Source: Trade Statistics
PeriodCubic capacity (cc)
>250 250-499 500-799 800+ Total
2500+ 3000+ Total
Table 14. Imports of new and second hand motor cycles by engine cubic capacity
Table 13. Imports of new and second hand motor vehicles by category and engine cubic capacity
Category Period Fuel N\UCubic capacity (cc)
<999 1000-1499 1500-2499 1500-2999
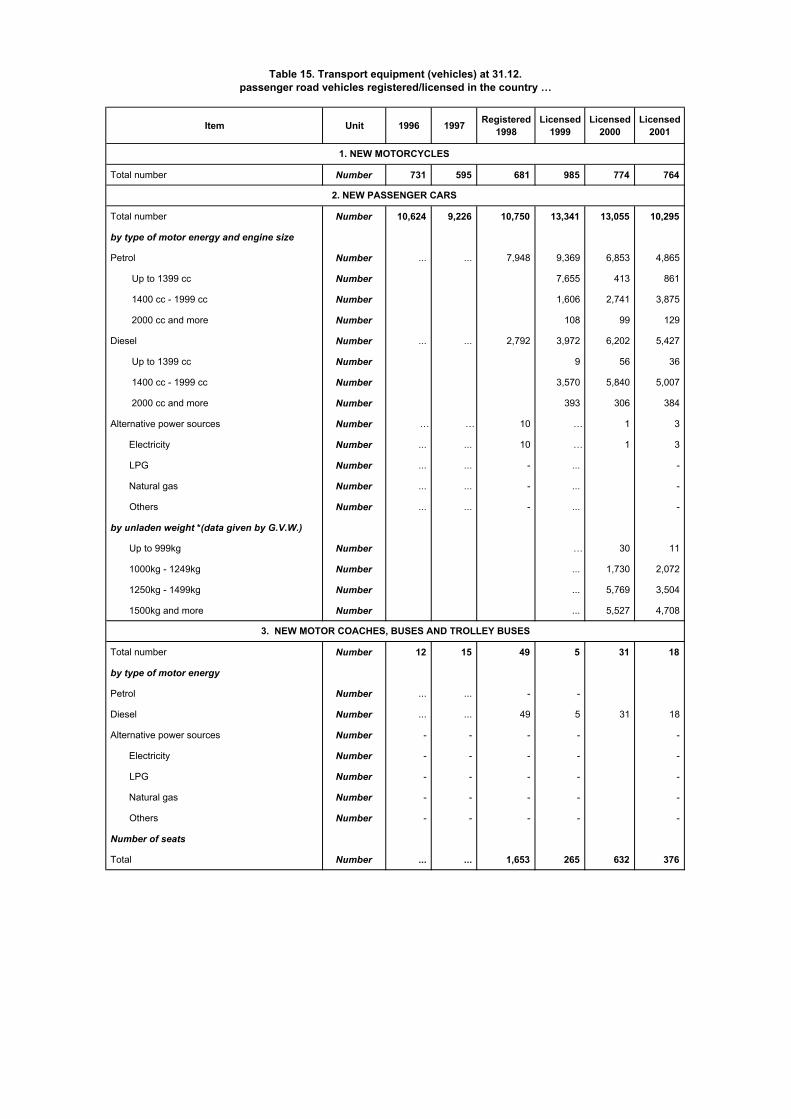
Item Unit 1996 1997 Registered 1998
Licensed 1999
Licensed 2000
Licensed 2001
Total number Number 731 595 681 985 774 764
Total number Number 10,624 9,226 10,750 13,341 13,055 10,295
by type of motor energy and engine size
Petrol Number ... ... 7,948 9,369 6,853 4,865
Up to 1399 cc Number 7,655 413 861
1400 cc - 1999 cc Number 1,606 2,741 3,875
2000 cc and more Number 108 99 129
Diesel Number ... ... 2,792 3,972 6,202 5,427
Up to 1399 cc Number 9 56 36
1400 cc - 1999 cc Number 3,570 5,840 5,007
2000 cc and more Number 393 306 384
Alternative power sources Number … … 10 … 1 3
Electricity Number ... ... 10 … 1 3
LPG Number ... ... - ... -
Natural gas Number ... ... - ... -
Others Number ... ... - ... -
by unladen weight *(data given by G.V.W.)
Up to 999kg Number … 30 11
1000kg - 1249kg Number ... 1,730 2,072
1250kg - 1499kg Number ... 5,769 3,504
1500kg and more Number ... 5,527 4,708
Total number Number 12 15 49 5 31 18
by type of motor energy
Petrol Number ... ... - -
Diesel Number ... ... 49 5 31 18
Alternative power sources Number - - - - -
Electricity Number - - - - -
LPG Number - - - - -
Natural gas Number - - - - -
Others Number - - - - -
Number of seats
Total Number ... ... 1,653 265 632 376
Table 15. Transport equipment (vehicles) at 31.12.passenger road vehicles registered/licensed in the country …
1. NEW MOTORCYCLES
2. NEW PASSENGER CARS
3. NEW MOTOR COACHES, BUSES AND TROLLEY BUSES
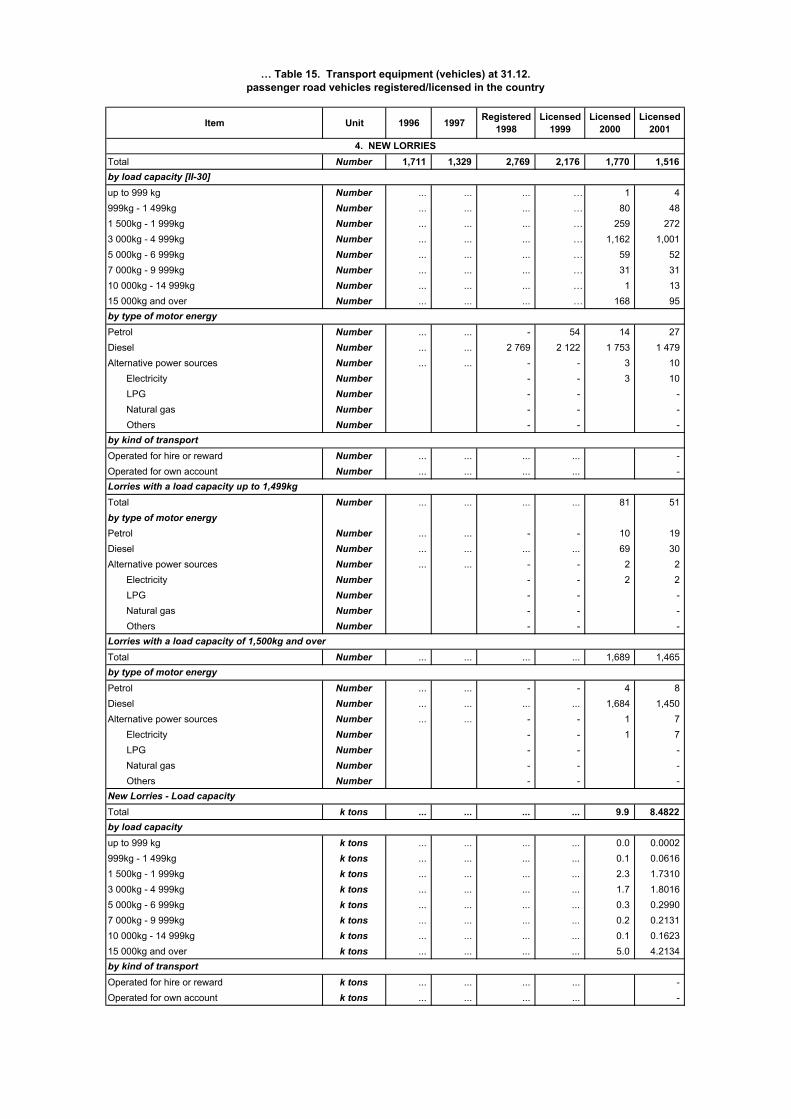
Item Unit 1996 1997 Registered 1998
Licensed 1999
Licensed 2000
Licensed 2001
Total Number 1,711 1,329 2,769 2,176 1,770 1,516
up to 999 kg Number ... ... ... … 1 4999kg - 1 499kg Number ... ... ... … 80 481 500kg - 1 999kg Number ... ... ... … 259 2723 000kg - 4 999kg Number ... ... ... … 1,162 1,0015 000kg - 6 999kg Number ... ... ... … 59 527 000kg - 9 999kg Number ... ... ... … 31 3110 000kg - 14 999kg Number ... ... ... … 1 1315 000kg and over Number ... ... ... … 168 95
Petrol Number ... ... - 54 14 27Diesel Number ... ... 2 769 2 122 1 753 1 479Alternative power sources Number ... ... - - 3 10 Electricity Number - - 3 10 LPG Number - - - Natural gas Number - - - Others Number - - -
Operated for hire or reward Number ... ... ... ... - Operated for own account Number ... ... ... ... -
Total Number ... ... ... ... 81 51by type of motor energyPetrol Number ... ... - - 10 19Diesel Number ... ... ... ... 69 30Alternative power sources Number ... ... - - 2 2 Electricity Number - - 2 2 LPG Number - - - Natural gas Number - - - Others Number - - -
Total Number ... ... ... ... 1,689 1,465
Petrol Number ... ... - - 4 8Diesel Number ... ... ... ... 1,684 1,450Alternative power sources Number ... ... - - 1 7 Electricity Number - - 1 7 LPG Number - - - Natural gas Number - - - Others Number - - -
Total k tons ... ... ... ... 9.9 8.4822
up to 999 kg k tons ... ... ... ... 0.0 0.0002999kg - 1 499kg k tons ... ... ... ... 0.1 0.06161 500kg - 1 999kg k tons ... ... ... ... 2.3 1.73103 000kg - 4 999kg k tons ... ... ... ... 1.7 1.80165 000kg - 6 999kg k tons ... ... ... ... 0.3 0.29907 000kg - 9 999kg k tons ... ... ... ... 0.2 0.213110 000kg - 14 999kg k tons ... ... ... ... 0.1 0.162315 000kg and over k tons ... ... ... ... 5.0 4.2134
Operated for hire or reward k tons ... ... ... ... - Operated for own account k tons ... ... ... ... -
by type of motor energy
Lorries with a load capacity up to 1,499kg
by kind of transport
by kind of transport
Lorries with a load capacity of 1,500kg and over
by type of motor energy
New Lorries - Load capacity
by load capacity
by load capacity [II-30]
4. NEW LORRIES
… Table 15. Transport equipment (vehicles) at 31.12.passenger road vehicles registered/licensed in the country
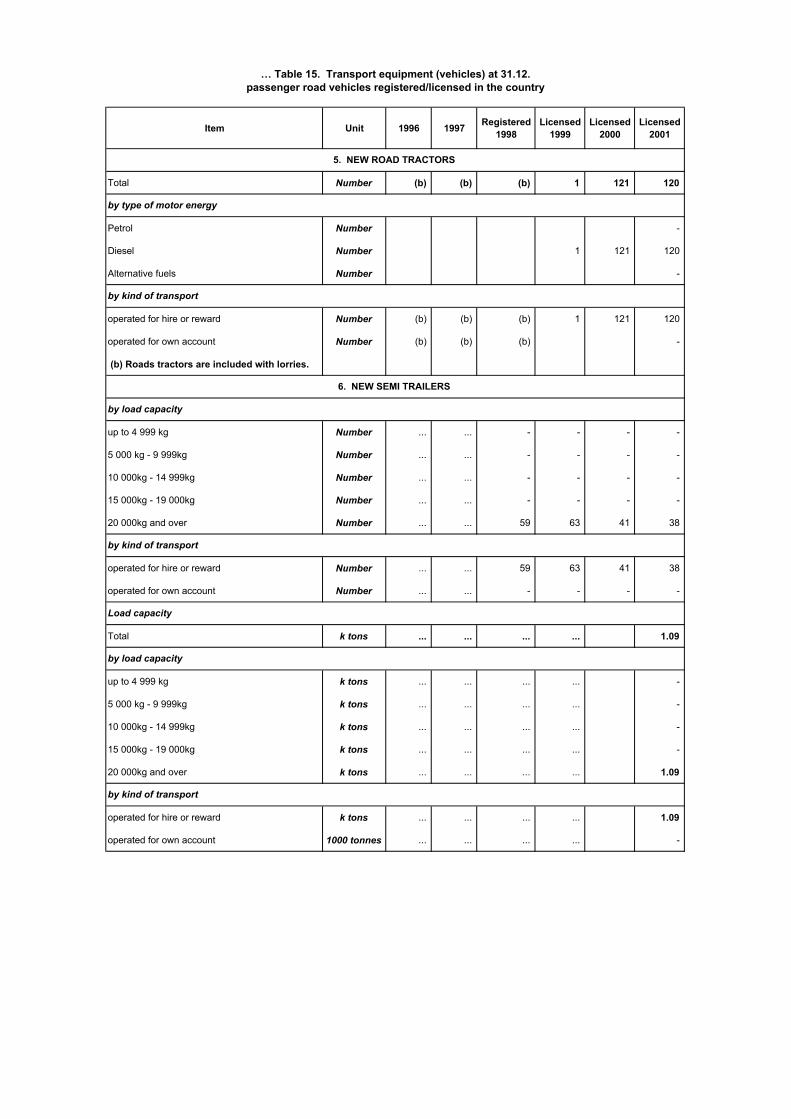
Item Unit 1996 1997 Registered 1998
Licensed 1999
Licensed 2000
Licensed 2001
Total Number (b) (b) (b) 1 121 120
Petrol Number -
Diesel Number 1 121 120
Alternative fuels Number -
operated for hire or reward Number (b) (b) (b) 1 121 120
operated for own account Number (b) (b) (b) -
(b) Roads tractors are included with lorries.
up to 4 999 kg Number ... ... - - - -
5 000 kg - 9 999kg Number ... ... - - - -
10 000kg - 14 999kg Number ... ... - - - -
15 000kg - 19 000kg Number ... ... - - - -
20 000kg and over Number ... ... 59 63 41 38
operated for hire or reward Number ... ... 59 63 41 38
operated for own account Number ... ... - - - -
Total k tons ... ... ... ... 1.09
up to 4 999 kg k tons ... ... ... ... -
5 000 kg - 9 999kg k tons ... ... ... ... -
10 000kg - 14 999kg k tons ... ... ... ... -
15 000kg - 19 000kg k tons ... ... ... ... -
20 000kg and over k tons ... ... ... ... 1.09
operated for hire or reward k tons ... ... ... ... 1.09
operated for own account 1000 tonnes ... ... ... ... -
Load capacity
by load capacity
by kind of transport
by kind of transport
6. NEW SEMI TRAILERS
by load capacity
by kind of transport
5. NEW ROAD TRACTORS
by type of motor energy
… Table 15. Transport equipment (vehicles) at 31.12.passenger road vehicles registered/licensed in the country
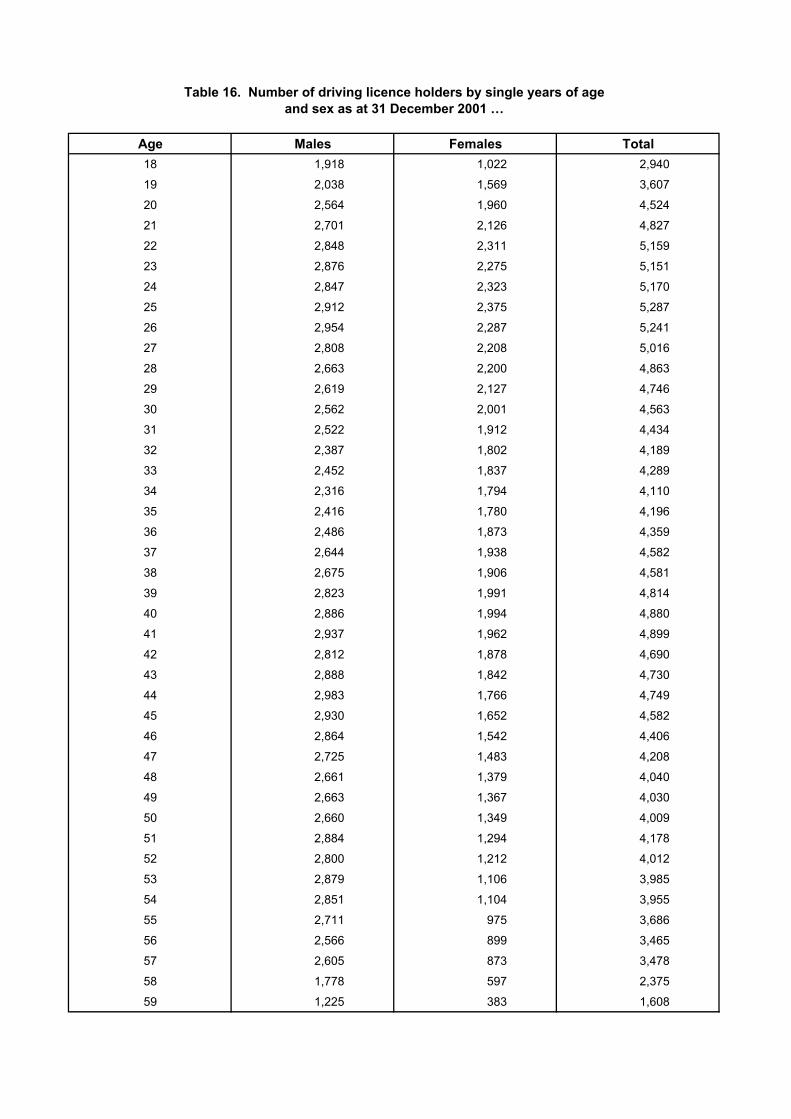
Age Males Females Total18 1,918 1,022 2,940
19 2,038 1,569 3,607
20 2,564 1,960 4,524
21 2,701 2,126 4,827
22 2,848 2,311 5,159
23 2,876 2,275 5,151
24 2,847 2,323 5,170
25 2,912 2,375 5,287
26 2,954 2,287 5,241
27 2,808 2,208 5,016
28 2,663 2,200 4,863
29 2,619 2,127 4,746
30 2,562 2,001 4,563
31 2,522 1,912 4,434
32 2,387 1,802 4,189
33 2,452 1,837 4,289
34 2,316 1,794 4,110
35 2,416 1,780 4,196
36 2,486 1,873 4,359
37 2,644 1,938 4,582
38 2,675 1,906 4,581
39 2,823 1,991 4,814
40 2,886 1,994 4,880
41 2,937 1,962 4,899
42 2,812 1,878 4,690
43 2,888 1,842 4,730
44 2,983 1,766 4,749
45 2,930 1,652 4,582
46 2,864 1,542 4,406
47 2,725 1,483 4,208
48 2,661 1,379 4,040
49 2,663 1,367 4,030
50 2,660 1,349 4,009
51 2,884 1,294 4,178
52 2,800 1,212 4,012
53 2,879 1,106 3,985
54 2,851 1,104 3,955
55 2,711 975 3,686
56 2,566 899 3,465
57 2,605 873 3,478
58 1,778 597 2,375
59 1,225 383 1,608
Table 16. Number of driving licence holders by single years of ageand sex as at 31 December 2001 …
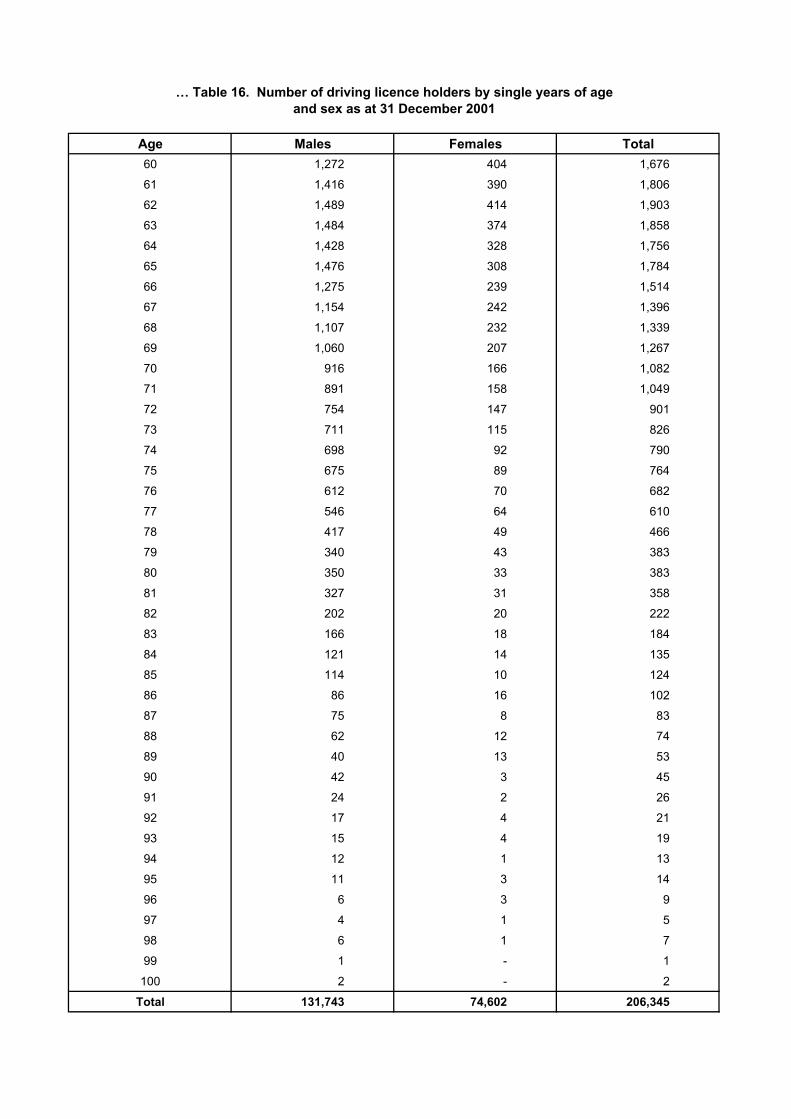
Age Males Females Total60 1,272 404 1,676
61 1,416 390 1,806
62 1,489 414 1,903
63 1,484 374 1,858
64 1,428 328 1,756
65 1,476 308 1,784
66 1,275 239 1,514
67 1,154 242 1,396
68 1,107 232 1,339
69 1,060 207 1,267
70 916 166 1,082
71 891 158 1,049
72 754 147 901
73 711 115 826
74 698 92 790
75 675 89 764
76 612 70 682
77 546 64 610
78 417 49 466
79 340 43 383
80 350 33 383
81 327 31 358
82 202 20 222
83 166 18 184
84 121 14 135
85 114 10 124
86 86 16 102
87 75 8 83
88 62 12 74
89 40 13 53
90 42 3 45
91 24 2 26
92 17 4 21
93 15 4 19
94 12 1 13
95 11 3 14
96 6 3 9
97 4 1 5
98 6 1 7
99 1 - 1
100 2 - 2
Total 131,743 74,602 206,345
… Table 16. Number of driving licence holders by single years of ageand sex as at 31 December 2001
Age Males Females Total
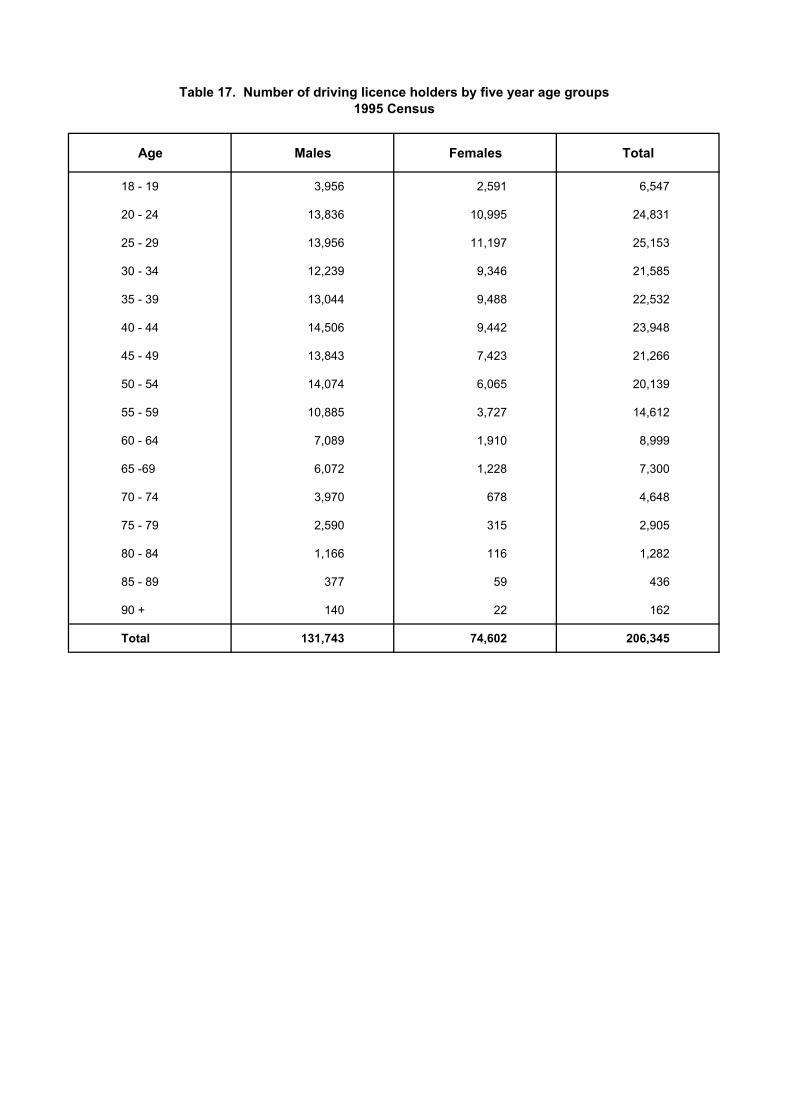
18 - 19 3,956 2,591 6,547
20 - 24 13,836 10,995 24,831
25 - 29 13,956 11,197 25,153
30 - 34 12,239 9,346 21,585
35 - 39 13,044 9,488 22,532
40 - 44 14,506 9,442 23,948
45 - 49 13,843 7,423 21,266
50 - 54 14,074 6,065 20,139
55 - 59 10,885 3,727 14,612
60 - 64 7,089 1,910 8,999
65 -69 6,072 1,228 7,300
70 - 74 3,970 678 4,648
75 - 79 2,590 315 2,905
80 - 84 1,166 116 1,282
85 - 89 377 59 436
90 + 140 22 162
Total 131,743 74,602 206,345
Table 17. Number of driving licence holders by five year age groups1995 Census
Males Females Total Males Females Total Males Females Total
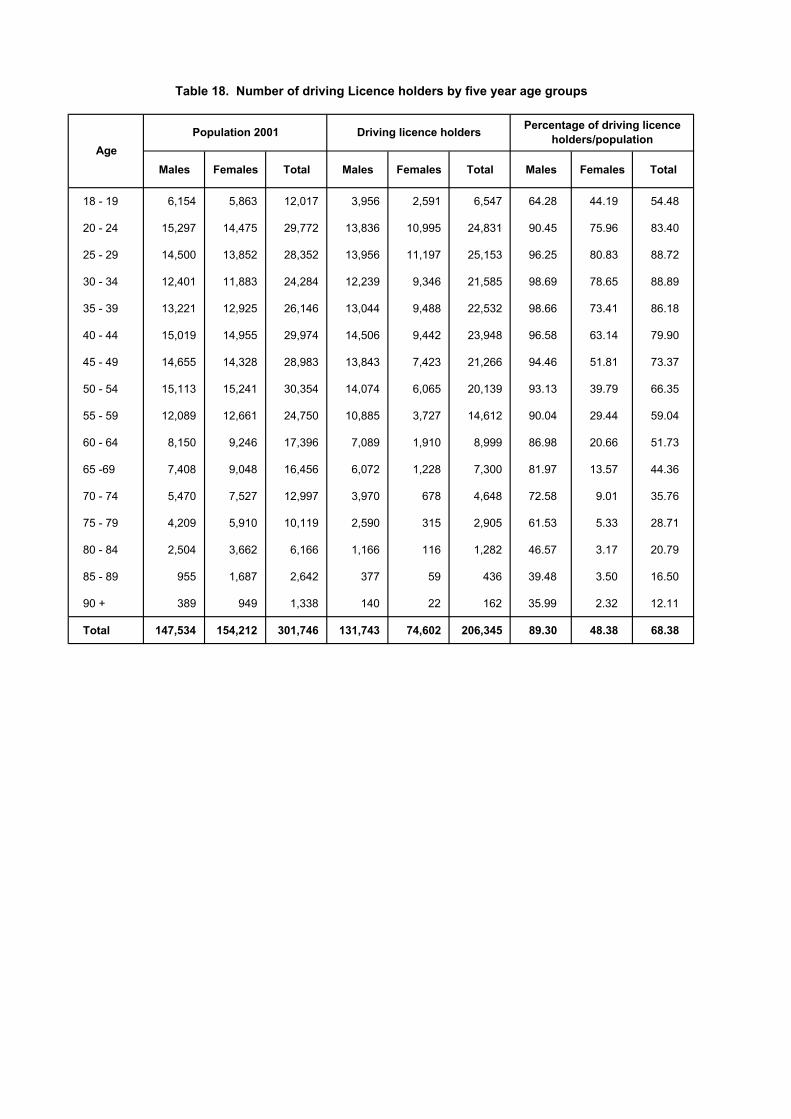
18 - 19 6,154 5,863 12,017 3,956 2,591 6,547 64.28 44.19 54.48
20 - 24 15,297 14,475 29,772 13,836 10,995 24,831 90.45 75.96 83.40
25 - 29 14,500 13,852 28,352 13,956 11,197 25,153 96.25 80.83 88.72
30 - 34 12,401 11,883 24,284 12,239 9,346 21,585 98.69 78.65 88.89
35 - 39 13,221 12,925 26,146 13,044 9,488 22,532 98.66 73.41 86.18
40 - 44 15,019 14,955 29,974 14,506 9,442 23,948 96.58 63.14 79.90
45 - 49 14,655 14,328 28,983 13,843 7,423 21,266 94.46 51.81 73.37
50 - 54 15,113 15,241 30,354 14,074 6,065 20,139 93.13 39.79 66.35
55 - 59 12,089 12,661 24,750 10,885 3,727 14,612 90.04 29.44 59.04
60 - 64 8,150 9,246 17,396 7,089 1,910 8,999 86.98 20.66 51.73
65 -69 7,408 9,048 16,456 6,072 1,228 7,300 81.97 13.57 44.36
70 - 74 5,470 7,527 12,997 3,970 678 4,648 72.58 9.01 35.76
75 - 79 4,209 5,910 10,119 2,590 315 2,905 61.53 5.33 28.71
80 - 84 2,504 3,662 6,166 1,166 116 1,282 46.57 3.17 20.79
85 - 89 955 1,687 2,642 377 59 436 39.48 3.50 16.50
90 + 389 949 1,338 140 22 162 35.99 2.32 12.11
Total 147,534 154,212 301,746 131,743 74,602 206,345 89.30 48.38 68.38
Percentage of driving licence holders/population
Age
Table 18. Number of driving Licence holders by five year age groups
Population 2001 Driving licence holders
Other Transport
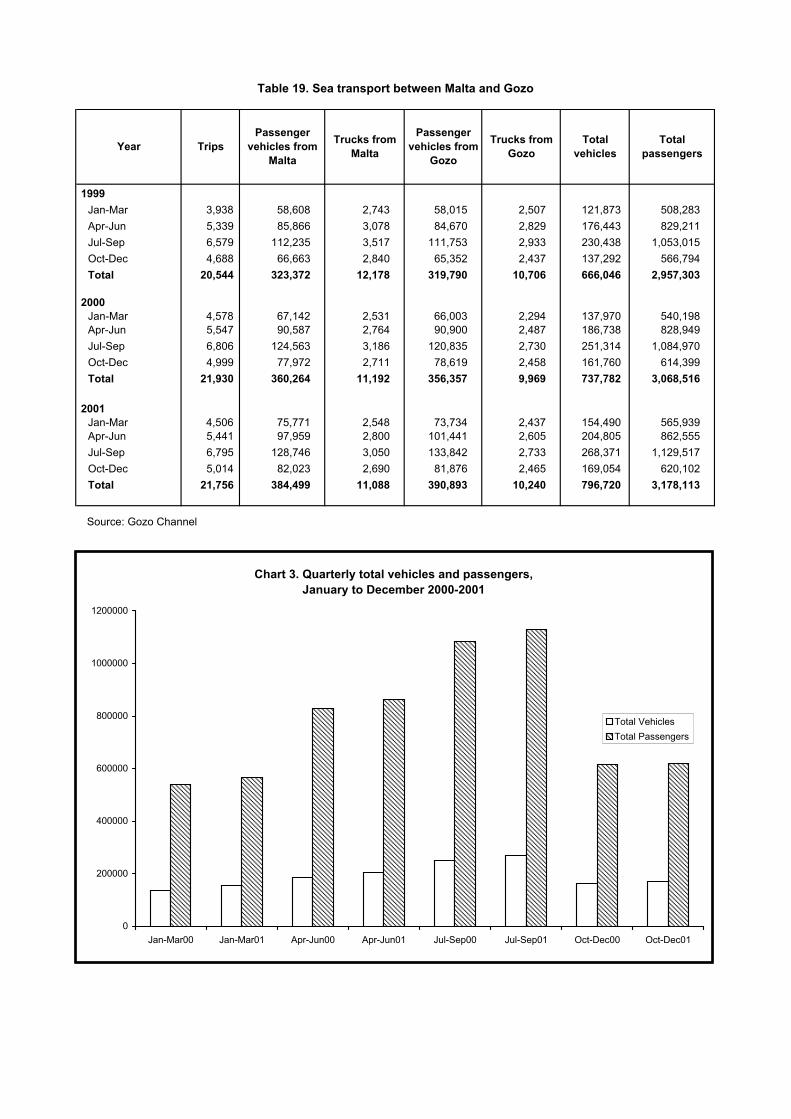
1999Jan-Mar 3,938 58,608 2,743 58,015 2,507 121,873 508,283Apr-Jun 5,339 85,866 3,078 84,670 2,829 176,443 829,211Jul-Sep 6,579 112,235 3,517 111,753 2,933 230,438 1,053,015Oct-Dec 4,688 66,663 2,840 65,352 2,437 137,292 566,794Total 20,544 323,372 12,178 319,790 10,706 666,046 2,957,303
2000Jan-Mar 4,578 67,142 2,531 66,003 2,294 137,970 540,198Apr-Jun 5,547 90,587 2,764 90,900 2,487 186,738 828,949Jul-Sep 6,806 124,563 3,186 120,835 2,730 251,314 1,084,970Oct-Dec 4,999 77,972 2,711 78,619 2,458 161,760 614,399Total 21,930 360,264 11,192 356,357 9,969 737,782 3,068,516
2001Jan-Mar 4,506 75,771 2,548 73,734 2,437 154,490 565,939Apr-Jun 5,441 97,959 2,800 101,441 2,605 204,805 862,555Jul-Sep 6,795 128,746 3,050 133,842 2,733 268,371 1,129,517Oct-Dec 5,014 82,023 2,690 81,876 2,465 169,054 620,102Total 21,756 384,499 11,088 390,893 10,240 796,720 3,178,113
Source: Gozo Channel
Table 19. Sea transport between Malta and Gozo
Total passengersYear Trips
Passenger vehicles from
Malta
Trucks from Malta
Passenger vehicles from
Gozo
Trucks from Gozo
Total vehicles
Chart 3. Quarterly total vehicles and passengers, January to December 2000-2001
0
200000
400000
600000
800000
1000000
1200000
Jan-Mar00 Jan-Mar01 Apr-Jun00 Apr-Jun01 Jul-Sep00 Jul-Sep01 Oct-Dec00 Oct-Dec01
Total VehiclesTotal Passengers
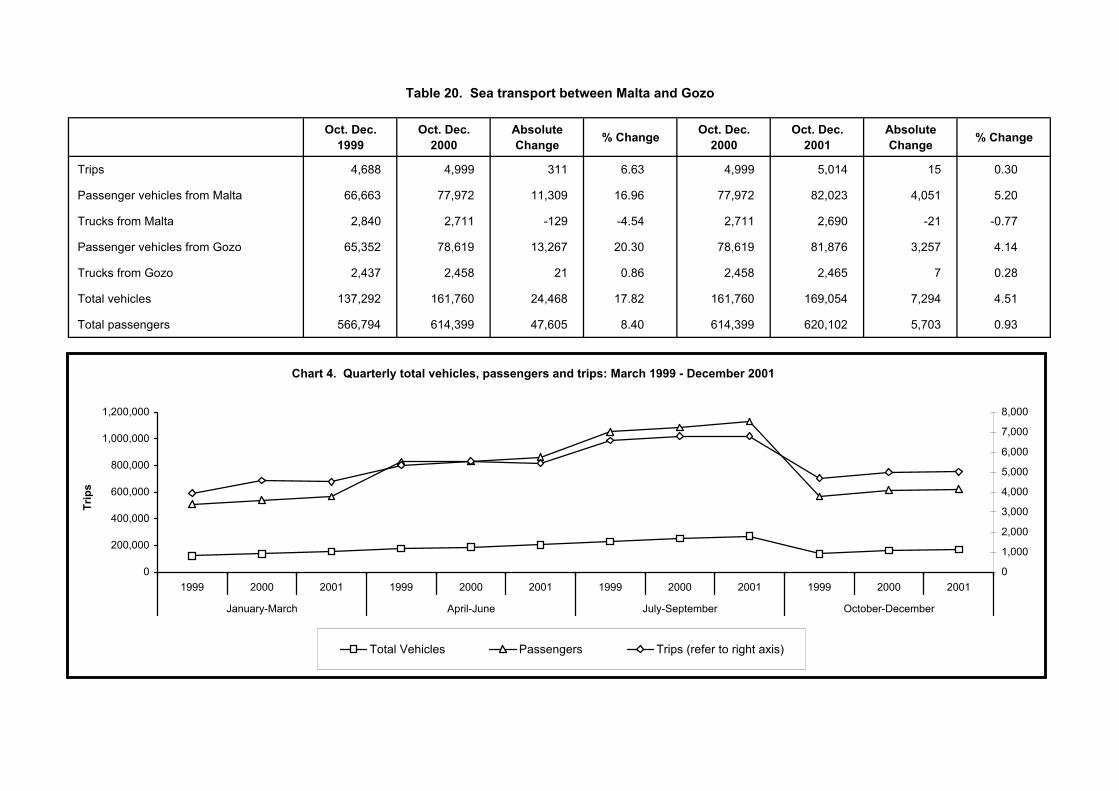
Oct. Dec. 1999
Oct. Dec. 2000
Absolute Change % Change Oct. Dec.
2000Oct. Dec.
2001Absolute Change % Change
Trips 4,688 4,999 311 6.63 4,999 5,014 15 0.30
Passenger vehicles from Malta 66,663 77,972 11,309 16.96 77,972 82,023 4,051 5.20
Trucks from Malta 2,840 2,711 -129 -4.54 2,711 2,690 -21 -0.77
Passenger vehicles from Gozo 65,352 78,619 13,267 20.30 78,619 81,876 3,257 4.14
Trucks from Gozo 2,437 2,458 21 0.86 2,458 2,465 7 0.28
Total vehicles 137,292 161,760 24,468 17.82 161,760 169,054 7,294 4.51
Total passengers 566,794 614,399 47,605 8.40 614,399 620,102 5,703 0.93
Table 20. Sea transport between Malta and Gozo
Chart 4. Quarterly total vehicles, passengers and trips: March 1999 - December 2001
0
200,000
400,000
600,000
800,000
1,000,000
1,200,000
1999 2000 2001 1999 2000 2001 1999 2000 2001 1999 2000 2001
January-March April-June July-September October-December
Trip
s
0
1,000
2,000
3,000
4,000
5,000
6,000
7,000
8,000
Total Vehicles Passengers Trips (refer to right axis)
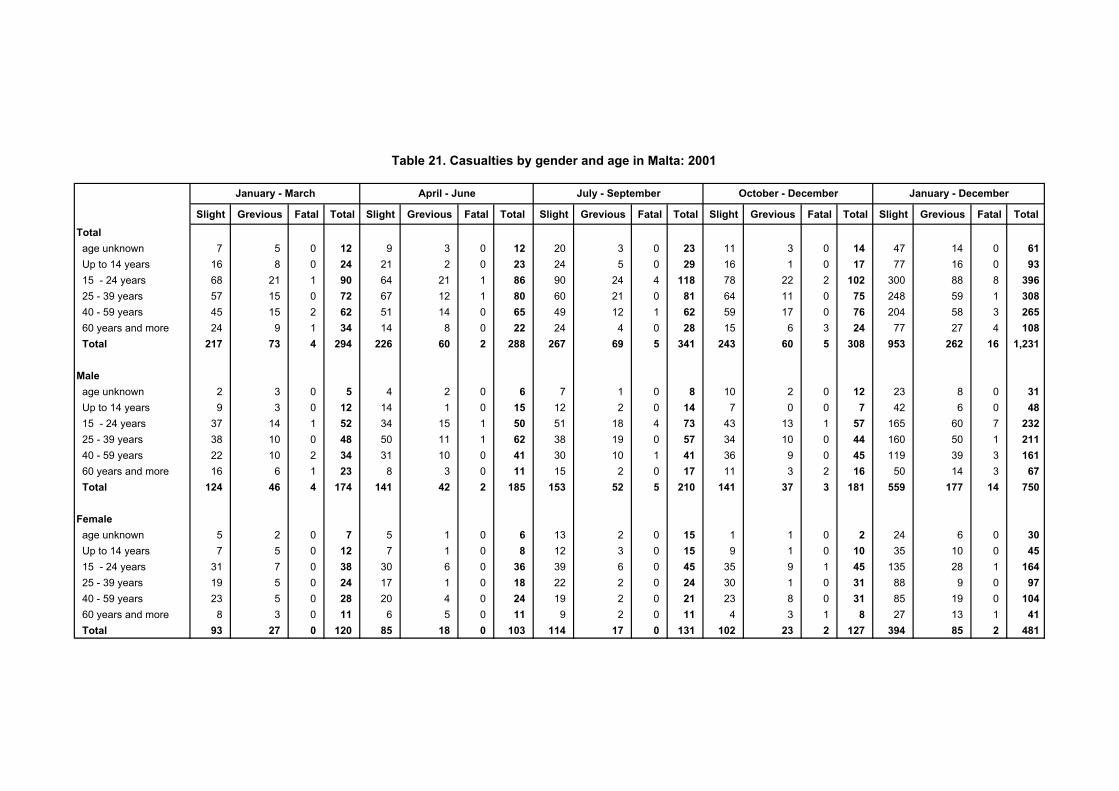
Table 21. Casualties by gender and age in Malta: 2001
Slight Grevious Fatal Total Slight Grevious Fatal Total Slight Grevious Fatal Total Slight Grevious Fatal Total Slight Grevious Fatal TotalTotal age unknown 7 5 0 12 9 3 0 12 20 3 0 23 11 3 0 14 47 14 0 61 Up to 14 years 16 8 0 24 21 2 0 23 24 5 0 29 16 1 0 17 77 16 0 93 15 - 24 years 68 21 1 90 64 21 1 86 90 24 4 118 78 22 2 102 300 88 8 396 25 - 39 years 57 15 0 72 67 12 1 80 60 21 0 81 64 11 0 75 248 59 1 308 40 - 59 years 45 15 2 62 51 14 0 65 49 12 1 62 59 17 0 76 204 58 3 265 60 years and more 24 9 1 34 14 8 0 22 24 4 0 28 15 6 3 24 77 27 4 108 Total 217 73 4 294 226 60 2 288 267 69 5 341 243 60 5 308 953 262 16 1,231
Male age unknown 2 3 0 5 4 2 0 6 7 1 0 8 10 2 0 12 23 8 0 31 Up to 14 years 9 3 0 12 14 1 0 15 12 2 0 14 7 0 0 7 42 6 0 48 15 - 24 years 37 14 1 52 34 15 1 50 51 18 4 73 43 13 1 57 165 60 7 232 25 - 39 years 38 10 0 48 50 11 1 62 38 19 0 57 34 10 0 44 160 50 1 211 40 - 59 years 22 10 2 34 31 10 0 41 30 10 1 41 36 9 0 45 119 39 3 161 60 years and more 16 6 1 23 8 3 0 11 15 2 0 17 11 3 2 16 50 14 3 67 Total 124 46 4 174 141 42 2 185 153 52 5 210 141 37 3 181 559 177 14 750
Female age unknown 5 2 0 7 5 1 0 6 13 2 0 15 1 1 0 2 24 6 0 30 Up to 14 years 7 5 0 12 7 1 0 8 12 3 0 15 9 1 0 10 35 10 0 45 15 - 24 years 31 7 0 38 30 6 0 36 39 6 0 45 35 9 1 45 135 28 1 164 25 - 39 years 19 5 0 24 17 1 0 18 22 2 0 24 30 1 0 31 88 9 0 97 40 - 59 years 23 5 0 28 20 4 0 24 19 2 0 21 23 8 0 31 85 19 0 104 60 years and more 8 3 0 11 6 5 0 11 9 2 0 11 4 3 1 8 27 13 1 41 Total 93 27 0 120 85 18 0 103 114 17 0 131 102 23 2 127 394 85 2 481
January - March January - DecemberApril - June July - September October - December
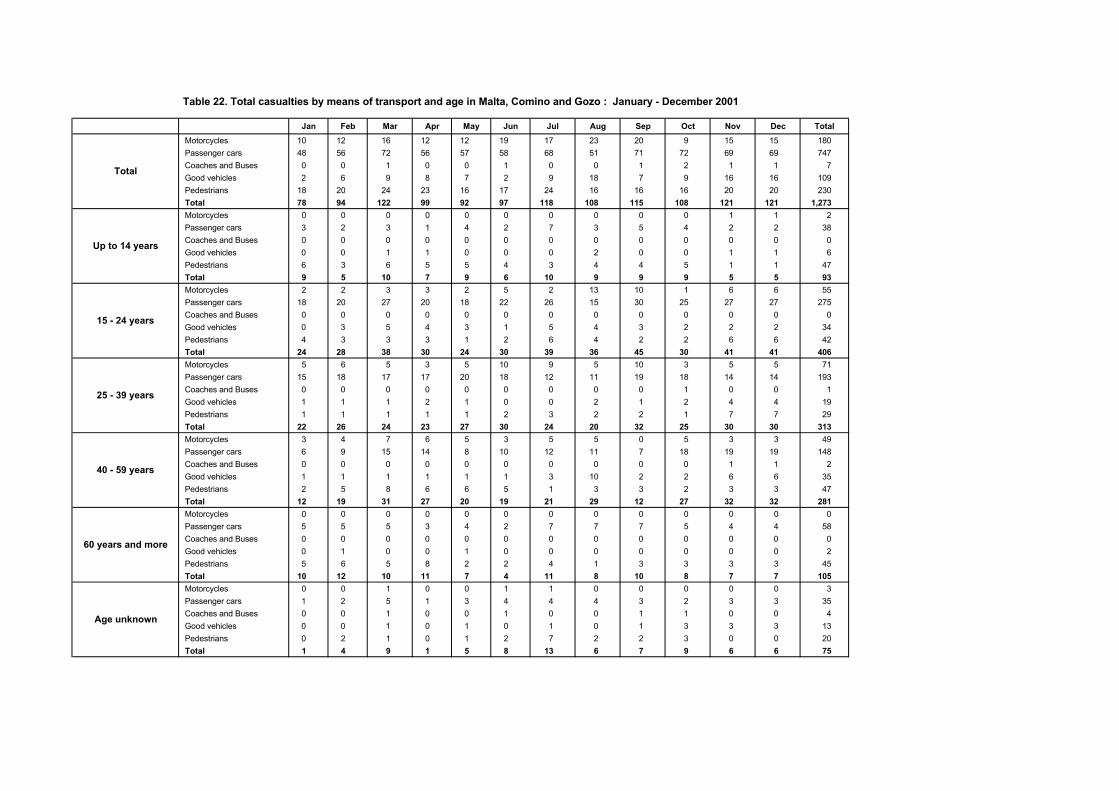
Jan Feb Mar Apr May Jun Jul Aug Sep Oct Nov Dec Total Motorcycles 10 12 16 12 12 19 17 23 20 9 15 15 180 Passenger cars 48 56 72 56 57 58 68 51 71 72 69 69 747 Coaches and Buses 0 0 1 0 0 1 0 0 1 2 1 1 7 Good vehicles 2 6 9 8 7 2 9 18 7 9 16 16 109 Pedestrians 18 20 24 23 16 17 24 16 16 16 20 20 230 Total 78 94 122 99 92 97 118 108 115 108 121 121 1,273 Motorcycles 0 0 0 0 0 0 0 0 0 0 1 1 2 Passenger cars 3 2 3 1 4 2 7 3 5 4 2 2 38 Coaches and Buses 0 0 0 0 0 0 0 0 0 0 0 0 0 Good vehicles 0 0 1 1 0 0 0 2 0 0 1 1 6 Pedestrians 6 3 6 5 5 4 3 4 4 5 1 1 47 Total 9 5 10 7 9 6 10 9 9 9 5 5 93 Motorcycles 2 2 3 3 2 5 2 13 10 1 6 6 55 Passenger cars 18 20 27 20 18 22 26 15 30 25 27 27 275 Coaches and Buses 0 0 0 0 0 0 0 0 0 0 0 0 0 Good vehicles 0 3 5 4 3 1 5 4 3 2 2 2 34 Pedestrians 4 3 3 3 1 2 6 4 2 2 6 6 42 Total 24 28 38 30 24 30 39 36 45 30 41 41 406 Motorcycles 5 6 5 3 5 10 9 5 10 3 5 5 71 Passenger cars 15 18 17 17 20 18 12 11 19 18 14 14 193 Coaches and Buses 0 0 0 0 0 0 0 0 0 1 0 0 1 Good vehicles 1 1 1 2 1 0 0 2 1 2 4 4 19 Pedestrians 1 1 1 1 1 2 3 2 2 1 7 7 29 Total 22 26 24 23 27 30 24 20 32 25 30 30 313 Motorcycles 3 4 7 6 5 3 5 5 0 5 3 3 49 Passenger cars 6 9 15 14 8 10 12 11 7 18 19 19 148 Coaches and Buses 0 0 0 0 0 0 0 0 0 0 1 1 2 Good vehicles 1 1 1 1 1 1 3 10 2 2 6 6 35 Pedestrians 2 5 8 6 6 5 1 3 3 2 3 3 47 Total 12 19 31 27 20 19 21 29 12 27 32 32 281 Motorcycles 0 0 0 0 0 0 0 0 0 0 0 0 0 Passenger cars 5 5 5 3 4 2 7 7 7 5 4 4 58 Coaches and Buses 0 0 0 0 0 0 0 0 0 0 0 0 0 Good vehicles 0 1 0 0 1 0 0 0 0 0 0 0 2 Pedestrians 5 6 5 8 2 2 4 1 3 3 3 3 45 Total 10 12 10 11 7 4 11 8 10 8 7 7 105 Motorcycles 0 0 1 0 0 1 1 0 0 0 0 0 3 Passenger cars 1 2 5 1 3 4 4 4 3 2 3 3 35 Coaches and Buses 0 0 1 0 0 1 0 0 1 1 0 0 4 Good vehicles 0 0 1 0 1 0 1 0 1 3 3 3 13 Pedestrians 0 2 1 0 1 2 7 2 2 3 0 0 20 Total 1 4 9 1 5 8 13 6 7 9 6 6 75
Table 22. Total casualties by means of transport and age in Malta, Comino and Gozo : January - December 2001
Total
Age unknown
60 years and more
40 - 59 years
25 - 39 years
15 - 24 years
Up to 14 years
1999 2000 Absolute change
% Change 2000 2001 Absolute
change%
Change
Island of Malta 10,870 3,795 -7,075 (65.09) 12,030 12,780 750 6.23
Southern Harbour District 2,305 2,621 316 13.71 2,621 2,716 95 3.62
Northern Harbour District 4,627 5,074 447 9.66 5,074 5,356 282 5.56
South Eastern District 1,057 1,174 117 11.07 1,174 1,263 89 7.58
Western District 1,070 1,145 75 7.01 1,145 1,271 126 11.00
Northern District 1,811 2,016 205 11.32 2,016 2,174 158 7.84
Gozo and Comino 586 624 38 6.48 624 592 -32 (5.13)
TOTAL 11,456 4,419 -7,037 (61.43) 12,654 13,372 718 5.67
Table 23. Total traffic accidents
Chart 5. Total Traffic Accidents
0
1,000
2,000
3,000
4,000
5,000
6,000
7,000
8,000
9,000
1999 2000 2001
South Eastern Region (Malta Xlokk) North Western Region (Malta Majjistral) Gozo and Comino
Year 1996 1997 1998 1999 2000 2001
Import duties of motor vehicles 2,233 2,147 2,163 2,278 2,094 1,700
Motor vehicle licenses 5,680 6,989 9,604 10,186 10,597 10,606
Motor vehicle registration tax 19,711 19,659 20,674 23,570 23,945 21,454
Table 24. Import duties, registration licences and excise duties collected, 1996 - 2001
Chart 6. Import duties, registration licences and excise duties collected, 1995-2000
0
3,000
6,000
9,000
12,000
15,000
18,000
21,000
24,000
27,000
1996 1997 1998 1999 2000 2001
Import duties of motor vehicles Motor vehicle licenses Motor vehicle registration tax
No % No % No % No % No % No % No % No % No % No %
Less than 11 persons 558 8.9 547 7.7 0 0.0 72 34.6 0 0.0 65 5.2 0 0.0 0 0.0 558 7.7 684 7.9
11 - 19 264 4.2 61 0.9 0 0.0 0 0.0 0 0.0 50 4.0 0 0.0 0 0.0 264 3.6 111 1.3
20 - 49 350 5.6 74 1.0 0 0.0 0 0.0 0 0.0 0 0.0 0 0.0 0 0.0 350 4.8 74 0.9
50 + 177 2.8 247 3.5 0 0.0 0 0.0 0 0.0 50 4.0 0 0.0 0 0.0 177 2.4 297 3.4 Do not know but more than 11 persons 0 0.0 0 0.0 58 25.8 0 0.0 0 0.0 0 0.0 0 0.0 0 0.0 58 0.8 0 0.0
Sub-total 1,349 21.5 929 13.1 58 25.8 72 34.6 0 0.0 165 13.1 0 0.0 0 0.0 1,407 19.4 1,166 13.5
Less than 11 persons 50 0.8 226 3.2 0 0.0 0 0.0 60 10.4 0 0.0 0 0.0 0 0.0 110 1.5 226 2.6
11 - 19 81 1.3 0 0.0 0 0.0 0 0.0 0 0.0 0 0.0 0 0.0 0 0.0 81 1.1 0 0.0
20 - 49 62 1.0 57 0.8 0 0.0 0 0.0 0 0.0 0 0.0 0 0.0 0 0.0 62 0.9 57 0.7
50 + 185 3.0 302 4.3 0 0.0 0 0.0 0 0.0 115 9.1 0 0.0 0 0.0 185 2.6 417 4.8 Do not know but more than 11 persons 0 0.0 0 0.0 0 0.0 0 0.0 0 0.0 73 5.8 0 0.0 0 0.0 0 0.0 73 0.8
Sub-total 378 6.0 585 8.3 0 0.0 0 0.0 60 10.4 188 14.9 0 0.0 0 0.0 438 6.0 773 9.0
Less than 11 persons 62 1.0 129 1.8 0 0.0 68 32.7 0 0.0 0 0.0 50 29.2 0 0.0 112 1.5 197 2.3
11 - 19 53 0.8 61 0.9 0 0.0 0 0.0 0 0.0 59 4.7 0 0.0 0 0.0 53 0.7 120 1.4
20 - 49 118 1.9 0 0.0 0 0.0 0 0.0 0 0.0 0 0.0 0 0.0 0 0.0 118 1.6 0 0.0
50 + 1,916 30.6 1,491 21.1 115 51.1 68 32.7 185 32.0 185 14.7 0 0.0 0 0.0 2,216 30.6 1,744 20.2 Do not know but more than 11 persons 0 0.0 0 0.0 0 0.0 0 0.0 0 0.0 0 0.0 0 0.0 0 0.0 0 0.0 0 0.0
Sub-total 2,149 34.3 1,681 23.7 115 51.1 136 65.4 185 32.0 244 19.4 50 29.2 0 0.0 2,499 34.5 2,061 23.9
Less than 11 persons 255 4.1 725 10.2 52 23.1 0 0.0 0 0.0 124 9.9 65 38.0 0 0.0 372 5.1 849 9.9
11 - 19 423 6.7 371 5.2 0 0.0 0 0.0 0 0.0 59 4.7 0 0.0 0 0.0 423 5.8 430 5.0
20 - 49 460 7.3 488 6.9 0 0.0 0 0.0 141 24.4 197 15.7 0 0.0 73 100.0 601 8.3 758 8.8
50 + 1,144 18.2 2,162 30.5 0 0.0 0 0.0 123 21.3 281 22.3 56 32.7 0 0.0 1,323 18.3 2,443 28.3 Do not know but more than 11 persons 113 1.8 138 1.9 0 0.0 0 0.0 69 11.9 0 0.0 0 0.0 0 0.0 182 2.5 138 1.6
Sub-total 2,395 38.2 3,884 54.9 52 23.1 0 0.0 333 57.6 661 52.5 121 70.8 73 100.0 2,901 40.0 4,618 53.6
Total 6,271 100.0 7,079 100.0 225 100.0 208 100.0 578 100.0 1,258 100.0 171 100.0 73 100.0 7,245 100.0 8,618 100.0
Supporting and
Auxiliary Transport Activities
Land Transport
Water Transport
Air Transport
Table 25. Number of persons working in one's own place of work in the whole transport sector
Male Female
Full-time job Part-time job Full-time job
2000 2001 2000 2001 2000 2001
Total
2000 2001
Part-time job
2000 2001
Total Length (km)
Malta Gozo Maltese Islands
Arterial & Distributor 137 48 185
Urban & Local Access (surfaced) 1,007 134 1,141
Urban unsurfaced (estimated) 208 73 281
Non urban (surfaced) 542 105 647
Total Length (km) 1,894 360 2,254
Category of RoadLength in Km.
Table 26. Summary of road lengths and category - December 2001
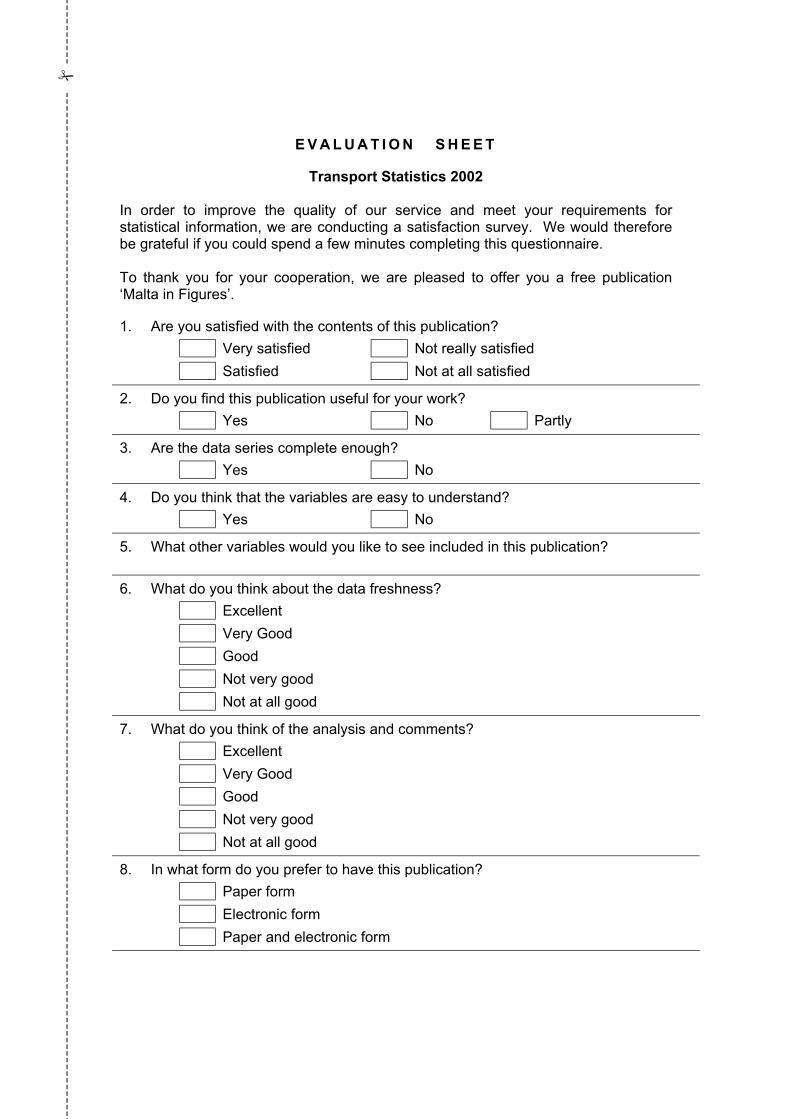
E V A L U A T I O N S H E E T
Transport Statistics 2002
In order to improve the quality of our service and meet your requirements for statistical information, we are conducting a satisfaction survey. We would therefore be grateful if you could spend a few minutes completing this questionnaire. To thank you for your cooperation, we are pleased to offer you a free publication ‘Malta in Figures’. 1. Are you satisfied with the contents of this publication?
Very satisfied Not really satisfied
Satisfied Not at all satisfied
2. Do you find this publication useful for your work?
Yes No Partly
3. Are the data series complete enough?
Yes No
4. Do you think that the variables are easy to understand?
Yes No
5. What other variables would you like to see included in this publication?
6. What do you think about the data freshness?
Excellent
Very Good
Good
Not very good
Not at all good
7. What do you think of the analysis and comments?
Excellent
Very Good
Good
Not very good
Not at all good
8. In what form do you prefer to have this publication?
Paper form
Electronic form
Paper and electronic form
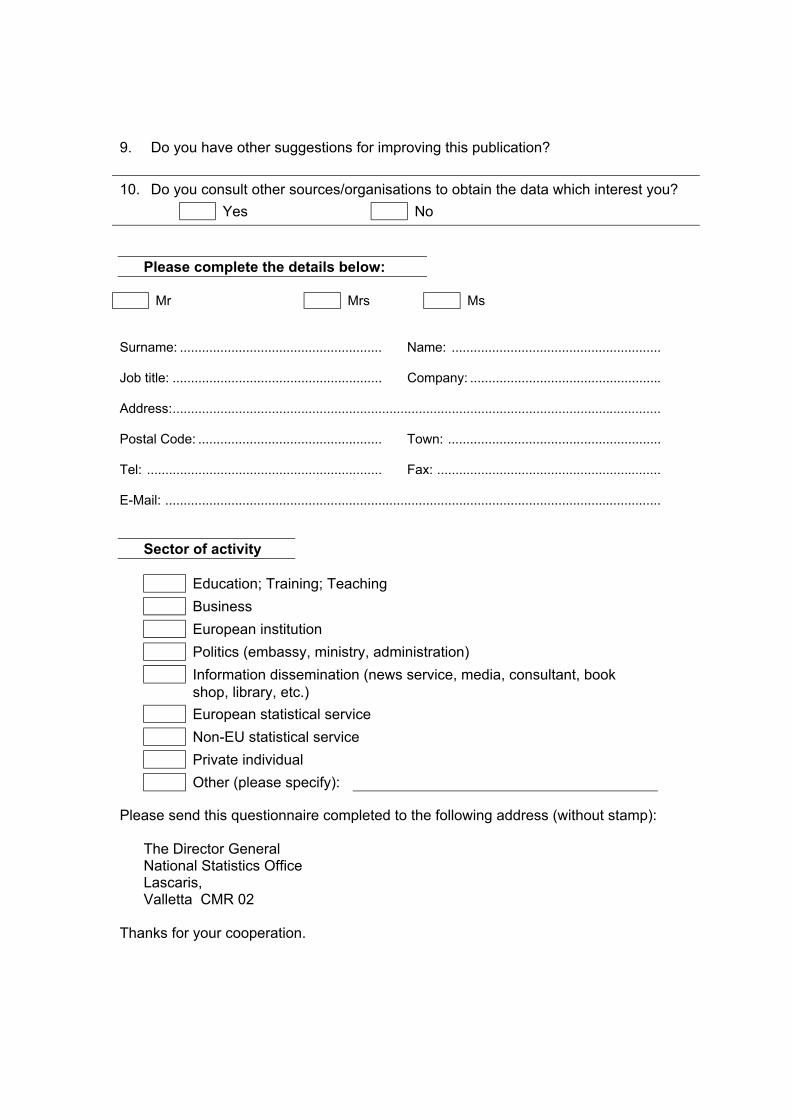
9. Do you have other suggestions for improving this publication?
10. Do you consult other sources/organisations to obtain the data which interest you?
Yes No
Please complete the details below: Mr Mrs Ms Surname: ....................................................... Name: ......................................................... Job title: ......................................................... Company: .................................................... Address:..................................................................................................................................... Postal Code: .................................................. Town: .......................................................... Tel: ................................................................ Fax: ............................................................. E-Mail: .......................................................................................................................................
Sector of activity
Education; Training; Teaching
Business
European institution
Politics (embassy, ministry, administration)
Information dissemination (news service, media, consultant, book shop, library, etc.)
European statistical service
Non-EU statistical service
Private individual
Other (please specify): Please send this questionnaire completed to the following address (without stamp):
The Director General National Statistics Office Lascaris, Valletta CMR 02
Thanks for your cooperation.