Embed Size (px)
Citation preview

Transport of CO and O3into the TexAQS II Study Area as
Observed by the Atmospheric InfraRed Sounder (AIRS)
W. Wallace McMillanAssociate Professor of Physics
Joint Center for Earth Systems TechnologyUniversity of Maryland, Baltimore County
K. Evans, X. J. Warner (UMBC/JCET), Brad Pierce (NOAA), Greg Osterman (JPL) and C. Barnet, W. Wolf (NOAA/NESDIS),
Supported by the NASA Tropospheric Chemistry Program
Thanks to the P-3 and AIRS Teams
TexAQS II Workshop http://physics.umbc.edu/~mcmillan 5/31/07

v4.0.9.0
AIRS:
daily satellite BIG view
Questions G and H:
Distant sources and transport impacts

AIRS daily overview product v4.0.9.0
TexAQS II Workshop http://physics.umbc.edu/~mcmillan 5/31/07

Launched May 4, 2002, onboard Aqua
AIRS

Atmospheric InfraRed Sounder
onboard NASA Aqua
(JPL depictions)
• 13.5 km nadir IR FOV 1650 km swath
• 45 km nadir μwave FOV (AMSU)
• 324,000 AIRS retrievals per day
• 2378 channels

H2O
AIRS Spectrum on 9/5/2002 @ 1830 UTC
CO2CO2 O3 CO N2OCH4
surface surface

New Standard ProductsProduct Desired RMS Uncertainty Expected Footprint
O3 < 10% total column 45 km x 45 kmO3 mid-upper tropospheric 45 km x 45 kmCO < 15% for column 45 km x 45 kmSO2 volcanic eruption detector 45 km x 45 kmCH4 1-5% for column 135 km x 135 km
TexAQS II Workshop http://physics.umbc.edu/~mcmillan 5/31/07

• Simultaneous retrieval for all products– 45 km horizontal resolution– Temperature (2 km vertical resolution)– Water vapor (3 km vertical resolution)
• Map 70-80% of the planet every day!• CO (UMBC) operational next month
– Total column + changes in vertical sensitivity• O3 (JPL) operational next month• Data reprocessing underway• See poster 37
SUMMARY: AIRS
TexAQS II Workshop http://physics.umbc.edu/~mcmillan 5/31/07

Regional Influences During Aug 30 - Sep 02, 2006 Houston Ozone AQ event – from REALTIME forecasts
Synthesis of EPA AIRNOW, NOAA P3, NASA AIRS measurementsand RAQMS chemical analyses
24hr averagedozone shows 30ppbv enhancement during the period that could be due to regional transport
Brad Pierce (NOAA)From 9/15/06 RSS talk

08/28/06 08/29/06
08/30/06
08/31/06 09/01/06
Houston surface (red)and 850mb (blue) 5-day
back trajectories
On-shore to Northeasterly transitionBrad Pierce (NOAA)

5-day Lagrangian mean ozone mixing ratio, altitude, and pbl heightHouston AIRNOW sites 09/01/06
Daily ozone production along back trajectories results in Lagrangian mean ozone increase of nearly 30ppbv during previous 4 days
Trajectories remain within boundary layer during the previous 5 days
Brad Pierce (NOAA)

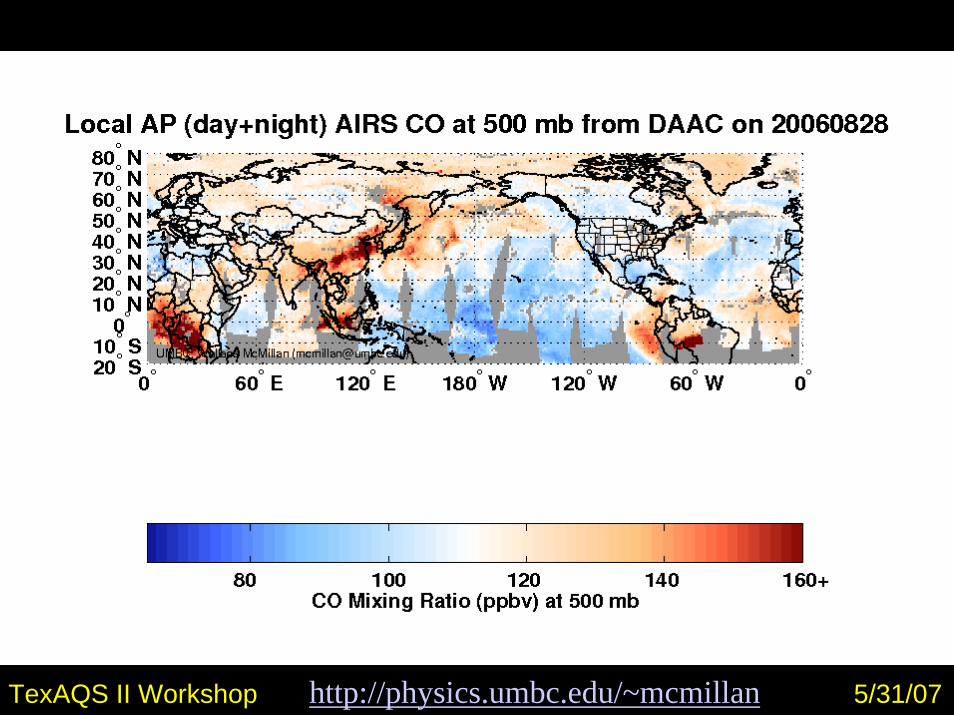
AIRS: Daily BIG view
v4.0.9.0
TexAQS II Workshop http://physics.umbc.edu/~mcmillan 5/31/07

v4.0.9.0
TexAQS II Workshop http://physics.umbc.edu/~mcmillan 5/31/07

v5.x


TES Observations TES Observations –– Aug 30, 2006Aug 30, 2006
TES Global Survey
High ozone in the troposphere over the Gulf of Mexico seen in Trop Column
Lower values over East TX
Enhancement in ozone in middle troposphere over TX, OK, KA
Low ozone in lower troposphere over East Texas, Central Oklahoma
High ozone in lower troposphere over the Gulf (still under investigation)
Greg Osterman (JPL)

TES track

August 30, 2006

CO enhancementin lower troposphere
August 30, 2006

August 30, 2006
CO vertical sensitivity profiles

AIRS CO Column Averaging Kernels

CO enhancementin lower troposphere
August 30, 2006

Stratosphericintrusion
CO enhancementin lower troposphere
August 30, 2006

Stratosphericintrusion
AIRS cannot seeO3 near surface
CO enhancementin lower troposphere
August 30, 2006

Greg Osterman (JPL)

Greg Osterman (JPL)

Greg Osterman (JPL)


P-3 track

August 31, 2006

CO enhancement
August 31, 2006

Stratosphericintrusion
August 31, 2006CO
enhancement


AIRS cannot seenear surface O3

AIRS cannot seenear surface O3
AIRS can seemid-tropospheric O3

• Simultaneous retrieval for all products– 45 km horizontal resolution– Temperature (2 km vertical resolution)– Water vapor (3 km vertical resolution)
• Map 70-80% of the planet every day!• CO (UMBC) operational next month
– Total column + changes in vertical sensitivity• O3 (JPL) operational next month• Data reprocessing underway• See poster 37
SUMMARY: AIRS
TexAQS II Workshop http://physics.umbc.edu/~mcmillan 5/31/07