Embed Size (px)
Citation preview
Transport OutlookMeeting the Needs of 9 Billion People 2011

Transport OutlookMeeting the Needs of 9 Billion People 2011
INTERNATIONAL TRANSPORT FORUM
The International Transport Forum at the OECD is an intergovernmental organisation with 52 member countries. It acts as a strategic think tank with the objective of helping shape the transport policy agenda on a global level and ensuring that it contributes to economic growth, environmental protection, social inclusion and the preservation of human life and well-being. The International Transport Forum organizes an annual summit of Ministers along with leading representatives from industry, civil society and academia.
The International Transport Forum was created under a Declaration issued by the Council of Ministers of the ECMT (European Conference of Ministers of Transport) at its Ministerial Session in May 2006 under the legal authority of the Protocol of the ECMT, signed in Brussels on 17 October 1953, and legal instruments of the OECD.
The Members of the Forum are: Albania, Armenia, Australia, Austria, Azerbaijan, Belarus, Belgium, Bosnia-Herzegovina, Bulgaria, Canada, Croatia, the Czech Republic, Denmark, Estonia, Finland, France, FYROM, Georgia, Germany, Greece, Hungary, Iceland, India, Ireland, Italy, Japan, Korea, Latvia, Liechtenstein, Lithuania, Luxembourg, Malta, Mexico, Moldova, Montenegro, Netherlands, New Zealand, Norway, Poland, Portugal, Romania, Russia, Serbia, Slovakia, Slovenia, Spain, Sweden, Switzerland, Turkey, Ukraine, the United Kingdom and the United States.
The International Transport Forum’s Research Centre gathers statistics and conducts co-operative research programmes addressing all modes of transport. Its findings are widely disseminated and support policymaking in Member countries as well as contributing to the annual summit.
Further information about the International Transport Forum is available at www.internationaltransportforum.org
Transport Outlook 2011: Meeting the Needs of 9 Billion People
© OECD/ITF 2011 3
TABLE OF CONTENTS
EXECUTIVE SUMMARY ......................................................................................................... 5
1. INTRODUCTION ................................................................................................................. 9
2. TRENDS IN TRANSPORT OVER THE NEXT 40 YEARS A MACROSCOPIC VIEW .................................................................................................... 9
2.1. Continued but uneven growth of transport demand ................................................... 10
2.2 Evolution of the modal distribution of transport services ............................................ 15
2.3 Transport demand, fuel economy, and CO2-emissions .............................................. 16
3. PEAK CAR TRAVEL IN ADVANCED ECONOMIES? ...................................................... 24
4. TRADE AND FREIGHT TRANSPORT BY SEA AND AIR ................................................ 30
ANNEX: THE INTERNATIONAL TRANSPORT FORUM’S GLOBAL TRADE AND TRANSPORT DATABASE – SHORT DESCRIPTION AND SUMMARY TABLES ........... 39

Transport Outlook 2011: Meeting the Needs of 9 Billion People
© OECD/ITF 2011 5
EXECUTIVE SUMMARY
The long term evolution of global transport demand Mobility to triple globally.
The world’s population reached 6 billion in 2000 and will be around 9 billion in 2050. Coupled with rising incomes this will lead global mobility to expand strongly through 2050. If infrastructure and energy prices allow, there will be around 3 to 4 times as much global passenger mobility (passenger-kilometres travelled) as in 2000 and 2.5 to 3.5 as much freight activity, measured in ton-kilometres.
Rapid increase outside the OECD region.
Growth will be much stronger outside the OECD region than within it. OECD passenger-kms are expected to grow around 30 to 40% between 2000 and 2050 and ton-km by 60 to 90%. Outside the OECD region, passenger-kms could increase by a factor of 5 to 6.5, and ton-kms by a factor of 4 to 5. The high end of these ranges would be reached only if mobility aspirations in emerging economies mimic those of advanced economies and if prices and policies accommodate these aspirations. Full realisation of such a development path may be unlikely but this illustrates the significant upside risk associated with the lower, baseline projection. Accounting for population growth, passenger mobility per-capita outside the OECD grows three fold in our baseline scenario or four-fold in the high scenario.
Consequently, like economic mass, the centre of gravity for mobility will shift to non-OECD economies. In 2000, half of all passenger-kms were driven in OECD countries. According to our scenarios this declines to around a fifth in 2050. For ton-kms, the OECD share declines from a half to around a third.
Car ownership levels critical.
Projections this far ahead are fraught with uncertainty. For example, it is unclear to what levels car ownership per capita will rise in emerging economies. Very high levels, characteristic of the USA, are unlikely; somewhere between European and Japanese levels is conceivable. The range between these reference points is large but in either case the share of car-trips in total passenger mobility seems set to increase strongly, e.g. from less than 10% at present in China to more than 50% in 2050.
Peak car travel in advanced economies? Peaking car travel is a risky assumption.
Travel by passenger vehicles has not grown much recently in a number of the highest income economies, or has even declined. The peak car travel hypothesis holds that this is because of a saturation effect, where more income no longer translates into more car travel when incomes are very high.
Transport Outlook 2011: Meeting the Needs of 9 Billion People
6 © OECD/ITF 2011
But peak car travel is just one among several potential explanations for the observed levelling off of car travel, so projections of future car travel demand should not take peaking for granted.
Other potential explanations include increases of fuel prices and uncertainty over future disposable income. Moreover, rising inequality in the distribution of incomes has meant that large parts of the population benefitted little from average growth in income, and this may explain part of the stagnation in travel by car in some countries. For the future, demographics (population size and age structure) as a driver for car travel demand will be increasingly important.
CO2 Emissions Doubling fuel economy to stabilise emissions.
CO2 emissions will rise less strongly than mobility because of improving fuel economy. By 2050 global emissions from vehicle use might be 2.5 to 3 times as large as they were in 2000.
For emissions from cars and light trucks to remain at the 2010 level, average fleet fuel economy would need to improve quickly and strongly, from around 8 l/100km in 2008 to 5 l/100km in 2030 and less than 4 l/100km in 2050.
Fuel economy and fuel tax revenues Falling fuel tax revenues.
Expected improvements in fuel economy will lead to reduced consumption of gasoline in, for example, the USA and OECD Europe (Diesel consumption would first increase and then decline in OECD Europe).
If fuel tax levels do not change, this means a strong reduction in revenues from the taxation of transport fuels. This prompts a need for revising transport tax structures, perhaps in the direction of distance-based charges.
To illustrate the point, a fuel economy improvement that reduces the CO2 emissions of an average diesel car in France from 160g/km to 130g/km generates enough savings on fuel expenditures for most drivers to make the investment in more efficient technology worthwhile. But the loss of tax revenue would result in a bad deal for society if the shortfall were to be made up by additional labour taxes, despite the benefits of lower CO2 emissions.
More km-based charges.
One way to avoid this tax cost is to turn to kilometre-based taxes. These can be designed so that both drivers and taxpayers benefit from improvement in fuel economy, at least if the kilometre-charging system is not too expensive to run.
Transport Outlook 2011: Meeting the Needs of 9 Billion People
© OECD/ITF 2011 7
The market for electric vehicles Limits to subsidies. To decarbonise transport radically a large proportion of the road vehicle
fleet would have to use alternative energy carriers including electricity, probably with an accompanying change in models of vehicle ownership and patterns of vehicle use. Part of the strategy for opening up the possibilities for change is to subsidise the purchase of general purpose passenger cars by the public. Vehicle manufacturers need to count on such subsidy programmes being in place long enough to support investment in electric technologies.
In the longer term, however, vehicles will have to become competitive without subsidy, as the cost to public budgets would be excessive if subsidised electric vehicles were to become a large part of overall car sales.
At the same time, prices for some of the electric vehicles now on the market suggest that they are financially advantageous in some high mileage markets, such as delivery vans and taxis, even without subsidies. Policies to promote uptake through non-financial incentives and partnerships might make more sense than subsidies in these markets.
The global economy, trade, and freight transport by sea and air Recovery characterised by downside risks.
The 2008 crisis led to a major disruption of global trade flows. But global trade has now surpassed pre-crisis volumes and is expected (by the WTO for example) to return quickly to growth at the pre-crisis rhythm.
The International Transport Forum accepts this as a reasonable expectation but points to downside risks that are far bigger than upside potential:
• The emerging economies are the driver of global economic expansion post-crisis. But their growth model, notably in China, relies heavily on exports and on domestic investment. Given weakening of export demand and reduced availability of near-term investment opportunities, the Chinese economy may increasingly need to turn to other sources of growth, e.g. domestic household demand.
• The upward pressure on energy prices and uncertainties related to geo-political events could put a brake on growth.
Trade figures underline the risks.
Data on external trade volumes for the EU and the USA reflect the shift in global economic mass to emerging economies through the composition of trade flows. The data reveal a reduction of trade deficits between the USA and China, between the USA and the EU and between Europe and China. But these reductions seem to be more a simple result of the 2008 shock than a fundamental change or a tendency to “rebalancing” trade. In that sense the trade figures contribute to our view that the current recovery is characterised mainly by downside risk.

Transport Outlook 2011: Meeting the Needs of 9 Billion People
© OECD/ITF 2011 9
1. INTRODUCTION
The International Transport Forum’s Transport Outlook 2011 reviews recent developments in the transport sector and discusses future scenarios. It updates the work underlying earlier editions (2008 through 2010) and extends it in several directions. It is a “focused-Outlook”, meaning that it does not provide a comprehensive treatment of the transport sector but instead discusses selected topics. The topics are:
• The development of global transport demand in the very long run – a macroscopic view (Section 2.1).
• The modal distribution of transport demand (Section 2.2).
• The interaction between transport demand, CO2-emissions, and transport tax revenues (Section 2.3).
• Peak car travel in advanced economies: permanent or transitory phenomenon? (Section 3).
• International sea and air freight transport flows: pre- and post-crisis trends (Section 4).
2. TRENDS IN TRANSPORT OVER THE NEXT 40 YEARS – A MACROSCOPIC VIEW
This section presents very long run scenarios for the development of global transport volumes by region. The world’s population reached 6 billion in 2000 and will be around 9 billion in 2050. Coupled with rising incomes this will lead global mobility to expand strongly through 2050. If infrastructure and energy prices allow, there will be around 3 to 4 times as much global passenger mobility (passenger-kilometres travelled) as in 2000 and 2.5 to 3.5 as much freight activity, measured in ton-kilometres.
Our discussion of scenarios focuses on two issues: the evolution of demand by mode and by region (Section 2.1) and the evolution of energy intensity and greenhouse gas emissions (Section 2.2). Our focus is as much on the discussion of possible futures for mobility as on issues related to energy use.
As in earlier editions of the Outlook, the scenarios are based on the MoMo-model developed at the International Energy Agency (IEA). The new scenarios are based on the 2011 version of the model whereas earlier editions used the 2008 version. The new model version is based on broader and more recent data and various model features have been refined. The projections are based on the latest IEA mid-term and long-term scenarios from the Energy Technology and World Energy Outlook scenarios.
Transport Outlook 2011: Meeting the Needs of 9 Billion People
10 © OECD/ITF 2011
2.1. Continued but uneven growth of transport demand
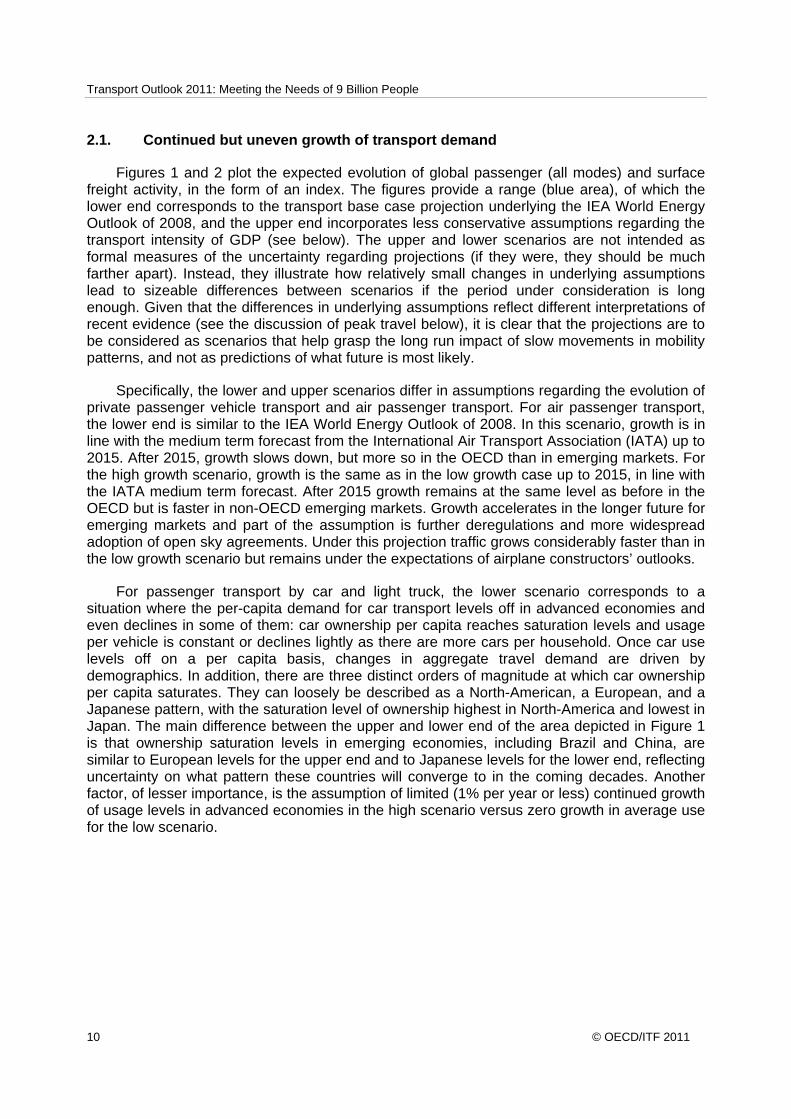
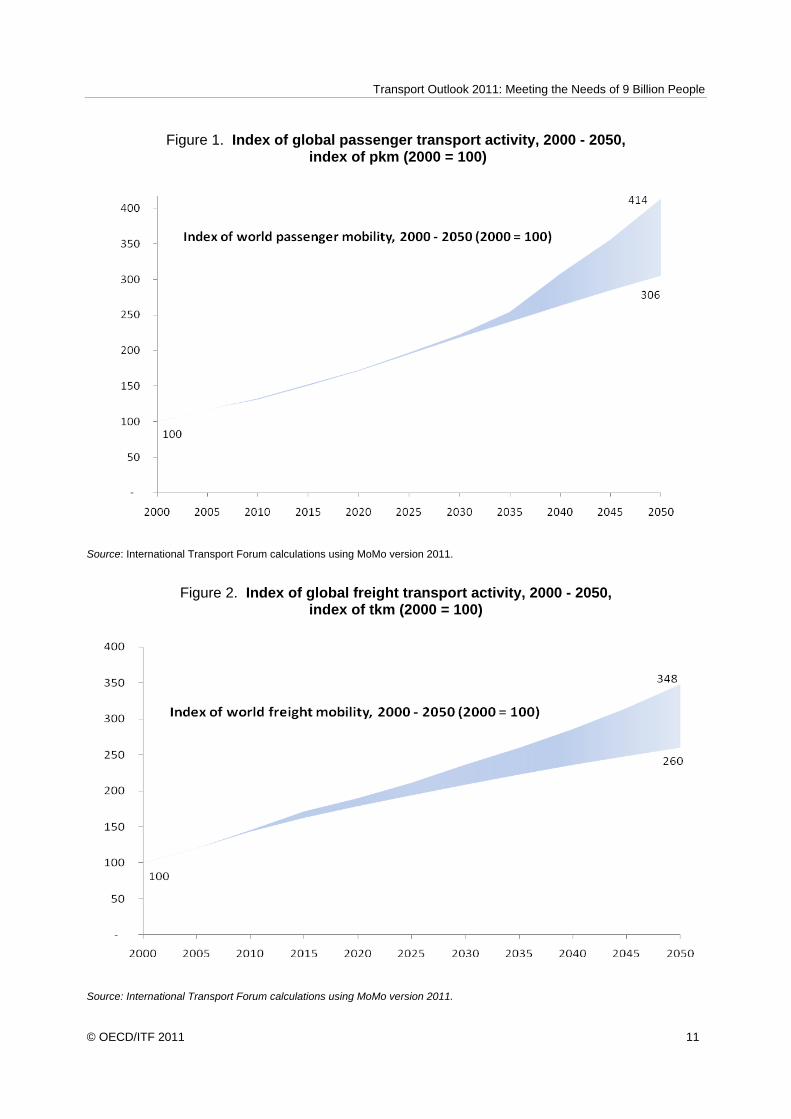
Figures 1 and 2 plot the expected evolution of global passenger (all modes) and surface freight activity, in the form of an index. The figures provide a range (blue area), of which the lower end corresponds to the transport base case projection underlying the IEA World Energy Outlook of 2008, and the upper end incorporates less conservative assumptions regarding the transport intensity of GDP (see below). The upper and lower scenarios are not intended as formal measures of the uncertainty regarding projections (if they were, they should be much farther apart). Instead, they illustrate how relatively small changes in underlying assumptions lead to sizeable differences between scenarios if the period under consideration is long enough. Given that the differences in underlying assumptions reflect different interpretations of recent evidence (see the discussion of peak travel below), it is clear that the projections are to be considered as scenarios that help grasp the long run impact of slow movements in mobility patterns, and not as predictions of what future is most likely.
Specifically, the lower and upper scenarios differ in assumptions regarding the evolution of private passenger vehicle transport and air passenger transport. For air passenger transport, the lower end is similar to the IEA World Energy Outlook of 2008. In this scenario, growth is in line with the medium term forecast from the International Air Transport Association (IATA) up to 2015. After 2015, growth slows down, but more so in the OECD than in emerging markets. For the high growth scenario, growth is the same as in the low growth case up to 2015, in line with the IATA medium term forecast. After 2015 growth remains at the same level as before in the OECD but is faster in non-OECD emerging markets. Growth accelerates in the longer future for emerging markets and part of the assumption is further deregulations and more widespread adoption of open sky agreements. Under this projection traffic grows considerably faster than in the low growth scenario but remains under the expectations of airplane constructors’ outlooks.
For passenger transport by car and light truck, the lower scenario corresponds to a situation where the per-capita demand for car transport levels off in advanced economies and even declines in some of them: car ownership per capita reaches saturation levels and usage per vehicle is constant or declines lightly as there are more cars per household. Once car use levels off on a per capita basis, changes in aggregate travel demand are driven by demographics. In addition, there are three distinct orders of magnitude at which car ownership per capita saturates. They can loosely be described as a North-American, a European, and a Japanese pattern, with the saturation level of ownership highest in North-America and lowest in Japan. The main difference between the upper and lower end of the area depicted in Figure 1 is that ownership saturation levels in emerging economies, including Brazil and China, are similar to European levels for the upper end and to Japanese levels for the lower end, reflecting uncertainty on what pattern these countries will converge to in the coming decades. Another factor, of lesser importance, is the assumption of limited (1% per year or less) continued growth of usage levels in advanced economies in the high scenario versus zero growth in average use for the low scenario.
Transport Outlook 2011: Meeting the Needs of 9 Billion People
© OECD/ITF 2011 11
Figure 1. Index of global passenger transport activity, 2000 - 2050, index of pkm (2000 = 100)
Source: International Transport Forum calculations using MoMo version 2011.
Figure 2. Index of global freight transport activity, 2000 - 2050, index of tkm (2000 = 100)
Source: International Transport Forum calculations using MoMo version 2011.
Transport Outlook 2011: Meeting the Needs of 9 Billion People
12 © OECD/ITF 2011
For surface freight transport activity (tkm), the low scenario assumes a gradual decline of the freight intensity of GDP in all regions, while the high scenarios assumes that freight intensity stays at the 2005 level in all regions through 2050. A declining freight intensity of GDP could be the consequence of “dematerialisation” of growth, i.e. a proportionally faster increase in those components of GDP that are not particularly freight-intensive, including many services and IT applications. A constant or increasing freight-intensity might be the consequence of continued globalisation, characterised by geographical fragmentation of supply chains. Moreover, countries at lower levels of economic development may be embarking upon a relatively freight-intensive growth path, so that in those regions the assumption of declining intensity is less straightforward than for regions where GDP is already very high.
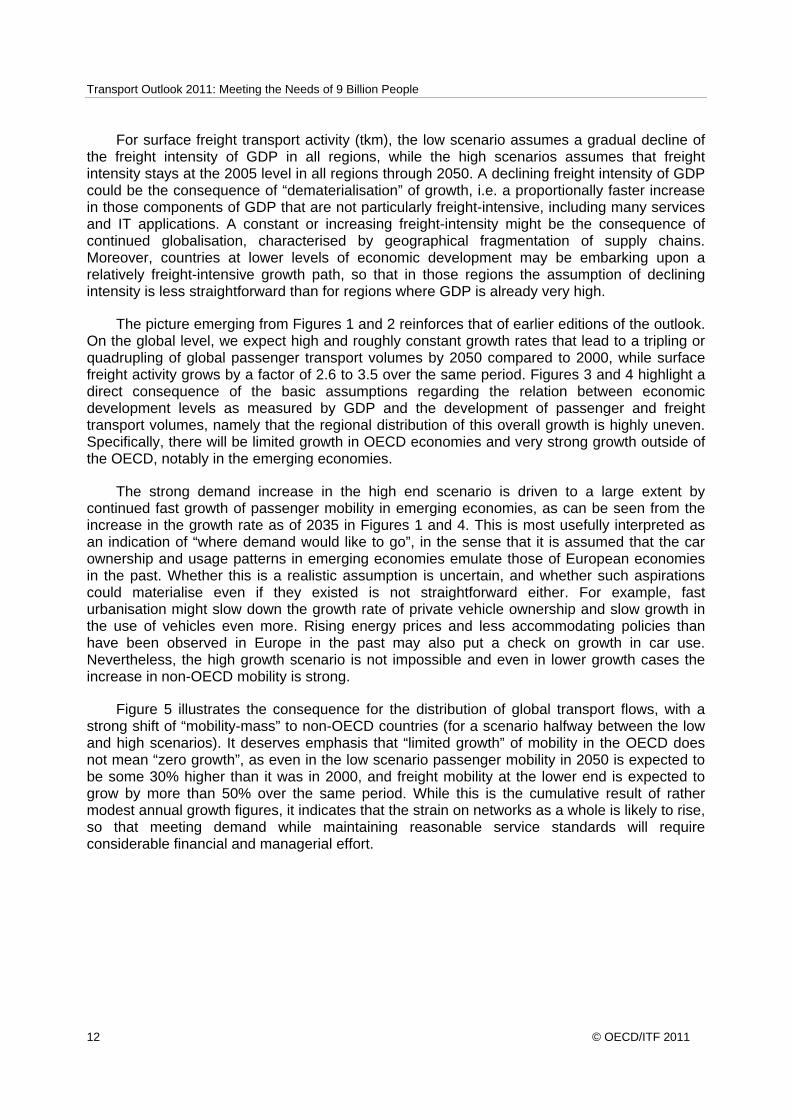
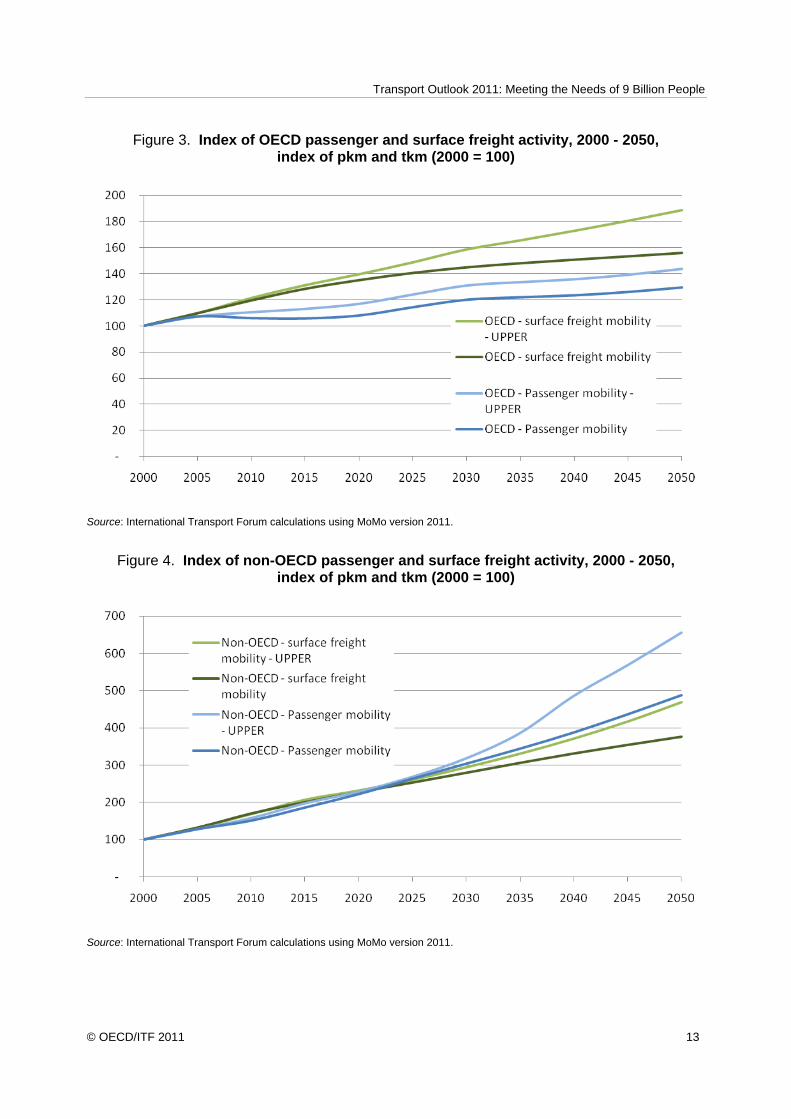
The picture emerging from Figures 1 and 2 reinforces that of earlier editions of the outlook. On the global level, we expect high and roughly constant growth rates that lead to a tripling or quadrupling of global passenger transport volumes by 2050 compared to 2000, while surface freight activity grows by a factor of 2.6 to 3.5 over the same period. Figures 3 and 4 highlight a direct consequence of the basic assumptions regarding the relation between economic development levels as measured by GDP and the development of passenger and freight transport volumes, namely that the regional distribution of this overall growth is highly uneven. Specifically, there will be limited growth in OECD economies and very strong growth outside of the OECD, notably in the emerging economies.
The strong demand increase in the high end scenario is driven to a large extent by continued fast growth of passenger mobility in emerging economies, as can be seen from the increase in the growth rate as of 2035 in Figures 1 and 4. This is most usefully interpreted as an indication of “where demand would like to go”, in the sense that it is assumed that the car ownership and usage patterns in emerging economies emulate those of European economies in the past. Whether this is a realistic assumption is uncertain, and whether such aspirations could materialise even if they existed is not straightforward either. For example, fast urbanisation might slow down the growth rate of private vehicle ownership and slow growth in the use of vehicles even more. Rising energy prices and less accommodating policies than have been observed in Europe in the past may also put a check on growth in car use. Nevertheless, the high growth scenario is not impossible and even in lower growth cases the increase in non-OECD mobility is strong.
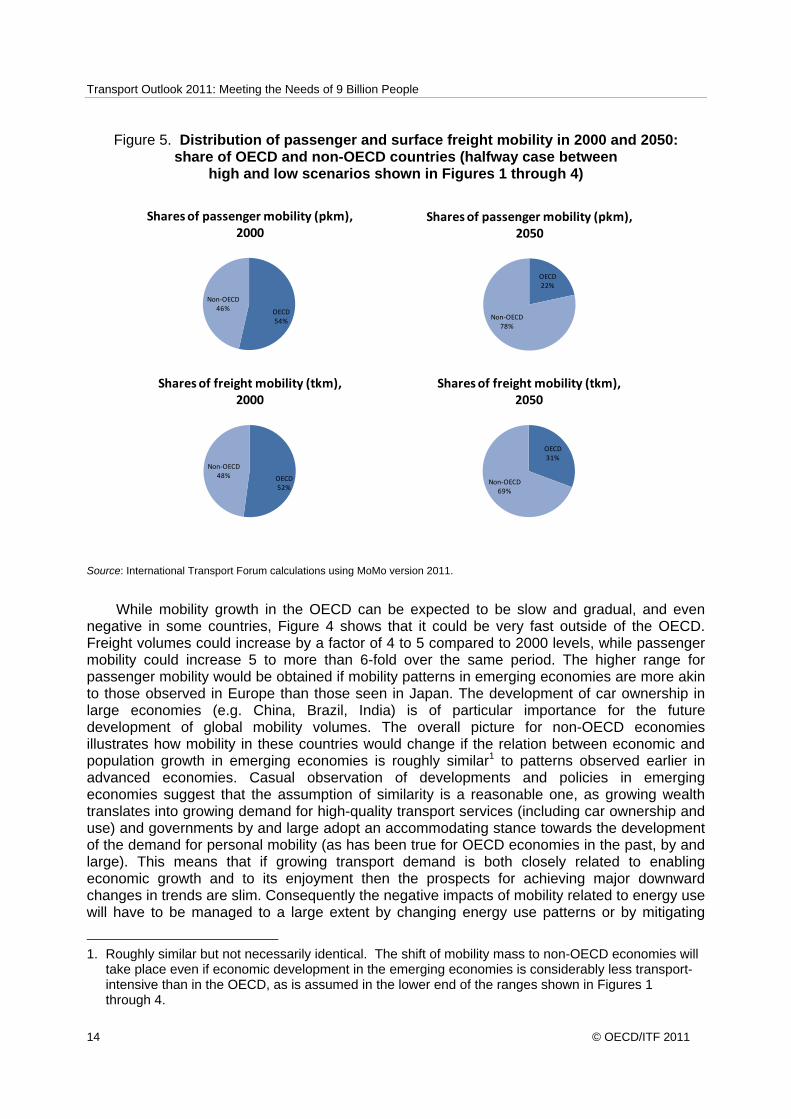
Figure 5 illustrates the consequence for the distribution of global transport flows, with a strong shift of “mobility-mass” to non-OECD countries (for a scenario halfway between the low and high scenarios). It deserves emphasis that “limited growth” of mobility in the OECD does not mean “zero growth”, as even in the low scenario passenger mobility in 2050 is expected to be some 30% higher than it was in 2000, and freight mobility at the lower end is expected to grow by more than 50% over the same period. While this is the cumulative result of rather modest annual growth figures, it indicates that the strain on networks as a whole is likely to rise, so that meeting demand while maintaining reasonable service standards will require considerable financial and managerial effort.
Transport Outlook 2011: Meeting the Needs of 9 Billion People
© OECD/ITF 2011 13
Figure 3. Index of OECD passenger and surface freight activity, 2000 - 2050, index of pkm and tkm (2000 = 100)
Source: International Transport Forum calculations using MoMo version 2011.
Figure 4. Index of non-OECD passenger and surface freight activity, 2000 - 2050, index of pkm and tkm (2000 = 100)
Source: International Transport Forum calculations using MoMo version 2011.
Transport Outlook 2011: Meeting the Needs of 9 Billion People
14 © OECD/ITF 2011
Figure 5. Distribution of passenger and surface freight mobility in 2000 and 2050: share of OECD and non-OECD countries (halfway case between
high and low scenarios shown in Figures 1 through 4)
OECD22%
Non‐OECD78%
Shares of passenger mobility (pkm), 2050
OECD54%
Non‐OECD46%
Shares of passenger mobility (pkm), 2000
OECD52%
Non‐OECD48%
Shares of freight mobility (tkm), 2000
OECD31%
Non‐OECD69%
Shares of freight mobility (tkm), 2050
Source: International Transport Forum calculations using MoMo version 2011.
While mobility growth in the OECD can be expected to be slow and gradual, and even negative in some countries, Figure 4 shows that it could be very fast outside of the OECD. Freight volumes could increase by a factor of 4 to 5 compared to 2000 levels, while passenger mobility could increase 5 to more than 6-fold over the same period. The higher range for passenger mobility would be obtained if mobility patterns in emerging economies are more akin to those observed in Europe than those seen in Japan. The development of car ownership in large economies (e.g. China, Brazil, India) is of particular importance for the future development of global mobility volumes. The overall picture for non-OECD economies illustrates how mobility in these countries would change if the relation between economic and population growth in emerging economies is roughly similar1 to patterns observed earlier in advanced economies. Casual observation of developments and policies in emerging economies suggest that the assumption of similarity is a reasonable one, as growing wealth translates into growing demand for high-quality transport services (including car ownership and use) and governments by and large adopt an accommodating stance towards the development of the demand for personal mobility (as has been true for OECD economies in the past, by and large). This means that if growing transport demand is both closely related to enabling economic growth and to its enjoyment then the prospects for achieving major downward changes in trends are slim. Consequently the negative impacts of mobility related to energy use will have to be managed to a large extent by changing energy use patterns or by mitigating
1. Roughly similar but not necessarily identical. The shift of mobility mass to non-OECD economies will
take place even if economic development in the emerging economies is considerably less transport-intensive than in the OECD, as is assumed in the lower end of the ranges shown in Figures 1 through 4.
Transport Outlook 2011: Meeting the Needs of 9 Billion People
© OECD/ITF 2011 15
adverse consequences. The social costs of other negative impacts, including congestion and air pollution, are as important as greenhouse gas emissions and energy security concerns and these problems need to be addressed where they emerge, rather than attempting to curb mobility overall.2
2.2 Evolution of the modal distribution of transport services
Section 2.1 provided an overview of prospects for the future development of mobility, measured in ton-kilometres for freight and passenger-kilometres for passenger transport. This Section considers the modal breakdown of that overall evolution, examining the halfway case between the low and high scenarios considered before.
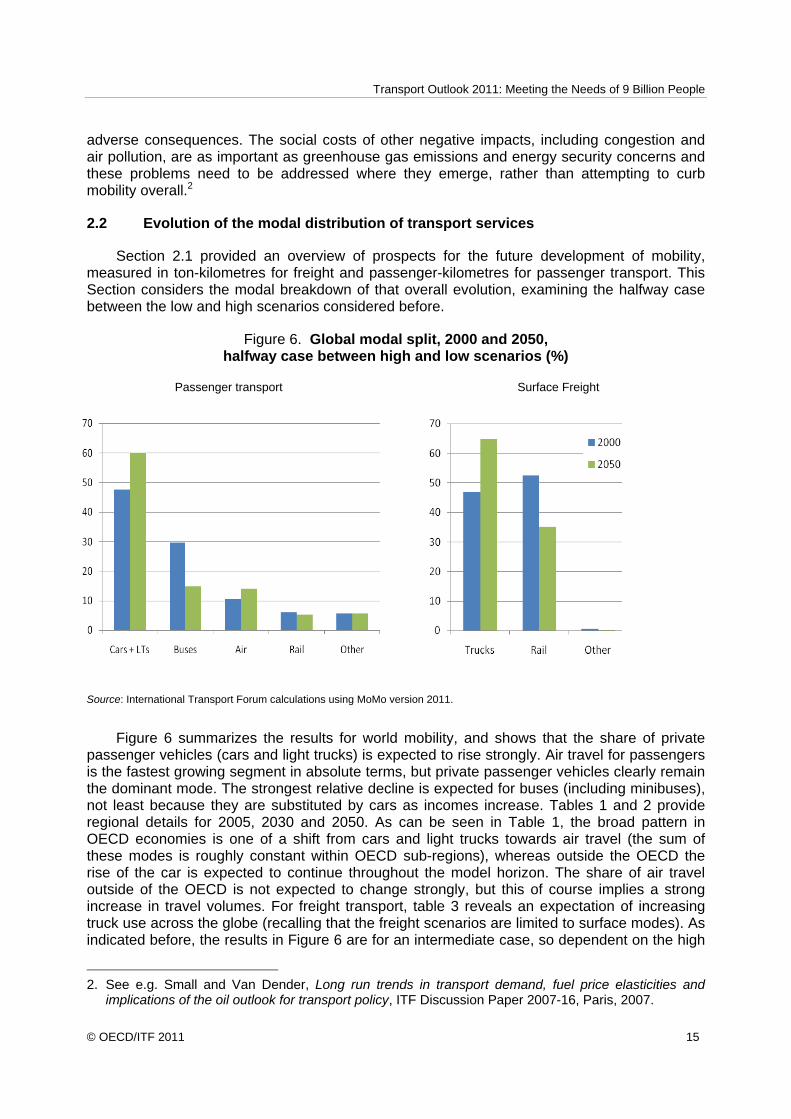
Figure 6. Global modal split, 2000 and 2050, halfway case between high and low scenarios (%)
Passenger transport Surface Freight
Source: International Transport Forum calculations using MoMo version 2011.
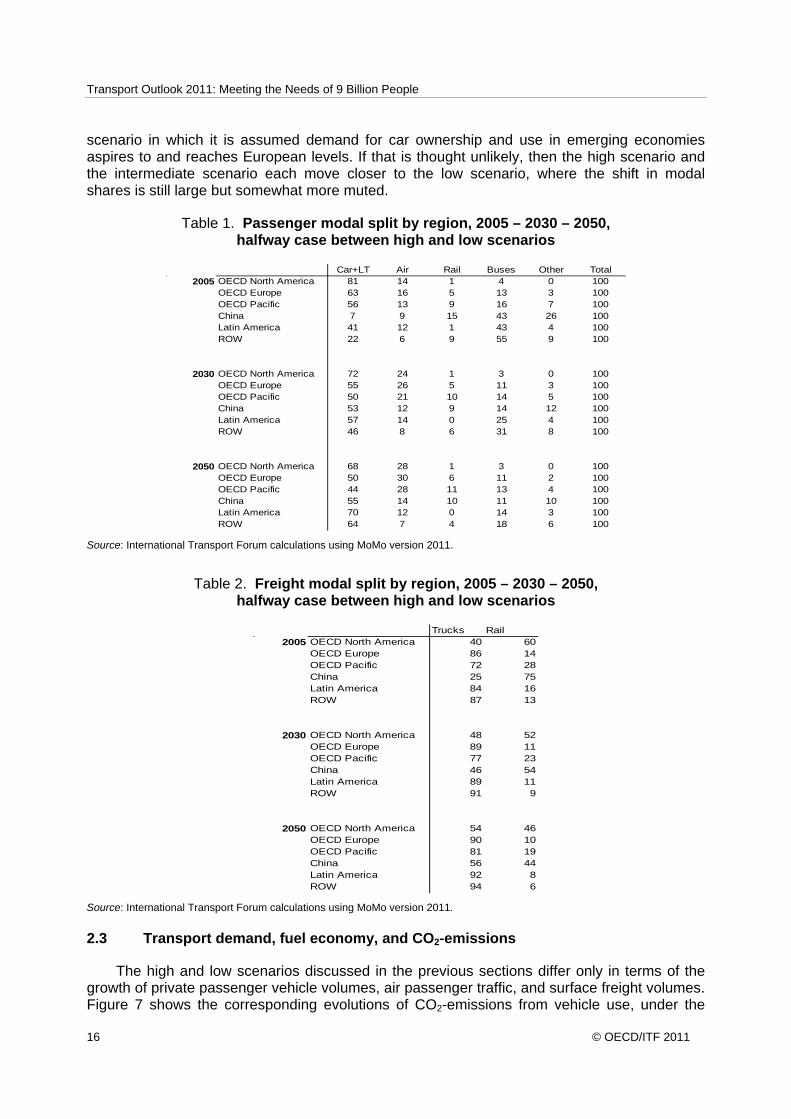
Figure 6 summarizes the results for world mobility, and shows that the share of private passenger vehicles (cars and light trucks) is expected to rise strongly. Air travel for passengers is the fastest growing segment in absolute terms, but private passenger vehicles clearly remain the dominant mode. The strongest relative decline is expected for buses (including minibuses), not least because they are substituted by cars as incomes increase. Tables 1 and 2 provide regional details for 2005, 2030 and 2050. As can be seen in Table 1, the broad pattern in OECD economies is one of a shift from cars and light trucks towards air travel (the sum of these modes is roughly constant within OECD sub-regions), whereas outside the OECD the rise of the car is expected to continue throughout the model horizon. The share of air travel outside of the OECD is not expected to change strongly, but this of course implies a strong increase in travel volumes. For freight transport, table 3 reveals an expectation of increasing truck use across the globe (recalling that the freight scenarios are limited to surface modes). As indicated before, the results in Figure 6 are for an intermediate case, so dependent on the high
2. See e.g. Small and Van Dender, Long run trends in transport demand, fuel price elasticities and
implications of the oil outlook for transport policy, ITF Discussion Paper 2007-16, Paris, 2007.
Transport Outlook 2011: Meeting the Needs of 9 Billion People
16 © OECD/ITF 2011
scenario in which it is assumed demand for car ownership and use in emerging economies aspires to and reaches European levels. If that is thought unlikely, then the high scenario and the intermediate scenario each move closer to the low scenario, where the shift in modal shares is still large but somewhat more muted.
Table 1. Passenger modal split by region, 2005 – 2030 – 2050, halfway case between high and low scenarios
Car+LT Air Rail Buses Other Total2005 OECD North America 81 14 1 4 0 100
OECD Europe 63 16 5 13 3 100OECD Pacific 56 13 9 16 7 100China 7 9 15 43 26 100Latin America 41 12 1 43 4 100ROW 22 6 9 55 9 100
2030 OECD North America 72 24 1 3 0 100OECD Europe 55 26 5 11 3 100OECD Pacific 50 21 10 14 5 100China 53 12 9 14 12 100Latin America 57 14 0 25 4 100ROW 46 8 6 31 8 100
2050 OECD North America 68 28 1 3 0 100OECD Europe 50 30 6 11 2 100OECD Pacific 44 28 11 13 4 100China 55 14 10 11 10 100Latin America 70 12 0 14 3 100ROW 64 7 4 18 6 100
Source: International Transport Forum calculations using MoMo version 2011.
Table 2. Freight modal split by region, 2005 – 2030 – 2050, halfway case between high and low scenarios
Trucks Rail2005 OECD North America 40 60
OECD Europe 86 14OECD Pacific 72 28China 25 75Latin America 84 16ROW 87 13
2030 OECD North America 48 52OECD Europe 89 11OECD Pacific 77 23China 46 54Latin America 89 11ROW 91 9
2050 OECD North America 54 46OECD Europe 90 10OECD Pacific 81 19China 56 44Latin America 92 8ROW 94 6
Source: International Transport Forum calculations using MoMo version 2011.
2.3 Transport demand, fuel economy, and CO2-emissions
The high and low scenarios discussed in the previous sections differ only in terms of the growth of private passenger vehicle volumes, air passenger traffic, and surface freight volumes. Figure 7 shows the corresponding evolutions of CO2-emissions from vehicle use, under the

Transport Outlook 2011: Meeting the Needs of 9 Billion People
© OECD/ITF 2011 17
assumption that current and expected fuel economy policies are implemented and that the fleet is still dominated by internal combustion engines (gasoline and diesel). The remainder of the LDV fleet is essentially comprised of gasoline/diesel hybrids (including plug-in hybrids). Electric vehicles make little penetration in the fleet by 2050 in this scenario. Fuel consumption of new LDVs improves along current trends. Total emissions increase by a factor of 2.6 to 3, which is considerably slower than the growth of overall mobility, because of the fuel economy improvements expected to take place over the modelling horizon. Table 3 shows the evolution of the modal composition of emissions for the halfway case. As a result of the interaction between the growth paths of the separate modes and the expected technological evolution, the share of passenger light-duty vehicles (LDVs) rises over time and is around 50% by 2050. Consequently, efforts to reduce the carbon-intensity of passenger vehicle use will have large effects on overall CO2 emissions, at least if technological improvements permeate throughout the global vehicle stock.
Figure 7. Global CO2 emissions from transport vehicle use, index (2000 = 100)
Source: International Transport Forum calculations using MoMo version 2011.
Table 4. Modal composition of global CO2 emissions from transport vehicle use
2000 2030 2050Freight + Passenger rail 2.3 1.9 1.5Buses 6.3 4.3 3.0Air 12.4 13.8 12.0Freight trucks 23.5 23.3 21.6LDVs 42.5 45.2 52.12-3 wheelers 2.4 2.2 2.0Water-borne 10.6 9.2 7.8 Total 100 100 100
Source: International Transport Forum calculations using MoMo version 2011.
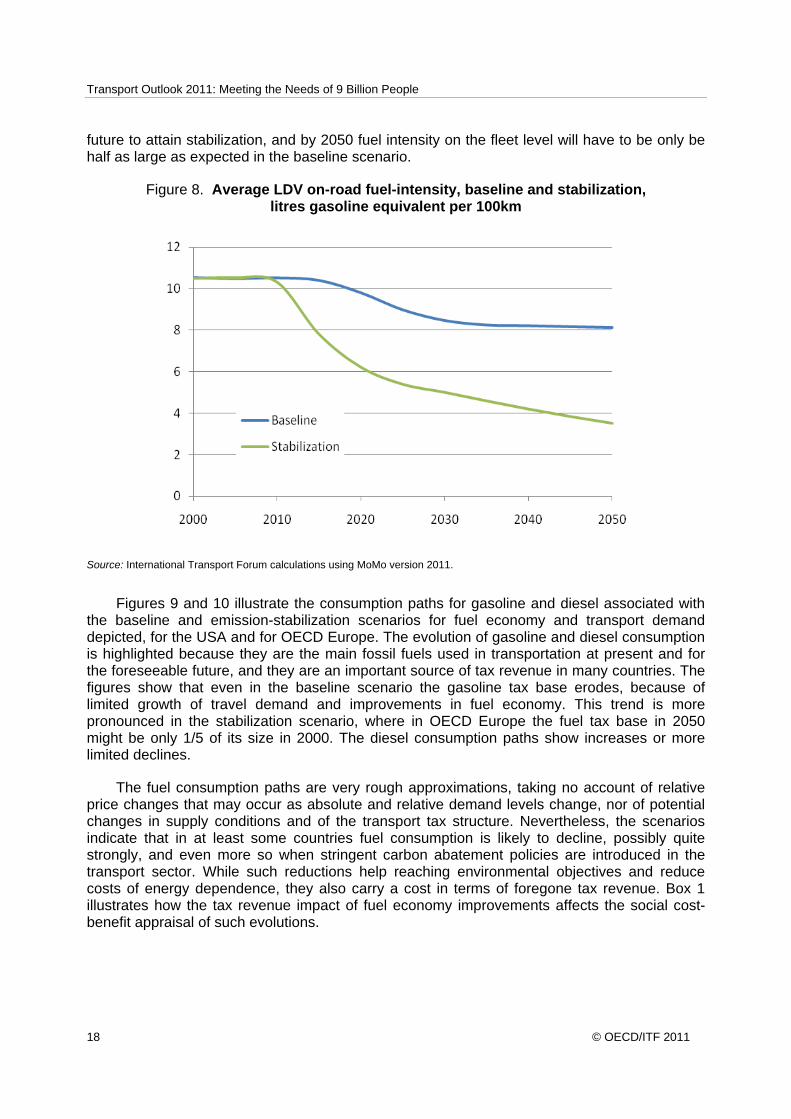
Figure 8 illustrates the global average on-road fuel intensity path for light-duty vehicles that would be sufficient to maintain light-duty vehicle emissions of CO2 approximately at their 2010 level, and how this compares with the baseline expectation of on-road fuel intensity. A strong shift in the use of technological potential towards improved fuel economy, or a shift to less carbon-intensive forms of transport energy, or a combination of both, will be needed in the near
Transport Outlook 2011: Meeting the Needs of 9 Billion People
18 © OECD/ITF 2011
future to attain stabilization, and by 2050 fuel intensity on the fleet level will have to be only be half as large as expected in the baseline scenario.
Figure 8. Average LDV on-road fuel-intensity, baseline and stabilization, litres gasoline equivalent per 100km
Source: International Transport Forum calculations using MoMo version 2011.
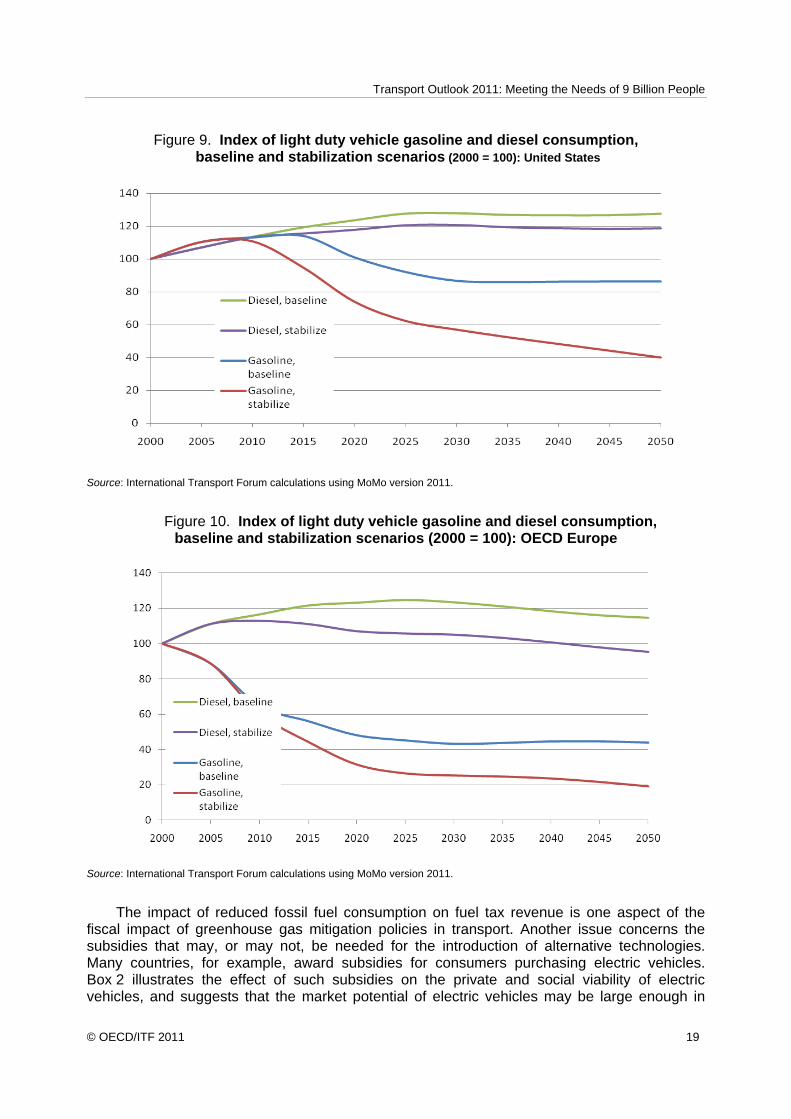
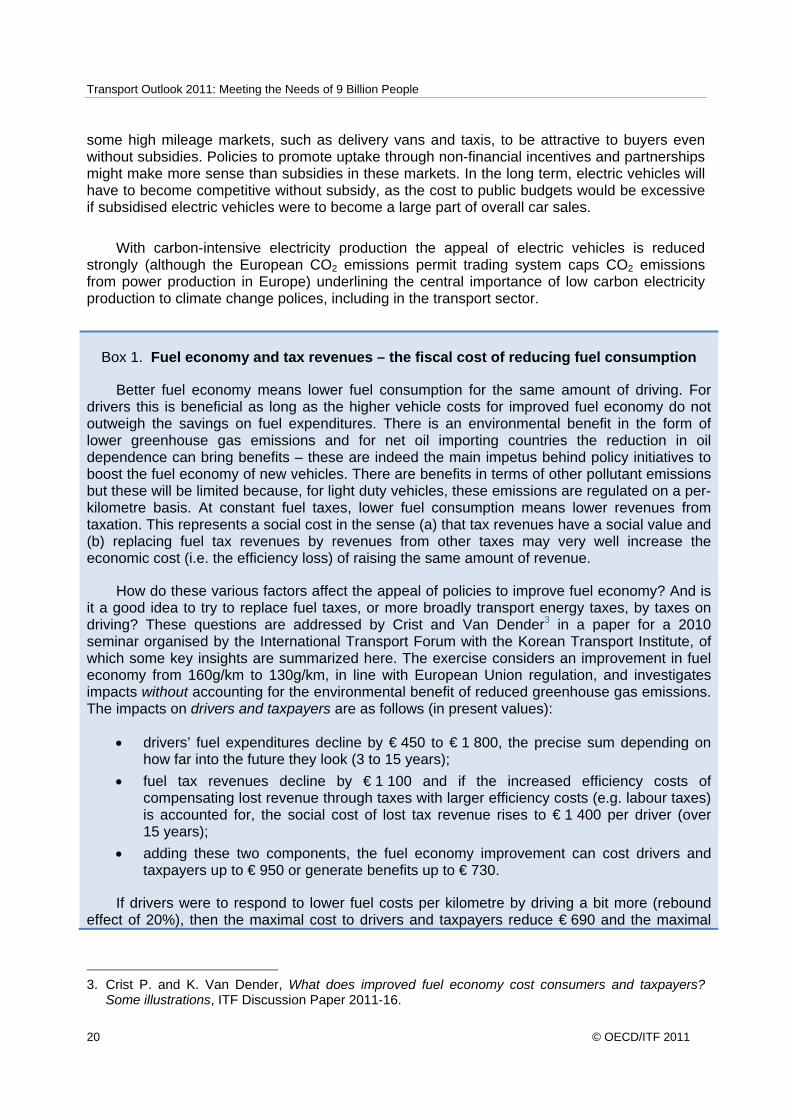
Figures 9 and 10 illustrate the consumption paths for gasoline and diesel associated with the baseline and emission-stabilization scenarios for fuel economy and transport demand depicted, for the USA and for OECD Europe. The evolution of gasoline and diesel consumption is highlighted because they are the main fossil fuels used in transportation at present and for the foreseeable future, and they are an important source of tax revenue in many countries. The figures show that even in the baseline scenario the gasoline tax base erodes, because of limited growth of travel demand and improvements in fuel economy. This trend is more pronounced in the stabilization scenario, where in OECD Europe the fuel tax base in 2050 might be only 1/5 of its size in 2000. The diesel consumption paths show increases or more limited declines.
The fuel consumption paths are very rough approximations, taking no account of relative price changes that may occur as absolute and relative demand levels change, nor of potential changes in supply conditions and of the transport tax structure. Nevertheless, the scenarios indicate that in at least some countries fuel consumption is likely to decline, possibly quite strongly, and even more so when stringent carbon abatement policies are introduced in the transport sector. While such reductions help reaching environmental objectives and reduce costs of energy dependence, they also carry a cost in terms of foregone tax revenue. Box 1 illustrates how the tax revenue impact of fuel economy improvements affects the social cost-benefit appraisal of such evolutions.
Transport Outlook 2011: Meeting the Needs of 9 Billion People
© OECD/ITF 2011 19
Figure 9. Index of light duty vehicle gasoline and diesel consumption, baseline and stabilization scenarios (2000 = 100): United States
Source: International Transport Forum calculations using MoMo version 2011.
Figure 10. Index of light duty vehicle gasoline and diesel consumption, baseline and stabilization scenarios (2000 = 100): OECD Europe
Source: International Transport Forum calculations using MoMo version 2011.
The impact of reduced fossil fuel consumption on fuel tax revenue is one aspect of the fiscal impact of greenhouse gas mitigation policies in transport. Another issue concerns the subsidies that may, or may not, be needed for the introduction of alternative technologies. Many countries, for example, award subsidies for consumers purchasing electric vehicles. Box 2 illustrates the effect of such subsidies on the private and social viability of electric vehicles, and suggests that the market potential of electric vehicles may be large enough in
Transport Outlook 2011: Meeting the Needs of 9 Billion People
20 © OECD/ITF 2011
some high mileage markets, such as delivery vans and taxis, to be attractive to buyers even without subsidies. Policies to promote uptake through non-financial incentives and partnerships might make more sense than subsidies in these markets. In the long term, electric vehicles will have to become competitive without subsidy, as the cost to public budgets would be excessive if subsidised electric vehicles were to become a large part of overall car sales.
With carbon-intensive electricity production the appeal of electric vehicles is reduced strongly (although the European CO2 emissions permit trading system caps CO2 emissions from power production in Europe) underlining the central importance of low carbon electricity production to climate change polices, including in the transport sector.
Box 1. Fuel economy and tax revenues – the fiscal cost of reducing fuel consumption
Better fuel economy means lower fuel consumption for the same amount of driving. For drivers this is beneficial as long as the higher vehicle costs for improved fuel economy do not outweigh the savings on fuel expenditures. There is an environmental benefit in the form of lower greenhouse gas emissions and for net oil importing countries the reduction in oil dependence can bring benefits – these are indeed the main impetus behind policy initiatives to boost the fuel economy of new vehicles. There are benefits in terms of other pollutant emissions but these will be limited because, for light duty vehicles, these emissions are regulated on a per-kilometre basis. At constant fuel taxes, lower fuel consumption means lower revenues from taxation. This represents a social cost in the sense (a) that tax revenues have a social value and (b) replacing fuel tax revenues by revenues from other taxes may very well increase the economic cost (i.e. the efficiency loss) of raising the same amount of revenue.
How do these various factors affect the appeal of policies to improve fuel economy? And is it a good idea to try to replace fuel taxes, or more broadly transport energy taxes, by taxes on driving? These questions are addressed by Crist and Van Dender3 in a paper for a 2010 seminar organised by the International Transport Forum with the Korean Transport Institute, of which some key insights are summarized here. The exercise considers an improvement in fuel economy from 160g/km to 130g/km, in line with European Union regulation, and investigates impacts without accounting for the environmental benefit of reduced greenhouse gas emissions. The impacts on drivers and taxpayers are as follows (in present values):
• drivers’ fuel expenditures decline by € 450 to € 1 800, the precise sum depending on how far into the future they look (3 to 15 years);
• fuel tax revenues decline by € 1 100 and if the increased efficiency costs of compensating lost revenue through taxes with larger efficiency costs (e.g. labour taxes) is accounted for, the social cost of lost tax revenue rises to € 1 400 per driver (over 15 years);
• adding these two components, the fuel economy improvement can cost drivers and taxpayers up to € 950 or generate benefits up to € 730.
If drivers were to respond to lower fuel costs per kilometre by driving a bit more (rebound effect of 20%), then the maximal cost to drivers and taxpayers reduce € 690 and the maximal
3. Crist P. and K. Van Dender, What does improved fuel economy cost consumers and taxpayers?
Some illustrations, ITF Discussion Paper 2011-16.
Transport Outlook 2011: Meeting the Needs of 9 Billion People
© OECD/ITF 2011 21
benefit € 970 per driver (over 15 years).
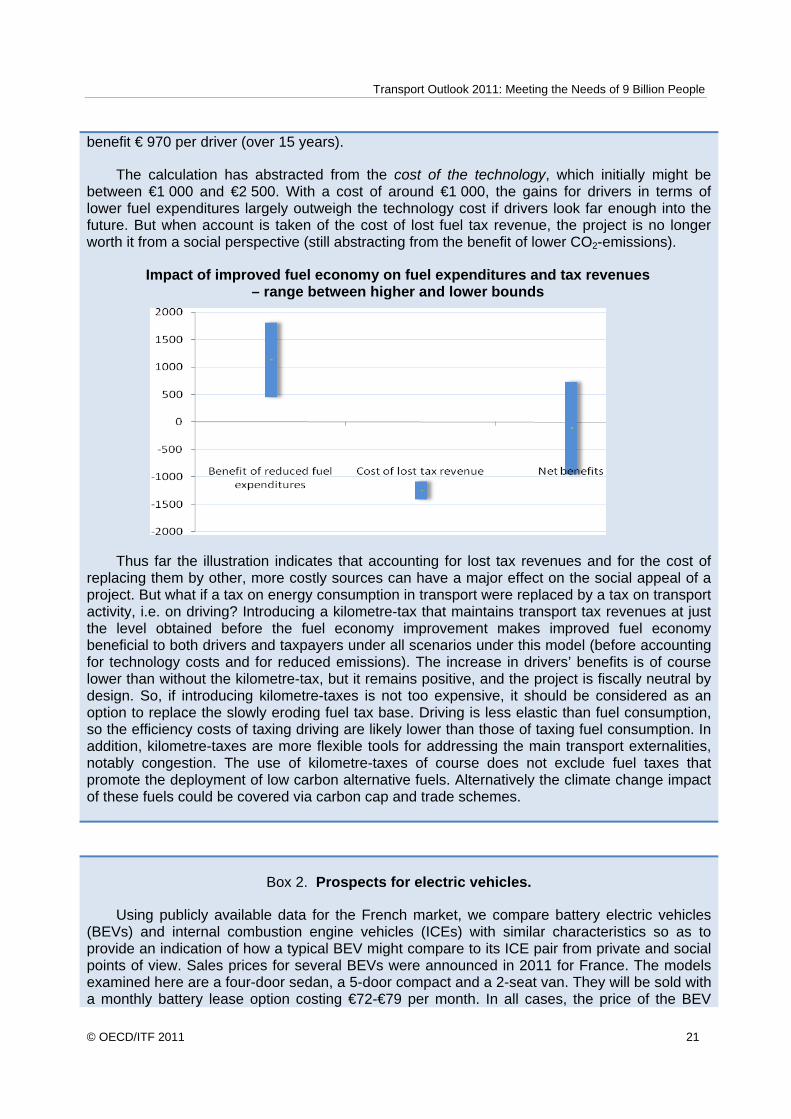
The calculation has abstracted from the cost of the technology, which initially might be between €1 000 and €2 500. With a cost of around €1 000, the gains for drivers in terms of lower fuel expenditures largely outweigh the technology cost if drivers look far enough into the future. But when account is taken of the cost of lost fuel tax revenue, the project is no longer worth it from a social perspective (still abstracting from the benefit of lower CO2-emissions).
Impact of improved fuel economy on fuel expenditures and tax revenues – range between higher and lower bounds
Thus far the illustration indicates that accounting for lost tax revenues and for the cost of replacing them by other, more costly sources can have a major effect on the social appeal of a project. But what if a tax on energy consumption in transport were replaced by a tax on transport activity, i.e. on driving? Introducing a kilometre-tax that maintains transport tax revenues at just the level obtained before the fuel economy improvement makes improved fuel economy beneficial to both drivers and taxpayers under all scenarios under this model (before accounting for technology costs and for reduced emissions). The increase in drivers’ benefits is of course lower than without the kilometre-tax, but it remains positive, and the project is fiscally neutral by design. So, if introducing kilometre-taxes is not too expensive, it should be considered as an option to replace the slowly eroding fuel tax base. Driving is less elastic than fuel consumption, so the efficiency costs of taxing driving are likely lower than those of taxing fuel consumption. In addition, kilometre-taxes are more flexible tools for addressing the main transport externalities, notably congestion. The use of kilometre-taxes of course does not exclude fuel taxes that promote the deployment of low carbon alternative fuels. Alternatively the climate change impact of these fuels could be covered via carbon cap and trade schemes.
Box 2. Prospects for electric vehicles.
Using publicly available data for the French market, we compare battery electric vehicles (BEVs) and internal combustion engine vehicles (ICEs) with similar characteristics so as to provide an indication of how a typical BEV might compare to its ICE pair from private and social points of view. Sales prices for several BEVs were announced in 2011 for France. The models examined here are a four-door sedan, a 5-door compact and a 2-seat van. They will be sold with a monthly battery lease option costing €72-€79 per month. In all cases, the price of the BEV
Transport Outlook 2011: Meeting the Needs of 9 Billion People
22 © OECD/ITF 2011
excluding batteries is more than the ICE alternative, i.e. diesel models based on the same chassis and offering broadly similar amenity. France, like many other countries, offers a purchase subsidy for BEVs (€5000) which narrows the gap for the sedan and the compact car and surpasses it for the van, i.e. with the purchase subsidy the electric van is less expensive than the diesel van.
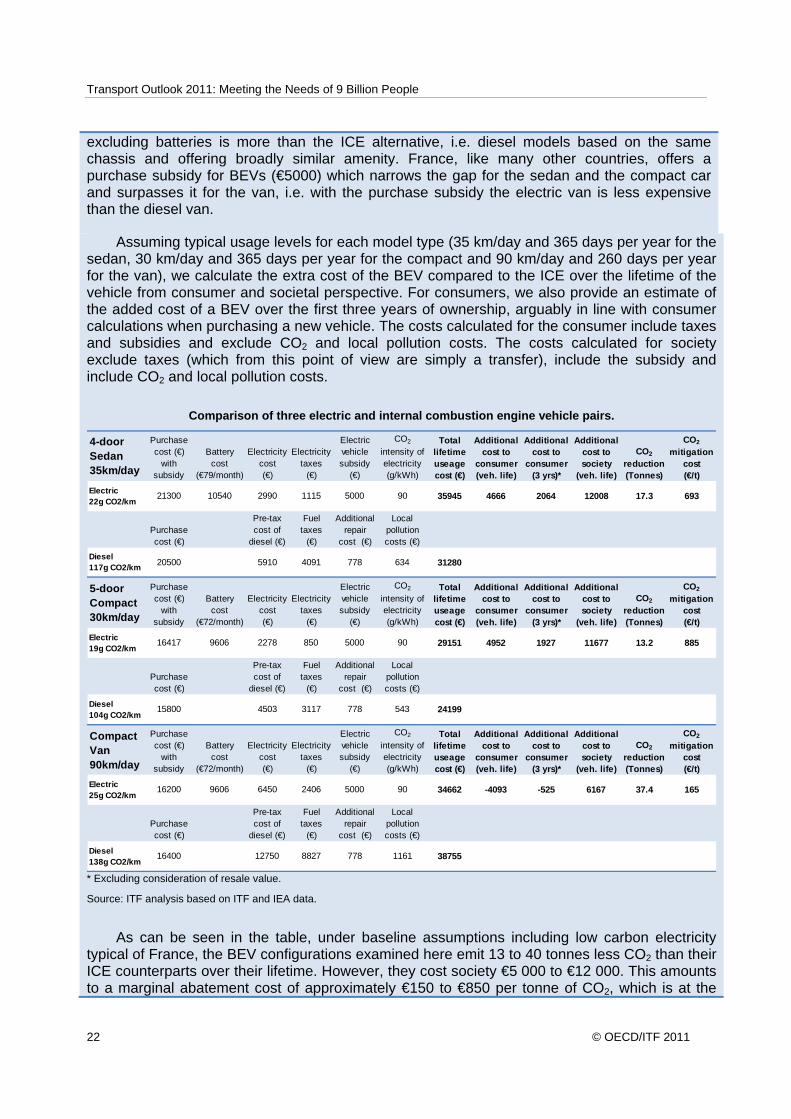
Assuming typical usage levels for each model type (35 km/day and 365 days per year for the sedan, 30 km/day and 365 days per year for the compact and 90 km/day and 260 days per year for the van), we calculate the extra cost of the BEV compared to the ICE over the lifetime of the vehicle from consumer and societal perspective. For consumers, we also provide an estimate of the added cost of a BEV over the first three years of ownership, arguably in line with consumer calculations when purchasing a new vehicle. The costs calculated for the consumer include taxes and subsidies and exclude CO2 and local pollution costs. The costs calculated for society exclude taxes (which from this point of view are simply a transfer), include the subsidy and include CO2 and local pollution costs.
Comparison of three electric and internal combustion engine vehicle pairs.
4-door Sedan 35km/day
Purchase cost (€)
with subsidy
Battery cost
(€79/month)
Electricity cost (€)
Electricity taxes
(€)
Electric vehicle subsidy
(€)
CO2
intensity of electricity (g/kWh)
Total lifetime useage cost (€)
Additional cost to
consumer (veh. life)
Additional cost to
consumer (3 yrs)*
Additional cost to society
(veh. life)
CO2
reduction (Tonnes)
CO2
mitigation cost (€/t)
Electric 22g CO2/km
21300 10540 2990 1115 5000 90 35945 4666 2064 12008 17.3 693
Purchase cost (€)
Pre-tax cost of
diesel (€)
Fuel taxes
(€)
Additional repair
cost (€)
Local pollution costs (€)
Diesel 117g CO2/km 20500 5910 4091 778 634 31280
5-door Compact 30km/day
Purchase cost (€)
with subsidy
Battery cost
(€72/month)
Electricity cost (€)
Electricity taxes
(€)
Electric vehicle subsidy
(€)
CO2
intensity of electricity (g/kWh)
Total lifetime useage cost (€)
Additional cost to
consumer (veh. life)
Additional cost to
consumer (3 yrs)*
Additional cost to society
(veh. life)
CO2
reduction (Tonnes)
CO2
mitigation cost (€/t)
Electric 19g CO2/km
16417 9606 2278 850 5000 90 29151 4952 1927 11677 13.2 885
Purchase cost (€)
Pre-tax cost of
diesel (€)
Fuel taxes
(€)
Additional repair
cost (€)
Local pollution costs (€)
Diesel 104g CO2/km
15800 4503 3117 778 543 24199
Compact Van 90km/day
Purchase cost (€)
with subsidy
Battery cost
(€72/month)
Electricity cost (€)
Electricity taxes
(€)
Electric vehicle subsidy
(€)
CO2
intensity of electricity (g/kWh)
Total lifetime useage cost (€)
Additional cost to
consumer (veh. life)
Additional cost to
consumer (3 yrs)*
Additional cost to society
(veh. life)
CO2
reduction (Tonnes)
CO2
mitigation cost (€/t)
Electric 25g CO2/km
16200 9606 6450 2406 5000 90 34662 -4093 -525 6167 37.4 165
Purchase cost (€)
Pre-tax cost of
diesel (€)
Fuel taxes
(€)
Additional repair
cost (€)
Local pollution costs (€)
Diesel 138g CO2/km
16400 12750 8827 778 1161 38755
* Excluding consideration of resale value.
Source: ITF analysis based on ITF and IEA data.
As can be seen in the table, under baseline assumptions including low carbon electricity typical of France, the BEV configurations examined here emit 13 to 40 tonnes less CO2 than their ICE counterparts over their lifetime. However, they cost society €5 000 to €12 000. This amounts to a marginal abatement cost of approximately €150 to €850 per tonne of CO2, which is at the
Transport Outlook 2011: Meeting the Needs of 9 Billion People
© OECD/ITF 2011 23
high end of the costs of measures to reduce CO2 emissions in the transport sector.
Results are more nuanced for consumers. A consumer will pay between €4 500 and €5 000 more for a BEV over the vehicle lifetime in the case of a sedan or a compact car. But because of higher mileage (and thus avoided diesel costs), a BEV van will cost the user nearly €4 000 less than an equivalent ICE over the lifetime of the vehicle, or €700 less over the three-year consumer perspective period. Under these conditions, one might expect that a market already exists for BEV vans if potential buyers have confidence in the advertised driving ranges and dealer support for these vehicles. A niche market also likely exists for “early adopters” of green technology who are willing to pay more for a BEV sedan or compact car with less range than a comparable ICE.
Sensitivity tests indicate that these results are robust to most plausible changes in parameter values, including strong decreases in battery costs. Two parameters stand out however; the carbon intensity of electricity production and the daily travel distance.
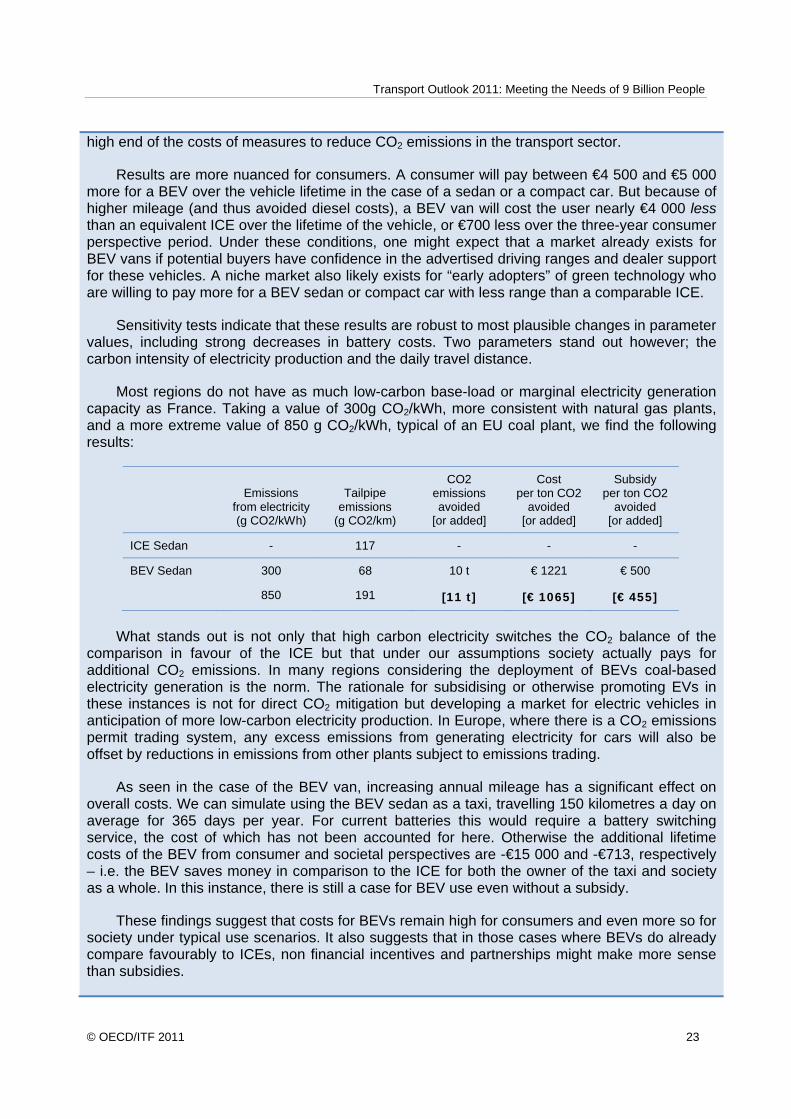
Most regions do not have as much low-carbon base-load or marginal electricity generation capacity as France. Taking a value of 300g CO2/kWh, more consistent with natural gas plants, and a more extreme value of 850 g CO2/kWh, typical of an EU coal plant, we find the following results:
Emissions from electricity (g CO2/kWh)
Tailpipe emissions
(g CO2/km)
CO2 emissions avoided
[or added]
Cost per ton CO2
avoided [or added]
Subsidy per ton CO2
avoided [or added]
ICE Sedan - 117 - - -
BEV Sedan 300 68 10 t € 1221 € 500
850 191 [11 t] [€ 1065] [€ 455]
What stands out is not only that high carbon electricity switches the CO2 balance of the
comparison in favour of the ICE but that under our assumptions society actually pays for additional CO2 emissions. In many regions considering the deployment of BEVs coal-based electricity generation is the norm. The rationale for subsidising or otherwise promoting EVs in these instances is not for direct CO2 mitigation but developing a market for electric vehicles in anticipation of more low-carbon electricity production. In Europe, where there is a CO2 emissions permit trading system, any excess emissions from generating electricity for cars will also be offset by reductions in emissions from other plants subject to emissions trading.
As seen in the case of the BEV van, increasing annual mileage has a significant effect on overall costs. We can simulate using the BEV sedan as a taxi, travelling 150 kilometres a day on average for 365 days per year. For current batteries this would require a battery switching service, the cost of which has not been accounted for here. Otherwise the additional lifetime costs of the BEV from consumer and societal perspectives are -€15 000 and -€713, respectively – i.e. the BEV saves money in comparison to the ICE for both the owner of the taxi and society as a whole. In this instance, there is still a case for BEV use even without a subsidy.
These findings suggest that costs for BEVs remain high for consumers and even more so for society under typical use scenarios. It also suggests that in those cases where BEVs do already compare favourably to ICEs, non financial incentives and partnerships might make more sense than subsidies.
Transport Outlook 2011: Meeting the Needs of 9 Billion People
24 © OECD/ITF 2011
3. PEAK CAR TRAVEL IN ADVANCED ECONOMIES?
As mentioned in Section 2, the car travel demand scenarios used in the projections assume that the per capita demand for car travel increases with income, but when incomes are very high this effect becomes smaller and in the limit it reduces to zero. If car travel demand does not increase with income any longer, then per capita demand can be expected to remain more or less constant if the economy continues to grow and other factors remain unchanged. Aggregate car travel demand then mainly is a function of changes in the size and structure of the population. The macroscopic approach used in Section 2 is highly stylized and simplified. In this Section, we take a brief look at evidence and debates on the changing relation between incomes and car travel demand.
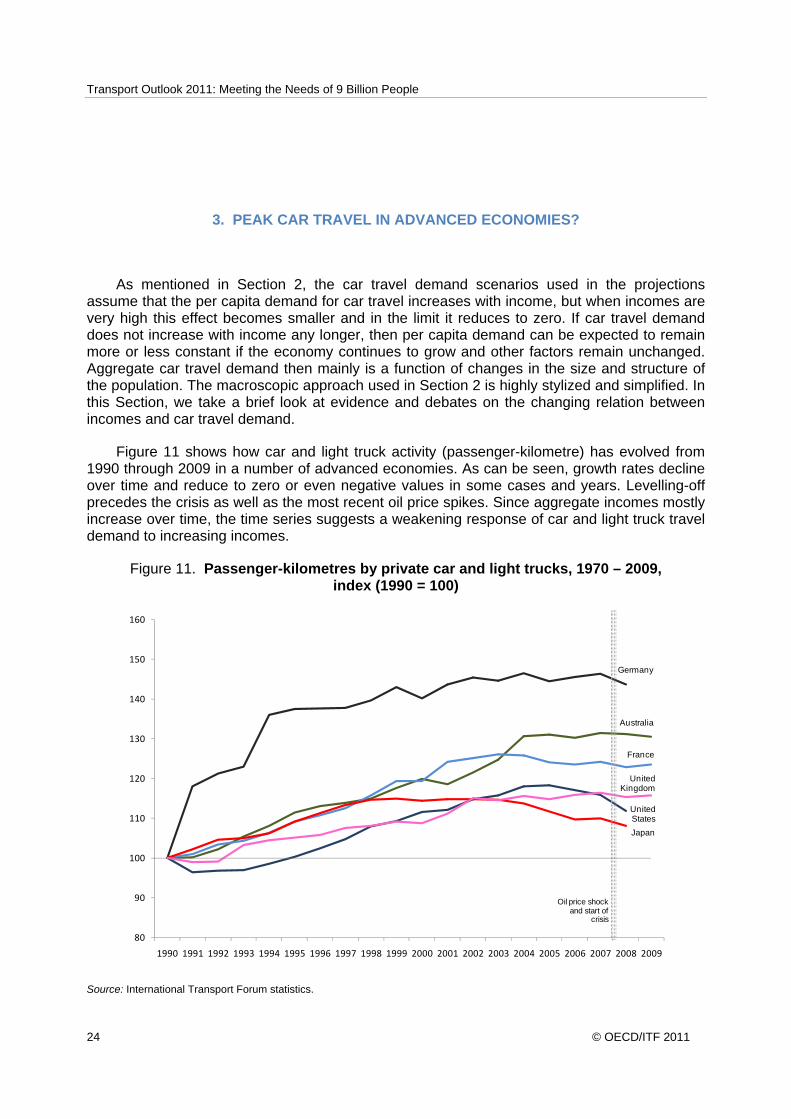
Figure 11 shows how car and light truck activity (passenger-kilometre) has evolved from 1990 through 2009 in a number of advanced economies. As can be seen, growth rates decline over time and reduce to zero or even negative values in some cases and years. Levelling-off precedes the crisis as well as the most recent oil price spikes. Since aggregate incomes mostly increase over time, the time series suggests a weakening response of car and light truck travel demand to increasing incomes.
Figure 11. Passenger-kilometres by private car and light trucks, 1970 – 2009, index (1990 = 100)
80
90
100
110
120
130
140
150
160
1990 1991 1992 1993 1994 1995 1996 1997 1998 1999 2000 2001 2002 2003 2004 2005 2006 2007 2008 2009
Germany
Australia
United States
France
Japan
United Kingdom
Oil price shockand start of
crisis
Source: International Transport Forum statistics.
Transport Outlook 2011: Meeting the Needs of 9 Billion People
© OECD/ITF 2011 25
Millard-Ball and Schipper4 present evidence for eight advanced economies that the rate at which motorized travel (pkm by all motorized modes) increases with per capita GDP declines over time and has levelled off in the years leading up to the crisis of 2008. For most countries this levelling off occurs at a per capita GDP between $25,000 and $30,000 (prices of 2000 at PPP); for the USA the turning point is at $37,000. The picture for per capita car and light truck use (vkm) is similar, except that it shows declines of car and light truck use in the last years before the crisis. Car ownership exhibits a similar pattern. These observed patterns can be the result of a range of explanatory factors including saturation, higher fuel prices, declining rates of transport infrastructure expansion, ageing, urbanization, macroeconomic shocks, income inequality, the advent of the online economy, etc. Millard-Ball and Schipper are careful to point out that the evidence does not allow them to draw definitive conclusions but nevertheless they see saturation as a plausible and important factor. It also bears reminding that international air travel is excluded from the analysis, even though air travel is growing fast and is no longer insignificant on a per capita basis.
Saturation of car travel is defined here as a situation in which additional car travel does not generate additional benefits for users and therefore travel will no longer increase even if higher time and money budgets allow it. The concept makes sense, but whether the observed patterns are (mainly) the result of saturation is far less clear. The issue is of obvious importance for future projections, as even small deviations from the saturation hypothesis have large impacts on aggregate demand patterns in the long run (see Section 2). For example, the UK Department for Transport expects a 30% increase in car traffic between 2010 and 2030.5 The increase is driven to a large extent by population growth (+16% in the same period) but other factors, including higher incomes and lower real costs of driving, matter as well and this means there is no saturation but just declining responsiveness of travel demand to rising incomes. As another example, the Dutch mid-term projections6 expect that car mobility will grow faster than GDP between 2011 and 2015 (whereas it had grown more slowly than GDP between 2006 and 2010), if assumptions regarding fuel prices and network management hold true. Furthermore, it is emphasized that small changes in volumes can have large consequences, notably in terms of congestion. The limited reduction in travel (about 1%) because of the economic crisis in 2009 reduced congestion on the main network by about 10%. The limited increase in travel expected for the medium term can have equally disproportional effects on congestion levels.
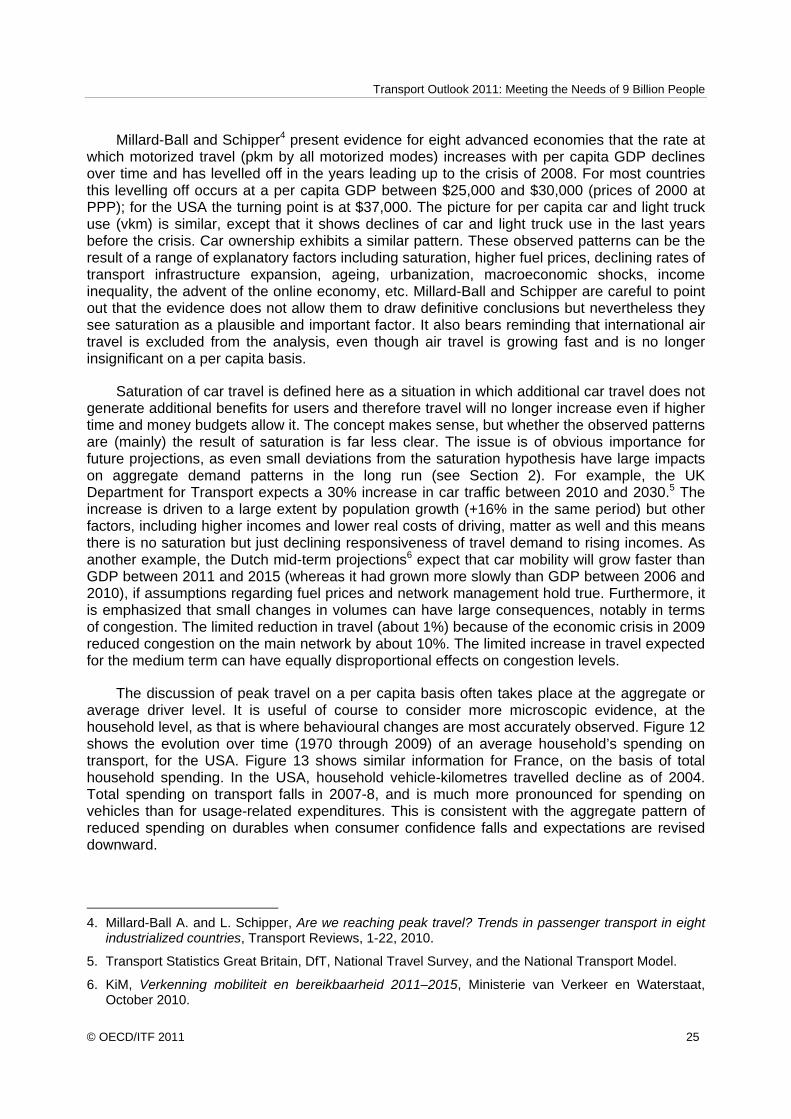
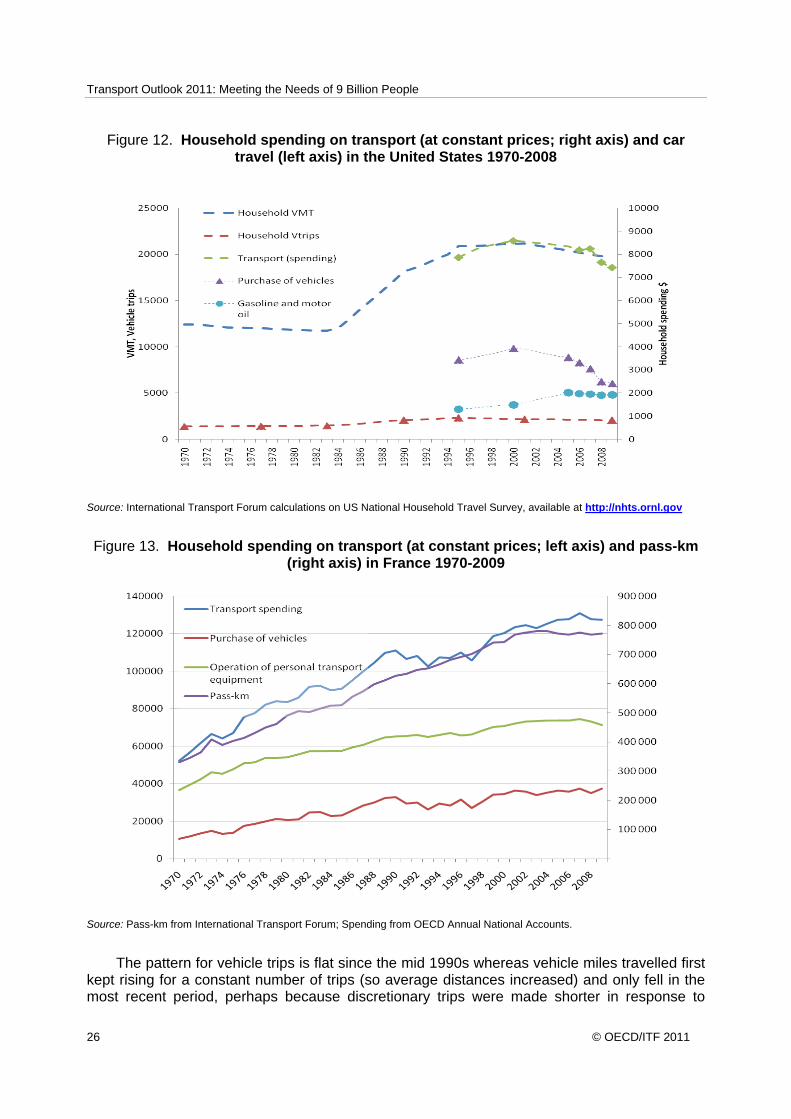
The discussion of peak travel on a per capita basis often takes place at the aggregate or average driver level. It is useful of course to consider more microscopic evidence, at the household level, as that is where behavioural changes are most accurately observed. Figure 12 shows the evolution over time (1970 through 2009) of an average household’s spending on transport, for the USA. Figure 13 shows similar information for France, on the basis of total household spending. In the USA, household vehicle-kilometres travelled decline as of 2004. Total spending on transport falls in 2007-8, and is much more pronounced for spending on vehicles than for usage-related expenditures. This is consistent with the aggregate pattern of reduced spending on durables when consumer confidence falls and expectations are revised downward.
4. Millard-Ball A. and L. Schipper, Are we reaching peak travel? Trends in passenger transport in eight
industrialized countries, Transport Reviews, 1-22, 2010.
5. Transport Statistics Great Britain, DfT, National Travel Survey, and the National Transport Model.
6. KiM, Verkenning mobiliteit en bereikbaarheid 2011–2015, Ministerie van Verkeer en Waterstaat, October 2010.
Transport Outlook 2011: Meeting the Needs of 9 Billion People
26 © OECD/ITF 2011
Figure 12. Household spending on transport (at constant prices; right axis) and car travel (left axis) in the United States 1970-2008
Source: International Transport Forum calculations on US National Household Travel Survey, available at http://nhts.ornl.gov
Figure 13. Household spending on transport (at constant prices; left axis) and pass-km (right axis) in France 1970-2009
Source: Pass-km from International Transport Forum; Spending from OECD Annual National Accounts.
The pattern for vehicle trips is flat since the mid 1990s whereas vehicle miles travelled first kept rising for a constant number of trips (so average distances increased) and only fell in the most recent period, perhaps because discretionary trips were made shorter in response to
Transport Outlook 2011: Meeting the Needs of 9 Billion People
© OECD/ITF 2011 27
higher fuel prices and/or reduced incomes or income expectations. The pattern for France is similar overall, except that spending on vehicles, total transport spending, and passenger-kilometre do not exhibit the same precipitous drop as in the USA in the most recent years recorded. The average pattern is thus equally suggestive of saturation as the aggregate data discussed before. It is also equally inconclusive, in the sense that it is fairly safe to say that the rate at which car transport demand and transport expenditures increase with income is on the decline in the richest countries, but not at all obvious that continued income growth will no longer lead to more car transport.
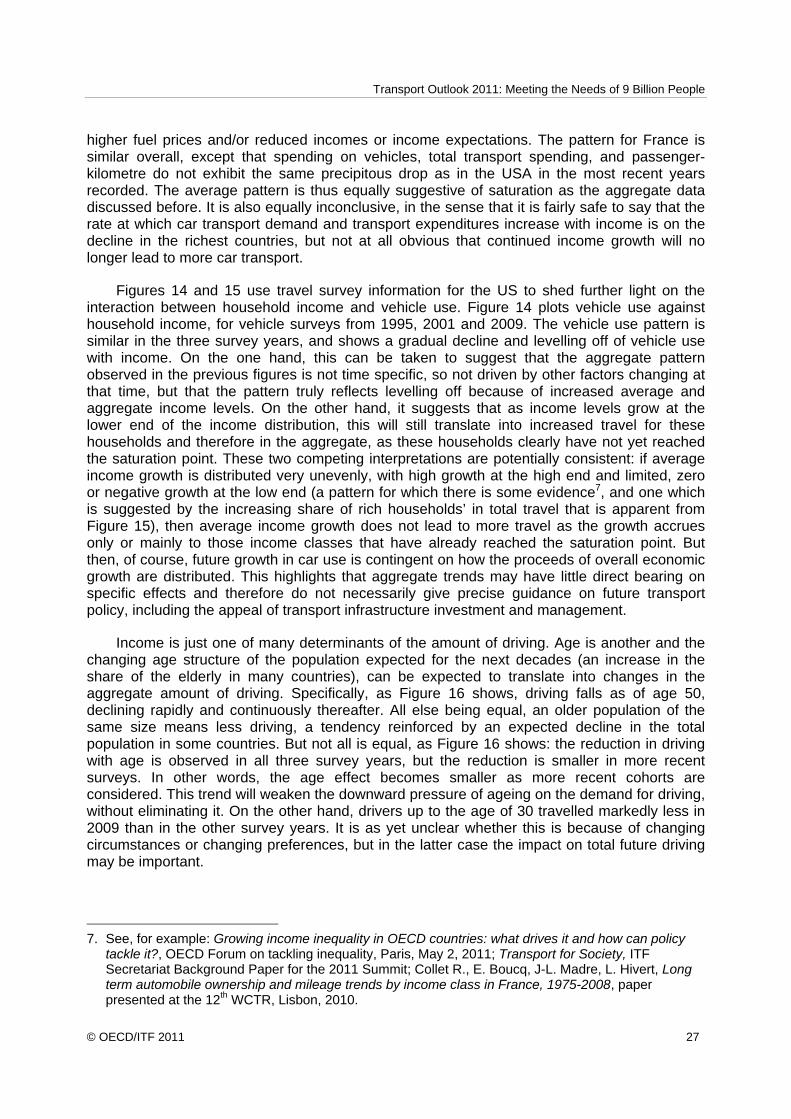
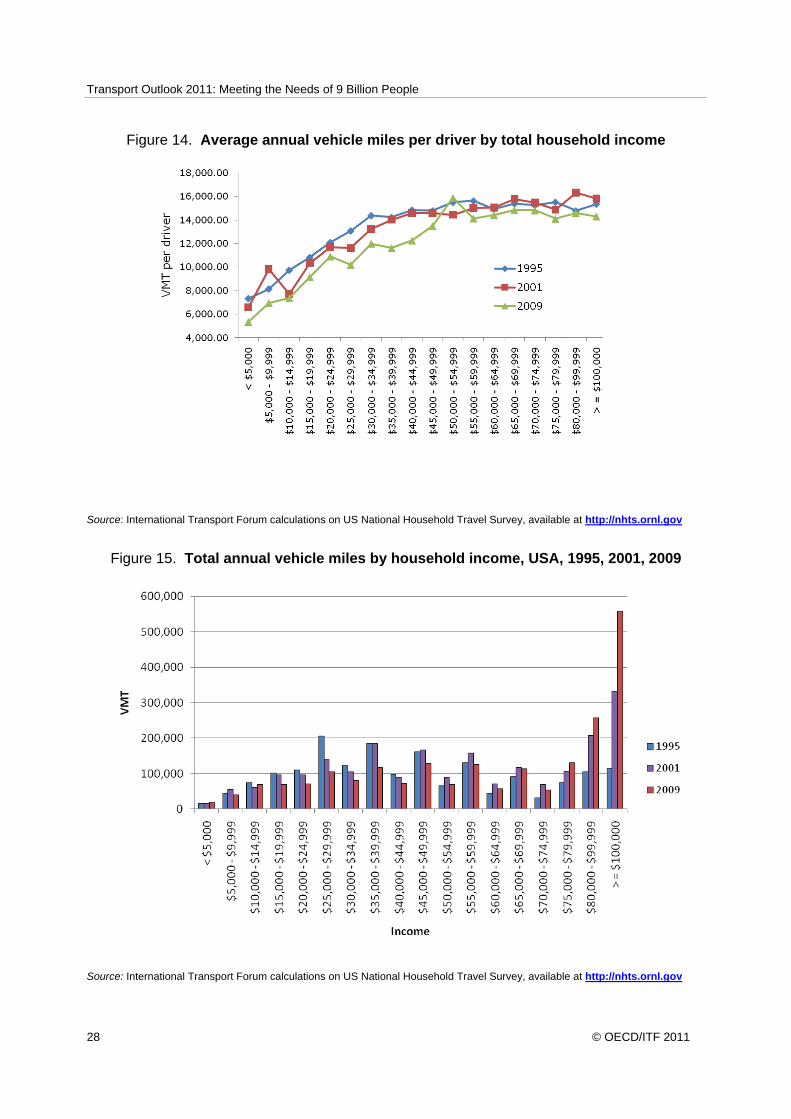
Figures 14 and 15 use travel survey information for the US to shed further light on the interaction between household income and vehicle use. Figure 14 plots vehicle use against household income, for vehicle surveys from 1995, 2001 and 2009. The vehicle use pattern is similar in the three survey years, and shows a gradual decline and levelling off of vehicle use with income. On the one hand, this can be taken to suggest that the aggregate pattern observed in the previous figures is not time specific, so not driven by other factors changing at that time, but that the pattern truly reflects levelling off because of increased average and aggregate income levels. On the other hand, it suggests that as income levels grow at the lower end of the income distribution, this will still translate into increased travel for these households and therefore in the aggregate, as these households clearly have not yet reached the saturation point. These two competing interpretations are potentially consistent: if average income growth is distributed very unevenly, with high growth at the high end and limited, zero or negative growth at the low end (a pattern for which there is some evidence7, and one which is suggested by the increasing share of rich households’ in total travel that is apparent from Figure 15), then average income growth does not lead to more travel as the growth accrues only or mainly to those income classes that have already reached the saturation point. But then, of course, future growth in car use is contingent on how the proceeds of overall economic growth are distributed. This highlights that aggregate trends may have little direct bearing on specific effects and therefore do not necessarily give precise guidance on future transport policy, including the appeal of transport infrastructure investment and management.
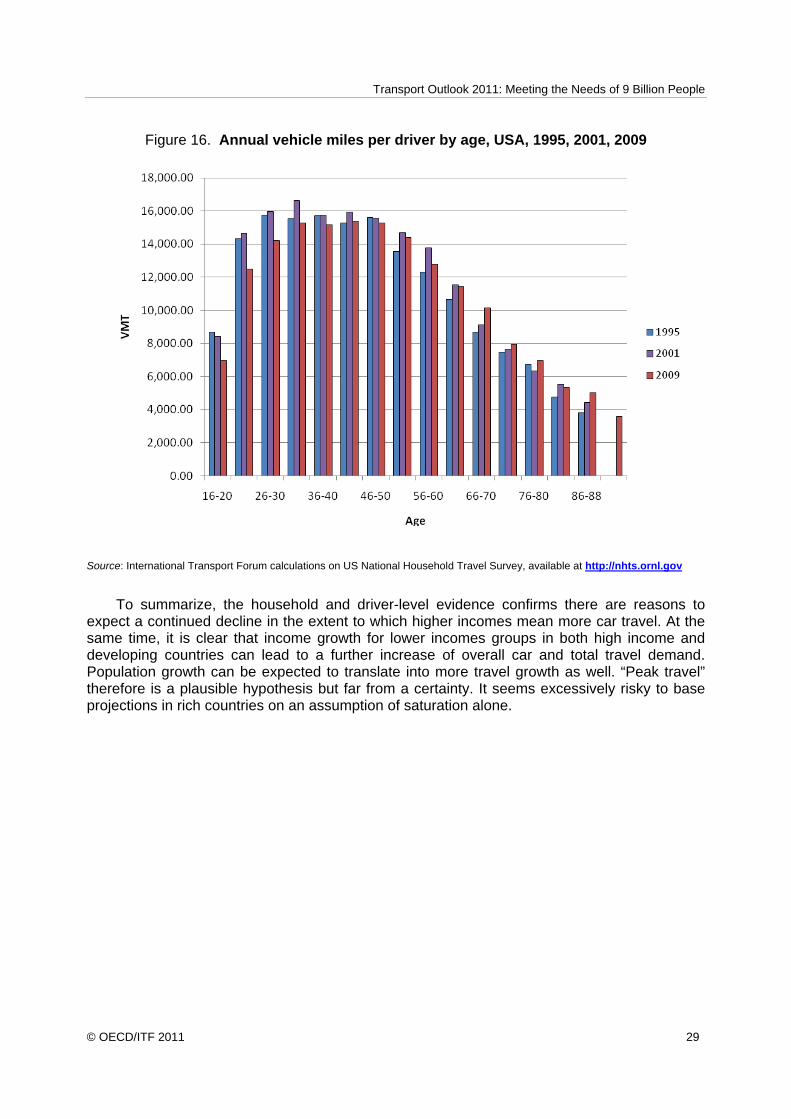
Income is just one of many determinants of the amount of driving. Age is another and the changing age structure of the population expected for the next decades (an increase in the share of the elderly in many countries), can be expected to translate into changes in the aggregate amount of driving. Specifically, as Figure 16 shows, driving falls as of age 50, declining rapidly and continuously thereafter. All else being equal, an older population of the same size means less driving, a tendency reinforced by an expected decline in the total population in some countries. But not all is equal, as Figure 16 shows: the reduction in driving with age is observed in all three survey years, but the reduction is smaller in more recent surveys. In other words, the age effect becomes smaller as more recent cohorts are considered. This trend will weaken the downward pressure of ageing on the demand for driving, without eliminating it. On the other hand, drivers up to the age of 30 travelled markedly less in 2009 than in the other survey years. It is as yet unclear whether this is because of changing circumstances or changing preferences, but in the latter case the impact on total future driving may be important.
7. See, for example: Growing income inequality in OECD countries: what drives it and how can policy
tackle it?, OECD Forum on tackling inequality, Paris, May 2, 2011; Transport for Society, ITF Secretariat Background Paper for the 2011 Summit; Collet R., E. Boucq, J-L. Madre, L. Hivert, Long term automobile ownership and mileage trends by income class in France, 1975-2008, paper presented at the 12th WCTR, Lisbon, 2010.
Transport Outlook 2011: Meeting the Needs of 9 Billion People
28 © OECD/ITF 2011
Figure 14. Average annual vehicle miles per driver by total household income
Source: International Transport Forum calculations on US National Household Travel Survey, available at http://nhts.ornl.gov
Figure 15. Total annual vehicle miles by household income, USA, 1995, 2001, 2009
Source: International Transport Forum calculations on US National Household Travel Survey, available at http://nhts.ornl.gov
Transport Outlook 2011: Meeting the Needs of 9 Billion People
© OECD/ITF 2011 29
Figure 16. Annual vehicle miles per driver by age, USA, 1995, 2001, 2009
Source: International Transport Forum calculations on US National Household Travel Survey, available at http://nhts.ornl.gov
To summarize, the household and driver-level evidence confirms there are reasons to expect a continued decline in the extent to which higher incomes mean more car travel. At the same time, it is clear that income growth for lower incomes groups in both high income and developing countries can lead to a further increase of overall car and total travel demand. Population growth can be expected to translate into more travel growth as well. “Peak travel” therefore is a plausible hypothesis but far from a certainty. It seems excessively risky to base projections in rich countries on an assumption of saturation alone.
Transport Outlook 2011: Meeting the Needs of 9 Billion People
30 © OECD/ITF 2011
4. TRADE AND FREIGHT TRANSPORT BY SEA AND AIR
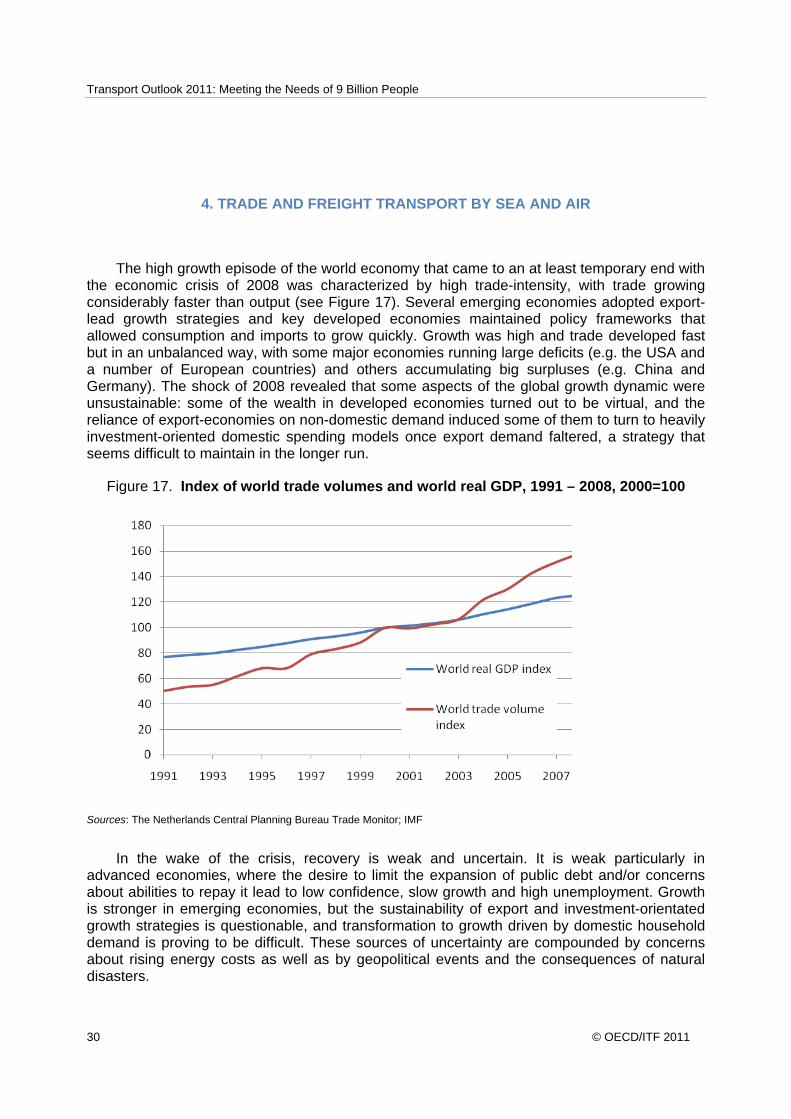
The high growth episode of the world economy that came to an at least temporary end with the economic crisis of 2008 was characterized by high trade-intensity, with trade growing considerably faster than output (see Figure 17). Several emerging economies adopted export-lead growth strategies and key developed economies maintained policy frameworks that allowed consumption and imports to grow quickly. Growth was high and trade developed fast but in an unbalanced way, with some major economies running large deficits (e.g. the USA and a number of European countries) and others accumulating big surpluses (e.g. China and Germany). The shock of 2008 revealed that some aspects of the global growth dynamic were unsustainable: some of the wealth in developed economies turned out to be virtual, and the reliance of export-economies on non-domestic demand induced some of them to turn to heavily investment-oriented domestic spending models once export demand faltered, a strategy that seems difficult to maintain in the longer run.
Figure 17. Index of world trade volumes and world real GDP, 1991 – 2008, 2000=100
Sources: The Netherlands Central Planning Bureau Trade Monitor; IMF
In the wake of the crisis, recovery is weak and uncertain. It is weak particularly in advanced economies, where the desire to limit the expansion of public debt and/or concerns about abilities to repay it lead to low confidence, slow growth and high unemployment. Growth is stronger in emerging economies, but the sustainability of export and investment-orientated growth strategies is questionable, and transformation to growth driven by domestic household demand is proving to be difficult. These sources of uncertainty are compounded by concerns about rising energy costs as well as by geopolitical events and the consequences of natural disasters.

Transport Outlook 2011: Meeting the Needs of 9 Billion People
© OECD/ITF 2011 31
Despite these uncertainties, however, global trade volumes have now surpassed pre-crisis levels according to the Trade Monitor published by The Netherlands Central Planning Bureau, see Figure 18. The post-crisis growth of trade initially was very fast, suggesting a rebound after the collapse in 2008 and 2009, moderating more recently and conceivably in line with the pre-crisis trend. The same picture emerges from WTO data and expectations for world export growth, see Figure 19, which after a post-crisis rebound is expected to align with pre-crisis trend rates, so that the long run effect of the crisis is a downward shift of the export curve. While this reconnection with “business as usual” is a reasonable expectation, on the basis of the uncertainties listed above the downside risks appear to outweigh the upside opportunities.
Figure 18. Index of world trade volumes, January 1991 – February 2011, 2000=100
Source: The Netherlands Central Planning Bureau, Trade Monitor.
Figure 19. Index of world export volumes, 1990 – 2001, 1990 = 100
Source: WTO Secretariat, http://www.wto.org/english/news_e/pres11_e/pr628_e.htm

Transport Outlook 2011: Meeting the Needs of 9 Billion People
32 © OECD/ITF 2011
Trade-intensive growth means transport-intensive growth. The macroeconomic growth strategies and firms’ efforts to benefit from the lowest factor-prices through geographic dispersion in their supply chains – which together can be said to constitute globalization – lead to fast growth of transport volumes within and between the world’s major regions. In order to follow the evolution of trade and in particular transport patterns in the short and medium run, the International Transport Forum has launched a new database, assembling data from a range of existing sources. These data lend further support to the view that the recovery is weak, particularly in advanced economies, and uncertain. Figure 20 shows that maritime cargo volumes to and from the EU and the USA, measured in tonnes, had not reached pre-crisis levels by the end of 2010. Air cargo volumes had more than recovered, but they show an appreciable slowdown in growth near the end of 2010, particularly in the USA.
Figure 20. External trade by sea, percentage change from pre-crisis peak Jun-08 (Tonnes, monthly trend, seasonally adjusted)
-16
.9
-6.7
-4.2
De
c-1
0
Jun
-09
Se
p-1
0
Jul-
08
-15
.9
-5.4
-5.1
De
c-1
0
Jul-
09
Se
p-1
0
Jul-
08
USA trade by seaEU 27 trade by sea
-20
.5
13
.9
15
.1D
ec-
10
Ap
r-0
9
Se
p-1
0
Jul-
08
EU 27 trade by air
-20
.9
3.3
1.1
De
c-1
0
Feb
-09
Se
p-1
0
Jul-
08
USA trade by air
Source: International Transport Forum Global Trade and Transport database, IATA.
The remainder of this section reports on the regional structure of trade and transport flows, focussing on trade between large regional aggregates in 2005, 2007 and 2010.8 It shows how economic mass and trade flows are growing as well as being redistributed over the globe.
8. Specifically, the database describes EU and USA imports and exports. For the EU the following
regions are considered: Africa, Asia-Pacific, Europe, Latin America, Middle East, and North America. For the USA, the regions are Africa, Asia-Pacific, Europe, Latin America, Middle East, North America, and EU27.
Transport Outlook 2011: Meeting the Needs of 9 Billion People
© OECD/ITF 2011 33
As indicated above, the 2008 crisis has by and large been overcome, but it can be seen as a marker event for the relative decline of the EU and the USA and the rise of emerging economies, in particular in the Asia-Pacific region. However, the highly unbalanced growth pattern observed before and even more so after the crisis seems unsustainable in the long run. The question for the short and medium run is whether rebalancing will take place gradually, i.e. accommodated by policy to the extent possible, or through further shocks to the global economic system. Changing relative costs of production, triggered by changing wages, capital costs, and energy prices, can affect trade and transport patterns, with most factors now pointing in the direction of shorter supply chains rather than continued fragmentation and dispersion.
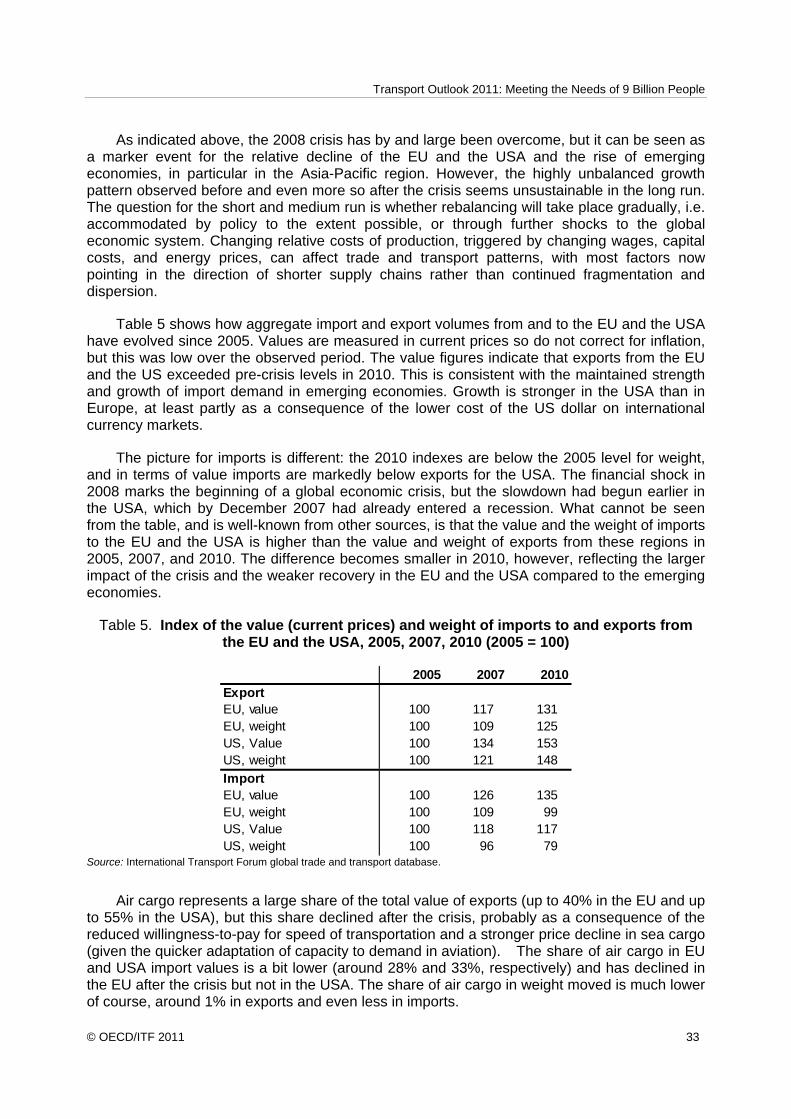
Table 5 shows how aggregate import and export volumes from and to the EU and the USA have evolved since 2005. Values are measured in current prices so do not correct for inflation, but this was low over the observed period. The value figures indicate that exports from the EU and the US exceeded pre-crisis levels in 2010. This is consistent with the maintained strength and growth of import demand in emerging economies. Growth is stronger in the USA than in Europe, at least partly as a consequence of the lower cost of the US dollar on international currency markets.
The picture for imports is different: the 2010 indexes are below the 2005 level for weight, and in terms of value imports are markedly below exports for the USA. The financial shock in 2008 marks the beginning of a global economic crisis, but the slowdown had begun earlier in the USA, which by December 2007 had already entered a recession. What cannot be seen from the table, and is well-known from other sources, is that the value and the weight of imports to the EU and the USA is higher than the value and weight of exports from these regions in 2005, 2007, and 2010. The difference becomes smaller in 2010, however, reflecting the larger impact of the crisis and the weaker recovery in the EU and the USA compared to the emerging economies.
Table 5. Index of the value (current prices) and weight of imports to and exports from the EU and the USA, 2005, 2007, 2010 (2005 = 100)
2005 2007 2010ExportEU, value 100 117 131 EU, weight 100 109 125 US, Value 100 134 153 US, weight 100 121 148 Import EU, value 100 126 135 EU, weight 100 109 99 US, Value 100 118 117 US, weight 100 96 79
Source: International Transport Forum global trade and transport database.
Air cargo represents a large share of the total value of exports (up to 40% in the EU and up to 55% in the USA), but this share declined after the crisis, probably as a consequence of the reduced willingness-to-pay for speed of transportation and a stronger price decline in sea cargo (given the quicker adaptation of capacity to demand in aviation). The share of air cargo in EU and USA import values is a bit lower (around 28% and 33%, respectively) and has declined in the EU after the crisis but not in the USA. The share of air cargo in weight moved is much lower of course, around 1% in exports and even less in imports.

Transport Outlook 2011: Meeting the Needs of 9 Billion People
34 © OECD/ITF 2011
The following tends are noteworthy for the EU.
• In the regional composition of trade and transport volumes, exports measured in value from the EU mainly go to Asia-Pacific and to North America. Concretely, the value of exports by air to Asia-Pacific and North America represents 72% of the total value of exports from the EU in 2005 as well as in 2007 and 2010. But the composition of this constant share changes, in line with the rising importance of the Asia-Pacific region: the share of Asia-Pacific in the total increases from 34% in 2005 to 39% in 2010, while that of North America declines by 5%-point to reach 33% in 2010. The regional concentration of maritime exports is weaker than that of exports by air: Asia-Pacific and North America dominate maritime exports from the EU but represent only about 55% of the total, a share that appears to be declining somewhat in the period considered, and in which the relative importance of the Asia-Pacific region increases.
• Looking at tonnes exported from the EU, air exports are dominated by the same two regions, but for maritime weights, Africa is ranked highest in 2010. The regional concentration of weight exported by sea is notably lower than that of weight moved by air and that of values moved by either mode. The weight-measures confirm the overall picture of the value-measures, except that they show an absolute decline of tonnes exported from the EU to the USA, in the sense that 2010 weights are below 2005 weights for both transport modes.
• Imports to the EU by air measured in value come mainly from Asia-Pacific and North America: the share of those regions combined is about 83% in the three years considered, a level of concentration considerably higher than found in air exports. As in other markets, the Asia-Pacific region gains while North America declines. The regional concentration of imports by sea in value is much weaker and in fact different in the sense that North America shows a quite small share (between 9 and 10%). Instead, the value of EU imports by sea is dominated by Asia-Pacific and by non-EU European countries.
• Imports to the EU measured in weight come mainly from Asia-Pacific where air cargo is concerned, with a share rising from 48.6% in 2005 to 54.4% in 2010. North America comes second with a share that has declined to 18.6% in 2010. For maritime weight imported, the regional pattern differs somewhat, with the highest share coming from other European countries.
Overall, the figures for the EU show a close connection between transport flows and the changing distribution of economic mass over the world. But the strength of the connection differs between modes, between value and weight, and to some extent between imports and exports. For air transport, the regional concentration and its evolution over time are very closely tied to the global distribution of economic mass. For maritime transport, the concentration is weaker, especially where weights and imports to the EU are concerned.
For the USA the picture is as follows.
• The value of exports from the USA is dominated by Europe and Asia Pacific, which together account for about 79% of air export values and 63% of sea export values. Contrary to what is observed for the EU, the share of Asia-Pacific does not rise very strongly between 2005 and 2010, although its share is a bit higher in 2010 than it is in 2005.
• Exports in tonnes go mainly to the same two regions, with shares and evolutions closely resembling the value shares.
Transport Outlook 2011: Meeting the Needs of 9 Billion People
© OECD/ITF 2011 35
• Imports to the USA in value terms are dominated by Asia Pacific and Europe as well. About 51% of imports in value moved by air come from Asia Pacific, and 36% from Europe. The value of maritime imports comes from Asia Pacific for 49%, a share increasing somewhat over time, and for 20% from Europe, a share that seems to be declining slightly.
• The weight shares reflect the value shares, except for a higher share of imports coming from Latin America where weight is considered, in particular weight moved by sea.
The USA figures reflect the large share that Europe and the Asia-Pacific region represent of global trade flows (together with the USA itself, of course). One difference with the EU trends is that the EU shows a clear shift of trade mass towards the Asia-Pacific region between 2005 and 2010, while the change in trade by region is small for the USA. The main observation for the USA is that weights imported by sea in 2010 are considerably lower than weights imported in 2005, and this holds for all regions; for imports by air, there are slight increases for some markets. Tonnes exported increase for nearly all destinations. This pattern suggest a considerable degree of rebalancing between 2005 and 2010, an adaptation that may reflect the severity of the initial imbalances as much as the speed of rebalancing. The EU shows a more mixed picture, with declining weights imported from some regions and increasing weights from others (notably maritime imports from the USA, an outcome for which the dollar exchange rate probably is an explanatory factor, especially since exports to the USA show an opposite trend).
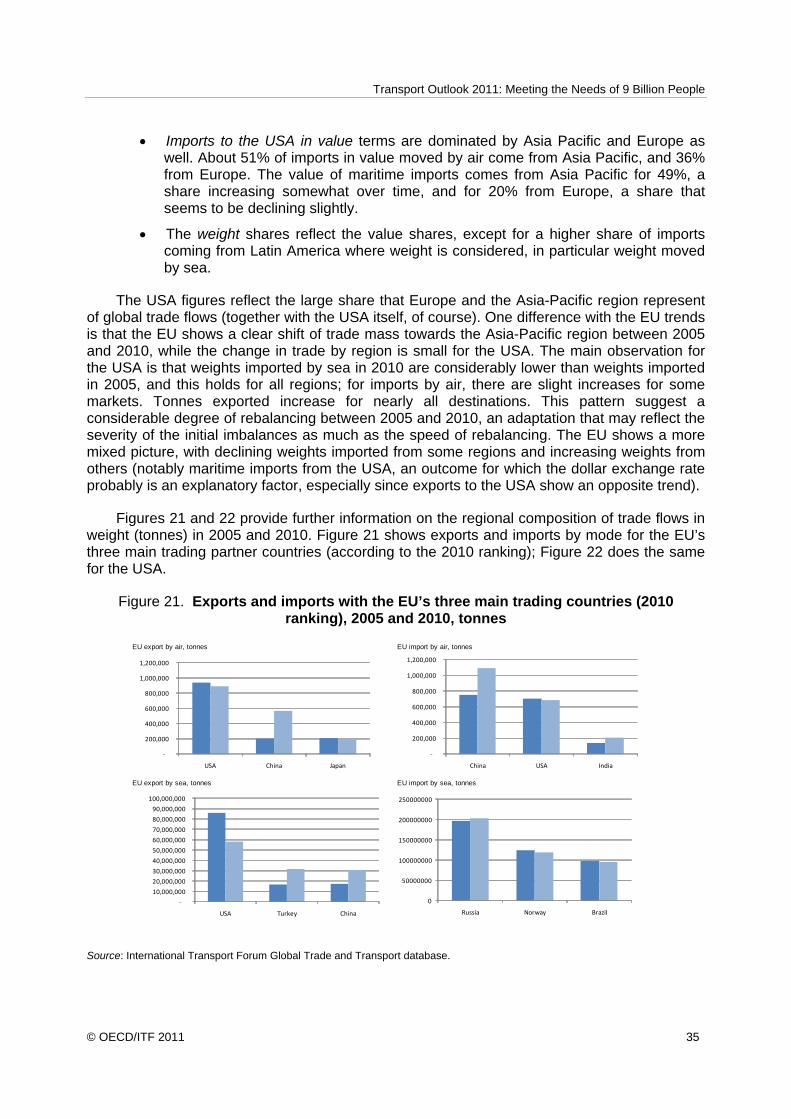
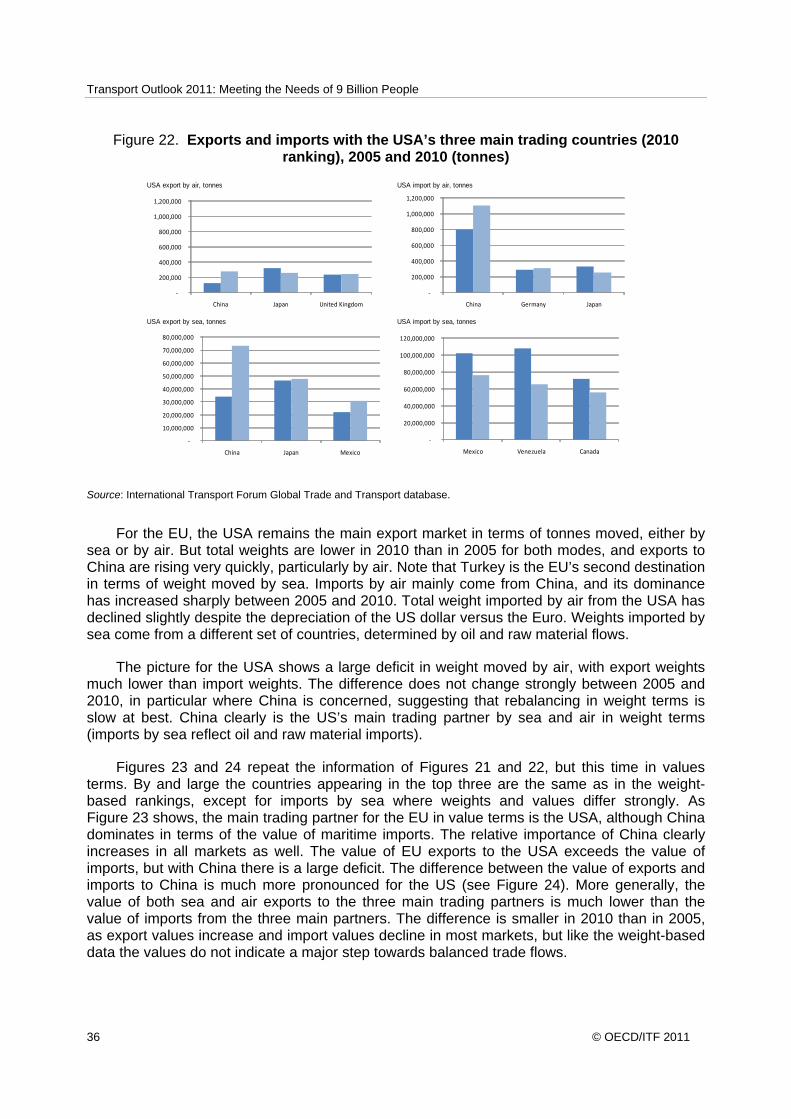
Figures 21 and 22 provide further information on the regional composition of trade flows in weight (tonnes) in 2005 and 2010. Figure 21 shows exports and imports by mode for the EU’s three main trading partner countries (according to the 2010 ranking); Figure 22 does the same for the USA.
Figure 21. Exports and imports with the EU’s three main trading countries (2010 ranking), 2005 and 2010, tonnes
EU export by air, tonnes EU import by air, tonnes
EU export by sea, tonnes EU import by sea, tonnes
‐
200,000
400,000
600,000
800,000
1,000,000
1,200,000
USA China Japan
‐
10,000,000
20,000,000
30,000,000
40,000,000
50,000,000
60,000,000
70,000,000
80,000,000
90,000,000
100,000,000
USA Turkey China
‐
200,000
400,000
600,000
800,000
1,000,000
1,200,000
China USA India
0
50000000
100000000
150000000
200000000
250000000
Russia Norway Brazil
Source: International Transport Forum Global Trade and Transport database.
Transport Outlook 2011: Meeting the Needs of 9 Billion People
36 © OECD/ITF 2011
Figure 22. Exports and imports with the USA’s three main trading countries (2010 ranking), 2005 and 2010 (tonnes)
USA export by air, tonnes USA import by air, tonnes
USA export by sea, tonnes USA import by sea, tonnes
‐
200,000
400,000
600,000
800,000
1,000,000
1,200,000
China Japan United Kingdom
‐
10,000,000
20,000,000
30,000,000
40,000,000
50,000,000
60,000,000
70,000,000
80,000,000
China Japan Mexico
‐
200,000
400,000
600,000
800,000
1,000,000
1,200,000
China Germany Japan
‐
20,000,000
40,000,000
60,000,000
80,000,000
100,000,000
120,000,000
Mexico Venezuela Canada
Source: International Transport Forum Global Trade and Transport database.
For the EU, the USA remains the main export market in terms of tonnes moved, either by sea or by air. But total weights are lower in 2010 than in 2005 for both modes, and exports to China are rising very quickly, particularly by air. Note that Turkey is the EU’s second destination in terms of weight moved by sea. Imports by air mainly come from China, and its dominance has increased sharply between 2005 and 2010. Total weight imported by air from the USA has declined slightly despite the depreciation of the US dollar versus the Euro. Weights imported by sea come from a different set of countries, determined by oil and raw material flows.
The picture for the USA shows a large deficit in weight moved by air, with export weights much lower than import weights. The difference does not change strongly between 2005 and 2010, in particular where China is concerned, suggesting that rebalancing in weight terms is slow at best. China clearly is the US’s main trading partner by sea and air in weight terms (imports by sea reflect oil and raw material imports).
Figures 23 and 24 repeat the information of Figures 21 and 22, but this time in values terms. By and large the countries appearing in the top three are the same as in the weight-based rankings, except for imports by sea where weights and values differ strongly. As Figure 23 shows, the main trading partner for the EU in value terms is the USA, although China dominates in terms of the value of maritime imports. The relative importance of China clearly increases in all markets as well. The value of EU exports to the USA exceeds the value of imports, but with China there is a large deficit. The difference between the value of exports and imports to China is much more pronounced for the US (see Figure 24). More generally, the value of both sea and air exports to the three main trading partners is much lower than the value of imports from the three main partners. The difference is smaller in 2010 than in 2005, as export values increase and import values decline in most markets, but like the weight-based data the values do not indicate a major step towards balanced trade flows.
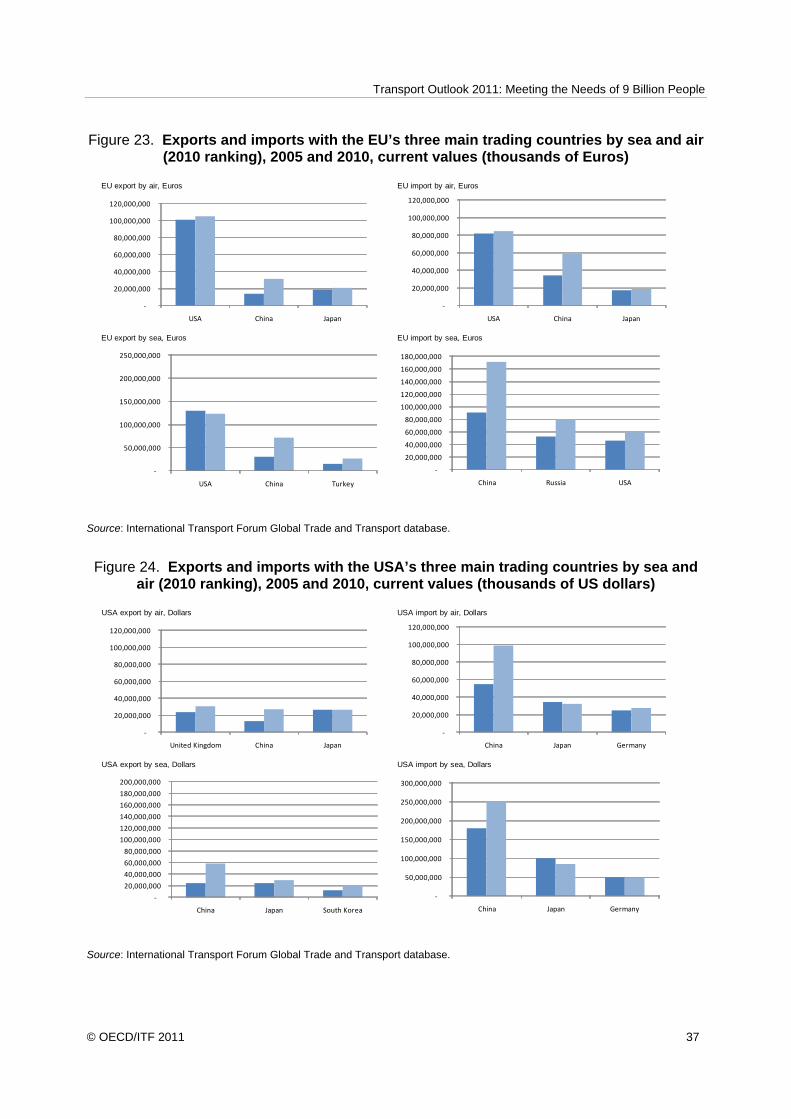
Transport Outlook 2011: Meeting the Needs of 9 Billion People
© OECD/ITF 2011 37
Figure 23. Exports and imports with the EU’s three main trading countries by sea and air (2010 ranking), 2005 and 2010, current values (thousands of Euros)
EU export by air, Euros EU import by air, Euros
EU export by sea, Euros EU import by sea, Euros
‐
20,000,000
40,000,000
60,000,000
80,000,000
100,000,000
120,000,000
USA China Japan
‐
50,000,000
100,000,000
150,000,000
200,000,000
250,000,000
USA China Turkey
‐
20,000,000
40,000,000
60,000,000
80,000,000
100,000,000
120,000,000
USA China Japan
‐
20,000,000
40,000,000
60,000,000
80,000,000
100,000,000
120,000,000
140,000,000
160,000,000
180,000,000
China Russia USA
Source: International Transport Forum Global Trade and Transport database.
Figure 24. Exports and imports with the USA’s three main trading countries by sea and air (2010 ranking), 2005 and 2010, current values (thousands of US dollars)
USA export by air, Dollars USA import by air, Dollars
USA export by sea, Dollars USA import by sea, Dollars
‐
20,000,000
40,000,000
60,000,000
80,000,000
100,000,000
120,000,000
United Kingdom China Japan
‐
20,000,000
40,000,000
60,000,000
80,000,000
100,000,000
120,000,000
140,000,000
160,000,000
180,000,000
200,000,000
China Japan South Korea
‐
20,000,000
40,000,000
60,000,000
80,000,000
100,000,000
120,000,000
China Japan Germany
‐
50,000,000
100,000,000
150,000,000
200,000,000
250,000,000
300,000,000
China Japan Germany
Source: International Transport Forum Global Trade and Transport database.
Transport Outlook 2011: Meeting the Needs of 9 Billion People
38 © OECD/ITF 2011
Summing up, the trade and transport data indicate a fairly rapid rebound of trade and transport levels after the crisis, but toward the end of 2010 the pace of recovery seems to have slowed down. Such a slowdown should not come as a surprise given the various downside risks that threaten the world economy and that limit improvements in confidence and in aggregate demand. The crisis accentuates a shift of economic mass from the advanced to the emerging economies, in particular toward China. The rising importance of China and its region is clearly reflected in the changing geographical composition of trade and transport flows. This process can be expected to continue over the long run. In the years after the crisis, the strong Chinese economy has been the locomotive of recovery, and this new role can be expected to gain prominence in the future. That is why uncertainties concerning the sustainability of the Chinese growth model, which relies heavily on exports and on domestic investment demand, are a concern not only for China region but for the world economy as a whole.

Transport Outlook 2011: Meeting the Needs of 9 Billion People
© OECD/ITF 2011 39
ANNEX: THE INTERNATIONAL TRANSPORT FORUM’S GLOBAL TRADE 4AND TRANSPORT DATABASE – SHORT DESCRIPTION AND SUMMARY TABLES
The International Transport Forum’s Global Trade and Transport Database compiles directional region and country level information on trade volumes (import/export; values/tonnes) transported by sea and by air. Data sources include Eurostat, the US Census, The Japanese Ministry of Finance and the IMF. The database is in Excel format and it is built to allow easy manipulation, e.g. geographical aggregation and data extraction and to be updated on a monthly basis.
The Database consists of two parts:
The “Total Trade Flows Database”, which summarizes trade volumes in monetary value between major regions and countries. This database provides summary tables on trade flows volumes in USD between major countries and regions. Global country pairs level data is available should users have particular interests in specific markets. For data consistency reason among reporting countries, only IMPORT CIF data is recorded. Data come from the International Monetary Fund’s Direction of Trade.
The “Origin-Destination Trade and Transport Database” which has detailed country-pair level directional trade volume statistics by modes of transport reported in monetary units and weight (tones). Three datasets form this part of the database. Each of them is sourced differently. The European dataset, from Eurostat, tracks directional volumes of trade (import/export) from EU27 to partner countries in monetary value and weight. Goods transported were recorded by sea and air. In addition to EU27 external trade data, the database also contains country level data for Germany, France, United Kingdom, the Netherlands and Belgium. The United States dataset, from the US Census Bureau, tracks directional volumes of trade (import/export) from the United States to partner countries in monetary value and weight. Goods transported were recorded by sea, air and total. The Japan dataset, from Japan Customs, Ministry of Finance, contains directional trade statistics transported by sea and by air between Japan and partner countries. Historical data dates back to year 2000. The dataset contains monthly data from year 2009 onwards while historical data from year 2000 to 2008 are quarterly data. The unit is in value (Japanese Yen) only.
The Global Trade and Transport Database complements existing databases by adding directional trade data on origin-destination level transported by air and by sea in value and weight tonne. It includes data for all countries worldwide. In addition, there are regions and sub-regions functions which allow users to easily extract aggregated time series data. The database was built in such a way that users can easily “reassign” the regions/sub-regions to suit specific projects.
Thus, this database allows users to examine the relation between international trade and modes of transport on the origin-destination level and the relationship between the values of goods transported and its weight. This database allows users to easily track market trends and performance, identify trade imbalances and market shifts. Updated with the latest available monthly data and seasonally adjusted, it also allows users to identify possible turning points and make short term projections.

Table A1. EU and US exports and imports, current values (’ 000s) and weight, 2005, 2007 and 2010
Source: ITF Global Trade and Transport database.
EU EXPORT
Air Sea Air Sea Air Sea Air Sea Air Sea Air Sea Africa 15,079,957 54,768,180 17,967,398 73,189,694 19,805,550 94,438,546 303,836 57,691,825 419,340 67,769,658 445,474 99,187,688 Asia Pacific 98,969,116 121,587,765 111,950,485 152,511,127 137,637,360 196,012,323 1,101,930 61,303,082 1,428,454 66,342,787 1,704,579 86,761,317 Europe 21,752,446 53,081,875 25,107,469 67,846,764 27,909,238 71,977,809 476,426 51,566,145 452,330 65,682,287 469,995 74,446,533 LATAM 13,949,276 38,133,481 16,580,723 52,501,310 20,970,860 62,352,822 252,199 22,917,037 301,502 29,618,887 366,701 34,007,269 Middle East 31,051,728 43,167,279 29,309,002 55,688,373 31,636,646 60,344,622 380,413 32,609,771 409,656 35,525,055 541,178 39,823,674 North America 109,114,233 142,798,180 114,349,764 150,958,563 114,366,298 139,709,941 1,032,025 95,392,222 1,165,859 85,794,123 986,050 66,130,387 Total 289,916,757 453,536,760 315,264,840 552,695,832 352,325,952 624,836,063 3,546,828 321,480,082 4,177,140 350,732,796 4,513,975 400,356,868 EU IMPORT Africa 10,650,677 72,368,572 11,309,414 90,170,440 10,837,688 97,975,738 296,194 247,401,072 341,709 247,000,322 445,555 211,225,066 Asia Pacific 111,509,156 203,691,560 130,401,485 285,668,369 145,225,554 314,931,029 1,732,481 138,023,640 2,276,768 186,514,749 2,161,463 135,554,648 Europe 12,375,237 128,201,705 13,386,004 168,683,807 13,766,889 182,315,273 369,570 387,690,652 316,985 419,363,520 205,959 407,715,005 LATAM 7,416,162 50,192,007 7,563,460 70,991,592 12,024,204 72,988,691 260,964 189,027,462 242,412 219,163,659 335,387 193,568,251 Middle East 11,069,155 44,166,719 8,286,047 50,033,316 7,718,068 53,004,245 148,612 133,174,048 148,882 119,177,254 84,926 115,607,686 North America 88,660,078 53,539,932 91,819,186 71,389,062 90,815,487 70,953,084 758,648 77,144,486 816,181 89,501,336 737,660 98,563,700 Total 241,680,467 552,160,495 262,765,596 736,936,586 280,387,891 792,168,060 3,566,467 1,172,461,360 4,142,938 1,280,720,840 3,970,950 1,162,234,356
USA EXPORT
Air Sea Air Sea Air Sea Air Sea Air Sea Air Sea Africa 3,278,560 10,445,080 4,584,780 17,405,850 5,357,160 20,557,550 43,730 20,088,140 66,340 30,859,180 68,290 28,990,890 Asia Pacific 119,133,610 102,709,670 142,346,540 138,876,520 157,236,350 181,777,560 1,037,160 139,285,790 1,220,990 155,260,280 1,403,050 213,573,940 Europe 116,566,730 72,530,540 149,595,170 106,714,690 153,149,120 106,048,100 996,730 67,100,180 1,238,920 89,833,210 1,108,340 103,878,760 LATAM 27,135,030 56,860,170 35,605,880 82,910,760 42,216,630 113,624,890 362,890 79,948,640 444,540 101,134,270 481,380 132,452,970 Middle East 12,584,420 14,497,330 16,877,770 23,406,270 16,704,280 26,092,930 101,150 10,371,030 170,580 15,750,960 159,080 14,444,710 North America 14,264,310 4,249,460 16,956,840 5,422,060 17,299,120 6,086,070 193,760 35,452,100 220,070 31,715,380 181,730 26,963,400 EU27 104,073,640 63,244,580 129,002,420 91,410,800 128,802,440 89,080,240 924,040 56,267,990 1,136,980 73,707,570 997,230 81,017,830 Total 292,962,660 261,292,250 365,966,980 374,736,150 391,962,660 454,187,100 2,735,420 352,245,880 3,361,440 424,553,280 3,401,870 520,304,670 USA IMPORT Africa 3,915,480 60,607,930 6,390,510 83,963,230 4,937,450 79,590,090 23,430 146,417,780 29,060 156,927,740 25,730 130,499,410 Asia Pacific 180,668,030 409,615,590 205,711,880 489,624,320 225,965,980 480,438,720 1,971,980 129,888,580 2,098,640 145,522,760 2,073,210 113,998,580 Europe 136,891,970 189,218,280 161,773,080 214,233,130 160,864,950 191,337,480 1,167,150 147,987,660 1,312,820 129,006,820 1,187,020 117,825,900 LATAM 14,686,320 139,347,120 14,394,570 159,510,280 27,032,760 149,605,260 664,800 377,499,940 694,830 338,709,290 615,290 271,261,380 Middle East 14,476,630 46,618,810 17,853,040 57,235,830 16,082,640 57,028,770 65,950 121,541,280 82,020 110,934,660 65,950 93,469,610 North America 8,470,980 13,997,160 9,129,980 19,208,040 9,428,930 20,796,690 68,340 71,803,110 85,150 69,429,730 43,860 56,194,530 EU27 124,228,750 158,776,860 146,803,880 177,853,060 142,269,330 149,188,530 1,079,620 93,364,480 1,214,410 78,212,880 1,054,680 60,876,610 Total 359,109,410 859,404,890 415,253,060 1,023,774,830 444,312,710 978,797,010 3,961,650 995,138,350 4,302,520 950,531,000 4,011,060 783,249,410
2007 2010USD $ Tonne
2005 2007 2010 2005
2007 2010EURO € TONNE
2005 2007 2005
40
Transport O
utlook 2011: Meeting the N
eeds of 9 Billion P
eople – ©O
EC
D/ITF 2011
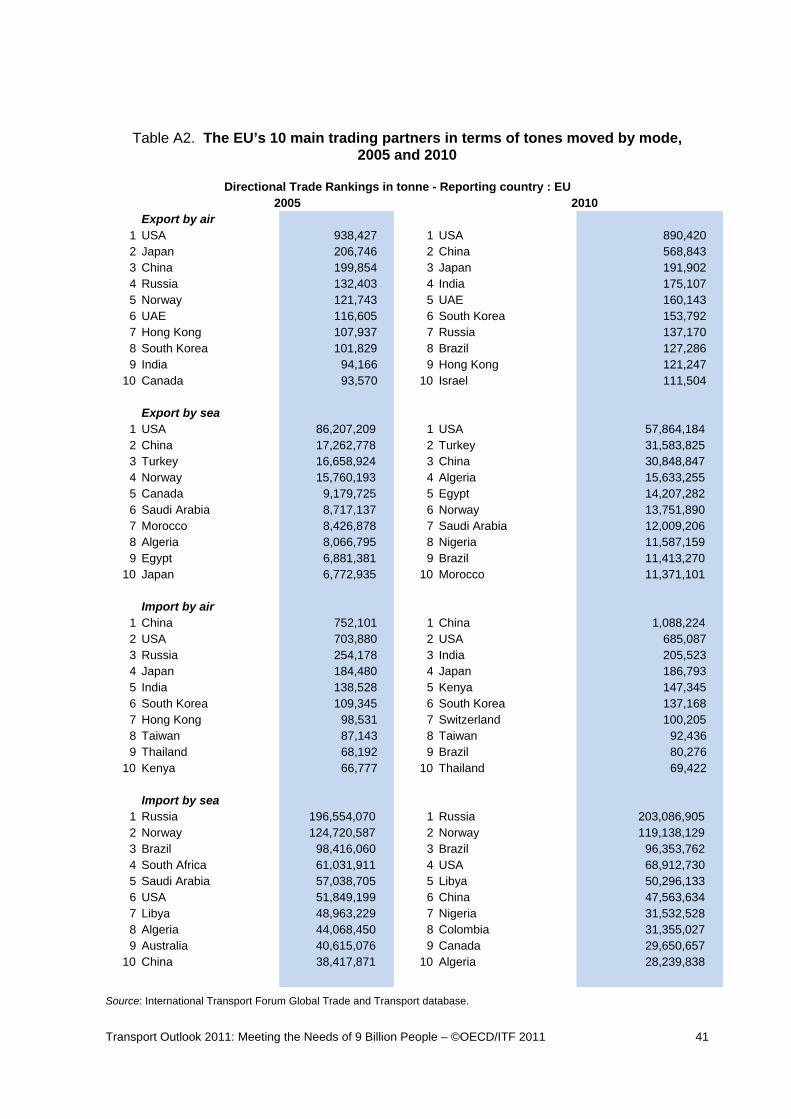
Transport Outlook 2011: Meeting the Needs of 9 Billion People – ©OECD/ITF 2011 41
Table A2. The EU’s 10 main trading partners in terms of tones moved by mode, 2005 and 2010
Source: International Transport Forum Global Trade and Transport database.
Export by air 1 USA 938,427 1 USA 890,420 2 Japan 206,746 2 China 568,843 3 China 199,854 3 Japan 191,902 4 Russia 132,403 4 India 175,107 5 Norway 121,743 5 UAE 160,143 6 UAE 116,605 6 South Korea 153,792 7 Hong Kong 107,937 7 Russia 137,170 8 South Korea 101,829 8 Brazil 127,286 9 India 94,166 9 Hong Kong 121,247
10 Canada 93,570 10 Israel 111,504
Export by sea 1 USA 86,207,209 1 USA 57,864,184 2 China 17,262,778 2 Turkey 31,583,825 3 Turkey 16,658,924 3 China 30,848,847 4 Norway 15,760,193 4 Algeria 15,633,255 5 Canada 9,179,725 5 Egypt 14,207,282 6 Saudi Arabia 8,717,137 6 Norway 13,751,890 7 Morocco 8,426,878 7 Saudi Arabia 12,009,206 8 Algeria 8,066,795 8 Nigeria 11,587,159 9 Egypt 6,881,381 9 Brazil 11,413,270
10 Japan 6,772,935 10 Morocco 11,371,101
Import by air 1 China 752,101 1 China 1,088,224 2 USA 703,880 2 USA 685,087 3 Russia 254,178 3 India 205,523 4 Japan 184,480 4 Japan 186,793 5 India 138,528 5 Kenya 147,345 6 South Korea 109,345 6 South Korea 137,168 7 Hong Kong 98,531 7 Switzerland 100,205 8 Taiwan 87,143 8 Taiwan 92,436 9 Thailand 68,192 9 Brazil 80,276
10 Kenya 66,777 10 Thailand 69,422
Import by sea 1 Russia 196,554,070 1 Russia 203,086,905 2 Norway 124,720,587 2 Norway 119,138,129 3 Brazil 98,416,060 3 Brazil 96,353,762 4 South Africa 61,031,911 4 USA 68,912,730 5 Saudi Arabia 57,038,705 5 Libya 50,296,133 6 USA 51,849,199 6 China 47,563,634 7 Libya 48,963,229 7 Nigeria 31,532,528 8 Algeria 44,068,450 8 Colombia 31,355,027 9 Australia 40,615,076 9 Canada 29,650,657
10 China 38,417,871 10 Algeria 28,239,838
Directional Trade Rankings in tonne - Reporting country : EU2005 2010

42 Transport Outlook 2011: Meeting the Needs of 9 Billion People – ©OECD/ITF 2011
Table A3. The EU’s 10 main trading partners in terms of (thousands of) Euros moved by mode, 2005 and 2010
Source: ITF Global Trade and Transport database.
Export by air 1 USA 100,661,524 1 USA 105,390,526 2 Japan 18,913,593 2 China 31,571,464 3 China 13,767,735 3 Japan 20,673,620 4 UAE 12,796,531 4 Hong Kong 16,181,414 5 Hong Kong 11,424,826 5 India 15,222,939 6 India 11,067,587 6 South Korea 10,954,253 7 Singapore 8,786,012 7 UAE 10,781,815 8 Canada 8,450,146 8 Singapore 10,167,199 9 South Korea 8,264,873 9 Switzerland 9,355,808
10 Switzerland 7,735,997 10 Canada 8,972,583
Export by sea 1 USA 129,596,845 1 USA 123,452,244 2 China 30,763,842 2 China 72,043,421 3 Japan 21,455,446 3 Turkey 26,257,696 4 Turkey 15,717,728 4 Brazil 21,431,685 5 Canada 13,182,854 5 Japan 21,061,181 6 Norway 12,010,086 6 India 17,429,706 7 Australia 11,630,470 7 Canada 16,232,204 8 Mexico 10,676,066 8 Australia 15,969,669 9 Brazil 10,077,069 9 South Korea 15,652,770
10 South Africa 10,036,197 10 Russia 14,586,188
Import by air 1 USA 82,033,427 1 USA 84,365,235 2 China 34,426,950 2 China 58,956,125 3 Japan 17,390,356 3 Japan 18,940,807 4 South Korea 11,966,080 4 South Korea 11,773,553 5 Singapore 11,875,137 5 Singapore 10,930,424 6 Taiwan 7,568,093 6 Taiwan 9,294,876 7 Canada 6,626,183 7 Malaysia 8,815,541 8 Switzerland 6,421,496 8 India 7,977,763 9 Malaysia 5,827,049 9 Switzerland 7,507,441
10 India 5,115,948 10 South Africa 6,560,777
Import by sea 1 China 90,315,266 1 China 171,113,340 2 Russia 52,491,860 2 Russia 80,664,262 3 USA 45,843,462 3 USA 59,622,968 4 Norway 40,836,199 4 Norway 47,345,228 5 Japan 33,816,013 5 Japan 31,335,452 6 Saudi Arabia 18,224,136 6 Brazil 27,405,286 7 Brazil 17,993,872 7 Libya 23,024,093 8 Turkey 16,091,547 8 India 20,776,833 9 Libya 15,712,626 9 Turkey 19,835,220
10 Algeria 13,890,936 10 South Korea 16,805,662
Directional Trade Rankings in Euro - Reporting country : EU2005 2010

Transport Outlook 2011: Meeting the Needs of 9 Billion People – ©OECD/ITF 2011 43
Table A4. The USA’s 10 main trading partners in terms of tonnes moved by mode, 2005 and 2010
Source: ITF Global Trade and Transport database.
Export by air 1 Japan 324,070 1 China 276,530 2 United Kingdom 238,260 2 Japan 258,160 3 Canada 193,760 3 United Kingdom 240,870 4 Germany 175,100 4 Germany 214,280 5 China 122,810 5 Canada 181,730 6 France 108,690 6 South Korea 165,540 7 Netherlands 106,860 7 Hong Kong 145,360 8 South Korea 100,950 8 Brazil 135,940 9 Taiwan 94,190 9 Singapore 127,310
10 Singapore 87,830 10 France 118,860
Export by sea 1 Japan 46,315,920 1 China 73,347,280 2 Canada 35,451,470 2 Japan 47,568,490 3 China 34,119,880 3 Mexico 30,830,420 4 Mexico 21,988,610 4 South Korea 27,102,170 5 South Korea 16,288,370 5 Canada 26,963,400 6 Taiwan 12,430,160 6 Brazil 23,735,400 7 Brazil 9,737,080 7 Netherlands 19,271,820 8 Netherlands 8,618,610 8 Turkey 13,432,120 9 Spain 7,875,610 9 Taiwan 12,655,180
10 Italy 7,723,750 10 India 12,421,180
Import by air 1 China 798,680 1 China 1,105,960 2 Japan 328,660 2 Germany 309,190 3 Germany 289,730 3 Japan 253,220 4 United Kingdom 185,250 4 United Kingdom 172,940 5 Italy 145,780 5 Colombia 142,880 6 Colombia 133,730 6 France 132,780 7 France 129,490 7 Italy 122,200 8 Malaysia 121,300 8 India 113,070 9 Chile 116,650 9 Taiwan 104,650
10 Taiwan 116,300 10 South Korea 93,640
Import by sea 1 Venezuela 107,860,090 1 Mexico 76,140,210 2 Mexico 101,958,730 2 Venezuela 65,557,830 3 Saudi Arabia 76,312,460 3 Canada 56,194,530 4 Canada 71,803,110 4 Saudi Arabia 54,648,270 5 Nigeria 58,555,580 5 China 53,892,260 6 China 57,966,270 6 Nigeria 50,698,420 7 Brazil 35,472,010 7 Russia 39,956,330 8 Colombia 34,310,250 8 Colombia 34,168,260 9 Russia 28,303,770 9 Brazil 28,767,030
10 Trinidad and Tobago 26,505,600 10 Algeria 23,566,800
Directional Trade Rankings in tonne - Reporting country : USA20102005
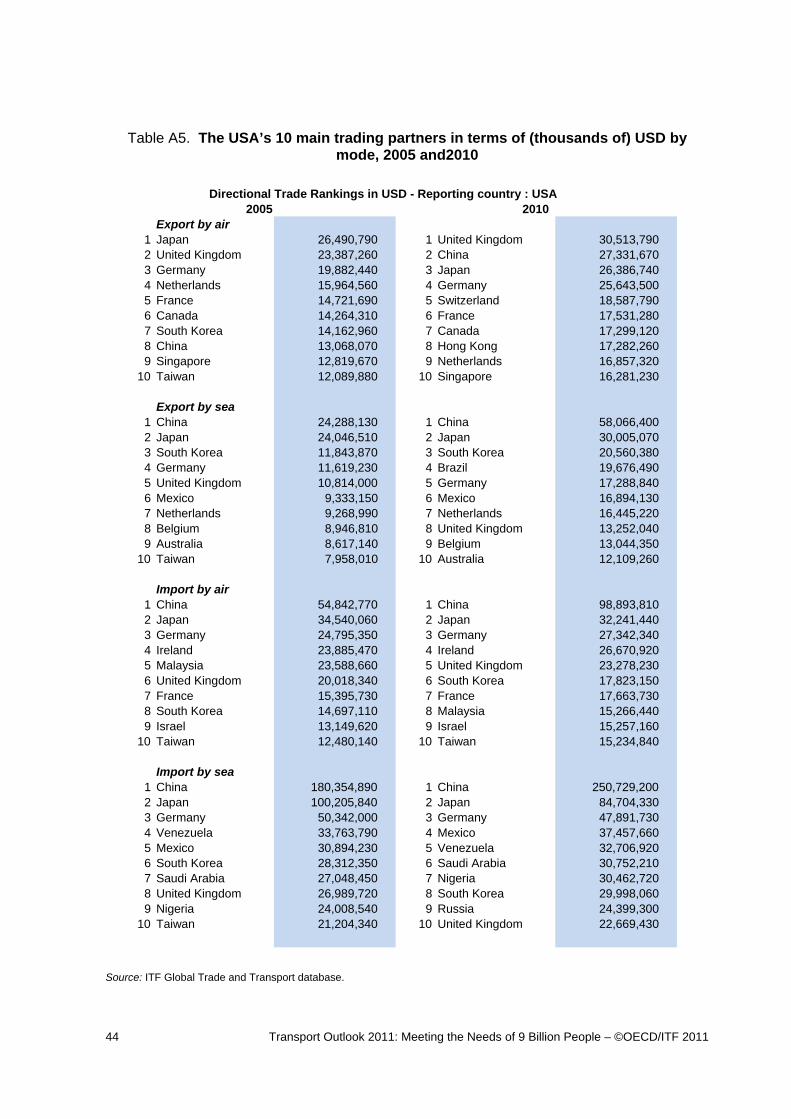
44 Transport Outlook 2011: Meeting the Needs of 9 Billion People – ©OECD/ITF 2011
Table A5. The USA’s 10 main trading partners in terms of (thousands of) USD by mode, 2005 and2010
Source: ITF Global Trade and Transport database.
Export by air 1 Japan 26,490,790 1 United Kingdom 30,513,790 2 United Kingdom 23,387,260 2 China 27,331,670 3 Germany 19,882,440 3 Japan 26,386,740 4 Netherlands 15,964,560 4 Germany 25,643,500 5 France 14,721,690 5 Switzerland 18,587,790 6 Canada 14,264,310 6 France 17,531,280 7 South Korea 14,162,960 7 Canada 17,299,120 8 China 13,068,070 8 Hong Kong 17,282,260 9 Singapore 12,819,670 9 Netherlands 16,857,320
10 Taiwan 12,089,880 10 Singapore 16,281,230
Export by sea1 China 24,288,130 1 China 58,066,400 2 Japan 24,046,510 2 Japan 30,005,070 3 South Korea 11,843,870 3 South Korea 20,560,380 4 Germany 11,619,230 4 Brazil 19,676,490 5 United Kingdom 10,814,000 5 Germany 17,288,840 6 Mexico 9,333,150 6 Mexico 16,894,130 7 Netherlands 9,268,990 7 Netherlands 16,445,220 8 Belgium 8,946,810 8 United Kingdom 13,252,040 9 Australia 8,617,140 9 Belgium 13,044,350
10 Taiwan 7,958,010 10 Australia 12,109,260
Import by air 1 China 54,842,770 1 China 98,893,810 2 Japan 34,540,060 2 Japan 32,241,440 3 Germany 24,795,350 3 Germany 27,342,340 4 Ireland 23,885,470 4 Ireland 26,670,920 5 Malaysia 23,588,660 5 United Kingdom 23,278,230 6 United Kingdom 20,018,340 6 South Korea 17,823,150 7 France 15,395,730 7 France 17,663,730 8 South Korea 14,697,110 8 Malaysia 15,266,440 9 Israel 13,149,620 9 Israel 15,257,160
10 Taiwan 12,480,140 10 Taiwan 15,234,840
Import by sea1 China 180,354,890 1 China 250,729,200 2 Japan 100,205,840 2 Japan 84,704,330 3 Germany 50,342,000 3 Germany 47,891,730 4 Venezuela 33,763,790 4 Mexico 37,457,660 5 Mexico 30,894,230 5 Venezuela 32,706,920 6 South Korea 28,312,350 6 Saudi Arabia 30,752,210 7 Saudi Arabia 27,048,450 7 Nigeria 30,462,720 8 United Kingdom 26,989,720 8 South Korea 29,998,060 9 Nigeria 24,008,540 9 Russia 24,399,300
10 Taiwan 21,204,340 10 United Kingdom 22,669,430
Directional Trade Rankings in USD - Reporting country : USA2005 2010

International Transport Forum2 rue André Pascal 75775 Paris Cedex [email protected]
Transport Outlook Meeting the Needs of 9 Billion People
The world’s population will reach 9 billion by 2050. Meeting their transport demands will be challenging. As both population and incomes rise, global passenger mobility and global freight transport volumes may triple by 2050. The International Transport Forum’s 2011 Outlook examines these trends, exploring the factors that may drive demand even higher and the limits imposed by infrastructure capacity, fuel prices and policies to accommodate or limit potentially expolosive growth of car use in rapidly developing countries.
The Outlook traces scenarios for emissions of CO2 from transport and the impact of policies to improve the fuel economy of conventional vehicles and promote the use of electric cars, including implications for fuel tax revenues. Trends in passenger car traffic are given particular attention, examining evidence for saturation of demand in high income countries.
The report also focuses on future directions for trade, as suggested by trends in the current economic recovery. A global rebalancing in the wake of the financial crisis may already be over, with trade returning to pre-crisis patterns ahead of any longer term restructuring for economic sustainability.