Embed Size (px)
Citation preview

Transport Statistics Great Britain 2014
People travel on average over 6,500 miles per year
Rail passenger journeys have more than doubled since privatisation 1994/95
32.8 million visits to the UK by overseas residents
The UK relies on shipping for about 95% of its imports and exports in terms of tonnage
1.4 million people employed in the GB Transport and Storage sector

Transport Statistics Great Britain 2014
Modal Comparisons
Passenger TransportPassenger kms by mode: Great Britain 1952 to 2013
0
100
200
300
400
500
600
700
800
900
1952 1956 1960 1964 1968 1972 1976 1980 1984 1988 1992 1996 2000 2004 2008 2012
Billi
on p
asse
nger
kilo
met
res
Buses & coaches Rail Cars, vans & taxis• Long-term increase in distance
travelled across most modes - mainly due to increased travel by cars, vans and taxis.
• Rail passenger miles have increased by 51% since 2001.
• Overall distance travelled has slowed in recent years and seen small falls since 2007.
Proportion of distance travelled, Great Britain 1952 and 2013
Further information:Statistical tables on
passenger transport are available from
TSGB0101 to TSGB0102
Personal Travel: 2013
Domestic air flights: Great Britain 1952 to 2013
1952
2013
0.7 million
19.5 million
20131952
Trips by main mode and purpose: England 2013
820 19
53
2722
821
8
1319 20
25
7
12
129
10
11 5
9
18
2921 25
35
20
0%
10%
20%
30%
40%
50%
60%
70%
80%
90%
100%
Walk Car / van Local bus Rail Other transport
Commuting / business Education / escort educationShopping Other escortPersonal business LeisureOther including just walk
How we travelled: England 2013, Mode share of trips:
64% Car or van
2% Other transport
3% Rail
7% Bus
22% Walk 2% Bicycle
Further information:Statistical tables on personal travel are available from: TSGB0103 to TSGB0105.
More detailed information can be found in the National Travel Survey.
Further data are available on Modal comparisons, including:• Passenger transport and personal travel: mode, distance, purpose, casualty rates and
travelling in London during the morning peak: TSGB0101-07• Travelling to work: TSGB0108-12 • Overseas travel: TSGB0113-15• Transport related employment: TSGB0116

Travelling to work in Great Britain: October to December 2013
Further Usual method of travel to work: Great Britain • 68 per cent of
people travel to work by car.
• 1 in 10 people walk to work.
information:
Statistical tables on
travelling to work from the Office
for National Statistics,
Labour Force Survey are available
from: TSGB0108 to
TSGB0112
Average time taken to travel to work: Great Britain
0 10 20 30 40 50 60 70
All modes
Walk
Bicycle
Motorcycle
Car
Bus / coach
Other modes
Rail
Minutes
• The average rail trip to work took one hour.
• The average walk to work took 14 minutes.
Passenger Casualty rates Overseas Travel
Further information:Statistical tables on passenger casualty
rates are available from TSGB0107
Further information and detailed statistical tables: Modal Comparisons statisticsPassenger Transport Labour Force Survey Overseas Travel
Glenn Goodman Glenn Goodman Olivia Christophersen0207 944 2519 0207 944 2519 0207 944 4276
[email protected] [email protected] [email protected]
Fatalities per billion passenger kilometres by mode: 2004 - 2013 average
89 motorcyclists
29 pedestrians
27 pedal cyclists
2 car occupants
1 van occupant
0* bus/coach
0* rail
0* air
* negligible number
0* water
Further information:Statistical tables on overseas travel are available from TSGB0113 to TSGB0115
Air 72%
Sea 14%
Channel Tunnel 14%
32.8 million visits to the UK in 2013 by overseas
residents
Visits to and from the United Kingdom by mode: 2003-2013

Transport Statistics Great Britain 2014
Aviation
Trends in air traffic at UK airports
100
150
200
250
91 93 95 97 99 01 03 05 07 09 11 13
Inde
x: 1
950=
100
Year
Air transport movements Terminal passengers Freight handled• There were 228 million
terminal passengers (arrivals and departures) at UK airports in 2013, an increase of 3.5% compared to 2012.
• This was the highest level since 2008 but still around 5% below the peak in 2007.
Share of air traffic at UK airports: 2013
23%
12%
6%
3%
3%
52%
Heathrow
Gatwick
Stansted
Luton
London City
Non-London(48 airports)
ATMs
32%
16%
8%
4%
1%
39%
Heathrow
Gatwick
Stansted
Luton
London City
Non-London(47 airports)
Passengers
63%
4%
9%
1%
0%
22%
Heathrow
Gatwick
Stansted
Luton
London City
Non-London(38 airports)
Freight (tonnes)
• Heathrow is easily the largest airport in the UK, accounting for twice as many passengers and air transport movements (ATMs) as the next largest airport, Gatwick. East Midlands handles the most air freight after Heathrow.
• Despite capacity constraints, the number of passengers at Heathrow increased by 2 million (3%) in 2013.
• The 5 London airports combined accounted for 48% of ATMs, 61% of passengers and 78% of freight tonnes in 2013.
Further information:Statistical tables on air traffic at UK airports are available from: AVI0101-02
Further data are available on Aviation, including:• Activity at UK airports, including punctuality and passenger characteristics: AVI01• Activity of UK airlines: AVI02• Major airports and airlines worldwide: AVI03• Casualties caused by aviation accidents and air proximity incidents: AVI04

International passenger movements at UK airports: 2013
• In 2013, nearly three-quarters (72%) of international passenger movements at UK airports were to/from other European countries.
• Spain was the most popular country origin/destination for passengers at UK airports, accounting for 17% of international movements, followed by the USA (9%).
Further information:Statistical tables on international passenger movements are available from: AVI0105
Mode of travel to selected UK airports: 2013
• Over half of terminating passengers at Stansted travelled to the airport by public transport in 2013, compared to 41%
30%
38%
43%
51%
58%
29%
10%
14%
17%
26%
41%
52%
43%
32%
16%
Heathrow
Stansted
Gatwick
Luton
Manchester
Car Public transporttaxi/minicab
at Heathrow and 16% at Manchester.
• At Heathrow, a similar proportion of passengers travel by car and taxi.
Further information: Statistical tables on passenger characteristics are available from: AVI0106-08
Olivia ChristophersenFurther information and detailed statistical tables: Aviation statistics
0207 944 [email protected]
0207 944 3088Devi Mylvaganam

Transport Statistics Great Britain 2014
Energy and Environment
UK greenhouse gas emissions: 2012• In 2012, 21% of UK domestic greenhouse
Energy Supply
Transport
Business
Residential
Agriculture Other
35%
15%
13% 10%
6%
21%
575.4 MtCO2e
gas (GHG) emissions were from transport at 118MtCO2e. Total net domestic emissions from all sources was at 575.4 MtCO2e.
• Transport comprises 26% of total GHG emissions when both domestic and international emissions are included.
In 2012, emissions from international aviation have more than doubled since 1990. Air transport movements have increased by 72% over the same period.
Further information:Statistical tables on total greenhouse gas emissions from transport are available from: ENV0201
UK transport greenhouse gas emissions by mode: 2012
• In 2012, road transport was the largest contributor to total transport GHG emissions (68%).
• Cars and taxis contributed the most of any transport mode (40%). Emissions from cars and taxis have declined by 11% since 1990.
*other consists mainly of shipping, rail, buses and coaches and motorcycles/mopeds.
Other: 13%
Vans: 10%
HGV’s: 15%
Aeroplanes: 21%
Cars and Taxi’s: 40% International aviation’s share of transport
emissions
1990 11%
2012 20%
Further information:Statistical tables on greenhouse gas emissions by transport mode are available from ENV0201 and ENV0202
Further data are available on Energy and Environment, including:• Transport energy consumption: ENV0101 - ENV0105• Greenhouse gas emissions from transport: ENV0201 - ENV0202• Local pollution from transport including aircraft noise: ENV0301 - ENV0303

New car fuel consumption, Great BritainAverage new car fuel consumption 2000 2013
0
1
2
3
4
5
6
7
8
9
2000 2001 2002 2003 2004 2005 2006 2007 2008 2009 2010 2011 2012 2013
Petrol cars Diesel cars 30% P23% D
2000 – 2013 change
Litr
es p
er 1
00 k
ilom
etre
s
• There has been a long term decrease in new car fuel consumption due to more fuel efficient cars.
• In 2013, new diesel cars consumed approximately 5 litres of fuel/100km compared to around 6 litres for petrol cars.
Further information:Statistical tables on transport energy consumption are available from ENV0101 - ENV0105Related information can be found in the Digest of UK Energy Statistics (DUKES)
UK air pollution emissionsOn average, most air pollutants have more than halved since 1990 (except particulate matter, which is measured by PM10 (less than 10 micrometres in diameter) and PM2.5 (less than 2.5 micrometres).
Air pollution emissions from transport in the UK 2000 2012
0
20
40
60
80
100
120
2000 2001 2002 2003 2004 2005 2006 2007 2008 2009 2010 2011 2012
Nitrogen oxides PM10 PM2.5
For e
ach
pollu
tant
Inde
x: 1
990
= 10
0
• Sulphur dioxide emissions from transport decreased by 88% between 1990 and 2012.
• This was largely due to the removal of sulphur from fuel.
Further information:Statistical tables on air pollutant emissions from transport are available from: ENV0301
Due to the ban on the sale of leaded petrol in 1999 it accounted for only 3% in 2012.
In 1990 transport made up 76% of total UK lead emissions.
Further information and detailed statistical tables: Energy and Environment statisticsDavita Patel
0207 944 4129Dorothy Anderson
0207 944 [email protected]

Transport Statistics Great Britain 2014
Freight
Domestic freightDomestic freight: goods moved, 2010
0
50
100
150
200
250
300
1990 1992 1994 1996 1998 2000 2002 2004 2006 2008 2010
Billi
on to
nne
kilo
met
res
Road Rail Water Pipeline
Further information:Statistical tables on domestic freight mode are available from TSGB0401
• 22 billion tonne kilometres of domestic freight was moved within GB in 2010
• This is broadly the same level as 1990, though a decrease of 14% from the 2005 peak
Proportion of freight goods moved by mode, 2010
Road 68%
Rail9%
Water19%
Pipeline5%
Road freight activityGB registered vehicles operating in the UK, 2010
60
65
70
75
80
85
90
95
100
105
110
1990 1992 1994 1996 1998 2000 2002 2004 2006 2008 2010
Inde
x (2
006=
100)
Tonne km Tonnes lifted Vehicle km
• Goods moved, 139 billion tonne kilometres (+6% since 1990)
• Goods lifted, 1,489 million tonnes (-9% since 1990)
• Vehicle distance, 18,769 million kilometres (-11% since 1990)
In 2010:
Further information:Statistical tables on domestic and international road freight activity are available from TSGB0404 - TSGB0433
EU-27 registered vehicles operating in the UK: 2010
31.5 million tonnes loaded and unloaded (similar to 2009)
Further information and detailed statistical tables: Road freight statisticsJulie Sullivan
020 7944 [email protected]
Darren Williams020 7944 4261

Road goods vehicles travelling to mainland Europe, 2013
Road goods vehicles
0
500
1,000
1,500
2,000
2,500
3,000
3,500
1990
1992
1994
1996
1998
2000
2002
2004
2006
2008
2010
2012
2013
UK registeredPowered vehicles
Foreign registeredPowered vehicles
Total vehicles
Unaccompanied Trailers
11%
16%
5%
4%
Pre-recession Peak: 2007
Latest 12 month totals percentage change
• In 2013, a total of 2.7 million goods vehicles travelled from GB to mainland Europe (+11% compared to 2012 and -7% on 2007 peak).
• Of these good vehicles, 2 million were powered vehicles (+13% compared to 2012, +181% compared to 1990).
• 0.7 million were unaccompanied trailers (+5% compared to 2012 and +12% since 1990).
Share of total powered vehicles by country of registration
*
2004 2013
Further information:Statistical tables on road goods vehicles travelling to mainland Europe are available from RORO0101 and RORO0201 Total = 1.9 million Total = 2 million
flag size represents proportion of total PVs
RailGoods moved by rail, by commodity, 2013/14
0
5
10
15
20
25
1999/00 2001/02 2003/04 2005/06 2007/08 2009/10 2011/12 2013/14
Billi
on to
nne-
kilo
met
res
Coal Domestic intermodal Other
• In 2013/14, 22.7 billion net tonne kilometres of freight were moved by rail (+5% on 2012/13)
• In 2013/14, coal accounted for 36% of goods moved by rail and domestic intermodal commodities 27%
Weight of goods lifted by rail
154 Mt1980/81
Further information:Statistical tables on rail freight activity are available from TSGB0422, TSGB0423 and TSGB0424
117 Mt2013/14
Further information and detailed statistical tables: Rail freight Roll-on roll-off international freight
Margaret Shaw Behnom Havaei-Ahary0207 944 2419 0207 944 2168

Transport Statistics Great Britain 2014
Maritime
Port freight• In 2013 4 out o
every 5 tonnesof freighthandled byUK ports wereimported orexported.
Million tonnes
272 96 136
Imports ExportsDOMESTIC
UK port freight: 2013503 million tonnes...
Major port total: 491mt
General
Liquid bulk
19795
Ro-Ro
Dry bulk
121
Lo-Lo
57
Million tonnes
Further information: Statistical tables on port freight are available from TSGB0501-TSGB0510
• Major ports handle 98% of total porttraffic.
• Liquid bulk (40%) has been steadilydeclining due to large decreases in crudeoil.
• Dry bulk (25%) has been steadilyincreasing largely due to increases seenin coal.
Shipping fleetTop 10 nations: registered trading vessels
f
- 50 100 150 200 250 300 350
16. United Kingdom( Excl. Crown Dep.)
10. United Kingdom( Inc. Crown Dep.)
9. Bahamas
8. China
7. Greece
6. Malta
5. Singapore
4. Hong Kong
3. Marshall Islands
2. Liberia
1. Panama 20092013
Percentage changeSince 2009
37%
95%
89%
74%
38%
50%
10%
7%
16%
22%
-12%
• In 2013 the top 10 nations held77% of the total deadweighttonnage.
• The UK’s deadweight tonnage,excluding Crown Dependencies,decreased by 12%.
• The UK’s top 10 position reliesheavily on the vessels registered toCrown Dependencies.
Further information: Statistical tableson shipping fleet are available from
TSGB0513 – TSGB0515
Further data are available on Maritime and shipping, including:• Shipping industry revenue and expenditure: TSGB0516• Marine Accidents and injuries: TSGB0517• HM Coastguard search and rescue operations: TSGB0518

Sea Passengers• In 2013, there
were 20.5 millioninternational shortsea passengerjourneys to and fromthe UK...
• ...journeys toand from Franceaccounted for 3 outof every 4 of these.
©Crown Copyright. All rights reserved for Department of Transport 2014. Made with natural earth
Finland
France
Germany
Spain
BelgiumNetherlands
Denmark
NorwaySweden
IrelandNumber of Passengers
(Millions)
Less than 0.005
0.005 – 0.09
0.1 – 0.49
0.5 – 2.99
3.0 – 15.5
No passengers (excluding UK)
Cruise passengers• In 2013, there were over 15 times
more passengers starting or endinga cruise at UK ports than 30 yearspreviously.
Domestic passengers• There were 43.3 million domestic
passengers in 2013, around half were onriver ferries. Number of passengers % of total
(millions)
1983 2013
124 thousand 1,906 thousand
Domestic sea crossings
Inter-Island
River ferries
18.5
21.1
3.6 8%
49%
43%
Seafarers UK Seafarers active at sea, 2013
0
5
10
15
20
25
30
2002 2003 2004 2005 2006 2007 2008 2009 2010 2011 2012 2013
Thou
sand
s
Certified Officers Uncertified Officers Ratings Officer Trainees
Further information: Statistical tables on Seafarers are available from TSGB0519
Further information and detailed statistical tables: MaritimeAmardeep Dhani
0207 944 [email protected]
• The UK has an ageing seafarerpopulation.
• Over 60% of certified officers are over40.
• There are significantly more men thanwomen in both the officer and ratingsprofessions.
Further information: Statistical tables on sea passengers are available from TSGB0511 – TSGB0512
UK officers
7% 93%
Transport Statistics Great Britain 2014
Public Transport
Passenger journeysPassenger journeys in Great Britain
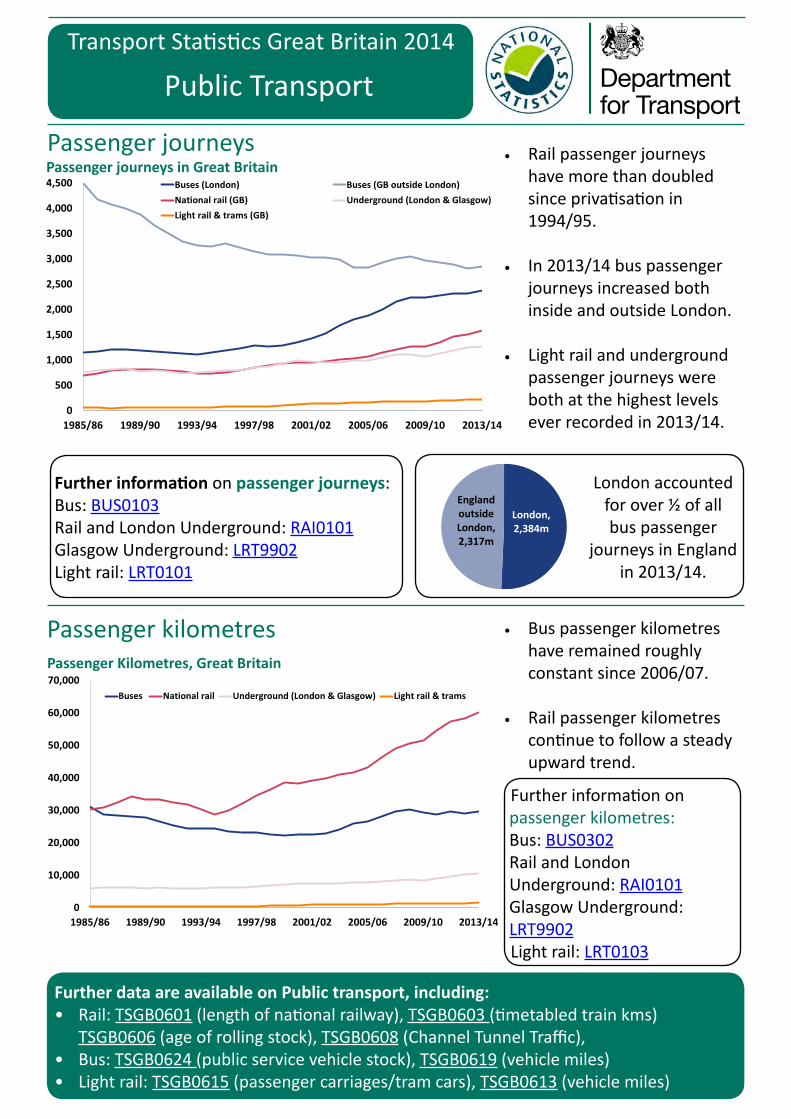
• Rail passenger journeys have more than doubled since privatisation in 1994/95.
• In 2013/14 bus passenger journeys increased both inside and outside London.
• Light rail and underground passenger journeys were both at the highest levels ever recorded in 2013/14.
0
500
1,000
1,500
2,000
2,500
3,000
3,500
4,000
4,500
1985/86 1989/90 1993/94 1997/98 2001/02 2005/06 2009/10 2013/14
Passenger Journeys millio sBuses (London) Buses (GB outside London)National rail (GB) Underground (London & Glasgow)Light rail & trams (GB)
Further information on passenger journeys:Bus: BUS0103Rail and London Underground: RAI0101Glasgow Underground: LRT9902Light rail: LRT0101
London,2,384m
England outside London, 2,317m
London accounted for over ½ of all bus passenger
journeys in England in 2013/14.
Passenger kilometres • Bus passenger kilometres have remained roughly constant since 2006/07.
• Rail passenger kilometres continue to follow a steady upward trend.
Further information on passenger kilometres:Bus: BUS0302 Rail and London Underground: RAI0101 Glasgow Underground: LRT9902 Light rail: LRT0103
0
10,000
20,000
30,000
40,000
50,000
60,000
70,000
1985/86 1989/90 1993/94 1997/98 2001/02 2005/06 2009/10 2013/14
Buses National rail Underground (London & Glasgow) Light rail & trams
Passenger Kilometres, Great Britain
Further data are available on Public transport, including:• Rail: TSGB0601 (length of national railway), TSGB0603 (timetabled train kms)
TSGB0606 (age of rolling stock), TSGB0608 (Channel Tunnel Traffic), • Bus: TSGB0624 (public service vehicle stock), TSGB0619 (vehicle miles)• Light rail: TSGB0615 (passenger carriages/tram cars), TSGB0613 (vehicle miles)

Buses 63%
National Rail19%
Underground (London & Glasgow)
15%
Light rail & trams
3%
Passenger journeys(8.3 Billion) GB 2013/14
Buses account for the majority
of passenger journeys but rail accounts
for the majority of passenger kilometres.
Buses 29%
National Rail59%
Underground (London & Glasgow)
10%
Light rail & trams
1%
Passenger kilometres(102 Billion) GB 2013/14
Revenue and government support
0123456789
2004/05 2006/07 2008/09 2010/11 2012/13
£ Bi
llion
Bus (England)
Net Government support
Passenger fare receipts
0123456789
2004/05 2006/07 2008/09 2010/11 2012/13
£ Bi
llion
Rail (Great Britain)
Total Government support
Total franchised passenger revenue
Rail fares continue to increase at a rate
greater than the cost of living (RPI) but bus and coach
fares by less • Since 2009/10 bus revenue from fares and government support have been diverging, with government support falling and revenue from fares increasing. For rail, since 2010/11 both government support and passenger revenue have increased.
Further information: Statistical tables on passenger revenue and government support are available from BUS05, TSGB1308 and RAI03.
Further data available on public transport:Peak overcrowding in London: 3.1% of standard class rail passengers were in excess of the capacity on their train service, a level that has remained fairly constant over the last decade.
There were 9.7 million concessionary travel pass holders in England, making an average of 104 trips a year in 2013/14.
4.1 taxis and private hire vehicles per 1000 people in England and Wales.
Further information: tables on concessionary travel, peak overcrowding and taxis and private hire vehicles are available from BUS0821, RAI0210 and TAXI01 respectively
Further information and detailed statistical tables: Public transport
Darren Stillwell0207 944 4746
Margaret Shaw0207 944 2419
Rail Buses, Light Rail & Taxis
Transport Statistics Great Britain 2014
Roads and Traffic
Road traffic: Trends in motor vehicle trafficYear-on-year change in motor vehicle traffic, Great Britain
-4
-2
0
2
4
6
8
10
12
14
16
18
1950 1955 1960 1965 1970 1975 1980 1985 1990 1995 2000 2005 2010
Year
-on-
year
cha
nge
(%)
High growth in car ownership
Suez crisis
OPEC oil embargo
Strong economic growth
Early 1990s recession Fuel
protests
Fuel price spike and recent economic downturn
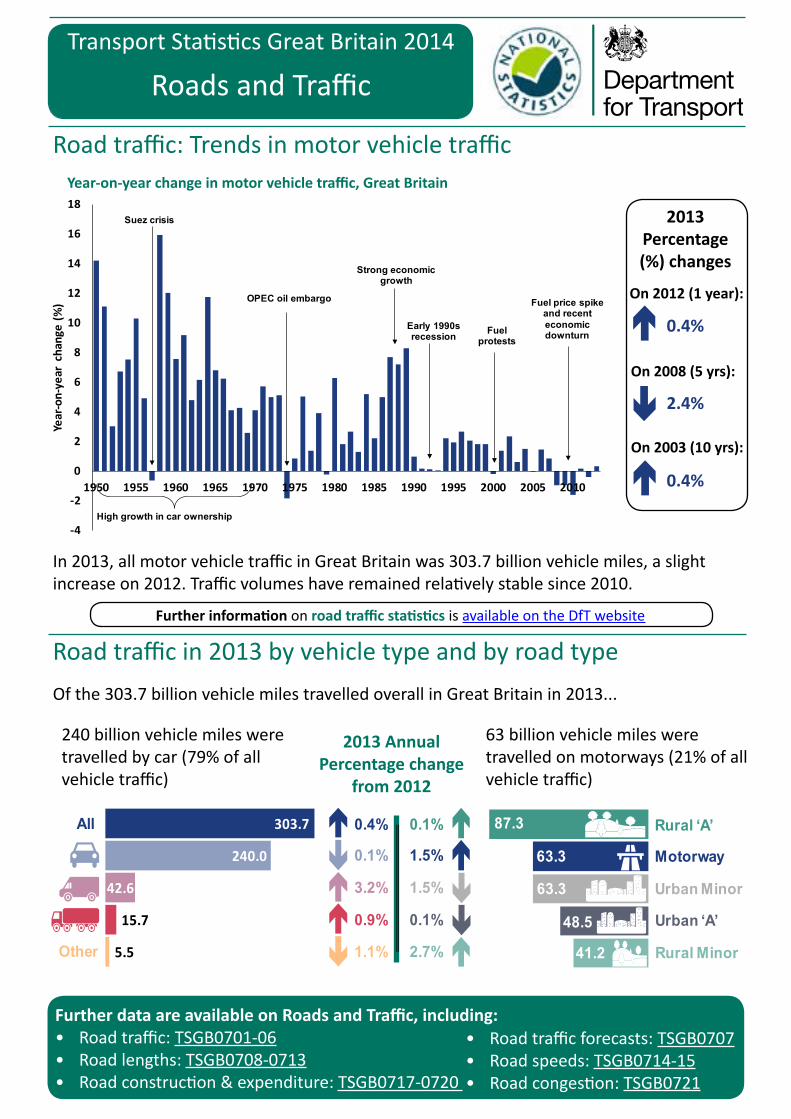
In 2013, all motor vehicle traffic in Great Britain was 303.7 billion vehicle miles, a slight increase on 2012. Traffic volumes have remained relatively stable since 2010.
2013 Percentage (%) changes
On 2012 (1 year):
0.4%
On 2008 (5 yrs):
2.4%
On 2003 (10 yrs):
0.4%
Further information on road traffic statistics is available on the DfT website
Road traffic in 2013 by vehicle type and by road typeOf the 303.7 billion vehicle miles travelled overall in Great Britain in 2013...
240 billion vehicle miles were travelled by car (79% of all vehicle traffic)
63 billion vehicle miles were travelled on motorways (21% of all vehicle traffic)
2013 Annual Percentage change
from 2012
5.5
15.7
42.6
240.0
303.7All
Other
Motorway
Urban Minor
Urban ‘A’
Rural Minor
Rural ‘A’0.4%
0.1%
3.2%
0.9%
1.1%
0.1%
1.5%
1.5%
0.1%
2.7%
87.3
63.3
63.3
48.5
41.2
Further data are available on Roads and Traffic, including:• Road traffic: TSGB0701-06 • Road traffic forecasts: TSGB0707• Road lengths: TSGB0708-0713 • Road speeds: TSGB0714-15• Road construction & expenditure: TSGB0717-0720 • Road congestion: TSGB0721
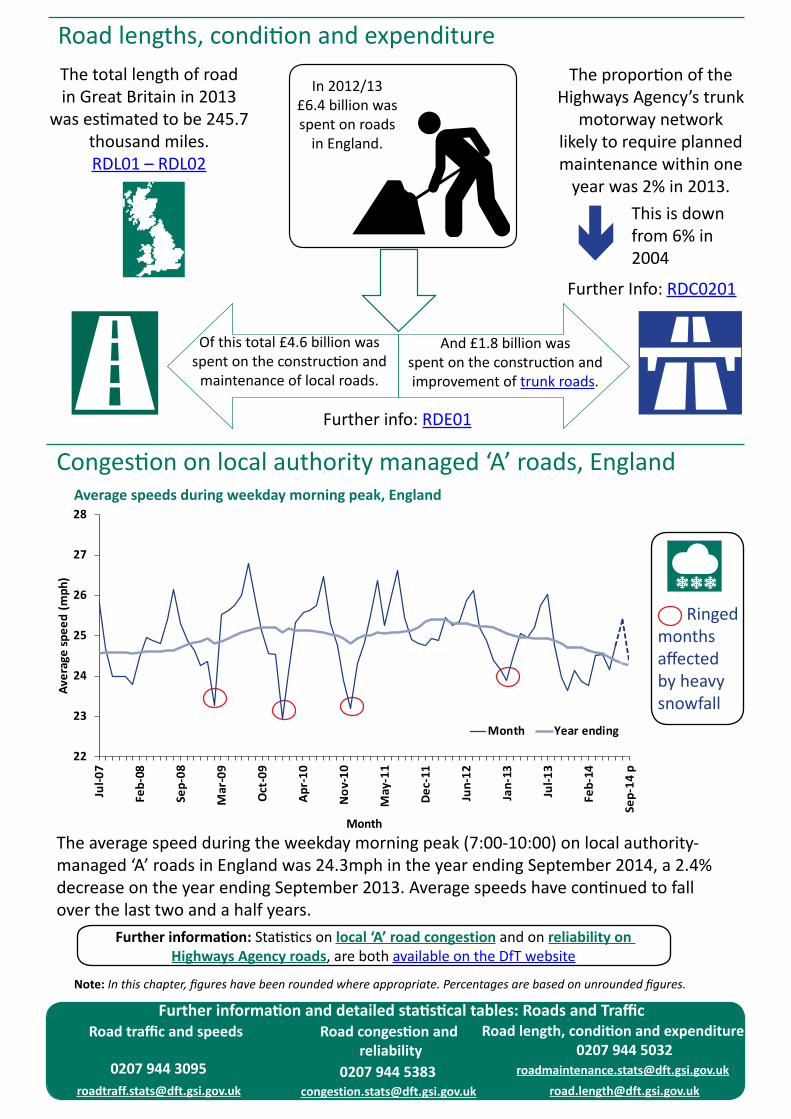
Road lengths, condition and expenditureThe total length of road in Great Britain in 2013
was estimated to be 245.7 thousand miles.RDL01 – RDL02
In 2012/13 £6.4 billion was spent on roads
in England.
Of this total £4.6 billion was spent on the construction and
maintenance of local roads.
And £1.8 billion was spent on the construction and improvement of trunk roads.
Further info: RDE01
The proportion of the Highways Agency’s trunk
motorway network likely to require planned maintenance within one
year was 2% in 2013. This is down from 6% in 2004
Further Info: RDC0201
Congestion on local authority managed ‘A’ roads, EnglandAverage speeds during weekday morning peak, England
22
23
24
25
26
27
28
Jul-0
7
Feb-
08
Sep-
08
Mar
-09
Oct
-09
Apr-
10
Nov
-10
May
-11
Dec-
11
Jun-
12
Jan-
13
Jul-1
3
Feb-
14
Sep-
14 p
Aver
age
spee
d (m
ph)
Month
Month Year ending
Ringed months affected by heavy snowfall
The average speed during the weekday morning peak (7:00-10:00) on local authority-managed ‘A’ roads in England was 24.3mph in the year ending September 2014, a 2.4% decrease on the year ending September 2013. Average speeds have continued to fall over the last two and a half years.
Further information: Statistics on local ‘A’ road congestion and on reliability on Highways Agency roads, are both available on the DfT website
Further information and detailed statistical tables: Roads and TrafficRoad traffic and speeds Road congestion and Road length, condition and expenditure
reliability 0207 944 50320207 944 3095 0207 944 5383 [email protected]
[email protected] [email protected] [email protected]
Note: In this chapter, figures have been rounded where appropriate. Percentages are based on unrounded figures.
Transport Statistics Great Britain 2014
Accidents and Casualties
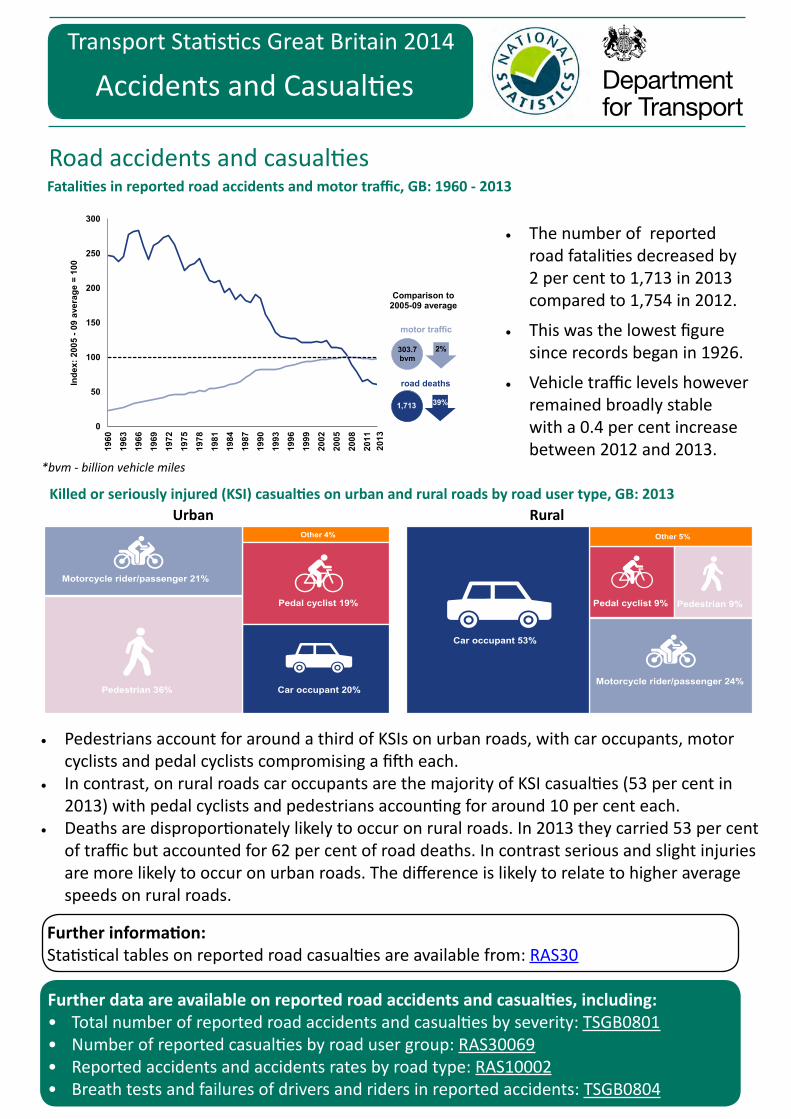
Road accidents and casualtiesFatalities in reported road accidents and motor traffic, GB: 1960 - 2013
0
50
100
150
200
250
300
1960
1963
1966
1969
1972
1975
1978
1981
1984
1987
1990
1993
1996
1999
2002
2005
2008
2011
Inde
x: 2
005
-09
aver
age
= 10
0
Comparison to 2005-09 average
2%
39%
motor traffic
road deaths
303.7 bvm
1,713
2013
• The number of reported road fatalities decreased by 2 per cent to 1,713 in 2013 compared to 1,754 in 2012.
• This was the lowest figure since records began in 1926.
• Vehicle traffic levels however remained broadly stable with a 0.4 per cent increase between 2012 and 2013.
Killed or seriously injured (KSI) casualties on urban and rural roads by road user type, GB: 2013
*bvm - billion vehicle miles
Urban Rural
Motorcycle rider/passenger 21%
Pedestrian 36% Car occupant 20%
Pedal cyclist 19%
Other 4%
Car occupant 53%
Motorcycle rider/passenger 24%
Pedal cyclist 9% Pedestrian 9%
Other 5%
• Pedestrians account for around a third of KSIs on urban roads, with car occupants, motor cyclists and pedal cyclists compromising a fifth each.
• In contrast, on rural roads car occupants are the majority of KSI casualties (53 per cent in 2013) with pedal cyclists and pedestrians accounting for around 10 per cent each.
• Deaths are disproportionately likely to occur on rural roads. In 2013 they carried 53 per cent of traffic but accounted for 62 per cent of road deaths. In contrast serious and slight injuries are more likely to occur on urban roads. The difference is likely to relate to higher average speeds on rural roads.
Further information:Statistical tables on reported road casualties are available from: RAS30
Further data are available on reported road accidents and casualties, including:• Total number of reported road accidents and casualties by severity: TSGB0801• Number of reported casualties by road user group: RAS30069• Reported accidents and accidents rates by road type: RAS10002• Breath tests and failures of drivers and riders in reported accidents: TSGB0804

Rail accidents and casualties
• There were 315 fatalities in 2013/14 on the national rail network, the majority of which were suicides (89 per cent).
• Trespassers accounted for 7 per cent and fatalities at level crossings accounted for 3 per cent.
• Since 2005/06, only one passenger has been killed in a train accident.
Suicides89%
Trespassers7%
Level crossings
3%
Other2%
315 fatalitiesin 2013/14
Fatalities and casualties (excluding suicides*)
020406080
100120140160
2003/04 2005/06 2007/08 2009/10 2011/12 2013/14
Inde
x: 2
003/
04 =
100
Fata ities and casua ties (excluding Fatalities Fatalities and major injuries
All casualties passenger kilometres
*suicides are classed as non-accidental harm therefore they are not included
Signals passed at danger (SPADs)
• The number of signals passed at danger has fallen gradually over the last decade, from 374 reported incidents in 2003/04 to 298 in 2013/14.
• The largest falls have been in the most serious cases, with the number of cases where a SPAD could potentially have led to a severe accident falling by 63% in the last 10 years.
Potentially severe
12%
Potentially significant
31%No
significant risk56%
Unclassified1%
Signals passed at danger: 2003/04 (Total 374)
Potentially severe
5%
Potentially significant
26%No
significant risk65%
Unclassified4%
Signals passed at danger: 2013/14 (Total 298)
Further information:Statistical tables on rail accidents and safety are available from RAI05Further statistics are published by the Rail Safety and Standards Board
0207 944 [email protected]
Road accidents and casualtiesFurther information and detailed statistical tables: Transport accidents and casualties
Margaret Shaw0207 944 2419
Rail accidents and safetyWilmah Deda

Transport Statistics Great Britain 2014
Vehicles
Licensed VehiclesLicensed vehicles in Great Britain 1950 - 2013
4 million
31 million
recession
recession
• The number of licensed vehicles in Great Britain has increased in every year since 1950, except for 1991.
• 2013 saw the largest annual increase (1.6%) since 2007.
• At the end of 2013, there were 35.2 million licensed vehicles, of which 29.1 were cars.
New registrationsVehicles registered for the first time, GB 1951 - 2013
Cars83.2%
Vans9.6%
HGVs1.3%
Motorcycles3.5%
Other2.0%
Buses & coaches0.4%
11.6%
2.4%
Change last year
• The largest number of new registrations in a single year was 3.2 million, in 2003.
Further information:Statistical tables on vehicle licensing are available from
TSGB0901 to TGSB0907Many more vehicle licensingstatistics can be found in the
Vehicles statistics series
Further data are available on Vehicles, including:• Licensed vehicles, by tax class, body type, engine type and region: TSGB0901-07• MoT and other roadworthiness testing statistics: TSGB0908-12• Personal motoring: Household car availability, driving licence holding, driving tests and
annual mileages: TSGB0913-17

MOT tests conducted: 28 million
Final pass rate: 71%
MOT tests in 2013/14 Further information:Statistical tables on road worthiness tests: TSGB0908 to TSGB0912 . Other experimental statistics derived from MOT data are available from: Vehicles statistics
Private motoring
• The proportion of the population aged 17+ holding a full driving licence rose from 48% in 1975/6 to 73% in 2013.
• In 2013, 80% of men and 66% of women held a licence.
Licence holding by age and gender
0
10
20
30
40
50
60
70
80
90
100
17-20
21-29
30-39
40-49
50-59
60-69
70+ 17-20
21-29
30-39
40-49
50-59
60-69
70+
Perc
enta
geho
ldin
g a
licen
ce1975/76 2013
Share of drivers:In 1975/76
In 2013
Men Women
1909
Vehicles per 100 persons:
2013 56
0.4
81950
Households with access to a car or van:
No car / van86%
One car / van13%
Two or more cars / vans1%
No car / van25%
One car / van43%
Two or more cars/vans
32%
• The proportion of households with access to a car or van rose from 14% in 1951 to 75% in 2013.
• There are more households with access to 2 or more cars than without any access at all.
Driving tests in 2013/14Practical car tests taken: 1.4 million
Pass rate: 47%
1951 2013
Women31%
Women47%
Men53%
Men69%
Further information:Statistical tables on private motoring: TSGB0913 to TSGB0917 . More related statistics available from: National Travel Survey and Driving Test and Instructor Statistics.
Further information and detailed statistical tables: Vehicles statisticsVehicle licensing MOT & driving tests National Travel Survey
Mike Dark Rachel Moyce Glenn Goodman0207 944 6386 0207 944 4139 0207 944 2519
Transport Statistics Great Britain 2014
Walking and Cycling
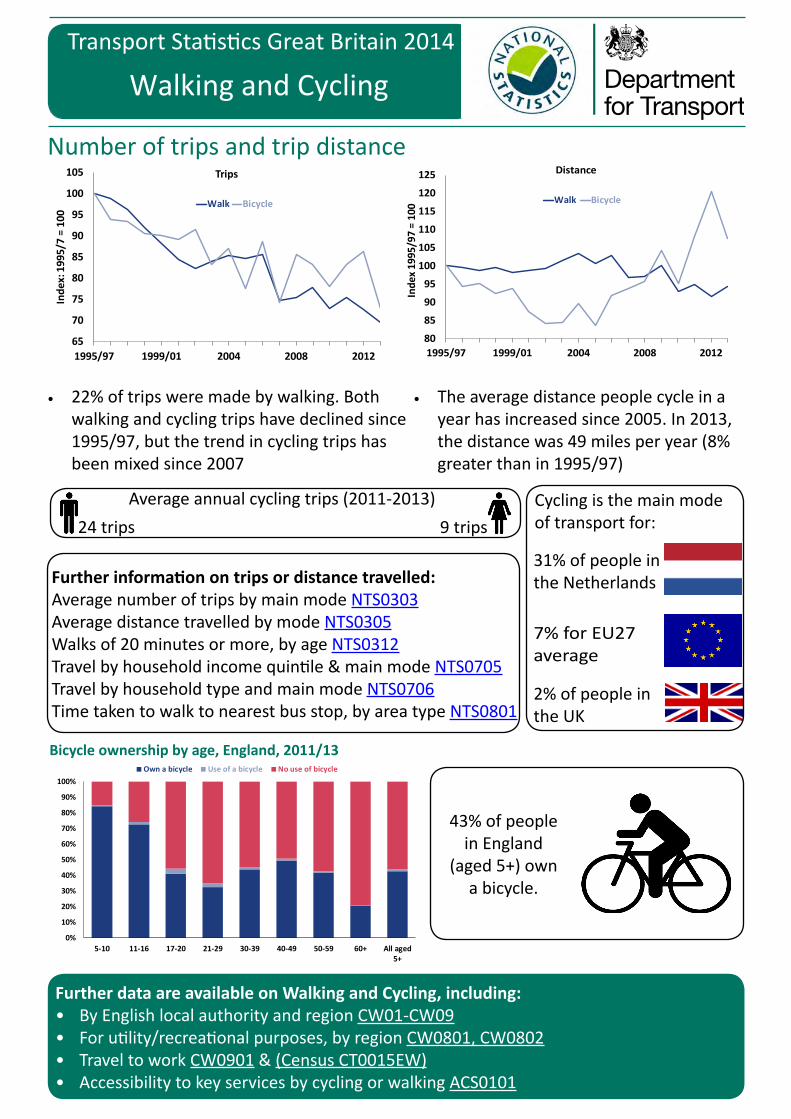
Number of trips and trip distance
65
70
75
80
85
90
95
100
105
1995/97 1999/01 2004 2008 2012
Inde
x: 1
995/
7 =
100
Trips
Walk Bicycle
80
85
90
95
100
105
110
115
120
125
1995/97 1999/01 2004 2008 2012
Inde
x 19
95/9
7 =
100
Distance
Walk Bicycle
• 22% of trips were made by walking. Bothwalking and cycling trips have declined since1995/97, but the trend in cycling trips hasbeen mixed since 2007
• The average distance people cycle in ayear has increased since 2005. In 2013,the distance was 49 miles per year (8%greater than in 1995/97)
24 trips
Further information on trips or distance travelled: Average number of trips by main mode NTS0303Average distance travelled by mode NTS0305Walks of 20 minutes or more, by age NTS0312Travel by household income quintile & main mode NTS0705Travel by household type and main mode NTS0706Time taken to walk to nearest bus stop, by area type NTS0801
Average annual cycling trips (2011-2013) 9 trips
Cycling is the main mode of transport for:
31% of people in the Netherlands
7% for EU27 average
2% of people in the UK
Bicycle ownership by age, England, 2011/13
0%
10%
20%
30%
40%
50%
60%
70%
80%
90%
100%
5-10 11-16 17-20 21-29 30-39 40-49 50-59 60+ All aged5+
B l n hi b : E d 2011 13Own a bicycle Use of a bicycle No use of bicycle
43% of people in England
(aged 5+) own a bicycle.
Further data are available on Walking and Cycling, including:• By English local authority and region CW01-CW09• For utility/recreational purposes, by region CW0801, CW0802• Travel to work CW0901 & (Census CT0015EW)• Accessibility to key services by cycling or walking ACS0101

Percentage of adults cycling at least once per week in 2012/13• England average 10% Outside London:• Cambridge, 49% • Oxford, 34%• 5 LAs, more than 20%• 14 LAs, fewer than 5%London:• Highest: Richmond, 21%• Lowest: Bexley, 3%
0
10
20
30
40
50
60
70
80
90
100
London SouthEast
SouthWest
East ofEngland
Yorkshire&
Humber
EastMidlands
WestMidlands
NorthWest
NorthEast
ENGLAND
% walking or cycling at least once per month: England (2012/13)
Any cycle Walk at least 10 mins
• Walking is the main mode of transport to school.
• Walking decreases for secondary pupils, as the use of buses increases.
• Cycling hardly changes.• 2% aged 16-74 cycle to work.
Transport to school/work
Road accidents
2013
Walk 46%
Bicycle1%
Car / Van46%
Other (including
buses)7%
Ages 5-10 years
Walk37%
Bicycle2%
Car / Van23%
Other (including
buses)38%
Ages 11-16 years
Reported killed or seriously injured casualties (KSI): Great Britain• Numbers of cyclists
KSI declined steadily from the mid 1980s, but have increased slightly in recent years. In 2013, the number of pedestrians KSI was at a record low.
• The UK had 6.7 pedestrian deaths per million population in 2012 (ranks 9th in OECD)
0
5,000
10,000
15,000
20,000
25,000
1979 1981 1983 1985 1987 1989 1991 1993 1995 1997 1999 2001 2003 2005 2007 2009 2011 2013
KSI c
asua
lties
Pedestrians Pedal cyclists
Further information on road safety:Vehicle accident numbers and rates by severity, GB 2002-2013 RAS20001Tables on reported road casualties RAS30Emergency admissions for falls in the street, England 2011 RAS55016Perceived danger cycling on roads, GB 2011-12 ATT0322International comparisons of road deaths RAS52001
John Cummings0207 944 6104
Further information and detailed statistical tables: Walking and Cycling

Transport Statistics Great Britain 2014
Transport and Disability
Travel by people with mobility difficulties
• Overall 9% of adults in England reported having a mobility difficulty* in 2013; this proportion was much higher for older people (31% for 70+ year olds)
• Those reporting mobility difficulties make fewer trips on average, across all age groups. This is largely due to fewer trips as a car/van driver or by walking
• People with mobility difficulties make fewer commuting, education or leisure trips on average, partly reflecting the age profile
0
200
400
600
800
1000
1200
16-49 50-59 60-69 70+ All aged 16+
With a mobility difficulty
No mobility difficulty
Trips per person per year by mobility status, and age: England, 2013
223
169
85
4323
7 121
495
145
197
66
937
17 110
100
200
300
400
500
Car/vandriver
Car/vanpassenger
Walk Bus Taxi Rail Bicycle Other
With a mobility difficulty
No mobility difficulty
Trips per person per year by mobility status and main mode: England, 2013
0
5
10
15
20
25
30
2005 2006 2007 2008 2009 2010 2011 2012
Percentage of disabled people experiencing difficulties in using public transport by year [ONS Opinions and Lifestyle Survey]
• The proportion of disabled people experiencing difficulties using public transport has been falling but increased in 2012 (Office for Disability Issues indicator)
Further information on travel by people with mobility difficulties can be found in the National Travel Survey
* The National Travel Survey definition of mobility difficulty is based on adults who say they have difficulties travelling on foot, by bus or both
Further data are available on Transport and Disability:• Travel by people with mobility difficulties (National Travel Survey): NTS0622, NTS0709-
10• Office for Disability Issues: Disability Equality Indicators• Disabled parking badges, England: DIS0101 (number) and DIS0102 (per head)• Disability accessible buses and taxis: BUS0603 (buses) and TAXI0102 (taxis)• List of rail vehicles built or refurbished to modern accessibility standards• Disabled concessionary bus passes issued, England: BUS0820

Disabled parking badges • An estimated 2.6 million valid blue badges (parking badges for disabled
people) were held by people in England at end March 2013.
• This is broadly the same as in the previous year, but 2.1% below the 2011 peak.
• 5% of the English population held a valid Blue Badge.
0
500
1000
1500
2000
2500
3000
1997 1999 2001 2003 2005 2007 2009 2011 2013
Held by organisationsSubject to further assessmentNo further assessment
Break in series 2009 due to change in methodology
Blue badges held: England, annually from 1997• There were 1.3 million
vehicles in the disabled tax class at end 2013 (email [email protected]) for further details.
Further information can be found in the Disabled Parking Badges Statistics tables DIS0101 (number of badges) and DIS0102 (badges per head)
Public transport: accessibility to disabled people% fully accessible vehicles
83% Mar 2014 28% Mar 2005 Table BUS0603
58% Mar 201354% Mar 2005Table TAXI0102
53% Nov 201431% Dec [email protected]
0%
20%
40%
60%
80%
2004/05 2013/14
% Accessible buses: Great Britain
0%
20%
40%
60%
80%
2005 2009 2013
% Accessible taxis: England and Wales
0%
20%
40%
60%
80%
2005
2006
2007
2008
Dec
2010
Jan
2011
Jan
2012
Jan
2012
Dec
2013
Nov
2014
Nov
% Accessible rail vehicles: Great Britain
No data available
• 882 thousand disabled concessionary bus passes in England in
Further informationConcessionary travel bus passes BUS0820 Disabled Transport notes and definitions
Glenn Goodman0207 944 3097
National Travel SurveyMatthew Tranter
0207 944 [email protected]
Disabled parking badgesFurther information and detailed statistical tables: TSGB Transport and Disability
Darren Stillwell0207 944 3094
Buses, taxis and concessionary travel

Transport Statistics Great Britain 2014
Transport Expenditure
UK public sector expenditure on transportUK public expenditure on transport
£7.3 billion in 1989/90
2009/10 peak at £23 billion
£20.2billion in 2013/14
£0bn
£5bn
£10bn
£15bn
£20bn
£25bn
1989-90 1993-94 1997-98 2001-02 2005-06 2009-10 2013-14
2013/14 prices CurrentThe peak in expenditure on transport was
£23 billion in 2009/10, three times the £7.3 billion in 1989/90.
In 2013/14, prices expenditure
nearly doubled from 1989/90 - 2009/10.
Public sector expenditure on transport by function
National Roads15%
Local Roads26%
Local Public Transport
17%
Railways34%
Other Transport
8%
Total public expenditure on
transport in 2013/2014 was at
£20.2 billion.
Railway spending was the highest around £7 billion, accounting for 34% of total public expenditure on transport.
The second highest contributor to public expenditure was local roads at £5 billion.
Further information:Statistical tables on public sector expenditure on transport are available from:TSGB1301 to TSGB1305
Further data are available on Transport expenditure, including:• Transport expenditure and costs: Public expenditure by mode & area TSGB1301-
TSGB1305• Household expenditure on transport: TSGB1306• Retail and consumer prices: transport indices & deflators: TSGB1307-TSGB1309• Government revenue from vehicle taxes: TSGB1310

The cost of transport and living
Rail and bus fares have increased faster than the cost of living (RPI).
Further information:
Statistical tables on
the costs of living and
the costs of Transport
are available from:
TSGB1307 to TSGB1308
Government revenues: Vehicle excise and fuel duty
Further information:Statistical tables on Government
revenues from vehicle and excise duty
are available from: TSGB1310
Fuel duty revenue has tripled since 1987, generating £26.7bn in 2013 alone.
This was 1% lower than the high of £27 billion in 2010.
Vehicle excise duty generated £6.1bn in 2013.This was more than twice as high as in 1987.
`Dorothy Anderson0207 944 4442
Government revenueFurther information and detailed statistical tables: Transport Expenditure
Total cost of motoring has risen around the same as the cost of living (RPI).
0
10
20
30
1987 1992 1997 2002 2007 2012
£ Bi
llion
Duty on hydrocarbon oils
Vehicle Excise Duty
Retail Price Index, transport components: 1987 - 2013
Duty on hydrocarbon oils and Vehicle excise duty: 1987 - 2013
0
50
100
150
200
250
300
350
400
1987 1989 1991 1993 1995 1997 1999 2001 2003 2005 2007 2009 2011 2013
Inde
x 19
87=1
00
Rail fares Bus & Coach fares All items Retail Prices Index All motoring