Embed Size (px)
Citation preview
iSto
ckph
oto/
back
hand
ing
Investing in energy and resource efficiencyTransport
376
Towards a green economy
Chapter Coordinating Authors: Holger Dalkmann and Ko
Sakamoto, Transport Research Laboratory, UK.
Fatma Ben Fadhl of UNEP managed the chapter, including the
handling of peer reviews, interacting with the coordinating
authors on revisions, conducting supplementary research and
bringing the chapter to final production.
The chapter benefited from research conducted by the following
experts: Dario Hidalgo, Aileen Carrigan, Prajna Rao, Madhav Pai
and Clayton Lane (Embarq – the WRI Center for Sustainable
Transport); Andrea M. Bassi, John P. Ansah and Zhuohua Tan
(Millennium Institute); Yoshitsugu Hayashi (Nagoya University);
Juan Carlos Dextre Quijandria and Felix Israel Cabrera Vega
(Pontificia Universidad Catolica del Peru); Sanjivi Sundar, Chhavi
Dhingra, Divya Sharma and Akshima Ghate (The Energy and
Resources Institute); Anne Binsted, Kate Avery, Catherine Ferris
and Ellie Gould (Transport Research Laboratory); Marianne
Vanderschuren and Tanya Lane (University of Cape Town); and
Ana Lucía Iturriza (ILO).
The coordinating authors would like to acknowledge the extensive work of the contributing authors, all of whom devoted a significant amount of time and effort in compiling the background papers. Much of their contributions were generously made in kind to make this work possible.
During the development of the chapter, the authors received advisory support from Rob De Jong and contributions from Elisa Dumitrescu, Kamala Ernest, Patricia Kim and Martina Otto from the United Nations Environment Programme.
We would also like to thank the peer reviewers (in their personal capacity) of the chapter consisting of Brinda Wachs and Romain Hubert (United Nations Economic Commission for Europe), ATM Nurul Amin (North South University, Bangladesh), Carmen Polo (consultant), Hernan Blanco (Research and Resources for Sustainable Development), Ian Parry (IMF), Justin Perrettson (Novozyme), and Arvid Strand (Oslo Transportøkonomisk institutt). A special thank also goes to Yuki Tanaka Iwao Matsuoka (Institution for Transport Policy Studies) as well as Lew Fulton and François Cuenot (International Energy Agency) for their role in facilitating access to data.
Acknowledgements
Copyright © United Nations Environment Programme, 2011Version -- 02.11.2011
377
Transport
ContentsList of acronyms 379
Key messages 380
1 Introduction 382
2 Challenges and opportunities in the transport sector 3832.1 Challenges . . . . . . . . . . . . . . . . . . . . . . . . . . . . . . . . . . . . . . . . . . . . . . . . . . . . . . . . . . . . . . . . . . . . . . . . . . . . . . . . . . . 3832.2 Opportunities . . . . . . . . . . . . . . . . . . . . . . . . . . . . . . . . . . . . . . . . . . . . . . . . . . . . . . . . . . . . . . . . . . . . . . . . . . . . . . . . 387
3 Transport in a green economy 3893.1 Supporting green growth . . . . . . . . . . . . . . . . . . . . . . . . . . . . . . . . . . . . . . . . . . . . . . . . . . . . . . . . . . . . . . . . . . . . 3893.2 Creating jobs. . . . . . . . . . . . . . . . . . . . . . . . . . . . . . . . . . . . . . . . . . . . . . . . . . . . . . . . . . . . . . . . . . . . . . . . . . . . . . . . . 3903.3 Supporting equity and poverty reduction . . . . . . . . . . . . . . . . . . . . . . . . . . . . . . . . . . . . . . . . . . . . . . . . . . . . . 392
4 Quantifying the economic implications of green transport 3934.1 Transport trends under business as usual . . . . . . . . . . . . . . . . . . . . . . . . . . . . . . . . . . . . . . . . . . . . . . . . . . . . . 3934.2 The Avoid, Shift and Improve strategy as a basis for redirecting investments. . . . . . . . . . . . . . . . . . . . 3934.3 Investing in green transport . . . . . . . . . . . . . . . . . . . . . . . . . . . . . . . . . . . . . . . . . . . . . . . . . . . . . . . . . . . . . . . . . . 396
5 Enabling conditions 3985.1 Designing appropriate regulation, planning and information provision . . . . . . . . . . . . . . . . . . . . . . . . 3985.2 Setting the right financial conditions and economic incentives . . . . . . . . . . . . . . . . . . . . . . . . . . . . . . . . 3995.3 Ensuring technology transfer and access . . . . . . . . . . . . . . . . . . . . . . . . . . . . . . . . . . . . . . . . . . . . . . . . . . . . . . 4045.4 Strengthening Institutions and Capacity . . . . . . . . . . . . . . . . . . . . . . . . . . . . . . . . . . . . . . . . . . . . . . . . . . . . . . 405
6 Conclusions 407
References 408
378
Towards a green economy
List of figuresFigure 1: Image of green transport as a goal, and actions and investments to achieve this goal . . . . . . . . 382Figure 2: Passenger light-duty vehicle fleet and ownership rates in key regions . . . . . . . . . . . . . . . . . . . . . . . 383Figure 3: Changes to energy consumption by sector and region between 2007 and 2030 . . . . . . . . . . . . . 384Figure 4: Reported deaths by type of road user, region and income group . . . . . . . . . . . . . . . . . . . . . . . . . . . . 386Figure 5: Moving towards a green trajectory . . . . . . . . . . . . . . . . . . . . . . . . . . . . . . . . . . . . . . . . . . . . . . . . . . . . . . . . 389Figure 6: Modal split by income group in Surabaya . . . . . . . . . . . . . . . . . . . . . . . . . . . . . . . . . . . . . . . . . . . . . . . . . . 390Figure 7: Global transport carbon abatement cost curve . . . . . . . . . . . . . . . . . . . . . . . . . . . . . . . . . . . . . . . . . . . . . 394Figure 8: Effect of a combination of Avoid, Shift and Improve measures to reduce CO2 emissions from the transport sector in the EU . . . . . . . . . . . . . . . . . . . . . . . . . . . . . . . . . . . . . . . . . . . . . . . . . . . . . . . . . . . . . . . . . 395Figure 9: Level of vehicle activity under BAU and the green scenarios. . . . . . . . . . . . . . . . . . . . . . . . . . . . . . . . . 396Figure 10: Modeled changes to CO2 emissions in the transport sector under the green and BAU scenarios . . . . . . . . . . . . . . . . . . . . . . . . . . . . . . . . . . . . . . . . . . . . . . . . . . . . . . . . . . . . . . . . . . . . . . . . . . . . . . . . . . . . . . . . . . . 396Figure 11: Growth patterns for cities around the world . . . . . . . . . . . . . . . . . . . . . . . . . . . . . . . . . . . . . . . . . . . . . . 399
List of tablesTable 1: Accident costs from various world regions . . . . . . . . . . . . . . . . . . . . . . . . . . . . . . . . . . . . . . . . . . . . . . . . . . 385Table 2: Avoid, Shift and Improve strategy . . . . . . . . . . . . . . . . . . . . . . . . . . . . . . . . . . . . . . . . . . . . . . . . . . . . . . . . . . 387Table 3: Economic impacts per US$ 1 million expenditures . . . . . . . . . . . . . . . . . . . . . . . . . . . . . . . . . . . . . . . . . . 390Table 4: Green transport businesses in the Avoid, Shift and Improve groups . . . . . . . . . . . . . . . . . . . . . . . . . . 391Table 5: Costs and benefits of investing in green transport . . . . . . . . . . . . . . . . . . . . . . . . . . . . . . . . . . . . . . . . . . . 394Table 6: Overview of instruments to support Avoid, Shift and Improve strategies . . . . . . . . . . . . . . . . . . . . . 400Table 7: Regulatory measures in practice . . . . . . . . . . . . . . . . . . . . . . . . . . . . . . . . . . . . . . . . . . . . . . . . . . . . . . . . . . . . 400Table 8: Options for financing green transport . . . . . . . . . . . . . . . . . . . . . . . . . . . . . . . . . . . . . . . . . . . . . . . . . . . . . . . 401Table 9: Various technologies to support green transport goals . . . . . . . . . . . . . . . . . . . . . . . . . . . . . . . . . . . . . . 404
List of boxesBox 1: Externalities . . . . . . . . . . . . . . . . . . . . . . . . . . . . . . . . . . . . . . . . . . . . . . . . . . . . . . . . . . . . . . . . . . . . . . . . . . . . . . . . . 384Box 2: Maritime and aviation emissions. . . . . . . . . . . . . . . . . . . . . . . . . . . . . . . . . . . . . . . . . . . . . . . . . . . . . . . . . . . . . . 385Box 3: Benefits of cleaner fuels in sub-Saharan Africa. . . . . . . . . . . . . . . . . . . . . . . . . . . . . . . . . . . . . . . . . . . . . . . . . 386Box 4: Re-examining the employment generating effects of aviation . . . . . . . . . . . . . . . . . . . . . . . . . . . . . . . . . 390Box 5: Green transport as a business . . . . . . . . . . . . . . . . . . . . . . . . . . . . . . . . . . . . . . . . . . . . . . . . . . . . . . . . . . . . . . . . 390Box 6: The role of transport in reducing rural poverty . . . . . . . . . . . . . . . . . . . . . . . . . . . . . . . . . . . . . . . . . . . . . . . . 391Box 7: Net savings from greening the transport sector. . . . . . . . . . . . . . . . . . . . . . . . . . . . . . . . . . . . . . . . . . . . . . . 395Box 8. Effects of combining investments in measures in the Avoid, Shift and Improve areas on reducing transport emissions . . . . . . . . . . . . . . . . . . . . . . . . . . . . . . . . . . . . . . . . . . . . . . . . . . . . . . . . . . . . . . . . . . . . . . . 395Box 9: Share the Road. . . . . . . . . . . . . . . . . . . . . . . . . . . . . . . . . . . . . . . . . . . . . . . . . . . . . . . . . . . . . . . . . . . . . . . . . . . . . . . 402Box 10: The future role of climate finance in enacting green transport . . . . . . . . . . . . . . . . . . . . . . . . . . . . . . . . 402Box 11: Fuel subsidies – transitional arrangements. . . . . . . . . . . . . . . . . . . . . . . . . . . . . . . . . . . . . . . . . . . . . . . . . . . 403Box 12: Congestion charging. . . . . . . . . . . . . . . . . . . . . . . . . . . . . . . . . . . . . . . . . . . . . . . . . . . . . . . . . . . . . . . . . . . . . . . . 403Box 13: The global fuel economy initiative . . . . . . . . . . . . . . . . . . . . . . . . . . . . . . . . . . . . . . . . . . . . . . . . . . . . . . . . . . . 405
379
Transport
List of acronymsBAU Business-as-usualBRT Bus Rapid TransitCAFE Corporate Average Fuel EconomyCBD Central Business DistrictCDM Clean Development MechanismCIF Climate Investment FundCO2 Carbon dioxideCTF Clean Technology FundECMT European Conference of Ministers of
TransportETS Emissions Trading SchemeFIA Fédération Internationale de l’AutomobileG2 Green Scenario 2GEF Global Environment FacilityGDP Gross Domestic ProductGFEI Global Fuel Economy InitiativeGHG Greenhouse gasHC Hydro CarbonICC International Chamber of CommerceIEA International Energy AgencyIET International Emissions TradingIMO International Maritime OrganizationIQ Intelligence quotientITF International Transport ForumJI Joint ImplementationLDVs Light-duty vehiclesMtoe Million tonnes of oil equivalent
NAMA Nationally Appropriate Mitigation ActionNAFTA North American Free Trade AgreementNMT Non-Motorised TransportNOX Nitrogen oxideODA Official Development AssistanceOECD Organisation for Economic Co-operation
and DevelopmentPKM Passenger per kilometresPPP Public-private partnershipPT Public transportR&D Research and developmentSLoCaT Partnership on Sustainable Low Carbon
TransportSOX Sulphur oxideSSA Sub-Saharan AfricaT21 Threshold 21 modelTDM Transport Development ManagementTKM Tonnes per kilometreTNA Technology Needs AssessmentTPK Tonnes per kilometreTRL Transport Research Laboratory (UK)UNEP United Nations Environment ProgrammeVKM Vehicle kilometresVOC Volatile Organic CompoundsVTPI Victoria Transport Planning InstituteWHO World Health Organization
380
Towards a green economy
Key messages1. Present patterns of transportation – based mainly on petrol and diesel-fuelled motor vehicles – generate serious social, environmental and economic damage and are highly unsustainable. At present, transportation consumes more than half of global liquid fossil fuels; emits nearly a quarter of the world’s energy-related CO2; generates more than 80 per cent of the air pollution in cities in developing countries; results in more than 1.27 million fatal traffic accidents per year; and produces chronic traffic congestion in many of the world’s urban areas. These costs to society, which can add up to more than 10 per cent of a country’s Gross Domestic Product (GDP), are likely to grow, primarily because of the expected growth of the global vehicle fleet.
2. Business-as-usual (BAU) will significantly enlarge vehicle fleets and exacerbate their costs to society. If we continue on a BAU path, the global vehicle fleet is set to increase from around 800 million to between 2 and 3 billion by 2050. Most of this growth will take place in developing countries. Aviation growth is expected to increase exponentially in the coming decades, fuelled largely by income growth in developing countries. Carbon emissions from shipping could also grow by up to 250 per cent.
3. A three-pronged investment strategy is needed to transform this sector: promote access instead of mobility; shift to less harmful modes of transportation; and improve vehicles towards lower carbon intensity and pollution. A fundamental shift in investment patterns is needed, based on the principles of avoiding or reducing trips through integrating land use and transport planning and enabling more localised production and consumption. Shifting to more environmentally efficient modes such as public and non-motorised transport (for passenger transport) and to rail and water transport (for freight) is recommended. Investment in public transport and infrastructure that promotes walking and cycling generates jobs, improves well-being and can add considerable value to regional and national economies. Improving vehicles and fuels is a priority in order to reduce urban air pollution and greenhouse gas emissions (GHG). Green transport policies will also reduce road accidents and alleviate poverty by improving access to markets and other essential facilities.
381
Transport
4. Investment in public transportation and vehicle efficiency improvements generates exceptional economic returns. Several scenarios show that a green, low carbon, transport sector can reduce greenhouse gas emissions by 70 per cent without major additional investment. A reallocation of just 0.34 per cent of global GDP in support of public transport infrastructure and efficiency improvements to road vehicles would reduce the expected increase in travel volume of road vehicles by around one-third by 2050. It would diminish the use of oil-based fuel by up to one-third and promote strong and sustainable employment in the sector.
5. Enabling conditions for green transportation have to be wide-ranging in order to be effective. Such investments, among other measures, should be enabled via policies, including land use planning to promote compact or mass-transit corridor-based cities; regulation of fuel and vehicles; and the provision of information to aid decisions by consumers and industry. In addition, shifting financing priorities towards public transport and non-motorised transport, coupled with strong economic incentives such as taxes, charges and subsidy reform will also send a strong signal. Finally, developing and widely applying green transport technology; as well as setting up and building the capacity of institutions to foster greener transport will help ensure close cooperation with other key sectors.
382
Towards a green economy
1 IntroductionTransport is central to the lives of citizens across the world, yet the current patterns of transport, dictated mainly by fossil-fuel driven motor vehicles, generate a range of environmental, social and economic costs. It is estimated, for example, that transport is responsible for nearly a quarter of global energy-related carbon dioxide (CO2).
There is a growing consensus on the need for more sustainable patterns of transport activity but investment patterns are still heavily skewed towards supporting the “motorisation” model of development. The recent economic recession has led to various stimulus packages that focus (with notable exceptions) on preserving current industries and forms of transport such as car manufacturing and road building.
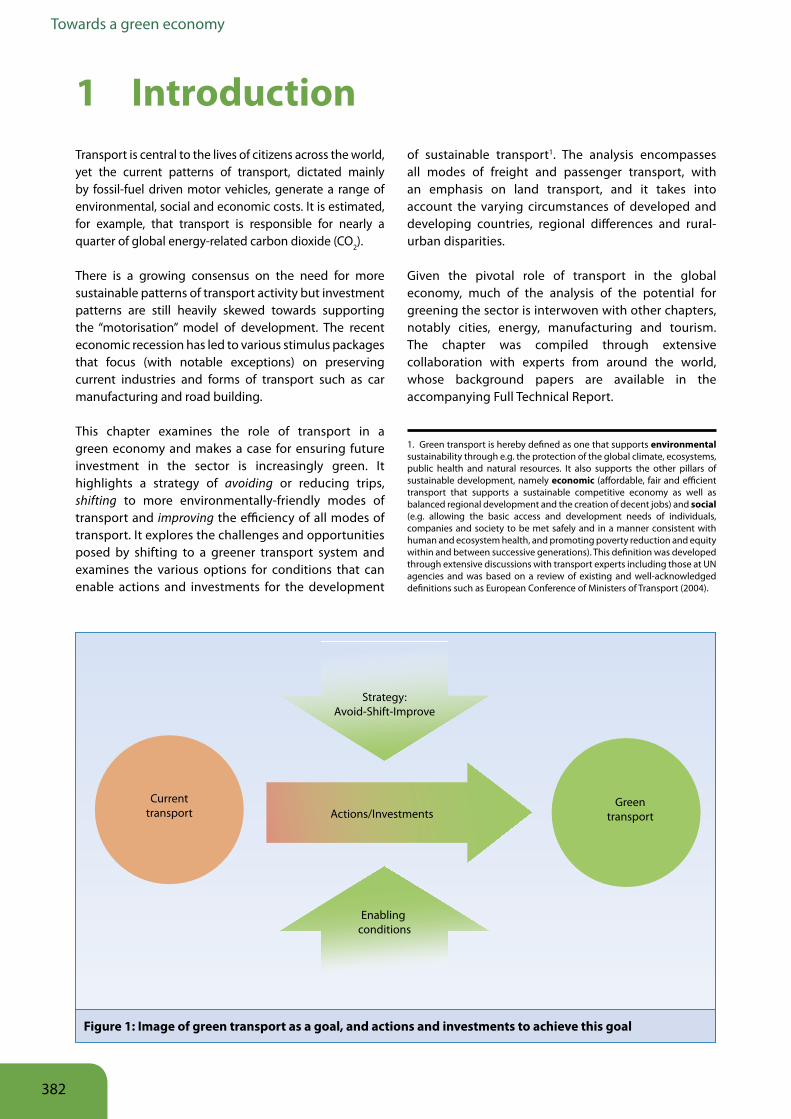
This chapter examines the role of transport in a green economy and makes a case for ensuring future investment in the sector is increasingly green. It highlights a strategy of avoiding or reducing trips, shifting to more environmentally-friendly modes of transport and improving the efficiency of all modes of transport. It explores the challenges and opportunities posed by shifting to a greener transport system and examines the various options for conditions that can enable actions and investments for the development
of sustainable transport1. The analysis encompasses all modes of freight and passenger transport, with an emphasis on land transport, and it takes into account the varying circumstances of developed and developing countries, regional differences and rural-urban disparities.
Given the pivotal role of transport in the global economy, much of the analysis of the potential for greening the sector is interwoven with other chapters, notably cities, energy, manufacturing and tourism. The chapter was compiled through extensive collaboration with experts from around the world, whose background papers are available in the accompanying Full Technical Report.
1. Green transport is hereby defined as one that supports environmental sustainability through e.g. the protection of the global climate, ecosystems, public health and natural resources. It also supports the other pillars of sustainable development, namely economic (affordable, fair and efficient transport that supports a sustainable competitive economy as well as balanced regional development and the creation of decent jobs) and social (e.g. allowing the basic access and development needs of individuals, companies and society to be met safely and in a manner consistent with human and ecosystem health, and promoting poverty reduction and equity within and between successive generations). This definition was developed through extensive discussions with transport experts including those at UN agencies and was based on a review of existing and well-acknowledged definitions such as European Conference of Ministers of Transport (2004).
Strategy:Avoid-Shift-Improve
Enabling conditions
Currenttransport
GreentransportActions/Investments
Figure 1: Image of green transport as a goal, and actions and investments to achieve this goal
383
Transport
2 1 Challenges
Unsustainable trendsThe challenges for the transport sector in becoming green are made obvious by observing current trends, whereby:
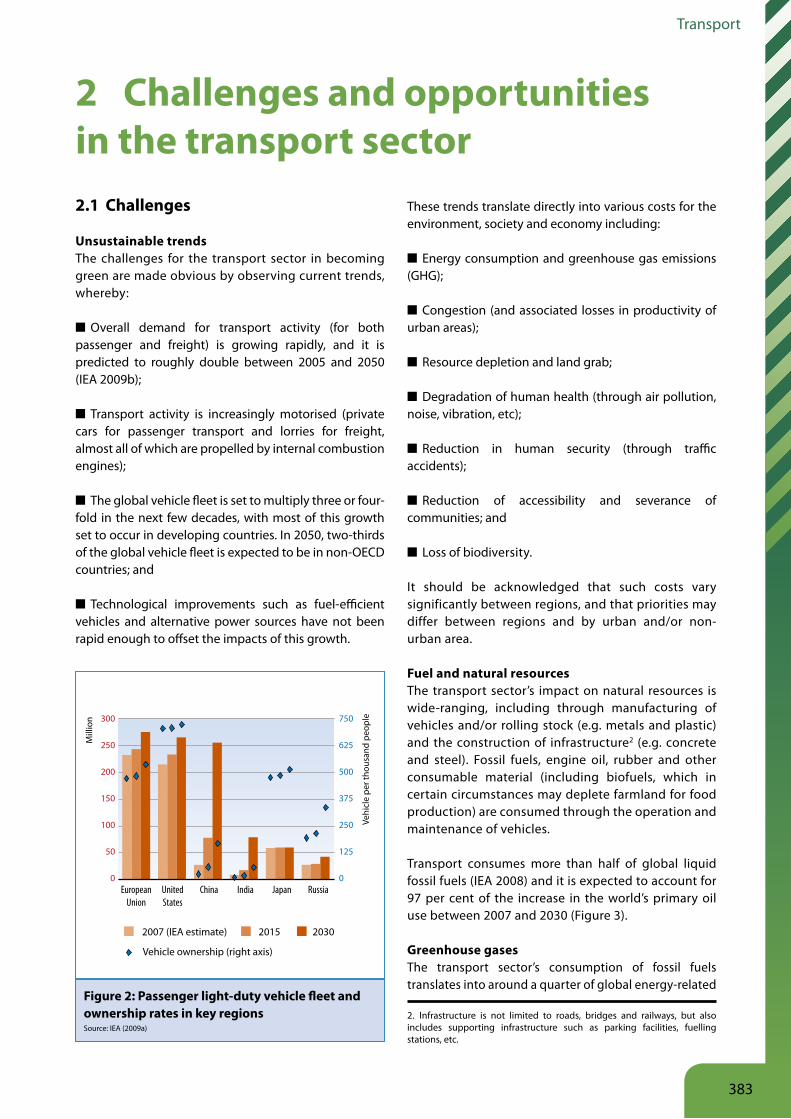
■ Overall demand for transport activity (for both passenger and freight) is growing rapidly, and it is predicted to roughly double between 2005 and 2050 (IEA 2009b);
■ Transport activity is increasingly motorised (private cars for passenger transport and lorries for freight, almost all of which are propelled by internal combustion engines);
■ The global vehicle fleet is set to multiply three or four-fold in the next few decades, with most of this growth set to occur in developing countries. In 2050, two-thirds of the global vehicle fleet is expected to be in non-OECD countries; and
■ Technological improvements such as fuel-efficient vehicles and alternative power sources have not been rapid enough to offset the impacts of this growth.
2 Challenges and opportunities in the transport sector
300
250
200
150
100
50
0
750
625
500
375
250
125
0European
UnionUnitedStates
China India Japan Russia
2007 (IEA estimate) 2015 2030
Mill
ion
Vehicle ownership (right axis)
Vehi
cle
per t
hous
and
peop
le
Figure 2: Passenger light-duty vehicle fleet and ownership rates in key regions Source: IEA (2009a)
These trends translate directly into various costs for the environment, society and economy including:
■ Energy consumption and greenhouse gas emissions (GHG);
■ Congestion (and associated losses in productivity of urban areas);
■ Resource depletion and land grab;
■ Degradation of human health (through air pollution, noise, vibration, etc);
■ Reduction in human security (through traffic accidents);
■ Reduction of accessibility and severance of communities; and
■ Loss of biodiversity.
It should be acknowledged that such costs vary significantly between regions, and that priorities may differ between regions and by urban and/or non-urban area.
Fuel and natural resources The transport sector’s impact on natural resources is wide-ranging, including through manufacturing of vehicles and/or rolling stock (e.g. metals and plastic) and the construction of infrastructure2 (e.g. concrete and steel). Fossil fuels, engine oil, rubber and other consumable material (including biofuels, which in certain circumstances may deplete farmland for food production) are consumed through the operation and maintenance of vehicles.
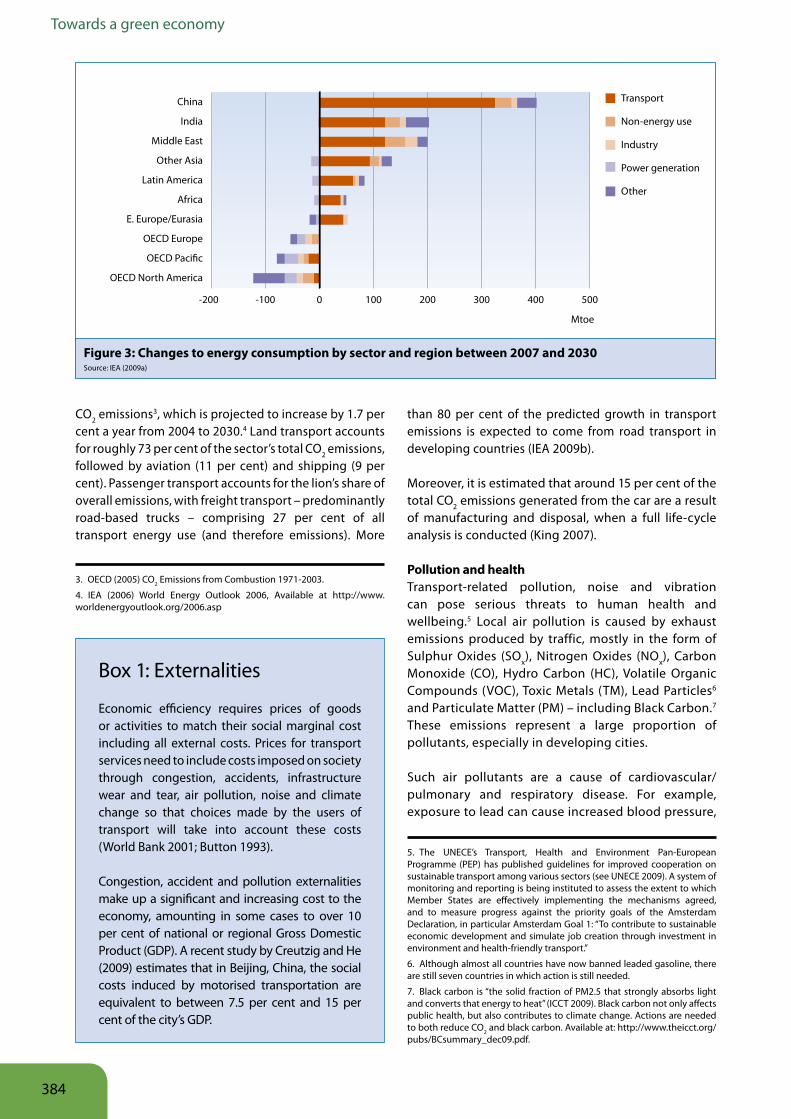
Transport consumes more than half of global liquid fossil fuels (IEA 2008) and it is expected to account for 97 per cent of the increase in the world’s primary oil use between 2007 and 2030 (Figure 3).
Greenhouse gasesThe transport sector’s consumption of fossil fuels translates into around a quarter of global energy-related
2. Infrastructure is not limited to roads, bridges and railways, but also includes supporting infrastructure such as parking facilities, fuelling stations, etc.
384
Towards a green economy
CO2 emissions3, which is projected to increase by 1.7 per cent a year from 2004 to 2030.4 Land transport accounts for roughly 73 per cent of the sector’s total CO2 emissions, followed by aviation (11 per cent) and shipping (9 per cent). Passenger transport accounts for the lion’s share of overall emissions, with freight transport – predominantly road-based trucks – comprising 27 per cent of all transport energy use (and therefore emissions). More
3. OECD (2005) CO2 Emissions from Combustion 1971-2003.
4. IEA (2006) World Energy Outlook 2006, Available at http://www.worldenergyoutlook.org/2006.asp
Box 1: Externalities
Economic efficiency requires prices of goods or activities to match their social marginal cost including all external costs. Prices for transport services need to include costs imposed on society through congestion, accidents, infrastructure wear and tear, air pollution, noise and climate change so that choices made by the users of transport will take into account these costs (World Bank 2001; Button 1993).
Congestion, accident and pollution externalities make up a significant and increasing cost to the economy, amounting in some cases to over 10 per cent of national or regional Gross Domestic Product (GDP). A recent study by Creutzig and He (2009) estimates that in Beijing, China, the social costs induced by motorised transportation are equivalent to between 7.5 per cent and 15 per cent of the city’s GDP.
China
India
Middle East
Other Asia
Latin America
Africa
E. Europe/Eurasia
OECD Europe
OECD Paci�c
OECD North America
Transport
Non-energy use
Industry
Power generation
Other
-200 -100 0 100 200 300 400 500
Mtoe
Figure 3: Changes to energy consumption by sector and region between 2007 and 2030Source: IEA (2009a)
than 80 per cent of the predicted growth in transport emissions is expected to come from road transport in developing countries (IEA 2009b).
Moreover, it is estimated that around 15 per cent of the total CO2 emissions generated from the car are a result of manufacturing and disposal, when a full life-cycle analysis is conducted (King 2007).
Pollution and health Transport-related pollution, noise and vibration can pose serious threats to human health and wellbeing.5 Local air pollution is caused by exhaust emissions produced by traffic, mostly in the form of Sulphur Oxides (SOx), Nitrogen Oxides (NOx), Carbon Monoxide (CO), Hydro Carbon (HC), Volatile Organic Compounds (VOC), Toxic Metals (TM), Lead Particles6 and Particulate Matter (PM) – including Black Carbon.7 These emissions represent a large proportion of pollutants, especially in developing cities.
Such air pollutants are a cause of cardiovascular/pulmonary and respiratory disease. For example, exposure to lead can cause increased blood pressure,
5. The UNECE’s Transport, Health and Environment Pan-European Programme (PEP) has published guidelines for improved cooperation on sustainable transport among various sectors (see UNECE 2009). A system of monitoring and reporting is being instituted to assess the extent to which Member States are effectively implementing the mechanisms agreed, and to measure progress against the priority goals of the Amsterdam Declaration, in particular Amsterdam Goal 1: “To contribute to sustainable economic development and simulate job creation through investment in environment and health-friendly transport.”
6. Although almost all countries have now banned leaded gasoline, there are still seven countries in which action is still needed.
7. Black carbon is “the solid fraction of PM2.5 that strongly absorbs light and converts that energy to heat” (ICCT 2009). Black carbon not only affects public health, but also contributes to climate change. Actions are needed to both reduce CO2 and black carbon. Available at: http://www.theicct.org/pubs/BCsummary_dec09.pdf.
385
Transport
liver and kidney damage, impaired fertility, comas, convulsions, and even death. Children are particularly vulnerable; they can suffer from reductions in IQ and attention span, learning disabilities, hyperactivity, impaired growth and hearing loss (Rapuano et al. 1997). Hatfield et al. (2010) estimate that the removal of lead from vehicle fuels has resulted in more than 1 million avoided premature deaths per year with annual financial benefits over US$ 2.4 trillion.
Sánchez-Triana et al. (2007) note that for Colombia, the health cost of urban air pollution was roughly 0.8 per cent of the nation’s GDP, amounting to 1,500 billion pesos (US$ 698 million).8 Noise pollution generated by transport can be detrimental to health and well-being, particularly if it contributes to sleep disturbance, which can lead to increased blood pressure and heart attacks (WHO 2009b). Research by
8. Calculated based on 2150 Colombian Pesos to US$ 1.
Lambert (2002) and Martínez (2005) indicate that the economic cost of noise can reach nearly 0.5 per cent of GDP in the European Union.
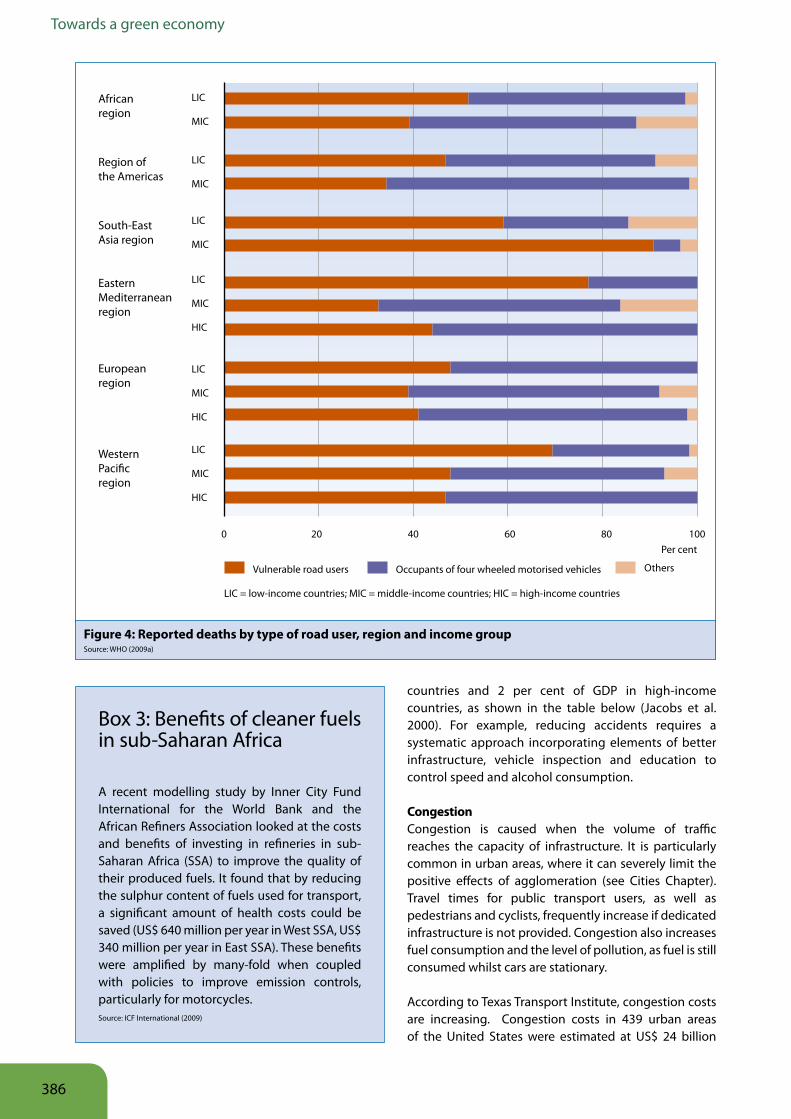
Human security and accidentsThe latest report from the World Health Organization (WHO 2009a) confirms that road accidents remain a serious public health issue. Every year more than 1.27 million people die in road accidents, of which 91 per cent occur in low and middle income countries. About half of those who die in road accidents worldwide are pedestrians, cyclists and motorcyclists, for whom infrastructure provision is often neglected. In Europe, traffic accidents are a major cause of fatalities for young people, particularly men aged between 15 and 25 (WHO 2008).
It is estimated that the cost of traffic accidents amounts to US$ 518 billion, and represents between 1 per cent and 1.5 per cent of GDP in low-and middle-income
Box 2: Maritime and aviation emissions
Road transport accounts for the majority of GHG emissions and their predicted growth, but those from maritime and aviation transport are increasing at a very rapid rate.
For maritime transport, developments in world trade are increasing while both the volume and distance of goods are being shipped at a pace that exceeds growth in world GDP. International Maritime Organization (2009) predicts that by 2050,
in the absence of additional policies, emissions from ships may grow between 150 per cent and 250 per cent (compared with 2007).
Despite a temporary slowdown in demand owing to the economic recession, the fundamental growth in the aviation sector remains strong. Aviation emissions are projected to increase exponentially in the next few decades, fuelled by income growth and reductions in the price of air travel.
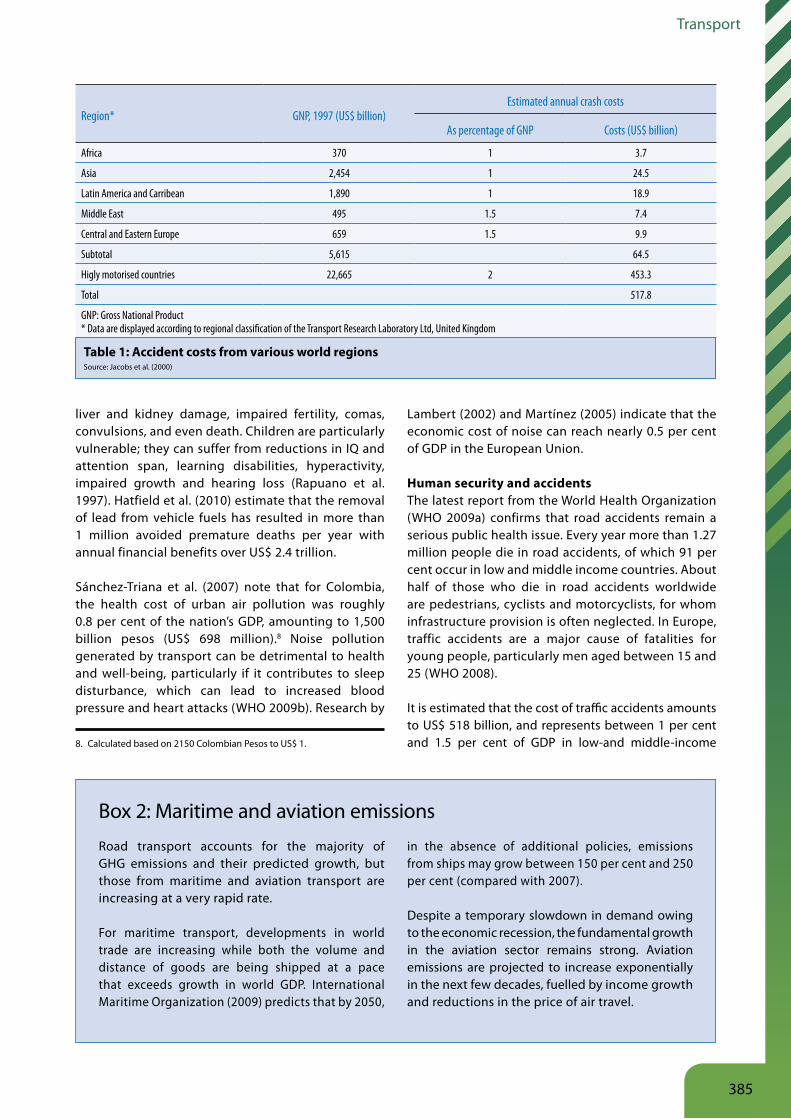
Table 1: Accident costs from various world regions Source: Jacobs et al. (2000)
Region* GNP, 1997 (US$ billion)Estimated annual crash costs
As percentage of GNP Costs (US$ billion)
Africa 370 1 3.7
Asia 2,454 1 24.5
Latin America and Carribean 1,890 1 18.9
Middle East 495 1.5 7.4
Central and Eastern Europe 659 1.5 9.9
Subtotal 5,615 64.5
Higly motorised countries 22,665 2 453.3
Total 517.8
GNP: Gross National Product* Data are displayed according to regional classification of the Transport Research Laboratory Ltd, United Kingdom
386
Towards a green economy
countries and 2 per cent of GDP in high-income countries, as shown in the table below (Jacobs et al. 2000). For example, reducing accidents requires a systematic approach incorporating elements of better infrastructure, vehicle inspection and education to control speed and alcohol consumption.
Congestion Congestion is caused when the volume of traffic reaches the capacity of infrastructure. It is particularly common in urban areas, where it can severely limit the positive effects of agglomeration (see Cities Chapter). Travel times for public transport users, as well as pedestrians and cyclists, frequently increase if dedicated infrastructure is not provided. Congestion also increases fuel consumption and the level of pollution, as fuel is still consumed whilst cars are stationary.
According to Texas Transport Institute, congestion costs are increasing. Congestion costs in 439 urban areas of the United States were estimated at US$ 24 billion
Box 3: Benefits of cleaner fuels in sub-Saharan Africa
A recent modelling study by Inner City Fund International for the World Bank and the African Refiners Association looked at the costs and benefits of investing in refineries in sub-Saharan Africa (SSA) to improve the quality of their produced fuels. It found that by reducing the sulphur content of fuels used for transport, a significant amount of health costs could be saved (US$ 640 million per year in West SSA, US$ 340 million per year in East SSA). These benefits were amplified by many-fold when coupled with policies to improve emission controls, particularly for motorcycles.Source: ICF International (2009)
Africanregion
Region ofthe Americas
South-EastAsia region
EasternMediterraneanregion
Europeanregion
WesternPaci�cregion
0 20 40 60 80 100Per cent
LIC
MIC
HIC
LIC
MIC
HIC
LIC
MIC
HIC
LIC
MIC
LIC
MIC
LIC
MIC
Vulnerable road users Occupants of four wheeled motorised vehicles Others
LIC = low-income countries; MIC = middle-income countries; HIC = high-income countries
Figure 4: Reported deaths by type of road user, region and income group Source: WHO (2009a)
387
Transport
in 1982, US$ 85 billion in 2000, and US$ 115 billion in 2009. Furthermore, congestion in the US cost 3.9 billion gallons of wasted fuel and 4.8 billion hours of extra time. According to Organisation for Economic Co-operation and Development (2009), congestion in Toronto, Canada costs the city around US$ 3.3 billion Canadian dollars a year in productivity (1.2 per cent of Toronto’s GDP), while in the UK the estimated cost of time lost in traffic is £ 20 billion a year, or 1.2 per cent of GDP (The Telegraph Business Club et al. 2009). In developing countries, a lack of traffic data often makes it difficult to estimate the loss of productivity. Data are available for Lima, Peru: people living within the city are estimated to lose an average of four hours in daily travel, which leads to a loss of approximately US$ 6.2 billion, or around 10 per cent of GDP every year (UNESCAP et al. 2010). The traditional approach to tackling congestion – providing more road capacity – has often been counter-effective, as the extra capacity induces further demand for traffic activity (SACTRA 1997).
Accessibility and severanceTraffic-filled roads can become physical and psychological barriers that can sever communities and divide entire cities (see Cities Chapter). There are various ways in which accessibility and severance can be quantified and monetised. Although values are highly context-dependent and differ greatly by region, Sælensminde (2002) in VTPI (2007) notes an extra cost of US$ 0.54-0.62 per mile of vehicle activity shifted from non-motorised transport to the car. Transport systems dominated by motor vehicles have been shown to hinder access to jobs, markets and essential facilities, particularly for the poorest and most vulnerable members of society.
Land use and loss of biodiversityRoads, railways, airports, harbours and other transport infrastructure can have a severe impact on the natural environment, from the removal of vegetation during construction or the subsequent fragmentation of habitats (CEU 2002; Kaczynska 2009). Fragmentation, without proper ecological infrastructure planning can severely disturb wildlife and reduce biodiversity.
2 2 Opportunities
Leapfrogging towards green transportResponding to these challenges will require a paradigm shift in the way the transport sector develops in the coming decades. Action is required in all countries, but opportunities are greatest for developing countries, where future patterns of transport can be shaped by the investment and planning decisions made today. Investing in green transport will enable such countries to leapfrog towards a sustainable path, rather than reproducing the mistakes made by industrialised countries (Dalkmann 2009).
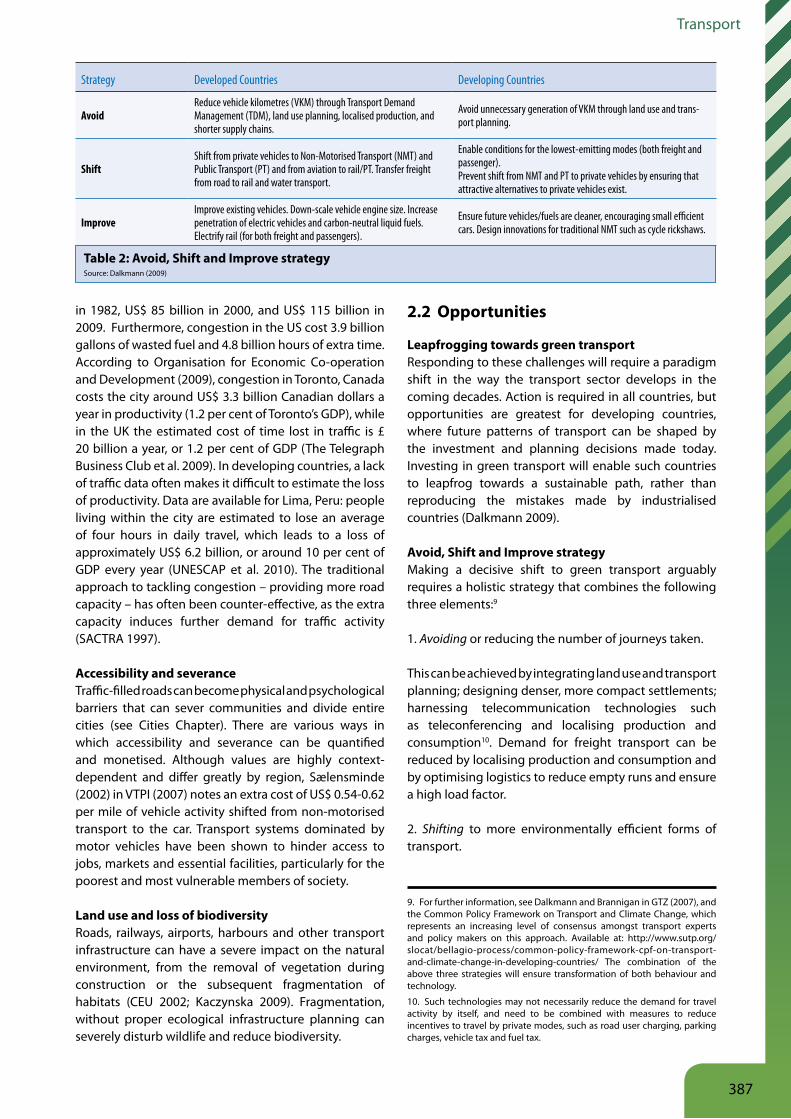
Avoid, Shift and Improve strategyMaking a decisive shift to green transport arguably requires a holistic strategy that combines the following three elements:9
1. Avoiding or reducing the number of journeys taken.
This can be achieved by integrating land use and transport planning; designing denser, more compact settlements; harnessing telecommunication technologies such as teleconferencing and localising production and consumption10. Demand for freight transport can be reduced by localising production and consumption and by optimising logistics to reduce empty runs and ensure a high load factor.
2. Shifting to more environmentally efficient forms of transport.
9. For further information, see Dalkmann and Brannigan in GTZ (2007), and the Common Policy Framework on Transport and Climate Change, which represents an increasing level of consensus amongst transport experts and policy makers on this approach. Available at: http://www.sutp.org/slocat/bellagio-process/common-policy-framework-cpf-on-transport-and-climate-change-in-developing-countries/ The combination of the above three strategies will ensure transformation of both behaviour and technology.
10. Such technologies may not necessarily reduce the demand for travel activity by itself, and need to be combined with measures to reduce incentives to travel by private modes, such as road user charging, parking charges, vehicle tax and fuel tax.
Table 2: Avoid, Shift and Improve strategy Source: Dalkmann (2009)
Strategy Developed Countries Developing Countries
AvoidReduce vehicle kilometres (VKM) through Transport Demand Management (TDM), land use planning, localised production, and shorter supply chains.
Avoid unnecessary generation of VKM through land use and trans-port planning.
ShiftShift from private vehicles to Non-Motorised Transport (NMT) and Public Transport (PT) and from aviation to rail/PT. Transfer freight from road to rail and water transport.
Enable conditions for the lowest-emitting modes (both freight and passenger).Prevent shift from NMT and PT to private vehicles by ensuring that attractive alternatives to private vehicles exist.
ImproveImprove existing vehicles. Down-scale vehicle engine size. Increase penetration of electric vehicles and carbon-neutral liquid fuels. Electrify rail (for both freight and passengers).
Ensure future vehicles/fuels are cleaner, encouraging small efficient cars. Design innovations for traditional NMT such as cycle rickshaws.
388
Towards a green economy
This involves promoting public transport as well as walking and cycling, which usually requires substantial investment in infrastructure. For public transport to rival the private car it needs to be frequent, reliable, affordable and comfortable. Railways and waterways are generally greener methods of transporting freight, and shifting to them frees up road space.
3. Improving vehicle and fuel technology to reduce adverse environmental effects such as pollution and resource depletion.
Enhancing the fuel economy of conventional engines; reducing the weight of vehicles and developing alternatives such as electric and hybrid vehicles, biofuels, and hydrogen fuel technologies are all examples of this strategy.11 Further efficiency gains can be achieved through an improvement in the occupancy rate of vehicles, or through better driving (eco-driving).
Given that transport systems vary greatly around the world, it is important that the above three strategies are applied in ways which fully consider the context and main problems facing each region. Many developing countries are heavily reliant upon non-motorised
11. It is important that the generation of electricity, production of hydrogen and biofuels are all conducted in a sustainable manner.
transport and therefore present opportunities for creating more sustainable transport systems than those in developed nations (see Table 2).
Enacting the Avoid, Shift and Improve strategy requires adequate investment in the research, development, production and operation/management of:
■ Infrastructure such as tracks for buses and rail, pavements and cycle routes and park-and-ride facilities;12
■ Greener vehicles and transport modes (including bicycles, public transport vehicles and low emission vehicles, utilising technologies listed in section 5.3);
■ Cleaner fuels;
■ Telecommunication technology to substitute conventional transport, e.g. telework/ teleconferencing; and
■ Technologies to enact green transport, e.g. GPS systems, Intelligent Transport Systems, green logistics, etc.
The above would need to be supported by appropriate enabling conditions, which are explored in Section 5.
12. It is vital that such infrastructure promote connectivity between modes, so that journeys are made seamless.
389
Transport
3 Transport in a green economyThis section examines how a green transport sector can lead to green economic growth, create jobs and reduce poverty.
3 1 Supporting green growth
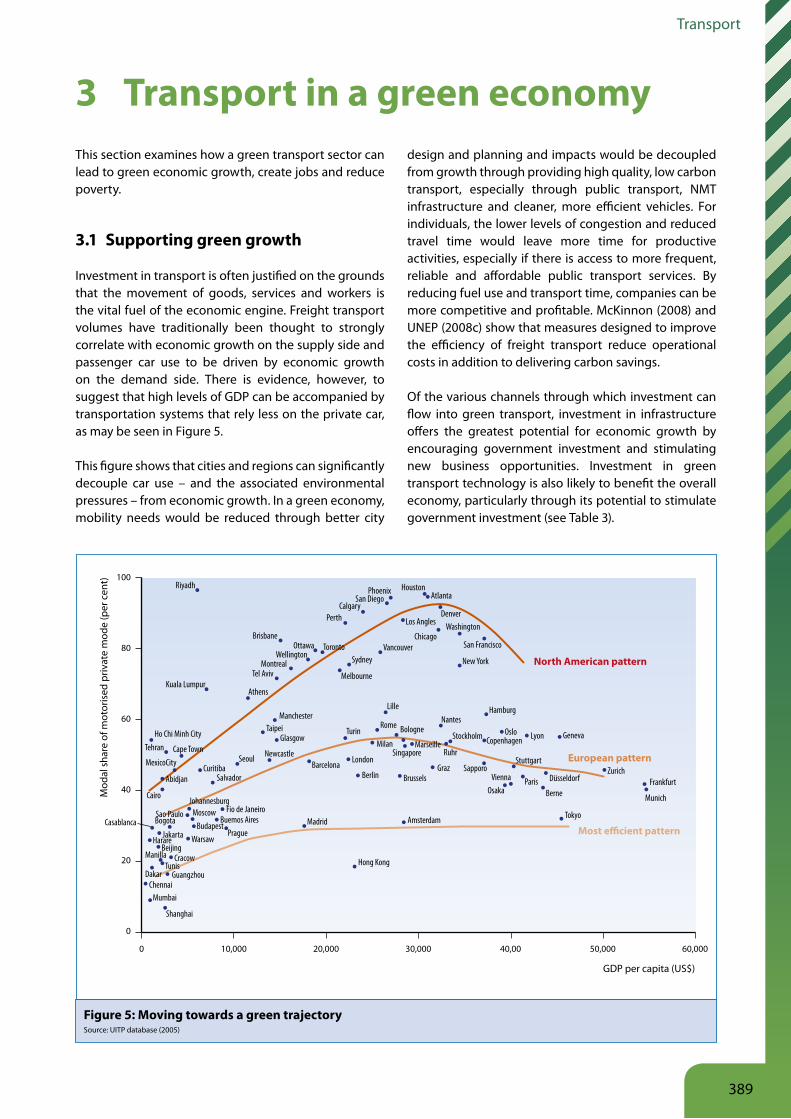
Investment in transport is often justified on the grounds that the movement of goods, services and workers is the vital fuel of the economic engine. Freight transport volumes have traditionally been thought to strongly correlate with economic growth on the supply side and passenger car use to be driven by economic growth on the demand side. There is evidence, however, to suggest that high levels of GDP can be accompanied by transportation systems that rely less on the private car, as may be seen in Figure 5.
This figure shows that cities and regions can significantly decouple car use – and the associated environmental pressures – from economic growth. In a green economy, mobility needs would be reduced through better city
design and planning and impacts would be decoupled from growth through providing high quality, low carbon transport, especially through public transport, NMT infrastructure and cleaner, more efficient vehicles. For individuals, the lower levels of congestion and reduced travel time would leave more time for productive activities, especially if there is access to more frequent, reliable and affordable public transport services. By reducing fuel use and transport time, companies can be more competitive and profitable. McKinnon (2008) and UNEP (2008c) show that measures designed to improve the efficiency of freight transport reduce operational costs in addition to delivering carbon savings.
Of the various channels through which investment can flow into green transport, investment in infrastructure offers the greatest potential for economic growth by encouraging government investment and stimulating new business opportunities. Investment in green transport technology is also likely to benefit the overall economy, particularly through its potential to stimulate government investment (see Table 3).
100
80
60
40
20
0
0 10,000 20,000 30,000 40,00 50,000 60,000
GDP per capita (US$)
Mod
al s
hare
of m
otor
ised
priv
ate
mod
e (p
er c
ent)
North American pattern
European pattern
Most e�cient pattern
Riyadh
BrisbaneOttawa Toronto
Sydney
Melbourne
PerthCalgary
Phoenix HoustonAtlanta
DenverLos Angles
ChicagoWashington
San Francisco
New York
Lille
TurinRome Bologne
Stockholm OsloCopenhagen Lyon Geneva
RuhrMarseille
NantesHamburg
Vancouver
San Diego
Kuala Lumpur
Ho Chi Minh CityTehran
MexicoCity
Cairo
Shanghai
MumbaiChennai
GuangzhouTunis
Cracow
Dakar
ManillaBeijing
Harare WarsawJakarta PragueBudapestBogota
Sao Paulo MoscowJohannesburg
Fio de JaneiroBuemos Aires Madrid
Hong Kong
Barcelona London
Berlin
MilanSingapore
GrazBrussels
Amsterdam
SapporoStuttgart
DüsseldorfZurich
Frankfurt
Munich
Tokyo
BerneParisVienna
Osaka
Casablanca
Abidjan Salvador
Seoul
ManchesterTaipei
Glasgow
Newcastle
Curitiba
Cape Town
Athens
Tel AvivMontreal
Wellington
Figure 5: Moving towards a green trajectory Source: UITP database (2005)
390
Towards a green economy
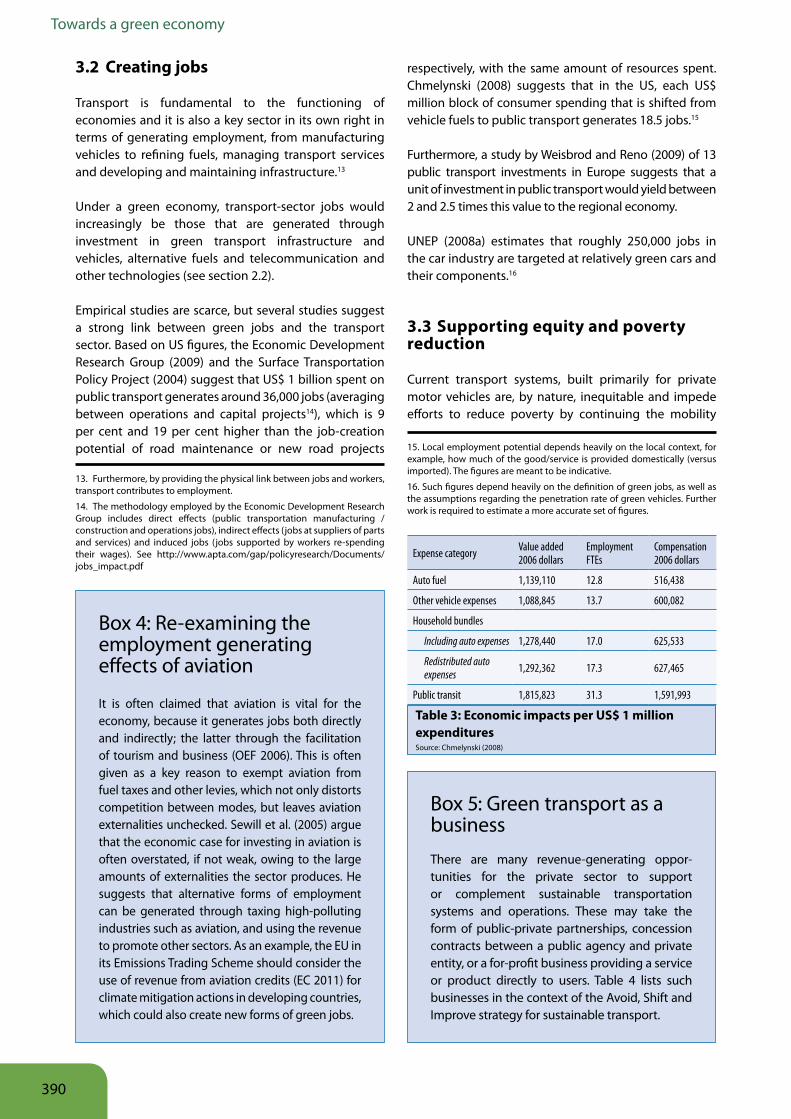
respectively, with the same amount of resources spent. Chmelynski (2008) suggests that in the US, each US$ million block of consumer spending that is shifted from vehicle fuels to public transport generates 18.5 jobs.15
Furthermore, a study by Weisbrod and Reno (2009) of 13 public transport investments in Europe suggests that a unit of investment in public transport would yield between 2 and 2.5 times this value to the regional economy.
UNEP (2008a) estimates that roughly 250,000 jobs in the car industry are targeted at relatively green cars and their components.16
3 3 Supporting equity and poverty reduction
Current transport systems, built primarily for private motor vehicles are, by nature, inequitable and impede efforts to reduce poverty by continuing the mobility
15. Local employment potential depends heavily on the local context, for example, how much of the good/service is provided domestically (versus imported). The figures are meant to be indicative.
16. Such figures depend heavily on the definition of green jobs, as well as the assumptions regarding the penetration rate of green vehicles. Further work is required to estimate a more accurate set of figures.
3 2 Creating jobs
Transport is fundamental to the functioning of economies and it is also a key sector in its own right in terms of generating employment, from manufacturing vehicles to refining fuels, managing transport services and developing and maintaining infrastructure.13
Under a green economy, transport-sector jobs would increasingly be those that are generated through investment in green transport infrastructure and vehicles, alternative fuels and telecommunication and other technologies (see section 2.2).
Empirical studies are scarce, but several studies suggest a strong link between green jobs and the transport sector. Based on US figures, the Economic Development Research Group (2009) and the Surface Transportation Policy Project (2004) suggest that US$ 1 billion spent on public transport generates around 36,000 jobs (averaging between operations and capital projects14), which is 9 per cent and 19 per cent higher than the job-creation potential of road maintenance or new road projects
13. Furthermore, by providing the physical link between jobs and workers, transport contributes to employment.
14. The methodology employed by the Economic Development Research Group includes direct effects (public transportation manufacturing /construction and operations jobs), indirect effects (jobs at suppliers of parts and services) and induced jobs (jobs supported by workers re-spending their wages). See http://www.apta.com/gap/policyresearch/Documents/jobs_impact.pdf
Box 4: Re-examining the employment generating effects of aviation
It is often claimed that aviation is vital for the economy, because it generates jobs both directly and indirectly; the latter through the facilitation of tourism and business (OEF 2006). This is often given as a key reason to exempt aviation from fuel taxes and other levies, which not only distorts competition between modes, but leaves aviation externalities unchecked. Sewill et al. (2005) argue that the economic case for investing in aviation is often overstated, if not weak, owing to the large amounts of externalities the sector produces. He suggests that alternative forms of employment can be generated through taxing high-polluting industries such as aviation, and using the revenue to promote other sectors. As an example, the EU in its Emissions Trading Scheme should consider the use of revenue from aviation credits (EC 2011) for climate mitigation actions in developing countries, which could also create new forms of green jobs.
Table 3: Economic impacts per US$ 1 million expenditures Source: Chmelynski (2008)
Expense category Value added2006 dollars
EmploymentFTEs
Compensation2006 dollars
Auto fuel 1,139,110 12.8 516,438
Other vehicle expenses 1,088,845 13.7 600,082
Household bundles
Including auto expenses 1,278,440 17.0 625,533
Redistributed auto expenses 1,292,362 17.3 627,465
Public transit 1,815,823 31.3 1,591,993
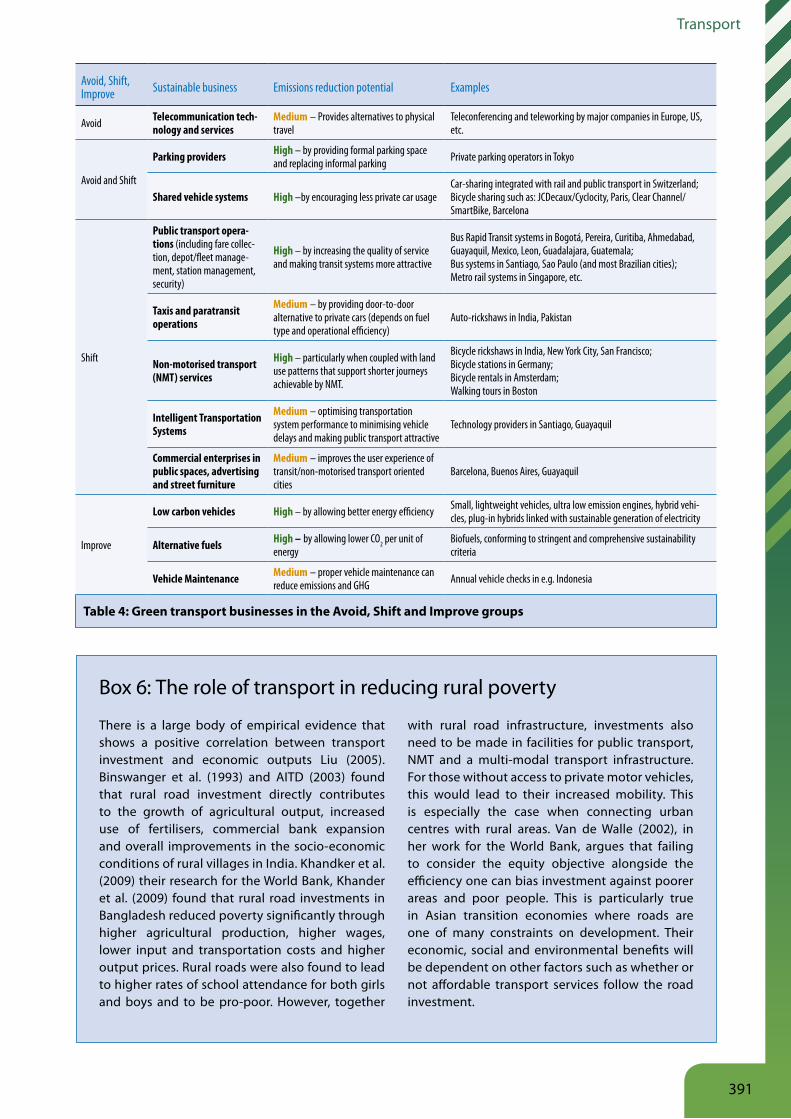
Box 5: Green transport as a businessThere are many revenue-generating oppor-tunities for the private sector to support or complement sustainable transportation systems and operations. These may take the form of public-private partnerships, concession contracts between a public agency and private entity, or a for-profit business providing a service or product directly to users. Table 4 lists such businesses in the context of the Avoid, Shift and Improve strategy for sustainable transport.
391
Transport
Table 4: Green transport businesses in the Avoid, Shift and Improve groups
Avoid, Shift, Improve Sustainable business Emissions reduction potential Examples
Avoid Telecommunication tech-nology and services
Medium – Provides alternatives to physical travel
Teleconferencing and teleworking by major companies in Europe, US, etc.
Avoid and Shift
Parking providers High – by providing formal parking space and replacing informal parking Private parking operators in Tokyo
Shared vehicle systems High –by encouraging less private car usageCar-sharing integrated with rail and public transport in Switzerland;Bicycle sharing such as: JCDecaux/Cyclocity, Paris, Clear Channel/SmartBike, Barcelona
Shift
Public transport opera-tions (including fare collec-tion, depot/fleet manage-ment, station management, security)
High – by increasing the quality of service and making transit systems more attractive
Bus Rapid Transit systems in Bogotá, Pereira, Curitiba, Ahmedabad, Guayaquil, Mexico, Leon, Guadalajara, Guatemala;Bus systems in Santiago, Sao Paulo (and most Brazilian cities);Metro rail systems in Singapore, etc.
Taxis and paratransit operations
Medium – by providing door-to-door alternative to private cars (depends on fuel type and operational efficiency)
Auto-rickshaws in India, Pakistan
Non-motorised transport (NMT) services
High – particularly when coupled with land use patterns that support shorter journeys achievable by NMT.
Bicycle rickshaws in India, New York City, San Francisco;Bicycle stations in Germany;Bicycle rentals in Amsterdam;Walking tours in Boston
Intelligent Transportation Systems
Medium – optimising transportation system performance to minimising vehicle delays and making public transport attractive
Technology providers in Santiago, Guayaquil
Commercial enterprises in public spaces, advertising and street furniture
Medium – improves the user experience of transit/non-motorised transport oriented cities
Barcelona, Buenos Aires, Guayaquil
Improve
Low carbon vehicles High – by allowing better energy efficiency Small, lightweight vehicles, ultra low emission engines, hybrid vehi-cles, plug-in hybrids linked with sustainable generation of electricity
Alternative fuels High – by allowing lower CO2 per unit of energy
Biofuels, conforming to stringent and comprehensive sustainability criteria
Vehicle Maintenance Medium – proper vehicle maintenance can reduce emissions and GHG Annual vehicle checks in e.g. Indonesia
Box 6: The role of transport in reducing rural poverty
There is a large body of empirical evidence that shows a positive correlation between transport investment and economic outputs Liu (2005). Binswanger et al. (1993) and AITD (2003) found that rural road investment directly contributes to the growth of agricultural output, increased use of fertilisers, commercial bank expansion and overall improvements in the socio-economic conditions of rural villages in India. Khandker et al. (2009) their research for the World Bank, Khander et al. (2009) found that rural road investments in Bangladesh reduced poverty significantly through higher agricultural production, higher wages, lower input and transportation costs and higher output prices. Rural roads were also found to lead to higher rates of school attendance for both girls and boys and to be pro-poor. However, together
with rural road infrastructure, investments also need to be made in facilities for public transport, NMT and a multi-modal transport infrastructure. For those without access to private motor vehicles, this would lead to their increased mobility. This is especially the case when connecting urban centres with rural areas. Van de Walle (2002), in her work for the World Bank, argues that failing to consider the equity objective alongside the efficiency one can bias investment against poorer areas and poor people. This is particularly true in Asian transition economies where roads are one of many constraints on development. Their economic, social and environmental benefits will be dependent on other factors such as whether or not affordable transport services follow the road investment.
392
Towards a green economy
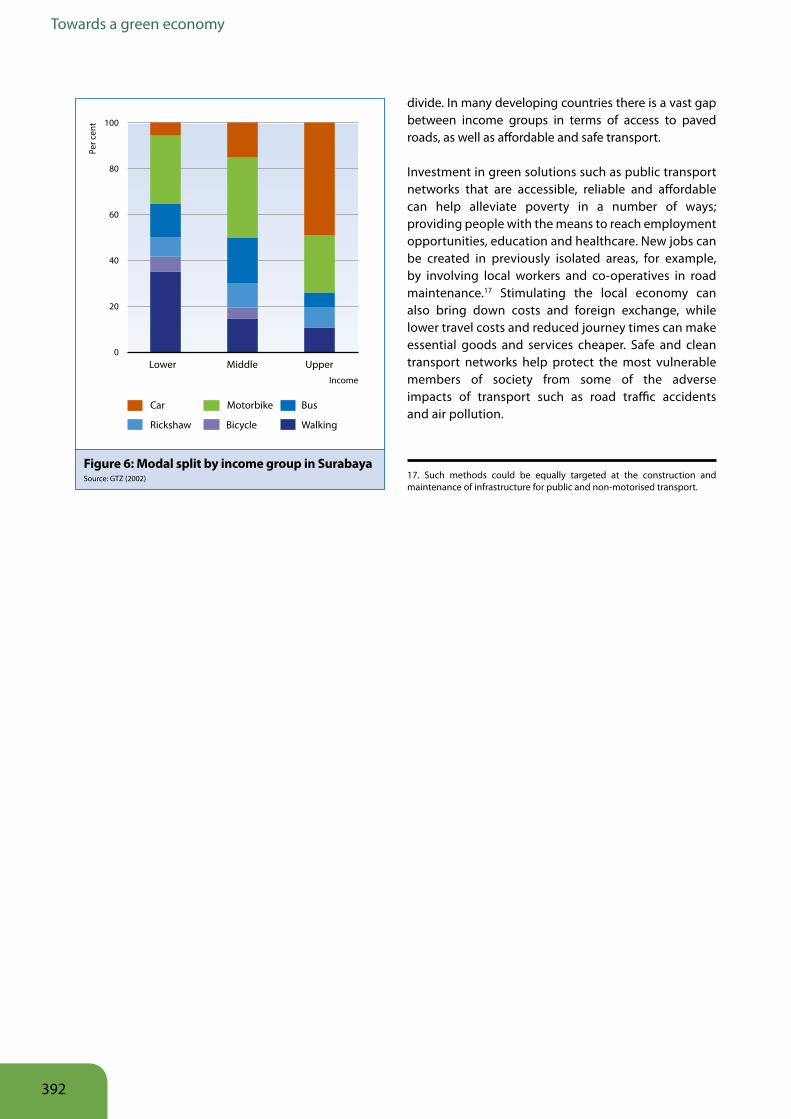
divide. In many developing countries there is a vast gap between income groups in terms of access to paved roads, as well as affordable and safe transport.
Investment in green solutions such as public transport networks that are accessible, reliable and affordable can help alleviate poverty in a number of ways; providing people with the means to reach employment opportunities, education and healthcare. New jobs can be created in previously isolated areas, for example, by involving local workers and co-operatives in road maintenance.17 Stimulating the local economy can also bring down costs and foreign exchange, while lower travel costs and reduced journey times can make essential goods and services cheaper. Safe and clean transport networks help protect the most vulnerable members of society from some of the adverse impacts of transport such as road traffic accidents and air pollution.
17. Such methods could be equally targeted at the construction and maintenance of infrastructure for public and non-motorised transport.
100
80
60
40
20
0
Per c
ent
Lower Middle UpperIncome
Car
Rickshaw Bicycle Walking
Motorbike Bus
Figure 6: Modal split by income group in Surabaya Source: GTZ (2002)
393
Transport
4 Quantifying the economic implications of green transport To quantitatively assess the macroeconomic implications of investing in green transport at the global level, the study applied a modelling approach utilising the Millennium Institute’s T21 model.18 Within the multi-sector green investment scenario in which 2 per cent of the global GDP is allocated for investment in greening a large number of sectors, transport was assumed to receive 17 per cent of the total.
This section describes the differences between investing the assumed additional amount in green transport and in the business-as-usual-scenario (BAU), including their macro-level implications up to the year 2050. Due to the scarcity of studies that employ the same modelling technique, the outcomes are to be interpreted as indicative of the direction of change that can be expected with green investment, and should be validated through further work. The figures should be assessed together with projections made by other models such as the IEA’s Mobility Model, to which comparisons are made in this section.
4 1 Transport trends under business as usual
Under BAU without additional investment, the total number of road vehicles19 increases rapidly. The stock of light-duty vehicles (LDVs) in particular would grow from the current 0.8 billion to 2.2 billion by 2050.20 In line with the future growth in total vehicle stock, travel volume would increase for both passenger and freight transport. In the year 2050, passenger transport would reach 103 trillion passengers per kilometre (pkm), whereas freight transport would be approximately 38 trillion tonnes per kilometre (tkm). Compared with baseline figures from IEA, these figures are higher,
18. The information contained within this section draws from modelling work conducted by the Millennium Institute (MI). Whilst every effort has been taken to accurately integrate the modelling results throughout the entire report, there may be certain figures which are subject to further refinement or corrections, based on the larger modelling process and changes in other sectors. Note also that the modelling process has been limited by the relative lack of standardised evidence and data, for example assumptions on employment in the transport sector, harmonised information on transport activity by city, region and country, standardised figures on transport externalities and the interrelationships between modes and sectors.
19. Includes both urban and non-urban, freight and passenger.
20. Others predict that this growth could even be higher. For example, IEA predicts the number of LDVs to reach 2.7 billion by 2050.
especially for freight where IEA predicts only 13 trillion tkm in the same year.
In BAU, for passenger transport LDVs would continue to dominate all transport modes with an increasing share (47 per cent in 2010 rising to 62 per cent in 2050) of the passenger travel load over the period, while the share of buses would decline from 25 per cent to 15 per cent.21 A steady share of the passenger travel load (6-7 per cent) is expected to be by rail, and around 10 per cent by aviation. For freight transport, the volume carried by rail would decline from 55 per cent in 2010 to 52 per cent in 2050, contrasted with an increase in road-based transport (trucks).22
With regards to energy use and carbon emissions, both are projected to increase by nearly 50 per cent by 2030 and more than 80 per cent by 2050 in the BAU case. The modes that will contribute most to emissions in 2050 are LDVs (56 per cent), trucks (16 per cent) and aviation (18 per cent). By 2050 the CO2 emissions of the transport sector would have increased to one fourth of global energy related CO2 emissions.
In the BAU case, total employment in the transport sector, which is 67.9 million in 2009, will continue to grow by 1.3 per cent per year on average through to 2050 and reach approximately 116 million.23
4 2 The Avoid, Shift and Improve strategy as a basis for redirecting investments
The transport sector will see massive investments in the coming decades, mainly through city planning, infrastructural works, public transport systems and
21. Of all passenger transport, IEA estimated, in terms of passenger-km per year (different from the measure in this model), 7 per cent to 6 per cent by rail, from 10 per cent in 2010 to 15 per cent in 2050 by air, and the remainder by road transport modes, in which 45-56 per cent of all passengers are carried by LDVs. Within road passenger transport, for which IEA reported total travel distance in km traveled by all road vehicles per year (same measure as in the model), LDVs account for 67-78 per cent of road passenger travel volume in 2010-2050.
22. The International Energy Agency (IEA) estimates the percentage of freight transport load, in terms of tonne-km per year, that is carried by road vehicles increases from 55 per cent in 2000 to 59 per cent in 2050.
23. These figures exclude the large level of informal labour in the transport sector (for example, the maintenance of vehicles, operation of micro buses in developing countries), which were not able to be estimated due to data restrictions. Such forms of employment may also benefit from the shift in investments towards a green scenario.
394
Towards a green economy
procurement of transport vehicles. IEA (2010) predicts that under BAU by 2050 the world will spend another US$ 150 trillion on motor vehicles24. There will be an investment of another US$ 100 trillion in other types of transport vehicles (trucks, ships, aircraft, etc.) and US$ 150 trillion in fuels.
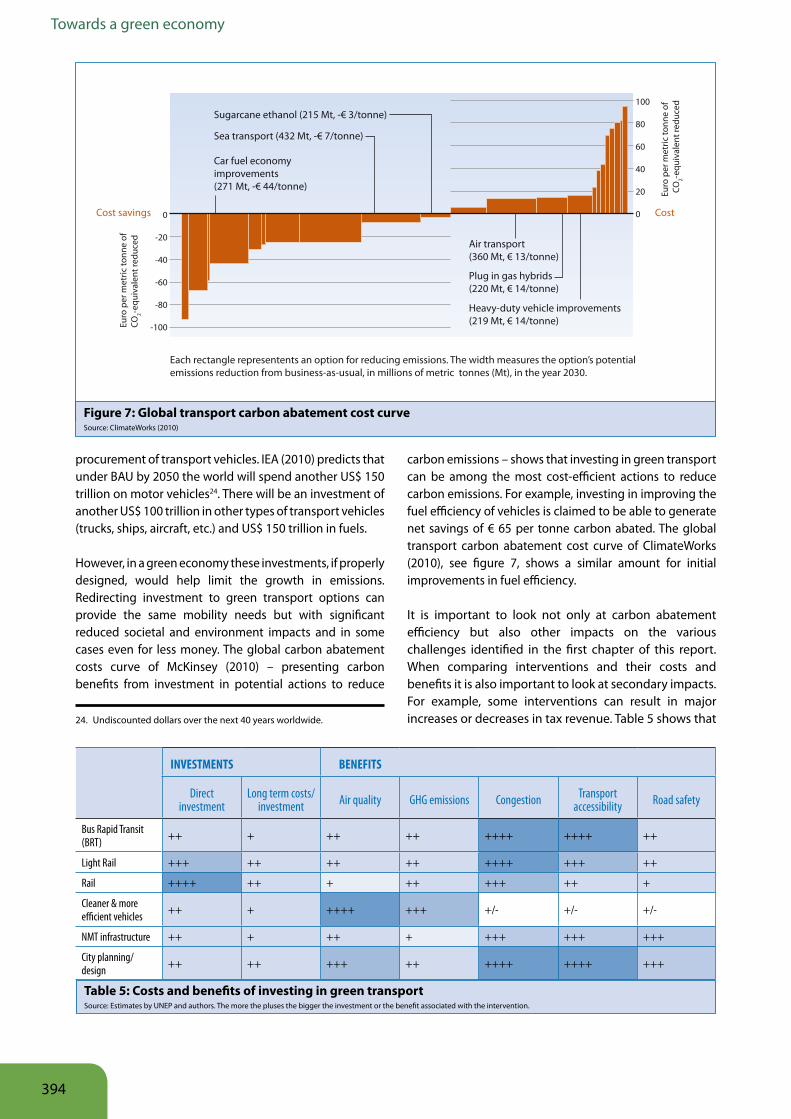
However, in a green economy these investments, if properly designed, would help limit the growth in emissions. Redirecting investment to green transport options can provide the same mobility needs but with significant reduced societal and environment impacts and in some cases even for less money. The global carbon abatement costs curve of McKinsey (2010) – presenting carbon benefits from investment in potential actions to reduce
24. Undiscounted dollars over the next 40 years worldwide.
carbon emissions – shows that investing in green transport can be among the most cost-efficient actions to reduce carbon emissions. For example, investing in improving the fuel efficiency of vehicles is claimed to be able to generate net savings of € 65 per tonne carbon abated. The global transport carbon abatement cost curve of ClimateWorks (2010), see figure 7, shows a similar amount for initial improvements in fuel efficiency.
It is important to look not only at carbon abatement efficiency but also other impacts on the various challenges identified in the first chapter of this report. When comparing interventions and their costs and benefits it is also important to look at secondary impacts. For example, some interventions can result in major increases or decreases in tax revenue. Table 5 shows that
Cost savings Cost0
-20
-40
-60
-80
-100
100
80
60
40
20
0
Car fuel economy improvements (271 Mt, -€ 44/tonne)
Sugarcane ethanol (215 Mt, -€ 3/tonne)
Air transport (360 Mt, € 13/tonne)
Plug in gas hybrids (220 Mt, € 14/tonne)
Heavy-duty vehicle improvements (219 Mt, € 14/tonne)
Sea transport (432 Mt, -€ 7/tonne)Eu
ro p
er m
etric
tonn
e of
CO
2-equ
ival
ent r
educ
ed
Euro
per
met
ric to
nne
of
CO2-e
quiv
alen
t red
uced
Each rectangle representents an option for reducing emissions. The width measures the option’s potential emissions reduction from business-as-usual, in millions of metric tonnes (Mt), in the year 2030.
Figure 7: Global transport carbon abatement cost curve Source: ClimateWorks (2010)
Table 5: Costs and benefits of investing in green transport Source: Estimates by UNEP and authors. The more the pluses the bigger the investment or the benefit associated with the intervention.
INVESTMENTS BENEFITS
Direct investment
Long term costs/ investment Air quality GHG emissions Congestion Transport
accessibility Road safety
Bus Rapid Transit (BRT) ++ + ++ ++ ++++ ++++ ++
Light Rail +++ ++ ++ ++ ++++ +++ ++
Rail ++++ ++ + ++ +++ ++ +
Cleaner & more efficient vehicles ++ + ++++ +++ +/- +/- +/-
NMT infrastructure ++ + ++ + +++ +++ +++
City planning/ design ++ ++ +++ ++ ++++ ++++ +++
395
Transport
while some transport interventions are cost effective ways to reduce carbon emissions, others are more effective in increasing accessibility or decreasing congestion.
While there are differing views on the role that biofuels can play in reducing GHG emissions in the transport sector, its use has been rapidly increasing over the past years. Much of this development has been triggered by mandates for blending biofuels into vehicle fuels, enacted in at least 41 states/provinces and 24 countries at the national level. Ethanol, made primarily from corn and sugar cane, and biodiesel, produced primarily from oil seeds such as rapseed and oil palm seeds, are currently the key biofuels for transport. Most mandates require blending 10-15 per cent ethanol with gasoline or blending 2-5 per cent biodiesel with diesel fuel. Standards comprehensively addressing environmental and social concerns raised in the context of production of biofuels should be applied to ensure sustainability.
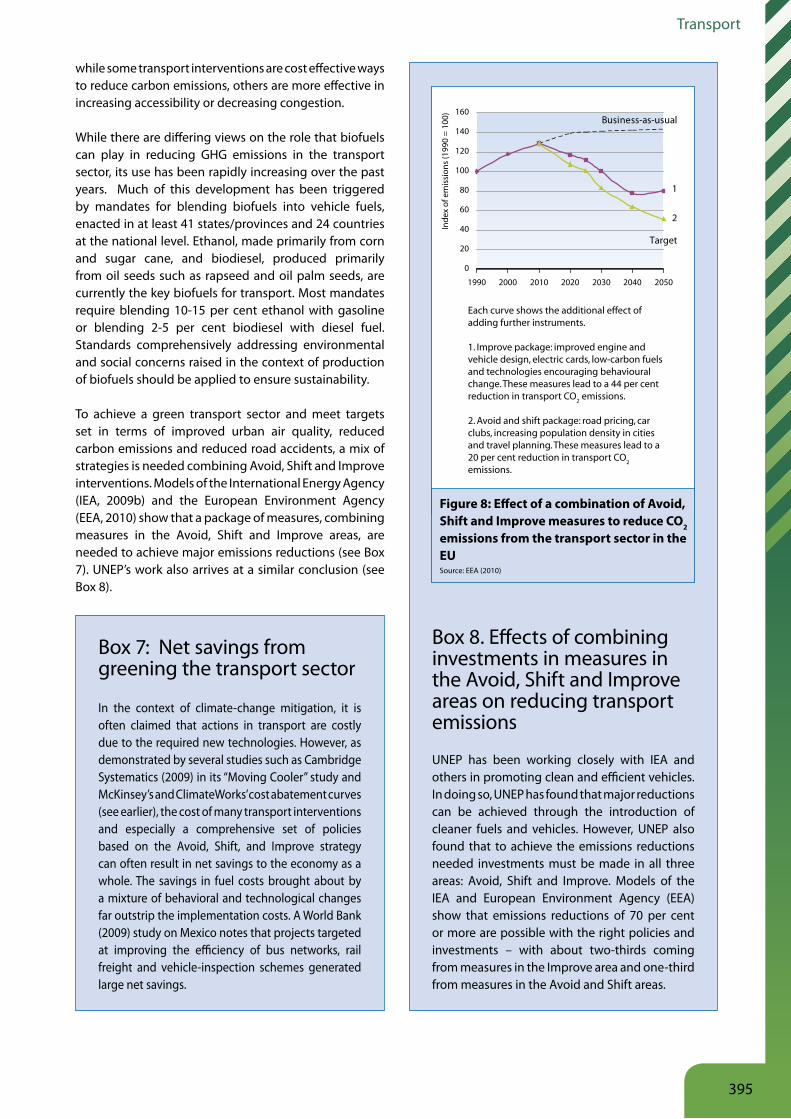
To achieve a green transport sector and meet targets set in terms of improved urban air quality, reduced carbon emissions and reduced road accidents, a mix of strategies is needed combining Avoid, Shift and Improve interventions. Models of the International Energy Agency (IEA, 2009b) and the European Environment Agency (EEA, 2010) show that a package of measures, combining measures in the Avoid, Shift and Improve areas, are needed to achieve major emissions reductions (see Box 7). UNEP’s work also arrives at a similar conclusion (see Box 8).
Box 7: Net savings from greening the transport sector
In the context of climate-change mitigation, it is often claimed that actions in transport are costly due to the required new technologies. However, as demonstrated by several studies such as Cambridge Systematics (2009) in its “Moving Cooler” study and McKinsey’s and ClimateWorks’ cost abatement curves (see earlier), the cost of many transport interventions and especially a comprehensive set of policies based on the Avoid, Shift, and Improve strategy can often result in net savings to the economy as a whole. The savings in fuel costs brought about by a mixture of behavioral and technological changes far outstrip the implementation costs. A World Bank (2009) study on Mexico notes that projects targeted at improving the efficiency of bus networks, rail freight and vehicle-inspection schemes generated large net savings.
Box 8. Effects of combining investments in measures in the Avoid, Shift and Improve areas on reducing transport emissions
UNEP has been working closely with IEA and others in promoting clean and efficient vehicles. In doing so, UNEP has found that major reductions can be achieved through the introduction of cleaner fuels and vehicles. However, UNEP also found that to achieve the emissions reductions needed investments must be made in all three areas: Avoid, Shift and Improve. Models of the IEA and European Environment Agency (EEA) show that emissions reductions of 70 per cent or more are possible with the right policies and investments – with about two-thirds coming from measures in the Improve area and one-third from measures in the Avoid and Shift areas.
0
20
40
60
80
100
120
140
160
Inde
x of
em
issi
ons
(199
0 =
100)
1990 2000 2010 2020 2030 2040 2050
Business-as-usual
1
2
Target
Each curve shows the additional effect of adding further instruments.
1. Improve package: improved engine and vehicle design, electric cards, low-carbon fuels and technologies encouraging behavioural change. These measures lead to a 44 per cent reduction in transport CO
2 emissions.
2. Avoid and shift package: road pricing, car clubs, increasing population density in cities and travel planning. These measures lead to a 20 per cent reduction in transport CO
2
emissions.
Figure 8: Effect of a combination of Avoid, Shift and Improve measures to reduce CO2 emissions from the transport sector in the EU Source: EEA (2010)
396
Towards a green economy
4 3 Investing in green transport
Inputs and assumptionsThe green investment scenario (G2) assumes US$ 419 billion in constant US$ 2010 invested per year over the next 40 year period into:
■ Expanding the public transport infrastructure (promoting modal share to bus and rail transport); and
■ Increasing the efficiency of road vehicles.
With respect to public transport infrastructure, investments are made to reduce LDV (cars) and air travel and increase bus and rail travel volume, promoting a modal shift to less carbon intensive forms of transport. An annual investment of around US$ 24 billion is allocated to transport infrastructure over the 40 year period.
With respect to energy efficiency improvement, around US$ 384 billion is assumed to be invested in more efficient vehicles on average each year between 2011 and 2050. Note that the investments assumed in the model for measures under the Avoid, Shift and Improve strategies are in line with the EEA and IEA green transport investment scenarios discussed earlier.
Furthermore, to represent future changes in travel needs under the green scenarios, a 25 per cent avoidance of total transport volume is initially assumed, in accordance with IEA’s outlook on total travel volume.25 This reduction is assumed to happen at no cost as a result of changing needs and behaviour motivated by the various enabling conditions such as better city planning, more e-working, strict regulations, etc. Note that the above assumptions on investment and behavioural changes directly mirror the Avoid, Shift and Improve paradigm set out in Section 2.2. These are shown to impact on the transport modal split, energy consumption, energy-related emissions, and employment as discussed below.
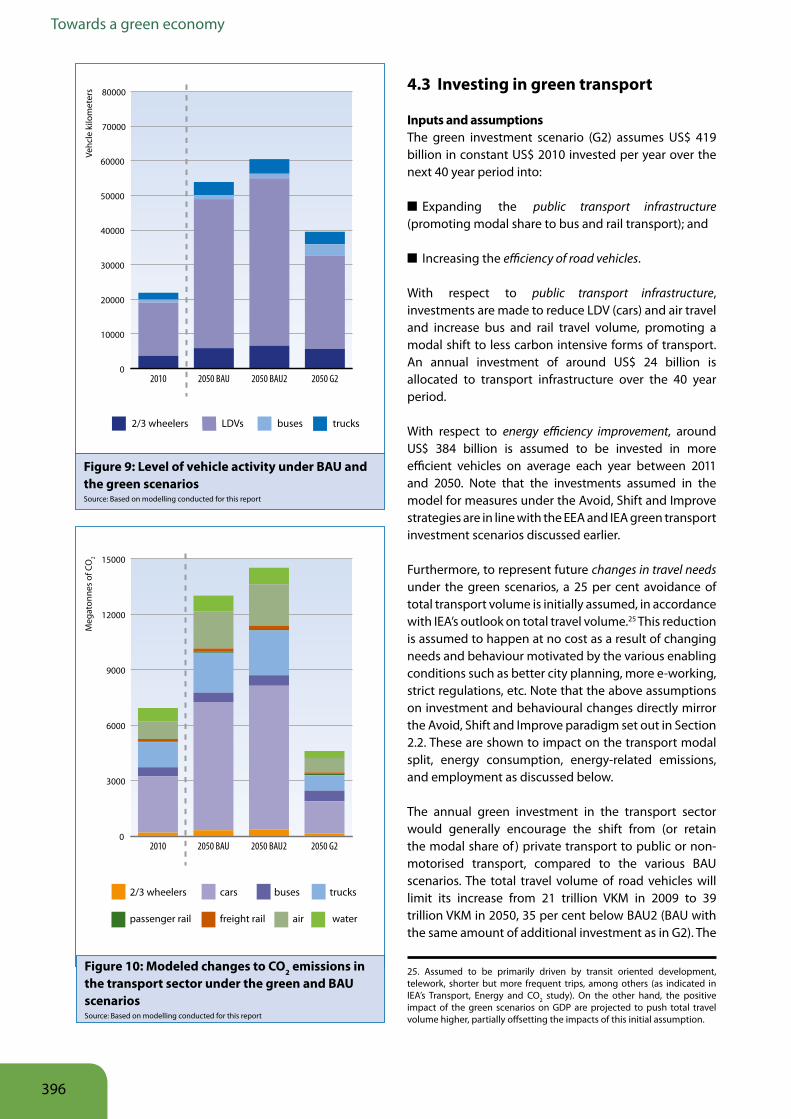
The annual green investment in the transport sector would generally encourage the shift from (or retain the modal share of ) private transport to public or non-motorised transport, compared to the various BAU scenarios. The total travel volume of road vehicles will limit its increase from 21 trillion VKM in 2009 to 39 trillion VKM in 2050, 35 per cent below BAU2 (BAU with the same amount of additional investment as in G2). The
25. Assumed to be primarily driven by transit oriented development, telework, shorter but more frequent trips, among others (as indicated in IEA’s Transport, Energy and CO2 study). On the other hand, the positive impact of the green scenarios on GDP are projected to push total travel volume higher, partially offsetting the impacts of this initial assumption.
0
10000
20000
30000
40000
50000
60000
70000
80000
trucksbusesLDVs2/3 wheelers
2050 G22050 BAU22050 BAU2010
Vehc
le k
ilom
eter
s
0
3000
6000
9000
12000
15000
waterairfreight railpassenger rail
trucksbusescars2/3 wheelers
2050 G22050 BAU22050 BAU2010
Meg
aton
nes
of C
O2
Figure 9: Level of vehicle activity under BAU and the green scenariosSource: Based on modelling conducted for this report
Figure 10: Modeled changes to CO2 emissions in the transport sector under the green and BAU scenariosSource: Based on modelling conducted for this report
397
Transport
figure below shows the level of road transport activity (in vehicle kilometres) under various BAU scenarios as well as the green investment scenario.
In terms of modal split, the green investment scenario assumes a fall in the share of passenger kilometres by car in 2050 from 62 per cent (BAU2) to 33 per cent26. For freight, rail retains a relatively large share of 52 per cent of the transport volume (tkm).
The total energy consumption of the transport sector will be limited to 2.2 thousand million tonnes of oil equivalent (Mtoe) in 2050 in green investment scenario. About 874 Mtoe are satisfied by biofuels,27 limiting oil-based fuels to 1,251 Mtoe in 2050, 81 per cent lower than BAU2. Considerable energy savings come from the switch to public transport as the increase in emissions by buses and electrified rail are much smaller than the avoided emissions from LDVs.
ResultsAs a result of these investments, carbon emissions are reduced radically, by 8.4 Gt of CO2, or 68 per cent relative to BAU2 in 2050. The green investment scenario corresponds roughly to the level of emissions modelled by IEA in their low carbon (BLUE Map) scenario, which combines incremental improvements in fuel efficiency of conventional engines, a 20-fold increase in biofuels and uptake of new vehicles such as hybrids and fuel cell vehicles. In the BLUE Map scenario, IEA estimates
26. This figure heavily depends on the assumptions that are used on the effectiveness of measures to avoid the need for travel, as well as to what extent the demand shifts towards public and non-motorised transport.
27. Care needs to be taken to ensure that the biofuels used comply strictly with sustainability criteria that cover the different environmental and social concerns including food prices.
$20 trillion additional investments in vehicles (for more efficient vehicles including electric vehicles) but about a similar, US$ 20 trillion, savings in fuel costs due to increased fuel efficiency28 (IEA 2009b). Therefore, a major global carbon reduction can be achieved without any cost (but would need investment policies that would promote investment in cleaner and more efficient vehicles).
Total employment in the transport sector will remain substantial, with large growth in public transport modes such as passenger rail. Overall employment in the transport sector in 2050 is modeled to be higher in the green scenario compared to BAU2, by roughly 10 per cent. Jobs related to cars (including production and maintenance) will also grow, albeit less rapidly compared with BAU2 owing to the lower levels of car ownership under the green scenario.29 As a result of the large reductions in carbon emissions, together with continued strong growth in transport employment, the carbon intensity of each transport job is reduced by around 70 per cent compared with BAU2, reflecting the decoupling of transport emissions from economic growth, and the greening of jobs in this sector.30
28. 2008 as a base year.
29. Note: Reliable job estimates on maintenance of cars could not be found and have not been included explicitly in the modelling. Concerning public transport, management and operation job numbers were calculated based on EU data (excluding France and Germany which have disproportionately high levels of employment in this subsector) to estimate employment at the world level.
30. The approach taken in this chapter to quantify the greenness of jobs may help inform existing and future definitions of green jobs – for example those from the International Labour Organization (ILO). Further refinement and coordination of approaches in this aspect would prove beneficial in better quantifying and monitoring the transition towards a green economy.
398
Towards a green economy
5 Enabling conditionsEnabling conditions are background conditions in the investment and political environment that collectively allow the transition to a green economy. They will assist the implementation of the green investments identified for the transport sector, particularly if efforts are taken to ensure a harmonised and integrated approach that facilitates best available policies and technologies across the world. Below, we explore the key enabling conditions for green transport, namely:
■ Designing appropriate regulation, planning and information provision;
■ Setting the right financial conditions and economic incentives;
■ Ensuring technology transfer and access; and
■ Strengthening institutions and capacity.
Transport is a complex sector, which is shaped over a long period of time, and by various external sectors and factors (EEA 2008). Therefore, a combination of strategic approaches and policy instruments is required to green the transport sector. An inventory of policy instruments for environmentally sustainable transport and extensive discussion of their possible use in selected countries may be found in (OECD 2002).
5 1 Designing appropriate regulation, planning and information provision
A wide range of policies could support the Avoid, Shift and Improve strategies for green transport, namely:
■ Planning – can reduce the need or distance to travel by bringing closer together the people and the activities that they need to access. It can enable the implementation, and increase the attractiveness of new green transport infrastructure, including for public transport, cycling and walking;
■ Regulation – can be used to restrict the use of certain motorised vehicles but can also influence the types of vehicles used and the standards that they should adhere to (both in terms of vehicle performance and road regulations);
■ Information – can increase peoples’ awareness of alternative means of transport, leading to a modal shift. Information can also be provided to improve driver behaviour and reduce fuel consumption; and
■ Economic Instruments – can provide incentives to change behaviour regarding choice of: vehicle type, fuel, type and timing of travel mode, etc. (see 5.2 for details).
Examples are provided in Table 6. Combining these individual policies is imperative to increasing their effectiveness. For example, restrictions on parking (or high fees) push users away from cars, whilst planning for public transport pulls them towards green transport.
Details of how these policies can enable green transport are provided in the sections below.
Planning Planning is essential in realising sustainable development. Good planning on all levels (urban, regional, and national) is a prerequisite for green transport, as land use often determines patterns of transport for many years (see the Cities chapter).
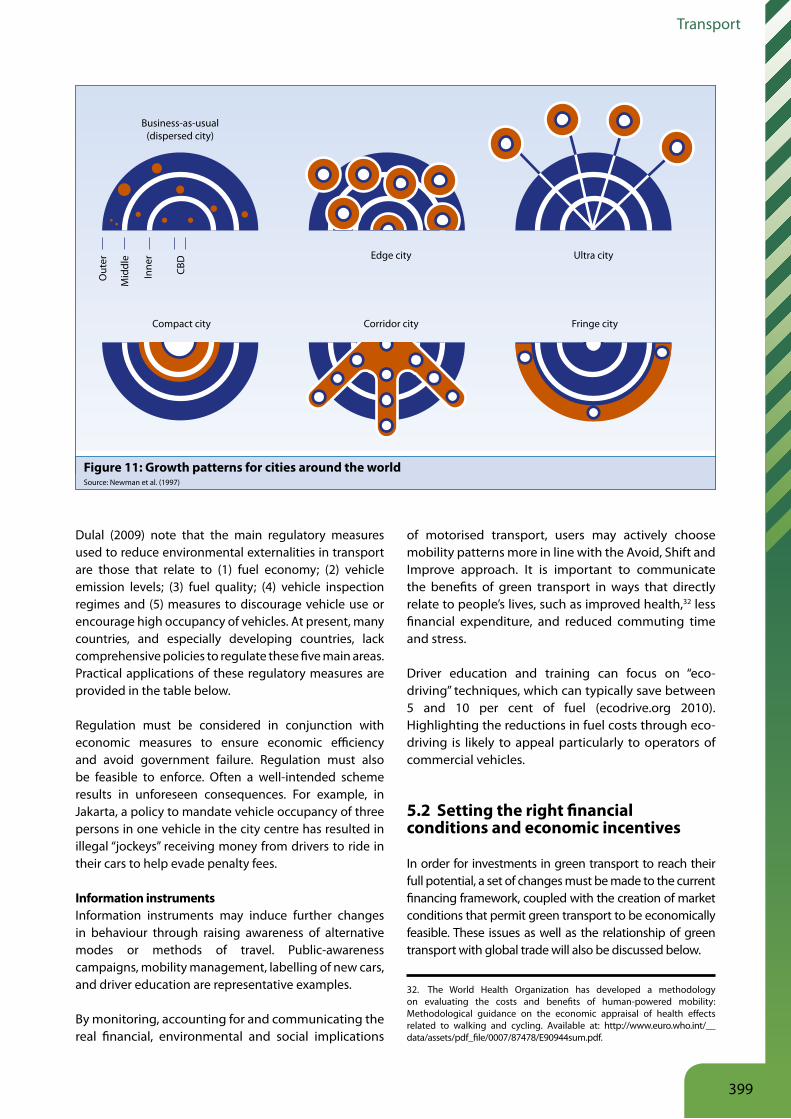
Planners have investigated and postulated growth patterns for cities over the years. Six of the most common forms of city evolution or current growth patterns are outlined in Figure 11. The “compact city”, which accommodates increases in population through densification of the city centre and the “corridor city”, which is synonymous with transit-oriented development are thought to be the most sustainable spatial approaches. The mid-sized city of Freiburg, Germany is a good example of the former, whereas Tokyo, Japan is a good example of the latter. Efforts have been made in many developing countries to build cities suited to public transport and non-motorised transport,31 and Aguascalientes, Mexico is a good example (Embarq, no date). On the other hand, the “fringe city” based on suburban sprawl is synonymous with a heavily private car-dependent society, a result of a traditional, sectoral-based, planning approach.
Regulatory instrumentsOwing to the inelastic nature of transport demand, economic signals such as the price of fuel are often insufficient on their own to trigger a large shift in behaviour for both consumers and industry. Regulatory instruments therefore play a large role in creating additional incentives to enable change. Timilsina and
31. The potential for land use and urban planning to shape long-term transport patterns is higher in developing countries, where cities are still emerging and have not yet locked themselves into a car-dominated society. To incorporate the increasing population brought by the trend towards urbanisation, cities in developing countries can set clear physical boundaries to define the outer perimeter of the city, promote mixed land use, and (if needed) develop new land around public transport corridors.
399
Transport
Dulal (2009) note that the main regulatory measures used to reduce environmental externalities in transport are those that relate to (1) fuel economy; (2) vehicle emission levels; (3) fuel quality; (4) vehicle inspection regimes and (5) measures to discourage vehicle use or encourage high occupancy of vehicles. At present, many countries, and especially developing countries, lack comprehensive policies to regulate these five main areas. Practical applications of these regulatory measures are provided in the table below.
Regulation must be considered in conjunction with economic measures to ensure economic efficiency and avoid government failure. Regulation must also be feasible to enforce. Often a well-intended scheme results in unforeseen consequences. For example, in Jakarta, a policy to mandate vehicle occupancy of three persons in one vehicle in the city centre has resulted in illegal “jockeys” receiving money from drivers to ride in their cars to help evade penalty fees.
Information instrumentsInformation instruments may induce further changes in behaviour through raising awareness of alternative modes or methods of travel. Public-awareness campaigns, mobility management, labelling of new cars, and driver education are representative examples.
By monitoring, accounting for and communicating the real financial, environmental and social implications
of motorised transport, users may actively choose mobility patterns more in line with the Avoid, Shift and Improve approach. It is important to communicate the benefits of green transport in ways that directly relate to people’s lives, such as improved health,32 less financial expenditure, and reduced commuting time and stress.
Driver education and training can focus on “eco-driving” techniques, which can typically save between 5 and 10 per cent of fuel (ecodrive.org 2010). Highlighting the reductions in fuel costs through eco-driving is likely to appeal particularly to operators of commercial vehicles.
5 2 Setting the right financial conditions and economic incentives
In order for investments in green transport to reach their full potential, a set of changes must be made to the current financing framework, coupled with the creation of market conditions that permit green transport to be economically feasible. These issues as well as the relationship of green transport with global trade will also be discussed below.
32. The World Health Organization has developed a methodology on evaluating the costs and benefits of human-powered mobility: Methodological guidance on the economic appraisal of health effects related to walking and cycling. Available at: http://www.euro.who.int/__data/assets/pdf_file/0007/87478/E90944sum.pdf.
Business-as-usual(dispersed city)
Edge city
Compact city Corridor city Fringe city
Ultra city
Out
er
Mid
dle
Inne
r
CBD
Figure 11: Growth patterns for cities around the world Source: Newman et al. (1997)
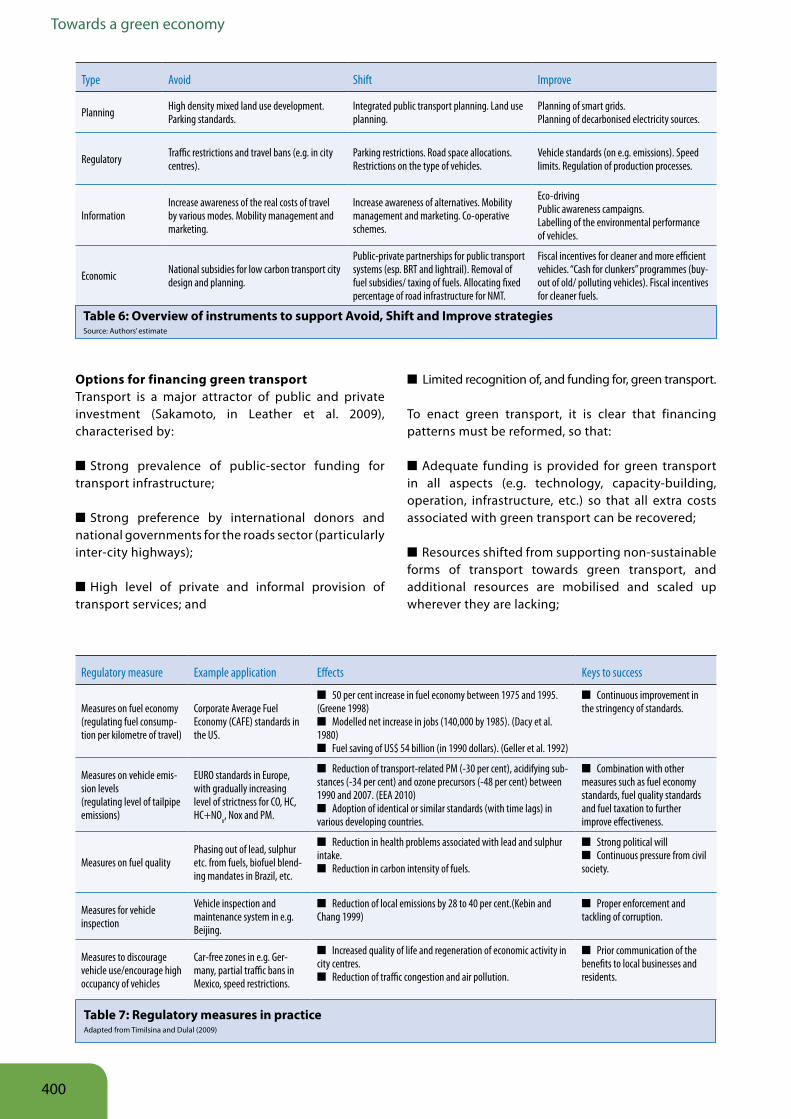
400
Towards a green economy
Table 6: Overview of instruments to support Avoid, Shift and Improve strategiesSource: Authors’ estimate
Table 7: Regulatory measures in practice Adapted from Timilsina and Dulal (2009)
Regulatory measure Example application Effects Keys to success
Measures on fuel economy (regulating fuel consump-tion per kilometre of travel)
Corporate Average Fuel Economy (CAFE) standards in the US.
■ 50 per cent increase in fuel economy between 1975 and 1995. (Greene 1998)
■ Modelled net increase in jobs (140,000 by 1985). (Dacy et al. 1980)
■ Fuel saving of US$ 54 billion (in 1990 dollars). (Geller et al. 1992)
■ Continuous improvement in the stringency of standards.
Measures on vehicle emis-sion levels (regulating level of tailpipe emissions)
EURO standards in Europe, with gradually increasing level of strictness for CO, HC, HC+NOx, Nox and PM.
■ Reduction of transport-related PM (-30 per cent), acidifying sub-stances (-34 per cent) and ozone precursors (-48 per cent) between 1990 and 2007. (EEA 2010)
■ Adoption of identical or similar standards (with time lags) in various developing countries.
■ Combination with other measures such as fuel economy standards, fuel quality standards and fuel taxation to further improve effectiveness.
Measures on fuel quality Phasing out of lead, sulphur etc. from fuels, biofuel blend-ing mandates in Brazil, etc.
■ Reduction in health problems associated with lead and sulphur intake.
■ Reduction in carbon intensity of fuels.
■ Strong political will ■ Continuous pressure from civil
society.
Measures for vehicle inspection
Vehicle inspection and maintenance system in e.g. Beijing.
■ Reduction of local emissions by 28 to 40 per cent.(Kebin and Chang 1999)
■ Proper enforcement and tackling of corruption.
Measures to discourage vehicle use/encourage high occupancy of vehicles
Car-free zones in e.g. Ger-many, partial traffic bans in Mexico, speed restrictions.
■ Increased quality of life and regeneration of economic activity in city centres.
■ Reduction of traffic congestion and air pollution.
■ Prior communication of the benefits to local businesses and residents.
Type Avoid Shift Improve
Planning High density mixed land use development. Parking standards.
Integrated public transport planning. Land use planning.
Planning of smart grids.Planning of decarbonised electricity sources.
Regulatory Traffic restrictions and travel bans (e.g. in city centres).
Parking restrictions. Road space allocations. Restrictions on the type of vehicles.
Vehicle standards (on e.g. emissions). Speed limits. Regulation of production processes.
Information Increase awareness of the real costs of travel by various modes. Mobility management and marketing.
Increase awareness of alternatives. Mobility management and marketing. Co-operative schemes.
Eco-drivingPublic awareness campaigns.Labelling of the environmental performance of vehicles.
Economic National subsidies for low carbon transport city design and planning.
Public-private partnerships for public transport systems (esp. BRT and lightrail). Removal of fuel subsidies/ taxing of fuels. Allocating fixed percentage of road infrastructure for NMT.
Fiscal incentives for cleaner and more efficient vehicles. “Cash for clunkers” programmes (buy-out of old/ polluting vehicles). Fiscal incentives for cleaner fuels.
Options for financing green transportTransport is a major attractor of public and private investment (Sakamoto, in Leather et al. 2009), characterised by:
■ Strong prevalence of public-sector funding for tran sport infrastructure;
■ Strong preference by international donors and national governments for the roads sector (particularly inter-city highways);
■ High level of private and informal provision of transport services; and
■ Limited recognition of, and funding for, green tran sport.
To enact green transport, it is clear that financing patterns must be reformed, so that:
■ Adequate funding is provided for green transport in all aspects (e.g. technology, capacity-building, operation, infrastructure, etc.) so that all extra costs associated with green transport can be recovered;
■ Resources shifted from supporting non-sustainable forms of transport towards green transport, and additional resources are mobilised and scaled up wherever they are lacking;
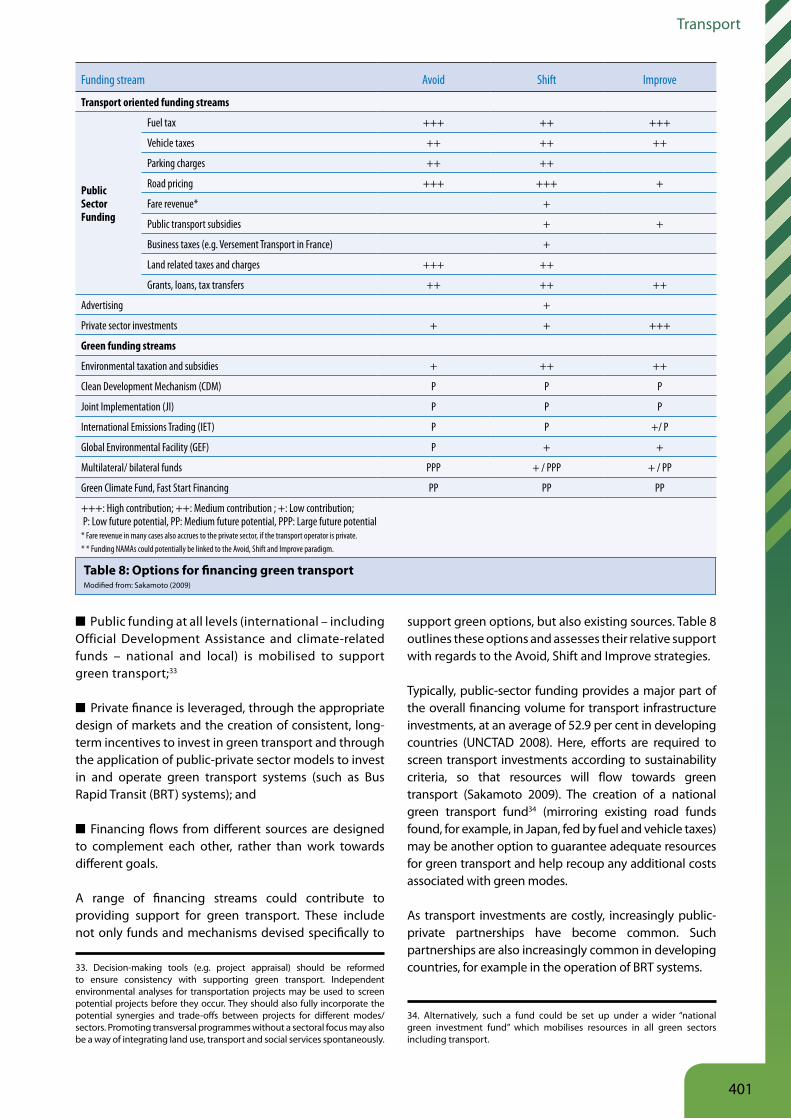
401
Transport
■ Public funding at all levels (international – including Official Development Assistance and climate-related funds – national and local) is mobilised to support green transport;33
■ Private finance is leveraged, through the appropriate design of markets and the creation of consistent, long-term incentives to invest in green transport and through the application of public-private sector models to invest in and operate green transport systems (such as Bus Rapid Transit (BRT) systems); and
■ Financing flows from different sources are designed to complement each other, rather than work towards different goals.
A range of financing streams could contribute to providing support for green transport. These include not only funds and mechanisms devised specifically to
33. Decision-making tools (e.g. project appraisal) should be reformed to ensure consistency with supporting green transport. Independent environmental analyses for transportation projects may be used to screen potential projects before they occur. They should also fully incorporate the potential synergies and trade-offs between projects for different modes/sectors. Promoting transversal programmes without a sectoral focus may also be a way of integrating land use, transport and social services spontaneously.
support green options, but also existing sources. Table 8 outlines these options and assesses their relative support with regards to the Avoid, Shift and Improve strategies.
Typically, public-sector funding provides a major part of the overall financing volume for transport infrastructure investments, at an average of 52.9 per cent in developing countries (UNCTAD 2008). Here, efforts are required to screen transport investments according to sustainability criteria, so that resources will flow towards green transport (Sakamoto 2009). The creation of a national green transport fund34 (mirroring existing road funds found, for example, in Japan, fed by fuel and vehicle taxes) may be another option to guarantee adequate resources for green transport and help recoup any additional costs associated with green modes.
As transport investments are costly, increasingly public-private partnerships have become common. Such partnerships are also increasingly common in developing countries, for example in the operation of BRT systems.
34. Alternatively, such a fund could be set up under a wider “national green investment fund” which mobilises resources in all green sectors including transport.
Table 8: Options for financing green transportModified from: Sakamoto (2009)
Funding stream Avoid Shift Improve
Transport oriented funding streams
PublicSectorFunding
Fuel tax +++ ++ +++
Vehicle taxes ++ ++ ++
Parking charges ++ ++
Road pricing +++ +++ +
Fare revenue* +
Public transport subsidies + +
Business taxes (e.g. Versement Transport in France) +
Land related taxes and charges +++ ++
Grants, loans, tax transfers ++ ++ ++
Advertising +
Private sector investments + + +++
Green funding streams
Environmental taxation and subsidies + ++ ++
Clean Development Mechanism (CDM) P P P
Joint Implementation (JI) P P P
International Emissions Trading (IET) P P +/ P
Global Environmental Facility (GEF) P + +
Multilateral/ bilateral funds PPP + / PPP + / PP
Green Climate Fund, Fast Start Financing PP PP PP
+++: High contribution; ++: Medium contribution ; +: Low contribution; P: Low future potential, PP: Medium future potential, PPP: Large future potential* Fare revenue in many cases also accrues to the private sector, if the transport operator is private.* * Funding NAMAs could potentially be linked to the Avoid, Shift and Improve paradigm.
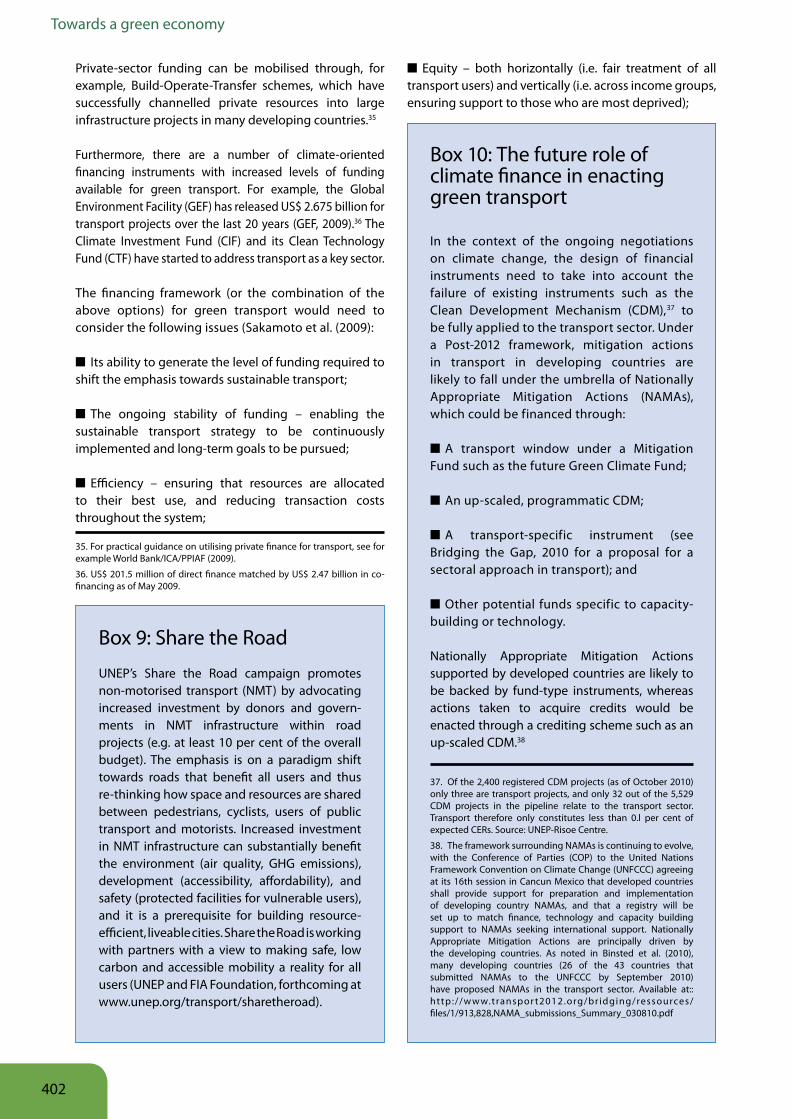
402
Towards a green economy
Private-sector funding can be mobilised through, for example, Build-Operate-Transfer schemes, which have successfully channelled private resources into large infrastructure projects in many developing countries.35
Furthermore, there are a number of climate-oriented financing instruments with increased levels of funding available for green transport. For example, the Global Environment Facility (GEF) has released US$ 2.675 billion for transport projects over the last 20 years (GEF, 2009).36 The Climate Investment Fund (CIF) and its Clean Technology Fund (CTF) have started to address transport as a key sector.
The financing framework (or the combination of the above options) for green transport would need to consider the following issues (Sakamoto et al. (2009):
■ Its ability to generate the level of funding required to shift the emphasis towards sustainable transport;
■ The ongoing stability of funding – enabling the sustainable transport strategy to be continuously implemented and long-term goals to be pursued;
■ Efficiency – ensuring that resources are allocated to their best use, and reducing transaction costs throughout the system;
35. For practical guidance on utilising private finance for transport, see for example World Bank/ICA/PPIAF (2009).
36. US$ 201.5 million of direct finance matched by US$ 2.47 billion in co-financing as of May 2009.
Box 9: Share the Road
UNEP’s Share the Road campaign promotes non-motorised transport (NMT) by advocating increased investment by donors and govern-ments in NMT infrastructure within road projects (e.g. at least 10 per cent of the overall budget). The emphasis is on a paradigm shift towards roads that benefit all users and thus re-thinking how space and resources are shared between pedestrians, cyclists, users of public transport and motorists. Increased investment in NMT infrastructure can substantially benefit the environment (air quality, GHG emissions), development (accessibility, affordability), and safety (protected facilities for vulnerable users), and it is a prerequisite for building resource-efficient, liveable cities. Share the Road is working with partners with a view to making safe, low carbon and accessible mobility a reality for all users (UNEP and FIA Foundation, forthcoming at www.unep.org/transport/sharetheroad).
Box 10: The future role of climate finance in enacting green transport
In the context of the ongoing negotiations on climate change, the design of financial instruments need to take into account the failure of existing instruments such as the Clean Development Mechanism (CDM),37 to be fully applied to the transport sector. Under a Post-2012 framework, mitigation actions in transport in developing countries are likely to fall under the umbrella of Nationally Appropriate Mitigation Actions (NAMAs), which could be financed through:
■ A transport window under a Mitigation Fund such as the future Green Climate Fund;
■ An up-scaled, programmatic CDM;
■ A transport-specific instrument (see Bridging the Gap, 2010 for a proposal for a sectoral approach in transport); and
■ Other potential funds specific to capacity-building or technology.
Nationally Appropriate Mitigation Actions supported by developed countries are likely to be backed by fund-type instruments, whereas actions taken to acquire credits would be enacted through a crediting scheme such as an up-scaled CDM.38
37. Of the 2,400 registered CDM projects (as of October 2010) only three are transport projects, and only 32 out of the 5,529 CDM projects in the pipeline relate to the transport sector. Transport therefore only constitutes less than 0.l per cent of expected CERs. Source: UNEP-Risoe Centre.
38. The framework surrounding NAMAs is continuing to evolve, with the Conference of Parties (COP) to the United Nations Framework Convention on Climate Change (UNFCCC) agreeing at its 16th session in Cancun Mexico that developed countries shall provide support for preparation and implementation of developing country NAMAs, and that a registry will be set up to match finance, technology and capacity building support to NAMAs seeking international support. Nationally Appropriate Mitigation Actions are principally driven by the developing countries. As noted in Binsted et al. (2010), many developing countries (26 of the 43 countries that submitted NAMAs to the UNFCCC by September 2010) have proposed NAMAs in the transport sector. Available at:: http://w w w.transpor t2012.org/br idging/ressources/files/1/913,828,NAMA_submissions_Summary_030810.pdf
■ Equity – both horizontally (i.e. fair treatment of all transport users) and vertically (i.e. across income groups, ensuring support to those who are most deprived);
403
Transport
■ Practicality – both in terms of political acceptability and technical feasibility, taking into account local conditions and priorities; and
■ Measurability and transparency – to ensure that the effects of the new funding arrangements on carbon emissions can be monitored and evaluated against various criteria including cost effectiveness.
Pricing practices and their reform (energy costs, taxation, subsidies)The market for transport is currently distorted in many ways. Firstly, the various impacts of motorised transport (see Section 2) are in most cases not accounted for in transport costs. Secondly, roads, fuels and sometimes vehicles are subsidised in many countries. These subsidies can be significant, in the European Union they are estimated to amount to 4 per cent of GDP (however, total taxes related to transport are about the same size). This results in unsustainable transport patterns and is a major barrier to the introduction of green transport models. On the other hand, studies show that there is an economic case for subsidising mass transit systems. For example, a study by Parry and Small (2007) shows subsidies for public transport are warranted as they support a reduction of urban traffic congestion and various scale economies that can be exploited (e.g. less time wasted waiting at stops when trains and buses run more frequently).
To escape this deadlock, economic instruments such as charges and taxes need to be applied, which can be designed to reflect at least some of the external costs onto the users. As regards transport taxes, Hayashi and Kato
(2000) point out that such instruments can be applied at three different levels, namely car purchase, car ownership and car use (e.g. fuel/mileage tax, road user charging and parking charges). The distinction between car ownership and use is important. Many developed countries, especially in Europe, combine high levels of car ownership with limited vehicle use. For example, the city of Vienna has one of the highest car ownership rates among European cities, while the use of public transport is also among the highest. Taxing car use rather than ownership, together with providing high quality public and non-motorised transport alternatives, seem to be able to limit car use in many European cities.
Changes in pricing are essential in promoting green transport. Revenues from a full-cost-priced transport system39 can be used to invest in green transport. Such changes do not necessarily have to result in increased tax burden; reforming existing tax structures can effectively reduce congestion and reduce emissions. London’s Congestion Charge scheme, for example, directs part of its revenue towards improving the quality of the city’s bus services (see Box 12). Pricing private modes of transport correctly will also ensure a level playing field for public transport.
The relationship between levels of trade and environmental sustainability is complex and their impacts should be assessed from a holistic perspective. In some cases, importing goods from other countries may actually
Box 11: Fuel subsidies – transitional arrangements
The implementation of policies and shifts in financing priorities will inevitably lead to some groups in society to be worse off, at least in the short term. The elimination of fuel subsidies may impact disproportionately on poorer households, with little access to alternative sources of energy. UNEP (2008b) argues that targeted subsidies towards the lower income groups may offset such impacts. Lessons can be learnt from the recent reduction of fuel subsidies in Indonesia, which has been coupled with cash compensations and increases in other types of social benefits for vulnerable groups, such as staple food prices and education (Bank of Indonesia 2008).
Box 12: Congestion charging
Congestion charging, a fee charged to motorist to enter a zone prone to heavy congestion, may be an important element of more comprehensive energy price rationalisation in the longer term, particularly in developed countries. Congestion charging in London is thought to have reduced the vehicle volumes by around 15 per cent in 2003-2004 (Green Fiscal Commission 2009). The Eddington Review (2006), for example, emphasised the importance of controlling spiralling future congestion costs in the UK. This may facilitate a restructuring – and in some cases perhaps lowering – of fuel excises to focus them on the objectives they are best served to address, such as climate change mitigation.
39. Especially in developing countries where coverage of all transport costs is difficult due to existing structures, one may begin by initially pricing for the variable (operational and maintenance costs), and/or subsidising certain elements of transport from other transport revenues in the form of cross-subsidies, for example, using fuel tax revenue to cover rail transport infrastructure.
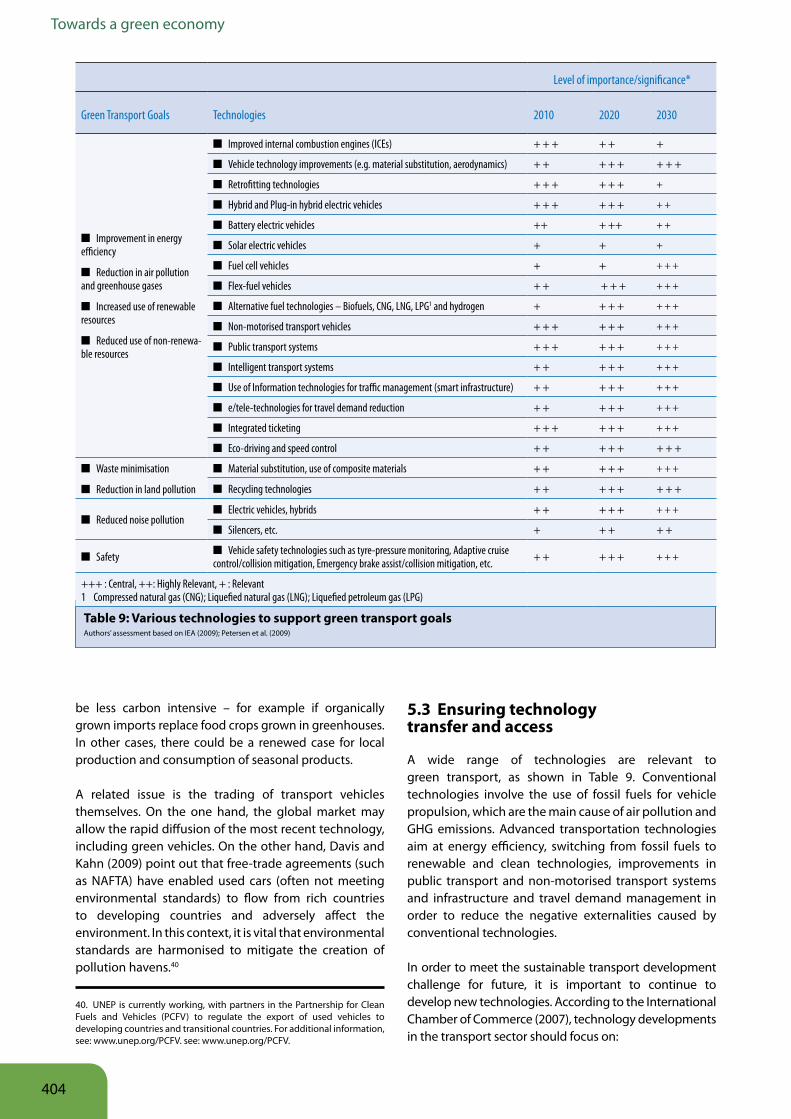
404
Towards a green economy
be less carbon intensive – for example if organically grown imports replace food crops grown in greenhouses. In other cases, there could be a renewed case for local production and consumption of seasonal products.
A related issue is the trading of transport vehicles themselves. On the one hand, the global market may allow the rapid diffusion of the most recent technology, including green vehicles. On the other hand, Davis and Kahn (2009) point out that free-trade agreements (such as NAFTA) have enabled used cars (often not meeting environmental standards) to flow from rich countries to developing countries and adversely affect the environment. In this context, it is vital that environmental standards are harmonised to mitigate the creation of pollution havens.40
5 3 Ensuring technology transfer and access
A wide range of technologies are relevant to green transport, as shown in Table 9. Conventional technologies involve the use of fossil fuels for vehicle propulsion, which are the main cause of air pollution and GHG emissions. Advanced transportation technologies aim at energy efficiency, switching from fossil fuels to renewable and clean technologies, improvements in public transport and non-motorised transport systems and infrastructure and travel demand management in order to reduce the negative externalities caused by conventional technologies.
In order to meet the sustainable transport development challenge for future, it is important to continue to develop new technologies. According to the International Chamber of Commerce (2007), technology developments in the transport sector should focus on:
Table 9: Various technologies to support green transport goals Authors’ assessment based on IEA (2009); Petersen et al. (2009)
Level of importance/significance*
Green Transport Goals Technologies 2010 2020 2030
■ Improvement in energy efficiency
■ Reduction in air pollution and greenhouse gases
■ Increased use of renewable resources
■ Reduced use of non-renewa-ble resources
■ Improved internal combustion engines (ICEs) + + + + + +
■ Vehicle technology improvements (e.g. material substitution, aerodynamics) + + + + + + + +
■ Retrofitting technologies + + + + + + +
■ Hybrid and Plug-in hybrid electric vehicles + + + + + + + +
■ Battery electric vehicles ++ + ++ + +
■ Solar electric vehicles + + +
■ Fuel cell vehicles + + + + +
■ Flex-fuel vehicles + + + + + + + +
■ Alternative fuel technologies – Biofuels, CNG, LNG, LPG1 and hydrogen + + + + + + +
■ Non-motorised transport vehicles + + + + + + + + +
■ Public transport systems + + + + + + + + +
■ Intelligent transport systems + + + + + + + +
■ Use of Information technologies for traffic management (smart infrastructure) + + + + + + + +
■ e/tele-technologies for travel demand reduction + + + + + + + +
■ Integrated ticketing + + + + + + + + +
■ Eco-driving and speed control + + + + + + + +
■ Waste minimisation
■ Reduction in land pollution
■ Material substitution, use of composite materials + + + + + + + +
■ Recycling technologies + + + + + + + +
■ Reduced noise pollution ■ Electric vehicles, hybrids + + + + + + + +
■ Silencers, etc. + + + + +
■ Safety ■ Vehicle safety technologies such as tyre-pressure monitoring, Adaptive cruise control/collision mitigation, Emergency brake assist/collision mitigation, etc. + + + + + + + +
+++ : Central, ++: Highly Relevant, + : Relevant 1 Compressed natural gas (CNG); Liquefied natural gas (LNG); Liquefied petroleum gas (LPG)
40. UNEP is currently working, with partners in the Partnership for Clean Fuels and Vehicles (PCFV) to regulate the export of used vehicles to developing countries and transitional countries. For additional information, see: www.unep.org/PCFV. see: www.unep.org/PCFV.
405
Transport
1. Promoting use of existing efficient technologies;
2. Retiring existing inefficient technologies; and
3. Supporting R&D for advanced technology developments.
At the same time, there is a need for commercialisation and widespread dissemination of existing efficient technologies. For example, applying already existing efficiency measures at a global scale (weight saving measures, stop-and-start technology, low resistance measures and hybridisation of vehicles, etc.) can already double the fuel economy of the global vehicle fleet. This is without introduction of state-of-the-art technologies such as electric and hydrogen vehicles (see Box 13).
Technology transfer/access needsTechnologies developed for developed nations often cannot simply be transferred to developing countries. According to UNEP (2009), effective technology transfer in the transport sector requires:
■ Accelerated deployment and diffusion of technologies;
■ Learning from the technology progress within countries already practicing technology transfer; and
■ Supporting mechanisms through appropriate financial mechanisms, knowledge networks and capacity building.
Technological, financial, institutional, information and social barriers can prevent the effective transfer of technology. The United Nations Environment Programme (2009) highlights economic and market barriers as some of the main obstacles of technology transfer. Furthermore, technology and knowledge transfer in transport should take place between developing countries, for example, to share experiences in applying low cost transport solutions such as BRT systems.
To facilitate an increased level of technology transfer, a detailed inventory of relevant technologies should be developed at national and regional levels. This may be linked to a Technology Needs Assessment, currently undertaken by many developing countries, which could also identify key actions for support from the international community.
5 4 Strengthening Institutions and Capacity
Realising the changes to investments and enforcing/executing the aforementioned policies, regulations and standards for green transport calls for strong institutional arrangements at both national and sub-national levels:
■ National level institutions, such as Ministries of Transport (in strong coordination with Ministries of Finance, Environment, Energy, Urban Development and Health) can help direct investments towards green technology to promote sustainable low carbon transport, bring in fiscal measures such as taxes and subsidies on vehicles and fuels and introduce regulations that restrict or discourage the usage and development of energy-intensive modes/ transport systems.
■ Sub-national level institutions, such as the Municipal Transport Agencies (in strong coordination with land use planning agencies and other local level agencies) can help integrate urban land use planning with transport infrastructure development, coordinate public transport systems, and introduce transport demand management measures such as congestion pricing, parking management, etc. (see section 5.1 for further details). The development of integrated urban transport agencies as seen in Singapore may help towards these aims.
Capacity building can help fine-tune the existing institutions to remove their infirmities and develop new ones to fill the vacuum, wherever it exists. To enable green transport, capacity building can in particular be targeted at:
Box 13: The global fuel economy initiative
Improving the efficiency of conventional engines is shown (at least in the short term) as one of the most cost-effective means to reduce environmental impacts (McKinsey and Company 2009). In this context, UNEP works with the IEA, the International Transport Forum (ITF) and the FIA Foundation in the Global Fuel Economy Initiative (GFEI)41 to promote vehicle efficiency worldwide. The GFEI is promoting at least a doubling of global vehicle fuel efficiency by 2050, and through this will make a major contribution to a future climate regime and meeting of climate targets. By providing the space for discussion and consensus on automotive fuel economy, the GFEI serves as a bridge between the car industry, governments, international organisations and NGO groups worldwide, in addition to providing support for the development of national clean and efficient vehicle policies.
41. See http://www.globalfueleconomy.org/
406
Towards a green economy
■ Improving administrative capacity of national and sub-national institutions to frame and execute green transport policies as well as develop core financing mechanisms directed towards investment in sustainable transport;
■ Methods to raise public awareness to use environment-friendly and energy efficient modes of transport;
■ Methods to mobilise the private sector, including the management of Public-Private-Partnerships (PPP), and support for indigenous technological development, encompassing R&D capability; and
■ Collection and maintenance of data which are essential for planning and monitoring progress towards green transport.
407
Transport
6 ConclusionsThis report highlighted that the current patterns of transport activity, based primarily on private motorised vehicles, generates many social, environmental and economic costs, represented for example by:
■ Consumption of more than half of global liquid fossil fuels;
■ Emission of nearly a quarter of the world’s energy-related CO2.;
■ The source of typically more than 80 per cent of developing cities’ local air pollutants;
■ More than 1.27 million fatal traffic accidents per year, mostly in developing countries; and
■ Chronic traffic congestion amounting to time and productivity loss.
Such costs, which can add up to nearly or over 10 per cent of a region or country’s GDP, were shown to grow further under the current trends of ever-increasing motorisation. This trend is unsustainable.
There is a need for a fundamental shift in investment patterns, based on the principles of:
■ Avoiding or reducing trips through integration of land use and transportation planning, and localised production and consumption;
■ Shifting to more environmentally efficient modes such as public transport and non-motorised transport and to rail and water transport (for freight); and
■ Improving fuels and vehicles through introduction of cleaner more efficient fuels and vehicles.
Models and scenarios show that a global paradigm shift is possible; investing in green transport measures could reduce emissions of the global transport sector by as much as 70 per cent. However this is only achievable with integrated policies that combine measures from all three components of the Avoid, Shift and Improve strategy.
Quantitative analysis using an integrated macro-economic model suggests that a small reallocation of investments (approximately 0.16 to 0.34 per cent of
global GDP) in support of public transport infrastructure and efficiency improvement of road vehicles would (in the year 2050, and compared to BAU) avoid travel volume of road vehicles by 27 per cent and 35 per cent, shift the share of private-car transport to other modes (by nearly 30 per centage points), reduce oil-based fuel usage by between 16 per cent and 31 per cent, reduce carbon emissions by 5 to 8.1 Gigatonnes (38 to 63 per cent compared with BAU), and retain strong and growing employment. Most of the green transport measures would actually be cost-efficient – for example major carbon reductions can be achieved with little or no extra investment.
Moving towards a green transport sector as part of an overall green economy strategy would also result in:
■ Green growth, by supporting cities with less congestion, air pollution and other costs;
■ The creation of jobs, particularly through the development for public transport infrastructure and operations; and
■ The alleviation of poverty by increasing affordability of transport and improving accessibility to markets and other essential facilities.
Furthermore, it was highlighted that, among others, such investment should be enabled via:
■ Policies, including land use planning to promote compact or mass transit corridor-based cities and conservation-based transportation infrastructure, regulation of, for example, fuel and vehicle standards, and the provision of information and awareness raising (e.g. on the health and safety benefits of active travel such as cycling and walking) to promote behavioural change in the form of modal choice;
■ A shift in financing priorities towards public and non-motorised transport, coupled with strong economic incentives (via taxes and charges) to promote sustainable consumption patterns and behaviour and to ensure green modes are commercially feasible and economically attractive; and
■ Development and application of green transport technology
408
Towards a green economy
ReferencesADB. (2009). Transport Operations, Asian Development Bank,
Manila. Available at: http://www.adb.org/Transport/operations.asp AITD. (2003). Socioeconomic Impact of National Highway Four-
Laning Project. Asian Institute of Transport Development. Bank of Indonesia. (2008). Press release – Government
explanation on government of Indonesia decree regarding the reduction of fuel subsidy and other relazted policies. Available at: http://www.bi.go.id/web/en/Publikasi/Investor+Relation+Unit/Government+Press+Release/Fuel+Subsidy.htm
Binsted, A., Bongardt, D., Dalkmann, H. and Wemaere, M. (2010). What’s next? The outcome of the climate conference in Copenhagen and its implications for the land transport sector. Available at: h t t p : / / w w w . t r a n s p o r t 2 0 1 2 . o r g / b r i d g i n g / r e s s o u r c e s /documents/1/556,Copenhagen_report_FINAL_Bridging_the.pdf
Binsted, A., Davies, A. and Dalkmann, H. (2010). Copenhagen Accord NAMA Submissions Implications for the Transport Sector. Available at: http://www.transport2012.org/bridging/ressources/files/1/913,828,NAMA_submissions_Summary_030810.pdf
Binswanger, H., Khandker, S. and Rosenzweig, M. (1993). “How Infrastructure and Financial Institutions Affect Agricultural Output and Investment in India.” Journal of Development Economics, Vol. 41, pp. 337-336. Elsevier.
Bongardt, D. and Schmid, D. (2009). Towards Technology Transfer in the Transport Sector: An Analysis of Technology Needs Assessments. Available at: http://www.transport2012.org/bridging/ressources/documents/1/449,TechnoTransf.pdf
Bridging the Gap. (2010). Reducing Emissions through Sustainable Transport (REST). Available at: http://www.transport2012.org/bridging/ressources/files/1/817,Transport_sectoral_approach_18-08-20.pdf
Button, K. (1993). Transport Economics 2ED. Edward Elgar, Cheltenham.
CABE. (2007). “Paved with gold: The real value of good street design.” Commission for Architecture and Built Environment. Available at: http://www.cabe.org.uk/files/paved-with-gold.pdf
Cambridge Systematics. (2009). “Economic Impact of public transportation investment.” Prepared for the American Public Transportation Association.
CEU. (2002). “Environmental Impacts of Transport.” Prepared by the Department of Environmental Sciences and Policy, Central European University. Available at: http://web.ceu.hu/envsci/sun/EnvImpactsOfTransport.pdf
Chmelynski, H. (2008). National Economic Impacts per $1 Million Household Expenditures (2006); Spreadsheet Based On IMPLAN Input-Output Model, Jack Faucett Associates. Available at: http.//www.jfaucett.com.
ClimateWorks. (2010). Global Transport Carbon Abatement Cost Curve. Available at: http://www.climateworks.org/network/sectors/sector/?id=94067c68-ee84-8275-c566-f97a2f59b590
Commission of the European Communities. (2009). “Cost Estimate for S.1733 Clean Energy Jobs and American Power Act Clean Energy and Security Act.” December 16, Washington, DC.
Creutzig, F. and He, D. (2009). “Climate change mitigation and co-benefits of feasible transport demand policies in Beijing. Transportation Research Part D.” Transport and Environment, Vol. 14, No. 2, March, pp. 120-131.
Dacy, D.C., Kuenne, R.E. and McCoy, P. (1980). Employment impacts of achieving automobile efficiency standards in the United States. Applied Economics 12, 295–312.
Dalkmann, H. (2009). “Policies for Low Carbon Transport” in Leather, J. and the Clean Air Initiative for Asian Cities Center Team. Rethinking Transport and Climate Change – New Approaches to Mitigate CO2 Emissions from Land Transport in Developing Asia. Asian Development Bank, Manila. Available at: http://www.adb.org/documents/papers/adb -work ing-paper-ser ies/ADB-WP10-Rethinking-Transport-Climate-Change.pdf
Dalkmann, H., Bongardt, D., Sakamoto, K., Neuweg, I. and Avery, K. (2010). Formulating NAMAs in the Transport Sector: Kick-starting action. Available at: http://www.transport2012.org/bridging/ressources/documents/1/567,Guidance_on_Transport_NAMA.pdf
Dalkmann, H. and Brannigan, C. in GTZ (2007). Transport and Climate Change. Module 5e: Sustainable Transport: A Sourcebook for Policy-makers in Developing Cities. Available at: http://siteresources.worldbank.org/EXTAFRSUBSAHTRA/Resources/gtz-transport-and-climate-change-2007.pdf
Davis, L. and Kahn, M. (2009). International Trade in Used Vehicles: The Environmental Consequences of NAFTA.
Dextre, J.C. (2009). De la circulación a la movilidad. Documento de trabajo, Área de Transporte de la Pontificia Universidad Católica del Perú.
European Commission (EC). (2011). Reducing emissions from the aviation sector. Available at: http://ec.europa.eu/clima/policies/transport/aviation/index_en.htm
ECMT. (2004). Assessment and decision making for sustainable transport. European Conference of Ministers of Transport.
Ecodrive.org. (2010). What is ecodriving? Available at: http://ecodrive.org/What-is-ecodriving.228.0.html
The Eddington Review. (2006). “Transport’s role in sustaining UK’s Productivity and Competitiveness: The Case for Action”. London.
EDRG. (2009). Job Impacts of Spending on Public Transportation: An Update. Prepared for the American Public Transportation Association. Economic Development Research Group. Available at: http://www.apta.com/gap/policyresearch/Documents/jobs_impact.pdf
EEA. (2000). European Environment Agency Says Transport Sector Falling Short of Goals, by Walsh, M. P in Car Lines, Issue 2000-3.
EEA. (2008). Beyond transport policy – exploring and managing the external drivers of transport demand. European Environment Agency, Copenhagen. Available at: http://www.eea.europa.eu/publications/technical_report_2008_12
EEA. (2010). Towards a resource efficient transport system, TERM 2009: Indicators tracking transport and environment in the European Union. Copenhagen. Available at: http://www.eea.europa.eu/publications/towards-a-resource-efficient-transport-system
Embarq. (no date). Aguascalientes – Housing. A New Urban Paradigm. Available at: http://www.embarq.org/en/project/aguascalientes-housing
Embarq. (2011). Latin America – SIBRT. Available at: http://www.embarq.org/en/project/latin-americas-sibrt
FHWA. (2000). Operations Story. Federal Highway Administration, Washington, DC. Available at: http://www.ops.fhwa.dot.gov/aboutus/opstory.htm
FIA Foundation, UNEP, IEA and ITF. (2009). 50by50: Global Fuel Economy Initiative. Available at: http://www.fiafoundation.org/50by50/pages/homepage.aspx
Foster, V. and Briceño-Garmendia, C. (2010). Africa’s Infrastructure – A time for Transformation. Available at: https://www.infrastructureafrica.org/aicd/flagship-report
Frazila, B. (2009). Unpublished report on transport and climate change.
GEF. (2009). Investing in Sustainable Urban Transport: The GEF Experience. Global Environment Facility, Washington, DC. Available at: http://www.thegef.org/gef/sites/thegef.org/files/publication/Investing-Urban-Transportation_0.pdf
Geller, H., DeCicco, J. and Laitner, S. (1992). Energy efficiency and job creation: the employment and income benefits from investing in energy conservation technologies. Report No. ED922, American Council for an Energy-Efficient Economy; Washington, DC.
Greene, D. L. (1991). Short-run Pricing Strategies to Increase Corporate Average Fuel Economy. Economic Inquiry, 29, 101-114.
Green Fiscal Commisison. (2009). The Case for Green Fiscal Reform: Final Report of the UK Green Fiscal Commission. London.
409
Transport
GTZ. (2002). Transport and Poverty in Developing Countries. Deutsche Gesellschaft für Technische Zusammenarbeit, Eschborn. Available at: http://www.gtkp.com/uploads/20091127-182046-6236-en-urban-transport-and-poverty.pdf
Hatfield, T. and Tsai, P. (2010). The Global Benefits of Phasing Out Leaded Fuel. California State University, Northridge, California.
Hayashi, Y. (1989). Issues in Financing Urban Rail Transit Projects and Value Captures. Department of Civil Engineering, Nagoya University, Nagoya.
Hayashi, Y. and Kato, H. (2000). A Model System for the Assessment of the Effects of Car and Fuel Green Taxes on CO2 Emissions. Department of Geotechnical and Environmental Engineering, Nagoya University, Nagoya.
ICC. (2007). Business perspectives on a long-term international policy approach to address global climate change. Department of Policy and Business Practices, International Chamber of Commerce, Paris. Available at: http://www.iccwbo.org/uploadedFiles/ICC/policy/Environment/ICC_Longer_term_paper_FINAL.pdf
ICCT. (2009). A policy-relevant summary of black carbon climate science and appropriate emission control strategies, International Council on Clean Transportation, Washington, DC. Available at: http://www.theicct.org/pubs/BCsummary_dec09.pdf
ICF International. (2009). Sub-Saharan Africa Refinery Project – Final Report. Available at: http://www.unep.org/pcfv/PDF/Final_Executive_Summary_6-08-09.pdf
IEA. (2005). CO2 Emissions from Fuel Combustion 1971-2004, International Energy Agency, Paris.
IEA. (2006). World Energy Outlook 2006, International Energy Agency, Paris. Available at: http://www.worldenergyoutlook.org/2006.asp
IEA. (2008). Energy Technology Perspectives: Scenarios and Strategies up to 2050. Part 1, Technology and the Global Energy Economy to 2050, International Energy Agency, Paris.
IEA. (2009a). World Energy Outlook 2009, International Energy Agency, Paris.
IEA. (2009b). Transport, Energy and CO2: Moving towards Sustainability, International Energy Agency, Paris.
IEA. (2010). Energy Technology Perspectives, International Energy Agency, Paris.
IMO. (2009). Prevention of Air Pollution from Ships. Marine Environment Protection Committee: 59th session. International Maritime Organization, London.
Jacobs, G. and Aeron-Thomas, A. (2000). A review of global road accident fatalities. RoSPA Road Safety Congress, Plymouth, UK, 3 - 7 March 2000.
Jacobs, G., Aeron-Thomas, A. and Astrop, A. (2005). Estimating global mortality and burden of disease, 2002-2030: data sources, methods and results. World Health Organization, Geneva.
Kaczynska, M. (2009). Impact of transport on biodiversity and nature protection legislation. European Investment Bank Workshop May 2009. Available at: http://www.eib.org/attachments/general/events/brussels_15052009_impact-on-biodiversity.pdf
Kebin, H. and Chang, C. (1999). Present and Future Pollution from Urban Transport in China. China Environment Series, 3, 38-50. Available at: http://wwics.si.edu/topics/pubs/ACF4BA.pdf
Khandler, S. Baakht, H. and Koolwal, G. (2009). “The poverty impact of rural roads: evidence from Bangladesh.” Economic Development and Cultural Change, Vol. 57, Issue 4, pp. 685-722.
King, J. (2007). The King Review of low carbon cars. Part I: the potential for CO2 reduction, HM Treasury, Norwich. Available at: http://www.hm-treasury.gov.uk/d/pbr_csr07_king840.pdf
Lambert, J. (2002). International Meeting on Acoustic Pollution in Cities. Madrid. Inrets-Lte, Cedex. Available at: http://www.inrets.fr/ur/lte/publications/publications-pdf/Lambert-publi/Madrid-2002.pdf
Litman, T. (2009). Smart Transportation Economic Stimulation: Infrastructure Investments That Support Economic Development. VTPI. Available at: http://www.vtpi.org/econ_stim.pdf
Litman, T. (2010). Win-Win Transportation Emission Reduction Strategies: Good News for Copenhagen.
Liu, Z. (2005). “Transport Investment, Economic. Growth and Poverty Reduction.” Journal of Transport and Infrastructure, The Asian Journal, Vol. 12, No. 1, August. Available at: http://siteresources.worldbank.org/I N T U R B A N T R A N S P O R T / R e s o u r c e s / 3 4 0 1 3 6 - 1 1 5 2 5 5 0 0 2 5 1 8 5 /TransportGrowth&Poverty-ZL.pdf
Martínez Sandoval , A. (2005). Ruido por tráfico urbano: Conceptos, medidas descriptivas y valoración económica, (Urban traffic noise: Concepts, descriptive measures and economic value). La Revista Económica y Administración – Universidad Autónoma de Occidente, Cali, Colombia. Available at: http://dali.uao.edu.co:7777/pls/por tal/docs/PAGE/UNIAUTONOMA_INVESTIGACIONES/REVISTA_ECONOMIK/NUMEROS/ECONOMIA2/RUIDO_0.PDF
McKinnon, A. (2008). “The Potential of Economic Incentives to Reduce CO2 Emissions from Goods Transport.” Paper prepared for the 1st International Transport Forum on Transport and Energy: the Challenge of Climate Change. Leipzig, 28-30 May. Available at: http://www.internationaltransportforum.org/Topics/Workshops/WS3McKinnon.pdf
McKinsey & Company. (2009). Roads toward a low-carbon future: Reducing CO2 emissions from passenger vehicles in the global road transportation system. Available at: http://www.mckinsey.com/clientservice/ccsi/pdf/roads_toward_low_carbon_future.pdf
McKinsey & Company. (2010). Impact of the financial crisis on carbon economics.
Motor Trader. (2009). Scrappage schemes boost European Car Sales by 11.2 per cent in October. Available at: http://www.m otor t ra d e r.com/ ind u str y- ne ws/ ca r- d e a le r- ne ws/ 29492-scrappage-schemes-boost-european-car-sales-rise-112-per-cent-in-october.html
Newman, P., Manins, P.C.L., Simpson, R., and Smith, N. (1997). Reshaping cities for a more sustainable future: exploring the link between urban form, air quality, energy and greenhouse gas emissions. Australian Housing and Urban Research Institute.
North, D. (1990). Institutions, institutional change and economic performance. Cambridge University Press.
OECD. (2002). Policy Instruments for Achieving Environmentally Sustainable Transport. Organisation for Economic Co-operation and Development, Paris.
OECD. (2009). Territorial Reviews: Toronto, Canada. Organisation for Economic Co-operation and Development, Paris. Available at: http://www.oecd.org/gov/regional/toronto. Retrieved 12-10-2009.
OEF. (2006). The Economic Contribution of the Aviation Industry in the UK. Oxford Economic Forecasting, Oxford. Available at: www.oef.com/Free/pdfs/Aviation2006Final.pdf
Parry, I. and Small, K. (2007). Should Urban Transit Subsidies Be Reduced? Available at: http://www.rff.org/documents/RFF-DP-07-38.pdf
Petersen, M., Sessa, C., Enei, R., Ulied, A., Larrea, E., Obisco, O., Timms, P. and Hansen, C. (2009) Report on Transport Scenarios with a 20 and 40 Year Horizon, Final report. Available at: http://ec.europa.eu/transport/strategies/studies/doc/future_of_transport/2009_02_transvisions_report.pdf
Rapuano,K.W, Rochow, J., and Garcia-Costas, A. (1997). Myths and Realities of Phasing Out Leaded Gasoline. Alliance To End Childhood Lead Poisoning. Washington, DC. Available at: http://www.unep.org/pcfv/PDF/Pub-AECLP-Myths.pdf
Reitveld, P. and Stough, R. (2004). “Institutions, regulations and sustainable transport: A cross national perspective”. Transport Review, Vol. 24, No. 6, pp.707-719, November.
SACTRA. (1997). Transport and the economy: summary report. The Standing Advisory Committee on Trunk Road Assessment. Available at: http://www.cipra.org/alpknowhow/publications/sactra/sactra1
Sælensminde, K. (2002). Walking and Cycling Track Networks in Norwegian Cities: Cost-Benefit Analysis Including Health Effects and External Costs of Road Traffic. Institute of Transport Economics, Oslo. Available at: www.toi.no/getfile.php/Publikasjoner/T%D8I%20rapporter/2002/567-2002/sum-567-02.pdf
410
Towards a green economy
Sakamoto, K. (2009). in Leather, J. and the Clean Air Initiative for Asian Cities Center Team. Rethinking Transport and Climate Change – New Approaches to Mitigate CO2 Emissions from Land Transport in Developing Asia, Asian Development Bank, Manila. Available at: http://www.adb.org/documents/papers/adb-working-paper-series/ADB-WP10-Rethinking-Transport-Climate-Change.pdf
Sanchez-Triana, E., Ahmed, K., and Awe, Y. (2007). “Environmental Priorities and Poverty Reduction – A Country Environmental Analysis for Colombia.” World Bank, Washington, DC. Available at: http://www-wds.worldbank.org/external/default/WDSContentServer/WDSP/IB/2007/08/13/000020953_20070813145440/Rendered/PDF/405210Env0prio101OFFICIAL0USE0ONLY1.pdf
Sewill, B. (2005). Fly now, grieve later: How to reduce the impact of air travel on climate change. Aviation Environment Federation, London. Available at: http://www.aef.org.uk/downloads/FlyNowFull.pdf
STPP. (2004). Setting the Record Straight: Transit, Fixing Roads and Bridges Offer Greatest Job Gains. Surface Transportation Policy Project. Available at: www.transact.org/library/decoder/jobs_decoder.pdf
The Telegraph Business Club and IBM. (2009). “Future Focus: Travel.” The Telegraph Business Club and IBM, June. Available at: https://www-304.ibm.com/businesscenter/cpe/download0/177501/IBM_White_Paper_3.pdf
Texas Transportation Institute. (2010). Urban Mobility Report 2010. Available at: http://tti.tamu.edu/documents/mobility_report_2010.pdf
Timilsina, G. and Dulal, B. (2009). A Review of Regulatory Instruments to Control Environmental Externalities from the Transport Sector. Available at: http://www-wds.worldbank.org/external/default/WDSContentServer/IW3P/IB/2009/03/17/000158349_20090317095252/Rendered/PDF/WPS4867.pdf
UITP (International Association of Public Transport) database (2005). A Panorama of Urban Mobility Strategies in Developing Countries, presentation at the World Bank on 5 September 2006 by Hubert Metge and Aurélie Jehanno of Systra. Available at: http://siteresources.worldbank.org/INTTRANSPORT/Resources/336291-1122908670104/1504838-1157987224249/2SYSTRA1.pdf
UNCTAD. (2008). World Investment Report 2008. United Nations Conference on Trade and Development, Geneva. Available at: www.unctad.org/en/docs/wir2008_en.pdf
UNECE. (2009). Working together for Sustainable and Healthy Transport: Guidance on Supportive Institutional Conditions for Policy Integration of Transport, Health and Environment, United Nations Economic Commission for Europe, Geneva. Available at: http://www.unece.org/thepep/en/publications/WorkingTogether.Guidance.en.pdf
UNEP. (2008a). Green Jobs: Towards decent work in a sustainable, low-carbon world Part II – Employment Impacts: Transportation. United Nations Environment Programme, Nairobi. Available at: http://www.unep.org/labour_environment/PDFs/Greenjobs/UNEP-GreenJobs-E-Bookp148-171-Part2section3.pdf
UNEP. (2008b). Reforming Energy Subsidies – Opportunities to Contribute to the Climate Change Agenda. United Nations Environment Programme, Nairobi. Available at: http://www.unep.org/pdf/pressreleases/reforming_energy_subsidies.pdf
UNEP. (2008c). Toolkit for Clean Vehicles Fleet Strategy Development, United Nations Environment Programme, Nairobi. Available at: http://www.unep.org/tnt-unep/toolkit
UNEP. (2009). Global Trends in Sustainable Energy Investment 2009. Analysis of trends and Issues in the financing of renewable energy and energy efficiency. United Nations Environment Programme, Nairobi. Available at: http://www.sefi.unep.org
UNEP. (2010). Driving a Green Economy Through Public Finance and Fiscal Policy Reform. United Nations Environment Programme, Nairobi. Available at http://www.unep.org/greeneconomy/Portals/30/docs/DrivingGreenEconomy.pdf
UNEP and FIA Foundation (Forthcoming). Share the Road Initiative Report. Will be available at: http://www.unep.org/transport/sharetheroad.
UNEP Risoe Centre. (2010). CDM Pipeline overview. Copenhagen. Available at: http://cdmpipeline.org/publications/CDMpipeline.xlsx
UNESCAP, UN-ECLAC, and Urban Design Lab. (2010). “Are We Building Competitive and Liveable Cities? Guidelines on Developing Eco-efficient and Sustainable Urban Infrastructure in Asia and Latin America.” United Nations Economic and Social Commission for Asia and Pacific, United Nations Economic Commission for Latin America and Caribbean, and Urban Design Lab. Available at: http://www.unescap.org/esd/environment/infra/documents/UN_Sustainable_Infrastructure_Guidelines_Preview.pdf
U.S. Department of Transportation. (2009). Car allowance rebate system. Washington, DC. Available at: http://www.cars.gov/faq
Vanderschuren, M. (2003). Optimising Settlement Location Planning in Cape Town. University of Cape Town, Cape Twon.
Van de Walle, D. (2002). “Choosing Rural Road Investments to Help Reduce Poverty”. World Development, Vol. 30, No.4, pp.575-589.
Veolia Transport, International Association of Public Transport (UITP) and UNEP. (2009) Strategies to bring land transport into the climate change negotiations: Discussion Paper.
VTPI. (2007). Transportation Cost and Benefit Analysis II – Barrier Effect. Victoria Transport Policy Institute, British Columbia. Available at: http://www.vtpi.org/tca/tca0513.pdf
VTPI. (2010). Economic Development Impacts: Evaluating Impacts On Productivity, Employment, Business Activity and Wealth. TDM Encyclopaedia. 13 December. Victoria Transport Policy Institute, British Columbia. Available at: http://www.vtpi.org/tdm/tdm54.htm
WBCSD. (2004). Mobility 2030: Meeting the challenges to sustainability. World Business Council for Sustainable Development, Geneva. Available at: http://www.wbcsd.org/web/publications/mobility/mobility-full.pdf
Weisbrod, G. and Reno, A. (2009). Economic Impact of Public Transportation Investment. Prepared for American Public Transportation Association. Available at: http://www.apta.com/resources/reportsandpublications/Documents/economic_impact_of_public_transportation_investment.pdf
Weisbrod, G., Vary, D. and Treyz, G. (2003). Measuring the Economic Costs of Urban Traffic Congestion to Business. Available at: http://www.edrgroup.com/pdf/weisbrod-congestion-trr2003.pdf.
WHO. (2008). Economic valuation of transport-related health effects. Review of methods and development of practical approaches, with a special focus on children. World Health Organization, Geneva. Available at: http://www.euro.who.int/__data/assets/pdf_file/0008/53864/E92127.pdf
WHO. (2009a). Global status report on road safety. World Health Organization, Geneva. Available at: http://www.who.int/violence_injury_prevention/road_safety_status/2009/en/
WHO. (2009b). Night noise guidelines for Europe. World Health Organization, Geneva. Available at: http://www.euro.who.int/document/e92845.pdf
World Bank. (2001). Cities on the move: a World Bank urban transport strategy review. Washington, DC. Available at: http://siteresources.worldbank.org/INTURBANTRANSPORT/Resources/cities_on_the_move.pdf
World Bank. (2007). A decade of action in transport – an evaluation of World Bank assistance to the transport sector, 1995-2005. Washington, DC. Available at: http://go.worldbank.org/FQPZR5DCN0
World Bank. (2009). Low-Carbon Development for Mexico. Washington, DC. Available at: http://siteresources.worldbank.org/INTMEXICO/Resources/MEDECExecutiveSummaryEng.pdf
World Bank/ICA/PPIAF. (2009). Attracting Investors toAfrican Public-Private Partnerships: A Project Preparation Guide. World Bank, The Infrastructure Consortium for Africa, and Public-Private Infrastructure Advisory Facility.

411
Transport