Embed Size (px)
Citation preview

Photo from CityBeat
TRANSPORTATIONEveryone relies on transportation—be that the stride of our own two feet, our own vehicle, a bike, a bus, a streetcar, or the pick-up and delivery of goods and services. Transportation is a key component of our everyday lives. It gets us to where we need to be, and what we need to us.
Transportation networks exist to provide social and economic connections through mobility and access. They contribute to the environmental, social and economic vitality of the communities they serve. The Transportation Task Team of the 2018 Green Cincinnati Plan—comprised of government, corporate, academic, non-profit, faith, community organizations and leaders—understands that the provisions of a transportation network are not absent of footprint or improvement. The advantages of increased mobility and access should be weighed against the environmental, social and economic costs. As a team, we believe that sustainability, resiliency and equity must be considered in all areas of transportation planning and implementation.
The Transportation Task Team has discussed the success and accomplishments since the 2013 Green Cincinnati Plan, such as the launch of Red Bike and the Cincinnati Bell Connector. We identified significant stakeholders and partners in our regional transportation network and current issues and areas in need of improvement. We developed a set of recommendations, including increased fuel efficiency for the City’s fleet, use of alternative fuels and energy, as well as increased funding, support and interconnectivity among mass transit, bicycling and pedestrian infrastructure.

We’re establishing measurable goals for evaluating and tracking progress throughout the next five years. All the while, considering who benefits, who doesn’t, who bares the impact, cost and/or burden. Equitable access to transportation is integral to the success of true connectivity.This discussion and deliberation among City and community leaders, though occasionally divisive and still in need of more diverse representation, will continue to move the needle in our transportation planning and incubate ideas and actionable efforts. Together we will accomplish more and better progress.
Elese DanielsRed BikeTransportation Team member
Goals1) DECREASE THE CONSUMPTION OF FOSSIL FUELS, INCLUDING GAS, DIESEL, AND NATURAL GAS BY 20%.
Year Diesel (g) Unleaded (g) Propane (g) E85 (g)
2015
782,667,000 1,052,598,000
37,916,000 47,371,000
2014
801,465,000 1,069,579,000
44,817,000 47,434,000
City-wide fuel usage is determined by wholesale fuel sales from regional distributors. Citation: City of Cincinnati Office of Environment and Sustainability, 2017.

2) INCREASE THE PASSENGER MILES TRAVELLED VIA PUBLIC TRANSIT BY 5%.
Year Passenger Miles Traveled via Public Transit (GU)
Passenger Boardings
Total Ridership, Bus-Rail (National Ridership Map)
% Public Transit Commute (National Ridership Map)
2016
109,918,000
2015
122,459,000 15,582,624 (Metro)
20,684,53720,138,628 (Bus)72,306 (Rail)
2.102%
2014
114,328,948 21,118,00020,595,093 (Bus)63,631 (Rail)
2.093%
2013
106,086,636 21,265,00020,764,897 (Bus)50,779 (Rail)
2.125%
2012
111.094,000 21,687,00021,203,690 (Bus)30,558 (Rail)
2.253%

2011
23,040,000 2.446%
2010
107,495,000 22,954,000 2.54%
2009
27,304,000
2008
30,259,000
2007
30,228,000
2006
29,538,992
Passenger miles travelled is the distance travelled by passengers on public transit. For these data, SORTA and TANK represent the bulk of miles measured. Transit authorities make these estimates based off ridership, pass use, survey, etc. Citation: Green Umbrella, 2017.
3) DOUBLE LANE MILES OF BIKE TRAIL.
Miles of Bike Trail in the Greater Cincinnati Area (2017)

Type of Trail City of Cincinnati County (includes City) Greater Region
Total 77.3 151.9 405
Multi-Use Trails 26 100 -
Protected Bike Lanes
2.27 3.9 -
Standard Bike Lanes 20.5 35.8 -
Sharrows 5.5 12.2 -
Multi-use trails are used by cyclists, pedestrians, and other recreational users allowed on the trail. Standard bike lanes are painted onto the outer edge of roadways, and protected bike lanes use planters, curbs, parked cars, or other barriers to separate the bike lane from the roadway. Sharrows are shared lane markings on roadways; the marking is placed in the travel lane where people should preferably cycle. Tri-State Trails tracks and maps the number of miles of trail every year. Citation: Tri-State Trails, 2017.
Recommendations
1. Accelerate the adoption of autonomous vehicles, starting with a pilot project.What is it and why is it important to Cincinnati?
Cincinnati will help convene a team of key stakeholders to implement an autonomous vehicle (AV) pilot project in Cincinnati. The technology for autonomous vehicles has been rapidly improving and is quickly becoming viable, especially in cities. Autonomous cars are proving themselves safer than human drivers and the technology is gaining social acceptance. A survey from Pittsburgh where autonomous vehicles have been in road tests for more than a year found that the public feels safer interacting with autonomous vehicles than with human-operated vehicles. It will take time for consumers and lawmakers to fully embrace autonomous vehicles, but eventually their safety and efficiency will win out. For cities, autonomous cars offer a reliable transportation option and allow urban spaces currently committed to parking, to be freed up for other uses. The City of Cincinnati can make itself attractive for autonomous car pilot programs by creating legislation that encourages autonomous vehicles in the City. Many of the first autonomous car programs will come in the form of ride-sharing programs, simply without the driver. Implementing a successful car-sharing program is another way to present the City as an attractive market for autonomous vehicles. For some communities, autonomous shuttle buses have been the first test of public AVs. A UC circulator, Fountain Square to U Square bus, or crosstown circulator from the Museum Center to the Casino might be a good AV pilot project.

Bolstering public support for autonomous vehicles is an important step in attracting autonomous vehicles. Many people are not comfortable with the idea of a machine driving the car without their control. The City will work with local transportation groups to educate residents about the benefits of autonomous vehicles and their safety successes. Autonomous cars reduce the carbon footprint of the transportation sector, reduce the need for parking spaces, and make travel safer for residents by removing the human driver.1
Examples in Cincinnati and Peer Cities
Cincinnati, OH CVG Airport is exploring a driverless shuttle program.
https://www.cincinnati.com/story/money/2017/12/20/driverless-shuttles-horizon-cvg-university-cincinnati-shuttles-could-available-tprogram-could-implem/962322001/
Pittsburgh, PA Pittsburgh formed collaboration with Uber to pilot AV technology
http://www.govtech.com/fs/5-Reasons-Pittsburgh-is-Still-Tops-in-Autonomous-Vehicles.html
Who could help with implementation? Venture Smarter Department of Transportation and Engineering
Who is the target audience? Cincinnati residents
What is the City of Cincinnati’s role in implementation?
The City of Cincinnati will convene a team of stakeholders to create an autonomous vehicle pilot program.
Is it feasible? Feasibility: Medium
AV technology continues to improve making them closer and closer to being implemented on a wide-scale. This creates an opportunity to get in early and help AVs come to Cincinnati.
How much will it cost?
Cost Benefit Cost-Benefit Ratio
Minimal/None (To City of Cincinnati) TBD (To City of Cincinnati and partners) NA
1 http://www.bikepgh.org/resources/save/survey/

Development of an autonomous vehicle pilot program can rely on lessons from numerous models in America and around the world. Once a team of key stakeholders is established they may begin development of strategic planning and risk management. There are many companies looking for suitable environments to test their equipment and the City may lean on this market of prospective developers to cover most of the capital intensive technological aspects of this recommendation.
Keys to Equity Autonomous shuttle busses must be free or affordably priced so everyone can use them. Autonomous car share services should eliminate barriers such as credit card requirements or
expensive memberships.
Timeline for Implementation 1-2 years
An autonomous shuttle bus pilot project will be approved in 1 year, and operational in 2 years.
A driverless car share service will be operational in Cincinnati in 3-5 years.
Greenhouse Gas Impact
Annual Carbon Reduction Potential
2018 2023 2050
0 mtCO2e 72,135 mtCO2e 1,351,763 mtCO2e
Adoption of autonomous vehicles has potential to significantly reduce our region’s GHG emissions. The potential reductions are driven by the efficiency of AVs, the ability for AVs to reduce on road congestion, and the impact of AVs on total vehicle miles travelled. A study by Intelligent Transportation Society of America estimates that the gradual introduction of AVs will help reduce vehicular emissions by 2-4% per year moving forward. In 2015, Cincinnati reported community-wide transportation emissions of 2,404,500 mtCO2e. We assume 3% reductions by 2023, followed by an annual reduction of 2% as AV utilization increases.2
2. Encourage the use of electric vehicles through City programs that incentivize EV ownership and infrastructure.What is it and why is it important to Cincinnati?
Electric vehicles (EVs) are a rapidly growing market-share in the United States and are seen as the future of the automobile industry. EVs are more reliable and lower maintenance than the traditional car because electric motors have fewer moving parts and need no oil changes or tune-ups. The cost of 2 https://www.scientificamerican.com/article/self-driving-cars-could-cut-greenhouse-gas-pollution/http://www.itic.org/policy/energy/intelligent-efficiency/dotAsset/933052fc-0c81-43cf-a061-6f76a44459d6.pdf

charging an electric car at home is much cheaper than buying gas, which can fluctuate drastically, making electric cars cheaper to own and operate than traditional vehicles. The biggest hurdle this technology still faces is the range and charge time of electric cars which can be an issue on long trips, but new innovations are solving this problem. As the world moves toward electric cars, adoption will happen faster in Cincinnati if the City creates incentives and implements electric car infrastructure.
The City already incentivizes electric cars by providing free parking at any City-owned parking meter and one garage. To further encourage electric cars in Cincinnati, the City will encourage electric car infrastructure in and around the City. That way it is easy for electric car users to find a charging station wherever they are. One way the City can achieve this is by changing the City’s Code to require any new parking garage or parking lot to be built with a minimum number of charging stations. This would allow the City to create the infrastructure without having to carry the entire burden of the cost. All new or rehabbed City parking facilities will include a minimum number of charging stations.
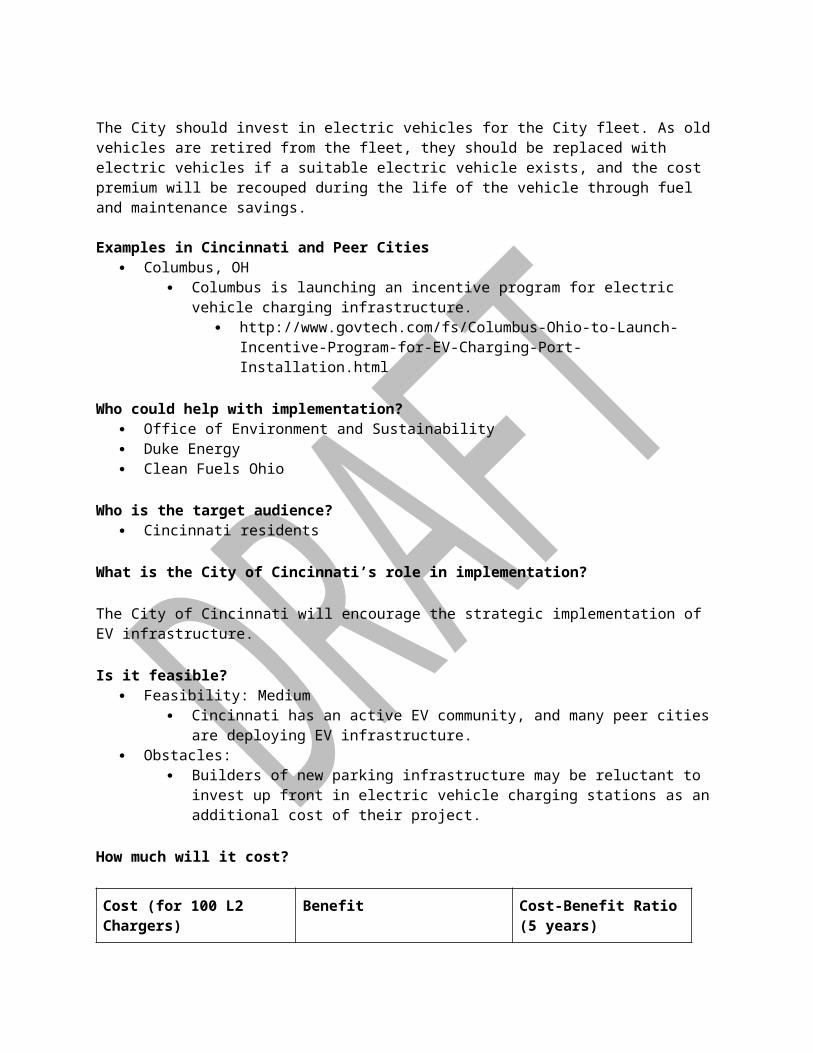
The City should invest in electric vehicles for the City fleet. As old vehicles are retired from the fleet, they should be replaced with electric vehicles if a suitable electric vehicle exists, and the cost premium will be recouped during the life of the vehicle through fuel and maintenance savings.
Examples in Cincinnati and Peer Cities
Columbus, OH Columbus is launching an incentive program for electric vehicle charging infrastructure.
http://www.govtech.com/fs/Columbus-Ohio-to-Launch-Incentive-Program-for-EV-Charging-Port-Installation.html
Who could help with implementation? Office of Environment and Sustainability Duke Energy Clean Fuels Ohio
Who is the target audience? Cincinnati residents
What is the City of Cincinnati’s role in implementation?
The City of Cincinnati will encourage the strategic implementation of EV infrastructure.
Is it feasible? Feasibility: Medium
Cincinnati has an active EV community, and many peer cities are deploying EV infrastructure.
Obstacles: Builders of new parking infrastructure may be reluctant to invest up front in electric
vehicle charging stations as an additional cost of their project.
How much will it cost?
Cost (for 100 L2 Chargers) Benefit Cost-Benefit Ratio (5 years)

$200,000 (To City of Cincinnati) $60,000/yr. (To City of Cincinnati) 1.5:1
A basic Level 2 charger costs about $2000 installed, and can be rented to an EV owner for about $2/day or $50/month, plus the cost of electricity. To install 100 chargers in the first year would cost $200,000, and would pay back $60,000 per year.
There are currently 84 public charging stations within 20 miles of Downtown Cincinnati3. The cost of a single port EVSE unit ranges from $300-$1,500 for Level 1, $400-$6,500 for Level 2, and $10,000-$40,000 for DC fast charging. Installation costs vary greatly from site to site with a ballpark cost range of $0-$3,000 for Level 1, $600- $12,700 for Level 2, and $4,000-$51,000 for DC fast charging4. It is worth noting that the level three charger is not compatible with all EVs, the market may or may not standardize this equipment. The State of Ohio offers financial assistance in the form of a loan to cover ¾ of project costs (up to $750,000.00) which can help to cushion the upfront costs of this undertaking. The rate charged to customers can also help mitigate both upfront costs and operating costs down the road.
Keys to Equity
The spread of electric vehicles must be accompanied by improvements to transit and other mobility solutions. While EVs improve vehicle affordability, private cars will likely remain beyond the reach of many residents.
Timeline for Implementation An initial deployment of chargers can happen within 1 year. Additional chargers should be
installed annually for the foreseeable future.
Greenhouse Gas Impact
Annual Carbon Reduction Potential
2018 2023 2050
3,300 mtCO2e 17,768 mtCO2e 1,202,500 mtCO2e
While electric vehicles have zero tailpipe emissions, they have CO2 emissions associated with electricity generation. The CO2 savings of electric vehicles depends on the electricity source used to charge the battery. Based on the average CO2 emissions from electricity generation in Ohio in 2017, an all-electric vehicle has “well-to-wheel” CO2 emissions about 40% lower than a conventional gasoline vehicle5. Homeowners who charge their vehicles at homes powered by the City’s 100% green energy aggregation program or with solar installations will have greater CO2 savings. As Cincinnati moves toward a greater mix of renewable sources, the CO2 savings of electric vehicles will also grow. Ohio has a larger proportion of coal-fired power plants than the national average, which means that electric vehicles charged in Ohio have a higher CO2 footprint than the national average.
3 According to the map generated on solvingev.com. Accessed December 20174 Costs Associated With Non-Residential Electric Vehicle Supply Equipment. UD Department of Energy Vehicle Technologies; New West Technologies LLC. November 20155 https://www.afdc.energy.gov/vehicles/electric_emissions.php

Electric vehicles in Ohio are estimated to produce 6,911 pounds (3.14 mt) CO2 per year, compared to 11,435 pounds (5.18 mt) CO2 per year for gasoline powered vehicles. Approximately 60% of Cincinnati homes are powered by renewable energy through the Energy Aggregation Program, eliminating the CO2 emissions of the vehicle. We estimate 840 EVs are operating in Cincinnati in 2018. Electric vehicle sales are expected to experience 40% annual growth over the next 5 years. Projecting EV adoption trends beyond 2023 is very difficult, as EV technology is intertwined with autonomous vehicle adoption. For purposes of estimation, we project the pace of sales to slow, but for electrification to eliminate 50% of current transportation emissions footprint.6,7
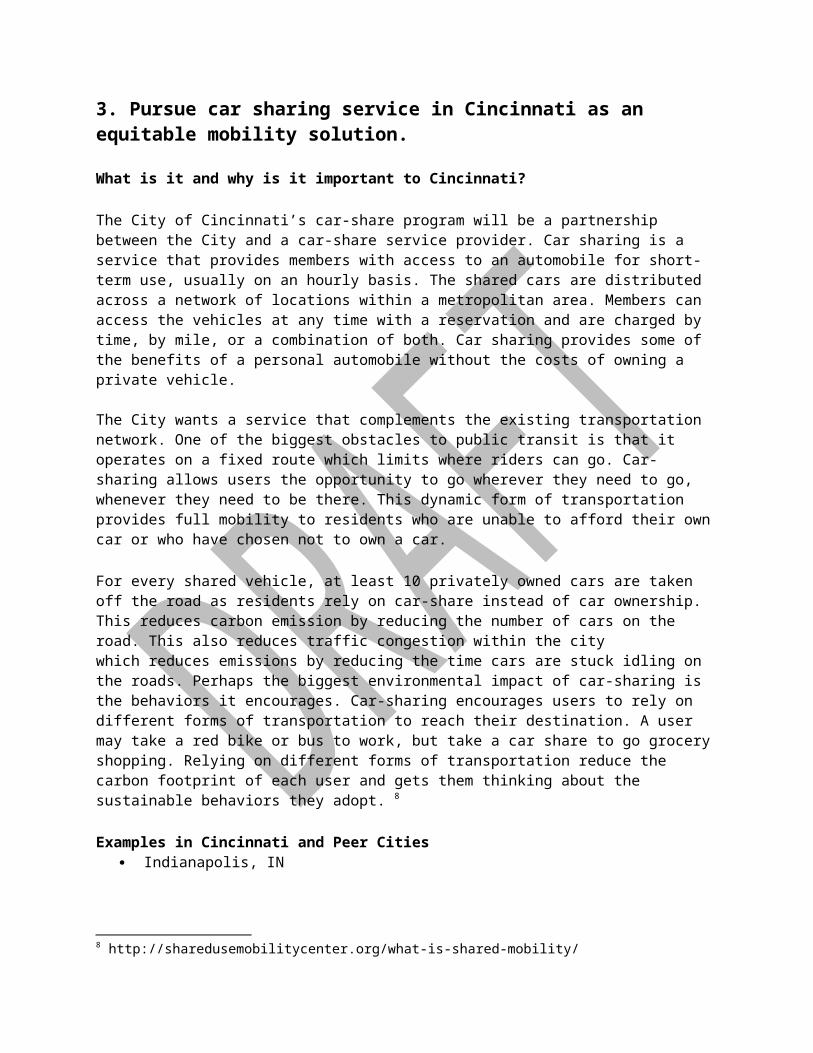
3. Pursue car sharing service in Cincinnati as an equitable mobility solution.What is it and why is it important to Cincinnati?
The City of Cincinnati’s car-share program will be a partnership between the City and a car-share service provider. Car sharing is a service that provides members with access to an automobile for short-term use, usually on an hourly basis. The shared cars are distributed across a network of locations within a metropolitan area. Members can access the vehicles at any time with a reservation and are charged by time, by mile, or a combination of both. Car sharing provides some of the benefits of a personal automobile without the costs of owning a private vehicle. The City wants a service that complements the existing transportation network. One of the biggest obstacles to public transit is that it operates on a fixed route which limits where riders can go. Car-sharing allows users the opportunity to go wherever they need to go, whenever they need to be there. This dynamic form of transportation provides full mobility to residents who are unable to afford their own car or who have chosen not to own a car.
For every shared vehicle, at least 10 privately owned cars are taken off the road as residents rely on car-share instead of car ownership. This reduces carbon emission by reducing the number of cars on the road. This also reduces traffic congestion within the city which reduces emissions by reducing the time cars are stuck idling on the roads. Perhaps the biggest environmental impact of car-sharing is the behaviors it encourages. Car-sharing encourages users to rely on different forms of transportation to reach their destination. A user may take a red bike or bus to work, but take a car share to go grocery shopping. Relying on different forms of transportation reduce the carbon footprint of each user and gets them thinking about the sustainable behaviors they adopt. 8
Examples in Cincinnati and Peer Cities Indianapolis, IN
6 https://www.afdc.energy.gov/vehicles/electric_emissions.php7 https://www.iea.org/publications/freepublications/publication/GlobalEVOutlook2017.pdf
8 http://sharedusemobilitycenter.org/what-is-shared-mobility/
BlueIndy in Indianapolis is the first electric car-sharing service in North America. Once a car is taken out, it can be returned to any of the BlueIndy stations around the city.
Columbus, OH Car2Go is a versatile car-sharing program that allows you to take a car and return it to
any public parking spot within particular regions of the city. Los Angeles, NV
Blue LA is the first car-share to ever specifically target low-income communities in hopes of creating new opportunities for LA’s low-income communities.
Who could help with implementation? Third party car sharing provider Office of Environment and Sustainability Cincinnati Chamber of Commerce - Leadership Cincinnati Department of Transportation and Engineering
Who is the target audience? High density areas of Cincinnati Low income residents
What is the City of Cincinnati’s role in implementation?
The City of Cincinnati will be responsible for selecting a provider to implement a new car-share service for the City. The City will oversee the implementation of the program and ensure that it addresses equity. The City will also work with the provider to ensure that the provided service compliments the City’s parking infrastructure.
Is it feasible? Feasibility: Hard
The City of Cincinnati is currently working with Leadership Cincinnati to identify a qualified car share provider.
Obstacles: Implementing an equitable car-share can be difficult because most models require areas
of high density to be successful which do not always include the areas that would benefit most from a car-share service.
How much will it cost?
Cost Benefit Cost Benefit Ratio
$0.00 (To City of Cincinnati) $ 2,228,500/year (To City of Cincinnati) NA
Actual costs won’t be known until a vendor is identified and a contract is signed. Under the City’s current car-share contract with ZipCar, the City pays nothing and receives $200/month for use of 6 parking spaces. It is likely that a new contract will have no cost to the City.
If the car share provider places 50 cars in Cincinnati, this will enable 500 people to give up their car. The average person saves $4,457/year if they don’t own a car. The net avoided cost of car ownership would be $2,228,500/year.

Keys to Equity
Car-sharing offers another form of reliable transportation that can be used to go anywhere around the City. When an affordable model is created, this provides increased mobility for low income residents and opens them to new opportunities, such as access to better jobs with a shorter transit time.
Timeline for Implementation Expected: 1 - 2 years
Leadership Cincinnati has adopted this project for the year ahead ensuring that progress will continue to be made with a strong system of support behind it.
Greenhouse Gas Impact
Annual Carbon Reduction Potential
2018 2023 2050
370 mtCO2e 1,850 mtCO2e 18,500 mtCO2e
Cars emit 3.7 mtCO2e per 10,000 miles traveled. We assume 100 people utilize car share to replace their car in year one, 500 people by 2023, and 5,000 by 2050.
4. Green the Fleet: Improve the fuel efficiency of the City’s Fleet.What is it and why is it important to Cincinnati?
The City of Cincinnati fleet includes almost 2,500 pieces of equipment. Many operate on a 24/7 schedule to maintain critical services to the residents of Cincinnati. The Cincinnati fleet is currently undergoing significant upgrades through the Capital Acceleration Plan (CAP) which will purchase $40 million worth of vehicles over the next 12 years. This investment is critical as before the CAP, the City’s fleet was out-of-life cycle causing significant costs in maintenance and downtime.
With the transportation sector being the single largest contributor of greenhouse gases in our region, the City has a responsibility to do its part by reducing the emissions from its own fleet. Upgrading Cincinnati’s fleet to a more reliable and more efficient fleet is the first priority. This investment in vehicle replacement will reduce maintenance costs, provide fuels savings, reduce emissions and reduce vehicle downtime. However, to go further the City will require additional investment. Electric vehicles, idle reduction technologies, alternative fuels and supporting infrastructure require additional capital. The VW Emissions Settlement has made available significant funding to the replacement of pre-2010 class 4-8 diesel vehicles. The City will work with partners to apply for grant funds to replace out-of-lifecycle diesel vehicles. Additional funding opportunities exist through the Diesel Emissions Reduction Grant (DERG). Both programs are administered by the OEPA.
If funds are awarded they will be used to offset already allocated expenses through the CAP fund. The offset CAP funding will be placed in a “Green Fleet Fund” and be used to pilot fuel saving and emission

reducing technologies such as battery backed idle reduction, electric vehicles, route optimization, compressed natural gas and alternative fuel infrastructure to support vehicles. Additional fuel savings through the implementation of new technologies could be placed in the “Green Fleet Fund” as well further enhancing the Cities ability to transition to newer, lower emitting technologies. The continued vehicle replacement through the CAP Program and the additional emissions reductions/fuel savings through technologies implemented through the “Green Fleet Fund” will allow the City to reduce overall fuel consumption by 15% by 2023 and 50% by 2028.
Examples in Cincinnati and Peer Cities
Columbus, OH The City of Columbus has been working since 2009 to make all City owned vehicles more
efficient, reducing their impact on the environment. Columbus Green Fleet Plan
Who will be taking the leading roles on this project? Public Services
Who is the target audience? City of Cincinnati fleet
What is the City of Cincinnati’s role in implementation?
The City of Cincinnati will continue to improve the City’s fleet through the CAP program. It will be responsible for identifying and acquiring grants and outside funding that will allow the City to pilot alternative fuels and technologies to reduce fuel consumption.
Is it feasible? Feasibility: Medium
The City of Cincinnati has already begun reducing its fleet emissions and fuel consumption through the CAP program. To implement the “Green Fleet Fund” will require the City being awarded funding through the OEPA or other sources and approval by City Council to appropriate offset CAP funds to the “Green Fleet Fund”.
How much will it cost?
Cost (Idle Reduction) Benefit Cost-Benefit Ratio (3 years)
$175,000 (To City of Cincinnati) $75,000 (To City of Cincinnati) 1:1.29 (2.3-year payback)
Cost of this program will be highly dependent on the technologies selected. Idle management technologies in police cruisers costs approximately $3,500 per car. Installing this technology as new vehicles are placed on line, approximately 50 per year, will result in an overall cost of $175,000 per year with an expected return of $75,000 in fuel savings. Electric vehicles have an incremental cost of
approximately $10,000 when compared to traditional gas cars. Expected return on fuel savings is $800-12,000 per year.
One long term method to reduce fuel consumption is to purchase vehicles with enhanced, market leading fuel economy. The Department of Transportation estimated in 2015 the average fuel economy of US light duty vehicles was 22 mpg. To achieve 15% improved fuel economy from this baseline the City could acquire vehicles with an average 25.3 mpg. At $2.75 for a gallon of gas for a fleet that travels 500,000 miles per year a fleet with an average 22 mpg would spend $62,500 on fuel. The same fleet VMT averaging 25.3 mpg would spend $54,374 on fuel, saving $8,135 or 13%9.
Keys to Equity Reducing overall emissions and increasing lifespan, decreasing asthma.
Timeline for Implementation 1 - 2 years
Volkswagen settlement money may be used to help green the fleet.
Greenhouse Gas Impact
Annual Carbon Reduction Potential
2018 2023 2028 2035
537 mtCO2e 2,686 mtCO2e 8,954 mtCO2e 17,908 mtCO2e
In 2015, City of Cincinnati’s fleet emitted 17,908 mtCO2e. This recommendation calls for a 15% improvement in fuel efficiency by 2023, and a 50% improvement by 2028. By 2035, fleet operations are expected to be carbon neutral.10
5. Encourage corporate sponsorship of transit passes and infrastructure to encourage employee bus and bikeshare ridership.What is it and why is it important to Cincinnati? The Cincinnati region is home to more fortune 500 companies per capita than New York or Chicago. With such a large corporate presence, it is important for these corporations to do their part in reducing their greenhouse gas footprint. Corporations can do that by encouraging employees to commute via bus, and by reducing the size and improving the efficiency of their vehicles fleets. Providing corporate sponsorship of passes is one way to encourage public transit use.9 Average Fuel Efficiency of US Light Duty Vehicles. Bureau of Transportation Statistics. US Department of Transportation. Table 4-23. Accessed January 2018. Web.10 "Greenhouse Gases Equivalencies Calculator - Calculations and References." EPA. Environmental Protection Agency: https://www.epa.gov/energy/greenhouse-gases-equivalencies-calculator-calculations-and-references

Corporate sponsorship of transit passes can help companies reduce the size of their fleet and reduce the costs of owning, maintaining, and parking the vehicles. Employees benefit from reduced fuel and parking cost. Use of transit for commuting reduces traffic congestion and carbon emissions as people share a bus ride rather than driving their own car. This also encourages employees to think about how they are getting to and from work, promoting the use of mixed modal transportation in the City. Metro’s guaranteed ride home program provides bus users with a safety net in the case of an emergency, making the bus system more viable as an alternative to driving. Corporations will be encouraged to invest in transit passes for their employees to reduce their own costs and encourage sustainable behaviors among employees.
Examples in Cincinnati and Peer Cities Cleveland, OH
Green Employee Commuting http://www.city.cleveland.oh.us/sites/default/files/forms_publications/SC-
MAP_Final_10.1.13.pdf Columbus, OH
Challenges businesses to offer incentives for their employees to use alternate modes of transportation.
https://www.theguardian.com/cities/2017/oct/03/free-public-transport- downtown-workers-columbus-car
Who could help with implementation? METRO Better Bus Coalition Ohio-Kentucky-Indiana Regional Council of Governments Red Bike
Who is the target audience? Cincinnati businesses and corporations
What is the City of Cincinnati’s role in implementation?
The City will partner with a group of transportation leaders that can work with Cincinnati businesses to incentivize the use of alternate modes of transportation.
Is it feasible? Feasibility: Medium
Peer cities work with local businesses to increase employee transit use. Levels of success vary from city to city.
Obstacles: Most Cincinnati residents rely on their personal car to get to and from work. Even with
an incentive program, it will be difficult to get residents to change their daily habits, especially for those who do not have a transit connection near them.
How much will it cost?
Cost (for a 6,000-employee company) Benefit Cost-Benefit Ratio

$15,000 (To employer) $60,000 (To employer) 1:4
UC has an arrangement with Metro that enables all 60,000 UC faculty, employees and students to ride Metro for $1 per ride. UC pays Metro $150,000/year for this arrangement. An employer the size of City Government (6,000 employees) could offer employees $1 fares at an annual cost of about $15,000. According to the American Public Transit Association, a 10% change in bus fares results in a 4% change in ridership. Therefore, this fare reduction of about 40% will yield a 16% ridership increase. This would boost the bus mode share in Cincinnati from 3% to 3.5%, or 30 additional transit riders in a 6,000-employee company. The cost to provide a parking space in an urban surface lot is about $2,000 per year, so if this employer provides employee parking, they can save $60,000/year just by eliminating 30 parking spaces.11
Keys to Equity
Car ownership is one of the largest expenses for the average American. Creating a reliable and affordable public transit system for employees would allow some families to reduce their reliance on a personal car, creating a chance to reduce their monthly bills.
Timeline for Implementation 1 - 2 years
The City will organize corporate partners and transit leaders to offer transit opportunities to corporate employees.
Greenhouse Gas Impact
Annual Carbon Reduction Potential
2018 2023 2050
470 mtCO2e 2,350 mtCO2e 15,040 mtCO2e
A typical passenger vehicle emits 4.7 mtCO2e per year. We assume a corporate sponsorship program could help 100 employees a year opt to use bike or bus for daily commuting in year one. We assume this number will increase by 100 employees per year.12
6. Improve neighborhood walkability, by improving sidewalk connectivity and pedestrian safety, especially in low-income neighborhoods.What is it and why is it important to Cincinnati?
Walkability is important for maintaining a healthy and stable community. Walking is a healthy, affordable and environmentally friendly way to get around the neighborhood. The City will work to 11 http://www.vtpi.org/tca/tca0504.pdf12 https://www.epa.gov/greenvehicles/greenhouse-gas-emissions-typical-passenger-vehicle
improve sidewalks and other pedestrian infrastructure in need of repairs and build new sidewalks, especially in low income neighborhoods. Sidewalks are important to every member of the community as they connect residents with local stores, access to transportation (bus stops especially), jobs, schools, parks, etc.
The City will seek a new way to fund and build adequate sidewalk infrastructure. Currently, property owners are expected to bear the costs of sidewalks, whether or not they are willing and able to. The City should fund repairs and new sidewalks because the sidewalk is public infrastructure, just like the road. The cost of sidewalks should come from a new revenue sources specifically earmarked for sidewalks. Like roads, street trees, water pipes, sewers, and streetlights, public infrastructure should not be the responsibility of private land owners.
Intersections, including traffic signal settings, curb cuts, and crosswalks, are important elements of a neighborhood’s walkability. Efforts to improve walkability will focus on intersections in addition to sidewalks.
For low income residents, sidewalks and walkable intersections are important because many do not own cars and rely on the public transit system. Sidewalks not only provide residents with safe paths throughout their own neighborhoods, but also improves access to different modes of transportation. Access to transportation opens the door for new job opportunities for disenfranchised residents. Neighborhood walkability creates opportunities and strengthens the sense of community for Cincinnati residents. The City will improve and expand its sidewalk network and walkable intersections.
Examples in Cincinnati and Peer Cities Madison, WI
The City of Madison is working to identify the current conditions of neighborhoods around the City, including neighborhood walkability, to better plan for future development.
Columbus, OH The City of Columbus is working to increase the rate of sidewalk installations around the
City.
Who could help implement this project? Department of Transportation and Engineering Tristate Trails
Who is the target audience? Low income communities Areas near bus stops Cincinnati neighborhoods without adequate sidewalks
What is the City of Cincinnati’s role in implementation?
The City of Cincinnati will be responsible for continuing to identify sources of funding so new trails and sidewalks can be put in throughout Cincinnati neighborhoods.
Is it feasible?

Feasibility: Hard – Financing for sidewalks and trails can be hard to find. A new fee would require a public vote. In exchange for that fee, land owners will no longer be financially liable for the cost of sidewalks.
How much would it cost?
Cost per mile Benefit per mile Cost-Benefit Ratio
$160,512 (To DOTE) $126,000 (To DOTE) 1.27:1
Cincinnati currently has 1700 miles of improved sidewalk valued at over $215 million [1]13. This boils down to $126,000 in value attributed to each mile. Cincinnati Sidewalk Safety reports that the average cost to produce a mile of sidewalk runs around ±$130,000; it is important to bear in mind also that $1 in preventive maintenance can save $6-$10 down the road14.
Sidewalks enhance the resale value of property, sometimes adding as much as 15x their cost to the property’s sale price. According to AARP, retail property with a WalkScore rating of 80-100 were 54% more valuable than retail property with a walk score <20[3]15. Increases in desirability, reduction in crime and improvements in community health can all be tied to greater sidewalk infrastructure. Individuals living in low income and racial/ethnic minority communities experience disproportionate ‐access to environmental features that support physical activity16.
Pedestrian Safety is a major component of walkability. Between fiscal year 2016-2017 there was an 11% spike in pedestrian fatalities17. More specific data can inform us that the pedestrian crash risk for crossing the arterial without a median was 6.48 times higher than for crossing the arterial with a median. Pedestrian crashes account for 12% of traffic fatalities annually-75% of these are not at intersections. Providing raised medians or pedestrian refuge areas at pedestrian crossings at marked crosswalks has demonstrated a 46 % reduction in pedestrian crashes. At unmarked crosswalk locations, pedestrian crashes have been reduced by 39% with the same development [6]18. The average cost of a pedestrian fatality in a motor vehicle incident is just under $5 million (adjusted to present value) [7] 19. Raised medians alone have been found to reduce motor vehicle crashes by 15 percent, improve travel time reliability, provide space for landscaping within the right-of-way (which can be utilized to reduce urban heat island effects), and can be less expensive to build and maintain than paved medians.
Keys to Equity
13 Sidewalk Safety Program. City of Cincinnati Department of Transportation & Engineering. 2017.14 Carrillo, Esteban et al. The Costs of Owning and Operating Sidewalks. Georgia Institute of Technology December 12, 2012.15 AARP Livability Fact Sheets. AARP Education and Outreach & Walkable and Livable Communities Institute. 2014. 16 Kelly, Carol et al. Association of Sidewalk Walkability and Physical Disorder with Area-Level Race and Poverty. US National Library of Medicine NIH. November 2007.17 Retting, Richard; Schwartz, Sam. Pedestrian Traffic Fatalities by State: 2016 Preliminary Data. GHSA.
18 Safety Benefits of Raised Medians and Pedestrian Refuge Areas. FWHA Safety Program. US Department of Transportation. February 1, 2013.19 Estimating the Cost of Unintentional Injuries. National Safety Council. 2017.

Walkable neighborhoods allow residents to get out and walk from one place to another rather than always having to rely on a personal car or public transit system. Walking is the cheapest transportation option. Walking is also healthier and helps residents get out and enjoy the fresh air, promoting a happier lifestyle.
Timeline for implementation 3 - 4 years
The City will identify areas that need sidewalks and work with partners to improve the walkability and safety for pedestrians of Cincinnati neighborhoods.
Greenhouse Gas Impact
Annual Carbon Reduction Potential
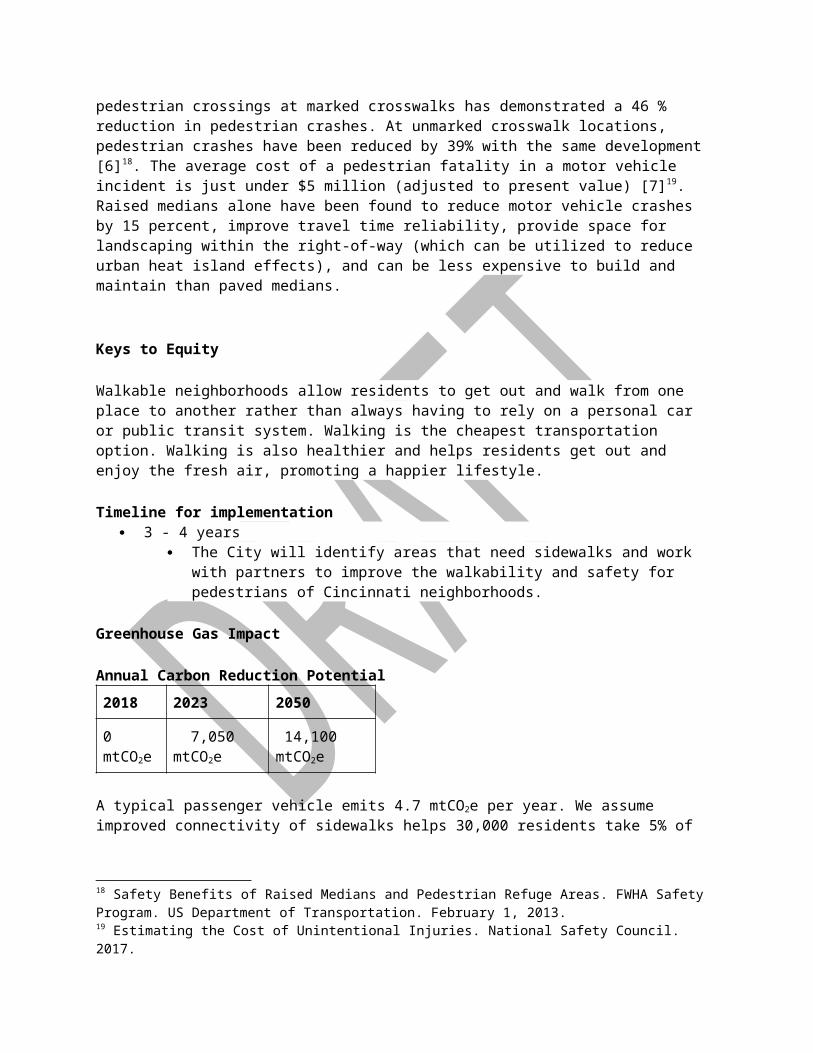
2018 2023 2050
0 mtCO2e 7,050 mtCO2e 14,100 mtCO2e
A typical passenger vehicle emits 4.7 mtCO2e per year. We assume improved connectivity of sidewalks helps 30,000 residents take 5% of their local travel by foot or by bike after 5 years. We assume that increases to 10% of travel by 2050.20
7. Police enforcement & legislative support for bike & pedestrian safety.What is it and why is it important to Cincinnati?
According to the Census Bureau, 0.9% of Cincinnati commuters travel by bicycle. Some Cincinnatians say that Cincinnati is too hilly for bicycles, or that the weather is not suitable, but San Francisco is hillier and more than 4% of San Francisco commuters travel by bike, and Minneapolis is much colder and more than 4% of commuters in Minneapolis bicycle. Cincinnatians could bicycle far more than they do.
One thing that holds Cincinnatians back from biking is the perception that it is unsafe. To significantly improve safety, and the perception of safety, for bicycles and pedestrians in Cincinnati, it is necessary to improve bicycle infrastructure, to create laws that mandate safe conduct by cyclists and drivers of motor vehicles, and to enforce those laws. Creating an interconnected pathway system will allow bikers and pedestrians to move around the City safely. It is important to have proper signage and street markings so cars can safely travel with bikers and pedestrians. Giving bikes and pedestrians the right of way and working to create bike lanes and sharrows will go a long way in improving safety. Local law enforcement must enforce laws that ensure the safety of bikers and pedestrians in Cincinnati.
It is important to educate both bikers and pedestrians in addition to drivers of the rules and regulations around walking and biking. This ensures that vehicles and bikes respect one another on the road and are
20 https://www.epa.gov/greenvehicles/greenhouse-gas-emissions-typical-passenger-vehicle

aware of the proper road etiquette. Biking and pedestrian safety is important because the City wants to encourage people to use these economical and environmentally friendly modes of transportation to get around Cincinnati.21
Examples in Cincinnati and Peer Cities Madison, WI
Who could help implement this project? Community Councils Department of Transportation and Engineering All local Police Departments and agencies
Who is the target audience? Cincinnati cyclists Pedestrians All Cincinnati residents
What is the City of Cincinnati’s role in implementation?
The City of Cincinnati will be responsible for the education and enforcement of laws surrounding safety for bikers and walkers.
Is it feasible? Feasibility: Medium
How much would it cost?
Cost Benefit Cost-Benefit Ratio
$15,000 (To combined Police Departments)
$5.3 million saved (To general public)
1:353
The cost of enforcement of cycling laws is small when we consider the danger of not enforcing. The economic cost of the average cycling fatality to the community in 2012 was $4,538,000. The average cost of injury was $58,700, and if the injury was incapacitating, $230,00022. The best way to offset this is with both passive and active enforcement of laws to ensure cyclist safety.
Keys to Equity
21 http://www.bikeleague.org/sites/default/files/Where_We_Ride_2014_data_web.pdf22 Economic Cost of Crashes Involving Bicyclists and Pedestrians (2012). Pedestrian and Bicycle Information Center. U.S. Department of Transportation Federal Highway Administration and the Bicycle Information Center of the University of North Carolina Highway Safety Research Center. Accessed December 2017.

Walking and biking are cost effective ways to get around from place to place. Making it safe and easy to get around the City by walking and biking will provide low-income residents with a means to get around for a low cost. It also gets people active and exercising at the same time.
Timeline for Implementation Expected: 1 - 2 years
The City will be able to take a few quick steps to better enforce pedestrian and biking safety.
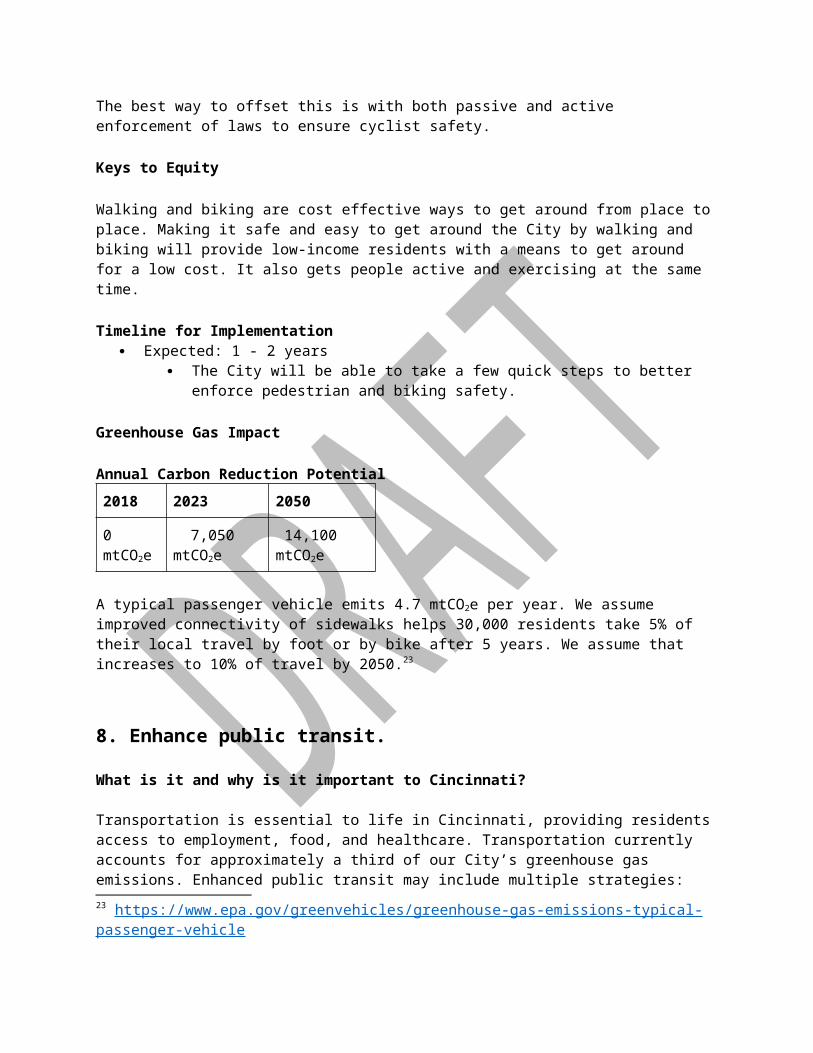
Greenhouse Gas Impact
Annual Carbon Reduction Potential
2018 2023 2050
0 mtCO2e 7,050 mtCO2e 14,100 mtCO2e
A typical passenger vehicle emits 4.7 mtCO2e per year. We assume improved connectivity of sidewalks helps 30,000 residents take 5% of their local travel by foot or by bike after 5 years. We assume that increases to 10% of travel by 2050.23
8. Enhance public transit.What is it and why is it important to Cincinnati? Transportation is essential to life in Cincinnati, providing residents access to employment, food, and healthcare. Transportation currently accounts for approximately a third of our City’s greenhouse gas emissions. Enhanced public transit may include multiple strategies:
Alignment of public transit routes and schedules with employment, health care, and educational opportunities
Implementation of electric buses Implementation of Bus Rapid Transit (BRT) along major transportation corridors Partnering with alternative transportation services, like car share, rideshare, and
bikeshare Development of a tap card system to pay fares on multiple platforms Explore the use of dedicated bus lanes
The Southwest Ohio Regional Transit Authority (Metro/SORTA) is the overseeing body of the Cincinnati public transit system. They are currently facing a significant budget shortfall. Additional funding is needed to maintain the current level of service. Without additional funding SORTA will have to raise bus fares and cut bus routes throughout the City. The Cincinnati region should be working to expand and improve its bus system creating new opportunities for its residents rather than cutting what they have. To achieve a steady and adequate revenue stream, a regional funding mechanism is essential.
23 https://www.epa.gov/greenvehicles/greenhouse-gas-emissions-typical-passenger-vehicle

One source of funding that has been proposed is a 0.5 to 1.0 percent county sales tax. While not large enough to support an optimal transit system, that would certainly be a step in the right direction. Almost every other major metropolitan area in the country has a regional funding mechanism for transit. Cincinnati is one of very few where the City is footing the bill alone. Another proposal is to form a multi-county, multi-state transportation authority to tackle the region’s public transportation needs. There are also federal funding opportunities that could be pursued to help with maintaining the funding for SORTA. An efficient transportation system provides residents with opportunities, reduces the City’s carbon emissions, and makes Cincinnati a more attractive place for prospective residents. The City will continue to work with SORTA, Hamilton County, and other regional partners to identify new streams of funding and enable expanded service.
Examples in Cincinnati and Peer Cities Madison, WI
Madison implemented a Bus Rapid Transit system based on analysis of needs. http://www.madisonareampo.org/BRT.cfm
Who will be taking the leading roles on this project? METRO Ohio-Kentucky-Indiana Regional Council of Governments Better Bus Coalition
Who is the target audience? METRO
What is the City of Cincinnati’s role in implementation?
The City of Cincinnati will support SORTA to secure reliable funding for transit.
Is it feasible? Feasibility: Hard
An increase in the sales tax will be challenging and may require a public vote.
How much will it cost?
Cost Benefit Cost-Benefit Ratio
Electric Bus $250,000 premium per bus (To METRO/SORTA)
$318,000 savings/bus (To METRO/SORTA)
1:1.3 lifetime
Bus Rapid Transit
$21,500,000/mile (To METRO/SORTA)
TBD (To METRO/SORTA) NPV 1:0.92
The many factors of this recommendation are discussed below:
Realignment of routes and procedures can be conducted by METRO/SORTA for nominal cost.

Electric Busses carry a purchase cost premium of $200,000-$300,000 compared to an average diesel transit bus [1]24. The City of Cincinnati has roughly 500 busses, some utilizing diesel and others are hybrid variants. Electric busses offer many advantages. Columbia University analyzed a similar proposal for New York City and calculated the reduced cost of ownership at $17,500 per year. Regenerative braking improves brake life 50%-100% and improves fuel economy up to 50%. Lifetime cost savings for electric are estimated at $168,000 per bus and bus payback was estimated to be 5.71 years, combined with an estimated $150,000 of value related to reduction of respiratory and related diseases25.
Development of BRT will require dedicated bus lanes, thruways and iconic stations. Cleveland Ohio constructed a total 9.38 miles of BRT thruway (58 stations and 24 vehicles) at a total cost of $200 million26. This is roughly $21,500,000 per mile, while variable engineering costs do play a large factor. Upon examination of their BRT program, Madison, Wi estimated a NPV of project benefits to be 92% of capital costs over a 30-year project lifetime27and annual operating costs in Seattle reduced to $2.7 million per mile28.
Partnering with rideshare services can be done for little to no cost and is greatly enhanced by the AV pilot program (see Transportation #10).
A multi-platform payment system can be accomplished with the mobility app (Transportation #9).
Keys to Equity Improve access to transit for low income neighborhoods. Keep transit fares low, or have a subsidy for those who need it.
Timeline for Implementation 1 - 2 years
METRO is facing a budget deficit and will need additional funding soon to maintain its current services.
Greenhouse Gas Impact
Annual Carbon Reduction Potential
2018 2023 2050
0 mtCO2e 2,033 mtCO2e 8,134 mtCO2e
24 Hybrid bus costs and benefits. Environmental and Energy Study Institute. Accessed January 2018. Web.25 Aber, Judah. Electric Bus Analysis for New York City Transit. Columbia University. May 2016. Accessed January 2018. Web.26 National BRT Institute. 2015. Web.27 Transport 2020 Bus Rapid Transit: A Cost Benefit Analysis. Madison Area Bus Advocates. Accessed January 2018. Web28 Madison Street BRT. Small Starts Project Development. Seattle, Washington. November 2016. Accessed January 2018. Web
An enhanced transportation system will increase public transit ridership by 5% over 5 years. In 2016, regional public transit authorities reported a total of 109,918,000 passenger miles travelled. A 5% increase would mean an additional 5,495,900 miles travelled via transit rather than personal automobile. Cars emit 3.7 mtCO2e per 10,000 miles traveled. This increase in public transit ridership would yield a GHG reduction of 2,033 mtCO2e. A 20% increase by 2050 would create an additional 21,983,600 public transit passenger miles travelled and would yield a GHG reduction of 8,134 mtCO2e.
9. Increase connectivity and cohesion within multimodal transportation options.What is it and why is it important to Cincinnati?
Cincinnati has a wide range of transportation options (bus, streetcar, bike share, ridesharing, carpooling, etc.). To provide the most effective transportation network for its residents, the City will increase connectivity between the different modes of transportation. Increasing connectivity allows residents to use a combination of transportation options creating a more reliable and efficient transportation network. Residents could, for example, take the bus from their neighborhood bus stop to the nearest Red Bike location and then bike the final leg of their trip. One of the most common complaints Metro receives is the lack of a uniform system of payment for the City’s transportation options. The City will work with Metro and other transportation partners in the City to create an app that helps people map out mixed modal routes and pay in a uniform system. Ideally, Cincinnati residents could have a single card that would allow them to pay for the bus, Red Bike, rideshare, carshare, taxi, carpooling, the streetcar, and parking all in one platform. With so many different partners with different systems of payment, a one card system may be challenging, but the goal of moving seamlessly through the City is worth the effort. The City will explore a multi-modal mobility app to plan and pay for trips based on minimizing travel time and cost.
The use of shared modes of transportation reduces carbon emissions, decreases traffic congestion, and frees up parking in the City. Streamlining the process into one platform will make residents more likely to take advantage of the existing transportation network because the process will be easier for residents. The City can also evaluate the existing transportation network to identify ways to improve the efficiency of the network. A successful transportation system connects residents with economic opportunities, especially low-income residents who may have limited access to transportation, and reduces the environmental impact of the City’s transportation sector.
Examples in Cincinnati and Peer Cities Columbus, OH
The City of Columbus is working to better integrate its public transit system and ensure that it is adaptable for future transportation technologies.
Who could help with implementation? Department of Community and Economic Development Office of Performance and Data Analytics METRO

Who is the target audience? All Cincinnati residents, especially those who already rely on the public transit system All mobility providers
What is the City of Cincinnati’s role in implementation?
The City of Cincinnati will partner with stakeholders, including Metro, to improve intermodal connectivity. The City will work with a third party to create a multimodal app that will help improve access and cohesion between the different modes of transportation in the City.
Is it feasible? Feasibility: Medium
It is challenging to synchronize the functions of multiple, incompatible technology systems. However, each system has a relatively short life expectancy, so at worst, compatibility can be a primary requirement when it comes time for system updates.
Obstacles: Cincinnati, like most US cities developed throughout the 20th century, are designed
around the use of personal cars. Cincinnati will need to continue to change its infrastructure so it is better adapted to serve public transit, shared mobility platforms, and walkers and bikers.
How much will it cost?
Cost Benefit Cost-Benefit Ratio
~$1,000,000 (To City of Cincinnati) TBD (To transit users) NA
Development of a multimodal transportation app will likely require a two-sided marketplace app platform. It will be important for users to know exactly where the bus is or whether there are bikes available. A two-sided market system would enable this flexibility. App development costs can be highly variable. Given the relative complexity this would require, it is likely it could cost $200,000-$1,500,000.29 An app that allows pay-by-mobile via a credit card is also likely to streamline the process of multiple fare methods.
[1]
Keys to Equity
Owning a car is very expensive. Connecting different modes of transportation improves the entire system and makes it easier for residents to quickly get from one place to another. A better mobility system decreases reliance on owning a car and allows more residents to choose a car-free lifestyle.
Improving the transportation system allows Cincinnatians to get from place to place quicker, reducing the time spent commuting to a job or to the store, putting more time back in their lives. This is crucial for low income residents who may be working long hours or multiple jobs to make ends meet.
29 Yarmosh, Ken. App Development Costs. SavvyApps.com. August 22, 2017. Accessed January 2018. Web.
Timeline for Implementation 1 - 2 years
A trip planning app with payment functionality will be in use within 1 year. Getting all mobility providers to accept payment via the app may take 2-5 years.
Greenhouse Gas Impact
Annual Carbon Reduction Potential
2018 2023 2050
0 mtCO2e 2,033 mtCO2e 8,134 mtCO2e
A more accessible multi-modal transportation system will help increase public transit ridership by 5% over 5 years. In 2016, regional public transit authorities reported a total of 109,918,000 passenger miles travelled. A 5% increase would mean an additional 5,495,900 miles travelled via transit rather than personal automobile. Cars emit 3.7 mtCO2e per 10,000 miles traveled. This increase in public transit ridership would yield a GHG reduction of 2,033 mtCO2e. A 20% increase by 2050 would create an additional 21,983,600 public transit passenger miles travelled and would yield a GHG reduction of 8,134 mtCO2e.30
10. Create a transit link between Downtown and Uptown.What is it and why is it important to Cincinnati? Downtown and Uptown are Cincinnati’s largest centers of employment. Improved transit options to connect the two areas will help connect people to jobs, entertainment, education, and health care. In 2016 the City of Cincinnati completed construction of the Cincinnati Bell Connector, the City’s streetcar. The streetcar operates on 3.6-mile fixed loop that connects the riverfront at The Banks with Downtown and Over the Rhine. The streetcar has spurred significant investment in real estate development projects along its route. Connecting the streetcar to Uptown would help create new economic opportunities for the City. An expanded streetcar is one way to link the current streetcar to Uptown. Other possibilities that merit consideration include underground rail, aerial tram, and bus options. The City will conduct a feasibility study comparing various options for connecting downtown to uptown, and will build a transit connection based on the results of that study.
Examples in Cincinnati and Peer Cities Cleveland, OH
The City of Cleveland is working to improve transit connections through a variety of methods between their main business centers to reduce the amount of travel residents and employees will need to make between them.
Portland, OR
30 https://www.epa.gov/greenvehicles/greenhouse-gas-emissions-typical-passenger-vehicle
Portland’s Aerial Tram travels 3300 feet at 22 miles per hour and rises 500 feet. The 2 cars hold 79 people each and carry 20,000 passengers per day. Construction cost was $57 million.
Who could help with implementation? METRO Better Bus Coalition Uptown Consortium UC
Who is the target audience? Residents, employees and patrons of uptown and downtown
What is the City of Cincinnati’s role in implementation?
The City, in cooperation with stakeholders, will commission the feasibility study. The City will partner with stakeholders to build and operate the Downtown to Uptown Link.
Is it feasible? Feasibility: Hard
This is capital intensive but Cincinnati has routinely completed major transit improvements.
How much would it cost?
Cost Benefit annual fare average Cost-Benefit Ratio
See table, below (To transit authority)
$2,033,000 (To transit authority) NA
Extension of a transit link to uptown is a cost intensive recommendation which has the potential to dramatically alter the ability of residents to easily travel across multiple neighborhoods in Cincinnati. This recommendation carries the potential to improve neighborhood connectivity between the Central Business District, Avondale, Clifton, Clifton Heights, University Heights and Fairview (CUF), Corryville, and parts of Mt. Auburn. A cost table estimate of various options is below:
Transit Mode Construction Cost per mile Miles Needed Total Cost
Streetcar 10-25 million [1] 3 $30-75 million
Subway 100-1000 million [2] 1 $100-1000 million
Gondola 3-12 million [3] 1 $3-12 million
Aerial tram 57 million 1 $57 million

Bus/Autonomous bus
NA 3 NA
Due to the highly variable costs it will be difficult to gain an accurate estimate until a feasibility report can be completed. Depending on the option selected, costs could range anywhere from $3 million to $1 billion. Assuming similar ridership to the Streetcar at the average of the two fare options ($1.50) we can estimate that annual fares will be roughly $2,033,600. This analysis does not attempt to factor in potential property value shifts, a potential for sustained increase in ridership or the significant business opportunities that the transit link provides.31,32,33
Keys to Equity
Regardless of the transportation mode selected, fares must be set at an affordable price, or some accommodation must be made to make mobility affordable for all.
Timeline for Implementation Feasibility Study: 1 year Construction: 3-7 years, depending on mode.
Greenhouse Gas Impact
Annual Carbon Reduction Potential
2018 2023 2050
0 mtCO2e 2,482 mtCO2e 2,482 mtCO2e
Using an average estimated fuel efficiency for existing vehicles of 22 miles per gallon (the average fuel economy of cars and light trucks in the US in 2015), the US EPA conversion factor of 8.89 x 10 -3 metric tons CO2 per gallon of gasoline, and a conversion factor for CH4 and N2O emissions emitted from tailpipes, we estimated that each personal car mile avoided by using the transit link would prevent 0.4 kg of CO2e emissions.
Assuming 10,000 rides per day, 365 days per year, with 1.7 mile of driving avoided each trip. 6,205,000 vehicle miles avoided will save 2,482 mtCO2e per year.34
31 http://www.reconnectingamerica.org/assets/Uploads/bestpractice175.pdf32 https://pedestrianobservations.com/2011/05/16/us-rail-construction-costs/ 33 https://www.citylab.com/transportation/2013/04/golden-age-gondolas-might-be-just-around-corner/5220/
34 "Greenhouse Gases Equivalencies Calculator - Calculations and References." EPA. Environmental Protection Agency: https://www.epa.gov/energy/greenhouse-gases-equivalencies-calculator-calculations-and-references
11. Implement and update 2010 Cincinnati Bike Plan and Cincinnati Riding or Walking Network (CROWN) Plan.What is it and why is it important to Cincinnati? The 2010 Cincinnati Bike Plan was created by the Department of Transportation and Engineering, to outline projects that would make Cincinnati a bike friendly City. Biking offers a healthy, economically responsible, and environmentally friendly alternative to driving a car. One of the biggest problems with the City’s existing bike infrastructure is a lack of connectivity between the different trails and routes. This lack of connectivity discourages biking as a viable mode of transportation in Cincinnati.In 2015 the transportation sector made up 31% of Cincinnati’s carbon emissions. One important step in becoming a greener city is improving alternative types of transportation, giving people an option other than simply driving their car. The 2010 Bike Plan lays out a framework to improve and implement bike paths, bike lanes, and sharrows (shared lanes for bikes and cars). Key elements of the Bike Plan include:
mapping out an integrated on-street and off-street bikeway network describing the bicycle facilities that will make up the network addressing bicycle parking needs stressing safety education for motorists, bicyclists and youth providing an action plan for encouragement and enforcement recommending transportation and development policy changes identifying how bicycle use should be integrated into new rail transit systems that
are being planned providing guidance regarding street maintenance and management practices.
Cincinnati is home to many beautiful parks and many unique business districts, providing an opportunity for an interconnected biking system in the City. Updating and implementing the 2010 Bike Plan would help Cincinnati strengthen its transportation network and offer its residents an economic and healthy way to get from place to place.
Examples in Cincinnati and Peer Cities Cincinnati Bike Plan, https://www.cincinnati-oh.gov/bikes/bicycle-transportation-plan/ Cincinnati Riding or Walking Network (CROWN)
Who will be taking the leading roles on this project? Department of Transportation and Engineering Tri-State Trails
Who is the target audience? Cincinnati residents Bikers Walkers
What is the City of Cincinnati’s role in implementation?
The City will organize local partners and lead implementation of the 2010 Bike Plan.

Is it feasible? Feasibility: Medium - Cincinnati has experience building bike and pedestrian infrastructure. The
challenges will come in securing funding and building community consensus for each construction project.
How much would it cost?
Cost Benefit Cost Benefit Ratio
Bike Plan (Phase 1)
$ 12,172,817 (To City of Cincinnati)
$928,125 (To Public)
11.5-year payback
CROWN Plan $ 50,700,000 (To City of Cincinnati) TBD (To Public) TBD
The 2010 Bike Plan estimates that Phase 1, including 103 miles of bike lanes and paths, would cost $12.12 (adjusted by CPI to inflation, February 2018, from 2010 study) million and would double the number of bicycle commuters. 675 additional commuters at 2,500 miles per year and $0.55 per mile in avoided automobile costs would save $928,125 per year.
The CROWN system plan benefits from the fact that 70% of the mileage is already in construction and it will only take minor renovation to these portions to bring it together. The key to connectivity is the Urban Trail Loop. It would cover 30 miles (9 of which are complete), would be easily accessed by 242,000 people and cost $45.7 million. CROWN highlights another 39 miles of neighborhood arterial connections that are needed.35 Since these are connectors, not the trail itself, they could be on-road bike lanes. A five-foot bicycle lane average cost is $130,000 per mile.36 In total, these arterial connectors will likely cost another $5 million. Together the CROWN completions plus arterial connectors should cost approximately $50.7 million.
Studies show that trails have a large benefit. Maryland found a ratio of trail associated tax revenues to maintenance of 1.5:1. Trails can also abate costs by serving utility needs. 40% of rail trails in America generate funding this way.37 Improved property values are commonly cited. A study of 1762 houses within 10000 feet of the Little Miami Scenic Trail found home buyers were willing to pay $9000 more to live within 1000 feet of a trail.
Keys to Equity
A comprehensive network of biking and walking paths will allow Cincinnati residents to safely travel from one place to another without the need of a car. Walking and biking is a cost-effective way to get around town and encourages residents to be active. Safe biking lanes will also allow people to commute to a job without the worry of competing for space on the road with cars.
35 The CROWN. Green Umbrella, Tri State Trails. Web.36 Bicycle Lanes. Pedestrian and Bicycle Information Center. USDOT Federal Highway Administration. Pedestrian and Bicycle Information Center within the University of North Carolina Highway Safety Research Center. Accessed January 2018. Web.37 Economic Benefits of Trails. Pennsylvania Land Trust Association. Conservationtools.org. Web.

Special attention must be paid to biking infrastructure for disadvantaged communities.
Timeline for Implementation 3-5 years
Cincinnati is currently expanding their trail network with projects such as the CROWN plan. Partner organizations will continue work on many of these projects with more planned to start in 2018. However, additional funding will be needed to get the 2010 Bike Plan and CROWN fully implemented.
Greenhouse Gas Impact
Annual Carbon Reduction Potential
2018 2023 2050
2010 Bike Plan 0 mtCO2e 709 mtCO2e 709 mtCO2e
CROWN 0 mtCO2e 1,050 mtCO2e 1,050 mtCO2e
Cars emit 4.2 mtCO2e per 10,000 miles traveled. We assume Phase 1 of the 2010 Bike Trail would create 675 additional bike commuters travelling 2,500 miles per year, reducing vehicle miles travelled by 1,687,500, and eliminating 625 mtCO2e per year. We assume CROWN, would produce an additional 1,000 bike commuters travelling 2,500 miles per year, reducing vehicle miles travelled by 2,500,000.3839
12. Continue to support Red Bike (bike share) as an equitable mobility solution.What is it and why is it important to Cincinnati?
Cincinnati Red Bike is a bike share program that currently has 442 bikes spread across 57 locations providing Cincinnati residents with a fun and sustainable way to get around. The program had over 100,000 users in 2016 alone and continues to grow and expand around the City. The current locations are primarily located in Downtown, The Banks, Newport, Over the Rhine, and Uptown. These are some of Cincinnati’s most dense and vibrant business districts and have helped to grow the local economy.
The City of Cincinnati will work with Red Bike and other partners to continue Red Bike’s growth in number of stations, bikes, and ridership. A special focus will be placed on increasing low-income ridership. The City will also explore dockless bike sharing programs which offer unique challenges, but also benefits along with the current point to point bike sharing program.
Expanding Red Bike beyond the downtown area will offer another mode of transportation, other than the bus, to get around town. This is especially important in low income neighborhoods where a Red Bike system will offer residents a healthy and environmentally friendly way to get Downtown. The City will
38 https://www.epa.gov/greenvehicles/greenhouse-gas-emissions-typical-passenger-vehicle39 https://www.epa.gov/energy/greenhouse-gases-equivalencies-calculator-calculations-and-references

work with Red Bike to offer discounts on the rates for low income residents to ensure they have equal access to the program, and to overcome participation barriers, like the requirement to have a credit card. A successful bike sharing program reduces greenhouse gas emissions in the City, provides a healthy mode of transportation, and creates economic opportunities for residents by connecting neighborhoods with the City’s business districts.
Examples in Cincinnati and Peer Cities Columbus, OH
Columbus has been working to offer discounts to low income residents for its CoGo bike-sharing service.
Who will be taking the leading roles on this project? Red Bike
Who is the target audience? Workers in the urban core Residents in the urban core Low income residents
What is the City of Cincinnati’s role in Implementation?
Case Study: Cincinnati Red Bike
Providing the City nearly 500 bikes across 57 stations, RedBike has been a key component of sustainable transportation in Cincinnati. They have been able to attract nearly 50 thousand unique users and have assisted in the burning of 36 million calories. Redbike ridership has been able to offset over 860,000 pounds of CO2 emissions and continues to do so.

The City of Cincinnati will work with Red Bike to create discounts and incentives for low income residents. The City will also work with Red Bike to identify locations to expand Red Bike to benefit low income communities.
Is it feasible? Feasibility: Medium
Red Bike has been a very successful bike sharing program, but it can be difficult to change the habits of residents, in this instance low income residents, who may not be used to using a bike to get from one place to another.
Obstacles: Red Bike locations are currently located in high density areas where they get the most
traffic, but those locations are not always the best when trying to establish an equitable system. it will require careful planning to ensure that stations are placed in spots where they will be used regularly.
How much will it cost?
Cost of 20% system expansion
Benefit: 20% program revenue expansion
Cost-Benefit Ratio (5 year)
$68,000 (To Redbike) $60,000 per year (To Redbike) 4.4:1
If RedBike continues to expand at a rate of 20% per year, that will require an additional 44 bikes and 6 stations in the 1st year, at a cost of $164,000. A ridership increase of 20% will mean an additional 20,000 rides per year. If 80% of the station costs are paid by sponsors, the remaining first year cost of expansion is $68,000. A 20% increase in program income would yield $60,000/year or $300,000 over 5 years.
Keys to Equity
Biking is a cost-effective way to get from one place to another, while also getting in some exercise. Bike sharing can provide residents with a reliable source of transportation right in their neighborhoods. With a cost-effective model, bikeshares save low income residents money and offer them alternative modes of transportation that may be quicker and easier to use than other public transit options.
Timeline for Implementation 1 - 2 years
The City has worked with Red Bike to implement the service and will continue with this partnership to expand the existing services and put a special focus on low income residents.
Greenhouse Gas Impact
Annual Carbon Reduction Potential
2018 2023 2050
12.6 mtCO2e 63 mtCO2e 403.2 mtCO2e

If Red Bike grows 20% each year, that will mean adding 20,000 rides per year. If the average ride is 1.5 miles, and cars emit 4.2 tons of CO2 per 10,000 miles travelled, this recommendation will avoid 12.6 tons in year 1, and an additional 12.6 tons per year for each subsequent expansion.