Embed Size (px)
Citation preview
REGULAR MEETING
Thursday, August 1, 2019 11:00 AM - 12:00 PM
SCAG MAIN OFFICE 900 Wilshire Blvd., Ste. 1700
RC Board Room
Los Angeles, CA 90017 (213) 236-1800
If members of the public wish to review the attachments or have any questions on any of the agenda items, please contact Tess Rey-Chaput at (213) 236-1908 or via email at [email protected]. Agendas & Minutes for the TC - Transportation Committee are also available at: www.scag.ca.gov/committees SCAG, in accordance with the Americans with Disabilities Act (ADA), will accommodate persons who require a modification of accommodation in order to participate in this meeting. SCAG is also committed to helping people with limited proficiency in the English language access the agency’s essential public information and services. You can request such assistance by calling (213) 236-1908. We request at least 72 hours (three days) notice to provide reasonable accommodations and will make every effort to arrange for assistance as soon as possible.
TRANSPORTATION COMMITTEE
TRANSPORTATION COMMITTEE AGENDA
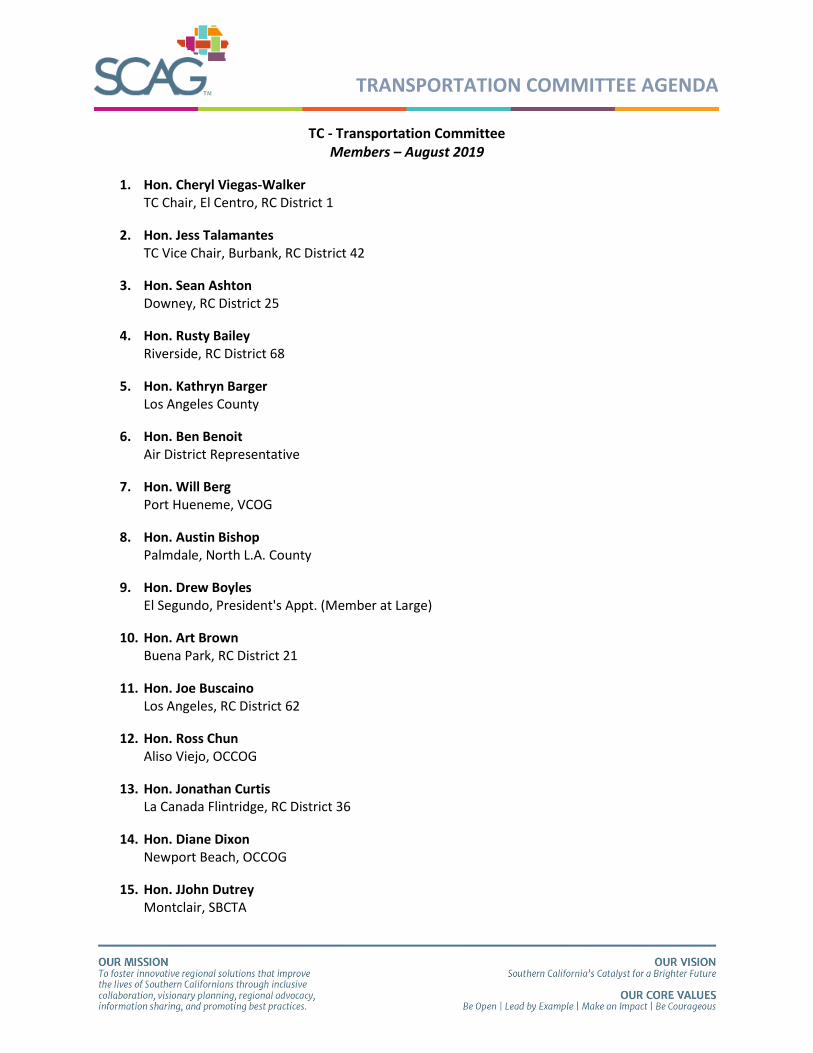
TC - Transportation Committee Members – August 2019
1. Hon. Cheryl Viegas-Walker TC Chair, El Centro, RC District 1
2. Hon. Jess Talamantes TC Vice Chair, Burbank, RC District 42
3. Hon. Sean Ashton Downey, RC District 25
4. Hon. Rusty Bailey Riverside, RC District 68
5. Hon. Kathryn Barger Los Angeles County
6. Hon. Ben Benoit Air District Representative
7. Hon. Will Berg Port Hueneme, VCOG
8. Hon. Austin Bishop Palmdale, North L.A. County
9. Hon. Drew Boyles El Segundo, President's Appt. (Member at Large)
10. Hon. Art Brown Buena Park, RC District 21
11. Hon. Joe Buscaino Los Angeles, RC District 62
12. Hon. Ross Chun Aliso Viejo, OCCOG
13. Hon. Jonathan Curtis La Canada Flintridge, RC District 36
14. Hon. Diane Dixon Newport Beach, OCCOG
15. Hon. JJohn Dutrey Montclair, SBCTA

TRANSPORTATION COMMITTEE AGENDA
16. Hon. Emily Gabel-Luddy Burbank, AVCJPA
17. Hon. James Gazeley Lomita, RC District 39
18. Hon. Jack Hadjinian Montebello, SGVCOG
19. Sup. Curt Hagman San Bernardino County
20. Hon. Ray Hamada Bellflower, GCCOG
21. Hon. Jan Harnik RCTC
22. Hon. Dave Harrington Aliso Viejo, OCCOG
23. Hon. Steven Hofbauer Palmdale, RC Disctrict 43
24. Hon. Jose Huizar Los Angeles, RC District 61
25. Hon. Mike Judge VCTC
26. Hon. Trish Kelley Mission Viejo, OCCOG
27. Hon. Paul Krekorian RC District 49/Public Transit Rep.
28. Hon. Linda Krupa Hemet, WRCOG
29. Hon. Randon Lane Murrieta, RC District 5
30. Hon. Clint Lorimore Eastvale, RC District 4
31. Hon. Steve Manos Lake Elsinore, RC District 63
TRANSPORTATION COMMITTEE AGENDA
32. Hon. Ray Marquez Chino Hills, RC District 10
33. Hon. Larry McCallon Highland, RC District 7
34. Hon. Brian McDonald Tribal Govt Regl Plng Board
35. Hon. Marsha McLean Santa Clarita, RC District 67
36. Hon. Dan Medina Gardena, RC District 28
37. Hon. LDennis Michael Rancho Cucamonga, RC District 9
38. Hon. Lisa Middleton Palm Springs, CVAG
39. Hon. Fred Minagar Laguna Niguel, RC District 12
40. Hon. Carol Moore Laguna Woods, OCCOG
41. Hon. Ara Najarian Glendale, SFVCOG
42. Hon. Frank Navarro Colton, RC District 6
43. Hon. Chuck Puckett Tustin, RC District 17
44. Hon. Teresa RealSebastian Monterey Park, RC District 34
45. Hon. Dwight Robinson Lake Forest, OCCOG
46. Hon. Carlos Rodriguez Yorba Linda, Pres. Appt., Member at Large
47. Hon. Crystal Ruiz San Jacinto, WRCOG
TRANSPORTATION COMMITTEE AGENDA
48. Hon. Ali Saleh Bell, RC District 27
49. Hon. Damon Sandoval Morongo Band of Mission Indians
50. Hon. Tim Sandoval Pomona, RC District 38
51. Hon. Rey Santos Beaumont, RC District 3
52. Hon. Marty Simonoff Brea, RC District 22
53. Hon. Thomas Small Culver City, WSCCOG
54. Hon. Karen Spiegel Riverside County
55. Hon. Cynthia Sternquist Temple City, SGVCOG
56. Hon. Brent Tercero Pico Rivera, GCCOG
57. Hon. Steve Tye Diamond Bar, RC District 37
58. Hon. Donald Wagner Orange County
59. Hon. Alan Wapner SBCTA
60. Hon. Alicia Weintraub
61. Mr. Paul Marquez, Ex-Officio Member Caltrans District 7
Calabasas, LVMCOG

This Page Intentionally Left Blank
TRANSPORTATION COMMITTEE AGENDA
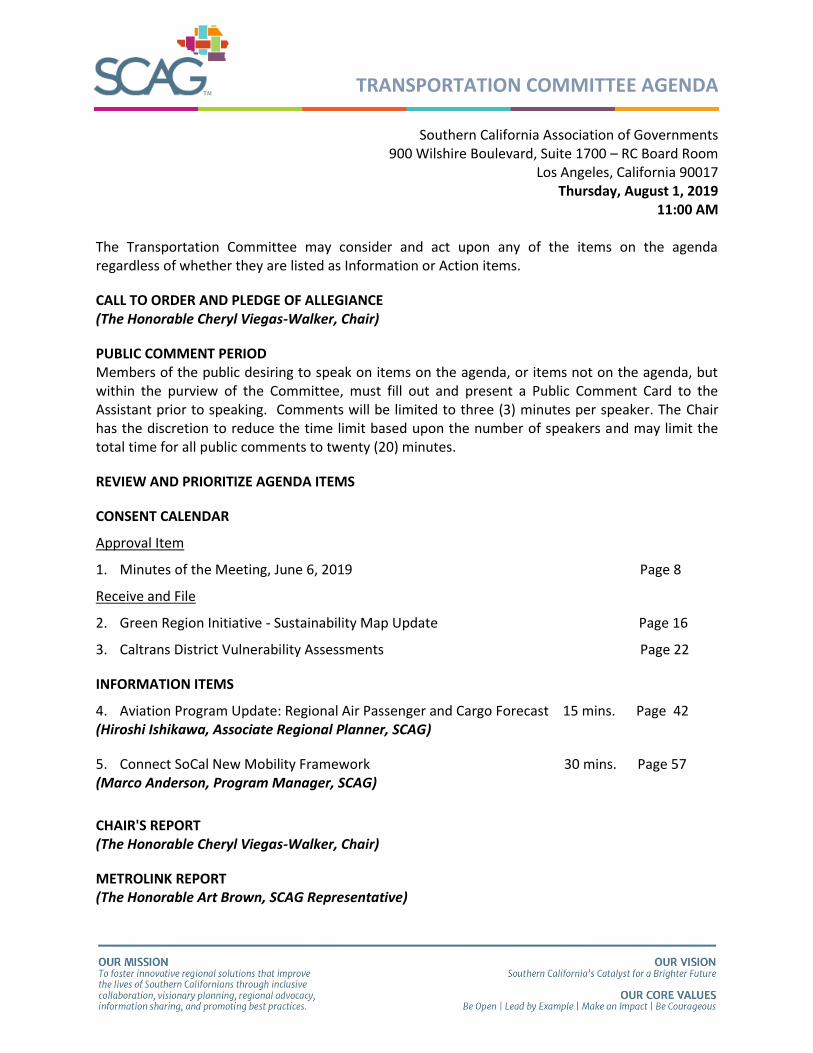
Southern California Association of Governments 900 Wilshire Boulevard, Suite 1700 – RC Board Room
Los Angeles, California 90017 Thursday, August 1, 2019
11:00 AM The Transportation Committee may consider and act upon any of the items on the agenda regardless of whether they are listed as Information or Action items.
CALL TO ORDER AND PLEDGE OF ALLEGIANCE (The Honorable Cheryl Viegas-Walker, Chair)
PUBLIC COMMENT PERIOD Members of the public desiring to speak on items on the agenda, or items not on the agenda, but within the purview of the Committee, must fill out and present a Public Comment Card to the Assistant prior to speaking. Comments will be limited to three (3) minutes per speaker. The Chair has the discretion to reduce the time limit based upon the number of speakers and may limit the total time for all public comments to twenty (20) minutes.
REVIEW AND PRIORITIZE AGENDA ITEMS
CONSENT CALENDAR
Approval Item
1. Minutes of the Meeting, June 6, 2019 Page 8
Receive and File
2. Green Region Initiative - Sustainability Map Update Page 16
3. Caltrans District Vulnerability Assessments Page 22
INFORMATION ITEMS
4. Aviation Program Update: Regional Air Passenger and Cargo Forecast 15 mins. Page 42 (Hiroshi Ishikawa, Associate Regional Planner, SCAG)
5. Connect SoCal New Mobility Framework 30 mins. Page 57(Marco Anderson, Program Manager, SCAG)
CHAIR'S REPORT (The Honorable Cheryl Viegas-Walker, Chair)
METROLINK REPORT (The Honorable Art Brown, SCAG Representative)
TRANSPORTATION COMMITTEE AGENDA
STAFF REPORT (John Asuncion, SCAG Staff)
FUTURE AGENDA ITEMS
ANNOUNCEMENT/S
ADJOURNMENT
REPORT
Southern California Association of Governments
900 Wilshire Boulevard, Suite 1700, Los Angeles, California 90017 August 1, 2019
TRANSPORTATION COMMITTEE
MINUTES OF THE MEETING THURSDAY, JUNE 6, 2019
THE FOLLOWING MINUTES ARE A SUMMARY OF ACTIONS TAKEN BY THE TRANSPORTATION COMMITTEE. A DIGITAL RECORDING OF THE ACTUAL MEETING IS AVAILABLE FOR LISTENING IN SCAG’S OFFICE.
The Transportation Committee (TC) met at SCAG, 900 Wilshire Blvd., 17th Floor, Los Angeles, CA 90017. The meeting was called to order by Chair Hon. Cheryl Viegas-Walker, El Centro. A quorum was present.
Members Present: Hon. Sean Ashton, Downey District 25
Hon. Kathryn Barger Los Angeles County
Hon. Ben Benoit, Wildomar South Coast AQMD
Hon. Will Berg, Port Hueneme VCOG
Hon. Russell Betts, Desert Hot Springs CVAG
Hon. Drew Boyles El Segundo
Hon. Art Brown, Buena Park District 21
Hon. Ross Chun, Aliso Viejo OCTA
Hon. Emily Gabel-Luddy AVCJPA
Hon. James Gazeley, Lomita District 39
Hon. Jack Hadjinian, Montebello SGVCOG
Hon. Curt Hagman San Bernardino County
Hon. Ray Hamada Bellflower
Hon. Jan Harnik, Palm Desert RCTC
Hon. Mike T. Judge, Simi Valley VCTC
Hon. Trish Kelley, Mission Viejo OCCOG
Hon. Randon Lane, Murrieta District 5
Hon. Clint Lorimore, Eastvale District 4
Hon. Steve Manos, Lake Elsinore District 63
Hon. Ray Marquez, Chino Hills District 10
Hon. Larry McCallon, Highland SBCTA
Hon. Marsha McLean, Santa Clarita District 67
Hon. Dan Medina, Gardena District 28
Hon. L. Dennis Michael District 9
Packet Pg. 8

REPORT
Hon. Ara Najarian, Glendale AVCJPA
Hon. Frank Navarro, Colton District 6
Hon. Charles Puckett, Tustin District 17
Hon. Teresa Real Sebastian, Monterey Park SGVCOG
Hon. Carlos Rodriguez, Yorba Linda President’s Appointment
Hon. Tim Sandoval, Pomona District 38
Hon. Marty Simonoff, Brea District 22
Hon. Karen Spiegel Riverside County
Hon. Jess Talamantes (Vice Chair) SFVCOG
Hon. Steve Tye District 37
Hon. Cheryl Viegas-Walker, El Centro (Chair) District 1
Hon. Don Wagner Orange County
Hon. Alan Wapner, Ontario SBCTA/SBCOG
Hon. Alicia Weintraub, Calabasas LVMCOG
Mr. Paul Marquez, Caltrans District 7 Ex-Officio Member
Members Not Present: Hon. Rusty Bailey, Riverside District 68
Hon. Austin Bishop, Palmdale North L.A. County
Hon. Joe Buscaino, Los Angeles District 62
Hon. Jonathan Curtis, La Cañada-Flintridge District 36
Hon. Diane Dixon, Newport Beach OCCOG
Hon. Lena Gonzalez, Long Beach District 30
Hon. Dave Harrington, Aliso Viejo OCCOG
Hon. Steven Hofbauer, Palmdale District 43
Hon. Jose Huizar, Los Angeles District 61
Hon. Paul Krekorian District 49
Hon. Linda Krupa, Hemet WRCOG
Hon. Brian McDonald Tribal Government Board
Hon. Fred Minagar, Laguna Niguel District 12
Hon. Carol Moore, Laguna Woods OCCOG
Hon. Dwight Robinson, Lake Forest OCCOG
Hon. Crystal Ruiz, San Jacinto WRCOG
Hon. Ali Saleh, Bell GCCOG
Hon. Damon Sandoval Morongo Band of Mission Indians
Hon. Thomas Small, Culver City Culver City
Hon. Cynthia Sternquist, Temple City SGVCOG
Hon. Brent Tercero, Pico Rivera GCCOG
Packet Pg. 9
REPORT
CALL TO ORDER & PLEDGE OF ALLEGIANCE
Hon. Cheryl Viegas-Walker, Imperial County Transportation Commission, called the meeting to order at 10:03 a.m. Hon. Curt Hagman, San Bernardino County, led the Pledge of Allegiance.
PUBLIC COMMENT Aaron Klemm, Chief of Energy and Sustainability, California State University Chancellor’s Office, requested to comment following the presentation on agenda item 9. ACTION ITEMS 1. I-105 Corridor Sustainability Study Status Report
Gary Hamrick, Cambridge Systematics, provided an update on the I-105 Corridor Sustainability Study. Mr. Hamrick stated the purpose of the study is to examine multi-modal conditions in the corridor which is an approach that goes beyond traditional freeway planning. He noted additional objectives of the study include improving connectivity between modes, transit, walking and bicycling as well as increasing system efficiency. Also, to reduce vehicles miles travelled and serious and fatal collisions. He noted the project study area is a 3 mile area around all sides of the I-105. Mr. Hamrick reviewed land use patterns and study area demographics and noted the study included significant stakeholder outreach to understand current corridor use. Mr. Hamrick listed the corridor improvement projects in the study area including active transportation, arterials, goods movement, highway and transit and noted how each would improve mobility and corridor efficiency. He reviewed the total cost of corridor projects examined and noted that the $21 billion total includes currently planned large scale infrastructure and transit projects. Hon. Larry McCallon, Highland, asked if consideration was given to making a connection between the Green Line and Metrolink. Mr. Hamrick responded that one of the projects involved closing the gap between those rail services. Hon. Jess Talamantes, Arroyo Verdugo Cities, asked if the I-105 study took into account Metro’s Next Gen Study. Mr. Hamrick responded that data and recommendations from the Next Gen Study was used in the I-105 study particularly those for transit and sustainability. A MOTION was made (Brown) and SECONDED (Hagman) to direct staff to transmit the final report to California Department of Transportation, the Federal Highway Administration and other interested stakeholders. The Motion passed by the following votes:
Packet Pg. 10
REPORT
AYES: Ashton, Barger, Benoit, Berg, Betts, Boyles, Brown, Gabel-Luddy, Gazeley,
Hadjinian, Hagman, Hamada, Harnik, Judge, Kelley, Lorimore, Manos, Marquez, McCallon, McLean, Michael, Najarian, Navarro, Puckett, Real Sebastian, Rodriguez, Sandoval, Simonoff, Spiegel, Talamantes, Tye, Viegas-Walker, Wagner, Wapner, Weintraub (35)
NOES: None (0) ABSTAIN: None (0)
CONSENT CALENDAR
Approval Item
2. Minutes of the April 4, 2019 Meeting
Receive and File
3. Safety Leadership Symposium and Workshop Series
4. ADA Paratransit Demand Forecast
5. Transit Asset Management Target Setting
6. Connect SoCal Technical Methodology and Submittal to California Air Resources Board
7. Local Input Survey Results
A MOTION was made (Navarro) and SECONDED (Ashton) to approve Consent Calendar items 2 - 7. The Motion passed by the following votes: AYES: Ashton, Barger, Benoit, Berg, Betts, Boyles, Brown, Gabel-Luddy, Gazeley,
Hadjinian, Hagman, Hamada, Harnik, Kelley, Lorimore, Manos, Marquez, McCallon, McLean, Michael, Najarian, Navarro, Puckett, Real Sebastian, Rodriguez, Sandoval, Simonoff, Spiegel, Talamantes, Viegas-Walker, Wagner, Wapner, Weintraub (33)
NOES: None (0) ABSTAIN: Tye (1)
INFORMATION ITEMS 8. Connect SoCal Financial Plan Development Update
Annie Nam, SCAG staff, provided an update on Connect SoCal financial plan development. Ms. Nam stated that the 2020 Regional Transportation Plan/Sustainable Communities Strategy (Connect SoCal) must include a financial plan that estimates how much funding will
Packet Pg. 11
REPORT
be needed to implement recommended improvements and operate and maintain the transportation system over the planning horizon. She noted that 60% of revenue is derived from local sources, 32% from the state and 8% from federal sources. It was further noted 57% of local revenue is generated from sales taxes, 12% from the Transportation Development Act, 9% from farebox revenue and 10% from other local sources. Ms. Nam stated that total revenue for Connect SoCal is approximately $506 billion which includes local, state and federal revenue sources through 2045. She stated next steps include refinement of project cost and revenue forecast and noted the committee will be provided additional financial plan updates as development of the 2020 RTP/SCS continues. Hon. Curt Hagman, San Bernardino County, asked that the financial plan development consider identifying opportunities for project cost savings so committee members may consider a response such as seeking regulatory relief to facilitate those cost savings. Ms. Nam responded that project cost savings will be examined and brought forth. Hon. Alan Wapner, Ontario, stated that county revenues traditionally only cover capital expenses and asked if operation and maintenance costs are considered in the development of the financial plan. Ms. Nam responded that SB 1 addresses a significant portion of operation and maintenance costs and a breakdown of lifecycle costs will be presented to the committee in the next iteration of the financial plan.
9. SCAG Transportation Demand Management Strategic Plan Update Steve Fox, SCAG staff, provided an update on the Transportation Demand Management (TDM) Strategic Plan. Mr. Fox stated that TDM is a set of strategies aimed at reducing the demand for roadway travel particularly in single occupancy vehicles. He noted that TDM investments reduce congestion and shift trips to other modes while costing significantly less than roadway or transit capital expansion projects. TDM strategies include carpooling, vanpooling, telecommuting as well as new technology such as transportation network companies (TNCs), carshare, bikeshare and multi-modal trip planning smart phone applications. Mr. Fox noted important strategic goals include assessing the current state of TDM planning and understanding the impact and opportunities from new mobility and technology innovations as well as develop performance measures to evaluate the effectiveness of corridor level, local and regional TDM strategies. Mr. Fox noted draft recommendations include creating a dedicated web page to share the TDM Strategic Plan deliverables such as the updated TDM toolbox and to convene periodic trainings sessions throughout the region. Also, establish a TDM regional data clearinghouse and formalize performance metrics and facilitate data collection and reporting. He noted next steps include further incorporating comments received on the draft recommendations into the draft TDM strategic plan.
Packet Pg. 12
REPORT
Hon. Cheryl Viegas-Walker, El Centro, stated that the region is a significant tourist destination and a greater effort can be made to assist visitors in getting around the region using transit and other options so they are not restricted to renting a vehicle. Mr. Fox responded that some of the strategies in the updated toolbox will address that need. Additionally, one study activity is to address 10 congested corridors including the intersection of I-10 and I-110, an important corridor for the upcoming 2028 Olympics. Hon. Alan Wapner, Ontario, expressed concern that TNCs such as Uber and Lyft are considered as TDM strategies as there is evidence that they increase vehicle miles travelled. Mr. Fox responded that TNCs are thought to be an alternative to single occupancy vehicle driving but there is evidence that TNCs increase roadway travel particularly when driving on the roadways waiting for their next trip. Aaron, Klemm, Chief of Energy and Sustainability, California State University Chancellor’s Office, commented that California state universities are major employment and student destinations throughout the state and they are seeking to partner with SCAG on traffic demand issues and to be a member of the technical advisory committee.
10. The Future of the Workplace: Regional Summary and Travel Impacts
Michele Bina, Cambridge Systematics, reported on the Future of the Workplace and telecommuting study. Ms. Bina stated that new technology and work concepts have emerged which can affect transportation planning. She noted the working trends examined include teleworkers, or those who work from a fixed office space but telecommute once per week and home workers who work only at home. She reviewed total teleworkers for each county in the SCAG region and the total days telecommuting noting that those who telework tend to be higher income earners. Ms. Bina further noted that there is an increasing trend in coworking spaces or short-term shared office space. These are commonly used by younger workers often in information technology and consulting. She noted that 40% of those surveyed indicate that their coworking offices are closer to home and involve less daily travel. Ms. Bina next reviewed the emergence of “Gig Economy” workers or those workers who are independent contractors, seasonal, temporary or on-call contract workers. She reviewed job sectors that may be affected by automation in the future noting that business and finance specialist sectors face the least likelihood of automation while those in the farming production sectors could experience a greater level of automation. Hon. Tim Sandoval, Pomona, asked if there has been an examination of the link between
Packet Pg. 13
REPORT
workforce automation and the increase in homelessness. Ms. Bina responded that it is worth investigating as some industry sectors have seen considerable displacement through automation.
CHAIR’S REPORT Hon. Cheryl Viegas-Walker, El Centro, announced that an employee wellness program is underway and committee members Hon. Alan Wapner and Hon. Randon Lane will serve as team leaders. Committee members interested in participating can contact one of the committee team leaders.
METROLINK REPORT
Hon. Art Brown, Buena Park, reported that Metrolink saw a slight 0.8 percent growth in ridership during January. February ridership decreased 1.1 percent but March increased 1.8 percent. He noted the LINK US project has completed CEQA environmental review and is progressing toward the design phase. This effort includes the L.A. Union Station run-through tracks. Additionally, Metrolink offered free rides on Monday, April 22, 2019 to promote Earth Day. This produced an overall ridership increase of 40% over a normal weekday. Also, with the April schedule change, Metrolink introduced an additional late night round trip from San Bernardino to Union Station.
STAFF REPORT
John Asuncion, SCAG staff, announced that SCAG’s 30th Annual Demographic Workshop will take place Tuesday June, 11, 2019 at USC and registration remains open.
ADJOURNMENT
Chair Cheryl Viegas-Walker, El Centro, adjourned the meeting at 11:39 a.m. [MINUTES ARE UNOFFICIAL UNTIL APPROVED BY THE TRANSPORTATION COMMITTEE]
Packet Pg. 14
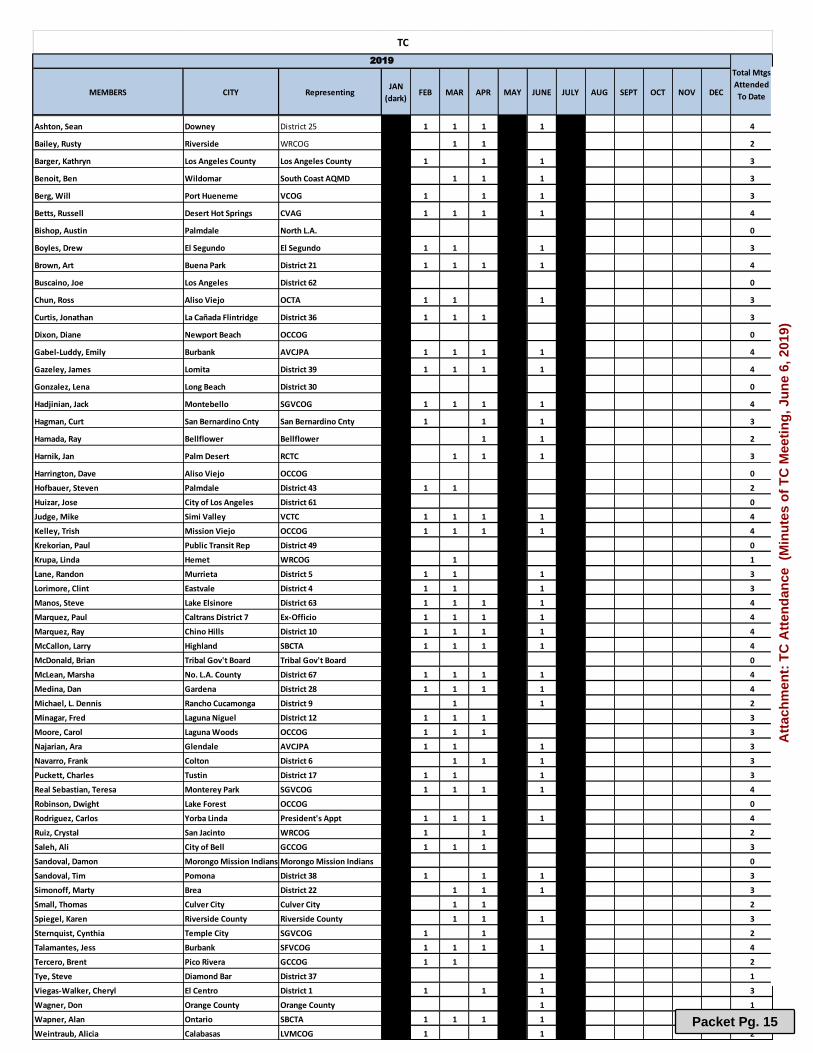
MEMBERS CITY RepresentingJAN
(dark)FEB MAR APR MAY JUNE JULY AUG SEPT OCT NOV DEC
Ashton, Sean Downey District 25 1 1 1 1 4
Bailey, Rusty Riverside WRCOG 1 1 2
Barger, Kathryn Los Angeles County Los Angeles County 1 1 1 3
Benoit, Ben Wildomar South Coast AQMD 1 1 1 3
Berg, Will Port Hueneme VCOG 1 1 1 3
Betts, Russell Desert Hot Springs CVAG 1 1 1 1 4
Bishop, Austin Palmdale North L.A. 0
Boyles, Drew El Segundo El Segundo 1 1 1 3
Brown, Art Buena Park District 21 1 1 1 1 4
Buscaino, Joe Los Angeles District 62 0
Chun, Ross Aliso Viejo OCTA 1 1 1 3
Curtis, Jonathan La Cañada Flintridge District 36 1 1 1 3
Dixon, Diane Newport Beach OCCOG 0
Gabel-Luddy, Emily Burbank AVCJPA 1 1 1 1 4
Gazeley, James Lomita District 39 1 1 1 1 4
Gonzalez, Lena Long Beach District 30 0
Hadjinian, Jack Montebello SGVCOG 1 1 1 1 4
Hagman, Curt San Bernardino Cnty San Bernardino Cnty 1 1 1 3
Hamada, Ray Bellflower Bellflower 1 0 1 0 2
Harnik, Jan Palm Desert RCTC 1 1 1 3
Harrington, Dave Aliso Viejo OCCOG 0
Hofbauer, Steven Palmdale District 43 1 1 2
Huizar, Jose City of Los Angeles District 61 0
Judge, Mike Simi Valley VCTC 1 1 1 1 4
Kelley, Trish Mission Viejo OCCOG 1 1 1 1 4
Krekorian, Paul Public Transit Rep District 49 0
Krupa, Linda Hemet WRCOG 1 1
Lane, Randon Murrieta District 5 1 1 1 3
Lorimore, Clint Eastvale District 4 1 1 1 3
Manos, Steve Lake Elsinore District 63 1 1 1 1 4
Marquez, Paul Caltrans District 7 Ex-Officio 1 1 1 1 4
Marquez, Ray Chino Hills District 10 1 1 1 1 4
McCallon, Larry Highland SBCTA 1 1 1 1 4
McDonald, Brian Tribal Gov't Board Tribal Gov't Board 0
McLean, Marsha No. L.A. County District 67 1 1 1 1 4
Medina, Dan Gardena District 28 1 1 1 1 4
Michael, L. Dennis Rancho Cucamonga District 9 1 1 2
Minagar, Fred Laguna Niguel District 12 1 1 1 3
Moore, Carol Laguna Woods OCCOG 1 1 1 3
Najarian, Ara Glendale AVCJPA 1 1 1 3
Navarro, Frank Colton District 6 1 1 1 3
Puckett, Charles Tustin District 17 1 1 1 3
Real Sebastian, Teresa Monterey Park SGVCOG 1 1 1 1 4
Robinson, Dwight Lake Forest OCCOG 0
Rodriguez, Carlos Yorba Linda President's Appt 1 1 1 1 4
Ruiz, Crystal San Jacinto WRCOG 1 1 2
Saleh, Ali City of Bell GCCOG 1 1 1 3
Sandoval, Damon Morongo Mission Indians Morongo Mission Indians 0
Sandoval, Tim Pomona District 38 1 1 1 3
Simonoff, Marty Brea District 22 1 1 1 3
Small, Thomas Culver City Culver City 1 1 2
Spiegel, Karen Riverside County Riverside County 1 1 1 3
Sternquist, Cynthia Temple City SGVCOG 1 1 2
Talamantes, Jess Burbank SFVCOG 1 1 1 1 4
Tercero, Brent Pico Rivera GCCOG 1 1 2
Tye, Steve Diamond Bar District 37 1 1
Viegas-Walker, Cheryl El Centro District 1 1 1 1 3
Wagner, Don Orange County Orange County 1 1
Wapner, Alan Ontario SBCTA 1 1 1 1 4
Weintraub, Alicia Calabasas LVMCOG 1 1 2
TC
Total Mtgs
Attended
To Date
2019
Packet Pg. 15
Att
ach
men
t: T
C A
tten
dan
ce (
Min
ute
s o
f T
C M
eeti
ng
, Ju
ne
6, 2
019)
REPORT
Southern California Association of Governments
900 Wilshire Boulevard, Suite 1700, Los Angeles, California 90017 August 1, 2019
RECOMMENDED ACTION FOR RC: For Information Only – No Action Required RECOMMENDED ACTION FOR CEHD, EEC AND TC: Receive and File STRATEGIC PLAN: This item supports the following Strategic Plan Goal 2: Advance Southern California’s policy interests and planning priorities through regional, statewide, and national engagement and advocacy. EXECUTIVE SUMMARY: The CivicSpark program is a statewide Governor’s Initiative AmeriCorps program administered by the State of California’s Office of Planning and Research and the Local Government Commission (LGC). SCAG is a regional partner and beneficiary of the CivicSpark program and has hosted CivicSpark Fellows working in the Sustainability Department for the past five (5) years. SCAG’s 2018-19 CivicSpark Fellows—April Crain, Guadalupe Franco, and Elisa Barrios—have prepared an update on the SCAG Green Region Initiative (GRI) map. The goal of GRI is to illustrate the status and progress of the region across 28 sustainability indicators. BACKGROUND: To enhance the development of the existing Green Region Initiative Sustainability Indicators project, SCAG partnered with the Local Government Commission (LGC) to host three CivicSpark Fellows. The project provides a visual resource of sustainability progress across the 191 cities and six counties within the SCAG region in both policy and performance. The policies and performance mapped for this project help identify existing best practices across 28 sustainability indicators.
To: Community Economic & Human Development Committee (CEHD) Energy & Environment Committee (EEC) Transportation Committee (TC)
Regional Council (RC)
EXECUTIVE DIRECTOR’S APPROVAL
From: Grieg Asher, Program Manager I, Sustainability, (213) 236-1869, [email protected]
Subject: Green Region Initiative - Sustainability Map Update
Packet Pg. 16

REPORT
The CivicSpark program is a statewide Governor’s Initiative AmeriCorps program administered by the State of California’s Office of Planning and Research and the LGC. The program places 90 Fellows in local governments around the state to help build local capacity around climate, housing, water and resiliency issues. SCAG is a regional partner and beneficiary of the CivicSpark program and has hosted CivicSpark Fellows in the Sustainability Department for the past five years. This year’s CivicSpark Fellows have continued work on the GRI Sustainability Indicators project, which charts and maps progress across 28 sustainability topics in every city and county in the SCAG region. The final deliverables of the 2018-19 CivicSpark program year are 11 updated maps, which create a polished and enhanced GRI v 3.6, individual GIS shapefiles to be accessed via SCAG’s Open Data Portal, as well as simplified regional sustainability statistics through utilization of the GRI data. Overall, the GRI provides a resource for SCAG staff, local governments, and the public to explore best practices in the region, facilitate collaboration, and advance sustainability and resiliency planning in Southern California. This project supports the 2020 RTP/SCS land use strategy to support local sustainability planning, highlighting best practices around the region and serving as a resource for other cities to replicate existing projects and tailor them to suit their unique needs. SCAG’s partnership with CivicSpark will continue through the next 2019-20 program year. The CivicSpark Fellows will continue collecting data on sustainability progress across the SCAG region. The Fellows will also conduct outreach from stakeholders on the map’s functionality, purpose, and the indicators as a whole. They will then use this feedback to further refine and update the map. Finally, the Fellows will help organize webinars and meetings to provide technical assistance for local governments on sustainability best practices in the region. FISCAL IMPACT: The CivicSpark program is funded jointly by the LGC, and SCAG in its FY 19-20 Overall Work Program (065.137.10). ATTACHMENT(S): 1. PowerPoint Presentation - CivicSpark
Packet Pg. 17
CivicSpark 2018-19Climate FellowsElisa Barrios, April Crain, and Lupe Franco
Agenda● SCAG and Civicspark ● Green Region Initiative ● Regional Climate Adaptation Framework● Go Human ● CivicSpark Projects ● Next Steps
Packet Pg. 18
Att
ach
men
t: P
ow
erP
oin
t P
rese
nta
tio
n -
Civ
icS
par
k (
Gre
en R
egio
n In
itia
tive
- S
ust
ain
abili
ty M
ap U
pd
ate)

CivicSpark and SCAG● To enhance the development of the existing
Green Region Initiative (GRI) Sustainability Indicators project, SCAG partnered with the Local Government Commission (LGC) to host three CivicSpark Fellows.
● The project provides a visual resource of sustainability progress across the 191 cities and six counties within the SCAG region in both policy and performance.
● The policies and performance mapped for this project help identify existing best practices across 28 sustainability indicators.
● The CivicSpark program is a statewide Governor’s Initiative AmeriCorps program administered by the State of California’s Office of Planning and Research and the Local Government Commission (LGC).
● SCAG is a regional partner and beneficiary of the CivicSpark program and has hosted CivicSpark Fellows working in the Sustainability Department for the past five (5) years.
Green Region Initiative
GGreen Region Initiative v3.6The Green Region Initiative (GRI) tracks sustainability effort across the
SCAG region. Through this simplified region-wide sustainability tool, the GRI provides a streamline platform for local jurisdictions to collaborate and
share best practices ultimately creating a more sustainable Southern California.
AAchievements• Completed updates to the GRI
Policy Indicators and Storymaps creating a polished and enhanced GRI v3.6
• Created GRI shapefiles that can be accessed via SCAG Open Data Portal and SCAG Geodatabase
• Quantified the regional efforts using the GRI to create sustainability statistics and GRI at a Glance
Packet Pg. 19
Att
ach
men
t: P
ow
erP
oin
t P
rese
nta
tio
n -
Civ
icS
par
k (
Gre
en R
egio
n In
itia
tive
- S
ust
ain
abili
ty M
ap U
pd
ate)
Climate Adaptation
RRegional Climate Adaptation Framework
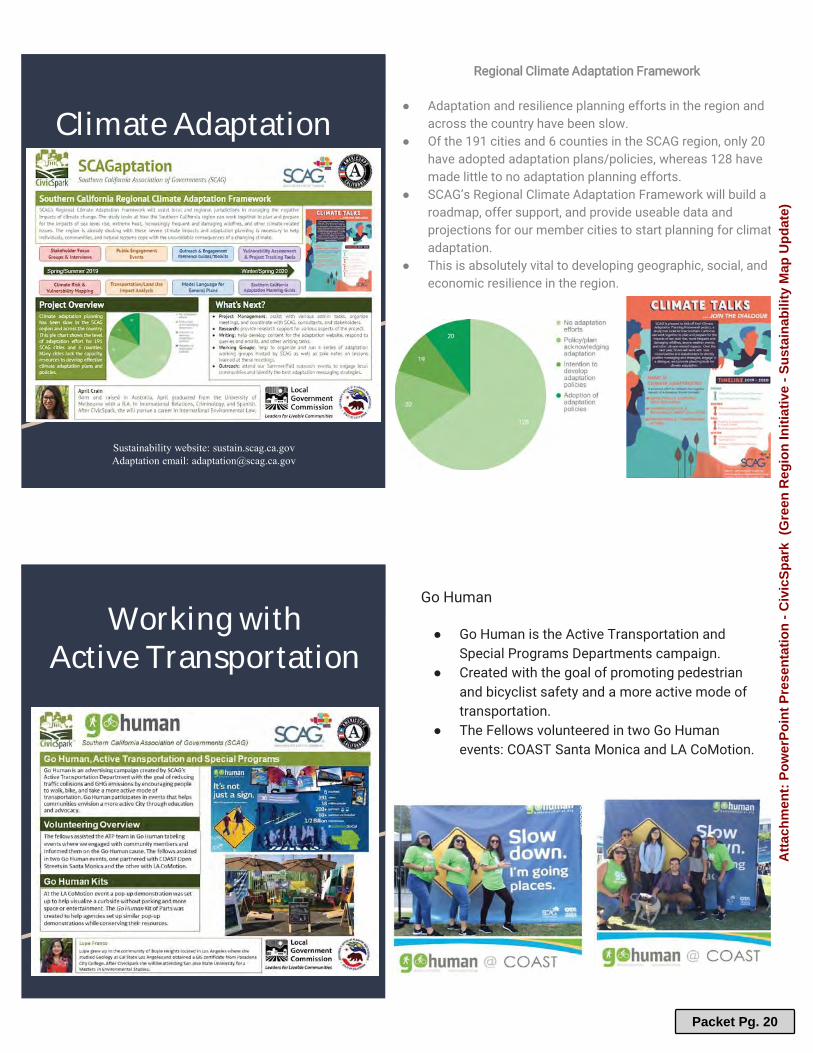
● Adaptation and resilience planning efforts in the region and across the country have been slow.
● Of the 191 cities and 6 counties in the SCAG region, only 20 have adopted adaptation plans/policies, whereas 128 have made little to no adaptation planning efforts.
● SCAG’s Regional Climate Adaptation Framework will build a roadmap, offer support, and provide useable data and projections for our member cities to start planning for climate adaptation.
● This is absolutely vital to developing geographic, social, and economic resilience in the region.
Sustainability website: sustain.scag.ca.govAdaptation email: [email protected]
Working with Active Transportation
Go Human
● Go Human is the Active Transportation and Special Programs Departments campaign.
● Created with the goal of promoting pedestrian and bicyclist safety and a more active mode of transportation.
● The Fellows volunteered in two Go Human events: COAST Santa Monica and LA CoMotion.
Packet Pg. 20
Att
ach
men
t: P
ow
erP
oin
t P
rese
nta
tio
n -
Civ
icS
par
k (
Gre
en R
egio
n In
itia
tive
- S
ust
ain
abili
ty M
ap U
pd
ate)

Service
Civicspark Projects
Volunteer Engagement Trainings
Next StepsEElisa Barrios
Looking to continue my environmental career in a
position that combines my passion for conservation and
sustainability.
Attending a masters program in GIS and/or environmental science
Lupe Franco
Attend San Jose State University in the Fall for
Environmental Studies with a focus on Environmental Justice
and Climate Research.
April Crain
Attending the University of Colorado at Boulder Law School
focusing on International Environmental Law.
Packet Pg. 21
Att
ach
men
t: P
ow
erP
oin
t P
rese
nta
tio
n -
Civ
icS
par
k (
Gre
en R
egio
n In
itia
tive
- S
ust
ain
abili
ty M
ap U
pd
ate)
REPORT
Southern California Association of Governments
900 Wilshire Boulevard, Suite 1700, Los Angeles, California 90017 August 1, 2019
RECOMMENDED ACTION FOR EEC: For Information Only – No Action Required RECOMMENDED ACTION FOR TC: Receive and File STRATEGIC PLAN: This item supports the following Strategic Plan Goal 2: Advance Southern California’s policy interests and planning priorities through regional, statewide, and national engagement and advocacy. EXECUTIVE SUMMARY: Caltrans is in the process of preparing reports on the vulnerability of the state highway system to the effects of climate change. The intention of the these vulnerability assessment reports is to provide data to support the discussion about how climate change impacts the way the state highway system is planned, designed, built, operated and maintained. The vulnerability assessment reports for twelve districts throughout California will ultimately evaluate which state highways are most vulnerable to flooding and other damage, assess possible consequences, and evaluate methods for deciding how to prioritize action. Representatives from Caltrans will provide a broad overview of the statewide goal, purpose and process of developing vulnerability assessment reports. BACKGROUND: In an effort to address Climate Change for both mitigation and adaptation purposes, Caltrans is taking steps to fully integrate climate change into transportation investment decision making, from planning to project development, operations and maintenance. Caltrans’ objective is to make the state highway system more resilient, sustainable, and adaptable to climate-spurred events and extreme weather. To identify where the state highway system is most vulnerable to the impacts of climate change and extreme events, Caltrans is conducting vulnerability assessments throughout the state at the district level using five climate stressors: sea level rise, storm surge, changes in
To: Energy & Environment Committee (EEC)
Transportation Committee (TC)
EXECUTIVE DIRECTOR’S APPROVAL
From: Jason Greenspan, Manager of Sustainability, Planning Division,
213-236-1859, [email protected] Subject: Caltrans District Vulnerability Assessments
Packet Pg. 22
REPORT
precipitation, changes in temperature, and increased wildfires. Although the vulnerability assessment reports neither propose specific projects nor discuss costs, they use the best science currently available on potential temperature changes and sea level rise to assess the various types of risks the state will need to prepare for in the future. District vulnerability assessment reports will project future climate scenarios, quantify and map impacts of climate change stressors, and identify transportation assets as risk. Three vulnerability assessments have been completed thus far for the Oakland/San Francisco, Fresno and Redding Caltrans districts. Vulnerability assessments for Los Angeles, San Bernardino and San Diego are pending release this fall, with six additional districts next in line, including Orange County. FISCAL IMPACT: None. ATTACHMENT(S): 1. PowerPoint Presentation - Caltrans District Vulnerability Assessments
Packet Pg. 23
1
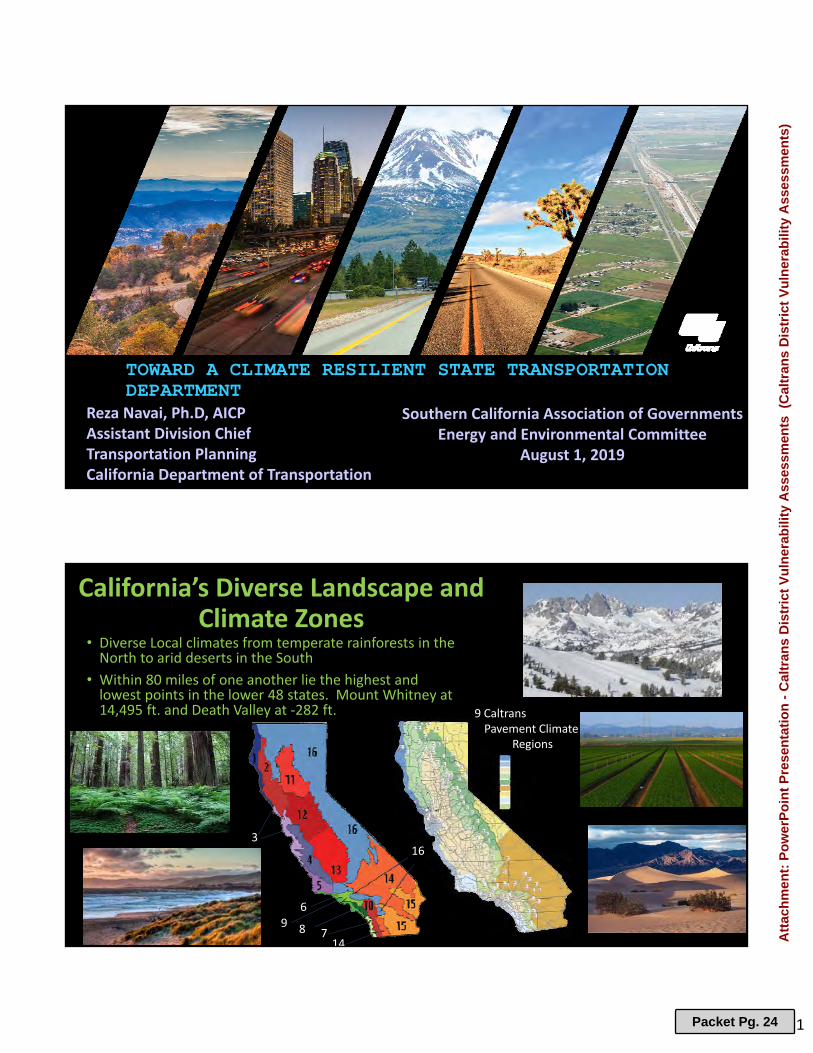
TOWARD A CLIMATE RESILIENT STATE TRANSPORTATION DEPARTMENT
Reza Navai, Ph.D, AICPAssistant Division ChiefTransportation PlanningCalifornia Department of Transportation
Southern California Association of GovernmentsEnergy and Environmental Committee
August 1, 2019
California’s Diverse Landscape and Climate Zones
• Diverse Local climates from temperate rainforests in the North to arid deserts in the South
• Within 80 miles of one another lie the highest and lowest points in the lower 48 states. Mount Whitney at 14,495 ft. and Death Valley at ‐282 ft.
78
69
14
163
9 Caltrans Pavement Climate
Regions
Packet Pg. 24
Att
ach
men
t: P
ow
erP
oin
t P
rese
nta
tio
n -
Cal
tran
s D
istr
ict
Vu
lner
abili
ty A
sses
smen
ts (
Cal
tran
s D
istr
ict
Vu
lner
abili
ty A
sses
smen
ts)
2
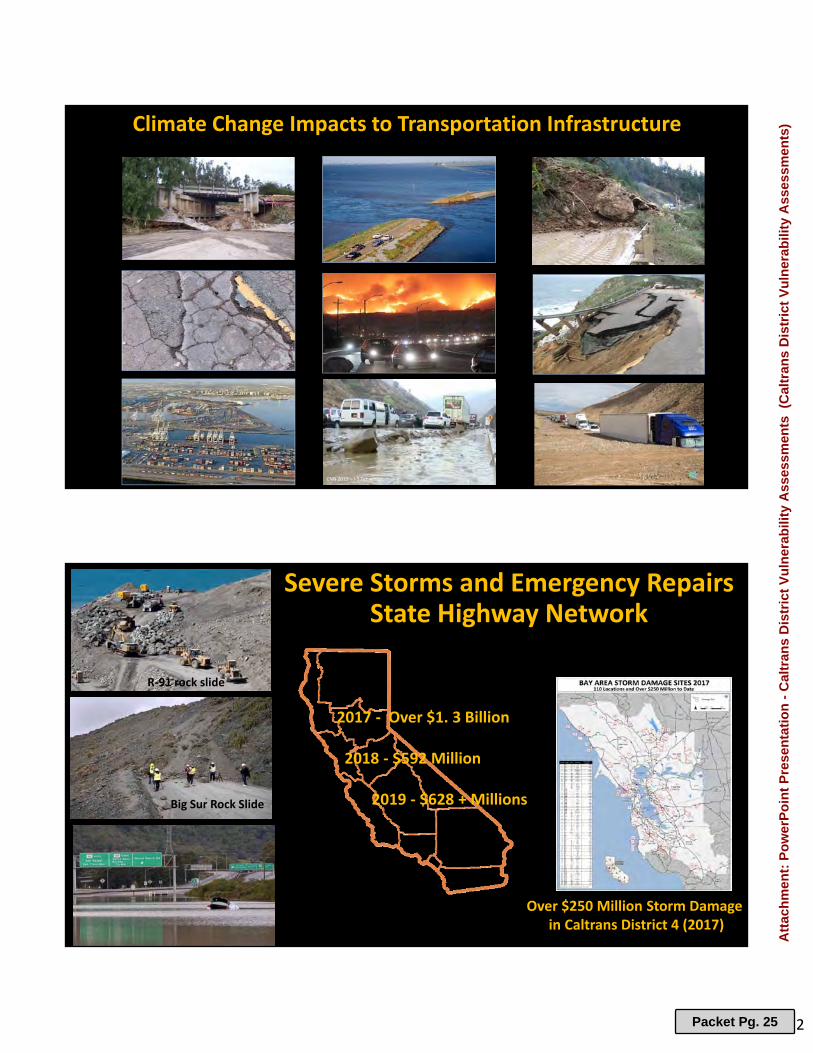
Climate Change Impacts to Transportation Infrastructure
CNN 2015 – I‐5 Tehachapi
Severe Storms and Emergency RepairsState Highway Network
Big Sur Rock Slide
R‐91 rock slide
2017 ‐ Over $1. 3 Billion
2018 ‐ $592 Million
2019 ‐ $628 + Millions
Over $250 Million Storm Damage in Caltrans District 4 (2017)
Big Sur Rock Slide
Packet Pg. 25
Att
ach
men
t: P
ow
erP
oin
t P
rese
nta
tio
n -
Cal
tran
s D
istr
ict
Vu
lner
abili
ty A
sses
smen
ts (
Cal
tran
s D
istr
ict
Vu
lner
abili
ty A
sses
smen
ts)
3
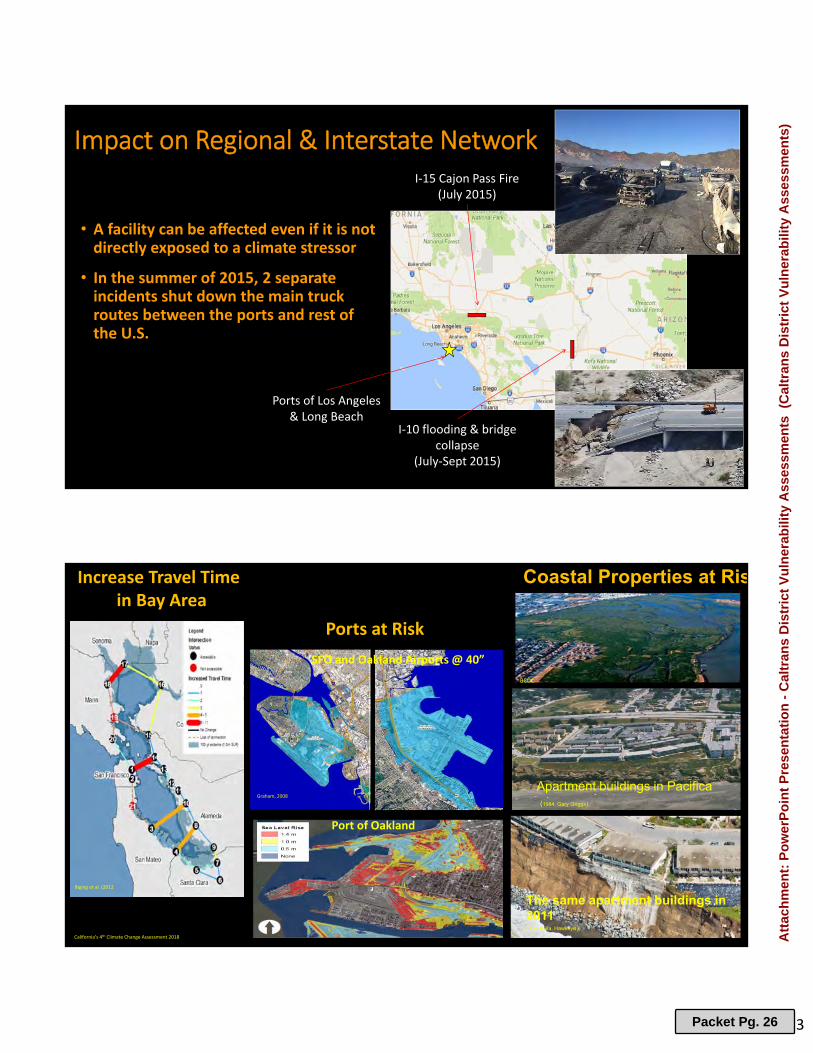
Impact on Regional & Interstate Network
• A facility can be affected even if it is not directly exposed to a climate stressor
• In the summer of 2015, 2 separate incidents shut down the main truck routes between the ports and rest of the U.S.
5
Ports of Los Angeles& Long Beach
I‐15 Cajon Pass Fire(July 2015)
I‐10 flooding & bridge collapse
(July‐Sept 2015)
Biging et al. (2012
Coastal Properties at Ris
Apartment buildings in Pacifica(1984: Gary Griggs).
The same apartment buildings in 2011(Joel Avila, Hawkeye).
Increase Travel Time in Bay Area
California’s 4th Climate Change Assessment 2018
Ports at Risk
Port of Oakland
SFO and Oakland Airports @ 40”
Graham, 2008
BCDC
Packet Pg. 26
Att
ach
men
t: P
ow
erP
oin
t P
rese
nta
tio
n -
Cal
tran
s D
istr
ict
Vu
lner
abili
ty A
sses
smen
ts (
Cal
tran
s D
istr
ict
Vu
lner
abili
ty A
sses
smen
ts)
4
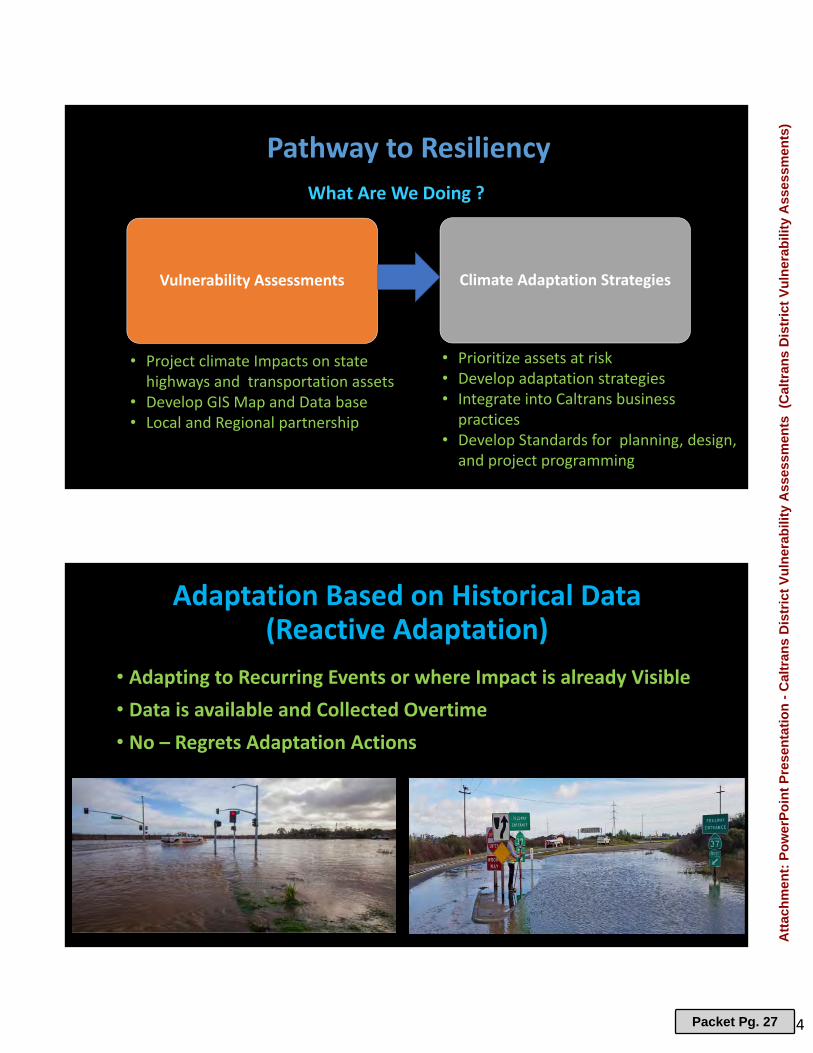
Pathway to Resiliency
Vulnerability Assessments Climate Adaptation Strategies
• Project climate Impacts on state highways and transportation assets
• Develop GIS Map and Data base• Local and Regional partnership
• Prioritize assets at risk• Develop adaptation strategies• Integrate into Caltrans business practices
• Develop Standards for planning, design, and project programming
What Are We Doing ?
Adaptation Based on Historical Data(Reactive Adaptation)
• Adapting to Recurring Events or where Impact is already Visible
• Data is available and Collected Overtime
• No – Regrets Adaptation Actions
Packet Pg. 27
Att
ach
men
t: P
ow
erP
oin
t P
rese
nta
tio
n -
Cal
tran
s D
istr
ict
Vu
lner
abili
ty A
sses
smen
ts (
Cal
tran
s D
istr
ict
Vu
lner
abili
ty A
sses
smen
ts)
5
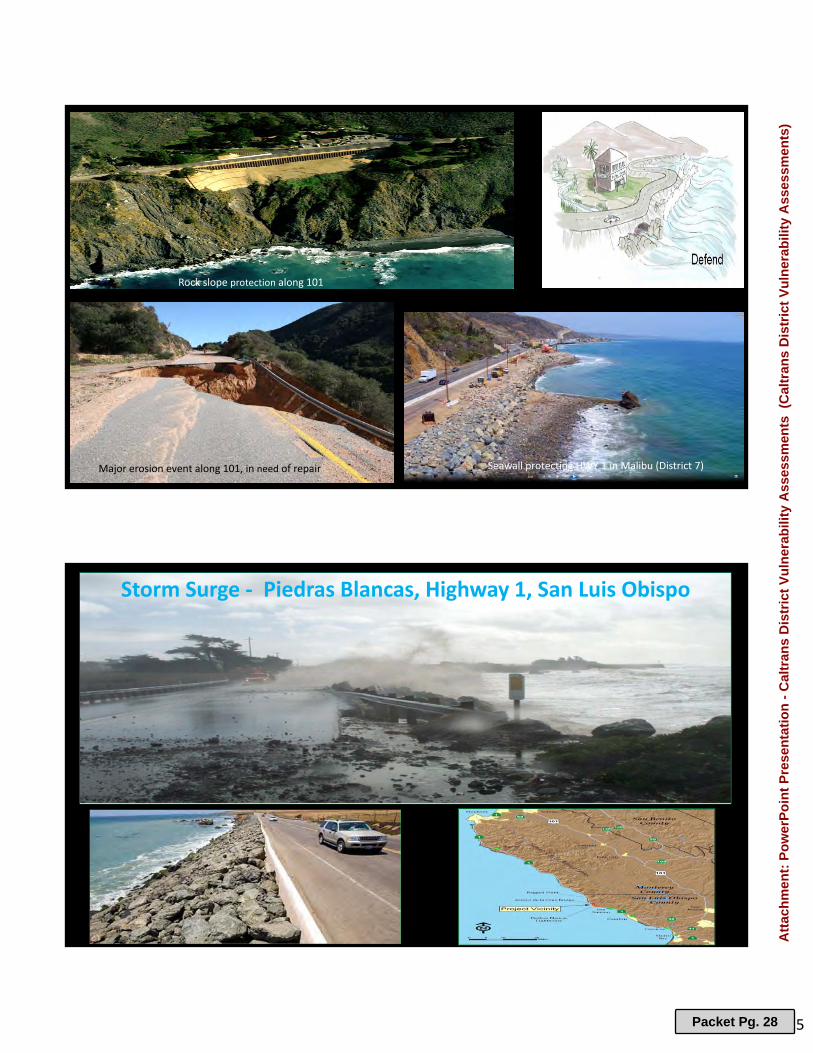
Rock slope protection along 101
Major erosion event along 101, in need of repair Seawall protecting HWY 1 in Malibu (District 7)
Storm Surge ‐ Piedras Blancas, Highway 1, San Luis Obispo
Packet Pg. 28
Att
ach
men
t: P
ow
erP
oin
t P
rese
nta
tio
n -
Cal
tran
s D
istr
ict
Vu
lner
abili
ty A
sses
smen
ts (
Cal
tran
s D
istr
ict
Vu
lner
abili
ty A
sses
smen
ts)

6
Realignment ‐ Piedras Blancas
Devil’s Slide CoastPacifica and Half Moon Bay
Packet Pg. 29
Att
ach
men
t: P
ow
erP
oin
t P
rese
nta
tio
n -
Cal
tran
s D
istr
ict
Vu
lner
abili
ty A
sses
smen
ts (
Cal
tran
s D
istr
ict
Vu
lner
abili
ty A
sses
smen
ts)
7
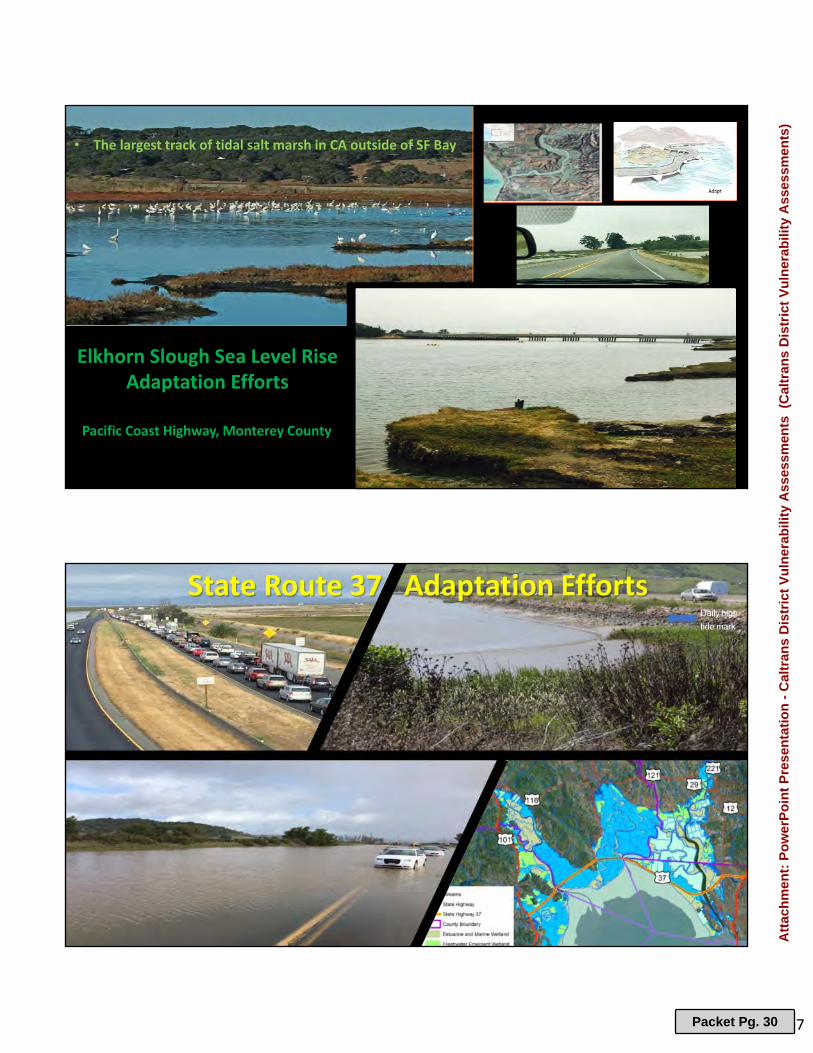
Pacific Coast Highway, Monterey County
Elkhorn Slough Sea Level Rise Adaptation Efforts
• The largest track of tidal salt marsh in CA outside of SF Bay
Packet Pg. 30
Att
ach
men
t: P
ow
erP
oin
t P
rese
nta
tio
n -
Cal
tran
s D
istr
ict
Vu
lner
abili
ty A
sses
smen
ts (
Cal
tran
s D
istr
ict
Vu
lner
abili
ty A
sses
smen
ts)
8
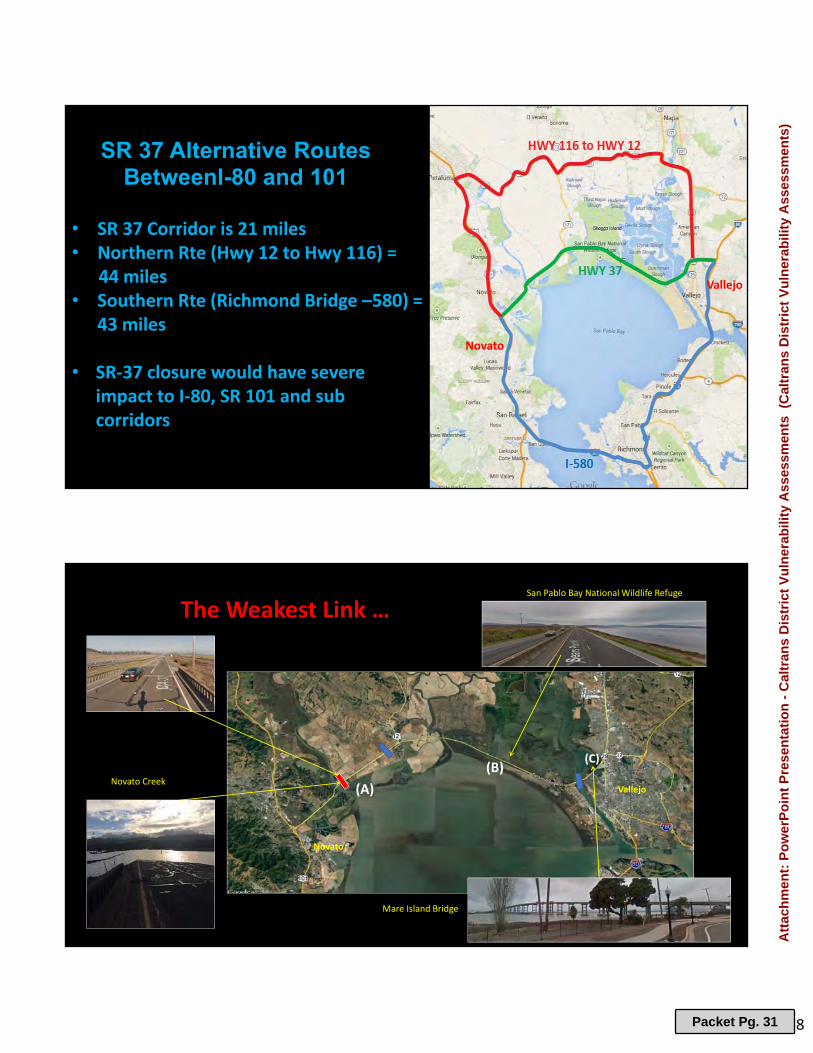
SR 37 Alternative Routes BetweenI-80 and 101
• SR 37 Corridor is 21 miles• Northern Rte (Hwy 12 to Hwy 116) =
44 miles• Southern Rte (Richmond Bridge –580) =
43 miles
• SR‐37 closure would have severe impact to I‐80, SR 101 and sub corridors
Novato
Vallejo
The Weakest Link …
Mare Island Bridge
San Pablo Bay National Wildlife Refuge
Novato CreekVallejo
Novato
(A)
(B)(C)
Packet Pg. 31
Att
ach
men
t: P
ow
erP
oin
t P
rese
nta
tio
n -
Cal
tran
s D
istr
ict
Vu
lner
abili
ty A
sses
smen
ts (
Cal
tran
s D
istr
ict
Vu
lner
abili
ty A
sses
smen
ts)
9
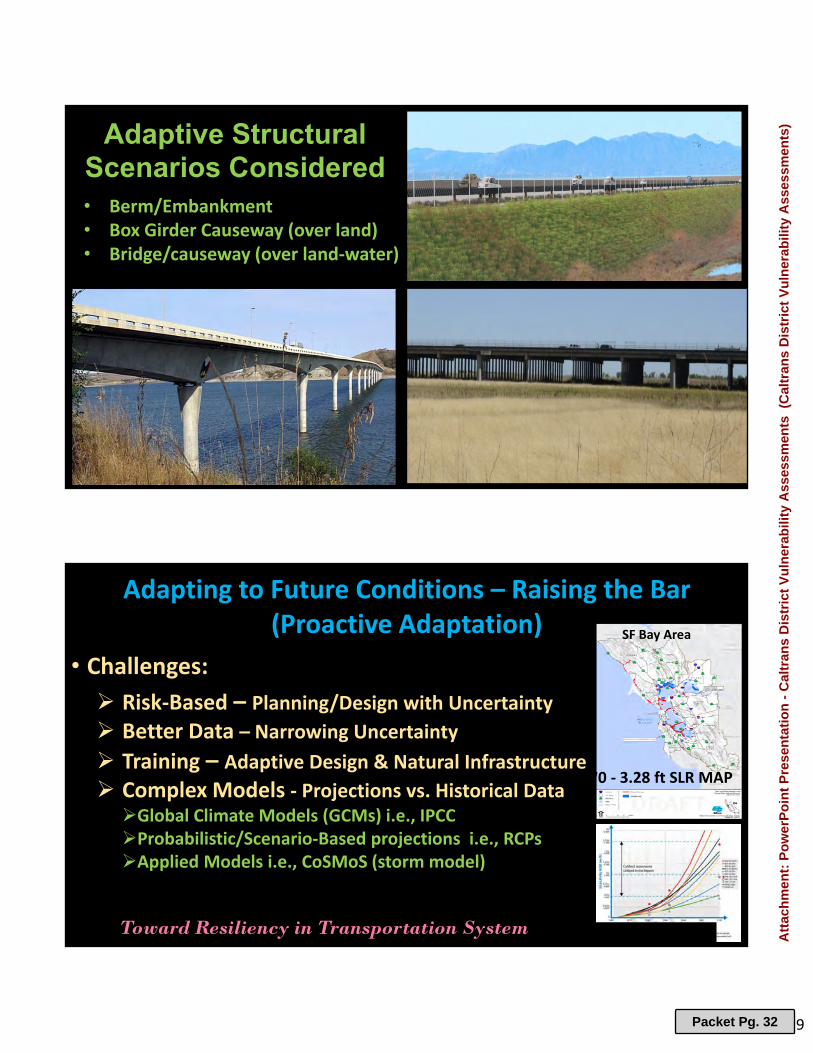
Adaptive Structural Scenarios Considered • Berm/Embankment• Box Girder Causeway (over land)• Bridge/causeway (over land‐water)
• Challenges: Risk‐Based – Planning/Design with Uncertainty
Better Data – Narrowing Uncertainty
Training – Adaptive Design & Natural Infrastructure
Complex Models ‐ Projections vs. Historical DataGlobal Climate Models (GCMs) i.e., IPCCProbabilistic/Scenario‐Based projections i.e., RCPsApplied Models i.e., CoSMoS (storm model)
Adapting to Future Conditions – Raising the Bar(Proactive Adaptation)
Toward Resiliency in Transportation System
2070 ‐ 3.28 ft SLR MAP
SF Bay Area
Model Projections
Packet Pg. 32
Att
ach
men
t: P
ow
erP
oin
t P
rese
nta
tio
n -
Cal
tran
s D
istr
ict
Vu
lner
abili
ty A
sses
smen
ts (
Cal
tran
s D
istr
ict
Vu
lner
abili
ty A
sses
smen
ts)
10
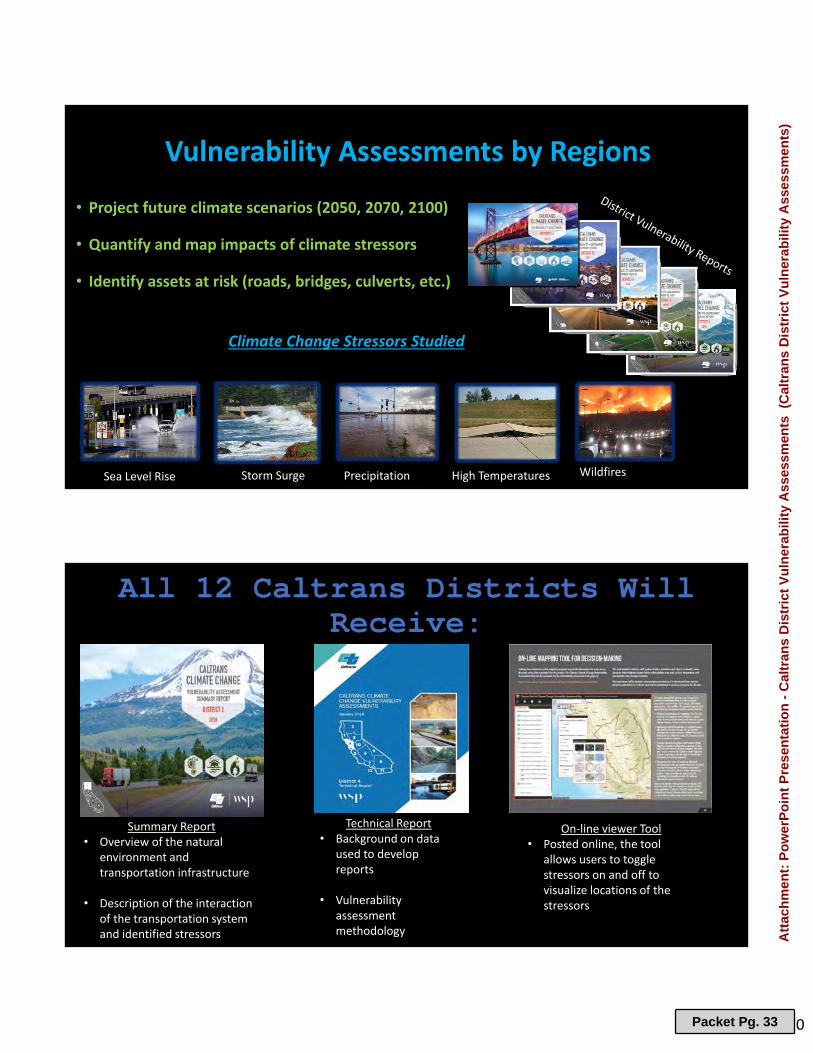
• Project future climate scenarios (2050, 2070, 2100)
• Quantify and map impacts of climate stressors
• Identify assets at risk (roads, bridges, culverts, etc.)
Vulnerability Assessments by Regions
PrecipitationSea Level Rise WildfiresHigh Temperatures
Climate Change Stressors Studied
Storm Surge
All 12 Caltrans Districts Will Receive:
Summary Report• Overview of the natural
environment and transportation infrastructure
• Description of the interaction of the transportation system and identified stressors
Technical Report• Background on data
used to develop reports
• Vulnerability assessment methodology
On‐line viewer Tool• Posted online, the tool
allows users to toggle stressors on and off to visualize locations of the stressors
Packet Pg. 33
Att
ach
men
t: P
ow
erP
oin
t P
rese
nta
tio
n -
Cal
tran
s D
istr
ict
Vu
lner
abili
ty A
sses
smen
ts (
Cal
tran
s D
istr
ict
Vu
lner
abili
ty A
sses
smen
ts)
11
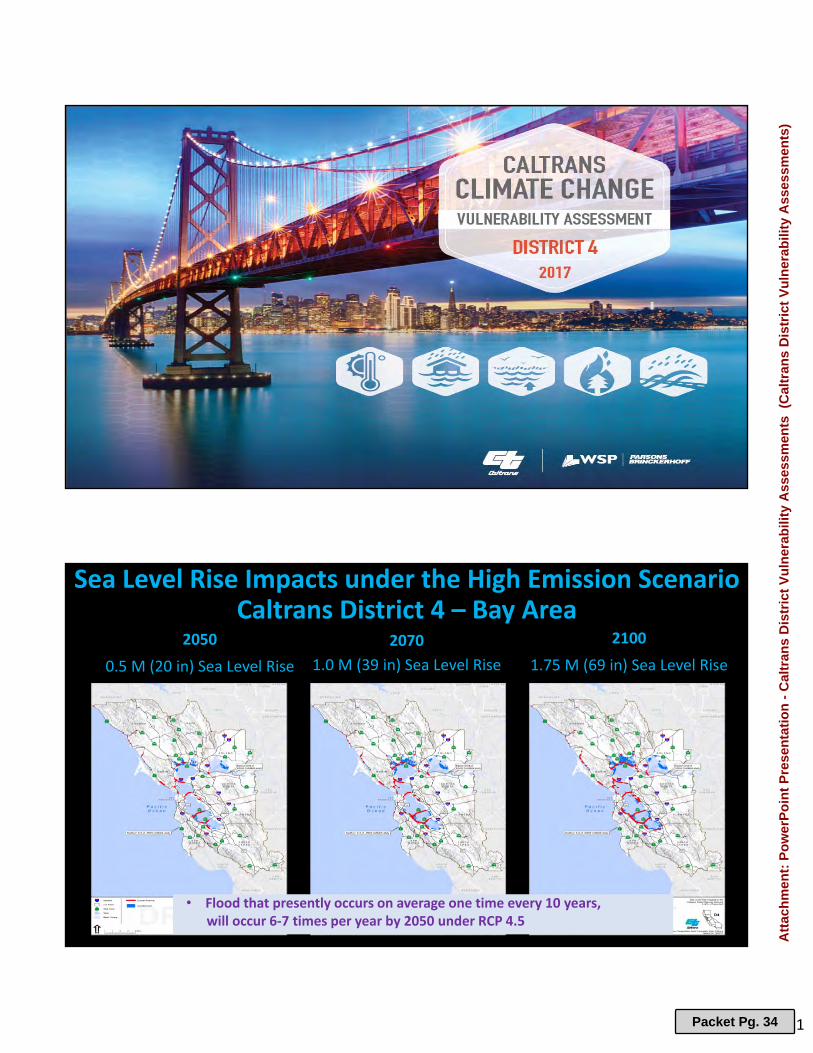
2050
0.5 M (20 in) Sea Level Rise
2100
1.75 M (69 in) Sea Level Rise2070
1.0 M (39 in) Sea Level Rise
Sea Level Rise Impacts under the High Emission ScenarioCaltrans District 4 – Bay Area
• Flood that presently occurs on average one time every 10 years, will occur 6‐7 times per year by 2050 under RCP 4.5
Packet Pg. 34
Att
ach
men
t: P
ow
erP
oin
t P
rese
nta
tio
n -
Cal
tran
s D
istr
ict
Vu
lner
abili
ty A
sses
smen
ts (
Cal
tran
s D
istr
ict
Vu
lner
abili
ty A
sses
smen
ts)
12
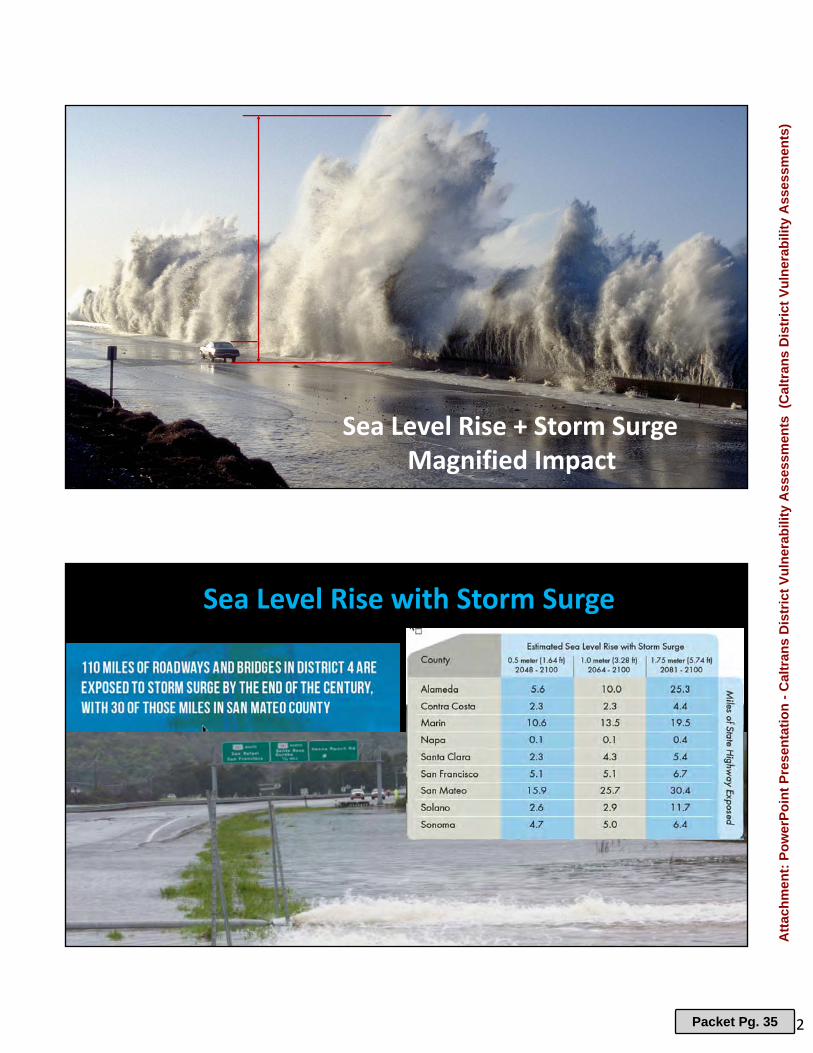
Sea Level Rise + Storm SurgeMagnified Impact
Sea Level Rise with Storm Surge
Packet Pg. 35
Att
ach
men
t: P
ow
erP
oin
t P
rese
nta
tio
n -
Cal
tran
s D
istr
ict
Vu
lner
abili
ty A
sses
smen
ts (
Cal
tran
s D
istr
ict
Vu
lner
abili
ty A
sses
smen
ts)
13
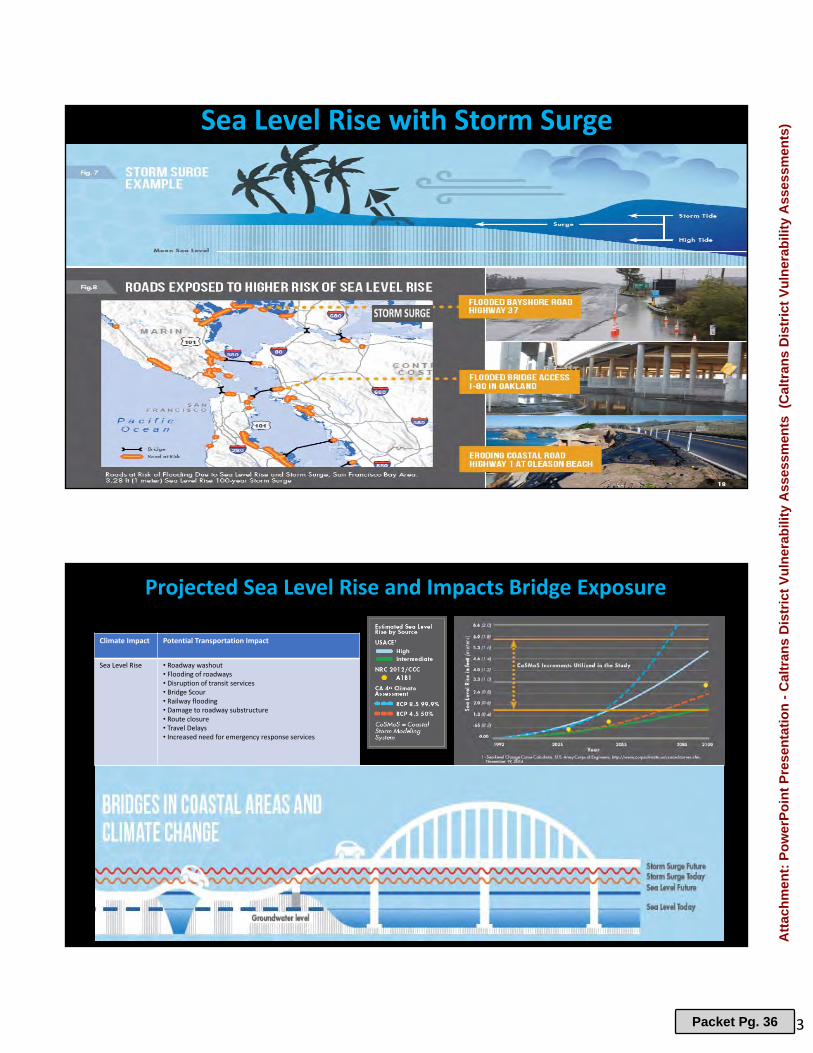
Sea Level Rise with Storm Surge
Projected Sea Level Rise and Impacts Bridge Exposure
Climate Impact Potential Transportation Impact
Sea Level Rise • Roadway washout• Flooding of roadways• Disruption of transit services• Bridge Scour• Railway flooding• Damage to roadway substructure • Route closure• Travel Delays• Increased need for emergency response services
RCP – Representative Concentration Pathway
Packet Pg. 36
Att
ach
men
t: P
ow
erP
oin
t P
rese
nta
tio
n -
Cal
tran
s D
istr
ict
Vu
lner
abili
ty A
sses
smen
ts (
Cal
tran
s D
istr
ict
Vu
lner
abili
ty A
sses
smen
ts)
14
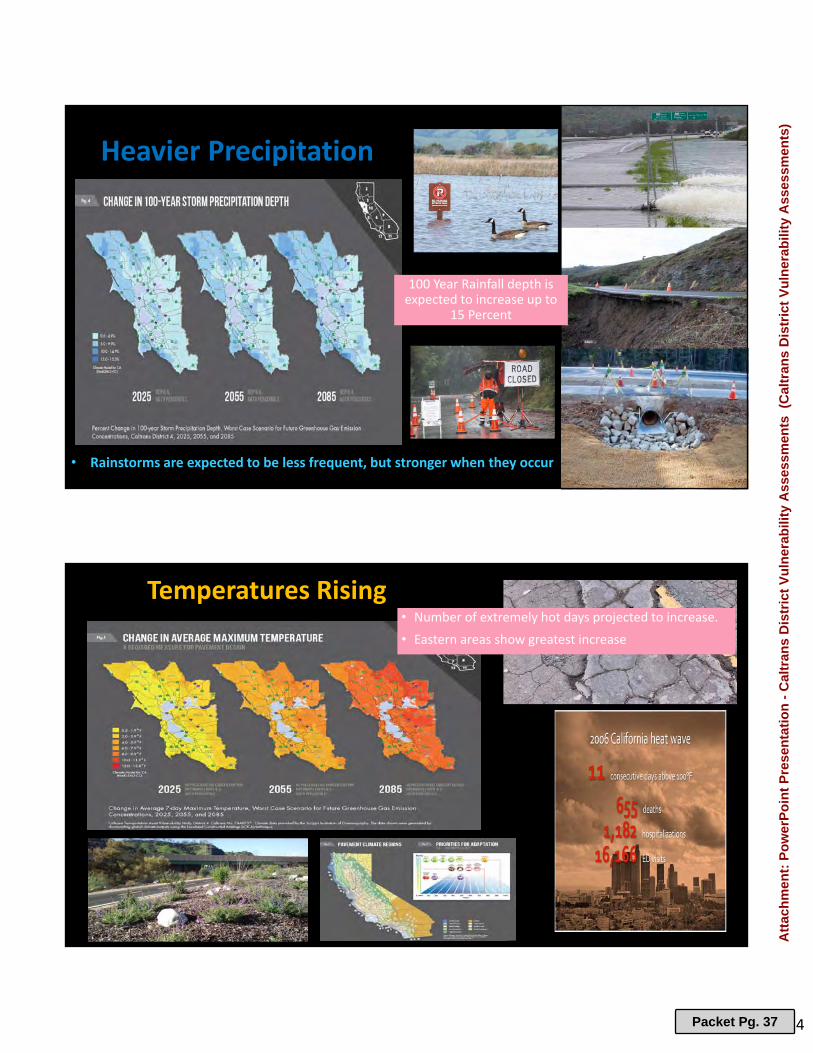
Heavier Precipitation
100 Year Rainfall depth is expected to increase up to
15 Percent
• Rainstorms are expected to be less frequent, but stronger when they occur
Temperatures Rising• Number of extremely hot days projected to increase.• Eastern areas show greatest increase
Packet Pg. 37
Att
ach
men
t: P
ow
erP
oin
t P
rese
nta
tio
n -
Cal
tran
s D
istr
ict
Vu
lner
abili
ty A
sses
smen
ts (
Cal
tran
s D
istr
ict
Vu
lner
abili
ty A
sses
smen
ts)
15
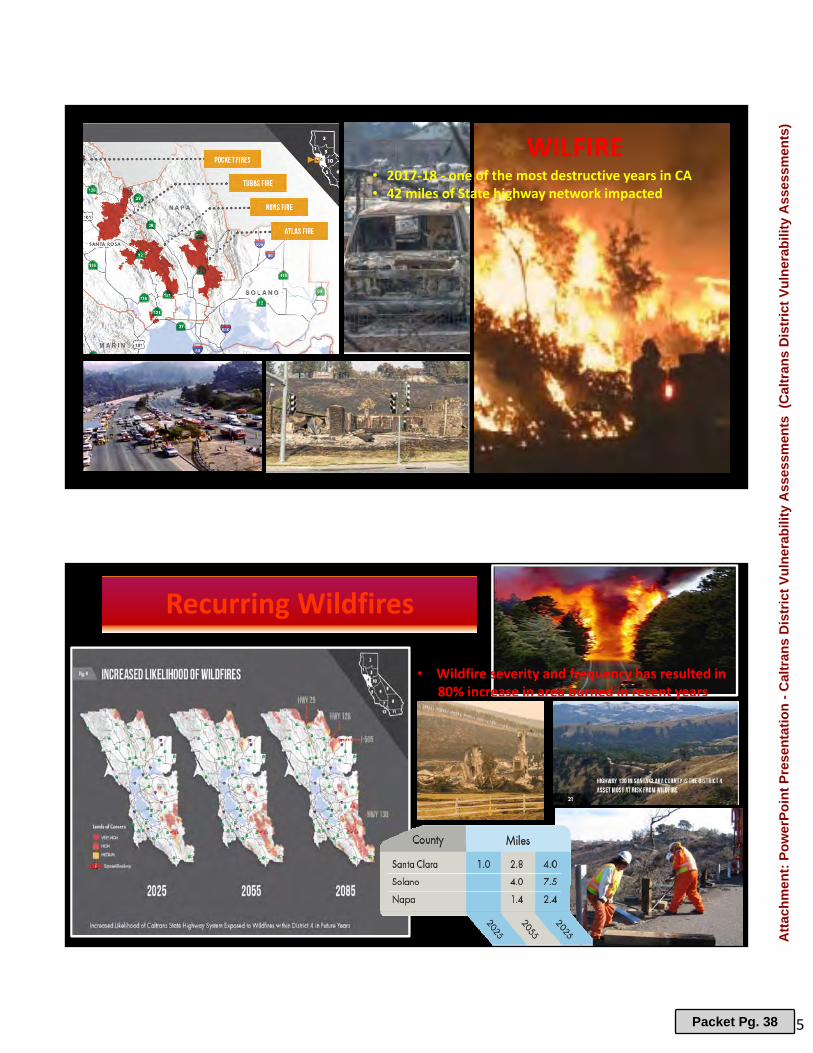
WILFIRE
State route serving as staging area during a fire
• 2017‐18 ‐ one of the most destructive years in CA• 42 miles of State highway network impacted
Recurring Wildfires
• Wildfire severity and frequency has resulted in 80% increase in area burned in recent years
Packet Pg. 38
Att
ach
men
t: P
ow
erP
oin
t P
rese
nta
tio
n -
Cal
tran
s D
istr
ict
Vu
lner
abili
ty A
sses
smen
ts (
Cal
tran
s D
istr
ict
Vu
lner
abili
ty A
sses
smen
ts)

16
Asset‐level assessments• Identify Localized Exposure• Develop Facility Management Plans’• Local Coordination• Develop complementary practices
Projected View
ON‐LINE INTERACTIVE MAPPING TOOL FOR DECISION‐MAKING
Packet Pg. 39
Att
ach
men
t: P
ow
erP
oin
t P
rese
nta
tio
n -
Cal
tran
s D
istr
ict
Vu
lner
abili
ty A
sses
smen
ts (
Cal
tran
s D
istr
ict
Vu
lner
abili
ty A
sses
smen
ts)
17
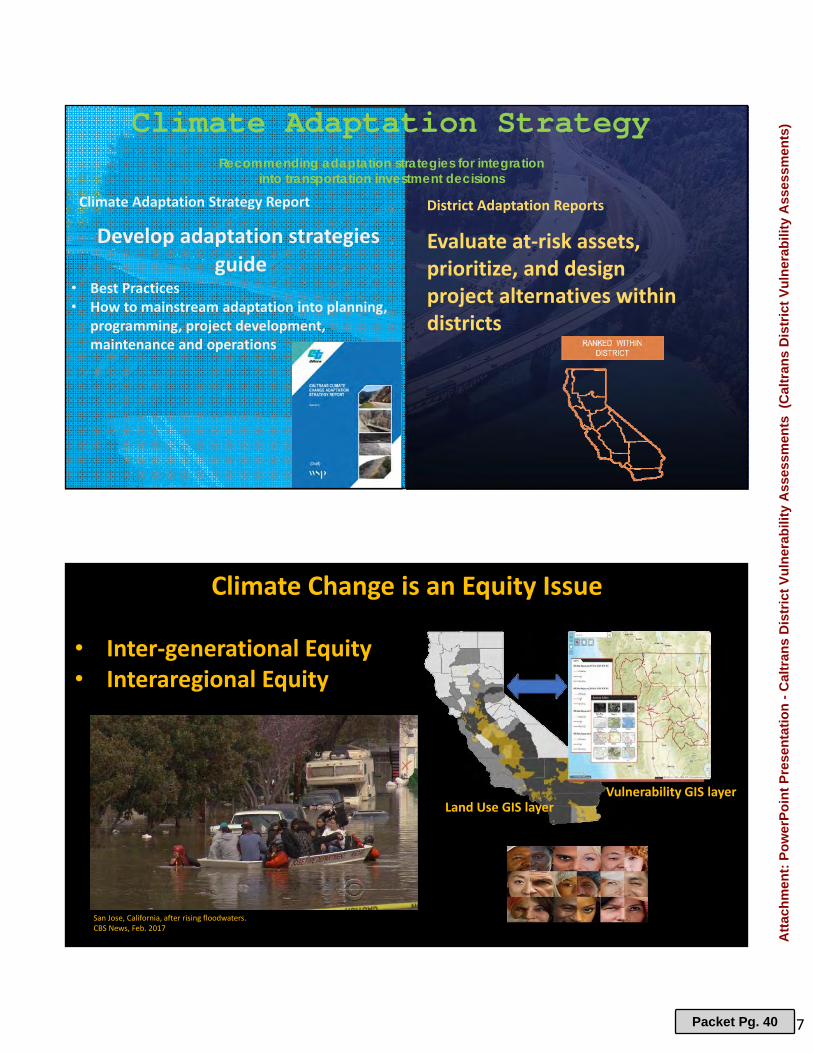
Evaluate at‐risk assets, prioritize, and design project alternatives within districts
District Adaptation Reports
Develop adaptation strategiesguide
• Best Practices• How to mainstream adaptation into planning,
programming, project development, maintenance and operations
Climate Adaptation Strategy Report
Climate Adaptation StrategyRecommending adaptation strategies for integration
into transportation investment decisions
Climate Change is an Equity Issue
• Inter‐generational Equity• Interaregional Equity
San Jose, California, after rising floodwaters.CBS News, Feb. 2017
Land Use GIS layerVulnerability GIS layer
Packet Pg. 40
Att
ach
men
t: P
ow
erP
oin
t P
rese
nta
tio
n -
Cal
tran
s D
istr
ict
Vu
lner
abili
ty A
sses
smen
ts (
Cal
tran
s D
istr
ict
Vu
lner
abili
ty A
sses
smen
ts)

18
Transportation in the Face of Changing Climate
Thank [email protected]
I‐15 Washout, February 2017 District 8
Packet Pg. 41
Att
ach
men
t: P
ow
erP
oin
t P
rese
nta
tio
n -
Cal
tran
s D
istr
ict
Vu
lner
abili
ty A
sses
smen
ts (
Cal
tran
s D
istr
ict
Vu
lner
abili
ty A
sses
smen
ts)

REPORT
Southern California Association of Governments
900 Wilshire Boulevard, Suite 1700, Los Angeles, California 90017 August 1, 2019
RECOMMENDED ACTION: For Information Only - No Action Required STRATEGIC PLAN: This item supports the following Strategic Plan Goal 1: Produce innovative solutions that improve the quality of life for Southern Californians. 4: Provide innovative information and value-added services to enhance member agencies’ planning and operations and promote regional collaboration. EXECUTIVE SUMMARY: SCAG Aviation Program staff have been gathering data and conducting analysis, including surveying and evaluating different regional aviation forecasts, in preparation of the Aviation Element of the Draft 2020 Regional Transportation Plan/Sustainable Communities Strategy (RTP/SCS) (Connect SoCal). Based on research and analysis of different aviation forecasts, including discussions with key stakeholders and experts, projected growth rates for the SCAG region passenger and cargo demand forecasts have been determined. SCAG staff have chosen to utilize passenger and cargo growth rate projections developed by the Federal Aviation Administration. BACKGROUND: As a metropolitan planning organization (MPO), SCAG does not have any regulatory, developmental, operational, or planning authority over the airports. Development authority rests with the airports (i.e. airport sponsors retain authority over planning and development decisions) and the Federal Aviation Administration (FAA). Rather, as the designated MPO for the six-County Southern California Region, and thus primarily a surface transportation planning agency, SCAG is focused on air and passenger cargo activity from the perspective of how the traffic coming and going from the airports affects the region’s roads, highways, and transit system. More specifically, California State Law (CA Government Code Section 65081.1) requires that regions that contain a primary air carrier airport (i.e. at least 10,000 annual scheduled passenger boardings) include an
To: Transportation Committee (TC) EXECUTIVE DIRECTOR’S APPROVAL
From: Hiroshi Ishikawa, Associate Regional Planner, Aviation
Department, (213) 236-1838, [email protected] Subject: Aviation Program Update: Regional Air Passenger and Cargo
Forecast
Packet Pg. 42

REPORT
airport ground access improvement program within the MPO regional transportation plan. Normally, MPOs address ground access improvements to the airports by discussing ongoing and proposed airport ground access projects, and maintaining an updated list of ongoing and proposed transportation projects, including airport ground access projects. In addition to the updated list of ground access projects, another way SCAG addresses airport ground transportation needs is by analyzing the current and the future passenger and air cargo demand within the region as part of the Regional Transportation Plan/Sustainable Communities Strategy (RTP/SCS) Update. In order to assess the impact of airport activity on the surface transportation system, SCAG includes an analysis of historic, current, and projected aviation passenger and cargo demand as part of the RTP/SCS. Specifically for the Connect SoCal, SCAG aviation program staff have gathered airport activity data from the airports and other sources, analyzed that data, reviewed aviation demand forecasts from different agencies and organizations (e.g. FAA, AECOM), conducted internal forecasts using airport activity data, met with the airports and other experts, vetted initial analysis and findings with the Aviation Technical Advisory Committee and the Transportation Committee, and come to an empirically-driven conclusion on annual projected growth rates for passenger and cargo demand in the region based on the above research, analyses, and discourse. SCAG REGION PASSENGER ACTIVITY AND FORECASTS: SCAG region air passenger activity and trends: Despite some downturns, air passenger traffic in the region has increased at a steady rate over the past two decades, with a particularly vigorous growth rate in recent years. While the air passenger growth from 88.5 MAP in 2000 to 110.17 MAP in 2017 appears relatively modest at 1.3 percent annual growth, the overall growth during this seventeen-year time period reflects downturns that occurred following 9/11 and the Great Recession that started in 2007 and ended around 2011/12. After starting off the century at 88.5 MAP, air passenger travel experienced a significant decline following 9/11, going from 81.9 MAP in 2001 to 77.9 MAP in 2002. Air travel increased again until the Great Recession in 2006, which saw air travel demand go down as low as 79.1 MAP in 2009. However, following the dips in 2002 and 2009, air travel in the region has grown at a steady rate, with a noticeable increase following 2012. Post-Great Recession, the increase in air passenger traffic has been robust. The region saw an increase from 85.8 MAP in 2012 to 110.17 MAP in 2017, an increase of 28 percent or 5.12 percent per year growth, making the SCAG region one of the fastest growing for passenger traffic when compared to other metropolitan regions, such as New York/New Jersey and Washington, DC. Overall, the SCAG region is one of the most active in terms of air passenger traffic, as well as annual air passenger demand growth. Comparison of passenger demand with other regions: In 2017, the six-county SCAG region was one of the most active and fastest growing regions for air passenger traffic in the United States. At
Packet Pg. 43

REPORT
110.17 MAP, SCAG was second only to the New York/New Jersey region for air passenger traffic, which saw a total of 132.69 MAP. Moreover, the growth rate of 5.12 percent for the SCAG region from 2012 to 2017 was second only to the Bay Area at 5.33 percent for the same time period. In general, the high air passenger activity and growing demand seen in the SCAG region is a trend occurring throughout the United States. Other major metropolitan regions in the United States saw significant air passenger activity and growth. Moreover, most regional forecasts project the growth in passenger demand to continue going forward. SCAG region passenger demand forecast: In order to develop regional air passenger and cargo forecasts for Connect SoCal, a comprehensive review was conducted of different forecasts and their respective methodologies, including work done by the Federal Aviation Administration (FAA), and AECOM for the 2016 RTP/SCS. Both the FAA and AECOM utilized logarithmic regression (i.e. natural log transformations of the dependent and independent variables) analysis to develop their forecasted growth rates. Logarithmic regression analysis is a commonly accepted method for forecasting aviation travel demand by academics, at the University of California, Institute of Transportation Studies, and the Transportation Research Board. In addition to logarithmic regression analysis being the standard method for aviation demand forecasting, utilizing the economy and airfare as key explanatory or independent variables for the response/dependent variable of passenger activity/demand is also the generally accepted industry and academic practice. For instance, the University of California, Institute of Transportation Studies, and the FAA Terminal Area Forecast (TAF), both use economy and airfare as key variables in their aviation forecast modeling. A healthy economy (usually measured in GDP or personal income) is correlated with increased air traffic. Conversely, the price of airfare is said to be negatively correlated with air travel demand (i.e. as prices increase then demand decreases, as prices decrease then demand increases). Therefore, for the purposes of air passenger demand modeling and forecasting, economy and airfare have proven to be statistically and practically significant variables. Due to generally accepted industry and academic practice, both the FAA and AECOM focused their logarithmic regression analyses and forecasts on the impact that airfare and the economy (e.g. income, gross domestic product) have on air passenger demand. The FAA-TAF forecasted a growth rate of 2.1 percent for passenger enplanements at the commercial airports in the SCAG region from 2017 to 2045 (i.e. the base year and horizon year for the upcoming SCAG RTP/SCS). The AECOM 2016-2045 RTP forecasted annual growth rate of 1.6 percent was much more conservative in comparison. Due to the conservative projected growth rate, and the lower base year number of 2013/88.4 MAP caused by a region still recovering from the Great Recession, the 2040 projection from the 2016 RTP is relatively low in comparison to previous SCAG air passenger demand forecasts, the most recent FAA-TAF, and other regional, national, and international forecasts. Furthermore, in comparison to the actual passenger activity growth rates from around the world and the United States for 2012 to 2017, both the AECOM projected growth rate for the 2016
Packet Pg. 44
REPORT
RTP/SCS and the 2018 FAA-TAF growth rate for the SCAG region were relatively modest growth estimates. Understanding the AECOM and FAA-TAF projected growth rates and forecasts within the context of actual activity data and growth rates, and comparable projections and forecasts, informed the decision-making process for the Connect SoCal regional forecasts. Based on the 2016 AECOM and the FAA-TAF analyses, with input from the airports and ATAC, and an analysis conducted by an independent expert, a base year/passenger demand number of 2017/110.17 MAP and a growth rate of 2.1 percent for Connect SoCal was established. Determining the base (2017) and horizon (2045) years was relatively straightforward. The base year for the 2016-2040 RTP/SCS aviation demand forecast, conducted by AECOM, was 2013. Thus, the base year for the Connect SoCal demand forecast was moved forward by four years to 2017. Furthermore, 2017 was the most recent year available with complete airport passenger activity data. Although the base year for most of the analyses for Connect SoCal is 2016, a base year of 2017 empirically made the most sense for the Aviation Element. The horizon year of 2045 was already predetermined by the RTP/SCS development process. Much more complex was the determination of 2.1 percent as the projected annual growth. The proposed growth rate of 2.1 percent for the SCAG region is still relatively low when compared to the forecasted growth rates for other comparable city (e.g. San Francisco), North American (e.g. United States), and international (e.g. Africa, Asia, the world), points of comparison. However, 2.1 percent is a slightly more reasonable estimate for the SCAG region when one factors in the airport-level forecasts and constraints, and the long forecast horizon (2017 – 2045). Thus, based on an analysis of domestic and international growth rates by SCAG staff with support from an aviation planning expert, Mike Armstrong, the FAA-TAF 2.1 percent growth rate was determined to be a conservative but reasonable growth rate for the SCAG region. Once the methodological assumptions were discussed, vetted, and finalized, the base year of 2017 with the passenger demand of 110.17 MAP, was then compounded at an annual rate of 2.1 percent for a 28-year growth period (2017 to 2045) to project 197.3 MAP for 2045. SCAG Region Air Passenger Forecast
Base year (2017): 110.17 MAP
Projected growth rate for air passenger demand: 2.1 percent
Horizon year (2045): 197.1 MAP
SCAG REGION AIR CARGO ACTIVITY AND FORECASTS: SCAG region air cargo activity and trends: Although the air cargo activity in the region is currently operating at high levels, similar to or even more so than air passenger travel, air cargo can be sensitive to changes in the economy. Due to significant downturns in the air cargo industry caused by 9/11 and the Great Recession, the overall growth in regional air cargo traffic has been relatively
Packet Pg. 45
REPORT
flat. From 2000 to 2017, air cargo grew marginally at 0.52 percent annual growth, going from 2.87 million tons of cargo in 2000 to 3.14 million tons in 2017. However, the steady to low growth in air cargo is also a reflection of the depressions caused by 9/11 and the Great Recession. Following 2010, air cargo experienced a boom, with air cargo demand hitting especially robust growth from 2012 onwards. In recent years, air cargo activity in the region has experienced a dramatic upsurge. From 2012 to 2017, air cargo grew at an increased annual rate of 4.6 percent. The growth over the last decade is due in great part to a relatively healthy post-Great Recession economy. Whether the recent upward trend for cargo will continue remains to be seen, but the FAA is fairly optimistic in its cargo industry forecast. In the 2019 FAA Aerospace Forecast, the FAA forecasted annual cargo demand growth at 3.3 percent. Given the current and the forecasted growth in air cargo, and the subsequent increase in truck traffic coming and going from the region’s airports, planning and strategizing for the surface transportation system into the future will be critical. Federal Aviation Administration Aerospace Forecast: The regional cargo forecast for the Connect SoCal was calculated using the Federal Aviation Administration (FAA) Aerospace Forecast. The 2019 FAA Aerospace Forecast estimates an annual growth rate for air cargo at 3.3 percent a year. Cargo forecasts are based on the assumptions that existing security restrictions will remain, most of the shift from air to ground transportation has occurred, and that long-term cargo growth is driven by economic growth. As a result, most forecast models of cargo activity are linked to gross domestic product. Based on the FAA growth rate (3.3 percent), using a base year of 2017 and 3.14 million tons, the air cargo forecast for the SCAG region in 2045 is 7.7 million tons. SCAG Region Air Cargo Forecast
Base Year (2017): 3.14 million tons
Projected growth rate for cargo demand: 3.3 percent
Horizon Year (2045): 7.77 million tons
DECLINING AIRCRAFT OPERATIONS AND FLATTENING FORECASTS: SCAG region aircraft operations have been declining: Overall growth in passenger and cargo demand has not resulted in increased aircraft operations. Although air passenger traffic has increased steadily from 2000 to 2017, and dramatically from 2012 to 2017, aircraft operations have actually decreased overall from 2000 to 2017, and flattened from 2012 to 2017. The SCAG region commercial, reliever, and general aviation airports went from 5.1 million operations in 2000 to 3.7 million operations in 2017. After hitting a dip of 3.6 million operations in 2012, aircraft operations
Packet Pg. 46
REPORT
began to flatten out and slowly increase. Overall, aircraft operations in the region decreased by an annual rate of 1.8 percent, or 26.51 percent total, from 2000 to 2017, and then increasing slightly from 2012 to 2017 at an annual rate of 0.8 percent. Therefore, as evidenced by the data, increased passenger and cargo activity does not result in aircraft operations increasing at the same rate. Due to various factors, the number of total aircraft operations did not grow as dramatically as the number of air passengers or cargo activity. Much of the discrepancy between air passenger traffic and aircraft operations annual growth rates can be explained by the newer model larger aircraft (e.g. Airbus A380, Boeing 747-8), planes with smaller seats and more rows, and airlines running at higher load factors (e.g. over 90 percent versus 70 percent) than in the past1. Federal Aviation Administration (FAA) forecasting flatter growth for aircraft operations: Unlike forecasted increases in air passenger and cargo activity, forecasted increases in aircraft operations are projected at a significantly lower rate. Given breakthroughs in technology and manufacturing, it is likely that newer aircraft with higher capacity (and lower emissions and sound) will be replacing the older planes in the airline fleets2. Moreover, it is also likely that the airlines will continue to increase their load factors3. In addition to changes in the commercial airline industry, the decline in general aviation operations has and will continue to impact the overall number of aircraft operations. Therefore, due in part to these key factors (e.g. larger planes, increased load factors, decreasing general aviation), the 2018 FAA-TAF estimates a relatively conservative annual growth rate of 0.74 percent for total aircraft operations in the SCAG region from 2017 to 2045. SCAG Region Aircraft Operations Forecast (2017 to 2045)
Base Year (2017): 3.7 million operations
Projected growth rate for aircraft operations: 0.74 percent
Horizon Year (2045): 4.58 million operations
NEXT STEPS: Follow up with airports to finalize airport-level forecasts and capacity constraints: Following the determination of the projected growth rate and passenger demand for the SCAG region, the next
1 Goldstein, Michael. 2018. “Meet the Most Crowded Airlines: Load Factor Hits All-Time High.” Forbes. https://www.forbes.com/sites/michaelgoldstein/2018/07/09/meet-the-most-crowded-airlines-load-factor-hits-all-time-high/#51f151b554fb 2 Federal Aviation Administration (FAA). History of Noise. https://www.faa.gov/regulations_policies/policy_guidance/noise/history/ 3 Goldstein, Michael. 2018. “Meet the Most Crowded Airlines: Load Factor Hits All-Time High.” Forbes. https://www.forbes.com/sites/michaelgoldstein/2018/07/09/meet-the-most-crowded-airlines-load-factor-hits-all-time-high/#51f151b554fb
Packet Pg. 47
REPORT
step will be to drill down and develop airport-level passenger demand forecasts. The development of the airport-level passenger forecasts for the Connect SoCal requires follow-up with the SCAG region’s airports, particularly regarding projected airport activity and airport capacity constraints (institutional and physical). A critical component of the analytical process throughout the development of the Connect SoCal air passenger forecasts has been working with the airports to sync the regional forecast with the individual airport forecasts and capacity constraints. Each of the commercial airports in the region have their own project timelines and internal passenger activity forecasts, as well as physical, institutional, and legal capacity constraints. Thus, in determining a projected annual growth rate for the region, the SCAG Aviation Program staff was, and continues to be, mindful of how airport-specific forecasts and constraints correspond with the broader regional forecast. FISCAL IMPACT: Work associated with this item is included in the FY 2019-2020 Overall Work Program (230-0174.05: 2016 RTP/SCS Regional Aviation Program Implementation and Preparation for the 2020 RTP/SCS) ATTACHMENT(S): 1. PowerPoint Presentation - Regional Passenger Forecast
Packet Pg. 48
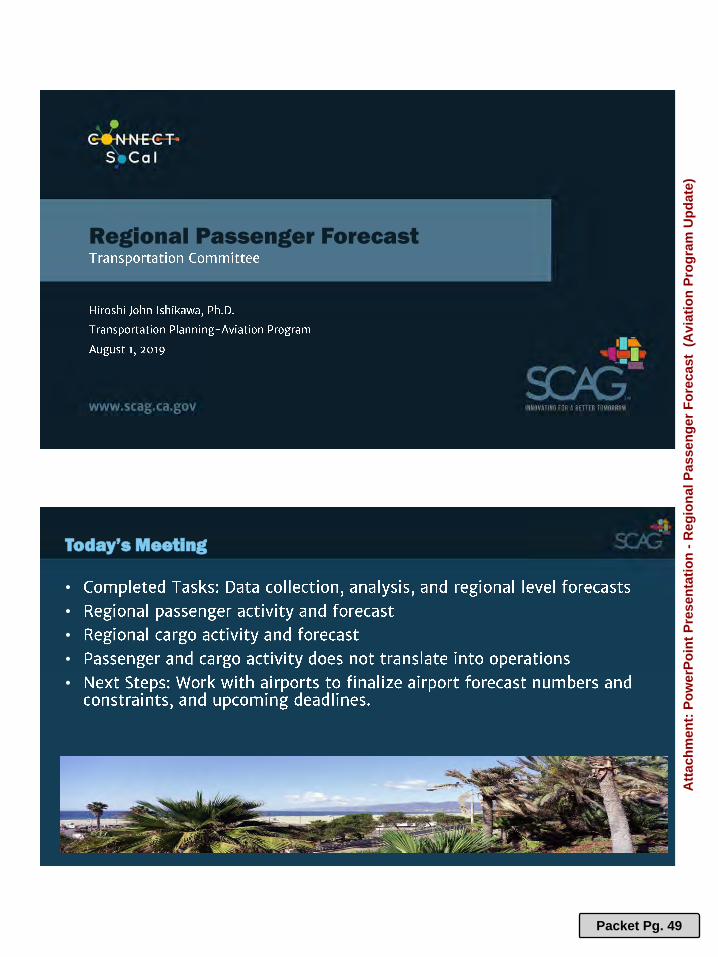
Regional Passenger Forecast
•••••
Today’s Meeting
Packet Pg. 49
Att
ach
men
t: P
ow
erP
oin
t P
rese
nta
tio
n -
Reg
ion
al P
asse
ng
er F
ore
cast
(A
viat
ion
Pro
gra
m U
pd
ate)
•
•
•
•
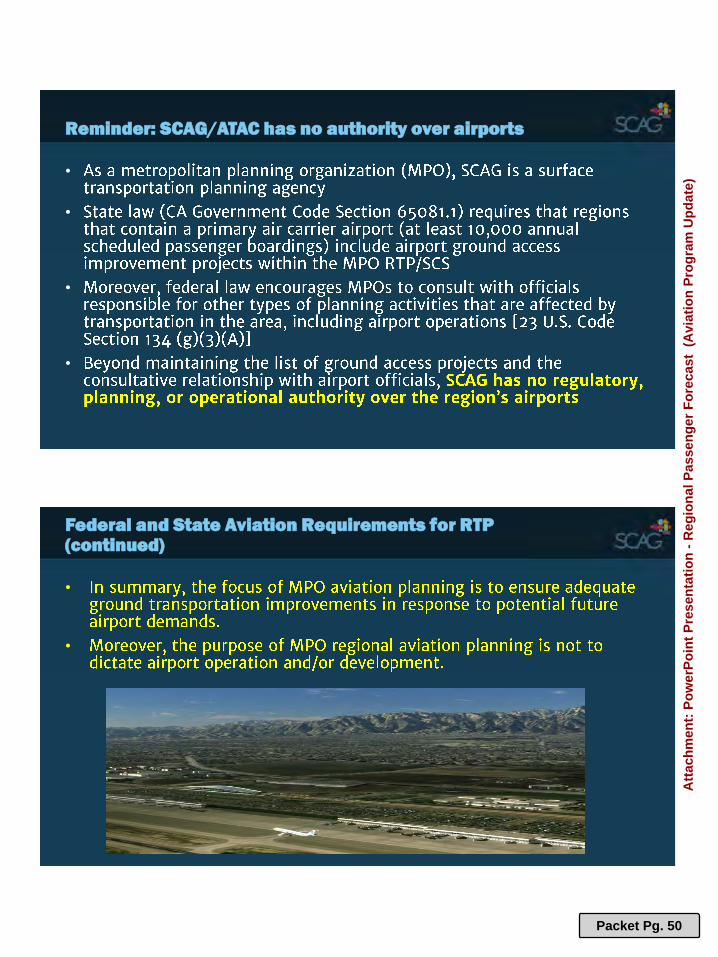
Reminder: SCAG/ATAC has no authority over airports
•
•
Federal and State Aviation Requirements for RTP (continued)
Packet Pg. 50
Att
ach
men
t: P
ow
erP
oin
t P
rese
nta
tio
n -
Reg
ion
al P
asse
ng
er F
ore
cast
(A
viat
ion
Pro
gra
m U
pd
ate)

•
••
•
•
••
Completed Tasks: Research and analysis for the RTP/SCS
•
•
•
Review: Passenger Activity in SCAG Region
Packet Pg. 51
Att
ach
men
t: P
ow
erP
oin
t P
rese
nta
tio
n -
Reg
ion
al P
asse
ng
er F
ore
cast
(A
viat
ion
Pro
gra
m U
pd
ate)
•
•
•
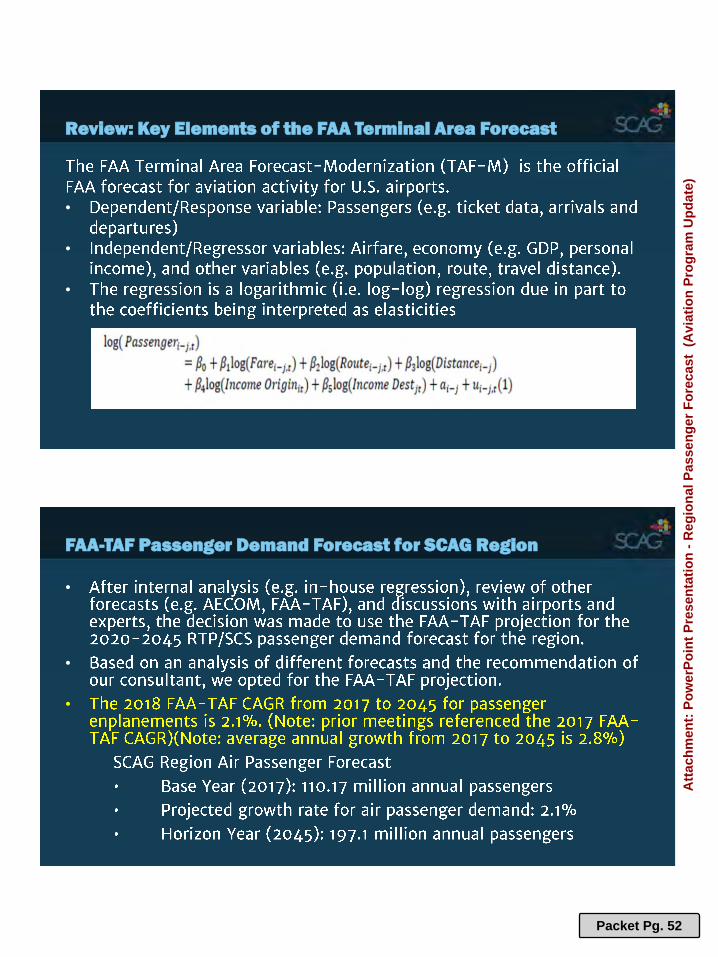
Review: Key Elements of the FAA Terminal Area Forecast
•
•
•
FAA-TAF Passenger Demand Forecast for SCAG Region
Packet Pg. 52
Att
ach
men
t: P
ow
erP
oin
t P
rese
nta
tio
n -
Reg
ion
al P
asse
ng
er F
ore
cast
(A
viat
ion
Pro
gra
m U
pd
ate)
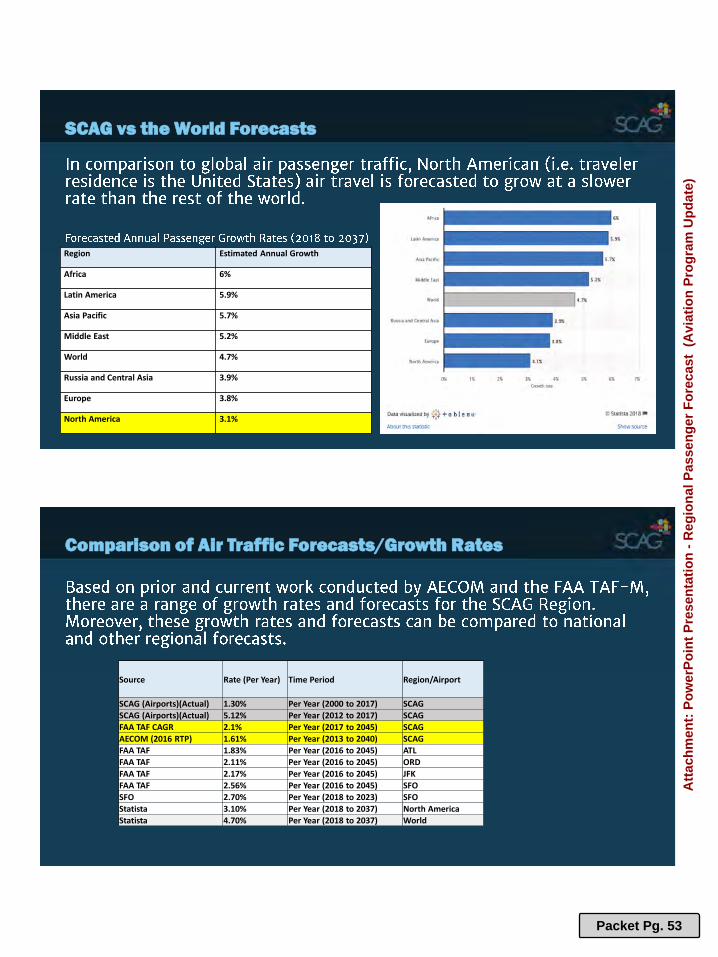
SCAG vs the World Forecasts
Region Estimated Annual Growth
Africa 6%
Latin America 5.9%
Asia Pacific 5.7%
Middle East 5.2%
World 4.7%
Russia and Central Asia 3.9%
Europe 3.8%
North America 3.1%
Comparison of Air Traffic Forecasts/Growth Rates
Source Rate (Per Year) Time Period Region/Airport
SCAG (Airports)(Actual) 1.30% Per Year (2000 to 2017) SCAG
SCAG (Airports)(Actual) 5.12% Per Year (2012 to 2017) SCAG
FAA TAF CAGR 2.1% Per Year (2017 to 2045) SCAG
AECOM (2016 RTP) 1.61% Per Year (2013 to 2040) SCAG
FAA TAF 1.83% Per Year (2016 to 2045) ATL
FAA TAF 2.11% Per Year (2016 to 2045) ORD
FAA TAF 2.17% Per Year (2016 to 2045) JFK
FAA TAF 2.56% Per Year (2016 to 2045) SFO
SFO 2.70% Per Year (2018 to 2023) SFO
Statista 3.10% Per Year (2018 to 2037) North America
Statista 4.70% Per Year (2018 to 2037) World
Packet Pg. 53
Att
ach
men
t: P
ow
erP
oin
t P
rese
nta
tio
n -
Reg
ion
al P
asse
ng
er F
ore
cast
(A
viat
ion
Pro
gra
m U
pd
ate)
•
••
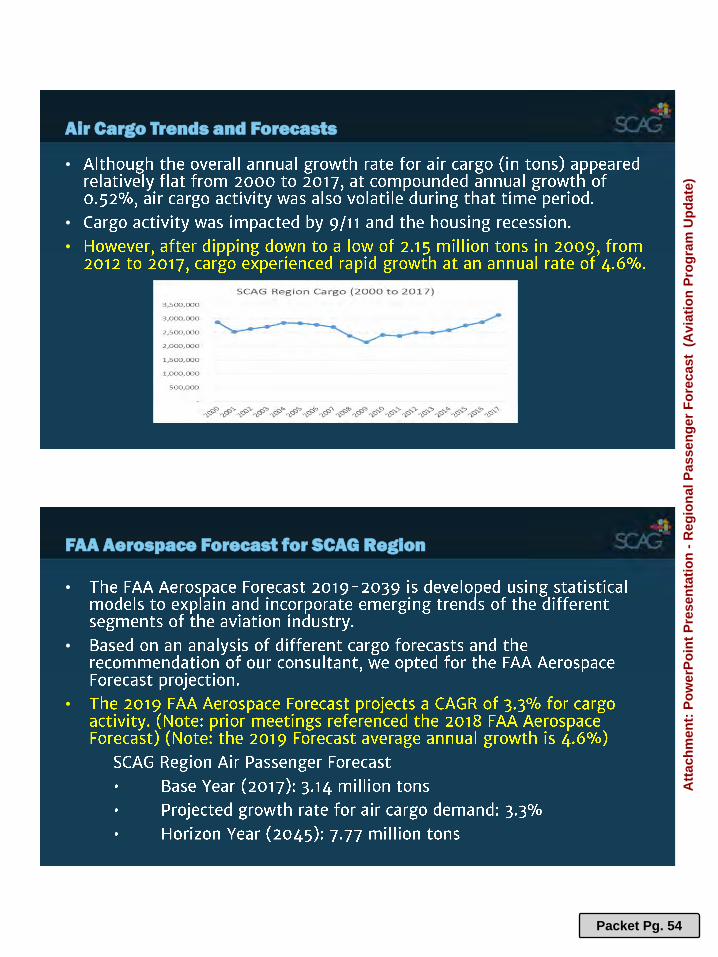
Air Cargo Trends and Forecasts
•
•
•
FAA Aerospace Forecast for SCAG Region
Packet Pg. 54
Att
ach
men
t: P
ow
erP
oin
t P
rese
nta
tio
n -
Reg
ion
al P
asse
ng
er F
ore
cast
(A
viat
ion
Pro
gra
m U
pd
ate)

•
•
•
Declining and flattening aircraft operations
•
•
•
Aircraft Operations Forecast for SCAG Region
Packet Pg. 55
Att
ach
men
t: P
ow
erP
oin
t P
rese
nta
tio
n -
Reg
ion
al P
asse
ng
er F
ore
cast
(A
viat
ion
Pro
gra
m U
pd
ate)

••••
Next Steps:
Thank you!
Mahalo nui loa!
Gracias!
Packet Pg. 56
Att
ach
men
t: P
ow
erP
oin
t P
rese
nta
tio
n -
Reg
ion
al P
asse
ng
er F
ore
cast
(A
viat
ion
Pro
gra
m U
pd
ate)

This Page Intentionally Left Blank

REPORT
Southern California Association of Governments
900 Wilshire Boulevard, Suite 1700, Los Angeles, California 90017 August 1, 2019
RECOMMENDED ACTION: Direct staff to include the proposed policy framework, which incorporates feedback from the Emerging Technologies Committee, in Connect SoCal, the 2020 Regional Transportation Plan/Sustainable Communities Strategy (RTP/SCS). STRATEGIC PLAN: This item supports the following Strategic Plan Goal 1: Produce innovative solutions that improve the quality of life for Southern Californians. 2: Advance Southern California’s policy interests and planning priorities through regional, statewide, and national engagement and advocacy. 4: Provide innovative information and value-added services to enhance member agencies’ planning and operations and promote regional collaboration. EXECUTIVE SUMMARY: Staff will present a matrix that can serve as a framework with which to view potential policies and strategies to assess new technologies in the region. These policies represent examples that SCAG could assist local jurisdictions in adopting as part of the implementation of the plan. Staff presented the proposed framework to the Emerging Technologies Committee (ETC) at their July 24, 2019 meeting. Feedback from the ETC is incorporated into the framework presented in this report. BACKGROUND: Emerging technology is a topic of intense speculation and interest at the regional planning level. Numerous popular press and academic articles have advanced the argument that the transportation sector is currently experiencing a period of changing transportation that has not been seen since the first decades of the previous century. Like that period, changes are now predominantly driven by private sector companies. In addition, the companies driving these changes are doing so through disruptive business models. At the state, regional and local levels, public agencies have begun to develop and implement policies that encourage technological innovation, and concurrently set boundaries regarding public
To: Transportation Committee (TC) EXECUTIVE DIRECTOR’S APPROVAL
From: Philip Law, Manager of Transit/Rail, 213-236-1841,
[email protected] Subject: Connect SoCal New Mobility Framework
Packet Pg. 57

REPORT
safety, use of the public right-of-way and more transparency with regards to data sharing. Larger cities in particular have learned valuable lessons since the sudden advent of TNCs took them completely by surprise. Many large cities across the state are working together on data platforms, which facilitate partnerships between technology innovators and the public sector. Jurisdictions in the SCAG region should work on developing customized frameworks for working with and anticipating technological change such as this. These frameworks allow cities and other public agencies to meet with emerging technology providers and assess whether the service benefits the jurisdiction beyond the novelty factor of hosting a new product. Cities in the SCAG region should continue to consider how these new services benefit residents. In addition, to avoid a future in which the SCAG region suffers from increased congestion and GHG emissions, reduced active transportation and compromised livable communities, the region should encourage adoption of policies that encourage what has been described as the Three Revolutions: Electrification, Sharing, and Automation. In addition to the examples cited earlier, SCAG has prepared a set of recommended policies. These policies represent examples that SCAG could assist local jurisdictions in adopting as part of implementation of the plan. These policies are recommendations that would need to be customized and adopted by local jurisdictions. They have been organized into three policy areas:
Land Use Policies - reflect collaborative ideas, incentives and regulations that local
jurisdictions could adopt to shape how emerging technologies interact with the built
environment and urban design.
Street Design Policies - reflect concepts that local jurisdictions and transportation agencies
could partner to implement, which would guide how emerging technologies operate in the
public right of way and the curb zone.
Pricing/System Management Policies - comprise the most effective and challenging
policies for influencing how users will choose to use emerging technologies in different
urban and suburban settings.
This matrix can help policymakers frame their initial reactions and policy solutions to both challenges and opportunities that arise from new technologies that enter our region. FISCAL IMPACT: Funding to support work on this report is included in 010.1631.02 (FY 19/20 OWP). ATTACHMENT(S): 1. Emerging Technology Policy Matrix_190724 2. PowerPoint Presentation - Connect Socal-Emerging_Tech_Report
Packet Pg. 58

1
Technology Specific Policies SCAG has prepared a set of recommended policies that will be featured in the Connect SoCal
Emerging Technology Technical Report. These policies represent examples that SCAG could
assist local jurisdictions in adopting as part of implementation of the plan. These policies are
recommendations that would need to be studied, customized and adopted by local jurisdictions
to fit the local context. For example, they would apply differently in urban areas than in
suburban areas. They have been organized into three policy areas:
Land Use Policies – reflect collaborative ideas, incentives and regulations that local
jurisdictions could adopt to shape how emerging technologies interact with the built
environment and urban design.
Street Design Policies – reflect concepts that local jurisdictions and transportation
agencies could partner to implement, which would guide how emerging technologies
operate in the public right of way, including the curb zone, as part of a comprehensive
curb space management system.
Pricing and System Management Policies - comprise the most effective and challenging
policies for influencing how users will choose to use emerging technologies in different
urban and suburban settings.
Local Government & Transportation Agencies Emerging Technology Policy Matrix
Land Use Street Design Pricing / System
Mgmt.
.Vehicle Electrification - light duty electric vehicles (EV) and charging stations.
Encourage EV charging at public fast charging locations, workplaces, and multi-family housing.
Encourage curbside EV charging stations and parking.
Provide rebates for charging stations and EVs.
Carshare - Cars that can be rented for a short period, either return-trip or point to point parking.
Encourage Carshare vehicles and parking as transportation demand management (TDM) strategies at workplaces, and multi-family housing.
Provide more on-street parking spaces or "pods" for car share vehicles.
Include car share as a service available on a Mobility as a Service (MaaS) platform. See below for definition of MaaS. Encourage carshare use as an alternative to single occupant vehicles (SOV).
Packet Pg. 59
Att
ach
men
t: E
mer
gin
g T
ech
no
log
y P
olic
y M
atri
x_19
0724
(C
on
nec
t S
oC
al N
ew M
ob
ility
Fra
mew
ork
)
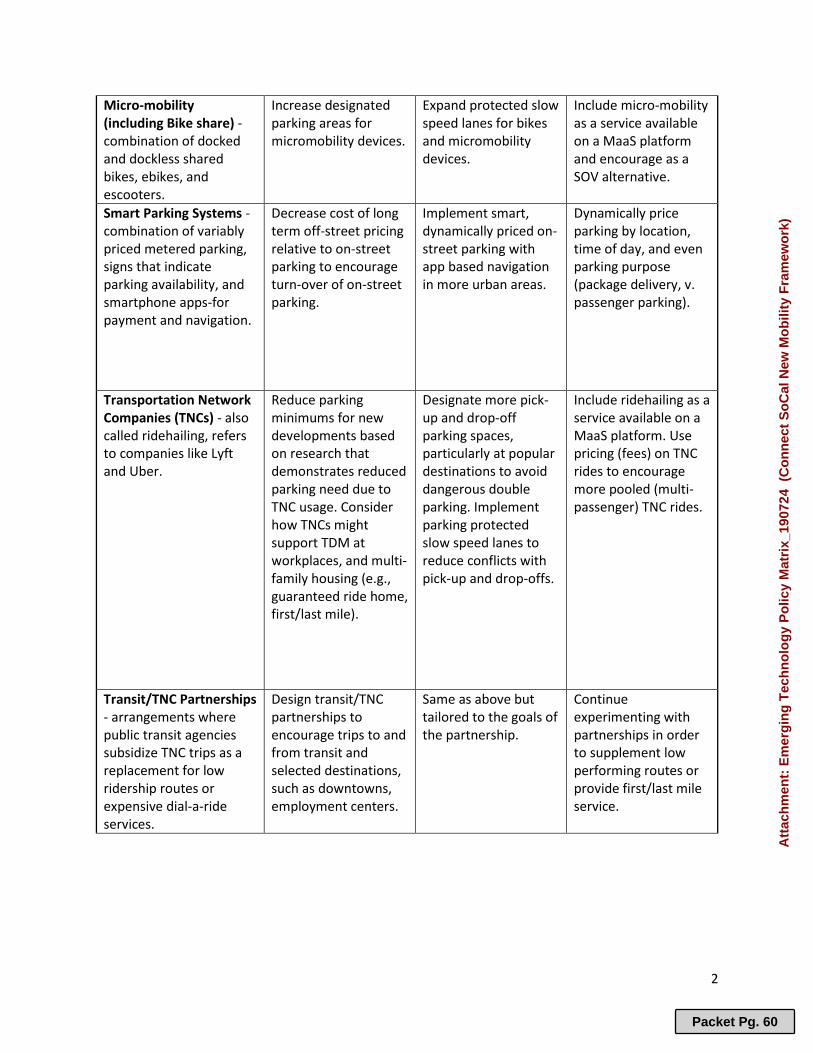
2
Micro-mobility (including Bike share) - combination of docked and dockless shared bikes, ebikes, and escooters.
Increase designated parking areas for micromobility devices.
Expand protected slow speed lanes for bikes and micromobility devices.
Include micro-mobility as a service available on a MaaS platform and encourage as a SOV alternative.
Smart Parking Systems - combination of variably priced metered parking, signs that indicate parking availability, and smartphone apps-for payment and navigation.
Decrease cost of long term off-street pricing relative to on-street parking to encourage turn-over of on-street parking.
Implement smart, dynamically priced on-street parking with app based navigation in more urban areas.
Dynamically price parking by location, time of day, and even parking purpose (package delivery, v. passenger parking).
Transportation Network Companies (TNCs) - also called ridehailing, refers to companies like Lyft and Uber.
Reduce parking minimums for new developments based on research that demonstrates reduced parking need due to TNC usage. Consider how TNCs might support TDM at workplaces, and multi-family housing (e.g., guaranteed ride home, first/last mile).
Designate more pick-up and drop-off parking spaces, particularly at popular destinations to avoid dangerous double parking. Implement parking protected slow speed lanes to reduce conflicts with pick-up and drop-offs.
Include ridehailing as a service available on a MaaS platform. Use pricing (fees) on TNC rides to encourage more pooled (multi-passenger) TNC rides.
Transit/TNC Partnerships - arrangements where public transit agencies subsidize TNC trips as a replacement for low ridership routes or expensive dial-a-ride services.
Design transit/TNC partnerships to encourage trips to and from transit and selected destinations, such as downtowns, employment centers.
Same as above but tailored to the goals of the partnership.
Continue experimenting with partnerships in order to supplement low performing routes or provide first/last mile service.
Packet Pg. 60
Att
ach
men
t: E
mer
gin
g T
ech
no
log
y P
olic
y M
atri
x_19
0724
(C
on
nec
t S
oC
al N
ew M
ob
ility
Fra
mew
ork
)
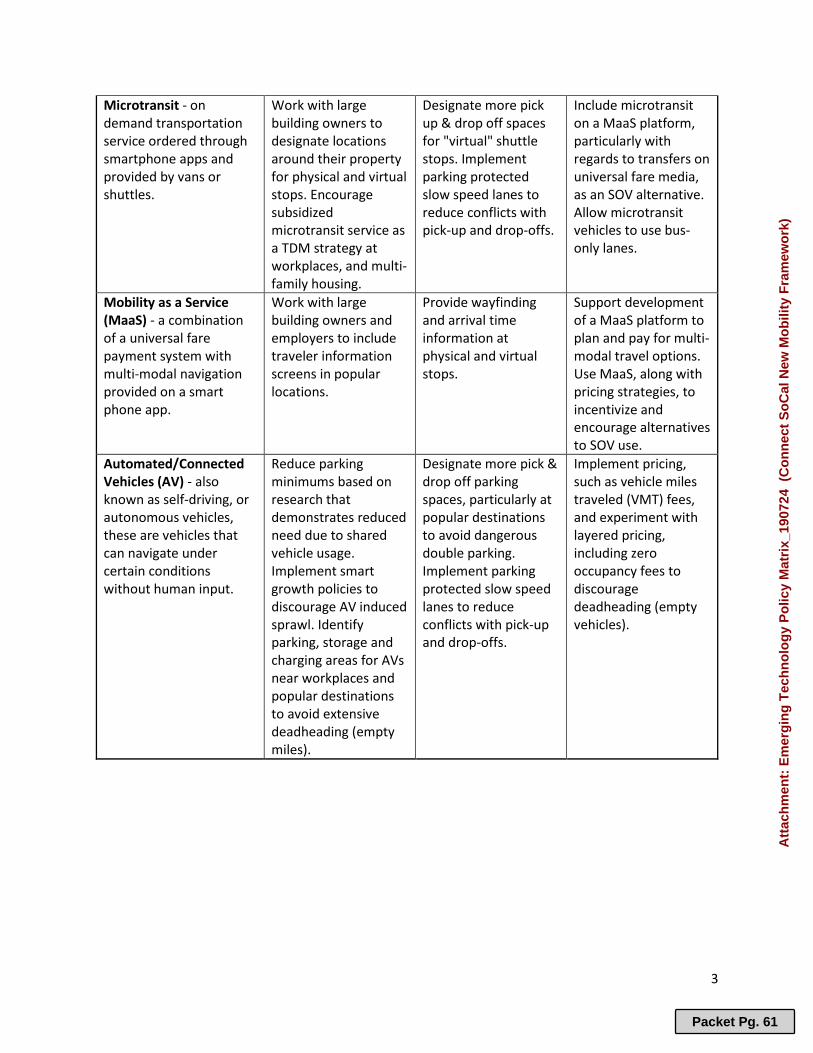
3
Microtransit - on demand transportation service ordered through smartphone apps and provided by vans or shuttles.
Work with large building owners to designate locations around their property for physical and virtual stops. Encourage subsidized microtransit service as a TDM strategy at workplaces, and multi-family housing.
Designate more pick up & drop off spaces for "virtual" shuttle stops. Implement parking protected slow speed lanes to reduce conflicts with pick-up and drop-offs.
Include microtransit on a MaaS platform, particularly with regards to transfers on universal fare media, as an SOV alternative. Allow microtransit vehicles to use bus-only lanes.
Mobility as a Service (MaaS) - a combination of a universal fare payment system with multi-modal navigation provided on a smart phone app.
Work with large building owners and employers to include traveler information screens in popular locations.
Provide wayfinding and arrival time information at physical and virtual stops.
Support development of a MaaS platform to plan and pay for multi-modal travel options. Use MaaS, along with pricing strategies, to incentivize and encourage alternatives to SOV use.
Automated/Connected Vehicles (AV) - also known as self-driving, or autonomous vehicles, these are vehicles that can navigate under certain conditions without human input.
Reduce parking minimums based on research that demonstrates reduced need due to shared vehicle usage. Implement smart growth policies to discourage AV induced sprawl. Identify parking, storage and charging areas for AVs near workplaces and popular destinations to avoid extensive deadheading (empty miles).
Designate more pick & drop off parking spaces, particularly at popular destinations to avoid dangerous double parking. Implement parking protected slow speed lanes to reduce conflicts with pick-up and drop-offs.
Implement pricing, such as vehicle miles traveled (VMT) fees, and experiment with layered pricing, including zero occupancy fees to discourage deadheading (empty vehicles).
Packet Pg. 61
Att
ach
men
t: E
mer
gin
g T
ech
no
log
y P
olic
y M
atri
x_19
0724
(C
on
nec
t S
oC
al N
ew M
ob
ility
Fra
mew
ork
)
Emerging TechnologyRegional Implications of the New Tomorrow
Marco Anderson
Program Manager, Sustainability Department
August 1st, 2019
1. Technical Approach2. Policy Approach3. Implementation
Agenda
2
Packet Pg. 62
Att
ach
men
t: P
ow
erP
oin
t P
rese
nta
tio
n -
Co
nn
ect
So
cal-
Em
erg
ing
_Tec
h_R
epo
rt (
Co
nn
ect
So
Cal
New
Mo
bili
ty F
ram
ewo
rk)
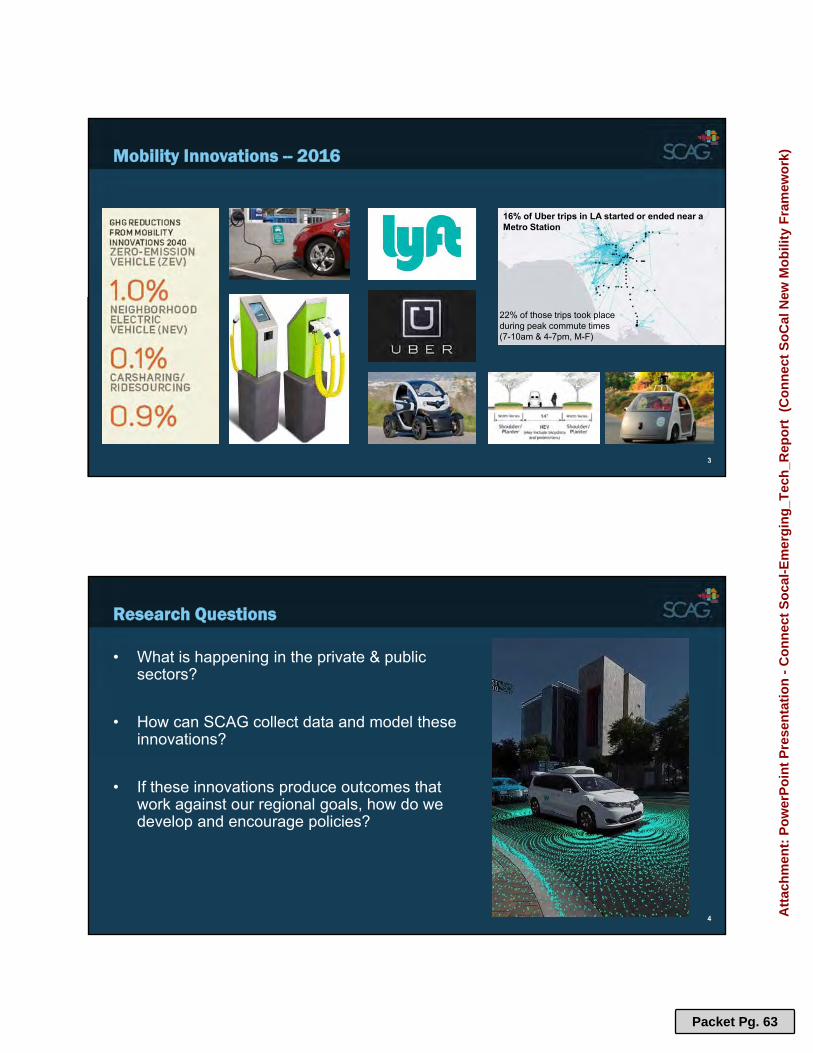
Mobility Innovations -- 2016
16% of Uber trips in LA started or ended near a Metro Station
22% of those trips took place during peak commute times (7-10am & 4-7pm, M-F)
3
• What is happening in the private & public sectors?
• How can SCAG collect data and model these innovations?
• If these innovations produce outcomes that work against our regional goals, how do we develop and encourage policies?
Research Questions
4
Packet Pg. 63
Att
ach
men
t: P
ow
erP
oin
t P
rese
nta
tio
n -
Co
nn
ect
So
cal-
Em
erg
ing
_Tec
h_R
epo
rt (
Co
nn
ect
So
Cal
New
Mo
bili
ty F
ram
ewo
rk)
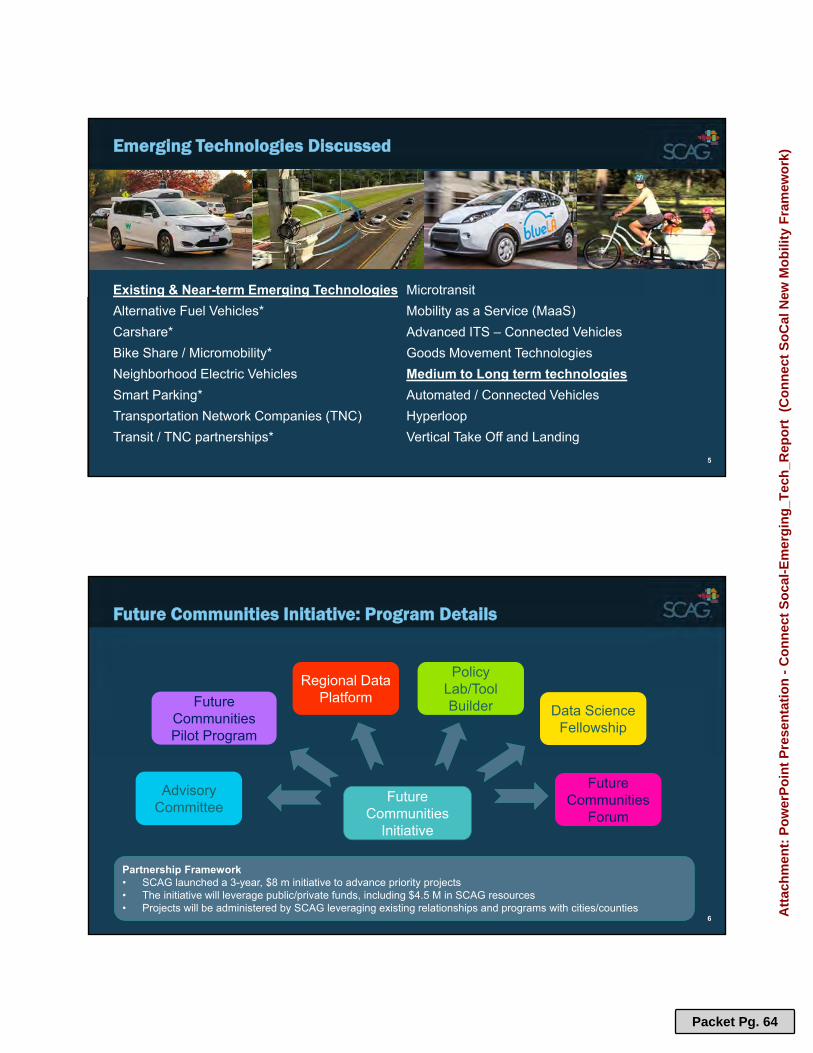
Existing & Near-term Emerging TechnologiesAlternative Fuel Vehicles*
Carshare*
Bike Share / Micromobility*
Neighborhood Electric Vehicles
Smart Parking*
Transportation Network Companies (TNC)
Transit / TNC partnerships*
Microtransit
Mobility as a Service (MaaS)
Advanced ITS – Connected Vehicles
Goods Movement Technologies
Medium to Long term technologiesAutomated / Connected Vehicles
Hyperloop
Vertical Take Off and Landing
Emerging Technologies Discussed
5
Future Communities Initiative: Program Details
Future Communities
Initiative
Data Science Fellowship
Regional Data PlatformFuture
Communities Pilot Program
Advisory Committee
Policy Lab/Tool Builder
Partnership Framework • SCAG launched a 3-year, $8 m initiative to advance priority projects• The initiative will leverage public/private funds, including $4.5 M in SCAG resources• Projects will be administered by SCAG leveraging existing relationships and programs with cities/counties
Future Communities
Forum
6
Packet Pg. 64
Att
ach
men
t: P
ow
erP
oin
t P
rese
nta
tio
n -
Co
nn
ect
So
cal-
Em
erg
ing
_Tec
h_R
epo
rt (
Co
nn
ect
So
Cal
New
Mo
bili
ty F
ram
ewo
rk)

1. Technical Approach
2. Policy Approach
3. Implementation
Agenda
7
Main Themes:
• Mobility
• Accessibility
• Public Health/Safety
• Climate Change
What Stakeholders Have Asked For
8
Packet Pg. 65
Att
ach
men
t: P
ow
erP
oin
t P
rese
nta
tio
n -
Co
nn
ect
So
cal-
Em
erg
ing
_Tec
h_R
epo
rt (
Co
nn
ect
So
Cal
New
Mo
bili
ty F
ram
ewo
rk)
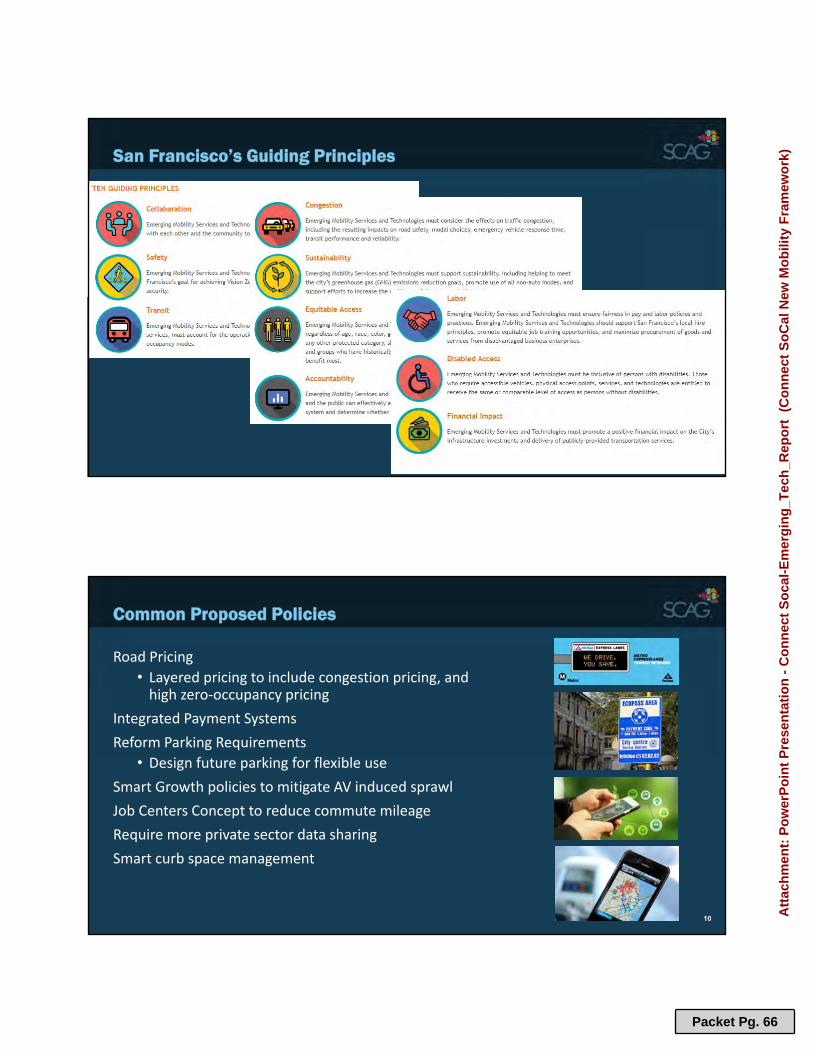
San Francisco’s Guiding Principles
9
Road Pricing• Layered pricing to include congestion pricing, and high zero‐occupancy pricing
Integrated Payment SystemsReform Parking Requirements
• Design future parking for flexible useSmart Growth policies to mitigate AV induced sprawlJob Centers Concept to reduce commute mileageRequire more private sector data sharingSmart curb space management
Common Proposed Policies
10
Packet Pg. 66
Att
ach
men
t: P
ow
erP
oin
t P
rese
nta
tio
n -
Co
nn
ect
So
cal-
Em
erg
ing
_Tec
h_R
epo
rt (
Co
nn
ect
So
Cal
New
Mo
bili
ty F
ram
ewo
rk)
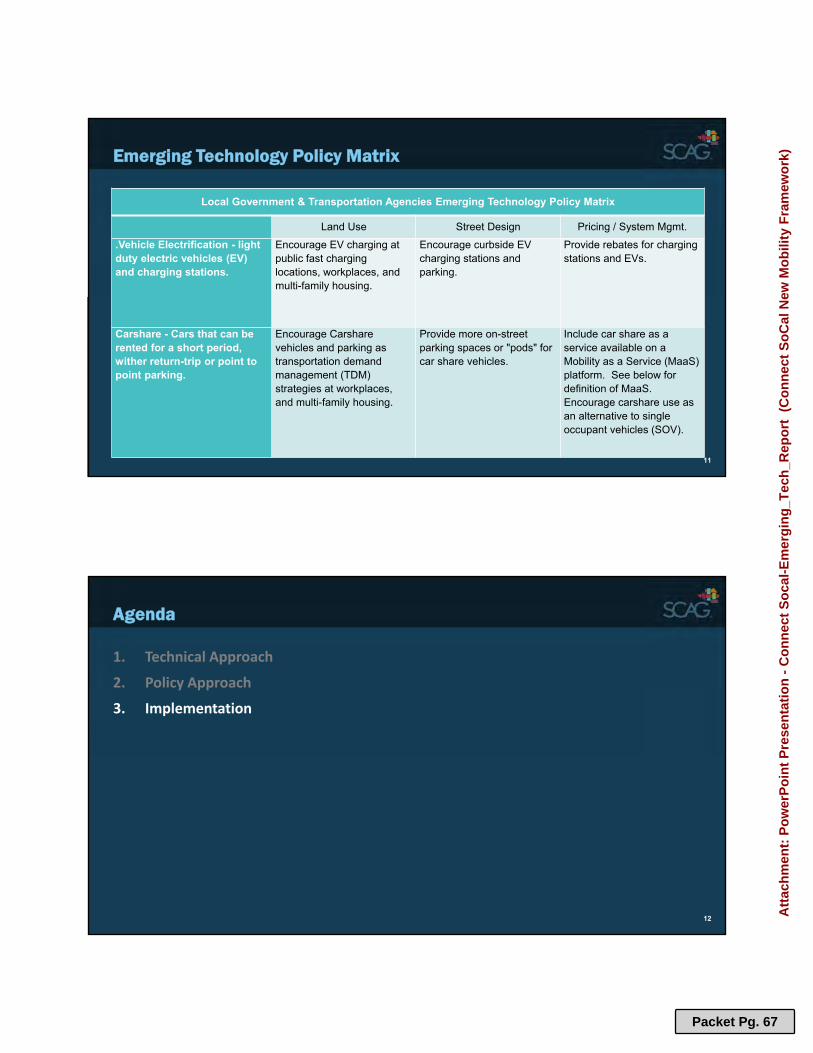
Emerging Technology Policy Matrix
Local Government & Transportation Agencies Emerging Technology Policy Matrix
Land Use Street Design Pricing / System Mgmt.
.Vehicle Electrification - light duty electric vehicles (EV) and charging stations.
Encourage EV charging at public fast charging locations, workplaces, and multi-family housing.
Encourage curbside EV charging stations and parking.
Provide rebates for charging stations and EVs.
Carshare - Cars that can be rented for a short period, wither return-trip or point to point parking.
Encourage Carshare vehicles and parking as transportation demand management (TDM) strategies at workplaces, and multi-family housing.
Provide more on-street parking spaces or "pods" for car share vehicles.
Include car share as a service available on a Mobility as a Service (MaaS) platform. See below for definition of MaaS. Encourage carshare use as an alternative to single occupant vehicles (SOV).
11
1. Technical Approach
2. Policy Approach
3. Implementation
Agenda
12
Packet Pg. 67
Att
ach
men
t: P
ow
erP
oin
t P
rese
nta
tio
n -
Co
nn
ect
So
cal-
Em
erg
ing
_Tec
h_R
epo
rt (
Co
nn
ect
So
Cal
New
Mo
bili
ty F
ram
ewo
rk)

Land-Use
Street Design
Pricing and System Management
Policy Integration
13
Neighborhood Mobility Areas
Identified TAZ’s with1. High number of Intersections2. Low observed travel speeds3. High mix of uses4. High accessibility to “everyday”
destinations
Land-Use & Sustainability
14
Packet Pg. 68
Att
ach
men
t: P
ow
erP
oin
t P
rese
nta
tio
n -
Co
nn
ect
So
cal-
Em
erg
ing
_Tec
h_R
epo
rt (
Co
nn
ect
So
Cal
New
Mo
bili
ty F
ram
ewo
rk)

Neighborhood Mobility Areas
Employ Complete Streets strategies:
• Bike lanes, roundabouts, wider sidewalks & better lighting,
• Connected network of low‐speed lanes
• Neighborhood design
Shift short trips to Non‐SOV modes.
Land-Use and New Mobility
15
Street Design & New Mobility
16
Packet Pg. 69
Att
ach
men
t: P
ow
erP
oin
t P
rese
nta
tio
n -
Co
nn
ect
So
cal-
Em
erg
ing
_Tec
h_R
epo
rt (
Co
nn
ect
So
Cal
New
Mo
bili
ty F
ram
ewo
rk)

Street Design & New Mobility
17
System Management & Sustainability
Regional Express Lane Network Pricing Strategies
18
Packet Pg. 70
Att
ach
men
t: P
ow
erP
oin
t P
rese
nta
tio
n -
Co
nn
ect
So
cal-
Em
erg
ing
_Tec
h_R
epo
rt (
Co
nn
ect
So
Cal
New
Mo
bili
ty F
ram
ewo
rk)

System Management & New Mobility
Curbside Management
19
Research Products:• Off‐Model Calculators for
Carshare, BikeShare, Microtransit etc.
• Modeling approach for automated vehicles
• Currently conducting travel surveys of ridehailing users
4 MPO Future Mobility Research Program
20
Packet Pg. 71
Att
ach
men
t: P
ow
erP
oin
t P
rese
nta
tio
n -
Co
nn
ect
So
cal-
Em
erg
ing
_Tec
h_R
epo
rt (
Co
nn
ect
So
Cal
New
Mo
bili
ty F
ram
ewo
rk)
Thank You
Marco Anderson
Sustainability
Packet Pg. 72
Att
ach
men
t: P
ow
erP
oin
t P
rese
nta
tio
n -
Co
nn
ect
So
cal-
Em
erg
ing
_Tec
h_R
epo
rt (
Co
nn
ect
So
Cal
New
Mo
bili
ty F
ram
ewo
rk)