Embed Size (px)
Citation preview

Transportation Development Plan Deliverable 1
Rossford Existing Conditions Report
Submitted to:
Edward J. Ciecka, City Administrator
City of Rossford, Ohio
133 Osborn Street
Rossford, Ohio 43460
May 25, 2012
Clear View Strategies
158 48th Street
Pittsburgh, PA 15201
Phone: 412-683-3635
Fax: 412-325-8686
m
CITY OF ROSSFORD, OHIO

Existing Conditions Report 1 Rossford TDP
Table of Contents 1.0 INTRODUCTION ..................................................................................................................................... 2
2.0 EXISTING TRANSPORTATION SERVICES ................................................................................................ 3
2.1 Kick-Off Meeting ................................................................................................................................ 3
2.2 Transit Funding .................................................................................................................................. 4
2.3 Inventory of Current Transit Services ................................................................................................ 4
2.4 Community Demographics ................................................................................................................ 8
2.5 Preliminary Key Destinations ........................................................................................................... 10
2.6 TARTA Data Collection ..................................................................................................................... 12
3.0 ASSESSMENT OF CURRENT TARTA SERVICE ....................................................................................... 22
4.0 OBSERVATIONS & FINDINGS ............................................................................................................... 29

Existing Conditions Report 2 Rossford TDP
1.0 INTRODUCTION
Under Ohio Revised Code Section 306.49, a tax is levied on local property owners to provide funding to the Toledo Area Regional Transit Authority (TARTA) to operate transit services in participating Toledo area communities. Nine communities, seven in Lucas County and two in Wood County including the City of Rossford, are assessed a 2.5 mil tax on properties based on a majority vote of constituents within TARTA’s service area boundaries. Under the Code, an individual community may vote to reject the property tax that supports TARTA, however if a majority of affirmative votes are received from the participating communities, the tax measure is approved. In 2010, the TARTA levy was defeated 57% to 43% in Rossford. But because the combined total of votes from the nine participating communities resulted in a majority, the tax levy was adopted.
The City of Rossford’s administration and council have not been certain that their community is receiving an appropriate return on the $300,000 plus tax levy that is imposed by the transit district operated by TARTA. As a result, the City decided to hire a consultant to conduct a Transportation Development Plan (TDP) to assess the current transit services received from TARTA, make recommendations to improve the efficiency of current services, and determine alternative service structures that might better meet the City’s needs. Because the City has been granted an opportunity by state legislation to opt out of TARTA by November 5, 2013, Rossford’s mayor and council are seeking information about current and potential transit services to inform residents about the most efficient, cost effective and user-friendly ways to provide public transit services in their community.
$302,180.53
$305,454.71
$286,859.61
$275,000.00
$280,000.00
$285,000.00
$290,000.00
$295,000.00
$300,000.00
$305,000.00
$310,000.00
2010 pay 2011 2009 pay 2010 2008 pay 2009
City of Rossford Tax Levy

Existing Conditions Report 3 Rossford TDP
Clear View Strategies, a public transportation consulting firm, was hired by the City of Rossford to conduct the TDP and associated assessments. The first phase of Clear View’s work plan is to obtain data, review and assess TARTA’s current transit services in Rossford and present findings. The ensuing report offers a comprehensive assessment of existing conditions and provides observations emerging from the examination of transit services throughout the City of Rossford.
2.0 EXISTING TRANSPORTATION SERVICES
2.1 Kick-Off Meeting A project kick-off meeting was held at the Rossford City offices on March 21, 2012 to discuss the scope of work, project goals and stakeholder/public involvement. Attendees included: Neil A. MacKinnon III, Mayor Edward J. Ciecka, City Administrator Larry Oberdorf, Sr., Councilman Robert Ruse, Councilman Laurie Andrews, Clear View Strategies, LLC Lynn Colosi, Clear View Strategies, LLC Lynda Conway, Clear View Strategies, LLC At the onset of the meeting, John Appt from Rossford’s School District asked Clear View about the possibility of Rossford School District being added onto Rossford’s agreement with Clear View to evaluate transportation services. Clear View followed up with Mr. Appt.
After introductions, Clear View provided an overview of the Rossford Transportation Development Plan Scope of Work, obtained clarifications ad discussed the project time line. Key points in this discussion included the availability of data from TARTA and the willingness of TARTA to provide the data, the impact of not obtaining sufficient data for the analysis and options for gathering public input to the process. The City of Rossford provided their goals and objectives for the study and for future transit services as follows:
Obtain all information that allows the City of Rossford to do the best for the citizens of Rossford.
Obtain real ridership numbers - who rides and where they ride.
Identify whether current TARTA service for Rossford equals the tax monies ($302,000) paid to TARTA.
Future service recommendations can be equal to or less than $302,000.
Existing Conditions Report 4 Rossford TDP
2.2 Transit Funding Transit agencies are funded through a variety of public sources at the local, State and Federal levels. Public funding supports both capital investments and operating expenses. In general there are two types of Federal funding - formula and discretionary. Formula funding is allocated to transit agencies and is based on population, population density and level of service. Discretionary funding typically involves an “application” process and is competitive. In FY 2011, TARTA was awarded $2,441,553 in Federal funding, just under4% of all Federal money allocated to the State of Ohio. The Ohio Department of Transportation (ODOT) allocates funding to public transportation from the State’s general fund. In 2012, TARTA was allocated $682,057 under ODOT’s Urban Transit Program. TARTA also receives local funding through a property tax levy on the “member” communities which in addition to Rossford includes the City of Toledo, Sylvania, Sylvania Township, Perrysburg, Ottawa Hills, Maumee, Spencer Township, and Waterville. The City of Rossford is a member of a transit district and, as such, is subject to 2.5 mil ($302,000) property tax for public transit services operated by TARTA. This money is collected by TARTA. There is no “formula” for how the local funding is spent according to TARTA officials i.e.; TARTA is not obligated to provide transit service to a community commensurate with the amount of property tax revenue that is generated by that community.
2.3 Inventory of Current Transit Services Currently, all public transportation within the City of Rossford is provided by TARTA. TARTA provides three types of service; fixed route, call-a-ride demand response and paratransit demand response compliant with the Americans with Disabilities Amendment Act (ADAAA). A more detailed description of each type of service is provided on the following pages.
Fixed Route TARTA offers fixed route service on one route that operates Monday through Friday and provides a total of five trips during morning and afternoon periods.
10L – Rossford – between Rossford and downtown Toledo o Two AM trips provide reverse commute service leaving Toledo at 6:30 a.m.
and 7:20 a.m. arriving in Rossford at Lime City and Schreier at 6:45 a.m. and 7:35 a.m. respectively. The trip that arrives in Rossford at 6:45 a.m. continues to Perrysburg where it becomes the 10A Perrysburg Express traveling from Perrysburg arriving in downtown Toledo at 7:15 a.m., a trip that can be used

Existing Conditions Report 5 Rossford TDP
by Rossford residents commuting to downtown Toledo during morning rush hours.
o Two afternoon reverse commute trips leave Rossford at Lime City and Schreier at 3:38 p.m. and 4:17 p.m. arriving in Toledo at 4:00 p.m. and 4:39 p.m. respectively.
o One afternoon commute trip leaves Toledo at 4:00 p.m. and arrives in Rossford at Lime City and Schreier at 4:17 p.m. This trip continues and becomes the 4:17 afternoon trip mentioned in the previous bullet.
There is no fixed route service to or from Rossford on Saturdays, Sundays or Holidays. The map below depicts the fixed route that TARTA operates in Rossford:
The cost of a one way ride on the fixed route service is $1.00 with several options for multi-ride discounts including tokens, weekly and monthly passes. TARTA also offers fare discounts to senior citizens, persons with disabilities and children under the age of six who ride free (limit 2) when traveling with an adult.
Lime City & Schreier
Superior and Glenwood
Park Station
Downtown
Toledo
10L Rossford

Existing Conditions Report 6 Rossford TDP
Call-A-Ride/Demand Response Service The map below depicts Route 10 Rossford Call-A-Ride and its three designated time points:
TARTA provides demand response service throughout the City of Rossford on Route 10 Rossford Call-A-Ride. This service is available Monday through Friday 6:00 a.m. and to 10:30 p.m., Saturday from 7:00 a.m. to 10:00 p.m., Sunday from 7:30 a.m. to 8:00 p.m. and on Holidays between 7:30 a.m. and 3:00 p.m. The TARTA Call-A-Ride service operates on a schedule to the extent that the bus arrives at designated stops on a prescribed schedule; however customers can call and be picked up and dropped off anywhere in Rossford, plus they can ride to a few destinations in Perrysburg and the Downtown Toledo TARTA Loop. The Perrysburg destinations include Kroger’s and, by request, Three Meadows and Country Charm.
Miller and Oakmead
Superior and Glenwood
10 Rossford Call-A-Ride
Park Station or Jackson
Line Up (Jackson Street
between Erie & Summit)
Downtown
Toledo

Existing Conditions Report 7 Rossford TDP
Passengers can request a connection to Perrysburg Call-A-Ride Route 9 at Three Meadows and Country Charm Shoppes.
The cost of a one-way ride on the Call-A-Ride service is $1.00 with several options for multi-ride discounts including tokens, weekly and monthly passes. TARTA also offers fare discounts to senior citizens, persons with disabilities and children under the age of six who ride free (limit 2) when traveling with an adult.
Paratransit Service Paratransit is a flexible transportation service that does not follow a fixed route or schedule.
It is a shared ride, door-to-door service.
In accordance with Americans with Disabilities Acts as amended (ADAAA) and the Code of Federal Regulations (49 CFR 37) TARTA provides complementary paratransit service. The service operates at similar times and in similar areas (a minimum of ¾ of miles) of TARTA’s fixed route service. This service is called TARPS (Toledo Area Regional Paratransit Service) and is available to individuals who are certified as ADAAA paratransit eligible. TARPS has a formal certification process to determine paratransit eligibility. The certification process determines eligibility based on the individual’s functional abilities as it relates to being able to independently use TARTA’s transit routes. All trips must be reserved in advance. Eligible clients may reserve a trip from 1 to 7 days in advance and must be cancelled no later than 2 hours prior to the scheduled pick up time. Because this is a shared ride service, TARPS allows for a 30 minute pick-up time window (15 minutes before and 15 minutes after the requested pick-up time). TARPS uses an automated telephone calling system that calls riders the evening prior to a scheduled trip as well as an alert call just before the vehicle is expected to arrive at their pick-up location. The service hours and days of operation are the same as TARTA’s fixed route service. According to TARTA’s ADA/TARPS Rider Guide, the service is provided to areas located within ¾ of a mile of a TARTA route. TARTA advised that in practice, they operate TARPS anywhere within their service area. Currently, TARPS operates 365 days per year as follows:
Monday-Friday – 5:00 a.m. until 11:30 p.m.
Saturday – 5:45 a.m. until 11:15 p.m.
Sunday – 7:00 a.m. until 9:00 p.m.
Holidays – 7:00 a.m. until 3:45 p.m.
TARPS service operates later for Mud Hens and Walleye home games

Existing Conditions Report 8 Rossford TDP
The fare for an ADAAA eligible paratransit trip is $2.00 (twice the fixed route fare) per ride. TARTA also offers non-ADAAA paratransit trips at a $4.00 premium fare.
2.4 Community Demographics Typically, transit usage is driven by several demographic and socio-economic factors such as population, age distribution, income, education and vehicle availability. Recent data on the mode of transportation used for work trips reflects that Rossford residents are not using public transportation to commute to work. As shown in the following table, nearly 96% of work trips originating in Rossford are made by car, truck or van while only one half of one percent are on transit. By comparison, nearly 2% of work trips in the State of Ohio and 4.4% nationwide are made on public transportation.
Mode of Transportation to Work
(Source: CLRsearch.com) Rossford
Wood County
Ohio USA
Percent of Work Trips by Car, Van, Truck
95.9% 92.1% 91.4% 87.3%
Percent of Work Trips by Public Transportation
0.5% 0.4% 1.9% 4.4%
Percent of Work Trips by Other Modes
1.6% 4.6% 3.1% 4.0%
Percent of Workers who Work at Home
2.0% 2.9% 3.7% 4.2%
A review of the 2010 census data indicates that Rossford has experienced a slight decline in population. According to census data, Rossford population decreased 1.8% from 2000 to 2010. For two segments of the population that tend to be transit users – senior citizens and young people under 18, the composition of Rossford population is similar to the County, State and national percentages.
Population (Source: 2010 Census Data)
Rossford Wood County
Ohio USA
Population change from 2000 to 2010 -1.8% +3.7% +1.6% +9.7%
Percent of population > 65 13.3% 12.3% 14.1% 13.0%
Percent of population < 18 23.6% 21.7% 23.7% 24.0%
As shown in the table below, the median income in Rossford exceeds the County, State and national levels although the median home value is less when compared to the County and slighter higher than the State. The percentage of the population in Rossford that is below the

Existing Conditions Report 9 Rossford TDP
poverty level is 5.9%, two times lower than the percentage of the population below the poverty level in Wood County and even slightly lower than that for both Ohio and the U.S.
Income
(Source: 2010 Census Data) Rossford
Wood County
Ohio USA
Median Household Income $59,803 $53,298 $47,358 $51,914
Median Value of Owner Occupied Home
$136,500 $154,600 $136,400 $188,400
Percent of Persons Below Poverty 5.9% 12.2% 14.2% 13.8%
On education, over 94% of Rossford residents have a high school degree which exceeds the County, State and national percentages by 2, 7 and 9 percentage points respectively. The 27.4 percent of residents with a Bachelor’s degree or higher in Rossford is 2 percent less than the level for the County, 3 percent less than the level for the State of Ohio and slightly less than the national percentage.
Education
(Source: 2010 Census Data) Rossford
Wood County
Ohio USA
Percent of population High School Graduates
93.9% 92.2% 87.4% 85.0%
Percent of population with Bachelor's Degree or higher
27.4% 29.3% 24.1% 27.9%
The data in the next table shows that Rossford has fewer households with no vehicle than the State of Ohio and the nation. By contrast, there are a greater percentage of households that own 2 vehicles in Rossford as compared to the County, State or country.
Vehicle Ownership
(Source: CLRsearch.com) Rossford
Wood County
Ohio USA
Percent of Households with Zero Vehicles
3.8% 3.5% 6.8% 8.5%
Percent of Households with One Vehicle
30.8% 29.2% 31.4% 32.7%
Percent of Households with Two Vehicles
45.3% 41.7% 39.4% 38.4%
Percent of Households with Three Vehicles
16.6% 18.6% 16.4% 15.0%
Percent of Households with Four+ Vehicles
3.6% 7.1% 6.0% 5.4%

Existing Conditions Report 10 Rossford TDP
The following chart provides a summary of disability statistics for the state of Ohio:
Attempts were made to obtain disability data for Rossford and Wood County however the attempts were not successful. Data for the State shows that 15% of the people in Ohio have a disability and 8% have a mobility type of disability. If this data is representative of that in the City of Rossford, it suggests that there is a need for paratransit services in Rossford.
Rossford’s population trends and composition coupled with key socio-economic indicators that drive transit ridership like income, vehicle availability and education do not imply a great need for public transit. The community in general is more affluent and educated than the surrounding County, the State and the nation and they have greater access to a vehicle for personal travel needs.
2.5 Preliminary Key Destinations From discussions with stakeholders, field visits to the City of Rossford and a review of Route 10 sample data, a list of key destinations in Rossford was identified. Also, a 12-question survey about transit was distributed and completed by a segment of Rossford’s residents; the key destination list will be modified based on the survey results most notably additional destinations identified by Rossford’s residents. The City of Rossford is located less than five miles from Toledo and borders the City of Perrysburg. The City has been described as a “barbell” with activity centers on either end of a nearly 7 mile stretch.) Rossford is located more than 19 miles from the County seat in Bowling Green, Ohio.
Disability Data for Ohio (Source: 2009 American Community Survey)
Number of people ages 5+ with disabilities and disability rate by type of disability in Ohio
Number of people Percent of population
Total 10,807,000 100%
Any type of disability* 1,623,000 15%
Hearing 427,000 4%
Vision 268,000 3%
Cognitive 670,000 6%
Mobility 894,000 8%
Daily activity limitation† 718,000 7%
Self-care activities 367,000 3%
Routine activities 653,000 6%
No reported disability 9,184,000 85%

Existing Conditions Report 11 Rossford TDP
It appears from the information received the majority of key destinations are located in Rossford
but also in the City of Perrysburg. There are a few in Toledo, Maumee and Bowling Green and one
in Perrysburg Township.

Existing Conditions Report 12 Rossford TDP
The following charts and maps identify key destinations for both residents of Rossford and others traveling to Rossford for business or entertainment.
2.6 TARTA Data Collection Clear View submitted a data request to TARTA for information that is critical to assessing the current transit service being provided to Rossford. The information request included ridership for all three types of service along with hours and/or miles of service. For the demand response service, specific information was requested regarding where riders travel to and from

Existing Conditions Report 13 Rossford TDP
and also any survey data TARTA might have that would provide insight into current ridership patterns and demand.
TARTA’s fareboxes are old and have limited functionality, which requires the agency to conduct sampling on a regular basis in order to gauge ridership and estimate missing and combined information. (TARTA advised Clear View that they are in the process of purchasing new fareboxes which will provide them with more accurate and detailed ridership statistics.) As such, the ridership data provided by TARTA is able to be utilized for this study but should be considered estimates. The following is a summary of the information that TARTA provided.
TARTA provided monthly ridership data for the fixed route service (including the Mud Hens shuttle) for the past three calendar years along with the hours of service by day of week. While on site, the Clear View also rode the morning trips on route 10L.
TARTA provided the Call-A-Ride information for the first two weeks of March 2012 in the form of the driver data sheets. These sheets show the trip date, boarding location and time, de-boarding location and time and the number of passengers per trip. The information was entered into an Excel spreadsheet so it could be sorted and tabulated easily.
TARTA also provided an Excel spreadsheet that included all TARPS trips with an origin or destination in Rossford for the month of March 2012. This data provides details on each TARPS trip including boarding location, trip purpose and client identification number.
The data shows that the distribution of Rossford ridership (not including TARPS) is 57% on Call-A-Ride, 41% fixed route and 2% on Mud Hens Shuttle.

Existing Conditions Report 14 Rossford TDP
The monthly ridership data for calendar year 2011 is relatively constant for the Mud Hens Shuttle and the 10L is fairly steady by month with typical seasonal peaks in the spring and fall and low points during the summer months. Route 10 Call-A-Ride shows an increase in ridership beginning in February with the highest period in August.
Calendar year ridership from 2009 to 2011 indicates an increase in Route 10, a slight increase in Route 10L and a decrease in Mud Hens Shuttle passengers.
57%
41%
2%
Rossford TARTA Ridership by Route January 2009 - December 2011
Route 10 Route 10L Mud Hens
0
500
1000
1500
2000
2500
3000
3500
4000
4500
Jan Feb Mar Apr May Jun Jul Aug Sep Oct Nov Dec
2011 Rossford Ridership
10 10L Mud Hens

Existing Conditions Report 15 Rossford TDP
The average monthly ridership for calendar year 2011 was 3,392 for route 10 Rossford Call-A-Ride and 2,042 for route 10L Rossford.
Route 10L Rossford
The 10L fixed route for calendar year 2011 averaged 96 passengers per day and 19 passengers per trip. The service hours indicate that this route was designed for reverse commute providing connections in downtown Toledo during peak periods for traditional Monday through Friday work hours destined for businesses along the route south of Toledo to Superior and Glenwood, and Lime City and Schreier in Rossford. The chart below shows the average weekday and average passengers per trip.
Route 10L Passengers
Calendar Year
Average Weekday Ridership
Average Passengers
per Trip
2009 85 17
2010 95 19
2011 96 19
Ride checks and observations of this route revealed numbers slightly lower than what this data reflect, however, the checks were conducted on President’s Day.
-
10,000
20,000
30,000
40,000
50,000
2009 2010 2011
Rossford TARTA Ridership 3-year trend
Route 10 Route 10L Mud Hens

Existing Conditions Report 16 Rossford TDP
Route 10 Call-A-Ride
TARTA provided three years of monthly data for Route 10 and two weeks of daily data for March 2012, both of which are provided in the table below.
Route 10 Passengers
Calendar Year Average
Weekday Average Saturday
Average Sunday
Average Weekly
Calendar Year 2009 99 31 20
548
Calendar Year 2010 108 34 23
596
Calendar Year 2011 144 44 31
795
March, 2012 133 41 28
734
The following chart summarizes the passengers per trip.
Route 10 Average Passengers Per Trip
Calendar Year Weekday Saturday Sunday
Calendar Year 2009 4 1 1
Calendar Year 2010 5 1 1
Calendar Year 2011 6 2 1
March, 2012 6 2 1
The following information summarizes the two weeks of March data for Route 10 provided by TARTA, which consists of more extensive information. The breakdown by day of week is as follows:
Day of Week Total Rides
Average Rides
Per Day
Average Inbound
Passengers
Average Outbound Passengers
Weekday 1331 133 46 87
Saturday 81 41 19 22
Sunday 55 28 11 17

Existing Conditions Report 17 Rossford TDP
The next two graphs indicate the communities in which passengers boarded and alighted the Call-A-Ride route. Sixty percent (60%) of the passengers boarded in Toledo and fifty-two percent (52%) alighted in Rossford.
The next two graphs breakdown the boardings and alightings by day type.
60%
30%
9%
1%
Total Boardings by Community
Toledo Rossford Perrysburg Perrysburg Township
33%
52%
14%
1% 0.1%
Total Alightings by Community
Toledo Rossford Perrysburg Perrysburg Township Maumee

Existing Conditions Report 18 Rossford TDP
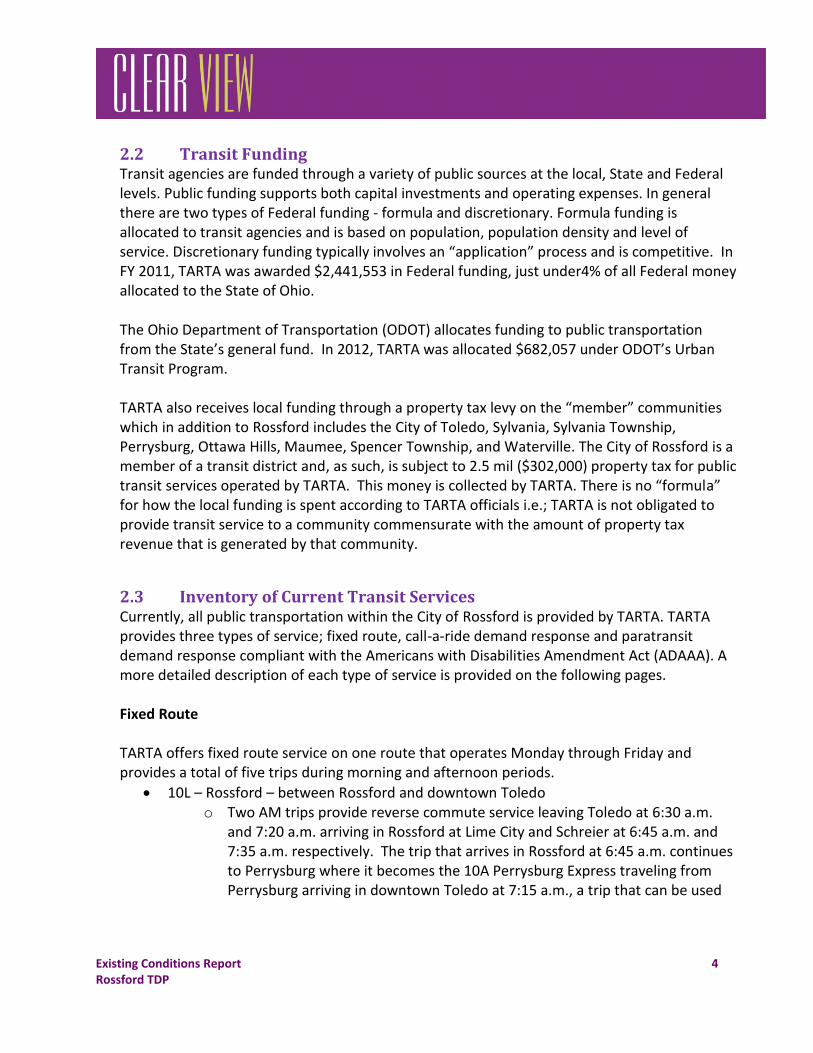
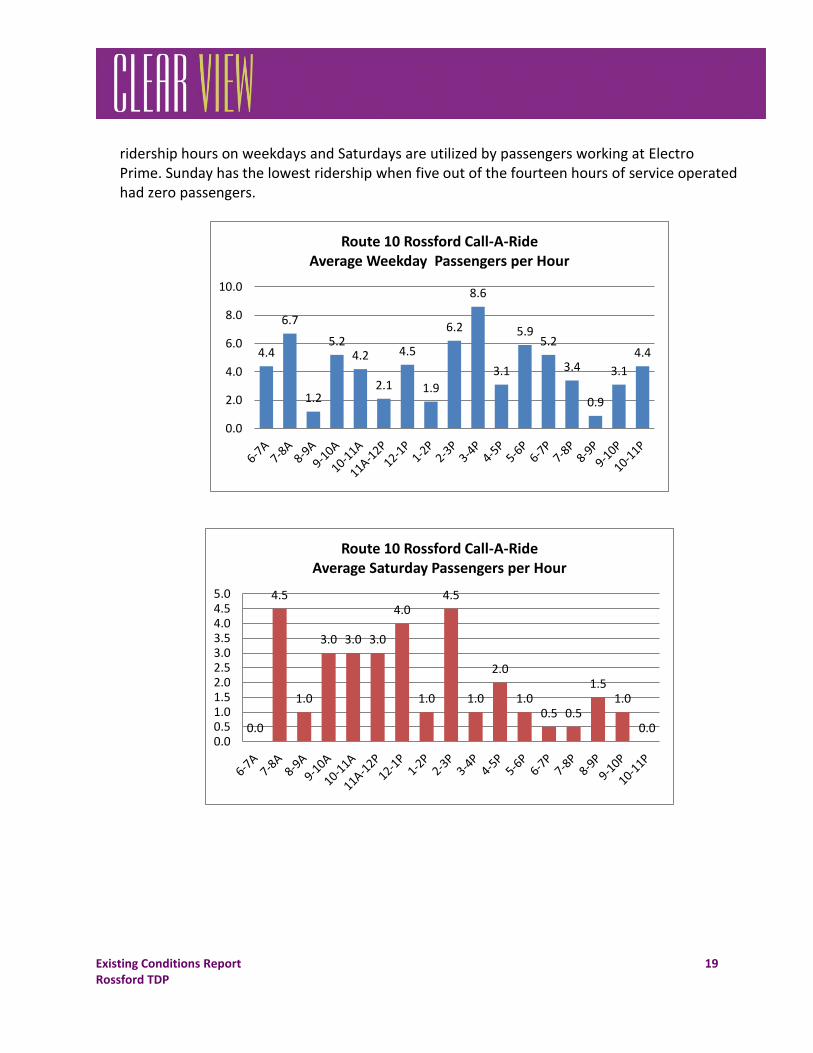
The following charts indicate the average passengers per hour derived from the March 2012 sample data. On Sunday, Route 10 has a total of eight midday trips that do not provide service to Toledo (four outbound trips end and four inbound trips begin at Superior and Glenwood). The two highest ridership periods on weekdays were 7-8 a.m. and 3-4 p.m. with an average of 7 and 9 passengers per hour respectively. On Saturday, the highest average passengers per hour were 7-8 a.m. and 2-3 p.m. both with 5 passengers. It appears that the two highest
0
20
40
60
80
100
120
Toledo Rossford Perrysburg PerrysburgTownship
Average Number of Boarding Riders by Community
Weekday Saturday Sunday
0
20
40
60
80
100
120
Toledo Rossford Perrysburg PerrysburgTownship
Maumee
Average Number of Alighting Riders by Community
Weekday Saturday Sunday
Existing Conditions Report 19 Rossford TDP
ridership hours on weekdays and Saturdays are utilized by passengers working at Electro Prime. Sunday has the lowest ridership when five out of the fourteen hours of service operated had zero passengers.
4.4
6.7
1.2
5.2 4.2
2.1
4.5
1.9
6.2
8.6
3.1
5.9 5.2
3.4
0.9
3.1
4.4
0.0
2.0
4.0
6.0
8.0
10.0
Route 10 Rossford Call-A-Ride Average Weekday Passengers per Hour
0.0
4.5
1.0
3.0 3.0 3.0
4.0
1.0
4.5
1.0
2.0
1.0 0.5 0.5
1.5 1.0
0.0 0.00.51.01.52.02.53.03.54.04.55.0
Route 10 Rossford Call-A-Ride Average Saturday Passengers per Hour

Existing Conditions Report 20 Rossford TDP
Meijer was the primary destination for passengers who boarded in Toledo on the weekend averaging five riders on Saturday and six on Sunday. The top five weekday destinations for passengers who boarded in Toledo were:
Electro Prime averaged 31,
Buck and Glenwood averaged 16,
Kroger’s averaged 6,
Hilton averaged 5, and
Meijer averaged 4 passengers.
The primary boarding locations by day type are as follows:
Top 5 Boarding Locations
Location City
Average Weekday
Passengers
Average Saturday
Passengers
Average Sunday
Passengers
Downtown Toledo Toledo 82 17 15
Buck & Glenwood Rossford 9
Electro Prime Rossford 8 2
Kroger’s Perrysburg 6 5 2
Meijer Rossford 5 5 4
Lime City & Buck Rossford 4
Superior/Dixie & Eagle Point Rossford
Lime City & Lewis Rossford 2
Lime City & Schreier Rossford 2
Hilton Perrysburg 3
Superior/Dixie & Elm Rossford 1
1.5
0.0 0.0 0.0 0.0
1.5 1.5 1.0
1.0
1.0
3.5
2.5
0.5 0.0
0.00.51.01.52.02.53.03.54.0
Route 10 Rossford Call-A-Ride Average Sunday Passengers per Hour

Existing Conditions Report 21 Rossford TDP
The primary destinations by day type are as follows:
Top 5 Destinations
Location City
Average Weekday
Passengers
Average Saturday
Passengers
Average Sunday
Passengers
Downtown Toledo Toledo 42 17 9
Electro Prime Rossford 31 2
Buck & Glenwood Rossford 19 2
Kroger’s Perrysburg 8 5
Hilton Perrysburg 5 3 2
Meijer Rossford 5 5 6
Superior/Dixie & Eagle Point Rossford 2
Lime City & Buck Rossford 2
Country Charm Perrysburg
Levis Commons Perrysburg 2 2
Superior/Dixie & Elm Rossford 2
Superior/Dixie & Rossway Rossford 2
Mud Hen Shuttle TARTA provided data for riders in Rossford who used the Toledo Mud Hen Shuttle to go the games. The table below shows the number of riders per game by month for the three most recent seasons:
Mud Hens Riders/Game 2009 2010 2011
April 11 18 2
May 17 18 12
June 20 20 11
July 12 13 19
August 26 11 19
September 20 13 10
TARPS
Rossford has 33 active TARPS riders and one subscription rider. A subscription rider is a person who travels at the same time, day(s) and destination on regular intervals. TARTA provided trip information for TARPS trips in Rossford for the month of March 2012. The data shows 28 trips

Existing Conditions Report 22 Rossford TDP
were made in March by three unique TARPS clients, one client took four trips to Toledo, another took 12 trips to the University of Toledo Health Science Campus and the third client took 12 trips to various destinations including doctor offices, Wal-Mart, Home Depot and Target. The following chart shows the number of TARPS riders that were picked up or dropped off in Rossford over the most current 12 month period:
PICK-UP DROP-OFF
Apr-11 48 47
May-11 41 42
Jun-11 28 26
Jul-11 28 29
Aug-11 30 29
Sep-11 35 35
Oct-11 49 48
Nov-11 64 59
Dec-11 51 49
Jan-12 54 51
Feb-12 34 33
Mar-12 33 32
Total 495 480
3.0 ASSESSMENT OF CURRENT TARTA SERVICE With all of the data accumulated to this point in the study, Clear View assessed the transit services that TARTA operates in the City of Rossford. There were some minor concerns about the data that TARTA provided, which are identified below; however the data was adequate and able to be used for this assessment.
All monthly ridership appears to be estimates (all end with a zero), TARTA reports ridership based on sampling.
Only 2 weeks of Call-A-Ride information was provided in the form of handwritten driver notes.
TARPS trip data did not have date or time information associated with it. TARTA provided a system average trip time of 26 minutes.
No mileage information was provided for TARPS trips. TARTA provided a system average trip length of 5.25 miles.

Existing Conditions Report 23 Rossford TDP
While the TARTA data is less than perfect for this analysis in some cases, it is fair to say that it provides a good perspective on public transit activity in the Rossford area. The data will be used in the next phases of this study to assist in determining level of demand, alternative routes and schedules, types of service and span of service. National Transit Database (NTD) information was also used in this assessment as a supplement in order to understand TARTA’s overall performance relative to service efficiency and effectiveness. This database groups TARTA’s performance measurements in two categories:
1. Fixed Route (includes Call-A-Ride) 2. Demand Response (TARPS)
Service Efficiency Operating expense per revenue vehicle mile and operating expense per revenue vehicle hour are two common measurements used to assess service efficiency. Both service categories experienced an increase in operating expense per vehicle revenue mile in 2010 as compared to 2009. Fixed route and Call-A-Ride increased 10% and TARPS increased 4%.
Comparing 2010 to 2009, operating expense per vehicle revenue hour decreased by 22% for fixed route and Call-A-Ride. TARPS increased by 22%.
$6.99 $6.55
$7.18
$3.40 $3.53 $3.67
$-
$1.00
$2.00
$3.00
$4.00
$5.00
$6.00
$7.00
$8.00
2008 2009 2010
Operating Expense per Vehicle Revenue Mile National Transit Database
Fixed Route & Call-A-Ride TARPS

Existing Conditions Report 24 Rossford TDP
TARTA advised that there was a change in the school contract and a reduction in tax levies that resulted in an overall decrease in fixed route service levels. TARTA’s NTD data relative to service consumption and service supplied is consistent with a reduction in service except for the revenue vehicle hours’ category. The following chart summarizes this data:
Service Consumption 2010 2009 % Change
Annual Passenger Miles 16,254,425 28,909,167 -44%
Annual Unlinked Trips 3,518,460 7,168,815 -51%
Average Weekday Unlinked Trips 11,697 25,003 -53%
Average Saturday Unlinked Trips 7,296 8,062 -10%
Average Sunday Unlinked Trips 4,754 6,110 -22%
Service Supplied 2010 2009 % Change
Annual Vehicle Revenue Miles 4,079,746 4,677,823 -13%
Annual Vehicle Revenue Hours 352,053 328,090 7%
Vehicles Operated in Maximum Service 155 192 -19%
Vehicles Available for Maximum Service 181 240 -25%
Base Period Requirement 46 54 -15%
Service Effectiveness Operating expense per passenger mile, operating expense per passenger, passengers per vehicle revenue mile and passengers per vehicle revenue hour are measurements of service effectiveness.
$113.12 $101.51
$79.57
$42.96 $39.03 $47.57
$-
$20.00
$40.00
$60.00
$80.00
$100.00
$120.00
2008 2009 2010
Operating Expense per Vehicle Revenue Hour National Transit Database
Fixed Route & Call-A-Ride TARPS

Existing Conditions Report 25 Rossford TDP
Comparing the last two years, expenses per passenger mile increased in both service categories. The fixed route and Call-A-Ride category had the most significant increase of 62% and TARPS increased 8%.
Operating expense per passenger increased in both service categories comparing 2010 to 2009. Fixed route and Call-A-Ride increased significantly by 81% and TARPS increased by 5%.
$0.89 $0.87
$1.41
$3.23
$2.41 $2.60
$-
$0.50
$1.00
$1.50
$2.00
$2.50
$3.00
$3.50
2008 2009 2010
Operating Expense per Passenger Mile National Transit Database
Fixed Route & Call-A-Ride TARPS
$3.66 $3.43 $6.21
$29.77
$19.50 $20.53
$-
$5.00
$10.00
$15.00
$20.00
$25.00
$30.00
$35.00
2008 2009 2010
Operating Expense per Unlinked Passenger Trip National Transit Database
Fixed Route & Call-A-Ride TARPS

Existing Conditions Report 26 Rossford TDP
Passengers per revenue mile decreased by 39% for fixed route and Call-A-Ride and remained constant for TARPS comparing 2010 to 2009.
Passengers per vehicle revenue hour decreased 57% for fixed route and Call-A-Ride and TARPS experienced a 16% increase in 2010 as compared to 2009.
1.91 1.91
1.16
0.11 0.18 0.18
0.00
0.50
1.00
1.50
2.00
2.50
2008 2009 2010
Unlinked Passenger Trips per Vehicle Revenue Mile National Transit Database
Fixed Route & Call-A-Ride TARPS
30.93 29.61
12.82
1.44 2.00 2.32
0.00
5.00
10.00
15.00
20.00
25.00
30.00
35.00
2008 2009 2010
Unlinked Passenger Trips per Vehicle Revenue Hour National Transit Database
Fixed Route & Call-A-Ride TARPS

Existing Conditions Report 27 Rossford TDP
The following chart highlights key National Transit Database statistics that compares TARTA to four other transit agencies in Ohio. Many considerations must be taken into account when comparing transit agencies because each agency has unique populations, demographics and operations. The chart indicates that TARTA’s data is consistent considering the agencies’ size and operation.

Existing Conditions Report 28 Rossford TDP
Service Hours TARTA provides Rossford with 37.8 hours of service each weekday, 33.3 hours of service on Saturdays, 27.2 hours of service on Sundays and 16.6 hours of service on holidays. Fixed route hours constitute 4 percent of the service that TARTA offers in Rossford each week. Call-A-Ride makes up of 46.3 percent of the service provided by TARTA and TARPS accounts for the remaining 49.7 percent weekly service hours.
Service Hours
Day Fixed Route Call-A-Ride TARPS MudHen Shuttle
Weekday 2 hours 17.3 hours 18.5 hours X
Saturday X 15.8 hours 17.5 hours X
Sunday X 13.2 hours 14.0 hours X
Holiday X 7.8 hours 8.8 hours X
Game Days X X X 2 hours (estimate)
Fares TARTA charges $1.00 per ride for fixed route and Call-A-Ride and $2.00 for a TARPS’ trip ($4.00 for premium TARPS’ fare.) This is an economical price for riders relative to other transit agencies’ fares. As with most public transit agencies however, fares collected do not offset operating costs. The following chart shows the adult and senior fares per trip for fixed route, Call-A-Ride and Game Shuttle.
Adult Senior
Fixed Route $1.00 .50¢
Call-A-Ride $1.00 .50¢
Game Shuttle $1.00 $1.00
TARPS fares are $2.00 per trip for qualified ADAAA customers and $4.00 per trip for non-qualified. Cost According to the 2010 National Transit Database submission from TARTA, the operating cost per hour of service is $79.57. Utilizing that rate and the amount of service currently provided by TARTA, the estimated annual cost for TARTA’s Rossford service is as follows:

Existing Conditions Report 29 Rossford TDP
Service Type Annual Cost
Fixed Route $ 40,740
Call-A-Ride $475,065
Mud Hens Shuttle $11,458
Total $527,263
In the 2010 National Transit Database information for demand response service, TARTA reported a cost per passenger trip of $20.53. Using this rate and the most recent TARPS ridership data, the estimated annual costs for TARPS service for riders picked-up in Rossford is $10,162. The total annual cost of Rossford’s transit service using NTD information and data provided by TARTA, is projected at $537,425; Rossford residents contribute $302,000 annually in tax levies to TARTA for service. According to TARTA, service is not required to be commensurate with a community’s financial contribution. Customer Information TARTA advertises their transit services primarily through their website and printed timetables. TARTA’s website is easy to navigate and provides information on routes, schedules, fares and passes. In addition, the TARPS application is on-line along with its policies and procedures. The website also offers guidance on how to ride, contact information, alerts and news. In addition to searching by route, a customer can search by community to view the available services. E-mail and mobile alerts are available and TARTA uses both Facebook and Twitter. The public timetables, which are difficult to understand, include a map of the route, select time points, general fare information, instructions for waiting for a bus and route specific tips. Feedback received so far from outreach initiatives indicates that the timetables don’t provide a sufficient explanation of the Call-A-Ride service and many people do not understand how to use Call-A-Ride.
4.0 OBSERVATIONS & FINDINGS
The following is a summary of initial observations and findings:
1. Strictly from a cost perspective, Rossford is clearly receiving more transit service than the amount of their tax levy. The tax levy is $302,000 and the estimated cost of TARTA’s service is $537,425.
2. Both the demographic information and the TARTA data indicate that the demand for and
use of public transportation in Rossford is relatively low. The composition of the population of the City of Rossford is not that of a transit dependent community.

Existing Conditions Report 30 Rossford TDP
3. TARTA provides an adequate if not exceptional number of service hours in Rossford except
for fixed route hours which are limited but consistent with demand.
4. TARTA provides four different types of transit services in the community of Rossford. These types seem to be designed to meet the multiple and varying needs of the local riders.
5. Generally speaking, most of TARTA’s fixed route services are a “hub and spoke” design with downtown Toledo as the hub (or destination) and connections to other locations in and around Toledo.
6. Fixed route service in Rossford is based on moving riders, most notably workers, from Toledo to Rossford businesses. This kind of service – from the downtown hub to an outlying community - is typically referred to as reverse commute. The reverse commute design is good for Rossford businesses; however for Rossford residents who need to get to Toledo or connect to another bus in Toledo for employment, the service is not conducive or convenient.
7. Call-A-Ride as it is designed and delivered by TARTA seems to meet the challenge of providing efficient services to decentralized suburban and remote employment locations; however this type of service delivery tends to be inefficient, and unreliable and confusing to customers.
8. TARPS service as provided by TARTA goes beyond ADA requirements, provides an exceptional span of service, and is convenient for customers.
9. The Mud Hen’s Shuttle hours and days of operation are sufficient for the type of service and to meet Rossford’s needs.
10. Although TARTA offers shuttle service to Mud Hen’s and Walleye’s games, in Rossford the agency only provides service to the Mud Hen’s games. Given the data provided by TARTA it appears that the shuttle service design in Rossford is less than optimal. By combining park and ride game shuttles, TARTA might be able to add Walleye’s game service in Rossford.
11. Fixed route transit ridership in Rossford seems to follow traditional seasonal patterns i.e. lower in the summer months when customers take vacations.
12. The fixed route hours (2 hours), fixed route trips (5 a day) and days of operation (weekdays only) that TARTA provides in Rossford are limited but seem to be coincident with demand;

Existing Conditions Report 31 Rossford TDP
from a customer perspective however this service could be considered infrequent and inconvenient.
13. A significant number of people riding transit services in Rossford are not residents of Rossford which suggests that those riders are destined for employers and businesses in Rossford.
14. Rossford residents use Call-A-Ride services primarily for work, shopping and social
activities.
15. The availability and hours of service for Call-A-Ride and TARPS are excellent; however this type of service is expensive and not efficient considering the low number of passengers per trip.
16. Many users of TARPS who travel to Rossford are not Rossford residents.
17. TARTA’s fares are low and economical for customers in comparison with other transit
agencies’ fares.
18. TARTA provides typical information materials for its customers like website and public timetables; however, a cursory review of the materials shows that the information is unclear, lacking detail and difficult to understand.
19. TARTA does not submit transit data and reports to Rossford officials on a regular or
ongoing basis nor do Rossford officials request information from TARTA.
20. Overall TARTA’s National Transit Database statistics are consistent with other Ohio transit agencies.
21. In general, the data suggests that TARTA provides sufficient levels of service commensurate
with demand and usage however there may be ways to improve both the efficiency and effectiveness of those services in Rossford.