Embed Size (px)
Citation preview

Audio Options
TO USE YOUR COMPUTER'S AUDIO:
When the Webinar begins, you will be connected to audio using your computer's microphone and speakers (VOIP).
TO USE YOUR TELEPHONE:
If you prefer to use your phone, select "Use Telephone" after joining the Webinar.
Transportation Mobility Systems: An Alternative to Concurrency in Florida
1
About 1000 Friends of Florida • Founded in 1986, 1000 Friends of Florida is a 501(c)(3)
nonprofit membership organization. • We work to save special places, fight sprawl and build better
communities. • We educate, advocate and negotiate to protect Florida’s high
quality of life. • Our bipartisan board of directors includes advocates and
experts from across the state. • Visit www.1000friendsofflorida.org/join-us/?alerts to sign up
for email alerts! • Follow 1000 Friends on Facebook and Twitter!
2

Dr. John M. DeGrove
UPCOMING FREE WEBINAR
• December 11 – Florida Greenways and Trails System Planning – Approved for free AICP CM, CLE, and CEHP credits
Register Now! 1000friendsofflorida.org/communications/webinars
1924-2012

Please Support the Dr. John M. DeGrove Webinars
1000 Friends needs your support to continue this free webinar series in 2014. Costs include:
• Go-to-Webinar subscription
• AICP CM subscription
• CLE Fees
• Staff time
Please make a donation to 1000 Friends at www.1000friendsofflorida.org/donate-now/
and under “program” click “DeGrove Education Fund”

QUESTIONS?
• Your webinar control panel includes a “Questions” box.
• Please type any questions in this box.
• Please refer to the slide number and/or speaker when you post your question.
• Please keep your questions succinct!
• Staff will ask the presenters questions, as time permits.
THIS WEBINAR:
• Approved for 2 AICP CM credits for Planners (including 1.5 legal credits) - #24352
• Approved for 2.5 CLE credits with Florida Bar – #1306233N
• Approved for 2 CEHP credits
• PowerPoint is available for downloading: www.1000friendsofflorida.org.
• Register for upcoming webinars: www.1000friendsofflorida.org/communications/webinars

Presenters
6

About David Goldstein
• Chief Assistant County Attorney for Pasco County
• Florida Bar Certified in City, County and Local Government Law
• Primary drafter of Pasco County’s Mobility Fee Ordinance and Multi-Modal Tax Increment ordinance
• Lead counsel that defended the challenge to Pasco County’s timing and phasing regulations.
7

About Richard E. Gehring
• Planning and Development Administrator for Pasco County
• Founding chairman of the Suncoast Section of the Florida Chapter APA
• Received Florida Chapter APA Suncoast Section Planner of the Year Award for 2010
• Pasco County given “One Bay” award by the Tampa Bay Regional Planning Council
8

About Jeffrey Hays, AICP
• Transportation Planning Manager, Alachua County Growth Management Department
• One of authors of Alachua County Mobility Plan
• Previously employed by USGS, Hernando and Alachua Counties in a variety of environmental, land use and transportation planning roles
9

About Bill Killingsworth, AICP
• Director, Division of Community Development, Florida Department of Economic Opportunity
• Previously worked for City of Jacksonville for more than 20 years
• Served as Director of Planning and Development, Chief of Community Planning and several other planning positions
10

Transportation Mobility Systems:
A Legal Overview

2009 Legislation (SB 360)
Evaluate and consider the implementation of a mobility fee to replace the existing transportation concurrency system.
A mobility fee should provide for mobility needs, ensure that development mitigates its impacts on the transportation system, and promote compact, mixed use, and energy efficient development.
12

2009 Legislation (SB 360)
Directed DCA and FDOT to complete a mobility fee study and file a joint report, including recommended legislation
DCA and DOT issued their Joint Report to the Florida Legislature on December 1, 2009
No specific legislation implementing Joint Report; some local governments proceeded forward anyway
13

2011 Community Planning Act
Section 163.3180(5)(f), Florida Statutes
Local governments encouraged to develop “tools and techniques” to complement transportation concurrency, including:
Long-term strategies to facilitate development patterns that support multimodal solutions, including urban design, and appropriate land use mixes
Exempting or discounting impacts of locally desired development, such as development in urban areas, redevelopment, job creation, and mixed use on the transportation system.
14

2013--HB 319
New subsection (i): If a local government elects
to repeal transportation concurrency, it is
encouraged to adopt an alternative mobility funding
system that uses one or more of the tools and
techniques identified in paragraph (f). Any
alternative mobility funding system adopted
may not be used to deny, time, or phase an
application for site plan approval, plat approval,
15

2013--HB 319
final subdivision approval, building permits, or the functional equivalent of such approvals provided that the developer agrees to pay for the development's identified transportation impacts via the funding mechanism implemented by the local government.
Discretionary development approvals (rezonings, DRIs, development agreements) not included in this restriction
16

2013--HB 319
Discretionary development approvals are subject to
transportation concurrency/prop share restrictions
May not be able to deny these approvals based on
transportation impacts if applicant offers in good
faith to enter into an agreement to pay for or
construct its prop share of required improvements
Complex prop share calculation with liberal
definition of excluded existing transportation
deficiencies, some of which could be included in
impact/mobility fee assessment under dual rational
nexus test
17

2013--HB 319
A mobility fee-based funding system must
comply with the dual rational nexus test applicable
to impact fees. An alternative system that is not
mobility fee-based shall not be applied in a
manner that imposes upon new development
any responsibility for funding an existing
transportation deficiency as defined in
paragraph (h).
18

Dual Rational Nexus Test
A rational nexus between proposed
development and the need for additional
capital facilities for which the fee or exaction
is imposed (“Needs Prong”)
A rational nexus between the
improvement/expenditure of funds collected
and the benefits accruing to the development
(“Benefit Prong”)
19

Dual Rational Nexus Test
Needs Prong More Difficult Issue for Mobility
Fees
Limited to capital facilities; generally can’t assess
for O&M, and transit is O&M intensive
Difficult to “promote” or “discount” compact,
mixed use, energy efficient developments (TND
and TOD), because development should be
paying for the same need (level of service), and
fee differentials are generally only based on trip
generation
20

Dual Rational Nexus Test
Pasco dealt with the Capital vs. O&M issue
by using a different funding source for transit
operations (home rule tax increment based
on Strand case)
Pasco discounted fees for urban areas, TND
and TOD by:
Relying on California studies (Caltrans) showing
that TND and TOD generate lower vehicle miles
traveled (VMT), because more people walk, bike
or ride transit
21

Dual Rational Nexus Test
Lower level of service (more congestion) for
urban areas, assuming greater reliance on
transit; helped offset higher right of way and
construction costs in urban areas
Subsidized or “bought down” the fees for urban
areas, TND and TOD (and other favored uses)
with other non-impact fee revenue sources
22

Florida Impact Fee Act
(163.31801, Florida Statutes)
Most recent and localized data (Pasco
updates every 3 years)
Accounting/reporting/auditing requirements
Administrative charges limited to actual costs
Local government has burden of proof if fee
challenged based on dual rational nexus test
23

Advantages of Mobility Fee Systems
Over Concurrency Post-HB 319
For Mobility Fee Systems, authority to deny,
time, or phase discretionary development
approvals based on transportation impacts
still alive -- not as clear for transportation
concurrency
24

Advantages of Mobility Fee Systems
Over Concurrency Post-HB 319
Dual Rational Nexus Test is more favorable
than prop share calculation -- more revenue
Can create predictable, equitable, and easy
to calculate fee schedule -- prop share is
none of these things
More predictable revenue source for capital
planners
25

Advantages of Mobility Fee Systems
Over Concurrency Post-HB 319
Can clearly spend Mobility Fees on other
modes (transit, bicycle/pedestrian) and local
roads
Can tailor Mobility Fees to land use goals
(smart growth, economic development, etc.)
and help reduce the sprawl that
transportation concurrency contributed to
26

Advantages of Mobility Fee Systems
Over Concurrency Post-HB 319
When remove fight over dollar amount
owed, frees up staff time to focus on
planning for solutions
Mobility Fees easier to explain to public than
concurrency/prop share
27

Pasco County’s Planning and
Development Structure for
Mobility Fee and
Timing and Phasing System:

29
Pasco…. Population: 464,697
Ranks 12th largest in the State of
Florida, 7th largest in population
change
In the eight county Tampa Bay
Partnership Region (map), Pasco is
the 2nd largest jurisdiction behind
Hillsborough County and ahead of
all other communities and counties.
Winner of the Inaugural One Bay
Award for "New Smart Pasco:
Market Area Plan and Transit
Oriented Development
Amendments."
The Tampa Bay Region is a hotspot
for innovative companies in the
sciences and services. It’s the 14th
largest consumer market in the
country and offers a diverse and
talented workforce supported by the
fastest growing research
university in the country- the
University of South Florida.
Multiple seaports and airports
create a cost competitive logistics
and distribution network offering
access to the global economy.
The communities of Tampa Bay
provide a burgeoning economy and
unfound diversity, both ripe with
possibilities, that ultimately enable
residents to capitalize on the
potential richness life has to offer.
PASCO COUNTY
Position Tampa Bay
Region and the
Florida Super Region

PASCO COUNTY
500,000 Acres
500,000 Population 93% Unincorporated
2040 Population 840,000 – 920,000
Tampa Bay Greenfield Growth Area
Future Employment Expansion
One Bay Focus on Consentrated Growth
Growth Area for Super Region Evolution

Factors Motivating Pasco
48% of Pasco County workers employed outside of Pasco County boundaries – Highest % of commuters in Region
12% Unemployment – Highest % in Region
Highest impact fees in Region
Unsustainable Growth Patterns
Tax Base dependent on residential development (79%)
Transportation Mitigation was complex and encouraged sprawl

Pasco County Mobility Fee - Overview
Adopted in 2011
Consumption based impact fee that complies with dual
rational nexus test
Assesses Capital Costs for
Roads
Transit
Bicycle/Pedestrian
O&M Costs Addressed by Gas Tax and Tax Increment Revenue

Mobility Planning History
TBARTA Adopts Transit Master Plan
MPO Adopts 2035 Long Range
Transportation Plan

Transit Oriented Development

Roadway Improvements

Transit Routes

Multi-Use Trail Facilities

Pedestrian Facilities
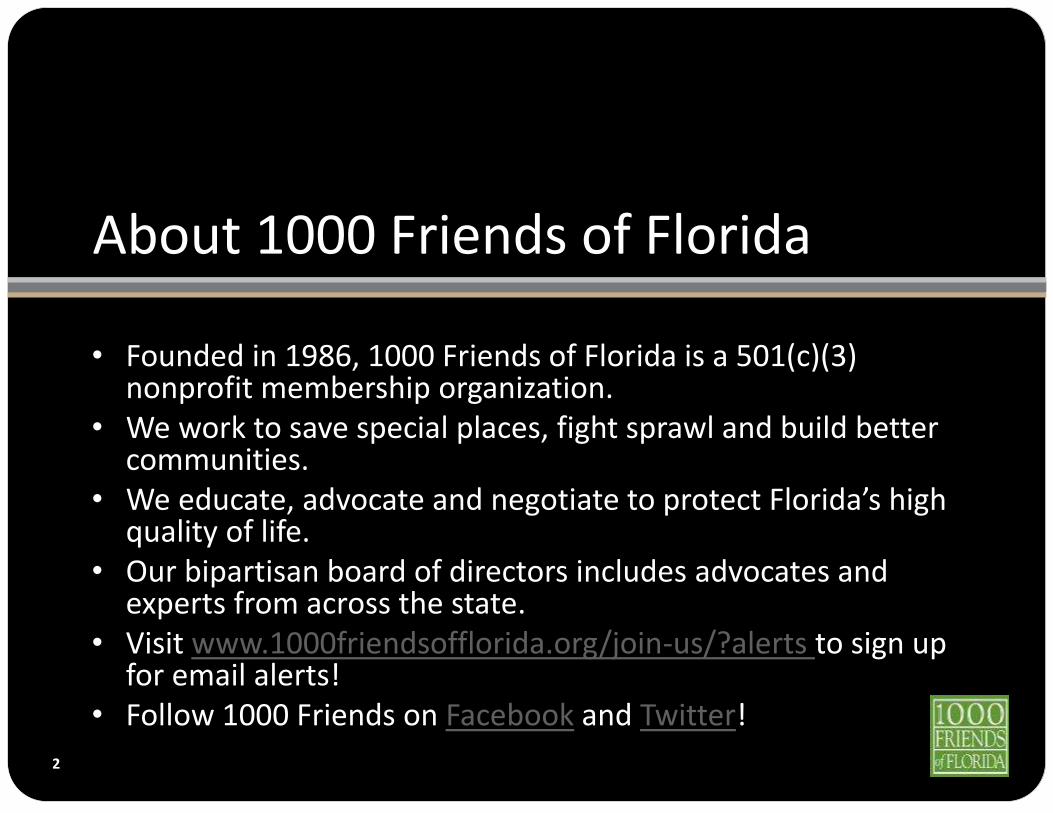
Bicycle Facilities

July 12, 2011
One of the First Counties in Florida/United States to Adopt a Mobility Fee
Innovative
Promotes Smart Growth
Promotes Economic Development
Pilot project becomes model for other communities

Fee Structure
Tiered Mobility Fee Rates
Lower Fees in Urban Market Area
Higher in Suburban & Rural Market
Areas
Longer Trip Lengths, higher LOS
standard = higher fees
Update Every 3 Years


Preferred Rates
Office
Industrial
Lodging (Hotel)
Traditional Neighborhood
Development/Town Centers (TND)
Transit Oriented Development (TOD)
January 13,
2012

Rate Buy-Down Other transportation revenues subsidize/buy-down mobility fee for preferred uses and locations
Gas Tax
Penny for Pasco (Sales Tax)
33.33% County-Wide Home Rule Tax Increment District
Required buy-down calculated yearly based on actual permits and revenues

FEE COMPARISON TABLE
(Non-residential fees are per 1,000 sf)
Prior TIF Mobility Fee
Urban
(West/South)
Mobility Fee
Suburban
(Central/East)
Mobility Fee
Rural (North)
Single-Family
(1501-2499 s.f.)
$10,302 $5,835 $8,570 $9,800
Apartments $7,564 $3,971 $5,845 $6,694
Light Industrial $3,151 $0 $1,000 $2,000
Office
(50,000-100,000)
$3,703 $0 $1,000 $2,000
Retail
(50,000-200,000)
$8,877 $5,641 $7,051 $8,813
Hotel $3,147 $0 $597 $1,192

FEE COMPARISON TABLE
TND and TOD
(Non-residential fees are per 1,000 sf)
Prior TIF Mobility Fee
Urban
(West/South)
Mobility Fee
Suburban
(Central/East)
Mobility Fee
Rural (North)
Town Center/
TND Single-Family
(1501-2499 s.f.)
$10,302 $1,459 $2,143 $2,450
Town Center/
TND Apartments
$7,564 $993 $1,463 $1,970
Town Center/
TND Light Industrial
$3,151 $0 $250 $500
Town Center/
TND Office(50,000-
100,000)
$3,703 $0 $250 $500
Town Center/
TND Retail(50,000-
200,000)
$8,877 $1,410 $1,763 $2,203
Town Center/
TND Hotel
$3,147 $0 $149 $298
TOD – All Uses N/A $0 N/A N/A

Rural Area Fees
Town Center Comparison
Rural Movie Theater
$21,454 per screen – 168% of prior transportation impact fee
Movie Theater in
Town Center
(Dade City, Pasadena Hills)
$4,318 per screen – 34% of prior transportation impact fee

Rural Area Fees
Town Center Comparison
Rural Supermarket
$13,082 per 1,000 s.f. – 160% of prior transportation impact fee
Supermarket in Town Center
(Dade City, Pasadena Hills)
$2,611 per 1,000 s.f. –
32% of prior transportation impact fee

Municipalities
Municipalities can participate; not required to participate
CRA’s excluded from home rule tax increment district
If participate, mobility fees and tax increment revenues collected in cities will be earmarked for improvements benefiting cities
Cities benefit from TND/Town Center rates in fee schedule

SIS Facilities
Portion of fee earmarked for improvements
that benefit Strategic Intermodal System (SIS)
in Pasco County
US 19
I-75
Suncoast Parkway
Portions of US 41 and SR 54
Requires consultation with FDOT prior to
budgeting SIS portion
Can be used for regional transit

Community Planning Act
Reinforcement
Local governments encouraged to develop tools and techniques to complement the application of transportation concurrency
Exempting or discounting impacts of locally desired development
Urban areas, redevelopment, job creation, and mixed use
Multi-modal solutions
* See Section 163.3180(5)(f), Florida Statutes

Pasco County’s Timing and
Phasing System
Opted-out of transportation concurrency in 2012 and now perform LOS analysis only at discretionary entitlement stage (Comp Plan/Rezoning/DRI)
Staff performs analysis, unless applicant volunteers to do it
Discretionary entitlements can be timed or phased to match available transportation capacity, or can be approved notwithstanding identified LOS failures

Pasco County’s Timing and
Phasing System
Site plans, building permits, plats etc. exempt—”pay mobility fees and go”
Exemptions for office, industrial and hotel uses
Exemptions for transit-oriented development (TOD)
More lenient LOS for traditional neighborhood development (TND), projects that incorporate Mixed Use Trip Reduction Measures (MUTRM), and development in Pasco’s designated urban areas
Exemptions for entitlements purchased from rural market area through TDR program

Pasco County’s Timing and
Phasing System
Just in case, created 5-year window for development to opt-out of new system and remain subject to transportation impact fees and transportation concurrency/proportionate share
No developer has opted out yet
No project denied since system adopted
At least 5 major projects have been approved since system adopted, including the development that challenged the system (Wiregrass)

Pasco County’s Timing and
Phasing System
Other projects seeking to use system in lieu of DRI DRI transportation analysis
Pasco’s Timing and Phasing/Mobility Fee System serves other public purposes that are equally or more important than the maintenance of transportation capacity, including economic development, tourism, promotion of “smart growth”, and reduction of sprawl
END OF PRESENTATION – Thank You……..

5 Years of Progress


Mixed Use Land Use Amendments
◦ Traditional Neighborhood Developments
◦ Transit Oriented Developments

Small blocks, buildings oriented to street,
parking to rear and on-street.

MOBILITY Long Term Capital Improvements Element

MULTI-MODAL
TRANSPORTATION
MITIGATION PROGRAM (MMTM)

Uses similar factors to original Transportation Impact Fee
Vehicle Miles Travel (VMT) Based / One Time Payment
Simple look up table = Surety
Infrastructure = Mobility Plan Capital Improvements Element
TOD/TND -- Reduced mitigation recognizes reduced impact due to higher internal capture and mode shift
MULTI-MODAL TRANSPORTATION
MITIGATION (MMTM) PROGRAM

MULTI-MODAL vs ROADWAY ONLY
More Fiscally Efficient

Multi-Modal Transportation Districts
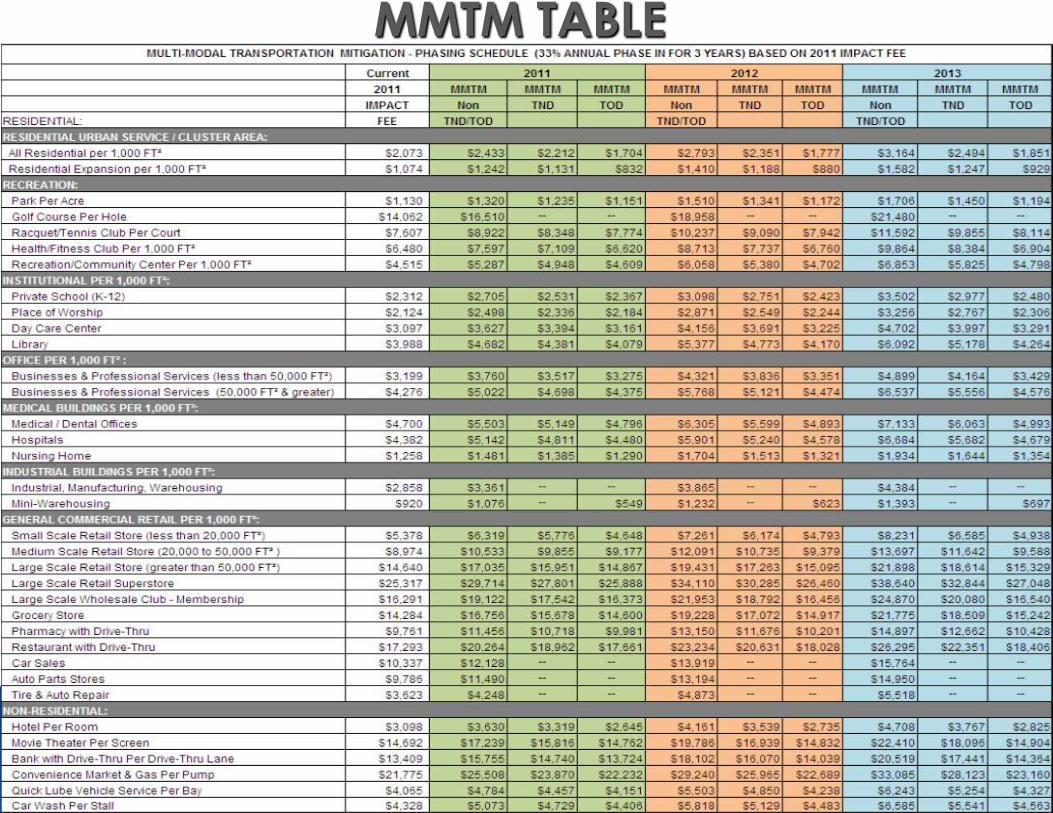
MMTM TABLE

WHAT DOES IT GET SPENT ON?
Consistent with Capital Improvements Element

TRANSPORTATION
IMPROVEMENT DISTRICT
Home Rule Tax Increment Finance Plan
Uses percentage of increase in general tax revenue for mobility
Anchored by Transit Oriented Development
Projects consistent with Capital Improvements Element
Allows County or Developer to front-end infrastructure
Mechanism to fund rapid transit service


SOUTHWEST DISTRICT

Celebration Pointe Transit Oriented Development

DEVELOPMENT COMPARISON
Development Haile Plantation Celebration Pointe
Acres 1,628 115
Miles of Road 37 3
Linear ft. of road/Unit
72.73 7.04
Residential Units 2,686 2,250
Residential Density
1.65 DU / ACRE 20 DU / ACRE
Non-Residential 280,000 896,000
Non-Residential Density / FAR
40 SF / CAPITA 175 SF / CAPITA
Hotels 0 250

FISCAL IMPACT (Celebration Pointe Approval)
•TOD: 2012-2035 resulted in $33.7 million surplus after TID is funded

FISCAL IMPACT (Under Base Land Use)
•Low Density: 2012-2035 resulted in $-195,910 deficit after TID is
funded
Based on 600 units consistent with underlying land use

PLAN PROACTIVELY POTENTIAL TND/TOD LOCATIONS

PLAN REGIONALLY POTENTIAL TND/TOD LOCATIONS

William B. Killingsworth
Director, Division of Community Development
City of Jacksonville’s 2030 Mobility Plan

Well Timed Opportunity
• The City was completing the first draft of three
Vision Plans.
• The TPO was updating the Long Range
Transportation Plan.
• Consensus that fair share was not working.
• The City was designated as a “dense urban land
area” or DULA per SB 360 (2009).

Mobility Strategies
Four mobility strategies outlined in Plan:
• Connect land use and transportation;
• Provide a multi-modal plan;
• Fund mobility; and
• Incentivize quality growth and development.

Average Vehicle Miles Traveled
by Traffic Analysis Zone

Development Areas

Land Use and Transportation Connection
• Development Areas link land use and transportation.
• Development Areas:
– Central Business District (CBD)
– Urban Priority Area (UPA)
– Urban Area (UA)
– Suburban Area (SA)
– Rural Area (RA)
• FLUE identifies land use criteria by Development Area.

Land Use and Transportation Connection
• Development Areas used to calculate average weighted VMT to assess a project’s mobility fee.
– Central Business District: 9.09 miles
– Urban Priority Area: 9.24 miles
– Urban Area: 9.46 miles
– Suburban Area: 10.28 miles
– Rural Area: 12.27 miles

Provide a Multi-Modal Plan
• Projects transportation deficiencies through 2030 - coincides with horizon year of the Comprehensive Plan.
• Identifies transportation needs for all modes:
• Bicycle;
• Pedestrian;
• Transit;
• Single Occupancy Vehicles.

Provide a Multi-Modal Plan
• Transportation improvement projects are proposed to address roadway deficiencies.
• Projects include:
• Roadway capacity;
• BRT, commuter rail, and streetcar;
• Facilities to improve bicycle network connectivity; and
• Pedestrian improvements design to achieve sidewalk connectivity.
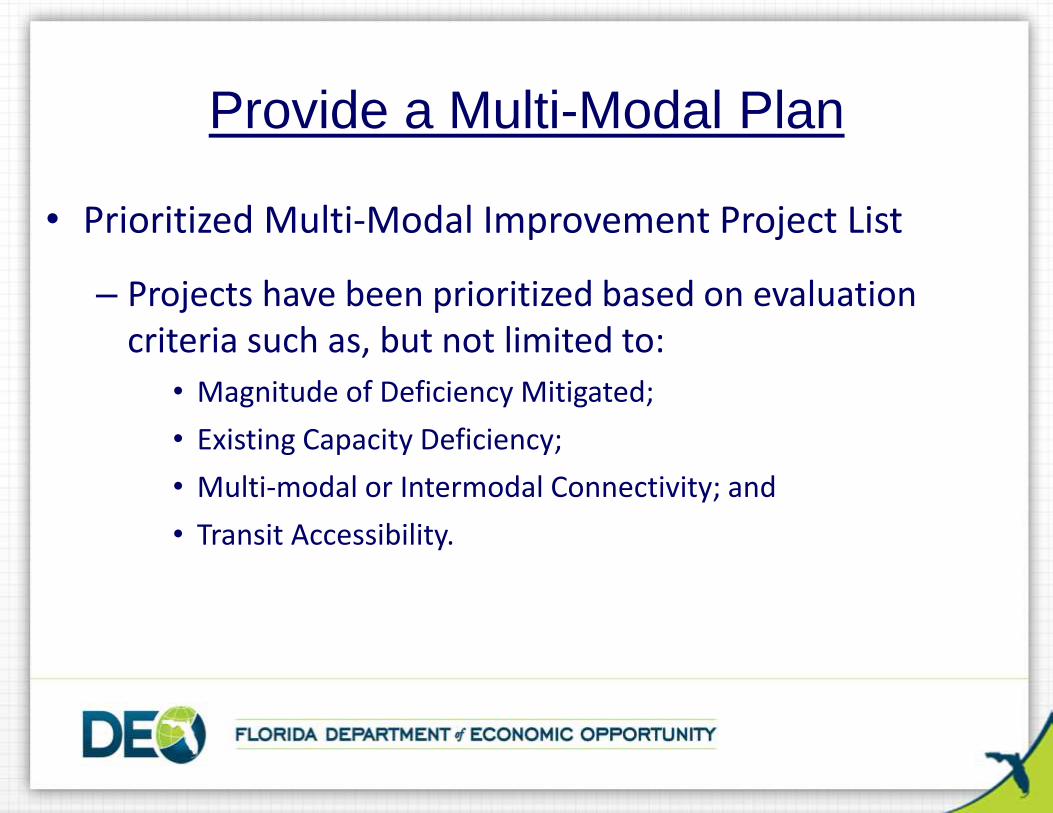
Provide a Multi-Modal Plan
• Prioritized Multi-Modal Improvement Project List
– Projects have been prioritized based on evaluation criteria such as, but not limited to:
• Magnitude of Deficiency Mitigated;
• Existing Capacity Deficiency;
• Multi-modal or Intermodal Connectivity; and
• Transit Accessibility.

Provide a Multi-Modal Plan
• A qualitative measure describing operational conditions within a traffic stream.
• Q/LOS value for each mode, weighted based on location and needs of each Mobility Zone.
• Expressed as letter grade levels (Q/LOS B-F).
Quality/Level of Service (Q/LOS)
• Grades are assigned a numerical value to calculate a Mobility Score.

Mobility Zones

Mobility Auto/Truck
Mode Transit Mode Bicycle Mode Pedestrian
Mode Weighted Weighted
Zone Score %
Weight Score %
Weight Score %
Weight Score %
Weight Score Q/LOS
"Grade"
1 1.68 60% 0.72 10% 2.41 15% 1.71 15% 1.70 E
2 1.78 60% 1.17 10% 2.69 15% 1.76 15% 1.85 E
3 2.56 80% 0.23 5% 2.40 10% 1.23 5% 2.36 D
4 2.29 80% 0.51 5% 2.43 10% 1.24 5% 2.16 D
5 2.13 80% 0.06 5% 2.12 10% 1.18 5% 1.98 E
6 2.36 80% 0.06 5% 2.62 10% 1.40 5% 2.22 D
7 1.39 25% 1.44 25% 1.73 25% 1.93 25% 1.62 E
8 2.09 25% 2.34 25% 1.92 25% 2.05 25% 2.10 D
9 1.99 25% 1.95 25% 1.91 25% 1.85 25% 1.93 E
10 2.02 20% 2.65 30% 1.96 20% 2.52 30% 2.35 D
Average 2.03 1.11 2.22 1.69 2.03 D
Mobility Score, a quantitative measure to determine the
average quality of service of the Mobility Plan within each of
the Mobility Zones.
Provide a Multi-Modal Plan

Fund Mobility
• Mobility Fee, assessed for new development as follows:
Mobility Fee = A x B x C
Where: A = Cost per VMT; B = Average VMT per Development Area; C = Project Daily Vehicle Trips
• Mobility Zones – Fee is applied to a defined geographic area, a Mobility Zone. – Ensures a rational relationship between the transportation
improvement to which the mobility fee is applied and the location of the development.

Incentivize Quality Growth •Trip reduction adjustments provide an opportunity to reduce the assessed mobility fee by reducing the total number of calculated trips generated by a proposed development.
•Applied as a % of the calculated trip generation and subtracted from the project’s trips (value “C”).
Mobility Fee = A x B x (C – Trip Reduction Adjustments)
Where: A = Cost per VMT;
B = Average VMT per Development Area;
C = Project Daily Vehicle Trips

Incentivize Quality Growth
• Trip reduction adjustments are based upon such
things as the street intersection density, bicycle
network completion, sidewalk network
completion, household density, number of
employees, a mix of uses,
transit service, and the
presence of local serving
retail within a ½-mile radius of
the proposed development.

Updating the 2030 Mobility Plan
• 2030 Mobility Plan will be evaluated every 5 years with the North Florida TPO’s Long Range Transportation Plan. Mobility fees may be re-assessed at that time.
• Over the first 5 years of the Mobility Plan, the City will collect data and establish baselines to begin evaluating the long range goal of reducing vehicle miles traveled.

Policy Implications
• Incentivizes infill and redevelopment.
• Incentivizes quality growth.
• Guides the market.
• Focuses on the future.
• Predictable, fair, efficient.

QUESTIONS?
• Your webinar control panel includes a “Questions” box.
• Please type any questions in this box.
• Please refer to the slide number and/or speaker when you post your question.
• Please keep your questions succinct!
• Staff will ask the presenters questions, as time permits.
THIS WEBINAR:
• Approved for 2 AICP CM credits for Planners (including 1.5 legal credits) - #24352
• Approved for 2.5 CLE credits with Florida Bar – #1306233N
• Approved for 2 CEHP credits
• PowerPoint is available for downloading: www.1000friendsofflorida.org.
• Register for upcoming webinars: www.1000friendsofflorida.org/communications/webinars

Please Support the Dr. John M. DeGrove Webinars
1000 Friends needs your support to continue this free webinar series in 2014. Costs include:
• Go-to-Webinar subscription
• AICP CM subscription
• CLE Fees
• Staff time
Please make a donation to 1000 Friends at www.1000friendsofflorida.org/donate-now/
and under “program” click “DeGrove Education Fund”