Embed Size (px)
Citation preview
Transportation Outlook
21st Breakbulk Americas Transportation Conference
Houston
October 14th, 2010

Transportation Outlook
1 Introduction
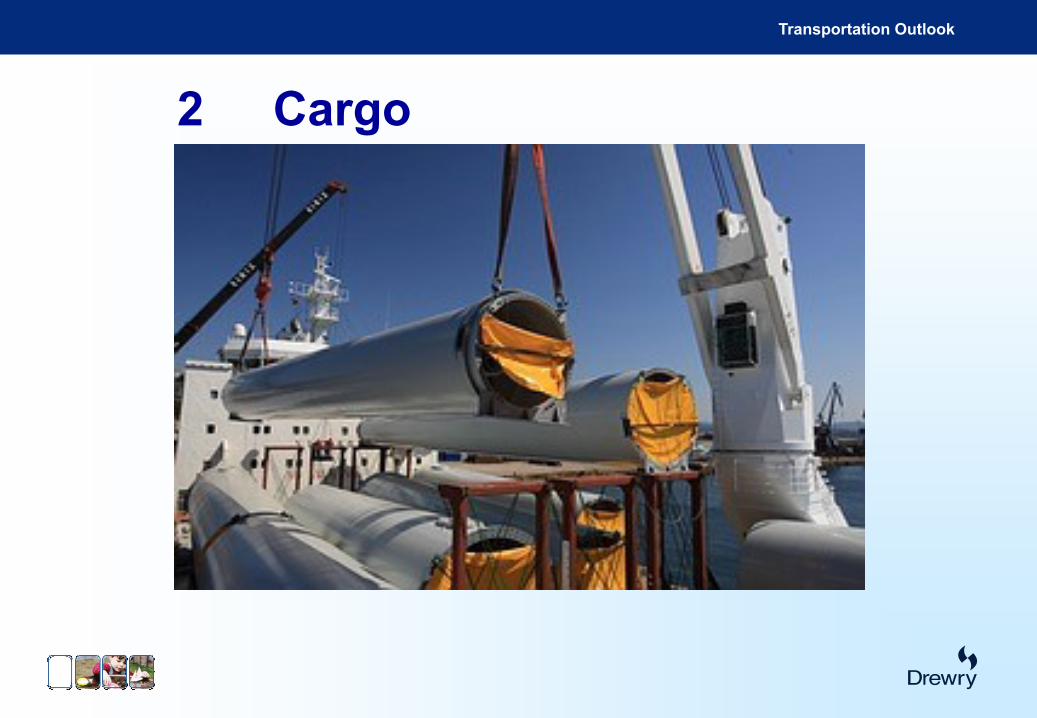
2 Cargo
3 Fleet
4 Market outlook & forecasts
Agenda
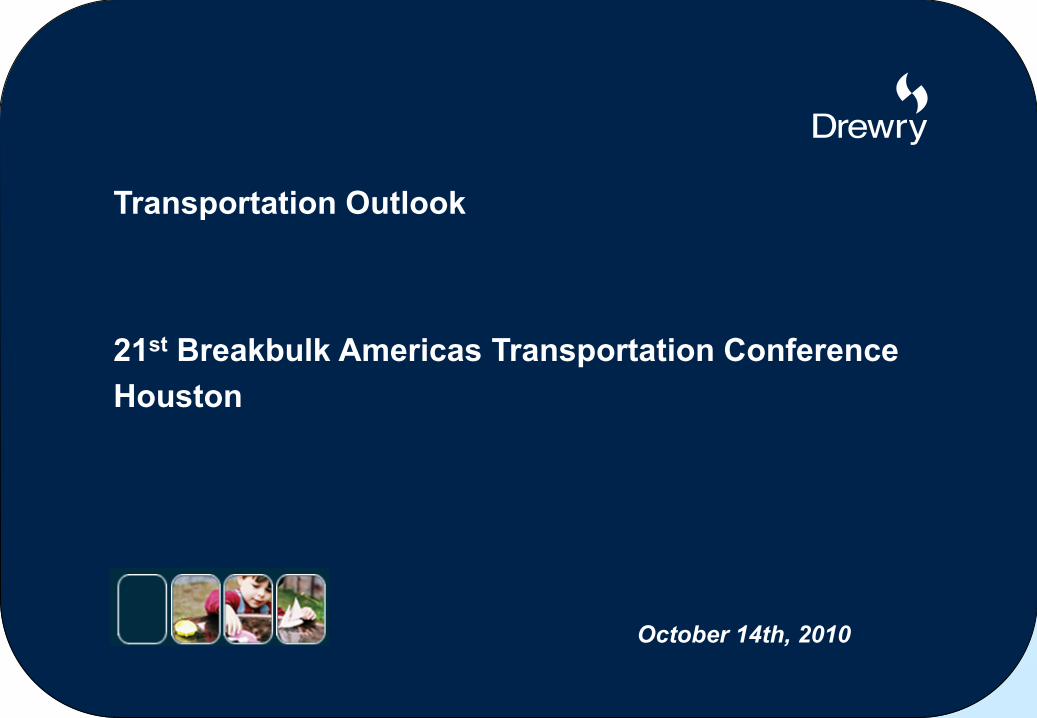
Transportation OutlookMajor MPV seaborne trade routes
ExporterImporterExporter and importer
Steel
14-16m tonnesSteel
10-12m tonnes
Steel
10-12m tonnes
South
Korea
JapanMed
China
North
Europe
Forest products
28-32m tonnes
Indonesia
USA
Forest products
10-12m tonnes
EU27
Forest products
10-12m tonnes
Taiwan
Construction commodities
15-18m tonnes
Brazil
Fertilisers
2-3m tonnes
India
Fertilisers
3-4m tonnes
Algeria
Grain (mpv routes)
3-4m tonnes
Argentina
Grain (mpv routes)
4-5m tonnes
Construction commodities
5-6m tonnes
FranceRussia
Transportation Outlook
0
500
1,000
1,500
2,000
2,500
2000 2002 2004 2006 2008 2010
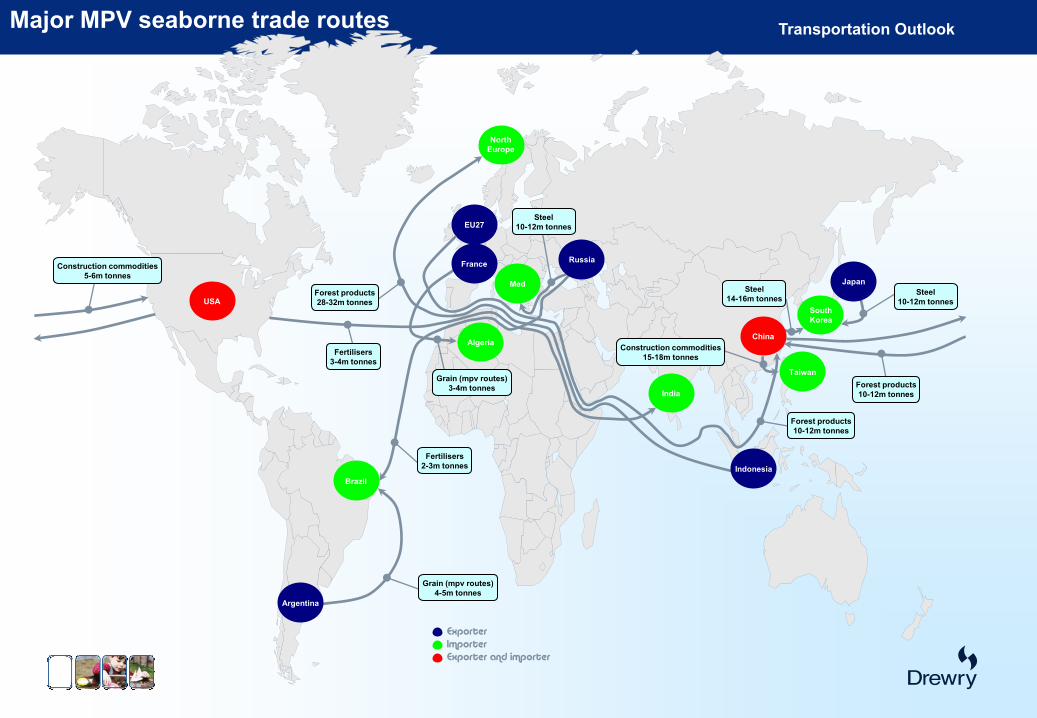
Estimated development of general cargo market (million tonnes)
General cargo market shareContainer market shareMPV market share
Total general cargo market
Source: Drewry, WTO
Transportation Outlook
2 Cargo
Transportation Outlook
Source: Drewry
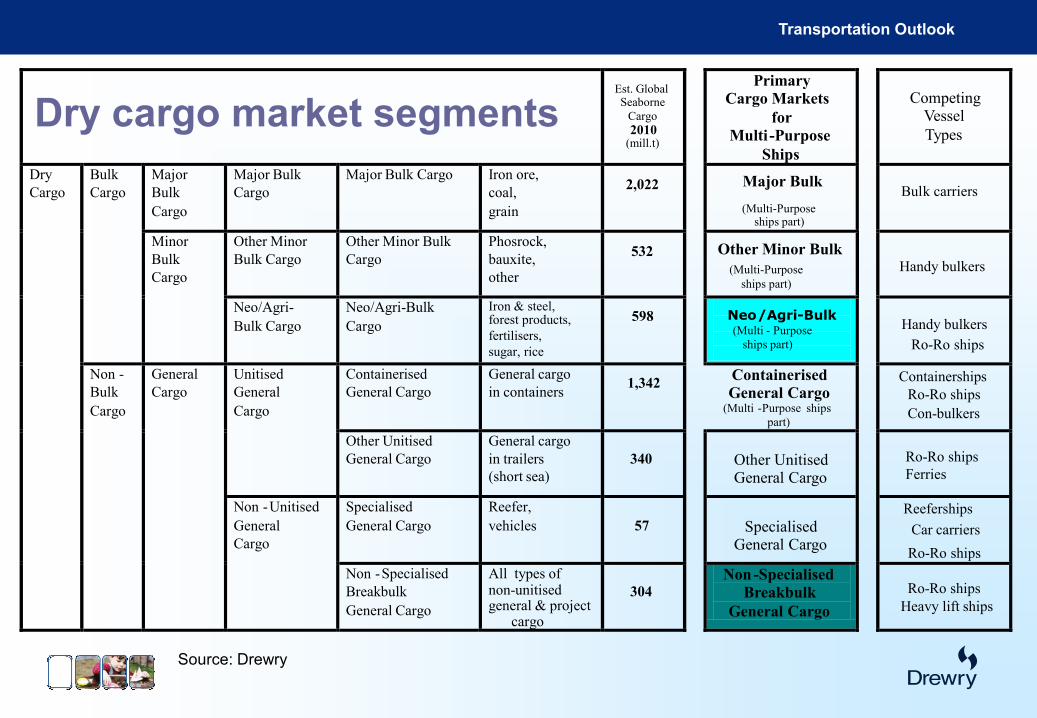
Dry cargo market segmentsSeaborne
Cargo
2010(mill.t)
Primary
Cargo Markets
for
Multi -Purpose
Ships
Competing Vessel
Types
Dry
Cargo
Bulk
Cargo
Major
Bulk
Cargo
Major Bulk
Cargo
Major Bulk Cargo Iron ore,
coal,
grain
2,022 Major BulkBulk carriers
Minor
Bulk
Cargo
Other Minor
Bulk Cargo
Other Minor Bulk
Cargo
Phosrock,
bauxite,
other
532 Other Minor BulkHandy bulkers
Neo/Agri-
Bulk Cargo
Neo/Agri-Bulk
Cargo
Iron & steel,forest products,
fertilisers,
sugar, rice
598 Neo/Agri-Bulk(Multi - Purpose
ships part)
Handy bulkers
Ro-Ro ships
Non -
Bulk
Cargo
General
Cargo
Unitised
General
Cargo
Containerised
General Cargo
General cargo
in containers1,342
Containerised
General Cargo(Multi -Purpose ships
part)
Containerships
Ro-Ro ships
Con-bulkers
Other Unitised
General Cargo
General cargo
in trailers
(short sea)
340 Other Unitised General Cargo
Ro-Ro ships
Ferries
Non -Unitised
General
Cargo
Specialised
General Cargo
Reefer,
vehicles 57 SpecialisedGeneral Cargo
Reeferships
Car carriers
Ro-Ro ships
Non -Specialised
Breakbulk
General Cargo
All types of non-unitisedgeneral & project
304
Non-Specialised
Breakbulk
General Cargo
Ro-Ro ships
Heavy lift ships
(Multi-Purposeships part)
(Multi-Purpose
ships part)
Est. Global
cargo
Transportation Outlook
Project cargo – the invisible break-bulk volume
1) Nowhere to be seen in port and trade statistics, but it has become
the foundation for the most dynamic part of the break-bulk market
and home to many fast growing specialist companies such as
Beluga, BBC, Clipper, Rickmers, SAL, Intermarine and others.
2) Wide range of industries generate project cargo, but they can be
combined into just 4 sectors:- Transportation (46%); Logistics
(34%); Power & Water (16%);Oil &Gas (4%)
3) Global annual project value, give or take a few billion, is estimated
at $275 bn. Assuming sea freight = 7.5% of value; average freight
rate of $150/rev ton; 2.5 cbm/tonne; and 60% of cargo seaborne,
this would indicate an annual project cargo flow of 33 million
tonnes or 82.5 million cbm pa.
Transportation Outlook
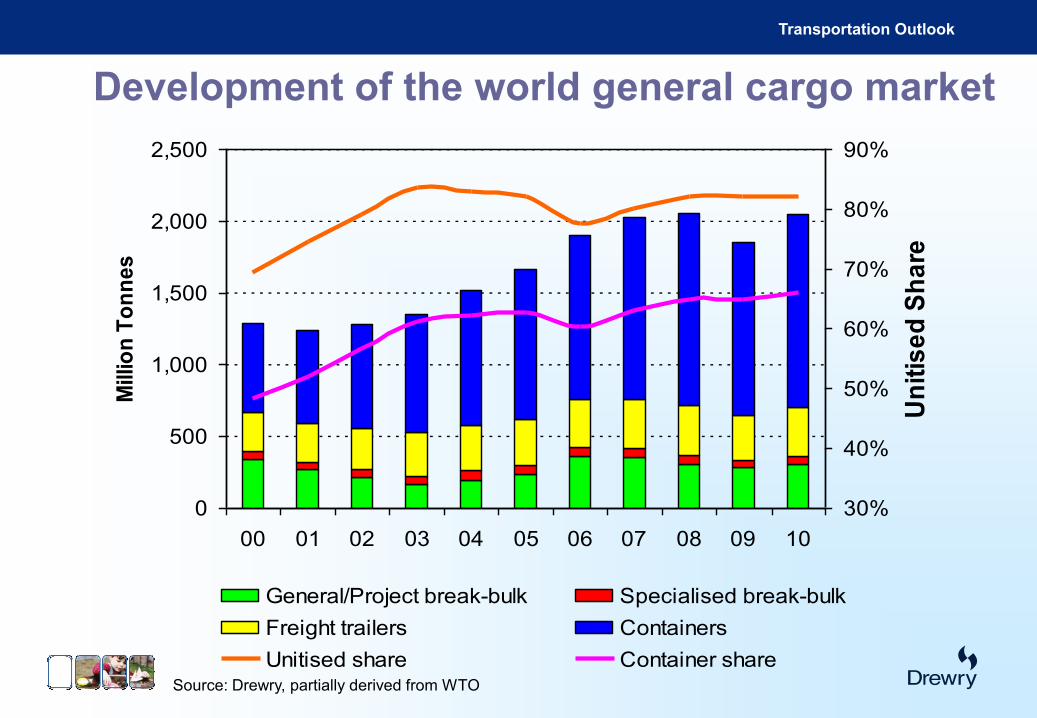
Development of the world general cargo market
0
500
1,000
1,500
2,000
2,500
00 01 02 03 04 05 06 07 08 09 10
Mill
ion
To
nn
es
30%
40%
50%
60%
70%
80%
90%
Un
itis
ed
Sh
are
General/Project break-bulk Specialised break-bulk
Freight trailers Containers
Unitised share Container shareSource: Drewry, partially derived from WTO
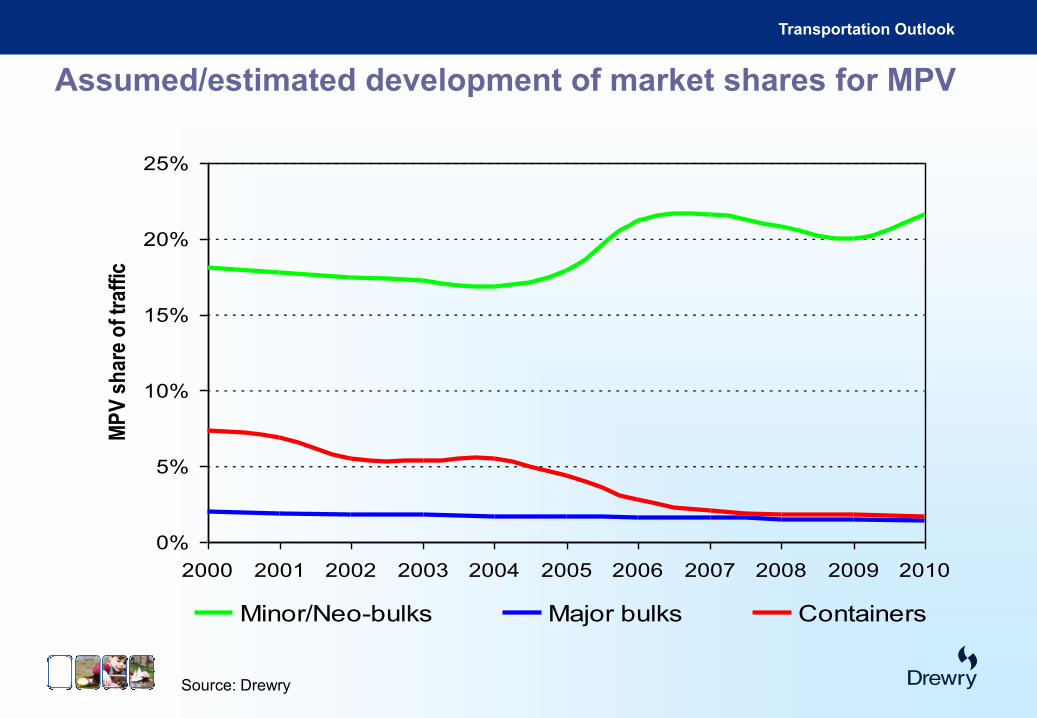
Transportation Outlook
Source: Drewry
0%
5%
10%
15%
20%
25%
2000 2001 2002 2003 2004 2005 2006 2007 2008 2009 2010
MP
V s
ha
re o
f tr
aff
ic
Minor/Neo-bulks Major bulks Containers
Assumed/estimated development of market shares for MPV
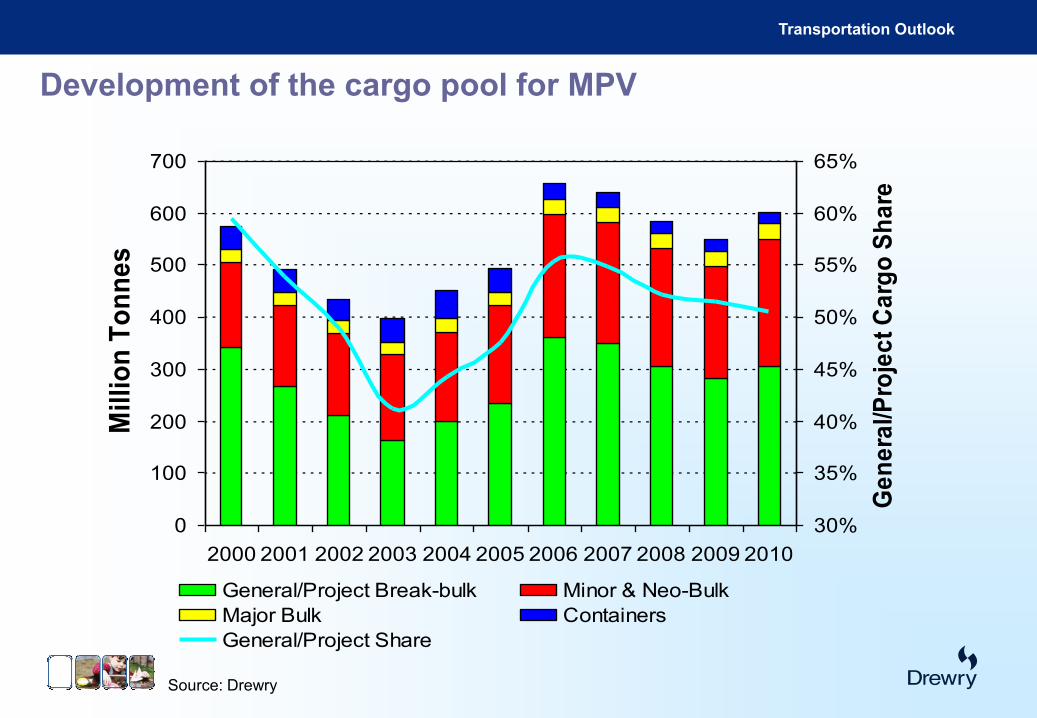
Transportation Outlook
Source: Drewry
Development of the cargo pool for MPV
0
100
200
300
400
500
600
700
2000 2001 2002 2003 2004 2005 2006 2007 2008 2009 2010
Mil
lio
n T
on
ne
s
30%
35%
40%
45%
50%
55%
60%
65%
Ge
ne
ral/P
roje
ct
Ca
rgo
Sh
are
General/Project Break-bulk Minor & Neo-Bulk
Major Bulk Containers
General/Project Share
Transportation Outlook
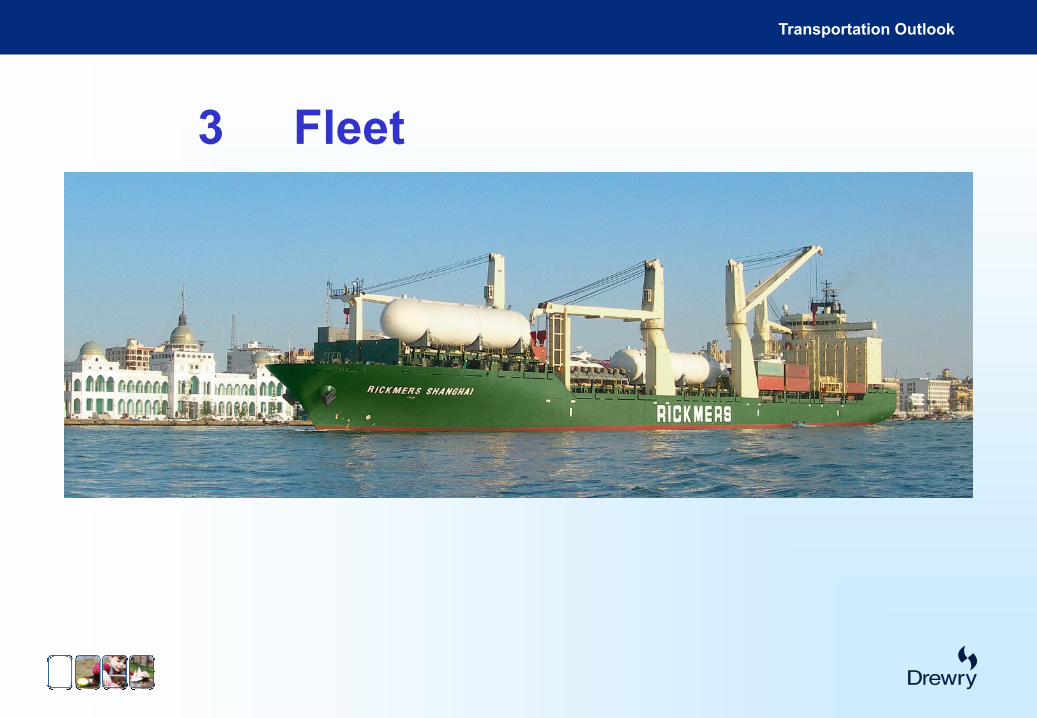
3 Fleet
Transportation Outlook
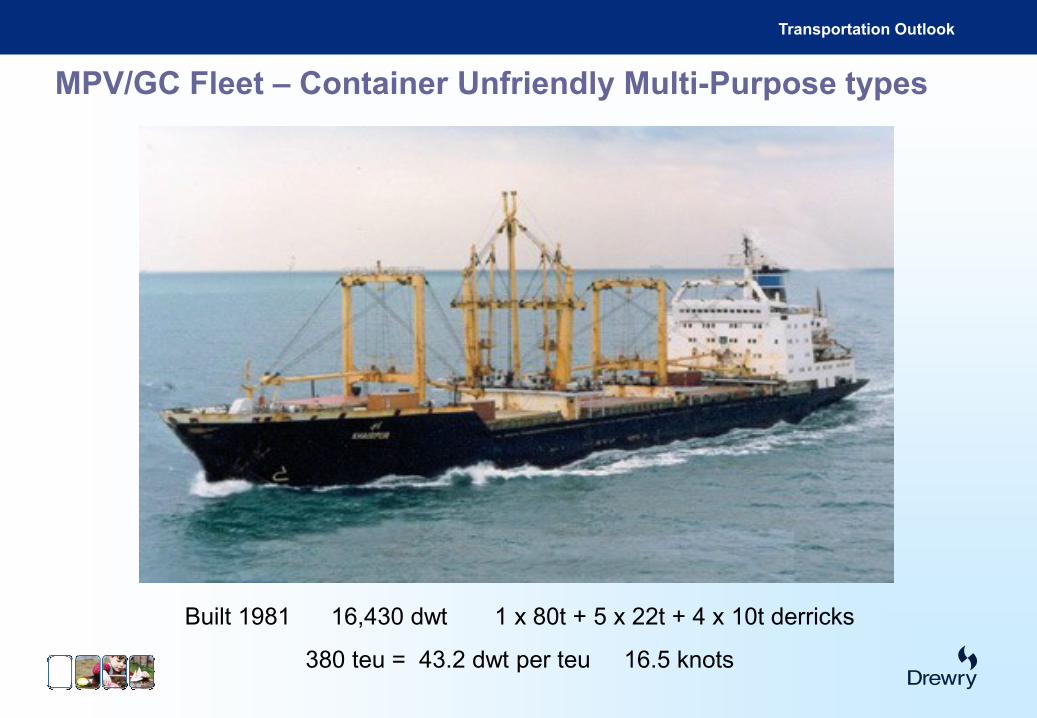
Built 1981 16,430 dwt 1 x 80t + 5 x 22t + 4 x 10t derricks
380 teu = 43.2 dwt per teu 16.5 knots
MPV/GC Fleet – Container Unfriendly Multi-Purpose types
Transportation Outlook
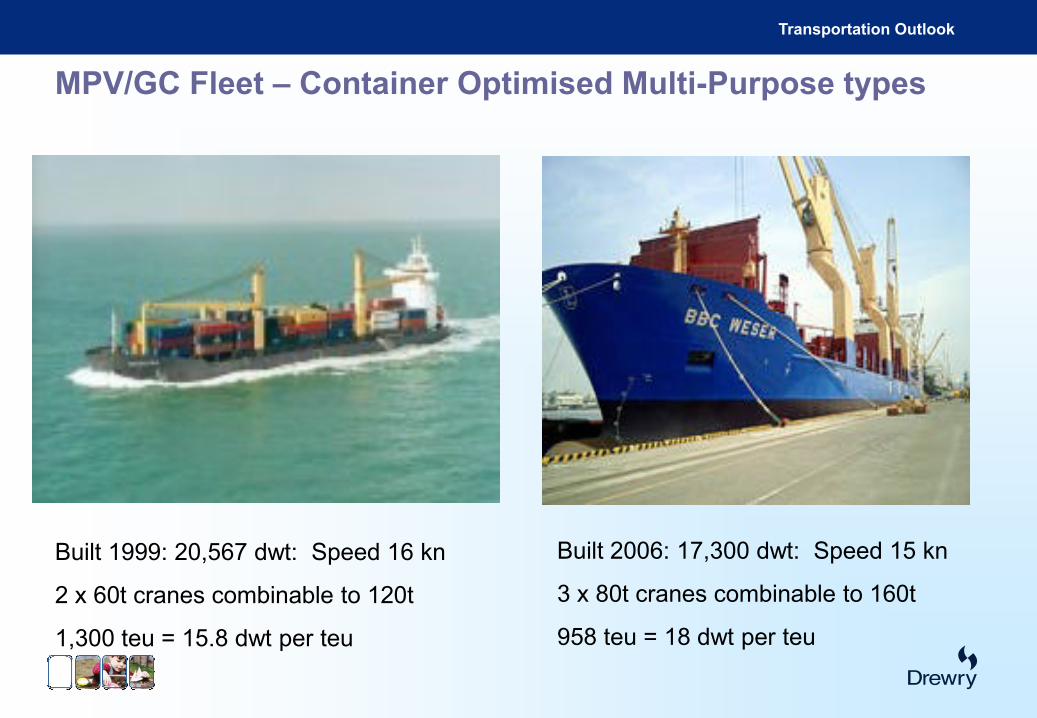
Built 1999: 20,567 dwt: Speed 16 kn
2 x 60t cranes combinable to 120t
1,300 teu = 15.8 dwt per teu
Built 2006: 17,300 dwt: Speed 15 kn
3 x 80t cranes combinable to 160t
958 teu = 18 dwt per teu
MPV/GC Fleet – Container Optimised Multi-Purpose types
Transportation Outlook
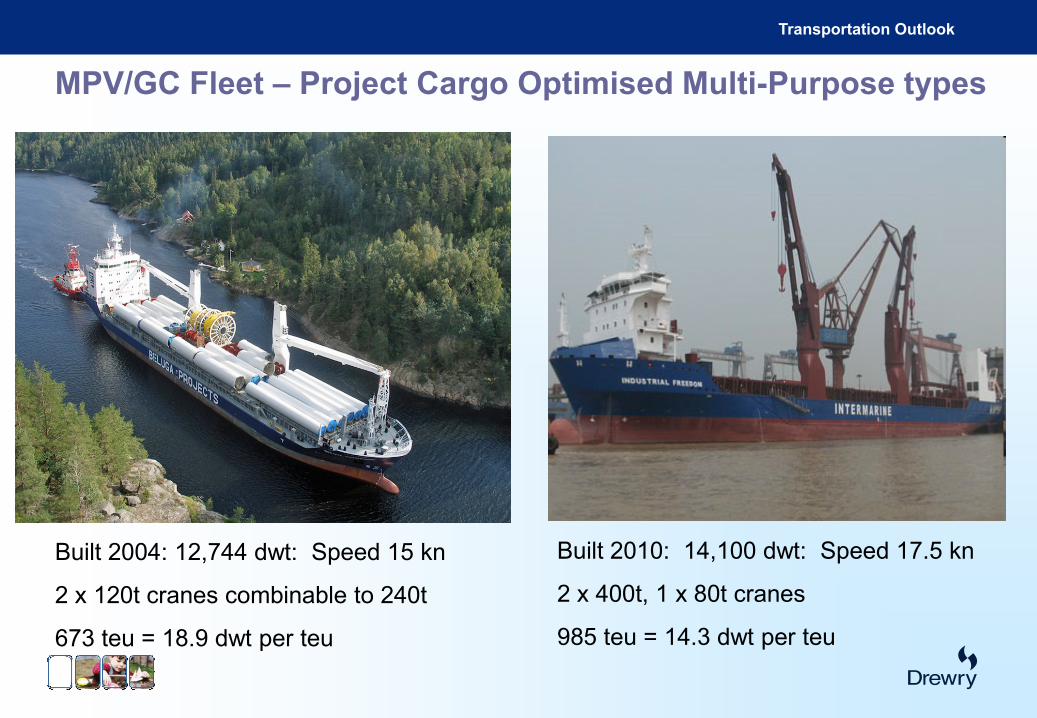
Built 2004: 12,744 dwt: Speed 15 kn
2 x 120t cranes combinable to 240t
673 teu = 18.9 dwt per teu
Built 2010: 14,100 dwt: Speed 17.5 kn
2 x 400t, 1 x 80t cranes
985 teu = 14.3 dwt per teu
MPV/GC Fleet – Project Cargo Optimised Multi-Purpose types
Transportation Outlook
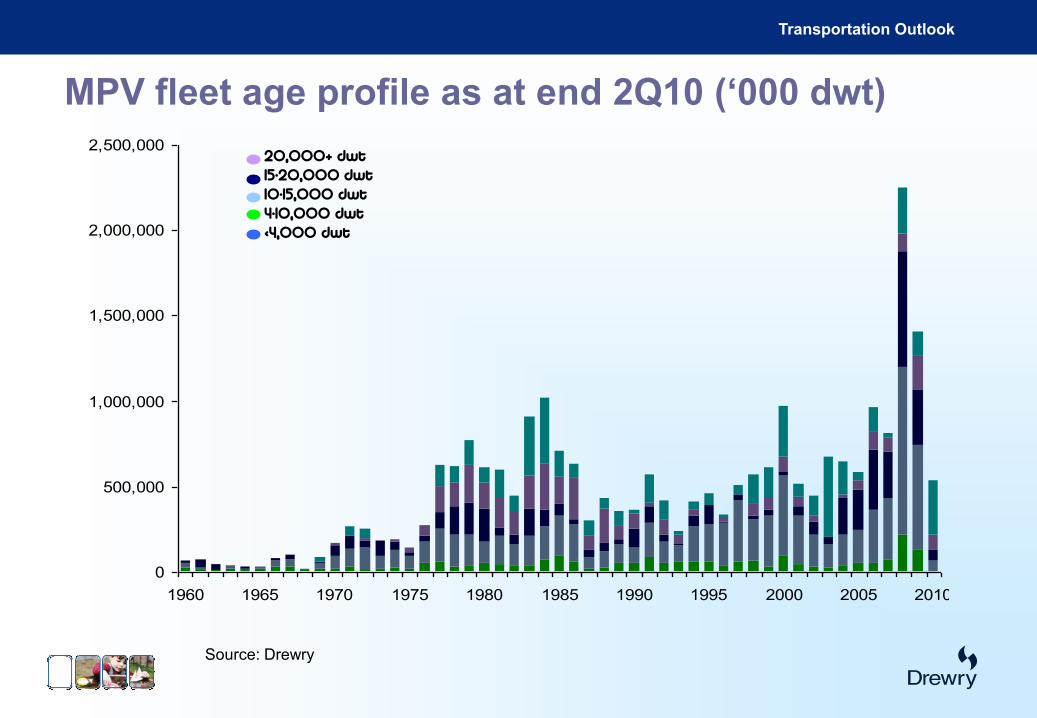
MPV fleet age profile as at end 2Q10 (‘000 dwt)
Source: Drewry
0
500,000
1,000,000
1,500,000
2,000,000
2,500,000
1960 1965 1970 1975 1980 1985 1990 1995 2000 2005 2010
20,000+ dwt15-20,000 dwt10-15,000 dwt4-10,000 dwt<4,000 dwt
Transportation Outlook
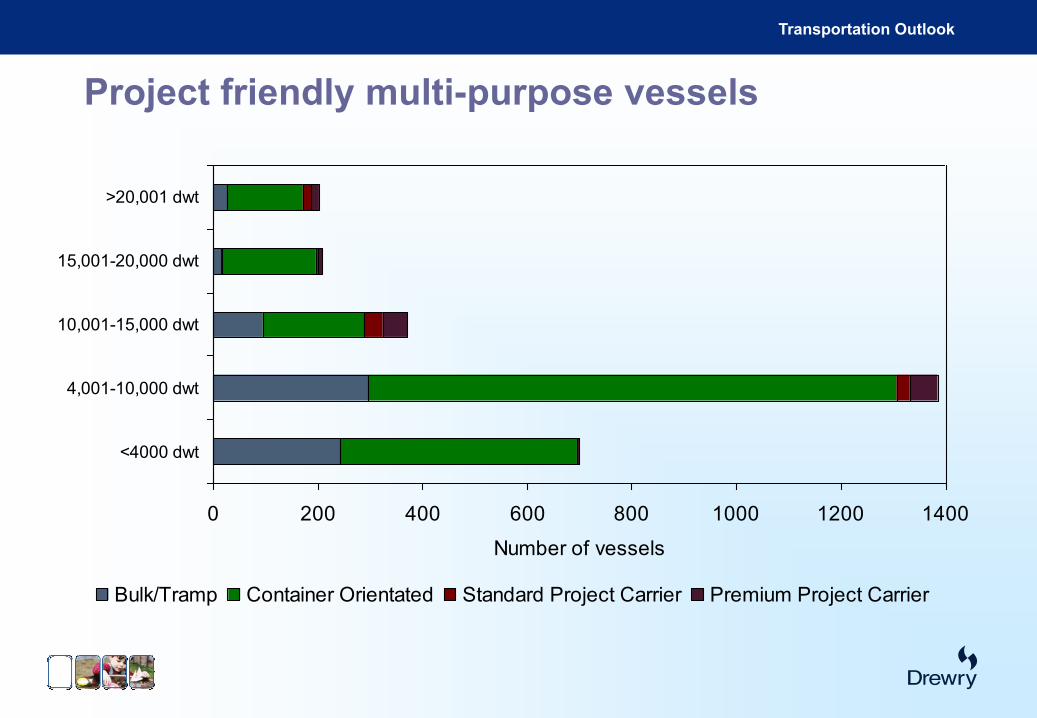
Project friendly multi-purpose vessels
0 200 400 600 800 1000 1200 1400
<4000 dwt
4,001-10,000 dwt
10,001-15,000 dwt
15,001-20,000 dwt
>20,001 dwt
Number of vessels
Bulk/Tramp Container Orientated Standard Project Carrier Premium Project Carrier
Transportation Outlook
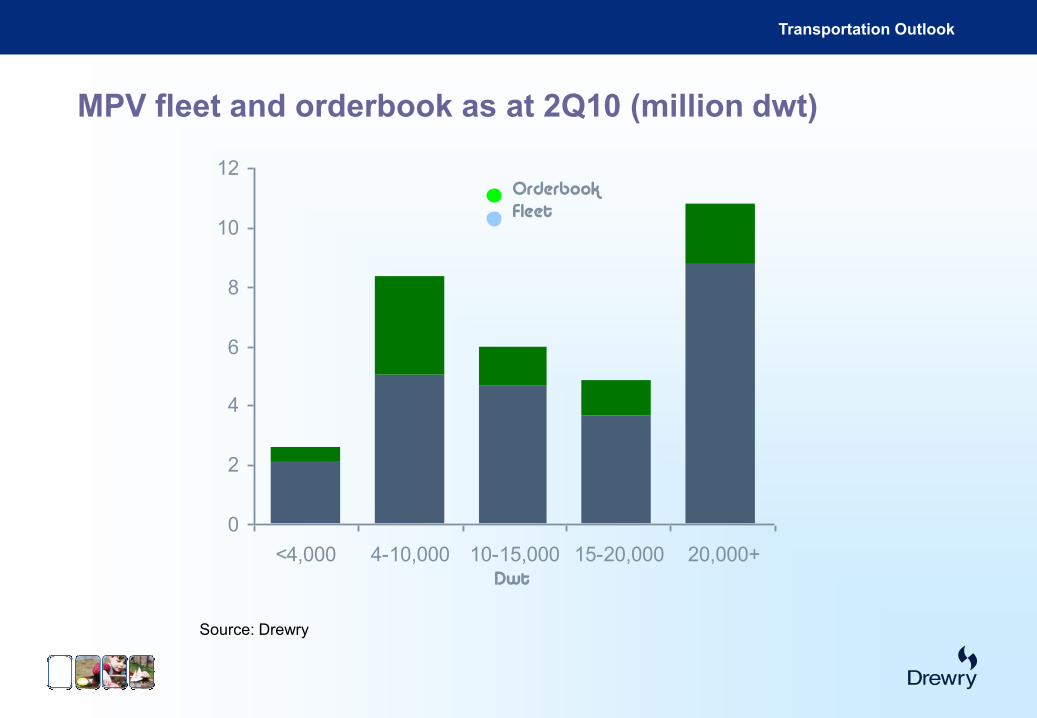
MPV fleet and orderbook as at 2Q10 (million dwt)
Source: Drewry
0
2
4
6
8
10
12
<4,000 4-10,000 10-15,000 15-20,000 20,000+Dwt
OrderbookFleet
Transportation Outlook
Source: Drewry
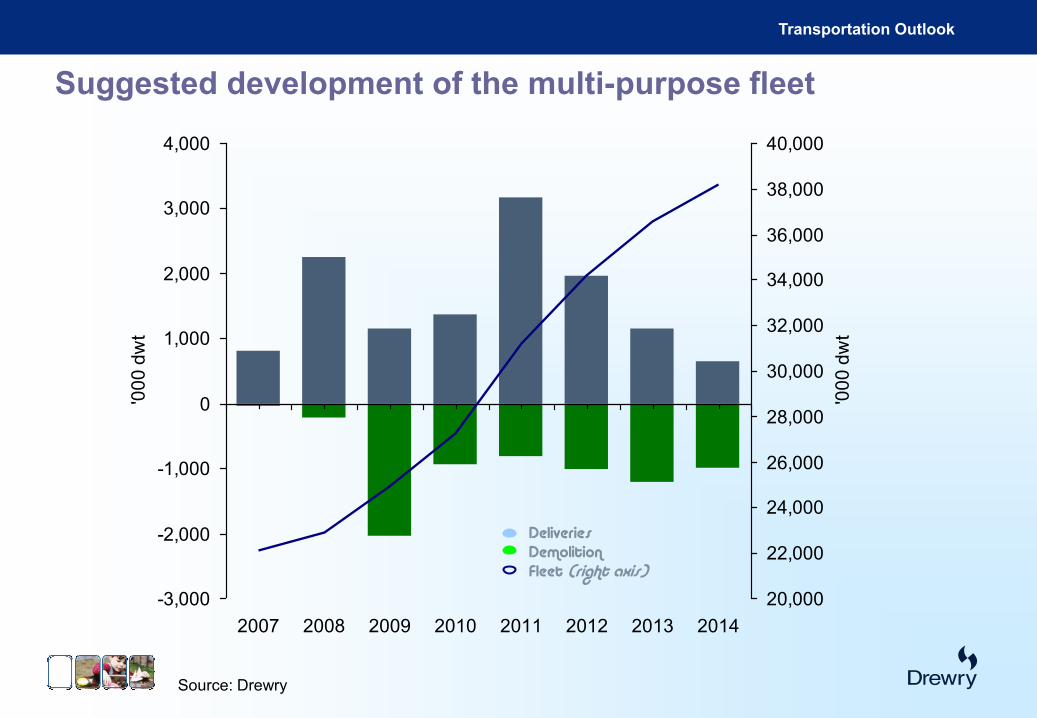
Suggested development of the multi-purpose fleet
-3,000
-2,000
-1,000
0
1,000
2,000
3,000
4,000
2007 2008 2009 2010 2011 2012 2013 2014
'00
0 d
wt
20,000
22,000
24,000
26,000
28,000
30,000
32,000
34,000
36,000
38,000
40,000
'00
0 d
wt
DeliveriesDemolitionFleet (right axis)

Transportation Outlook
4 Market outlook and forecasts
Transportation Outlook
-15%
-10%
-5%
0%
5%
10%
15%
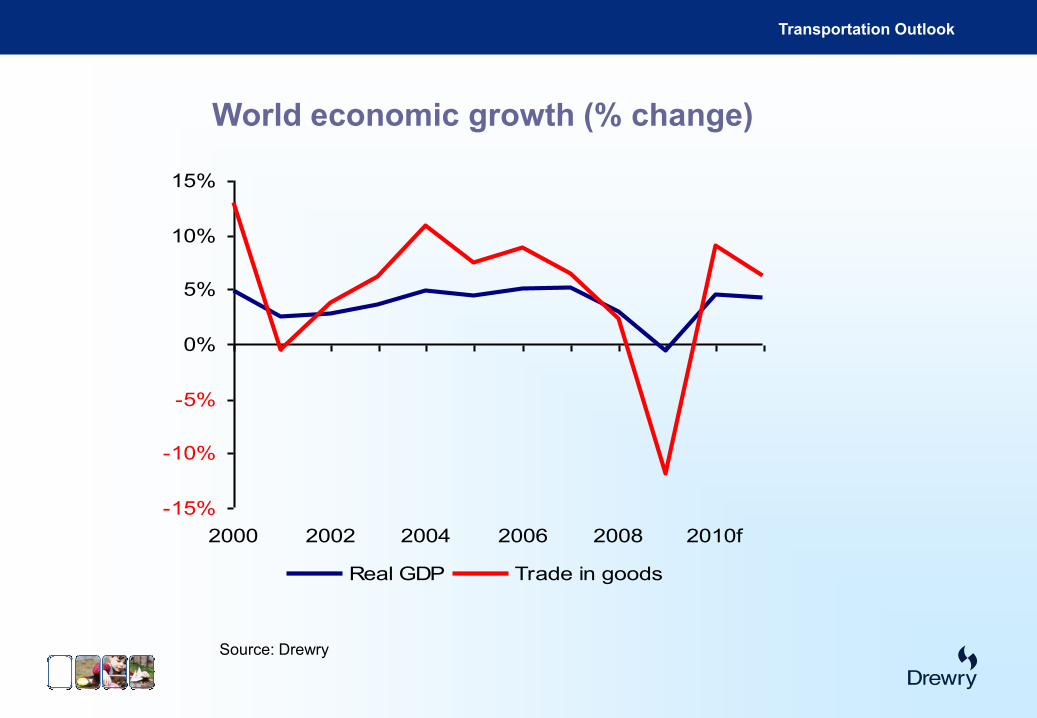
2000 2002 2004 2006 2008 2010f
Real GDP Trade in goods
World economic growth (% change)
Source: Drewry
Transportation Outlook
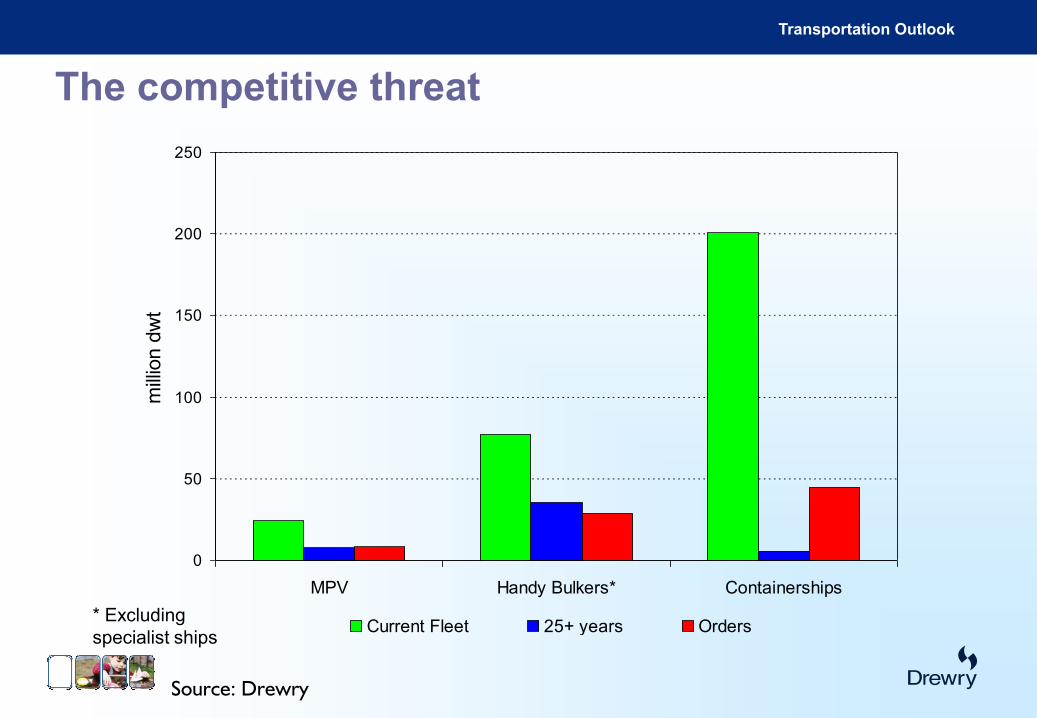
0
50
100
150
200
250
MPV Handy Bulkers* Containerships
mill
ion d
wt
Current Fleet 25+ years Orders
Source: Drewry
* Excluding
specialist ships
The competitive threat
Transportation Outlook
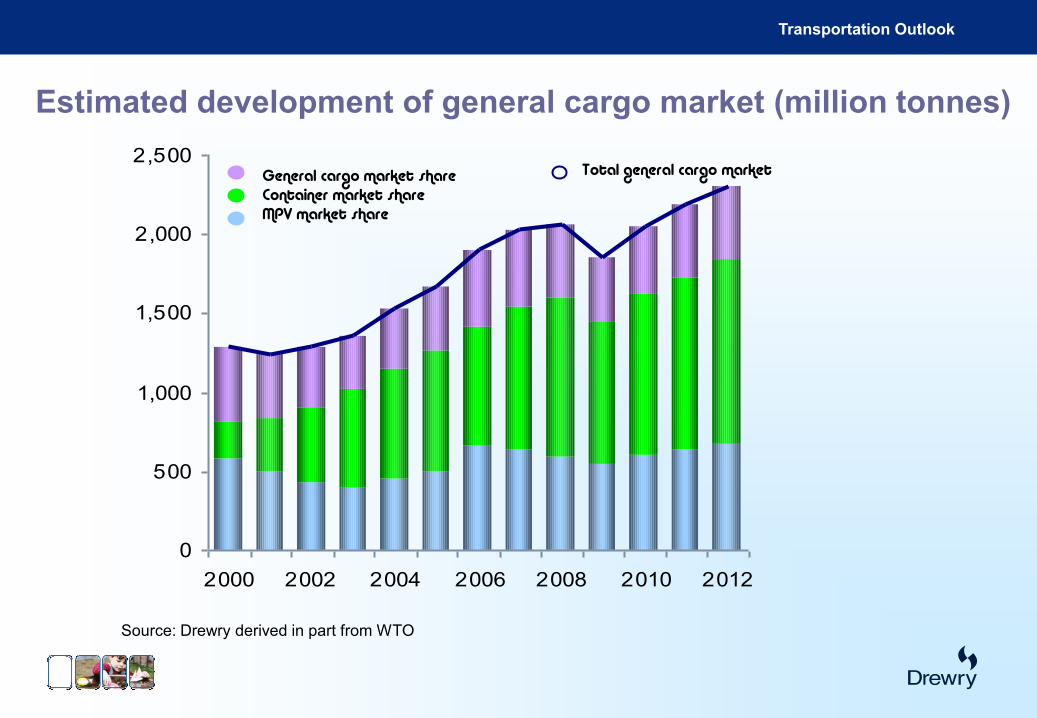
0
500
1,000
1,500
2,000
2,500
2000 2002 2004 2006 2008 2010 2012
Estimated development of general cargo market (million tonnes)
General cargo market shareContainer market shareMPV market share
Total general cargo market
Source: Drewry derived in part from WTO
Transportation Outlook
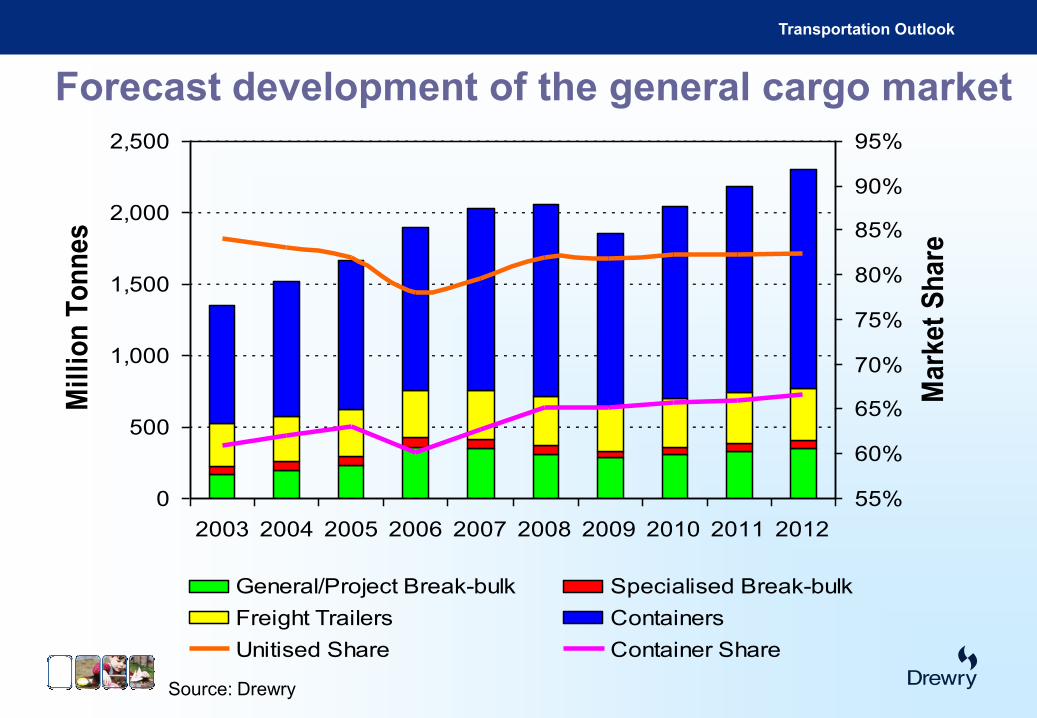
Source: Drewry
0
500
1,000
1,500
2,000
2,500
2003 2004 2005 2006 2007 2008 2009 2010 2011 2012
Mil
lio
n T
on
nes
55%
60%
65%
70%
75%
80%
85%
90%
95%
Mark
et
Sh
are
General/Project Break-bulk Specialised Break-bulk
Freight Trailers Containers
Unitised Share Container Share
Forecast development of the general cargo market
Transportation Outlook
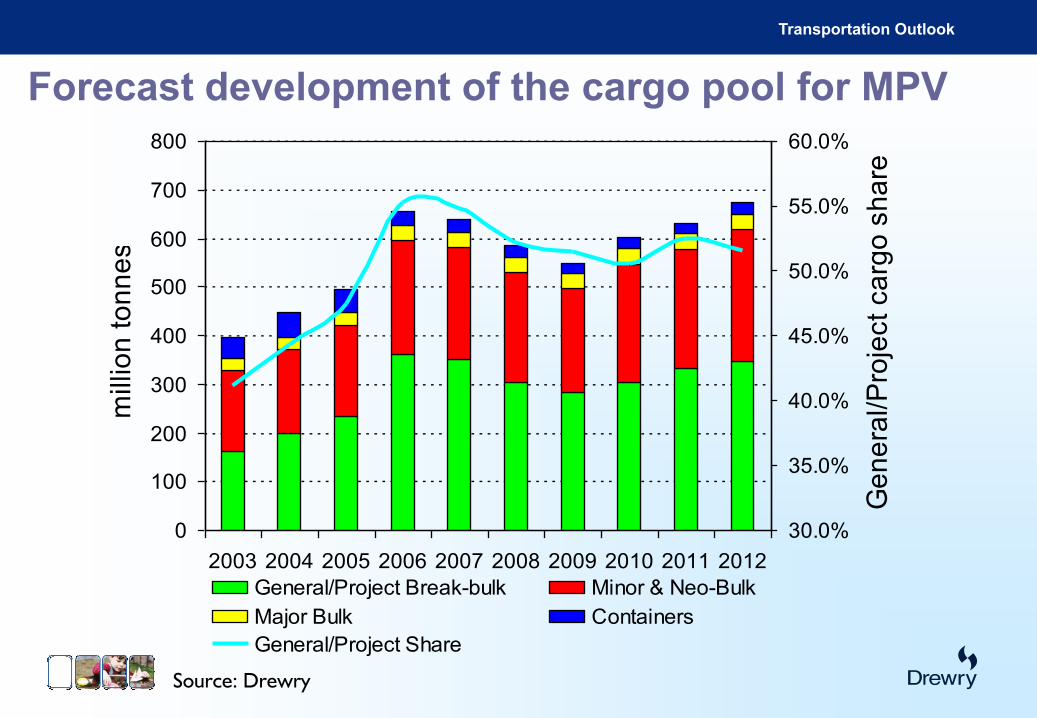
Source: Drewry
0
100
200
300
400
500
600
700
800
2003 2004 2005 2006 2007 2008 2009 2010 2011 2012
mill
ion
to
nn
es
30.0%
35.0%
40.0%
45.0%
50.0%
55.0%
60.0%
Ge
ne
ral/P
roje
ct
ca
rgo
sh
are
General/Project Break-bulk Minor & Neo-Bulk
Major Bulk Containers
General/Project Share
Forecast development of the cargo pool for MPV
Transportation Outlook
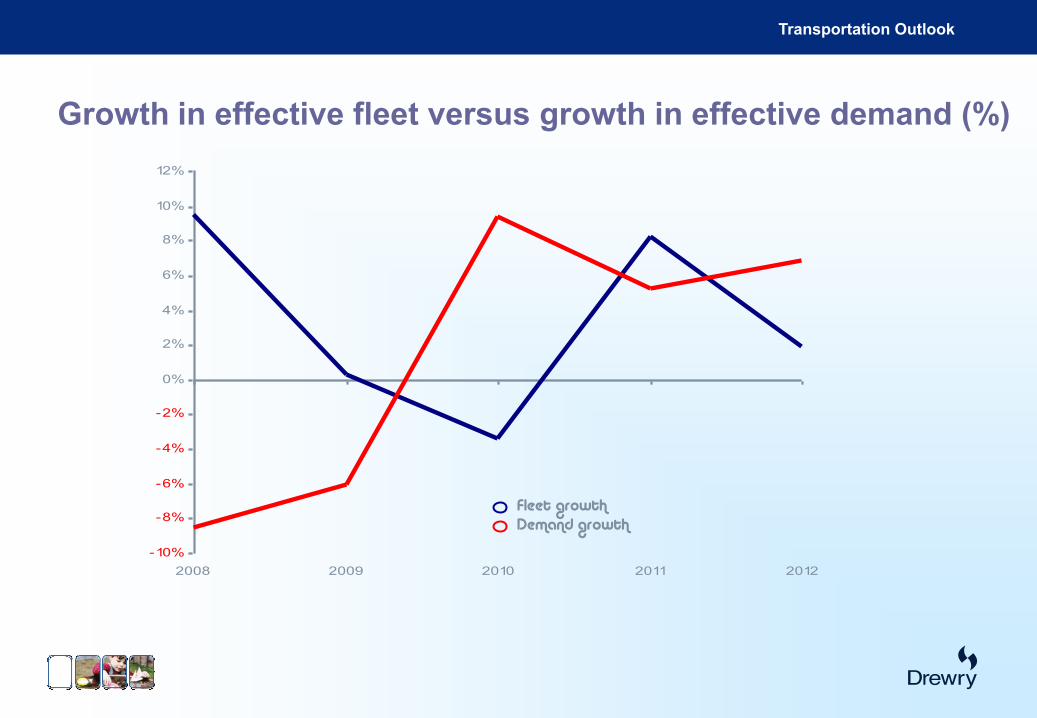
Growth in effective fleet versus growth in effective demand (%)
-10%
-8%
-6%
-4%
-2%
0%
2%
4%
6%
8%
10%
12%
2008 2009 2010 2011 2012
Fleet growthDemand growth
Transportation Outlook
Source: Drewry
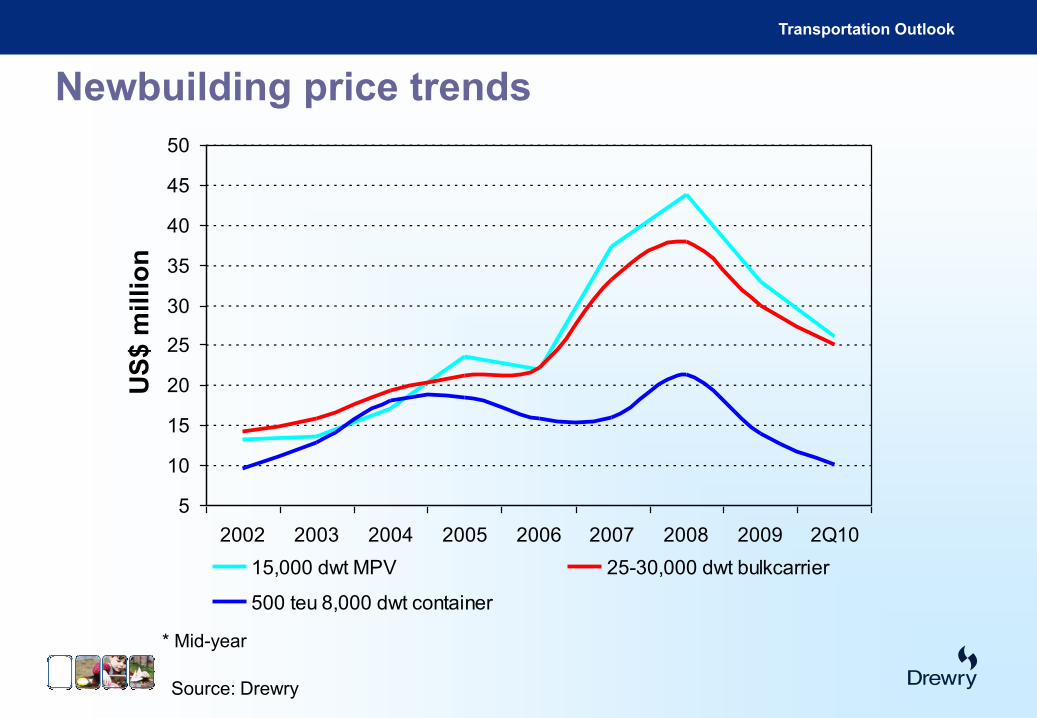
5
10
15
20
25
30
35
40
45
50
2002 2003 2004 2005 2006 2007 2008 2009 2Q10
US
$ m
illi
on
15,000 dwt MPV 25-30,000 dwt bulkcarrier
500 teu 8,000 dwt container
* Mid-year
Newbuilding price trends
Transportation Outlook
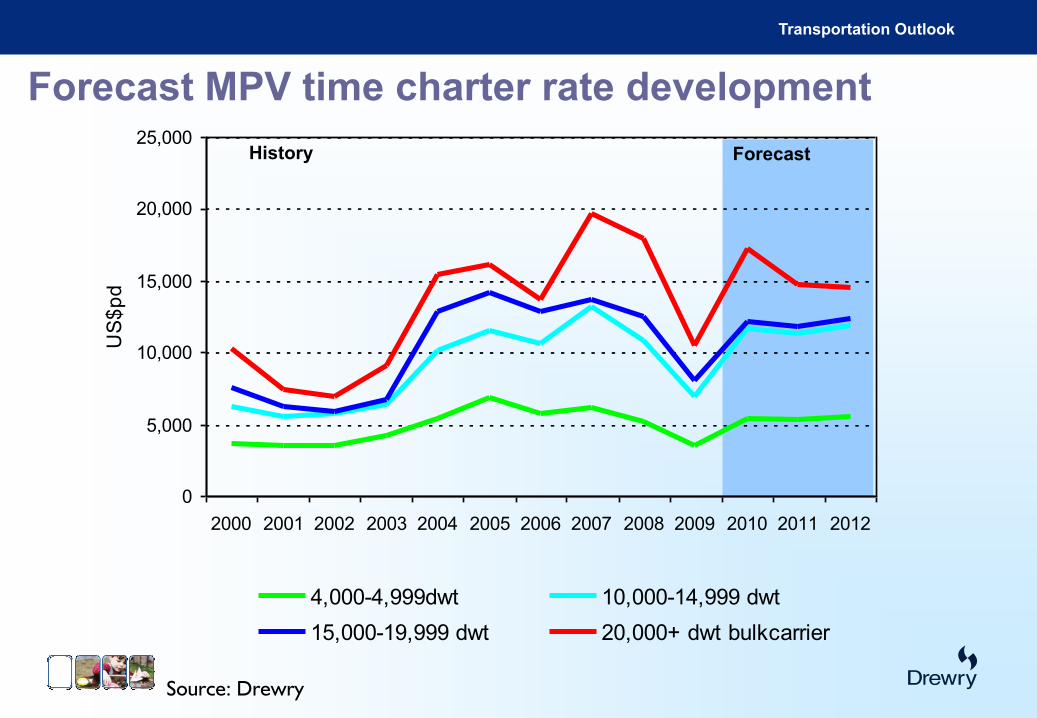
0
5,000
10,000
15,000
20,000
25,000
2000 2001 2002 2003 2004 2005 2006 2007 2008 2009 2010 2011 2012
US
$p
d
4,000-4,999dwt 10,000-14,999 dwt
15,000-19,999 dwt 20,000+ dwt bulkcarrier
Source: Drewry
Forecast MPV time charter rate development
History Forecast
Transportation Outlook
Break-bulk shipping in the future
1) Whilst the long lead times on projects provided some cushioning
against the demand collapse, there is now some lag in regenerating
new demand
2) Global GDP growth is expected to return to an average rate of 4.3%
from 2010 onwards
3) Heavy orientation of the project market to the developing world, where
economic growth will be stronger.
4) Cargo demand in this sector is forecast to increase at an average
annual rate of 7% to 2012,with fleet growth nearer 3% pa.
5) However whilst government involvement in many major infrastructure
projects helped sustain demand over the worst of the recession, it
may be that this has run its course.
Transportation Outlook
Summing up1) The fleet was in seemingly terminal decline, but the trade/economic super-cycle
reversed this and the sector is now seeing managed expansion. Memo - New
vessels are considerably more productive/efficient than the ships they replace
and have the potential to create over-capacity – but they also draw on a
different cargo pool and add value.
2) Many traditional break-bulk lines missed or misread the opportunity and have
effectively abandoned the market to a new breed of logistics based project carriers.
Memo – Possible trend towards more vessel pooling, joint services - & even
consolidation? – amongst the leading project carriers.
3) Through investment in new ships & methods, project carriers have created a partially
insulated niche within the break-bulk market, resulting in higher rates, higher profits
and differentiated products/services. Memo – Can this insulation survive the
global down-turn and extra modal competition?
4) Demand for project cargoes lags the general cargo market but over time is less
volatile. Memo – a sustained period of firm rates may be necessary before we
see any return to the peak rates, as happened in 2003-07