Embed Size (px)
Citation preview
Transposon insertion site profiling chip (TIP-chip)Sarah J. Wheelan†, Lisa Z. Scheifele†, Francisco Martinez-Murillo†, Rafael A. Irizarry‡§, and Jef D. Boeke†§
†High Throughput Biology Center and Department of Molecular Biology and Genetics, Johns Hopkins University School of Medicine,Baltimore, MD 21205; and ‡Department of Biostatistics, Johns Hopkins Bloomberg School of Public Health, Baltimore, MD 21205
Edited by Susan R. Wessler, University of Georgia, Athens, GA, and approved September 19, 2006 (received for review June 29, 2006)
Mobile elements are important components of our genomes, withdiverse and significant effects on phenotype. Not only can trans-posons inactivate genes by direct disruption and shuffle thegenome through recombination, they can also alter gene expres-sion subtly or powerfully. Currently active transposons are highlypolymorphic in host populations, including, among hundreds ofothers, L1 and Alu elements in humans and Ty1 elements in yeast.For this reason, we wished to develop a simple genome-widemethod for identifying all transposons in any given sample. Wehave designed a transposon insertion site profiling chip (TIP-chip),a microarray intended for use as a high-throughput technique formapping transposon insertions. By selectively amplifying transpo-son flanking regions and hybridizing them to the array, we canlocate all transposons present in a sample. We have tested theTIP-chip extensively to map Ty1 retrotransposon insertions in yeastand have achieved excellent results in two laboratory strains aswell as in evolved Ty1 high-copy strains. We are able to identify allof the theoretically detectable transposons in the FY2 lab strain,with essentially no false positives. In addition, we mapped manynew transposon copies in the high-copy Ty1 strain and determinedits Ty1 insertion pattern.
evolution � microarray � yeast � Ty1 � integration
Transposable elements share one characteristic: they are ableto physically move about their host genome, either by a
cut-and-paste mechanism (most DNA transposons) or by acopy-and-paste process involving an RNA intermediate (retro-transposons). Occupying various and often substantial fractionsof nearly every genome studied to date [human, 45% (1);chicken, 4.3% (2); mouse, 38% (3); yeast, 3% (4); maize, �60%(5), for example], transposons are under intense scrutiny as theircomplex contributions to evolutionary history are revealedthrough genome sequencing. It is clear that transposons havemany effects on their host genomes: they can physically disruptand potentially inactivate or alter genes upon transposition;mediate genome rearrangements once in place; and can affectgene expression in many ways, including enabling alternativesplicing, triggering premature transcript termination, and facil-itating gene breaking (for reviews see refs. 6 and 7). Importantly,transposon phenotypes do not require disruption of codingsequences. Defective or evolutionarily divergent elements suchas the L1 element in humans (1, 8, 9) can also have profoundeffects.
The Saccharomyces cerevisiae Ty1 element is a well studiedLTR-containing retrotransposon present in 20–30 copies intypical laboratory yeast strains (4, 10). This high copy numbermay result from the evolution of yeast and its population ofretrotransposons under laboratory conditions; most wild yeaststrains typically harbor lower Ty1 copy numbers (10–12).
Knowing all transposon insertion sites in a sample is very useful.First, such a method would be useful for studying transposonecology, quickly addressing questions related to insertion sitepreference and the locations of transposon ‘‘hotspots’’ or ‘‘coldspots’’ in a genome. Second, studies of transposon evolution couldbenefit from a simple way to comprehensively scan the host genomefor transposon locations. Third, individuals of the same species maycarry varying transposon burdens; variations in transposon com-
plement may be important factors in population dynamics and inphenotypes such as disease susceptibility.
We describe here a transposon insertion site profiling chip(TIP-chip), a custom tiling microarray-based strategy to searchfor transposons in either regions of interest or throughout anentire genome. By digesting sample genomic DNA, ligating tovectorettes, amplifying with a transposon-specific primer, f luo-rescently labeling the products, and hybridizing them to theTIP-chip, one can identify all sequences that flank the transpo-son being examined. Then, transposon profiles of differentsamples can be compared.
As a test of the TIP-chip strategy, we created a genomic tilingmicroarray for S. cerevisiae and used this to identify all Ty1retrotransposons in two common lab strains and an experimen-tally derived Ty1 high-copy strain. We were able to correctlydetermine the locations of 94% of the known Ty1 elements in theS288C-derived FY2 strain, and identified 2 Ty1s not reported inthe S288C DNA sequence. In addition, we examined the trans-poson profile of the L27-10 Ty1 high-copy strain. Comparing itwith its parental strain GRF167, we observe at least 39 new Ty1insertion sites, and we find that the population of new Ty1insertions that occurred during the evolution of this strain islocated largely (78%) within 2 kb of tRNA genes. Also, we foundevidence in the high-copy strain for at least seven target regionsin which multiple Ty1 elements were inserted, consistent with theexistence of a limited number of high frequency target regionsin the yeast genome (13).
ResultsSupporting Information. For further details, see Tables 2 and 3,Figs. 5–7, and Supporting Text, which are published as supportinginformation on the PNAS web site.
In Silico Design to Allow Comprehensive Amplification of the YeastGenome. The DNA amplification protocol was designed based onthe need to represent as much of the yeast genome as possiblein the form of at least one fragment �1 kb long (allowinghybridization to multiple features on the TIP-chip, therebyincreasing the statistical significance of positive signals) and �10kb long (to maximize the yield of DNA amplified by the PCR).This was modeled by evaluating all possible two- and three-waymixtures of restriction digests of the actual yeast genomicsequence in silico chosen from a list of enzymes that generatesticky ends and cut Ty1 once or twice in appropriate regions,allowing the design of useful primers; enzymes also had to beefficient and cost-effective. Yeast genomic DNA was digested in
Author contributions: S.J.W. and J.D.B. designed research; S.J.W., L.Z.S., and F.M.-M.performed research; S.J.W., L.Z.S., F.M.-M., and R.A.I. contributed new reagents�analytictools; S.J.W., L.Z.S., F.M.-M., R.A.I., and J.D.B. analyzed data; and S.J.W. wrote the paper.
The authors declare no conflict of interest.
This article is a PNAS direct submission.
Abbreviations: TIP, transposon insertion site profiling; SGD, Saccharomyces Genome Da-tabase.
Data deposition: The data reported in this paper have been deposited in the GeneExpression Omnibus (GEO) database, www.ncbi.nlm.nih.gov/geo (accession no. GSE5646).
§To whom correspondence may be addressed. E-mail: [email protected] or [email protected].
© 2006 by The National Academy of Sciences of the USA
17632–17637 � PNAS � November 21, 2006 � vol. 103 � no. 47 www.pnas.org�cgi�doi�10.1073�pnas.0605450103
Dow
nloa
ded
by g
uest
on
Janu
ary
30, 2
020
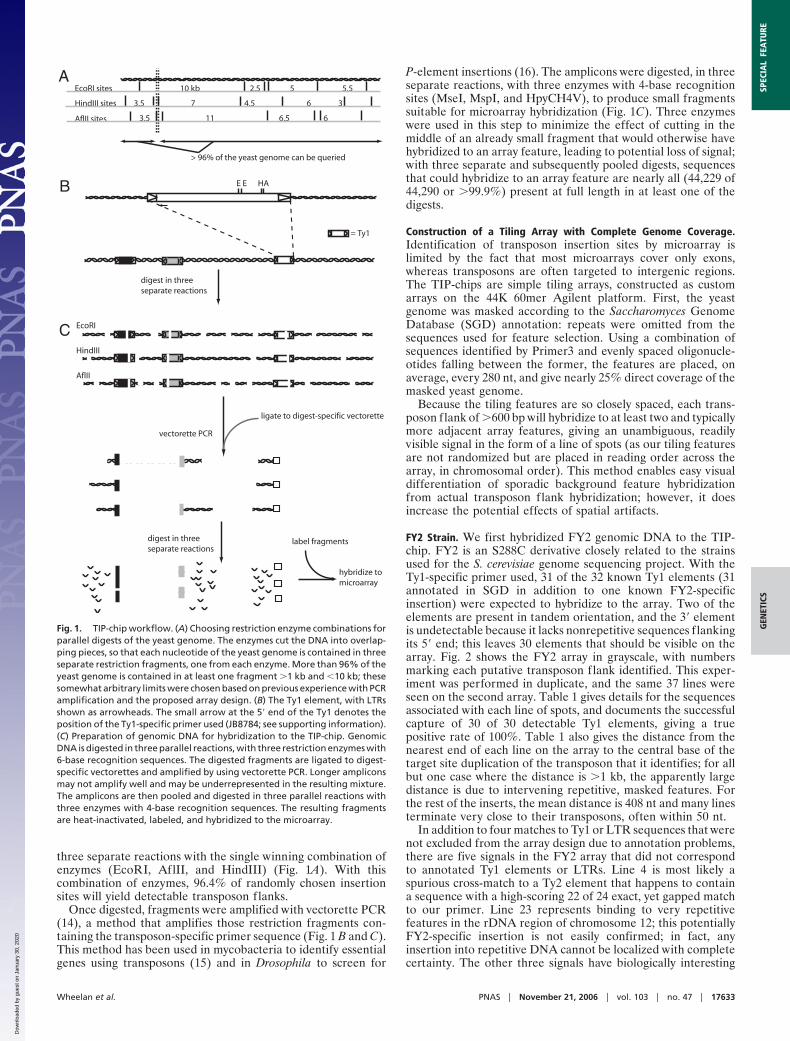
three separate reactions with the single winning combination ofenzymes (EcoRI, AflII, and HindIII) (Fig. 1A). With thiscombination of enzymes, 96.4% of randomly chosen insertionsites will yield detectable transposon flanks.
Once digested, fragments were amplified with vectorette PCR(14), a method that amplifies those restriction fragments con-taining the transposon-specific primer sequence (Fig. 1 B and C).This method has been used in mycobacteria to identify essentialgenes using transposons (15) and in Drosophila to screen for
P-element insertions (16). The amplicons were digested, in threeseparate reactions, with three enzymes with 4-base recognitionsites (MseI, MspI, and HpyCH4V), to produce small fragmentssuitable for microarray hybridization (Fig. 1C). Three enzymeswere used in this step to minimize the effect of cutting in themiddle of an already small fragment that would otherwise havehybridized to an array feature, leading to potential loss of signal;with three separate and subsequently pooled digests, sequencesthat could hybridize to an array feature are nearly all (44,229 of44,290 or �99.9%) present at full length in at least one of thedigests.
Construction of a Tiling Array with Complete Genome Coverage.Identification of transposon insertion sites by microarray islimited by the fact that most microarrays cover only exons,whereas transposons are often targeted to intergenic regions.The TIP-chips are simple tiling arrays, constructed as customarrays on the 44K 60mer Agilent platform. First, the yeastgenome was masked according to the Saccharomyces GenomeDatabase (SGD) annotation: repeats were omitted from thesequences used for feature selection. Using a combination ofsequences identified by Primer3 and evenly spaced oligonucle-otides falling between the former, the features are placed, onaverage, every 280 nt, and give nearly 25% direct coverage of themasked yeast genome.
Because the tiling features are so closely spaced, each trans-poson flank of �600 bp will hybridize to at least two and typicallymore adjacent array features, giving an unambiguous, readilyvisible signal in the form of a line of spots (as our tiling featuresare not randomized but are placed in reading order across thearray, in chromosomal order). This method enables easy visualdifferentiation of sporadic background feature hybridizationfrom actual transposon flank hybridization; however, it doesincrease the potential effects of spatial artifacts.
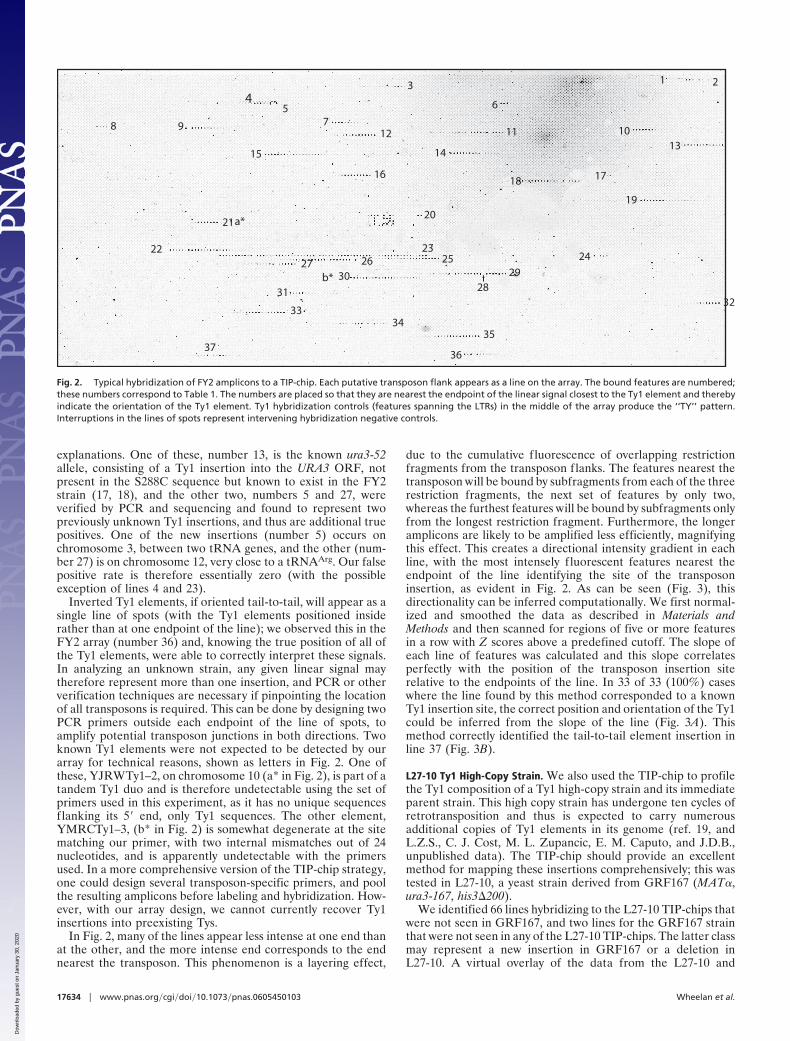
FY2 Strain. We first hybridized FY2 genomic DNA to the TIP-chip. FY2 is an S288C derivative closely related to the strainsused for the S. cerevisiae genome sequencing project. With theTy1-specific primer used, 31 of the 32 known Ty1 elements (31annotated in SGD in addition to one known FY2-specificinsertion) were expected to hybridize to the array. Two of theelements are present in tandem orientation, and the 3� elementis undetectable because it lacks nonrepetitive sequences flankingits 5� end; this leaves 30 elements that should be visible on thearray. Fig. 2 shows the FY2 array in grayscale, with numbersmarking each putative transposon flank identified. This exper-iment was performed in duplicate, and the same 37 lines wereseen on the second array. Table 1 gives details for the sequencesassociated with each line of spots, and documents the successfulcapture of 30 of 30 detectable Ty1 elements, giving a truepositive rate of 100%. Table 1 also gives the distance from thenearest end of each line on the array to the central base of thetarget site duplication of the transposon that it identifies; for allbut one case where the distance is �1 kb, the apparently largedistance is due to intervening repetitive, masked features. Forthe rest of the inserts, the mean distance is 408 nt and many linesterminate very close to their transposons, often within 50 nt.
In addition to four matches to Ty1 or LTR sequences that werenot excluded from the array design due to annotation problems,there are five signals in the FY2 array that did not correspondto annotated Ty1 elements or LTRs. Line 4 is most likely aspurious cross-match to a Ty2 element that happens to containa sequence with a high-scoring 22 of 24 exact, yet gapped matchto our primer. Line 23 represents binding to very repetitivefeatures in the rDNA region of chromosome 12; this potentiallyFY2-specific insertion is not easily confirmed; in fact, anyinsertion into repetitive DNA cannot be localized with completecertainty. The other three signals have biologically interesting
= Ty1
digest in threeseparate reactions
vectorette PCR
digest in threeseparate reactions
hybridize tomicroarray
ligate to digest-specific vectorette
label fragments
EcoRI
HindIII
AflII
E E HA
10 kb 2.5 5 5.5EcoRI sites
HindIII sites 3.5 7 4.5 6 3
AflII sites 3.5 11 6.5 6
> 96% of the yeast genome can be queried
A
B
C
Fig. 1. TIP-chip workflow. (A) Choosing restriction enzyme combinations forparallel digests of the yeast genome. The enzymes cut the DNA into overlap-ping pieces, so that each nucleotide of the yeast genome is contained in threeseparate restriction fragments, one from each enzyme. More than 96% of theyeast genome is contained in at least one fragment �1 kb and �10 kb; thesesomewhat arbitrary limits were chosen based on previous experience with PCRamplification and the proposed array design. (B) The Ty1 element, with LTRsshown as arrowheads. The small arrow at the 5� end of the Ty1 denotes theposition of the Ty1-specific primer used (JB8784; see supporting information).(C) Preparation of genomic DNA for hybridization to the TIP-chip. GenomicDNA is digested in three parallel reactions, with three restriction enzymes with6-base recognition sequences. The digested fragments are ligated to digest-specific vectorettes and amplified by using vectorette PCR. Longer ampliconsmay not amplify well and may be underrepresented in the resulting mixture.The amplicons are then pooled and digested in three parallel reactions withthree enzymes with 4-base recognition sequences. The resulting fragmentsare heat-inactivated, labeled, and hybridized to the microarray.
Wheelan et al. PNAS � November 21, 2006 � vol. 103 � no. 47 � 17633
GEN
ETIC
SSP
ECIA
LFE
ATU
RE
Dow
nloa
ded
by g
uest
on
Janu
ary
30, 2
020
explanations. One of these, number 13, is the known ura3-52allele, consisting of a Ty1 insertion into the URA3 ORF, notpresent in the S288C sequence but known to exist in the FY2strain (17, 18), and the other two, numbers 5 and 27, wereverified by PCR and sequencing and found to represent twopreviously unknown Ty1 insertions, and thus are additional truepositives. One of the new insertions (number 5) occurs onchromosome 3, between two tRNA genes, and the other (num-ber 27) is on chromosome 12, very close to a tRNAArg. Our falsepositive rate is therefore essentially zero (with the possibleexception of lines 4 and 23).
Inverted Ty1 elements, if oriented tail-to-tail, will appear as asingle line of spots (with the Ty1 elements positioned insiderather than at one endpoint of the line); we observed this in theFY2 array (number 36) and, knowing the true position of all ofthe Ty1 elements, were able to correctly interpret these signals.In analyzing an unknown strain, any given linear signal maytherefore represent more than one insertion, and PCR or otherverification techniques are necessary if pinpointing the locationof all transposons is required. This can be done by designing twoPCR primers outside each endpoint of the line of spots, toamplify potential transposon junctions in both directions. Twoknown Ty1 elements were not expected to be detected by ourarray for technical reasons, shown as letters in Fig. 2. One ofthese, YJRWTy1–2, on chromosome 10 (a* in Fig. 2), is part of atandem Ty1 duo and is therefore undetectable using the set ofprimers used in this experiment, as it has no unique sequencesflanking its 5� end, only Ty1 sequences. The other element,YMRCTy1–3, (b* in Fig. 2) is somewhat degenerate at the sitematching our primer, with two internal mismatches out of 24nucleotides, and is apparently undetectable with the primersused. In a more comprehensive version of the TIP-chip strategy,one could design several transposon-specific primers, and poolthe resulting amplicons before labeling and hybridization. How-ever, with our array design, we cannot currently recover Ty1insertions into preexisting Tys.
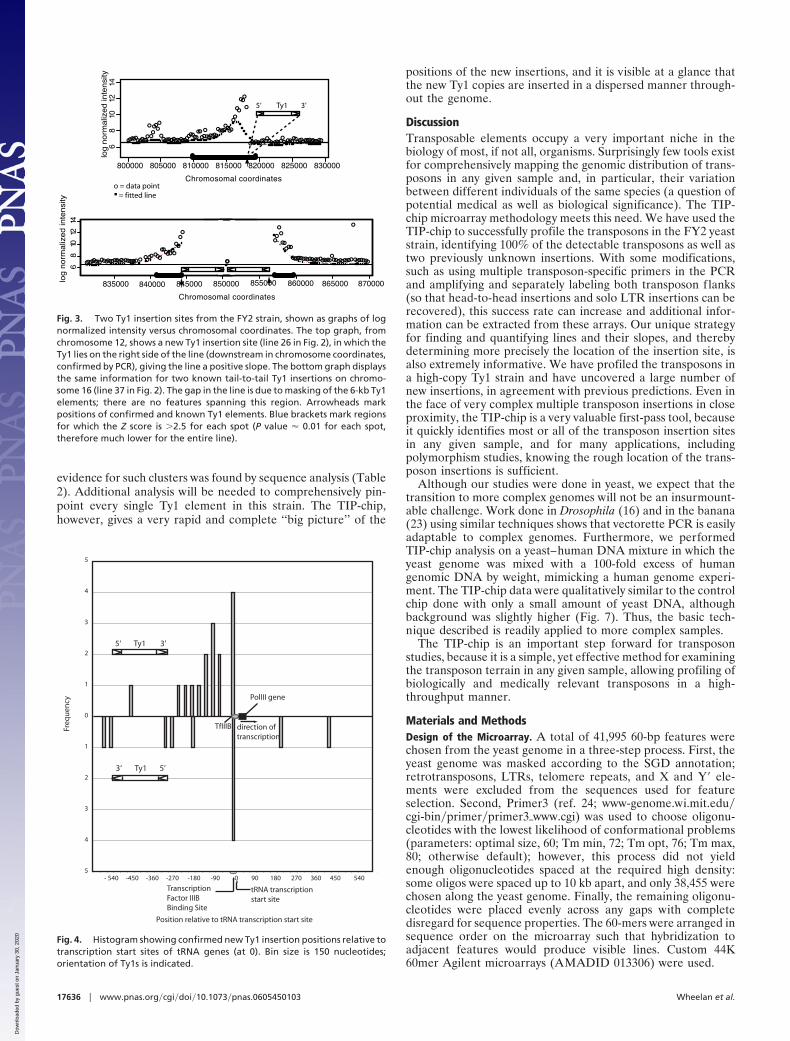
In Fig. 2, many of the lines appear less intense at one end thanat the other, and the more intense end corresponds to the endnearest the transposon. This phenomenon is a layering effect,
due to the cumulative fluorescence of overlapping restrictionfragments from the transposon flanks. The features nearest thetransposon will be bound by subfragments from each of the threerestriction fragments, the next set of features by only two,whereas the furthest features will be bound by subfragments onlyfrom the longest restriction fragment. Furthermore, the longeramplicons are likely to be amplified less efficiently, magnifyingthis effect. This creates a directional intensity gradient in eachline, with the most intensely fluorescent features nearest theendpoint of the line identifying the site of the transposoninsertion, as evident in Fig. 2. As can be seen (Fig. 3), thisdirectionality can be inferred computationally. We first normal-ized and smoothed the data as described in Materials andMethods and then scanned for regions of five or more featuresin a row with Z scores above a predefined cutoff. The slope ofeach line of features was calculated and this slope correlatesperfectly with the position of the transposon insertion siterelative to the endpoints of the line. In 33 of 33 (100%) caseswhere the line found by this method corresponded to a knownTy1 insertion site, the correct position and orientation of the Ty1could be inferred from the slope of the line (Fig. 3A). Thismethod correctly identified the tail-to-tail element insertion inline 37 (Fig. 3B).
L27-10 Ty1 High-Copy Strain. We also used the TIP-chip to profilethe Ty1 composition of a Ty1 high-copy strain and its immediateparent strain. This high copy strain has undergone ten cycles ofretrotransposition and thus is expected to carry numerousadditional copies of Ty1 elements in its genome (ref. 19, andL.Z.S., C. J. Cost, M. L. Zupancic, E. M. Caputo, and J.D.B.,unpublished data). The TIP-chip should provide an excellentmethod for mapping these insertions comprehensively; this wastested in L27-10, a yeast strain derived from GRF167 (MAT�,ura3-167, his3�200).
We identified 66 lines hybridizing to the L27-10 TIP-chips thatwere not seen in GRF167, and two lines for the GRF167 strainthat were not seen in any of the L27-10 TIP-chips. The latter classmay represent a new insertion in GRF167 or a deletion inL27-10. A virtual overlay of the data from the L27-10 and
13
5 6
78 10111213
1415
171618
1920
21
22 232527
2930
3132
3334
35
3637
28
2
a*
b*
9
2426
4
Fig. 2. Typical hybridization of FY2 amplicons to a TIP-chip. Each putative transposon flank appears as a line on the array. The bound features are numbered;these numbers correspond to Table 1. The numbers are placed so that they are nearest the endpoint of the linear signal closest to the Ty1 element and therebyindicate the orientation of the Ty1 element. Ty1 hybridization controls (features spanning the LTRs) in the middle of the array produce the ‘‘TY’’ pattern.Interruptions in the lines of spots represent intervening hybridization negative controls.
17634 � www.pnas.org�cgi�doi�10.1073�pnas.0605450103 Wheelan et al.
Dow
nloa
ded
by g
uest
on
Janu
ary
30, 2
020
GRF167 TIP-chips shows the signals that appear in one arrayand not the other (Fig. 5). Each signal in L27-10 not seen inGRF167 was examined in detail by PCR and sequence analyses(see supporting information for detail). In total, 66 insertionswere identified, this finding is in good agreement with real-timePCR experiments that predict this strain harbors �70 new Ty1elements (data not shown). The 66 insertions fell into threeclasses, sequence confirmed (24 or 36%), likely true positive (29or 44%) and likely false positive (20%). Although it is notpossible to definitively determine the false positive rate withouta complete genome sequence from this strain, the data suggesta true positive rate of 80%. Ty1 elements insert near RNA
polymerase III (polIII) transcripts (4, 20, 21); this is also true ofthe sequence-confirmed new copies of Ty1 that accumulate inthe high copy strain, as 92% of these are within 2 kb of a polIIIgene. Interestingly, one of these insertions hit SNR52, the onlysnoRNA transcribed by polIII in yeast (22). Table 2 details thelocations of all 66 new insertions. Fig. 4 displays all sequence-confirmed insertions within 600 nt of polIII-transcribed targetgenes; nearly all insertions fall upstream of these targets.
Seven of the previously unidentified PCR-amplified insertionswere actually positioned in the middle of the line seen on thearray; those signals are presumed to represent flanks frommultiple Ty1 elements inserted in close genomic proximity,
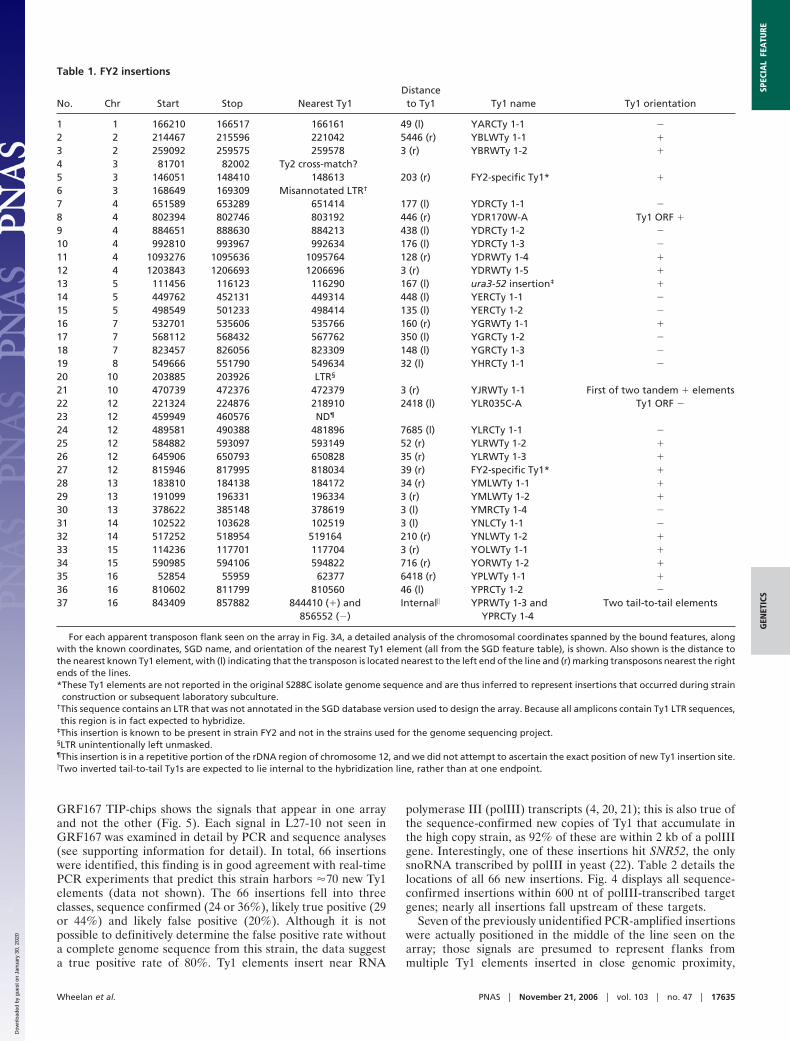
Table 1. FY2 insertions
No. Chr Start Stop Nearest Ty1Distanceto Ty1 Ty1 name Ty1 orientation
1 1 166210 166517 166161 49 (l) YARCTy 1-1 �
2 2 214467 215596 221042 5446 (r) YBLWTy 1-1 �
3 2 259092 259575 259578 3 (r) YBRWTy 1-2 �
4 3 81701 82002 Ty2 cross-match?5 3 146051 148410 148613 203 (r) FY2-specific Ty1* �
6 3 168649 169309 Misannotated LTR†
7 4 651589 653289 651414 177 (l) YDRCTy 1-1 �
8 4 802394 802746 803192 446 (r) YDR170W-A Ty1 ORF �
9 4 884651 888630 884213 438 (l) YDRCTy 1-2 �
10 4 992810 993967 992634 176 (l) YDRCTy 1-3 �
11 4 1093276 1095636 1095764 128 (r) YDRWTy 1-4 �
12 4 1203843 1206693 1206696 3 (r) YDRWTy 1-5 �
13 5 111456 116123 116290 167 (l) ura3-52 insertion‡ �
14 5 449762 452131 449314 448 (l) YERCTy 1-1 �
15 5 498549 501233 498414 135 (l) YERCTy 1-2 �
16 7 532701 535606 535766 160 (r) YGRWTy 1-1 �
17 7 568112 568432 567762 350 (l) YGRCTy 1-2 �
18 7 823457 826056 823309 148 (l) YGRCTy 1-3 �
19 8 549666 551790 549634 32 (l) YHRCTy 1-1 �
20 10 203885 203926 LTR§
21 10 470739 472376 472379 3 (r) YJRWTy 1-1 First of two tandem � elements22 12 221324 224876 218910 2418 (l) YLR035C-A Ty1 ORF �
23 12 459949 460576 ND¶
24 12 489581 490388 481896 7685 (l) YLRCTy 1-1 �
25 12 584882 593097 593149 52 (r) YLRWTy 1-2 �
26 12 645906 650793 650828 35 (r) YLRWTy 1-3 �
27 12 815946 817995 818034 39 (r) FY2-specific Ty1* �
28 13 183810 184138 184172 34 (r) YMLWTy 1-1 �
29 13 191099 196331 196334 3 (r) YMLWTy 1-2 �
30 13 378622 385148 378619 3 (l) YMRCTy 1-4 �
31 14 102522 103628 102519 3 (l) YNLCTy 1-1 �
32 14 517252 518954 519164 210 (r) YNLWTy 1-2 �
33 15 114236 117701 117704 3 (r) YOLWTy 1-1 �
34 15 590985 594106 594822 716 (r) YORWTy 1-2 �
35 16 52854 55959 62377 6418 (r) YPLWTy 1-1 �
36 16 810602 811799 810560 46 (l) YPRCTy 1-2 �
37 16 843409 857882 844410 (�) and856552 (�)
Internal� YPRWTy 1-3 andYPRCTy 1-4
Two tail-to-tail elements
For each apparent transposon flank seen on the array in Fig. 3A, a detailed analysis of the chromosomal coordinates spanned by the bound features, alongwith the known coordinates, SGD name, and orientation of the nearest Ty1 element (all from the SGD feature table), is shown. Also shown is the distance tothe nearest known Ty1 element, with (l) indicating that the transposon is located nearest to the left end of the line and (r) marking transposons nearest the rightends of the lines.*These Ty1 elements are not reported in the original S288C isolate genome sequence and are thus inferred to represent insertions that occurred during strainconstruction or subsequent laboratory subculture.
†This sequence contains an LTR that was not annotated in the SGD database version used to design the array. Because all amplicons contain Ty1 LTR sequences,this region is in fact expected to hybridize.
‡This insertion is known to be present in strain FY2 and not in the strains used for the genome sequencing project.§LTR unintentionally left unmasked.¶This insertion is in a repetitive portion of the rDNA region of chromosome 12, and we did not attempt to ascertain the exact position of new Ty1 insertion site.�Two inverted tail-to-tail Ty1s are expected to lie internal to the hybridization line, rather than at one endpoint.
Wheelan et al. PNAS � November 21, 2006 � vol. 103 � no. 47 � 17635
GEN
ETIC
SSP
ECIA
LFE
ATU
RE
Dow
nloa
ded
by g
uest
on
Janu
ary
30, 2
020
evidence for such clusters was found by sequence analysis (Table2). Additional analysis will be needed to comprehensively pin-point every single Ty1 element in this strain. The TIP-chip,however, gives a very rapid and complete ‘‘big picture’’ of the
positions of the new insertions, and it is visible at a glance thatthe new Ty1 copies are inserted in a dispersed manner through-out the genome.
DiscussionTransposable elements occupy a very important niche in thebiology of most, if not all, organisms. Surprisingly few tools existfor comprehensively mapping the genomic distribution of trans-posons in any given sample and, in particular, their variationbetween different individuals of the same species (a question ofpotential medical as well as biological significance). The TIP-chip microarray methodology meets this need. We have used theTIP-chip to successfully profile the transposons in the FY2 yeaststrain, identifying 100% of the detectable transposons as well astwo previously unknown insertions. With some modifications,such as using multiple transposon-specific primers in the PCRand amplifying and separately labeling both transposon flanks(so that head-to-head insertions and solo LTR insertions can berecovered), this success rate can increase and additional infor-mation can be extracted from these arrays. Our unique strategyfor finding and quantifying lines and their slopes, and therebydetermining more precisely the location of the insertion site, isalso extremely informative. We have profiled the transposons ina high-copy Ty1 strain and have uncovered a large number ofnew insertions, in agreement with previous predictions. Even inthe face of very complex multiple transposon insertions in closeproximity, the TIP-chip is a very valuable first-pass tool, becauseit quickly identifies most or all of the transposon insertion sitesin any given sample, and for many applications, includingpolymorphism studies, knowing the rough location of the trans-poson insertions is sufficient.
Although our studies were done in yeast, we expect that thetransition to more complex genomes will not be an insurmount-able challenge. Work done in Drosophila (16) and in the banana(23) using similar techniques shows that vectorette PCR is easilyadaptable to complex genomes. Furthermore, we performedTIP-chip analysis on a yeast–human DNA mixture in which theyeast genome was mixed with a 100-fold excess of humangenomic DNA by weight, mimicking a human genome experi-ment. The TIP-chip data were qualitatively similar to the controlchip done with only a small amount of yeast DNA, althoughbackground was slightly higher (Fig. 7). Thus, the basic tech-nique described is readily applied to more complex samples.
The TIP-chip is an important step forward for transposonstudies, because it is a simple, yet effective method for examiningthe transposon terrain in any given sample, allowing profiling ofbiologically and medically relevant transposons in a high-throughput manner.
Materials and MethodsDesign of the Microarray. A total of 41,995 60-bp features werechosen from the yeast genome in a three-step process. First, theyeast genome was masked according to the SGD annotation;retrotransposons, LTRs, telomere repeats, and X and Y� ele-ments were excluded from the sequences used for featureselection. Second, Primer3 (ref. 24; www-genome.wi.mit.edu�cgi-bin�primer�primer3�www.cgi) was used to choose oligonu-cleotides with the lowest likelihood of conformational problems(parameters: optimal size, 60; Tm min, 72; Tm opt, 76; Tm max,80; otherwise default); however, this process did not yieldenough oligonucleotides spaced at the required high density:some oligos were spaced up to 10 kb apart, and only 38,455 werechosen along the yeast genome. Finally, the remaining oligonu-cleotides were placed evenly across any gaps with completedisregard for sequence properties. The 60-mers were arranged insequence order on the microarray such that hybridization toadjacent features would produce visible lines. Custom 44K60mer Agilent microarrays (AMADID 013306) were used.
•••••••••••••••••••••••••••••••••••••••
•••••••••••••••••••••••••••
••••••••••••••••••••••••••••••••••••••••
800000 805000 810000 815000 820000 825000 830000
68
0121
41lo
g n
orm
aliz
ed
inte
nsi
ty
Chromosomal coordinates
•
•••••••••••••••••••••••••••••••••••••••
•
•••••••
850000 855000 860000 865000 870000
•••••••••••••••••••••••••••••••••••••••••••••
•
835000 840000 845000
68
0121
41
Chromosomal coordinates
log
no
rma
lize
d in
ten
sity
5‘ Ty1 3’
o = data point = fitted line
Fig. 3. Two Ty1 insertion sites from the FY2 strain, shown as graphs of lognormalized intensity versus chromosomal coordinates. The top graph, fromchromosome 12, shows a new Ty1 insertion site (line 26 in Fig. 2), in which theTy1 lies on the right side of the line (downstream in chromosome coordinates,confirmed by PCR), giving the line a positive slope. The bottom graph displaysthe same information for two known tail-to-tail Ty1 insertions on chromo-some 16 (line 37 in Fig. 2). The gap in the line is due to masking of the 6-kb Ty1elements; there are no features spanning this region. Arrowheads markpositions of confirmed and known Ty1 elements. Blue brackets mark regionsfor which the Z score is �2.5 for each spot (P value � 0.01 for each spot,therefore much lower for the entire line).
0
1
2
3
4
5
- 540 -450 -360 -270 -180 -90 0 90 180 270 360 450 540
5
4
3
2
1
0
1
2
3
4
5
Position relative to tRNA transcription start site
Freq
uen
cy
5‘ Ty1 3’
3‘ Ty1 5’
tRNA transcriptionstart site
TranscriptionFactor IIIBBinding Site
{
TfIIIB
PolIII gene
direction of transcription
Fig. 4. Histogram showing confirmed new Ty1 insertion positions relative totranscription start sites of tRNA genes (at 0). Bin size is 150 nucleotides;orientation of Ty1s is indicated.
17636 � www.pnas.org�cgi�doi�10.1073�pnas.0605450103 Wheelan et al.
Dow
nloa
ded
by g
uest
on
Janu
ary
30, 2
020
Amplification of Transposon Flanking Fragments. We followed thebasic vectorette protocol first described in Riley et al. (14). Yeastgenomic DNA, prepared as described by Yuan et al. (25), wastreated with RNase, if necessary, and 20 �g of gDNA wasimmediately digested with EcoRI, AflII, and HindIII in threeseparate 250-�l reactions. After digestion, the fragments wereheat-inactivated at 65°C for 20 min and then ligated to theannealed vectorette primers (JB9408, common to all reactions,JB9409 for the EcoRI fragments, JB9487 for the AflII frag-ments, and JB9488 for the HindIII reaction). See supportinginformation for primer sequences. After ligation, the fragmentswere amplified by using the vectorette primer, JB9410, and alsothe Ty1-specific primer, JB8784, complementary to sequencesadjacent to the 5� LTR.
The amplified Ty1-adjacent fragments were pooled and di-gested in three parallel reactions with MseI, MspI, andHpyCH4V. The digests were heat inactivated and then pooledand labeled for use on the microarray. The products werepurified and concentrated on a Microcon column (Amicon,Millipore, Bedford, MA), boiled, and spotted onto microarraysand covered with coverslips. The microarrays were hybridizedovernight and washed in 2� SSC, 0.03% SDS for 5 min at 65°C,then in 1� SSC for 5 min at room temperature, and finally in0.2� SSC for 5 min at room temperature. Microarrays wereallowed to air dry and then were scanned in a GenePix 4000Bscanner from Axon Instruments (Sunnyvale, CA), using GenePixPro 5.1 software.
Microarray Analysis: Finding and Quantifying Lines. Two methods(outlined in more detail in supporting information) were used todefine lines of spots that were above the background. In analysismethod 1, we simply looked at the F635 median–B635 mediandifference and empirically set a cutoff defining hybridized vs.unhybridized features. We then scanned the data in order of ID(which is the same as chromosomal coordinates) and looked forthree or more features in a row above the cutoff, with fewer thantwo intervening features below the cutoff. In analysis method 2,we first normalized the data to minimize spatial effects. We tookadvantage of the fact that there should be no lines of featureswith high intensity in the vertical dimension and estimatedspatial biases by fitting a loess curve to the log intensity versuscolumn number (horizontal dimension) scatterplot. We did this
for each row and used the residuals as the normalized data.Because amplified probes are expected only in the horizontaldimension, features related to amplified regions will appear asoutliers in the log-intensity versus column number plots and thusignored by loess (a robust procedure). We added back themedian log intensity of the original data to keep it in the originalscale.
The features were naturally segmented across chromosomesby the repeat masking performed during the construction of thearray. To reduce noise, we smoothed the data in each chromo-somal segment (in the horizontal dimension) by using a runningwindow of ten features and averaging each window using loessto remove outliers.
Empirical densities of the log intensity smoothed data (notshown) showed that the log-intensity data were normally dis-tributed with the exception of a few outliers. These outliers, ofcourse, are related to the feature of interest. Therefore, weassumed that log-intensities associated with unamplified regionsfollowed a normal distribution. We refer to this as the nulldistribution. Because of the outliers, we estimated the mean andvariance of this distribution with the robust summary statistics:the median and MAD (median absolute distance) of the logintensities. With the null-distribution properly estimated, wewere then able to covert the smoothed log-intensity data into Zscores (subtract the mean and divide by the standard deviation).
Scanning the data once more, we looked for regions of five ormore features in a row with Z scores above a predefined cutoff(we used 2.5, which roughly corresponds to a marginal P valueof 0.01). The slope of each line of features was then calculated;positive slopes correspond to Ty1 elements on the plus strand,negative slopes correspond to Ty1 features on the minus strand,and near-zero slopes indicate tail-to-tail inverted Ty1 pairs.
Note Added in Proof. A similar method for mapping transposoninsertion sites was independently developed by Gabriel and colleagues(A. Gabriel, J. Dapprich, M. Kunkel, D. Gresham, S. Pratt, and M.Dunham, personal communication).
S.J.W. was supported by National Institutes of Health (NIH) TrainingGrant CA009139. L.Z.S. is a Robert Black Fellow of the Damon RunyonCancer Research Foundation (DRG-1858-05). This work was supportedin part by NIH Grants GM36481 and CA16519 (to J.D.B.).
1. Lander ES, Linton LM, Birren B, Nusbaum C, Zody MC, Baldwin J, Devon K,Dewar K, Doyle M, FitzHugh W, et al. (2001) Nature 409:860–921.
2. Wicker T, Robertson JS, Schulze SR, Feltus FA, Magrini V, Morrison JA,Mardis ER, Wilson RK, Peterson DG, Paterson AH, et al. (2005) Genome Res15:126–136.
3. Waterston RH, Lindblad-Toh K, Birney E, Rogers J, Abril JF, Agarwal P,Agarwala R, Ainscough R, Alexandersson M, An P, et al. (2002) Nature420:520–562.
4. Kim JM, Vanguri S, Boeke JD, Gabriel A, Voytas DF (1998) Genome Res8:464–478.
5. Messing J, Dooner HK (2006) Curr Opin Plant Biol 9:157–163.6. Han JS, Boeke JD (2005) BioEssays 27:775–784.7. Kazazian, HH, Jr (2004) Science 303:1626–1632.8. Szak ST, Pickeral OK, Makalowski W, Boguski MS, Landsman D, Boeke JD
(2002) Genome Biol 3:research0052.9. Boissinot S, Chevret P, Furano AV (2000) Mol Biol Evol 17:915–928.
10. Liti G, Peruffo A, James SA, Roberts IN, Louis EJ (2005) Yeast22:177–192.
11. Eibel H, Gafner J, Stotz A, Philippsen P (1981) Cold Spring Harbor Symp QuantBiol 45:609–617.
12. Sniegowski PD, Dombrowski PG, Fingerman E (2002) FEMS Yeast Res1:299–306.
13. Bachman N, Eby Y, Boeke JD (2004) Genome Res 14:1232–1247.14. Riley J, Butler R, Ogilvie D, Finniear R, Jenner D, Powell S, Anand R, Smith
JC, Markham AF (1990) Nucleic Acids Res 18:2887–2890.15. Sassetti CM, Boyd DH, Rubin EJ (2001) Proc Natl Acad Sci USA 98:12712–
12717.16. Eggert H, Bergemann K, Saumweber H (1998) Genetics 149:1427–1434.17. Winston F, Dollard C, Ricupero-Hovasse SL (1995) Yeast 11:53–55.18. Rose M, Winston F (1984) Mol Gen Genet 193:557–560.19. Boeke JD, Eichinger DJ, Natsoulis G (1991) Genetics 129:1043–1052.20. Ji H, Moore DP, Blomberg MA, Braiterman LT, Voytas DF, Natsoulis G,
Boeke JD (1993) Cell 73:1007–1018.21. Devine SE, Boeke JD (1996) Genes Dev 10:620–633.22. Harismendy O, Gendrel CG, Soularue P, Gidrol X, Sentenac A, Werner M,
Lefebvre O (2003) EMBO J 22:4738–4747.23. Perez-Hernandez JB, Swennen R, Sagi L (2006) Transgenic Res 15:139–150.24. Rozen S, Skaletsky H (2000) Methods Mol Biol 132:365–386.25. Yuan DS, Pan X, Ooi SL, Peyser BD, Spencer FA, Irizarry RA, Boeke JD
(2005) Nucleic Acids Res 33:e103.
Wheelan et al. PNAS � November 21, 2006 � vol. 103 � no. 47 � 17637
GEN
ETIC
SSP
ECIA
LFE
ATU
RE
Dow
nloa
ded
by g
uest
on
Janu
ary
30, 2
020