Embed Size (px)
Citation preview
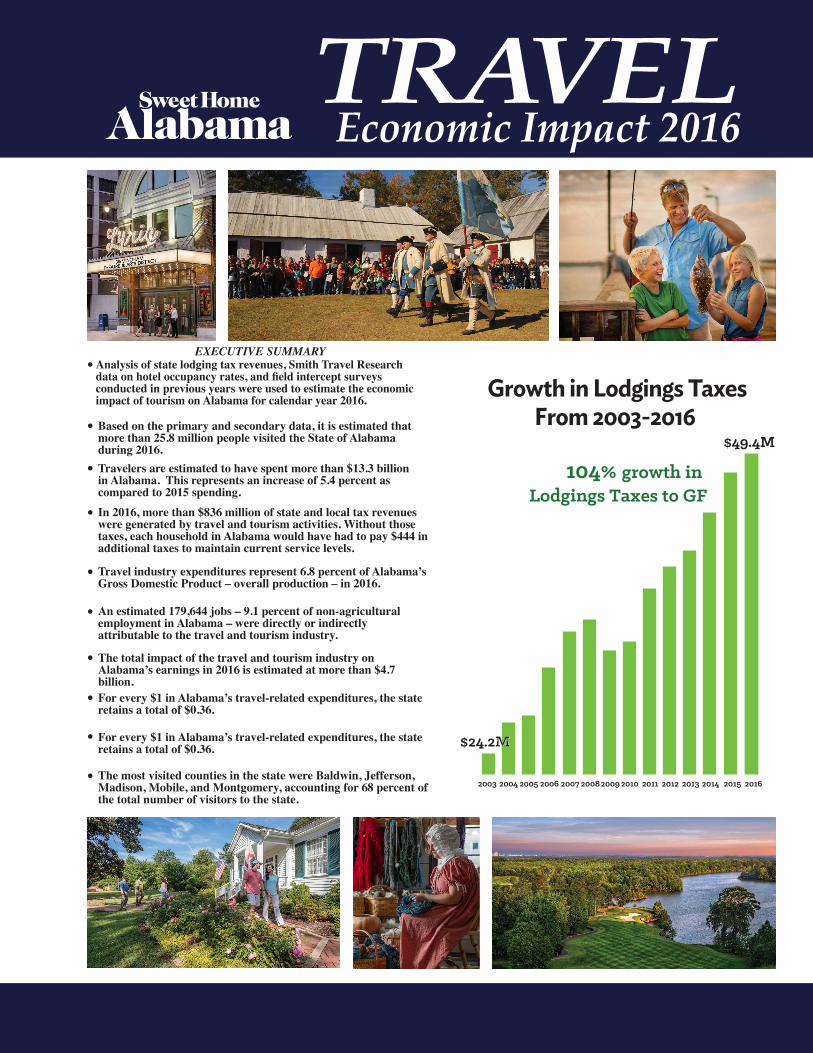
TRAVELEconomic Impact 2016
In 2016, more than $836 million of state and local tax revenues were generated by travel and tourism activities. Without those taxes, each household in Alabama would have had to pay $444 in additional taxes to maintain current service levels.
Travel industry expenditures represent 6.8 percent of Alabama’s Gross Domestic Product – overall production – in 2016.
Analysis of state lodging tax revenues, Smith Travel Research data on hotel occupancy rates, and field intercept surveys conducted in previous years were used to estimate the economic impact of tourism on Alabama for calendar year 2016.
Based on the primary and secondary data, it is estimated that more than 25.8 million people visited the State of Alabama during 2016.Travelers are estimated to have spent more than $13.3 billion in Alabama. This represents an increase of 5.4 percent as compared to 2015 spending.
An estimated 179,644 jobs – 9.1 percent of non-agricultural employment in Alabama – were directly or indirectly attributable to the travel and tourism industry.
The total impact of the travel and tourism industry on Alabama’s earnings in 2016 is estimated at more than $4.7 billion.For every $1 in Alabama’s travel-related expenditures, the state retains a total of $0.36.
For every $1 in Alabama’s travel-related expenditures, the state retains a total of $0.36.
The most visited counties in the state were Baldwin, Jefferson, Madison, Mobile, and Montgomery, accounting for 68 percent of the total number of visitors to the state.
EXECUTIVE SUMMARY•
•
•
•
•
•
•
•
•
•
Growth in Lodgings TaxesFrom 2003-2016
2003
$24.2M
$49.4M
2004 2005 2006 2007 20082009 2010 2011 2012 2013 2014 2015 2016
104% growth in Lodgings Taxes to GF
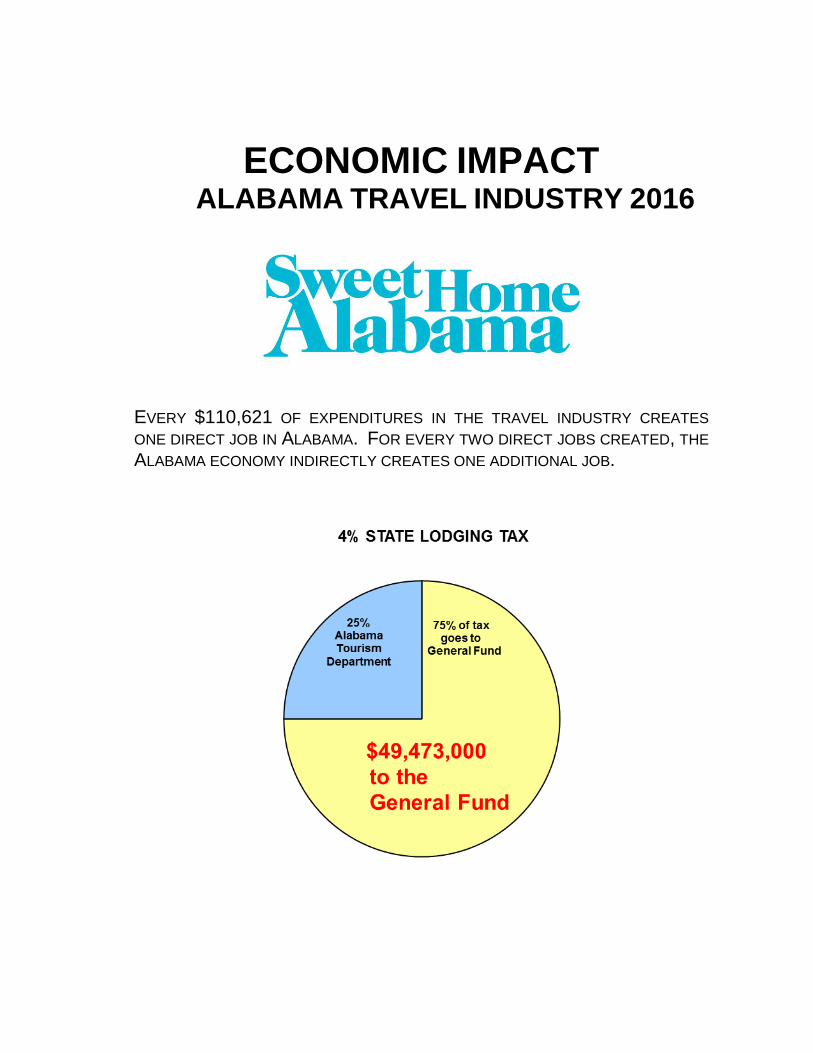
ECONOMIC IMPACT ALABAMA TRAVEL INDUSTRY 2016
EVERY $110,621 OF EXPENDITURES IN THE TRAVEL INDUSTRY CREATES
ONE DIRECT JOB IN ALABAMA. FOR EVERY TWO DIRECT JOBS CREATED, THE
ALABAMA ECONOMY INDIRECTLY CREATES ONE ADDITIONAL JOB.
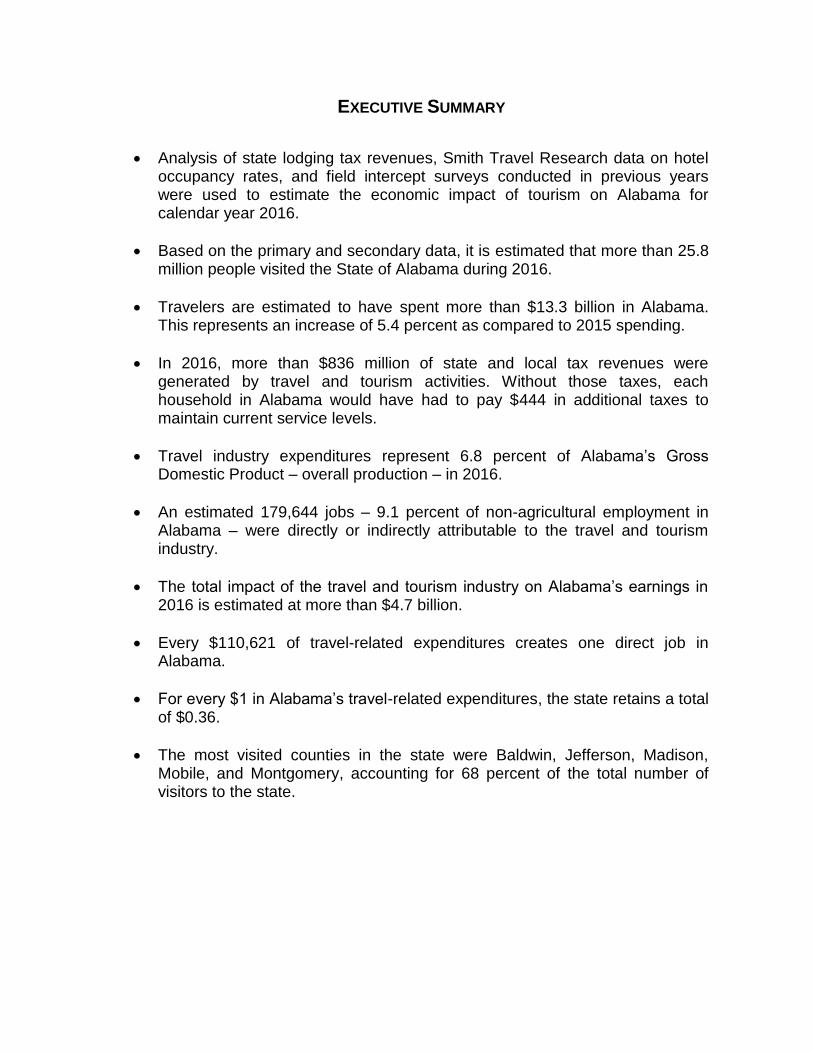
EXECUTIVE SUMMARY
Analysis of state lodging tax revenues, Smith Travel Research data on hotel occupancy rates, and field intercept surveys conducted in previous years were used to estimate the economic impact of tourism on Alabama for calendar year 2016.
Based on the primary and secondary data, it is estimated that more than 25.8 million people visited the State of Alabama during 2016.
Travelers are estimated to have spent more than $13.3 billion in Alabama. This represents an increase of 5.4 percent as compared to 2015 spending.
In 2016, more than $836 million of state and local tax revenues were generated by travel and tourism activities. Without those taxes, each household in Alabama would have had to pay $444 in additional taxes to maintain current service levels.
Travel industry expenditures represent 6.8 percent of Alabama’s Gross Domestic Product – overall production – in 2016.
An estimated 179,644 jobs – 9.1 percent of non-agricultural employment in Alabama – were directly or indirectly attributable to the travel and tourism industry.
The total impact of the travel and tourism industry on Alabama’s earnings in 2016 is estimated at more than $4.7 billion.
Every $110,621 of travel-related expenditures creates one direct job in Alabama.
For every $1 in Alabama’s travel-related expenditures, the state retains a total of $0.36.
The most visited counties in the state were Baldwin, Jefferson, Madison, Mobile, and Montgomery, accounting for 68 percent of the total number of visitors to the state.
iii
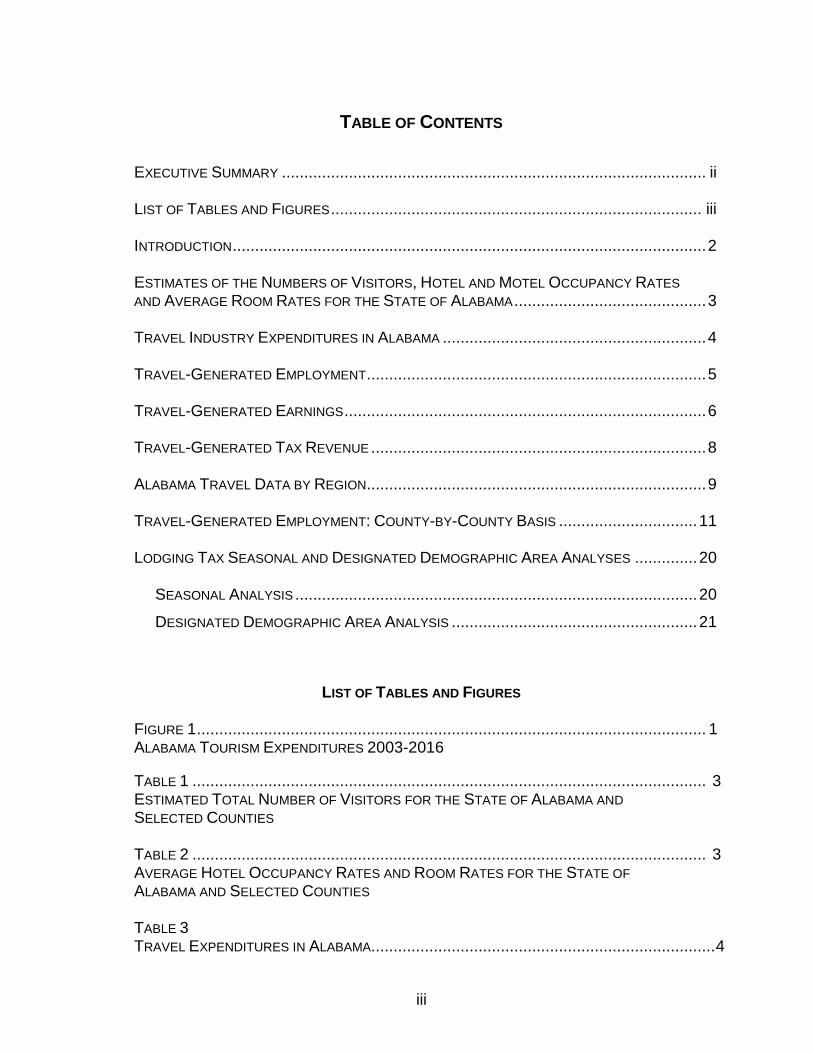
TABLE OF CONTENTS
EXECUTIVE SUMMARY ............................................................................................... ii LIST OF TABLES AND FIGURES ................................................................................... iii INTRODUCTION .......................................................................................................... 2 ESTIMATES OF THE NUMBERS OF VISITORS, HOTEL AND MOTEL OCCUPANCY RATES AND AVERAGE ROOM RATES FOR THE STATE OF ALABAMA ........................................... 3 TRAVEL INDUSTRY EXPENDITURES IN ALABAMA ........................................................... 4 TRAVEL-GENERATED EMPLOYMENT ............................................................................ 5 TRAVEL-GENERATED EARNINGS ................................................................................. 6 TRAVEL-GENERATED TAX REVENUE ........................................................................... 8 ALABAMA TRAVEL DATA BY REGION............................................................................ 9 TRAVEL-GENERATED EMPLOYMENT: COUNTY-BY-COUNTY BASIS ............................... 11 LODGING TAX SEASONAL AND DESIGNATED DEMOGRAPHIC AREA ANALYSES .............. 20 SEASONAL ANALYSIS .......................................................................................... 20
DESIGNATED DEMOGRAPHIC AREA ANALYSIS ....................................................... 21
LIST OF TABLES AND FIGURES
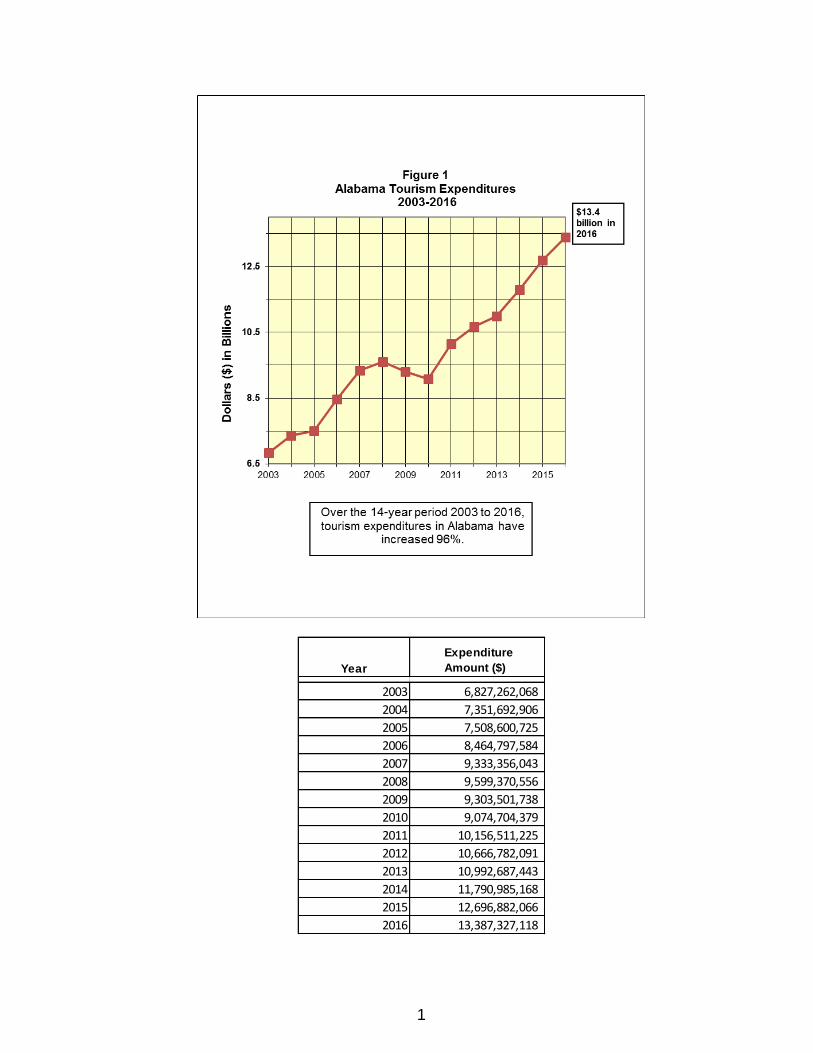
FIGURE 1 .................................................................................................................. 1 ALABAMA TOURISM EXPENDITURES 2003-2016
TABLE 1 ................................................................................................................... 3 ESTIMATED TOTAL NUMBER OF VISITORS FOR THE STATE OF ALABAMA AND SELECTED COUNTIES TABLE 2 ................................................................................................................... 3 AVERAGE HOTEL OCCUPANCY RATES AND ROOM RATES FOR THE STATE OF ALABAMA AND SELECTED COUNTIES TABLE 3 TRAVEL EXPENDITURES IN ALABAMA............................................................................. 4
iv
TABLE 4 ................................................................................................................... 4 REAL RATES OF GROWTH IN 2014-2016 TABLE 5 ................................................................................................................... 5 TRAVEL EXPENDITURES BY CATEGORY - 2016 TABLE 6 ................................................................................................................... 5 TRAVEL-RELATED DIRECT EMPLOYMENT - 2016 TABLE 7 ................................................................................................................... 6 TRAVEL INDUSTRY TOTAL (IMPACT) EMPLOYMENT - 2016 TABLE 8 ................................................................................................................... 6 TRAVEL-RELATED DIRECT EARNINGS - 2016 TABLE 9 ................................................................................................................... 7 TRAVEL INDUSTRY TOTAL (IMPACT) EARNINGS - 2016 TABLE 10 ................................................................................................................. 8 GOVERNMENT REVENUE ASSOCIATED WITH TRAVEL INDUSTRY 2014-2016 TABLE 11 ................................................................................................................. 9 ALABAMA REGIONAL TOURISM DATA FIGURE 2 ................................................................................................................. 10 2016 TRAVEL-RELATED TOTAL EXPENDITURES BY ALABAMA TRAVEL REGION
TABLE 12 ................................................................................................................. 13 DIRECT TRAVEL-RELATED EMPLOYMENT BY COUNTY TABLE 13 ................................................................................................................. 15 TOTAL (DIRECT AND INDIRECT) TRAVEL-RELATED EMPLOYMENT BY COUNTY TABLE 14 ................................................................................................................. 17 TOTAL TRAVEL-RELATED EMPLOYMENT BY COUNTY: ORDERED BY SIZE TABLE 15 ................................................................................................................. 19 COUNTIES WITH LARGEST TOTAL EMPLOYMENT GROWTH IN 2016
FIGURE 3 .................................................................................................................. 20 LODGING TAXES BY QUARTER - STATE: 2016 TABLE 16 ................................................................................................................. 21 RATIO OF COUNTIES' QUARTERLY TO ANNUAL LODGING TAX
v
TABLE 17 ................................................................................................................. 23 STATE LODGING TAX: MSA AS A PERCENT OF TOTAL STATE TABLE 18 ................................................................................................................. 23 MSA STATE LODGING TAX BY DESIGNATED DEMOGRAPHIC AREAS TABLE 19 ................................................................................................................. 24 TRAVEL-RELATED EARNINGS BY COUNTY - TOTAL (DIRECT AND INDIRECT)
TABLE 20 ................................................................................................................. 26 TRAVEL-RELATED EXPENDITURES BY COUNTY
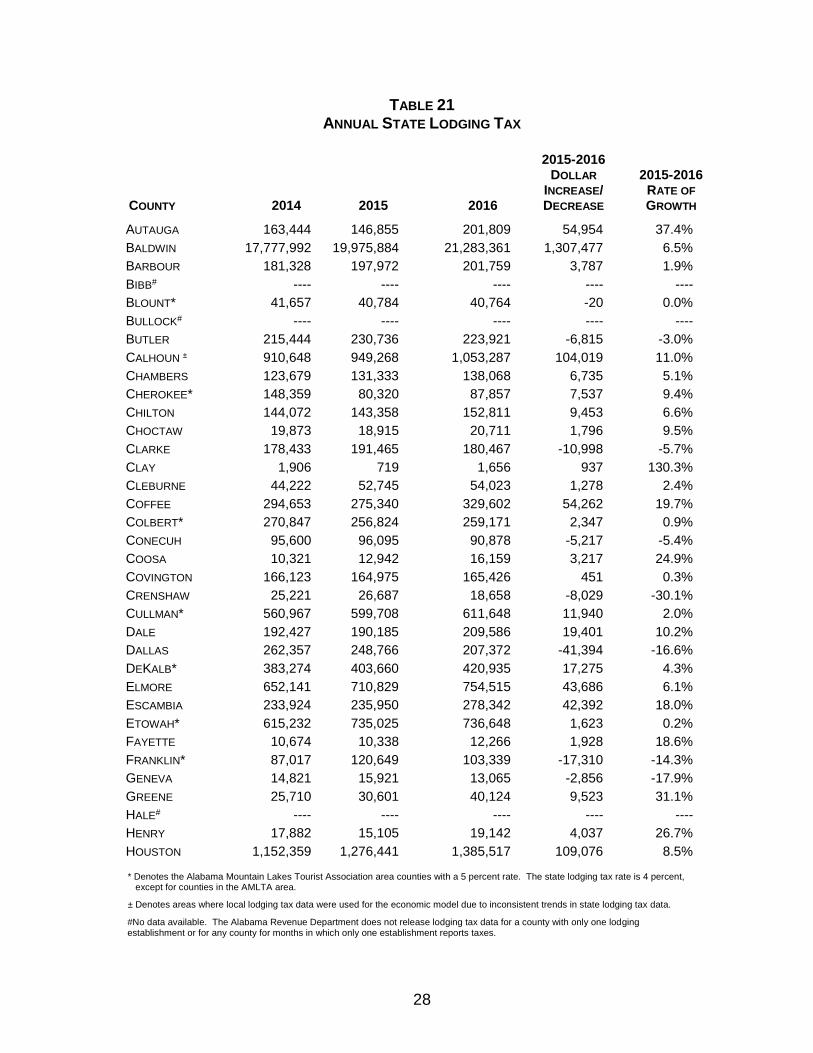
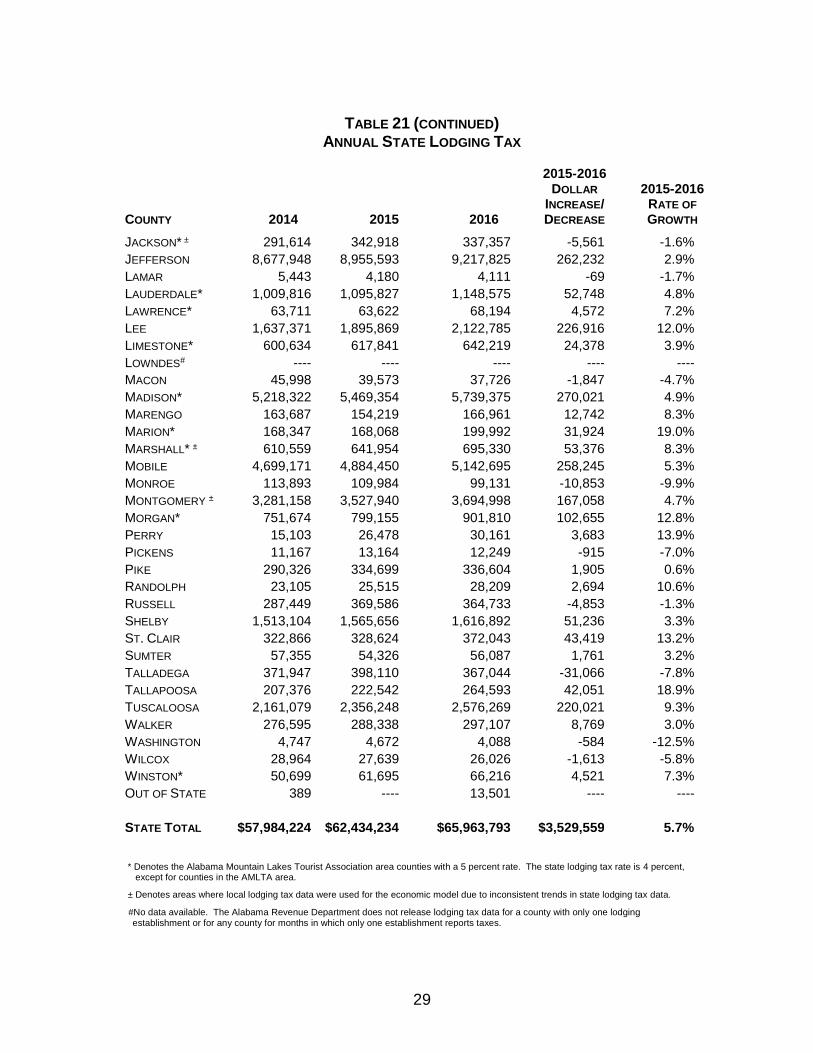
TABLE 21 ................................................................................................................. 28 ANNUAL STATE LODGING TAX
1
Year
Expenditure
Amount ($)
2003 6,827,262,068
2004 7,351,692,906
2005 7,508,600,725
2006 8,464,797,584
2007 9,333,356,043
2008 9,599,370,556
2009 9,303,501,738
2010 9,074,704,379
2011 10,156,511,225
2012 10,666,782,091
2013 10,992,687,443
2014 11,790,985,168
2015 12,696,882,066
2016 13,387,327,118
2
INTRODUCTION
The purpose of this study is to estimate the economic impact of the travel and tourism industry in Alabama for 2016. Information sources used to prepare this report included primary data, detailed monthly lodging tax data, copies of previously commissioned economic impact studies, and other relevant information and publications. State lodging tax data analyzed for this report was on a “by month of expenditure” basis. This data was provided by the Alabama Department of Revenue. This study also used information obtained from selected issues of Impact of Travel on State Economies (The Research Department of the U.S. Travel Association [USTA]). Any, and all, revisions in travel industry multipliers or adjustments in primary data by USTA have been incorporated into the Alabama 2016 report. Additional sources of information were used in preparing the 2016 economic impact study. Information on hotel occupancy rates and lodging revenue generation was obtained from Smith Travel Research. The results of field-intercept surveys that were conducted in previous years at locations and events throughout the state were also utilized. Economic impact analysis was performed using a model developed by Dr. Keivan Deravi, an economist in the School of Business, Auburn University Montgomery. This model, designed for the Alabama Tourism Department and the State of Alabama, uses Alabama industry multipliers developed by the Regional Input-Output Modeling System, United States Department of Commerce, Economic and Statistical Division, Bureau of Economic Analysis, Regional Economic Analysis Division. Data collection and report compilation was done by Alabama Tourism Department staff member Pam Smith. We wish to express our appreciation and thanks to Dr. Deravi for his assistance in the preparation of this report.
April 27, 2017
3
ESTIMATES OF THE NUMBER OF VISITORS, HOTEL AND MOTEL OCCUPANCY
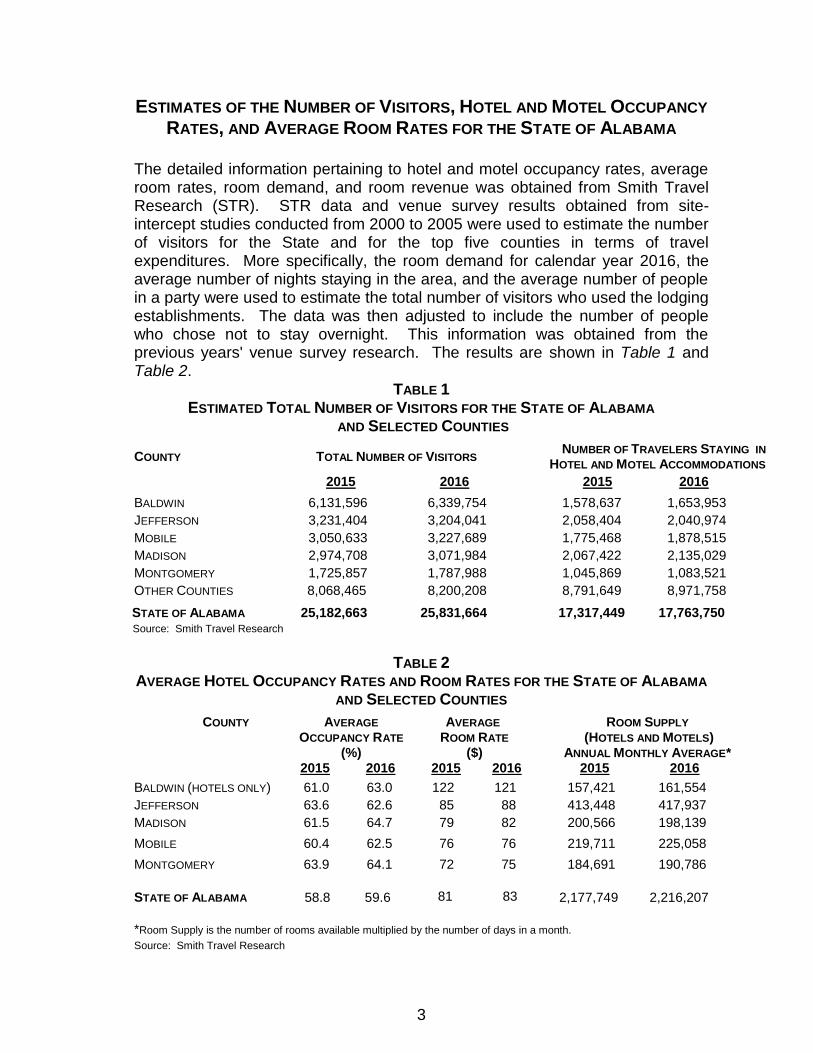
RATES, AND AVERAGE ROOM RATES FOR THE STATE OF ALABAMA The detailed information pertaining to hotel and motel occupancy rates, average room rates, room demand, and room revenue was obtained from Smith Travel Research (STR). STR data and venue survey results obtained from site-intercept studies conducted from 2000 to 2005 were used to estimate the number of visitors for the State and for the top five counties in terms of travel expenditures. More specifically, the room demand for calendar year 2016, the average number of nights staying in the area, and the average number of people in a party were used to estimate the total number of visitors who used the lodging establishments. The data was then adjusted to include the number of people who chose not to stay overnight. This information was obtained from the previous years' venue survey research. The results are shown in Table 1 and Table 2.
TABLE 1 ESTIMATED TOTAL NUMBER OF VISITORS FOR THE STATE OF ALABAMA
AND SELECTED COUNTIES
COUNTY TOTAL NUMBER OF VISITORS NUMBER OF TRAVELERS STAYING IN
HOTEL AND MOTEL ACCOMMODATIONS 2015 2016 2015 2016 BALDWIN 6,131,596 6,339,754 1,578,637 1,653,953
JEFFERSON 3,231,404 3,204,041 2,058,404 2,040,974
MOBILE 3,050,633 3,227,689 1,775,468 1,878,515
MADISON 2,974,708 3,071,984 2,067,422 2,135,029
MONTGOMERY 1,725,857 1,787,988 1,045,869 1,083,521
OTHER COUNTIES 8,068,465 8,200,208 8,791,649 8,971,758
STATE OF ALABAMA 25,182,663 25,831,664 17,317,449 17,763,750 Source: Smith Travel Research
TABLE 2
AVERAGE HOTEL OCCUPANCY RATES AND ROOM RATES FOR THE STATE OF ALABAMA
AND SELECTED COUNTIES
COUNTY
AVERAGE
OCCUPANCY RATE
(%)
AVERAGE ROOM RATE
($)
ROOM SUPPLY (HOTELS AND MOTELS)
ANNUAL MONTHLY AVERAGE* 2015 2016 2015 2016 2015 2016 BALDWIN (HOTELS ONLY) 61.0 63.0 122 121 157,421 161,554
JEFFERSON 63.6 62.6 85 88 413,448 417,937
MADISON 61.5 64.7 79 82 200,566 198,139
MOBILE 60.4 62.5 76 76 219,711 225,058
MONTGOMERY 63.9 64.1 72 75 184,691 190,786
STATE OF ALABAMA 58.8 59.6 81 83 2,177,749 2,216,207
*Room Supply is the number of rooms available multiplied by the number of days in a month.
Source: Smith Travel Research
4
It is estimated that more than 25.8 million visitors made Alabama their travel destination in 2016. It is also estimated that Baldwin, Jefferson, Madison, Mobile, and Montgomery counties attracted the largest numbers of travelers. More specifically, 68 percent of the travelers chose these counties as their destination.
TRAVEL INDUSTRY EXPENDITURES IN ALABAMA
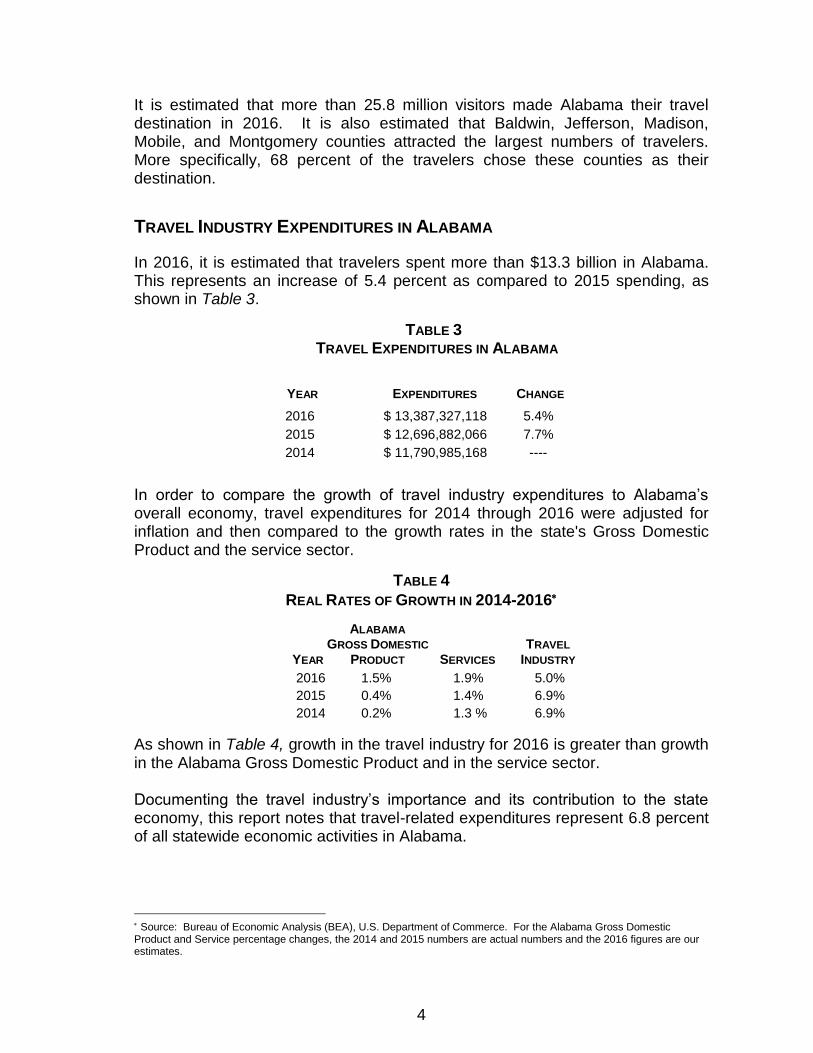
In 2016, it is estimated that travelers spent more than $13.3 billion in Alabama. This represents an increase of 5.4 percent as compared to 2015 spending, as shown in Table 3.
TABLE 3 TRAVEL EXPENDITURES IN ALABAMA
YEAR EXPENDITURES CHANGE
2016 $ 13,387,327,118 5.4%
2015 $ 12,696,882,066 7.7%
2014 $ 11,790,985,168 ----
In order to compare the growth of travel industry expenditures to Alabama’s overall economy, travel expenditures for 2014 through 2016 were adjusted for inflation and then compared to the growth rates in the state's Gross Domestic Product and the service sector.
TABLE 4
REAL RATES OF GROWTH IN 2014-2016
ALABAMA
GROSS DOMESTIC TRAVEL YEAR PRODUCT SERVICES INDUSTRY
2016 1.5% 1.9% 5.0%
2015 0.4% 1.4% 6.9%
2014 0.2% 1.3 % 6.9%
As shown in Table 4, growth in the travel industry for 2016 is greater than growth in the Alabama Gross Domestic Product and in the service sector. Documenting the travel industry’s importance and its contribution to the state economy, this report notes that travel-related expenditures represent 6.8 percent of all statewide economic activities in Alabama.
Source: Bureau of Economic Analysis (BEA), U.S. Department of Commerce. For the Alabama Gross Domestic Product and Service percentage changes, the 2014 and 2015 numbers are actual numbers and the 2016 figures are our estimates.
5
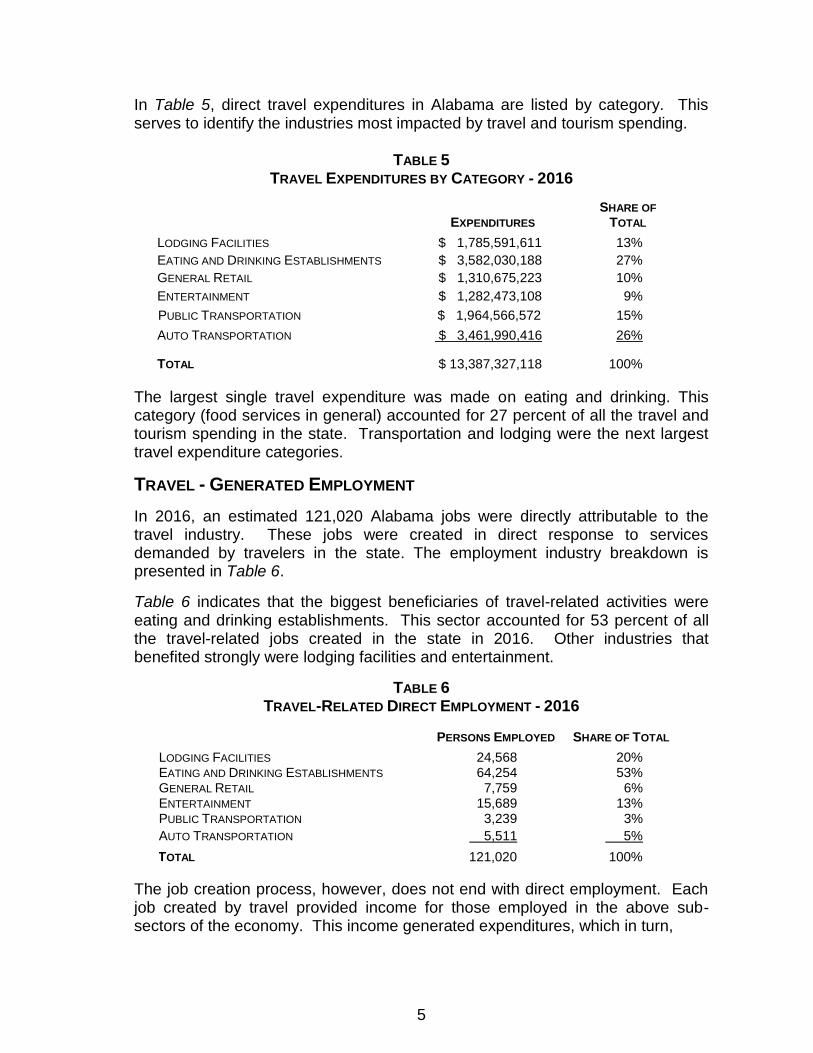
In Table 5, direct travel expenditures in Alabama are listed by category. This serves to identify the industries most impacted by travel and tourism spending.
TABLE 5
TRAVEL EXPENDITURES BY CATEGORY - 2016
EXPENDITURES SHARE OF
TOTAL LODGING FACILITIES $ 1,785,591,611 13%
EATING AND DRINKING ESTABLISHMENTS $ 3,582,030,188 27%
GENERAL RETAIL $ 1,310,675,223 10%
ENTERTAINMENT $ 1,282,473,108 9%
PUBLIC TRANSPORTATION $ 1,964,566,572 15%
AUTO TRANSPORTATION $ 3,461,990,416 26%
TOTAL $ 13,387,327,118 100%
The largest single travel expenditure was made on eating and drinking. This category (food services in general) accounted for 27 percent of all the travel and tourism spending in the state. Transportation and lodging were the next largest travel expenditure categories.
TRAVEL - GENERATED EMPLOYMENT
In 2016, an estimated 121,020 Alabama jobs were directly attributable to the travel industry. These jobs were created in direct response to services demanded by travelers in the state. The employment industry breakdown is presented in Table 6.
Table 6 indicates that the biggest beneficiaries of travel-related activities were eating and drinking establishments. This sector accounted for 53 percent of all the travel-related jobs created in the state in 2016. Other industries that benefited strongly were lodging facilities and entertainment.
TABLE 6 TRAVEL-RELATED DIRECT EMPLOYMENT - 2016
PERSONS EMPLOYED SHARE OF TOTAL LODGING FACILITIES 24,568 20% EATING AND DRINKING ESTABLISHMENTS 64,254 53% GENERAL RETAIL 7,759 6% ENTERTAINMENT 15,689 13% PUBLIC TRANSPORTATION 3,239 3%
AUTO TRANSPORTATION 5,511 5% TOTAL 121,020 100%
The job creation process, however, does not end with direct employment. Each job created by travel provided income for those employed in the above sub-sectors of the economy. This income generated expenditures, which in turn,
6
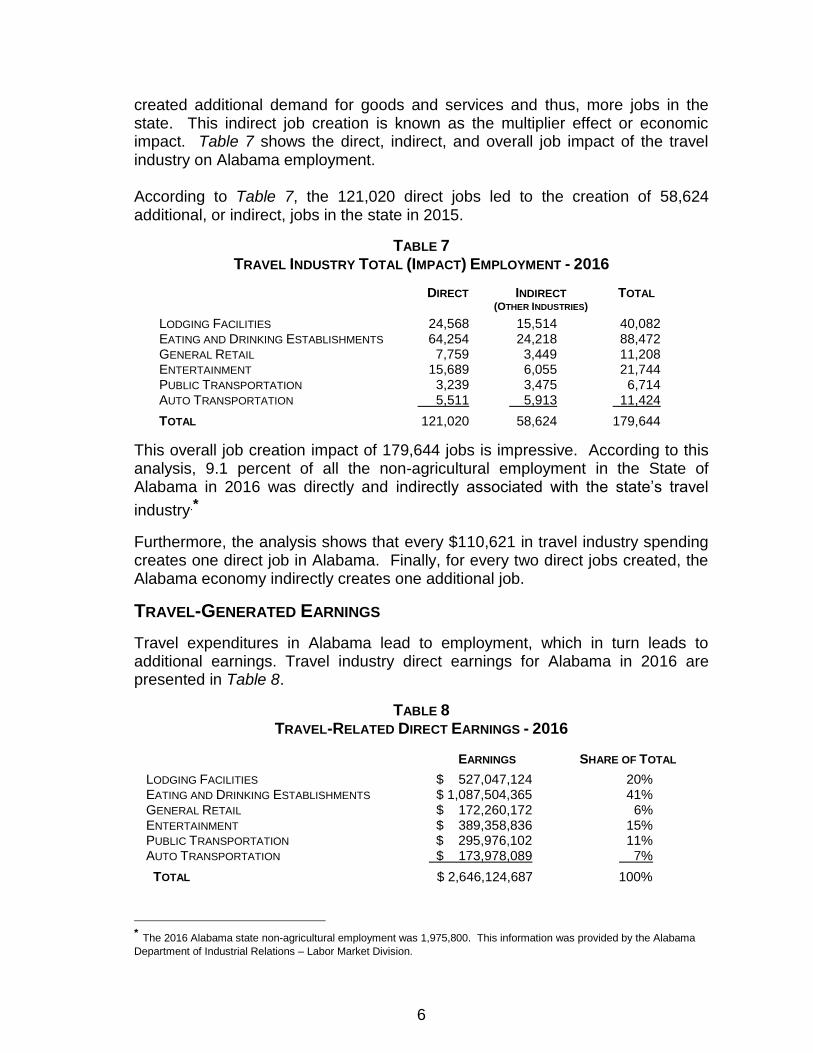
created additional demand for goods and services and thus, more jobs in the state. This indirect job creation is known as the multiplier effect or economic impact. Table 7 shows the direct, indirect, and overall job impact of the travel industry on Alabama employment. According to Table 7, the 121,020 direct jobs led to the creation of 58,624 additional, or indirect, jobs in the state in 2015.
TABLE 7
TRAVEL INDUSTRY TOTAL (IMPACT) EMPLOYMENT - 2016
DIRECT INDIRECT TOTAL (OTHER INDUSTRIES)
LODGING FACILITIES 24,568 15,514 40,082 EATING AND DRINKING ESTABLISHMENTS 64,254 24,218 88,472 GENERAL RETAIL 7,759 3,449 11,208 ENTERTAINMENT 15,689 6,055 21,744 PUBLIC TRANSPORTATION 3,239 3,475 6,714 AUTO TRANSPORTATION 5,511 5,913 11,424 TOTAL 121,020 58,624 179,644
This overall job creation impact of 179,644 jobs is impressive. According to this analysis, 9.1 percent of all the non-agricultural employment in the State of Alabama in 2016 was directly and indirectly associated with the state’s travel
industry.*
Furthermore, the analysis shows that every $110,621 in travel industry spending creates one direct job in Alabama. Finally, for every two direct jobs created, the Alabama economy indirectly creates one additional job.
TRAVEL-GENERATED EARNINGS
Travel expenditures in Alabama lead to employment, which in turn leads to additional earnings. Travel industry direct earnings for Alabama in 2016 are presented in Table 8.
TABLE 8 TRAVEL-RELATED DIRECT EARNINGS - 2016
EARNINGS SHARE OF TOTAL LODGING FACILITIES $ 527,047,124 20% EATING AND DRINKING ESTABLISHMENTS $ 1,087,504,365 41% GENERAL RETAIL $ 172,260,172 6% ENTERTAINMENT $ 389,358,836 15% PUBLIC TRANSPORTATION $ 295,976,102 11% AUTO TRANSPORTATION $ 173,978,089 7% TOTAL $ 2,646,124,687 100%
* The 2016 Alabama state non-agricultural employment was 1,975,800. This information was provided by the Alabama
Department of Industrial Relations – Labor Market Division.
7
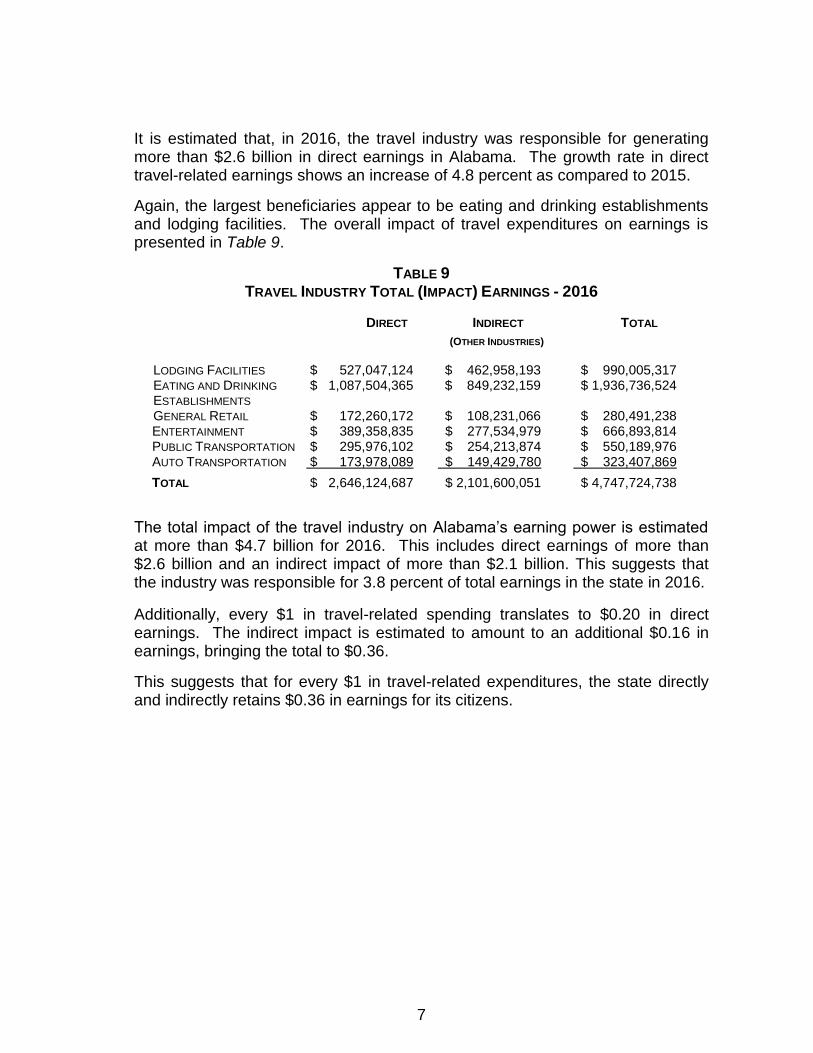
It is estimated that, in 2016, the travel industry was responsible for generating more than $2.6 billion in direct earnings in Alabama. The growth rate in direct travel-related earnings shows an increase of 4.8 percent as compared to 2015.
Again, the largest beneficiaries appear to be eating and drinking establishments and lodging facilities. The overall impact of travel expenditures on earnings is presented in Table 9.
TABLE 9 TRAVEL INDUSTRY TOTAL (IMPACT) EARNINGS - 2016
DIRECT INDIRECT TOTAL
(OTHER INDUSTRIES) LODGING FACILITIES $ 527,047,124 $ 462,958,193 $ 990,005,317 EATING AND DRINKING
ESTABLISHMENTS $ 1,087,504,365 $ 849,232,159 $ 1,936,736,524
GENERAL RETAIL $ 172,260,172 $ 108,231,066 $ 280,491,238 ENTERTAINMENT $ 389,358,835 $ 277,534,979 $ 666,893,814 PUBLIC TRANSPORTATION $ 295,976,102 $ 254,213,874 $ 550,189,976 AUTO TRANSPORTATION $ 173,978,089 $ 149,429,780 $ 323,407,869
TOTAL $ 2,646,124,687 $ 2,101,600,051 $ 4,747,724,738
The total impact of the travel industry on Alabama’s earning power is estimated at more than $4.7 billion for 2016. This includes direct earnings of more than $2.6 billion and an indirect impact of more than $2.1 billion. This suggests that the industry was responsible for 3.8 percent of total earnings in the state in 2016.
Additionally, every $1 in travel-related spending translates to $0.20 in direct earnings. The indirect impact is estimated to amount to an additional $0.16 in earnings, bringing the total to $0.36.
This suggests that for every $1 in travel-related expenditures, the state directly and indirectly retains $0.36 in earnings for its citizens.
8
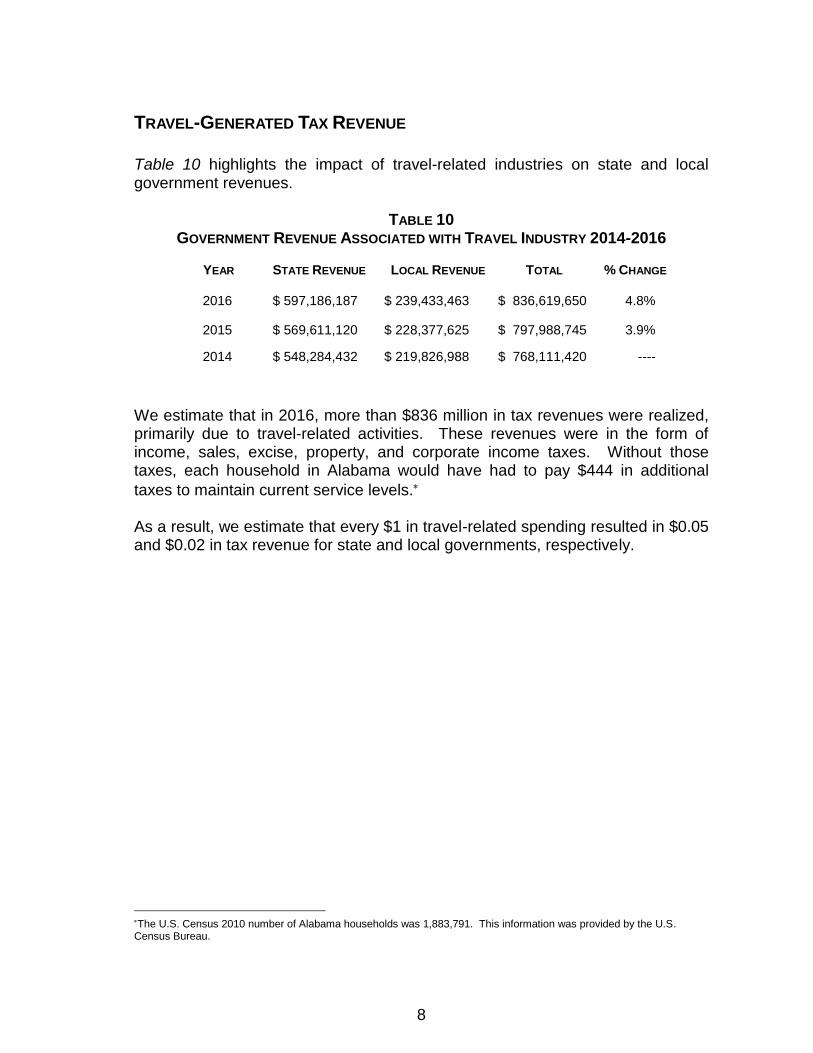
TRAVEL-GENERATED TAX REVENUE
Table 10 highlights the impact of travel-related industries on state and local government revenues.
TABLE 10 GOVERNMENT REVENUE ASSOCIATED WITH TRAVEL INDUSTRY 2014-2016
YEAR STATE REVENUE LOCAL REVENUE TOTAL % CHANGE
2016 $ 597,186,187 $ 239,433,463 $ 836,619,650 4.8%
2015 $ 569,611,120 $ 228,377,625 $ 797,988,745 3.9%
2014 $ 548,284,432 $ 219,826,988 $ 768,111,420 ----
We estimate that in 2016, more than $836 million in tax revenues were realized, primarily due to travel-related activities. These revenues were in the form of income, sales, excise, property, and corporate income taxes. Without those taxes, each household in Alabama would have had to pay $444 in additional
taxes to maintain current service levels. As a result, we estimate that every $1 in travel-related spending resulted in $0.05 and $0.02 in tax revenue for state and local governments, respectively.
The U.S. Census 2010 number of Alabama households was 1,883,791. This information was provided by the U.S. Census Bureau.
9
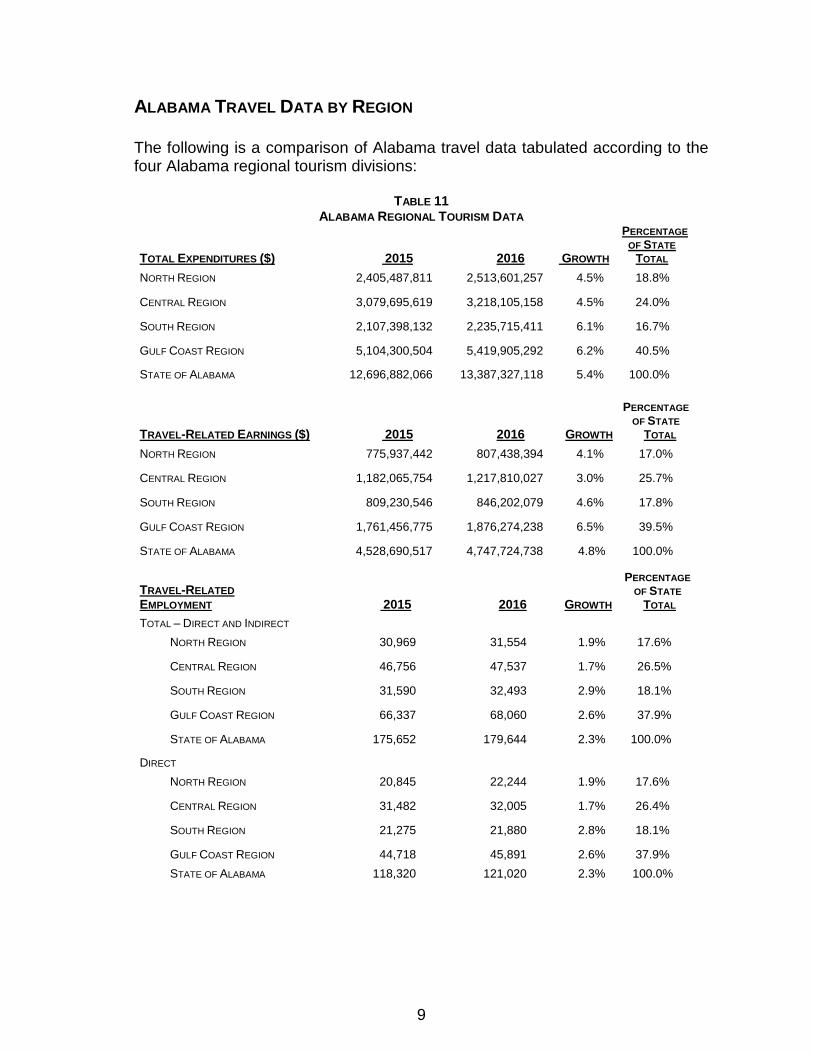
ALABAMA TRAVEL DATA BY REGION The following is a comparison of Alabama travel data tabulated according to the four Alabama regional tourism divisions:
TABLE 11 ALABAMA REGIONAL TOURISM DATA
TOTAL EXPENDITURES ($) 2015 2016 GROWTH
PERCENTAGE
OF STATE
TOTAL
NORTH REGION 2,405,487,811 2,513,601,257 4.5% 18.8%
CENTRAL REGION 3,079,695,619 3,218,105,158 4.5% 24.0%
SOUTH REGION 2,107,398,132 2,235,715,411 6.1% 16.7%
GULF COAST REGION 5,104,300,504 5,419,905,292 6.2% 40.5%
STATE OF ALABAMA 12,696,882,066 13,387,327,118 5.4% 100.0%
TRAVEL-RELATED EARNINGS ($) 2015 2016 GROWTH
PERCENTAGE OF STATE
TOTAL
NORTH REGION 775,937,442 807,438,394 4.1% 17.0%
CENTRAL REGION 1,182,065,754 1,217,810,027 3.0% 25.7%
SOUTH REGION 809,230,546 846,202,079 4.6% 17.8%
GULF COAST REGION 1,761,456,775 1,876,274,238 6.5% 39.5%
STATE OF ALABAMA 4,528,690,517 4,747,724,738 4.8% 100.0%
TRAVEL-RELATED
EMPLOYMENT 2015 2016 GROWTH
PERCENTAGE OF STATE
TOTAL
TOTAL – DIRECT AND INDIRECT
NORTH REGION 30,969 31,554 1.9% 17.6%
CENTRAL REGION 46,756 47,537 1.7% 26.5%
SOUTH REGION 31,590 32,493 2.9% 18.1%
GULF COAST REGION 66,337 68,060 2.6% 37.9%
STATE OF ALABAMA 175,652 179,644 2.3% 100.0%
DIRECT
NORTH REGION 20,845 22,244 1.9% 17.6%
CENTRAL REGION 31,482 32,005 1.7% 26.4%
SOUTH REGION 21,275 21,880 2.8% 18.1%
GULF COAST REGION 44,718 45,891 2.6% 37.9%
STATE OF ALABAMA 118,320 121,020 2.3% 100.0%
10
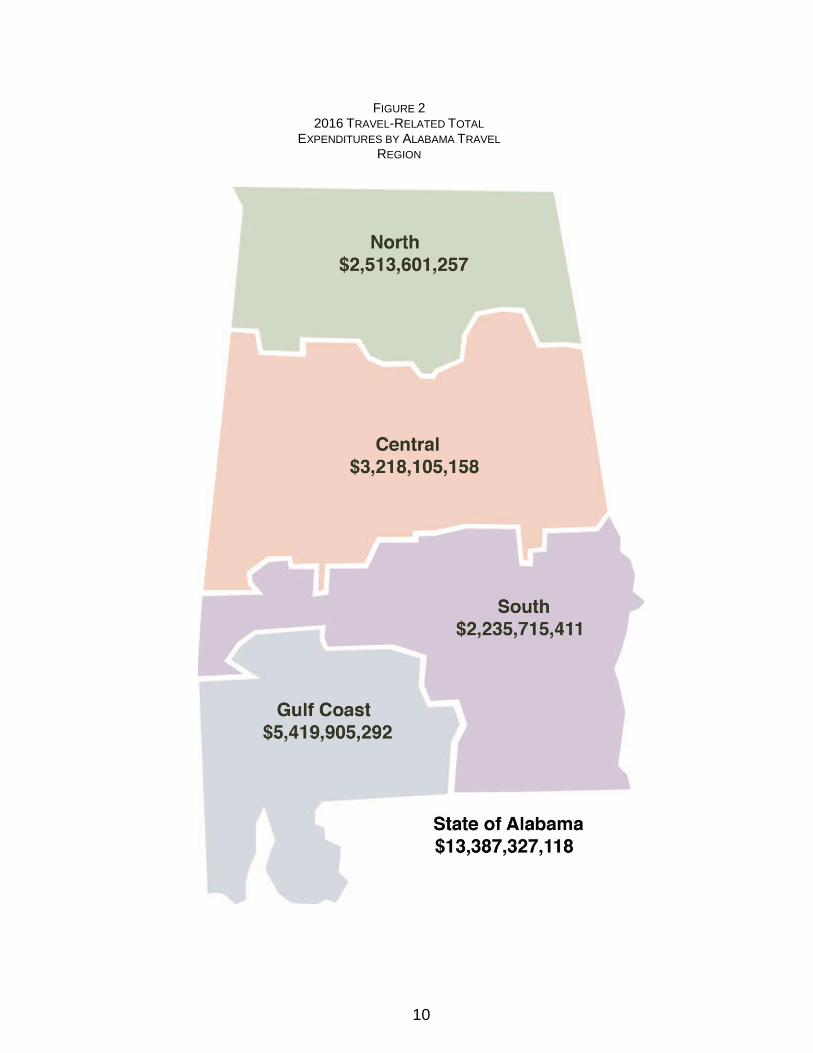
FIGURE 2 2016 TRAVEL-RELATED TOTAL
EXPENDITURES BY ALABAMA TRAVEL REGION
11
TRAVEL-GENERATED EMPLOYMENT: COUNTY-BY-COUNTY BASIS
Total travel-generated employment in 2016 was distributed on a county-by-county level on the basis of each county’s share of total lodging expenditures. The results are reported in tables on the following pages, as explained below: Table 12, on page 13, represents direct travel-generated employment for each county and the rate of annual change. Table 13, on page 15, represents travel-generated total employment (both direct and indirect) in each county and the rate of annual change. Table 14, on page 17, ranks the counties in Alabama, from greatest to least, based on the benefit received from travel-generated total employment in the state. Table 15, on page 19, shows the 37 counties with the highest growth rate in travel-generated total employment. Several conclusions can be drawn from the information presented in Tables 12 through 15, which are as follows:
Baldwin and Jefferson counties are, by far, the largest travel-concentrated counties in the state, accounting for 43 percent of all travel-related employment.
Seven counties - Baldwin, Jefferson, Madison, Mobile, Montgomery, Shelby, and Tuscaloosa - account for 134,516 travel-related workers, which is 75 percent of all travel-generated employment.
OTHER TABLE LISTINGS:
Table 16, on page 21 provides the ratio of county quarterly-to-annual state lodging tax in 2016. Table 17, on page 23, shows the metropolitan statistical area (MSA) share of state lodging tax per MSA. Table 18, on page 23, shows the distribution of state lodging tax among designated demographic areas. Additional information on Tables 16 through 18 will be provided in the following section, starting on page 20.

12
Table 19, on page 24, shows travel-related earnings by county, including the annual growth rate. Table 20, on page 26, shows travel-related expenditures by county. Table 21, on page 28, contains annual state lodging tax data and provides the amount and percentage of annual change.
13
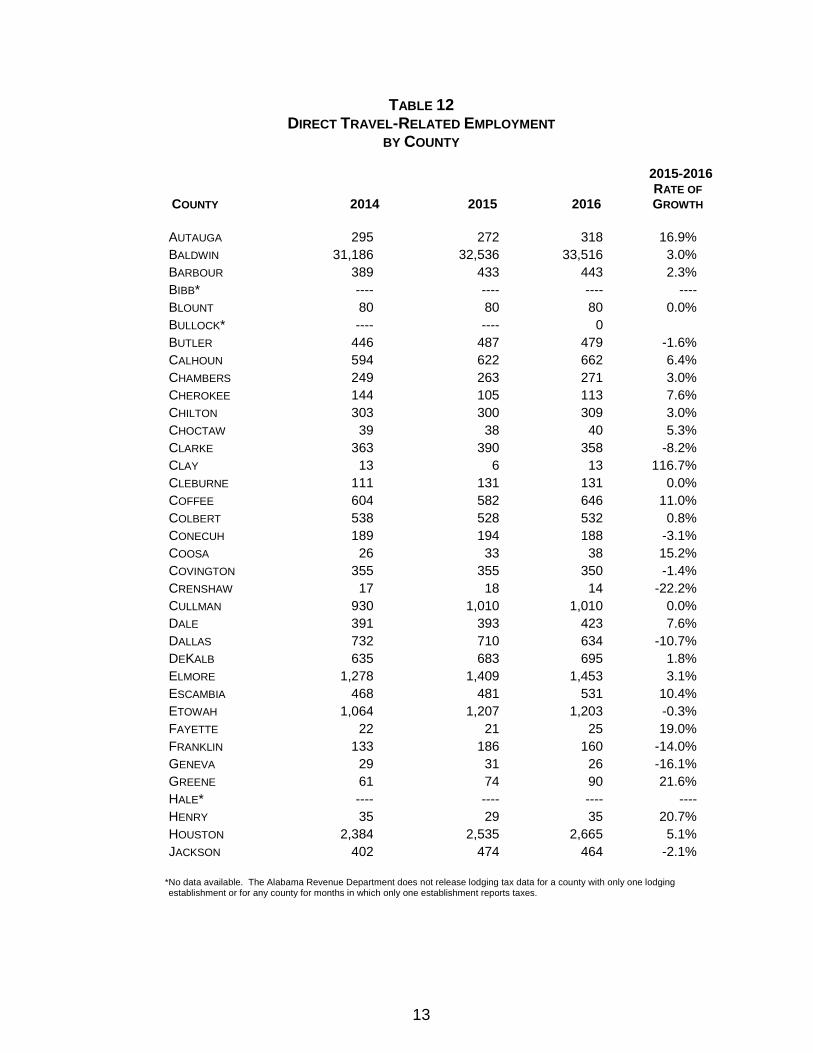
TABLE 12 DIRECT TRAVEL-RELATED EMPLOYMENT
BY COUNTY
COUNTY
2014 2015 2016
2015-2016 RATE OF GROWTH
AUTAUGA 295 272 318 16.9%
BALDWIN 31,186 32,536 33,516 3.0%
BARBOUR 389 433 443 2.3%
BIBB* ---- ---- ---- ----
BLOUNT 80 80 80 0.0%
BULLOCK* ---- ---- 0
BUTLER 446 487 479 -1.6%
CALHOUN 594 622 662 6.4%
CHAMBERS 249 263 271 3.0%
CHEROKEE 144 105 113 7.6%
CHILTON 303 300 309 3.0%
CHOCTAW 39 38 40 5.3%
CLARKE 363 390 358 -8.2%
CLAY 13 6 13 116.7%
CLEBURNE 111 131 131 0.0%
COFFEE 604 582 646 11.0%
COLBERT 538 528 532 0.8%
CONECUH 189 194 188 -3.1%
COOSA 26 33 38 15.2%
COVINGTON 355 355 350 -1.4%
CRENSHAW 17 18 14 -22.2%
CULLMAN 930 1,010 1,010 0.0%
DALE 391 393 423 7.6%
DALLAS 732 710 634 -10.7%
DEKALB 635 683 695 1.8%
ELMORE 1,278 1,409 1,453 3.1%
ESCAMBIA 468 481 531 10.4%
ETOWAH 1,064 1,207 1,203 -0.3%
FAYETTE 22 21 25 19.0%
FRANKLIN 133 186 160 -14.0%
GENEVA 29 31 26 -16.1%
GREENE 61 74 90 21.6%
HALE* ---- ---- ---- ----
HENRY 35 29 35 20.7%
HOUSTON 2,384 2,535 2,665 5.1%
JACKSON 402 474 464 -2.1%
*No data available. The Alabama Revenue Department does not release lodging tax data for a county with only one lodging establishment or for any county for months in which only one establishment reports taxes.
14
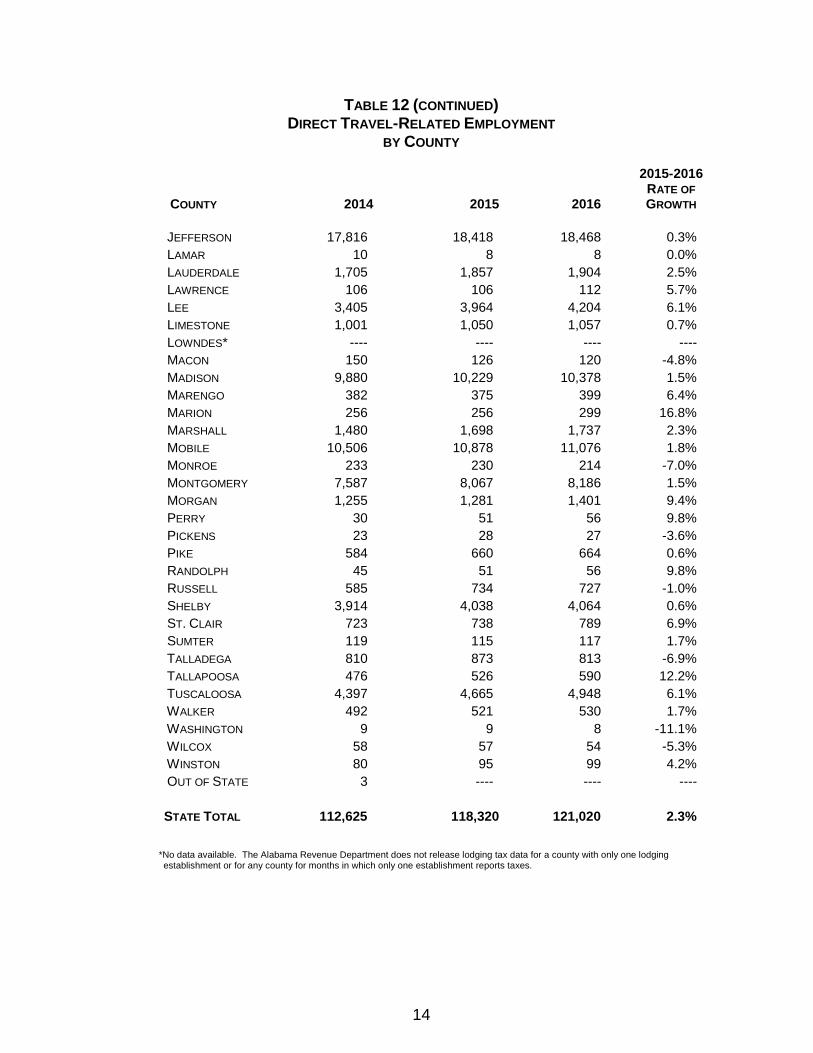
TABLE 12 (CONTINUED) DIRECT TRAVEL-RELATED EMPLOYMENT
BY COUNTY
COUNTY
2014 2015 2016
2015-2016
RATE OF
GROWTH
JEFFERSON 17,816 18,418 18,468 0.3%
LAMAR 10 8 8 0.0%
LAUDERDALE 1,705 1,857 1,904 2.5%
LAWRENCE 106 106 112 5.7%
LEE 3,405 3,964 4,204 6.1%
LIMESTONE 1,001 1,050 1,057 0.7%
LOWNDES* ---- ---- ---- ----
MACON 150 126 120 -4.8%
MADISON 9,880 10,229 10,378 1.5%
MARENGO 382 375 399 6.4%
MARION 256 256 299 16.8%
MARSHALL 1,480 1,698 1,737 2.3%
MOBILE 10,506 10,878 11,076 1.8%
MONROE 233 230 214 -7.0%
MONTGOMERY 7,587 8,067 8,186 1.5%
MORGAN 1,255 1,281 1,401 9.4%
PERRY 30 51 56 9.8%
PICKENS 23 28 27 -3.6%
PIKE 584 660 664 0.6%
RANDOLPH 45 51 56 9.8%
RUSSELL 585 734 727 -1.0%
SHELBY 3,914 4,038 4,064 0.6%
ST. CLAIR 723 738 789 6.9%
SUMTER 119 115 117 1.7%
TALLADEGA 810 873 813 -6.9%
TALLAPOOSA 476 526 590 12.2%
TUSCALOOSA 4,397 4,665 4,948 6.1%
WALKER 492 521 530 1.7%
WASHINGTON 9 9 8 -11.1%
WILCOX 58 57 54 -5.3%
WINSTON 80 95 99 4.2%
OUT OF STATE 3 ---- ---- ----
STATE TOTAL 112,625 118,320 121,020 2.3%
*No data available. The Alabama Revenue Department does not release lodging tax data for a county with only one lodging establishment or for any county for months in which only one establishment reports taxes.
15
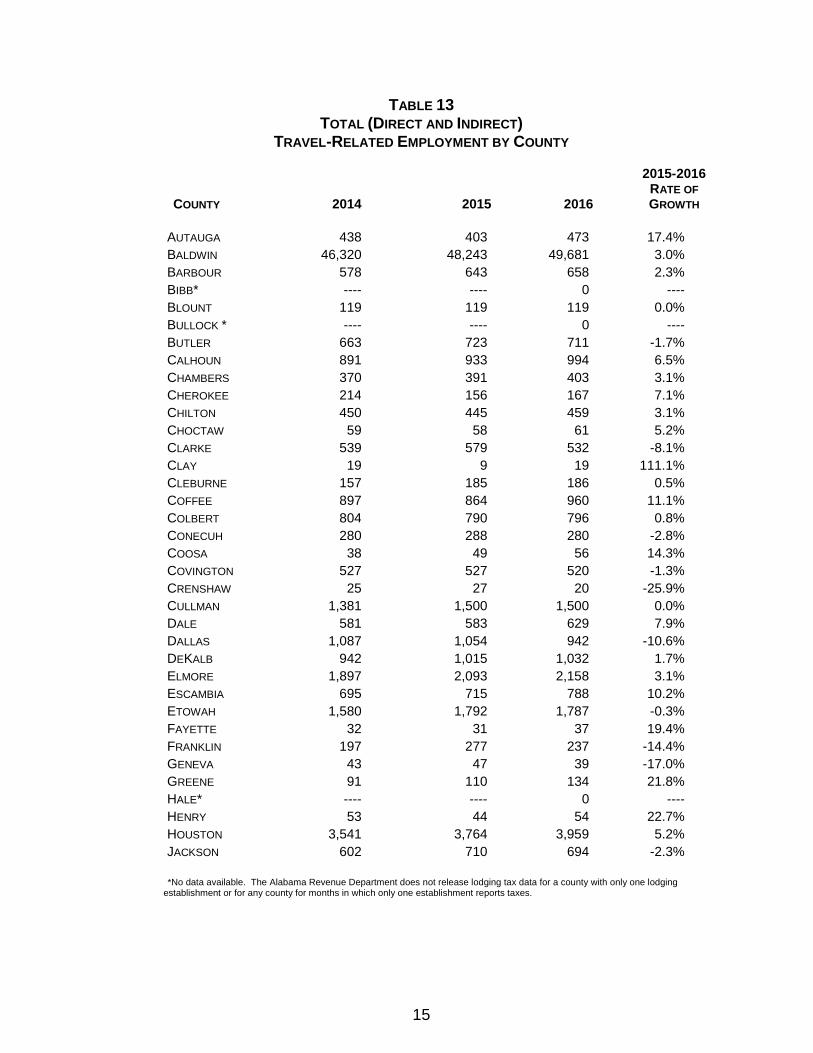
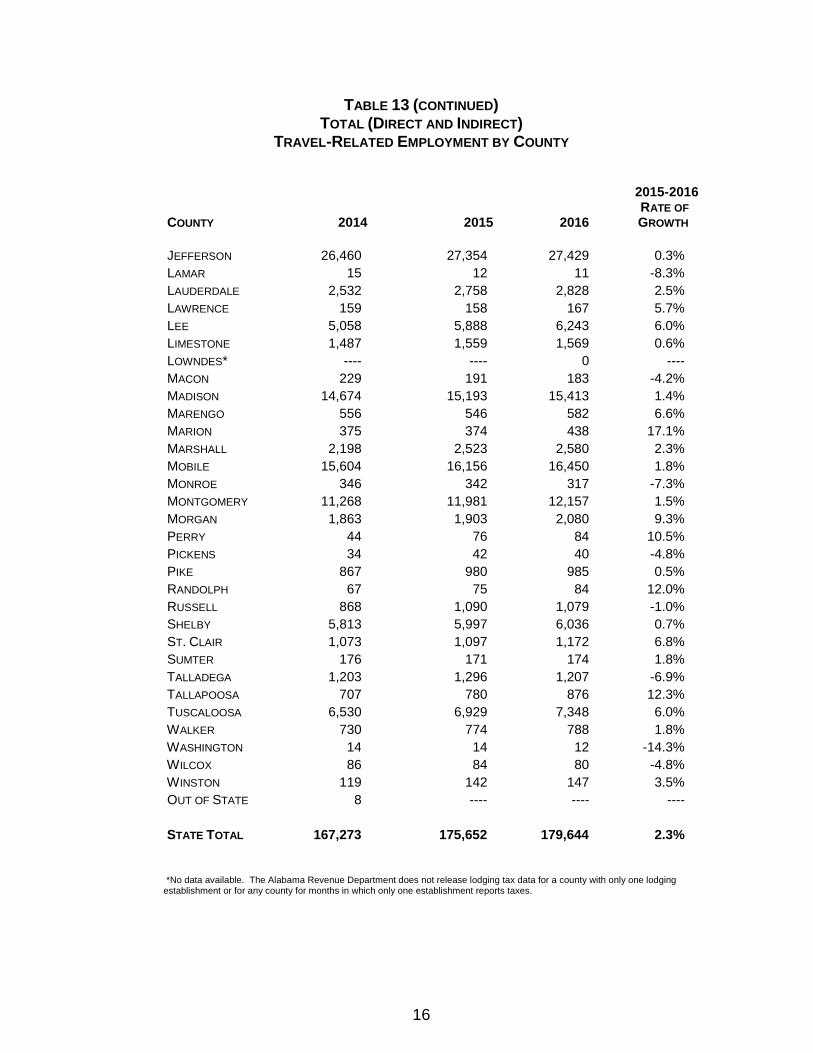
TABLE 13
TOTAL (DIRECT AND INDIRECT) TRAVEL-RELATED EMPLOYMENT BY COUNTY
COUNTY 2014 2015 2016
2015-2016 RATE OF
GROWTH
AUTAUGA 438 403 473 17.4%
BALDWIN 46,320 48,243 49,681 3.0%
BARBOUR 578 643 658 2.3%
BIBB* ---- ---- 0 ----
BLOUNT 119 119 119 0.0%
BULLOCK * ---- ---- 0 ----
BUTLER 663 723 711 -1.7%
CALHOUN 891 933 994 6.5%
CHAMBERS 370 391 403 3.1%
CHEROKEE 214 156 167 7.1%
CHILTON 450 445 459 3.1%
CHOCTAW 59 58 61 5.2%
CLARKE 539 579 532 -8.1%
CLAY 19 9 19 111.1%
CLEBURNE 157 185 186 0.5%
COFFEE 897 864 960 11.1%
COLBERT 804 790 796 0.8%
CONECUH 280 288 280 -2.8%
COOSA 38 49 56 14.3%
COVINGTON 527 527 520 -1.3%
CRENSHAW 25 27 20 -25.9%
CULLMAN 1,381 1,500 1,500 0.0%
DALE 581 583 629 7.9%
DALLAS 1,087 1,054 942 -10.6%
DEKALB 942 1,015 1,032 1.7%
ELMORE 1,897 2,093 2,158 3.1%
ESCAMBIA 695 715 788 10.2%
ETOWAH 1,580 1,792 1,787 -0.3%
FAYETTE 32 31 37 19.4%
FRANKLIN 197 277 237 -14.4%
GENEVA 43 47 39 -17.0%
GREENE 91 110 134 21.8%
HALE* ---- ---- 0 ----
HENRY 53 44 54 22.7%
HOUSTON 3,541 3,764 3,959 5.2%
JACKSON 602 710 694 -2.3%
*No data available. The Alabama Revenue Department does not release lodging tax data for a county with only one lodging establishment or for any county for months in which only one establishment reports taxes.
16
TABLE 13 (CONTINUED) TOTAL (DIRECT AND INDIRECT)
TRAVEL-RELATED EMPLOYMENT BY COUNTY
COUNTY
2014
2015
2016
2015-2016
RATE OF GROWTH
JEFFERSON 26,460 27,354 27,429 0.3%
LAMAR 15 12 11 -8.3%
LAUDERDALE 2,532 2,758 2,828 2.5%
LAWRENCE 159 158 167 5.7%
LEE 5,058 5,888 6,243 6.0%
LIMESTONE 1,487 1,559 1,569 0.6%
LOWNDES* ---- ---- 0 ----
MACON 229 191 183 -4.2%
MADISON 14,674 15,193 15,413 1.4%
MARENGO 556 546 582 6.6%
MARION 375 374 438 17.1%
MARSHALL 2,198 2,523 2,580 2.3%
MOBILE 15,604 16,156 16,450 1.8%
MONROE 346 342 317 -7.3%
MONTGOMERY 11,268 11,981 12,157 1.5%
MORGAN 1,863 1,903 2,080 9.3%
PERRY 44 76 84 10.5%
PICKENS 34 42 40 -4.8%
PIKE 867 980 985 0.5%
RANDOLPH 67 75 84 12.0%
RUSSELL 868 1,090 1,079 -1.0%
SHELBY 5,813 5,997 6,036 0.7%
ST. CLAIR 1,073 1,097 1,172 6.8%
SUMTER 176 171 174 1.8%
TALLADEGA 1,203 1,296 1,207 -6.9%
TALLAPOOSA 707 780 876 12.3%
TUSCALOOSA 6,530 6,929 7,348 6.0%
WALKER 730 774 788 1.8%
WASHINGTON 14 14 12 -14.3%
WILCOX 86 84 80 -4.8%
WINSTON 119 142 147 3.5%
OUT OF STATE 8 ---- ---- ----
STATE TOTAL 167,273 175,652 179,644 2.3%
*No data available. The Alabama Revenue Department does not release lodging tax data for a county with only one lodging establishment or for any county for months in which only one establishment reports taxes.
17
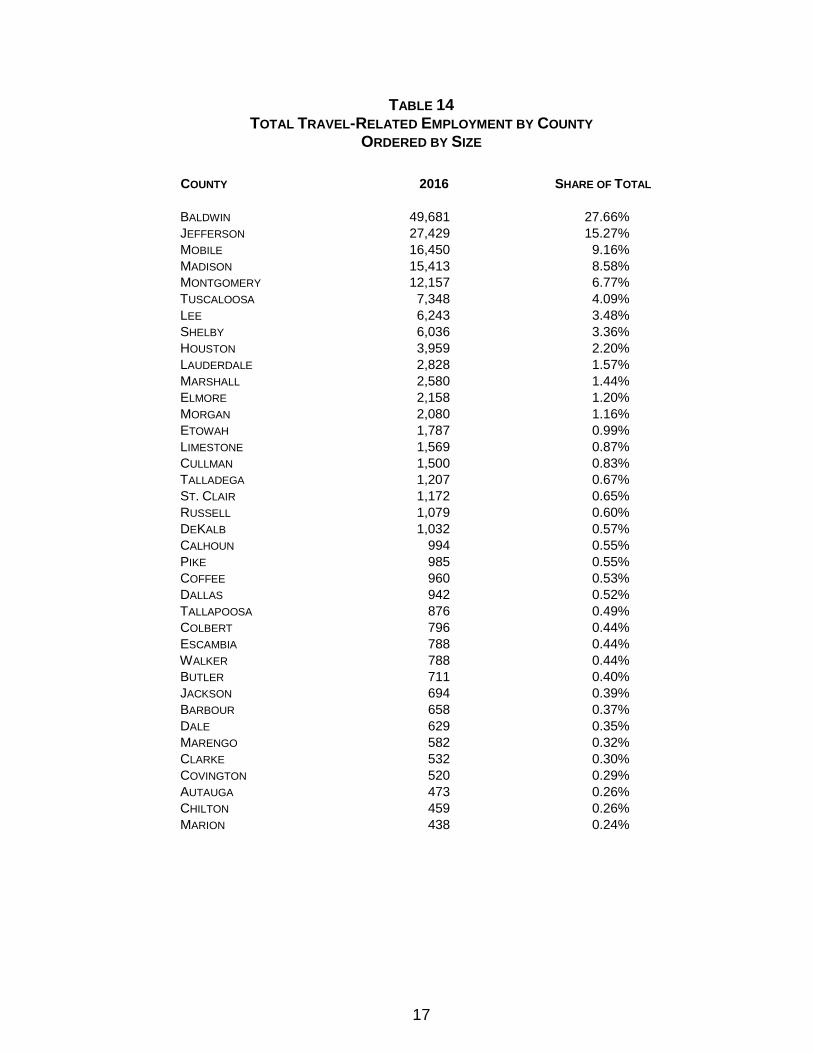
TABLE 14 TOTAL TRAVEL-RELATED EMPLOYMENT BY COUNTY
ORDERED BY SIZE
COUNTY 2016 SHARE OF TOTAL
BALDWIN 49,681 27.66%
JEFFERSON 27,429 15.27%
MOBILE 16,450 9.16%
MADISON 15,413 8.58%
MONTGOMERY 12,157 6.77%
TUSCALOOSA 7,348 4.09%
LEE 6,243 3.48%
SHELBY 6,036 3.36%
HOUSTON 3,959 2.20%
LAUDERDALE 2,828 1.57%
MARSHALL 2,580 1.44%
ELMORE 2,158 1.20%
MORGAN 2,080 1.16%
ETOWAH 1,787 0.99%
LIMESTONE 1,569 0.87%
CULLMAN 1,500 0.83%
TALLADEGA 1,207 0.67%
ST. CLAIR 1,172 0.65%
RUSSELL 1,079 0.60%
DEKALB 1,032 0.57%
CALHOUN 994 0.55%
PIKE 985 0.55%
COFFEE 960 0.53%
DALLAS 942 0.52%
TALLAPOOSA 876 0.49%
COLBERT 796 0.44%
ESCAMBIA 788 0.44%
WALKER 788 0.44%
BUTLER 711 0.40%
JACKSON 694 0.39%
BARBOUR 658 0.37%
DALE 629 0.35%
MARENGO 582 0.32%
CLARKE 532 0.30%
COVINGTON 520 0.29%
AUTAUGA 473 0.26%
CHILTON 459 0.26%
MARION 438 0.24%
18
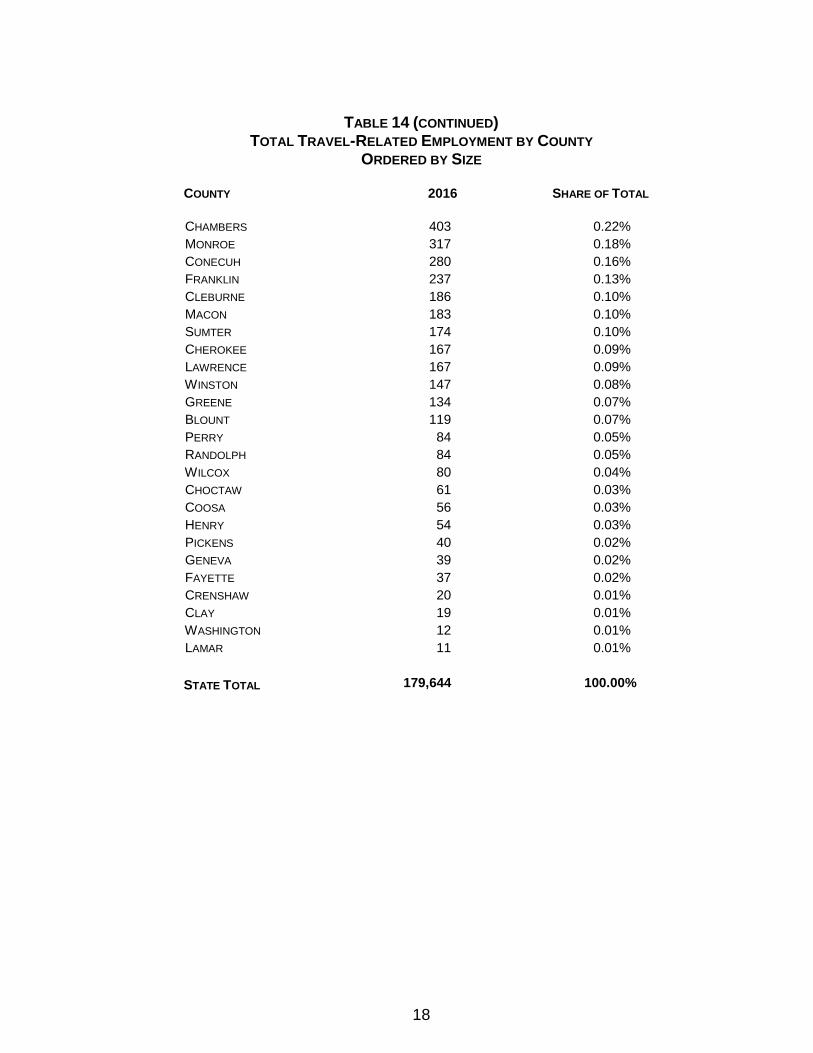
TABLE 14 (CONTINUED) TOTAL TRAVEL-RELATED EMPLOYMENT BY COUNTY
ORDERED BY SIZE
COUNTY 2016 SHARE OF TOTAL
CHAMBERS 403 0.22%
MONROE 317 0.18%
CONECUH 280 0.16%
FRANKLIN 237 0.13%
CLEBURNE 186 0.10%
MACON 183 0.10%
SUMTER 174 0.10%
CHEROKEE 167 0.09%
LAWRENCE 167 0.09%
WINSTON 147 0.08%
GREENE 134 0.07%
BLOUNT 119 0.07%
PERRY 84 0.05%
RANDOLPH 84 0.05%
WILCOX 80 0.04%
CHOCTAW 61 0.03%
COOSA 56 0.03%
HENRY 54 0.03%
PICKENS 40 0.02%
GENEVA 39 0.02%
FAYETTE 37 0.02%
CRENSHAW 20 0.01%
CLAY 19 0.01%
WASHINGTON 12 0.01%
LAMAR 11 0.01%
STATE TOTAL 179,644 100.00%
19
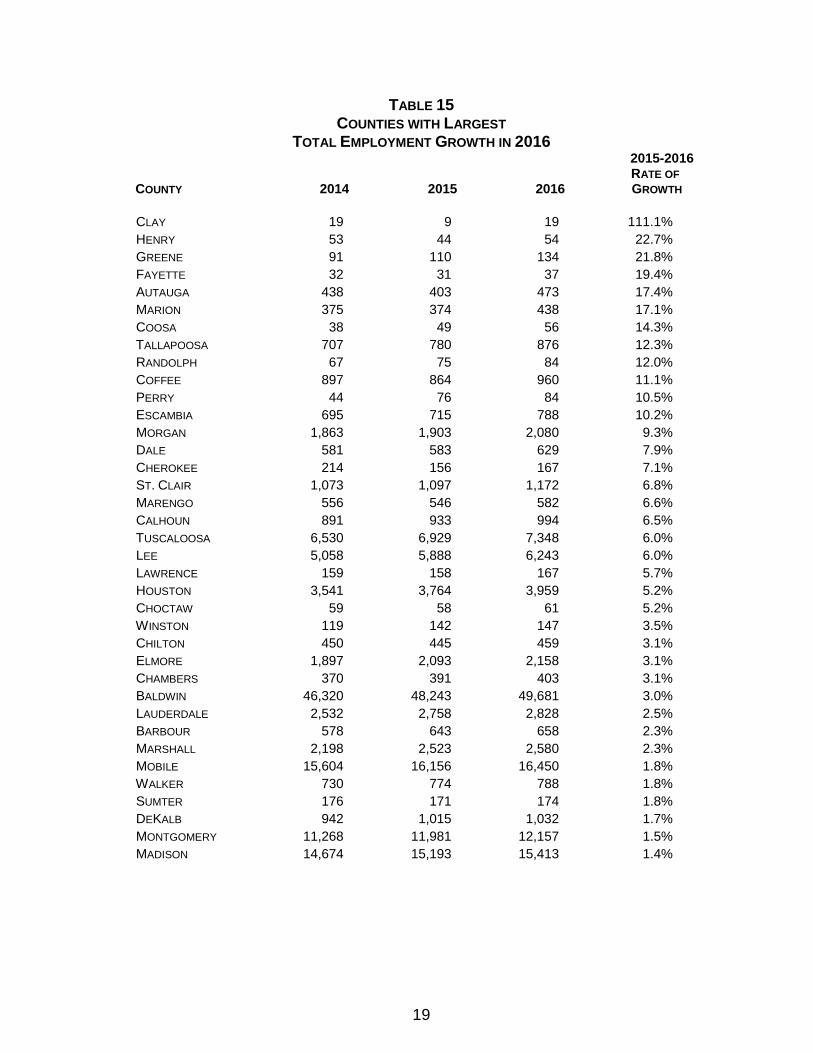
TABLE 15
COUNTIES WITH LARGEST TOTAL EMPLOYMENT GROWTH IN 2016
COUNTY 2014 2015 2016
2015-2016 RATE OF GROWTH
CLAY 19 9 19 111.1%
HENRY 53 44 54 22.7%
GREENE 91 110 134 21.8%
FAYETTE 32 31 37 19.4%
AUTAUGA 438 403 473 17.4%
MARION 375 374 438 17.1%
COOSA 38 49 56 14.3%
TALLAPOOSA 707 780 876 12.3%
RANDOLPH 67 75 84 12.0%
COFFEE 897 864 960 11.1%
PERRY 44 76 84 10.5%
ESCAMBIA 695 715 788 10.2%
MORGAN 1,863 1,903 2,080 9.3%
DALE 581 583 629 7.9%
CHEROKEE 214 156 167 7.1%
ST. CLAIR 1,073 1,097 1,172 6.8%
MARENGO 556 546 582 6.6%
CALHOUN 891 933 994 6.5%
TUSCALOOSA 6,530 6,929 7,348 6.0%
LEE 5,058 5,888 6,243 6.0%
LAWRENCE 159 158 167 5.7%
HOUSTON 3,541 3,764 3,959 5.2%
CHOCTAW 59 58 61 5.2%
WINSTON 119 142 147 3.5%
CHILTON 450 445 459 3.1%
ELMORE 1,897 2,093 2,158 3.1%
CHAMBERS 370 391 403 3.1%
BALDWIN 46,320 48,243 49,681 3.0%
LAUDERDALE 2,532 2,758 2,828 2.5%
BARBOUR 578 643 658 2.3%
MARSHALL 2,198 2,523 2,580 2.3%
MOBILE 15,604 16,156 16,450 1.8%
WALKER 730 774 788 1.8%
SUMTER 176 171 174 1.8%
DEKALB 942 1,015 1,032 1.7%
MONTGOMERY 11,268 11,981 12,157 1.5%
MADISON 14,674 15,193 15,413 1.4%
20
LODGING TAX-SEASONAL AND DESIGNATED DEMOGRAPHIC AREA
ANALYSES
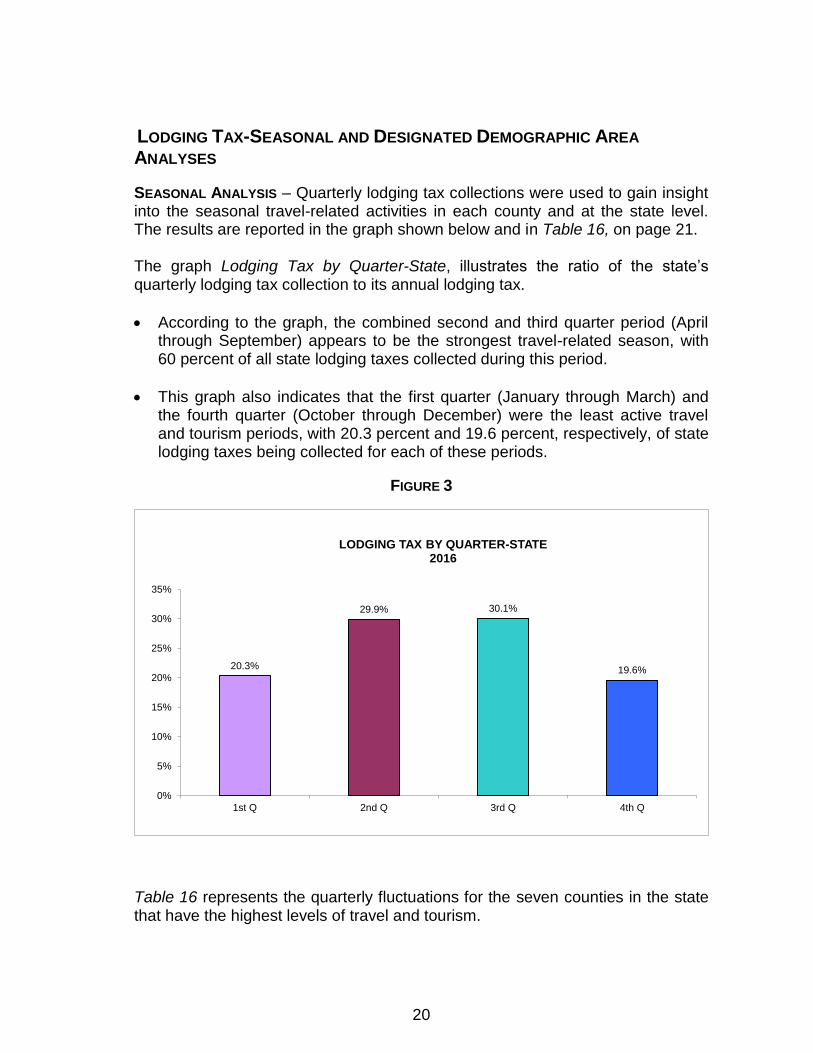
SEASONAL ANALYSIS – Quarterly lodging tax collections were used to gain insight into the seasonal travel-related activities in each county and at the state level. The results are reported in the graph shown below and in Table 16, on page 21. The graph Lodging Tax by Quarter-State, illustrates the ratio of the state’s quarterly lodging tax collection to its annual lodging tax.
According to the graph, the combined second and third quarter period (April through September) appears to be the strongest travel-related season, with 60 percent of all state lodging taxes collected during this period.
This graph also indicates that the first quarter (January through March) and the fourth quarter (October through December) were the least active travel and tourism periods, with 20.3 percent and 19.6 percent, respectively, of state lodging taxes being collected for each of these periods.
FIGURE 3
20.3%
29.9% 30.1%
19.6%
0%
5%
10%
15%
20%
25%
30%
35%
1st Q 2nd Q 3rd Q 4th Q
LODGING TAX BY QUARTER-STATE2016
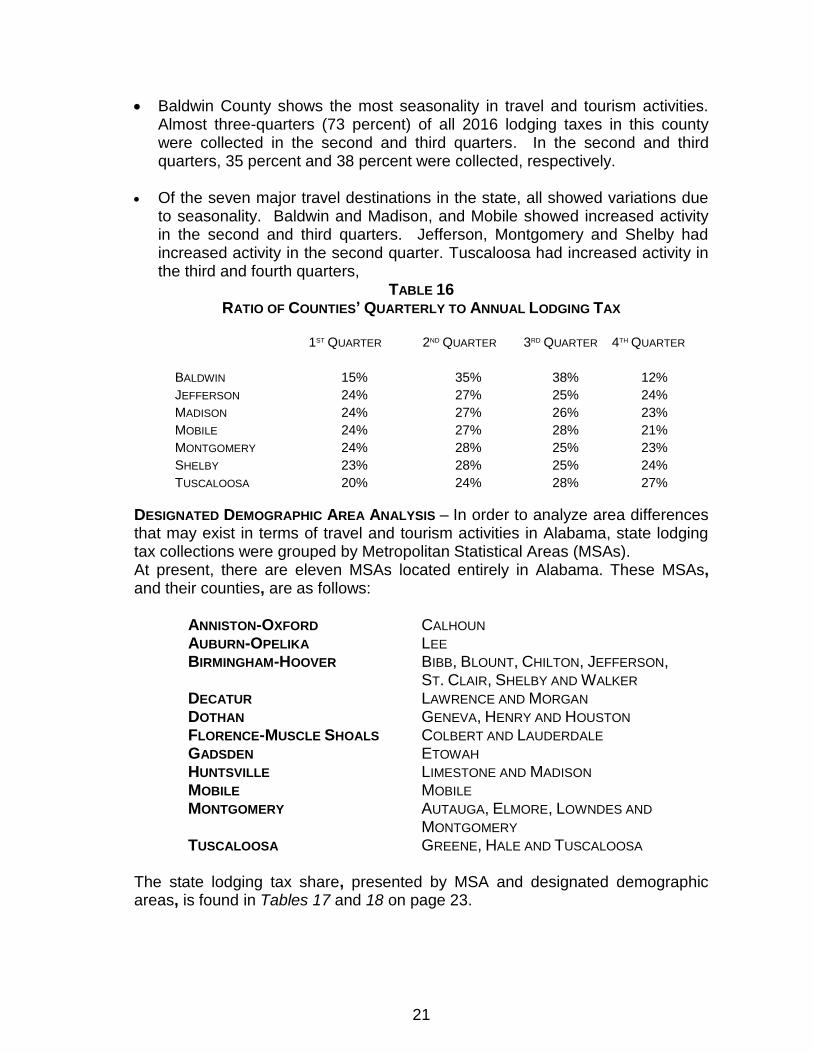
Table 16 represents the quarterly fluctuations for the seven counties in the state that have the highest levels of travel and tourism.
21
Baldwin County shows the most seasonality in travel and tourism activities. Almost three-quarters (73 percent) of all 2016 lodging taxes in this county were collected in the second and third quarters. In the second and third quarters, 35 percent and 38 percent were collected, respectively.
Of the seven major travel destinations in the state, all showed variations due
to seasonality. Baldwin and Madison, and Mobile showed increased activity in the second and third quarters. Jefferson, Montgomery and Shelby had increased activity in the second quarter. Tuscaloosa had increased activity in the third and fourth quarters,
TABLE 16 RATIO OF COUNTIES’ QUARTERLY TO ANNUAL LODGING TAX
1ST QUARTER 2ND QUARTER 3RD QUARTER 4TH QUARTER
BALDWIN 15% 35% 38% 12%
JEFFERSON 24% 27% 25% 24%
MADISON 24% 27% 26% 23%
MOBILE 24% 27% 28% 21%
MONTGOMERY 24% 28% 25% 23%
SHELBY 23% 28% 25% 24%
TUSCALOOSA 20% 24% 28% 27%
DESIGNATED DEMOGRAPHIC AREA ANALYSIS – In order to analyze area differences that may exist in terms of travel and tourism activities in Alabama, state lodging tax collections were grouped by Metropolitan Statistical Areas (MSAs). At present, there are eleven MSAs located entirely in Alabama. These MSAs, and their counties, are as follows:
ANNISTON-OXFORD CALHOUN AUBURN-OPELIKA LEE BIRMINGHAM-HOOVER BIBB, BLOUNT, CHILTON, JEFFERSON, ST. CLAIR, SHELBY AND WALKER DECATUR LAWRENCE AND MORGAN DOTHAN GENEVA, HENRY AND HOUSTON FLORENCE-MUSCLE SHOALS COLBERT AND LAUDERDALE GADSDEN ETOWAH HUNTSVILLE LIMESTONE AND MADISON MOBILE MOBILE MONTGOMERY AUTAUGA, ELMORE, LOWNDES AND MONTGOMERY TUSCALOOSA GREENE, HALE AND TUSCALOOSA
The state lodging tax share, presented by MSA and designated demographic areas, is found in Tables 17 and 18 on page 23.
22
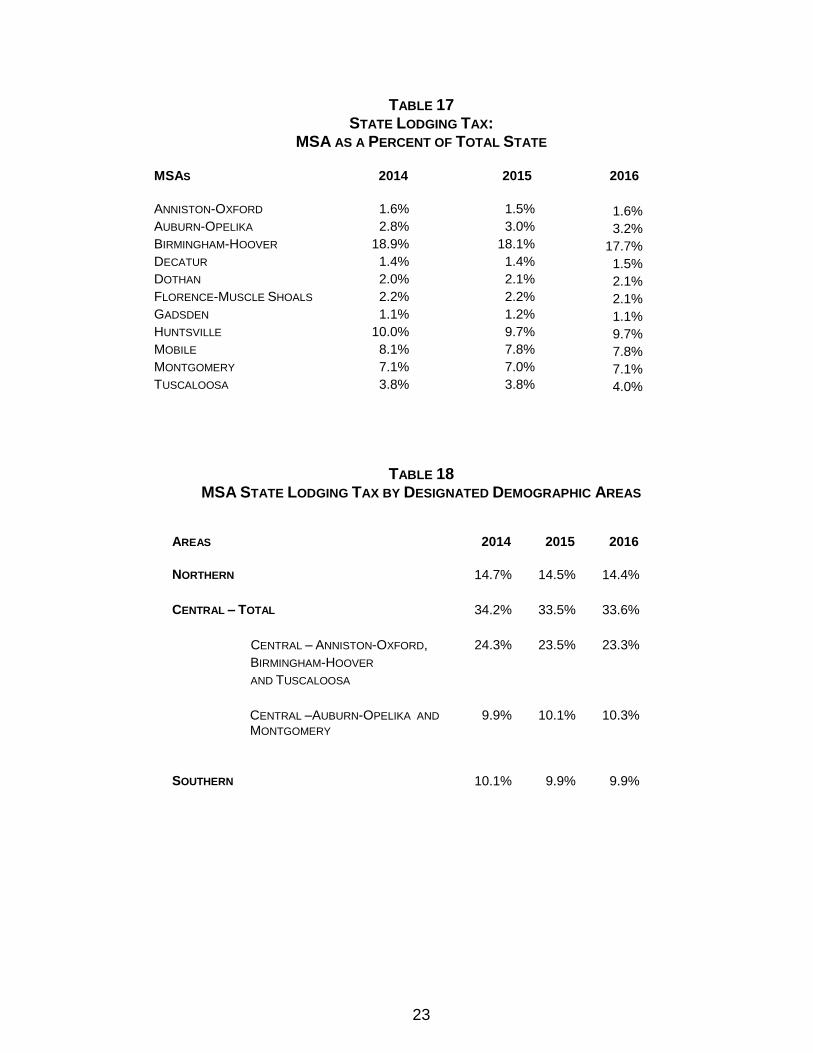
Table 17 shows the state lodging tax share of each MSA relative to the total lodging tax for the state. This information can be summarized as follows:
58 percent of all the lodging tax in the state is collected in these 11 MSAs.
The Birmingham-Hoover MSA is largest in terms of travel-related spending.
Huntsville MSA is second, Mobile MSA is third and Montgomery MSA is fourth in terms of travel-related spending.
In Table 18, MSAs are combined to form Designated Demographic Areas. These are as follows: NORTHERN AREA DECATUR, FLORENCE-MUSCLE SHOALS,
HUNTSVILLE AND GADSDEN
CENTRAL AREA ANNISTON-OXFORD, AUBURN-OPELIKA, BIRMINGHAM- HOOVER, MONTGOMERY AND TUSCALOOSA
SOUTHERN AREA DOTHAN AND MOBILE Table 18 shows the lodging tax share of each area relative to the state. These results can be summarized as follows:
The Central Area has the largest lodging tax share, with 33.6 percent of the state’s total.
The Northern Area is second, in terms of travel and tourism activities, with 14.4 percent of the state’s total.
The Southern Area is ranked third in comparison to the Central and Northern areas, with a 9.9 percent share of the state’s travel and tourism activities.
23
TABLE 17 STATE LODGING TAX:
MSA AS A PERCENT OF TOTAL STATE
MSAS 2014 2015 2016
ANNISTON-OXFORD 1.6% 1.5% 1.6% AUBURN-OPELIKA 2.8% 3.0% 3.2% BIRMINGHAM-HOOVER 18.9% 18.1% 17.7% DECATUR 1.4% 1.4% 1.5% DOTHAN 2.0% 2.1% 2.1% FLORENCE-MUSCLE SHOALS 2.2% 2.2% 2.1% GADSDEN 1.1% 1.2% 1.1% HUNTSVILLE 10.0% 9.7% 9.7% MOBILE 8.1% 7.8% 7.8% MONTGOMERY 7.1% 7.0% 7.1% TUSCALOOSA 3.8% 3.8% 4.0%
TABLE 18 MSA STATE LODGING TAX BY DESIGNATED DEMOGRAPHIC AREAS
AREAS 2014 2015 2016
NORTHERN 14.7% 14.5% 14.4%
CENTRAL – TOTAL 34.2% 33.5% 33.6%
CENTRAL – ANNISTON-OXFORD, 24.3% 23.5% 23.3%
BIRMINGHAM-HOOVER
AND TUSCALOOSA
CENTRAL –AUBURN-OPELIKA AND
MONTGOMERY 9.9% 10.1% 10.3%
SOUTHERN 10.1% 9.9% 9.9%
24
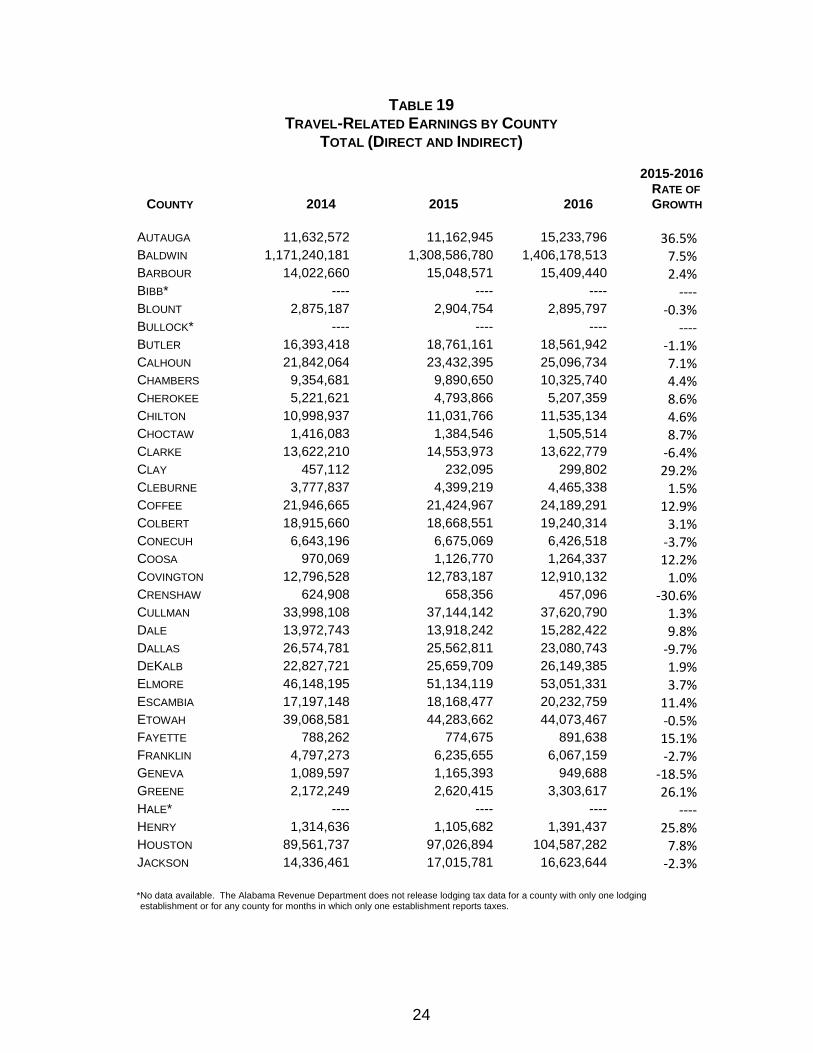
TABLE 19 TRAVEL-RELATED EARNINGS BY COUNTY
TOTAL (DIRECT AND INDIRECT)
COUNTY 2014 2015 2016
2015-2016 RATE OF GROWTH
AUTAUGA 11,632,572 11,162,945 15,233,796 36.5% BALDWIN 1,171,240,181 1,308,586,780 1,406,178,513 7.5% BARBOUR 14,022,660 15,048,571 15,409,440 2.4% BIBB* ---- ---- ---- ---- BLOUNT 2,875,187 2,904,754 2,895,797 -0.3% BULLOCK* ---- ---- ---- ---- BUTLER 16,393,418 18,761,161 18,561,942 -1.1% CALHOUN 21,842,064 23,432,395 25,096,734 7.1% CHAMBERS 9,354,681 9,890,650 10,325,740 4.4% CHEROKEE 5,221,621 4,793,866 5,207,359 8.6% CHILTON 10,998,937 11,031,766 11,535,134 4.6% CHOCTAW 1,416,083 1,384,546 1,505,514 8.7% CLARKE 13,622,210 14,553,973 13,622,779 -6.4% CLAY 457,112 232,095 299,802 29.2% CLEBURNE 3,777,837 4,399,219 4,465,338 1.5% COFFEE 21,946,665 21,424,967 24,189,291 12.9% COLBERT 18,915,660 18,668,551 19,240,314 3.1% CONECUH 6,643,196 6,675,069 6,426,518 -3.7% COOSA 970,069 1,126,770 1,264,337 12.2% COVINGTON 12,796,528 12,783,187 12,910,132 1.0% CRENSHAW 624,908 658,356 457,096 -30.6% CULLMAN 33,998,108 37,144,142 37,620,790 1.3% DALE 13,972,743 13,918,242 15,282,422 9.8% DALLAS 26,574,781 25,562,811 23,080,743 -9.7% DEKALB 22,827,721 25,659,709 26,149,385 1.9% ELMORE 46,148,195 51,134,119 53,051,331 3.7% ESCAMBIA 17,197,148 18,168,477 20,232,759 11.4% ETOWAH 39,068,581 44,283,662 44,073,467 -0.5% FAYETTE 788,262 774,675 891,638 15.1% FRANKLIN 4,797,273 6,235,655 6,067,159 -2.7% GENEVA 1,089,597 1,165,393 949,688 -18.5% GREENE 2,172,249 2,620,415 3,303,617 26.1% HALE* ---- ---- ---- ---- HENRY 1,314,636 1,105,682 1,391,437 25.8% HOUSTON 89,561,737 97,026,894 104,587,282 7.8% JACKSON 14,336,461 17,015,781 16,623,644 -2.3%
*No data available. The Alabama Revenue Department does not release lodging tax data for a county with only one lodging establishment or for any county for months in which only one establishment reports taxes.
25
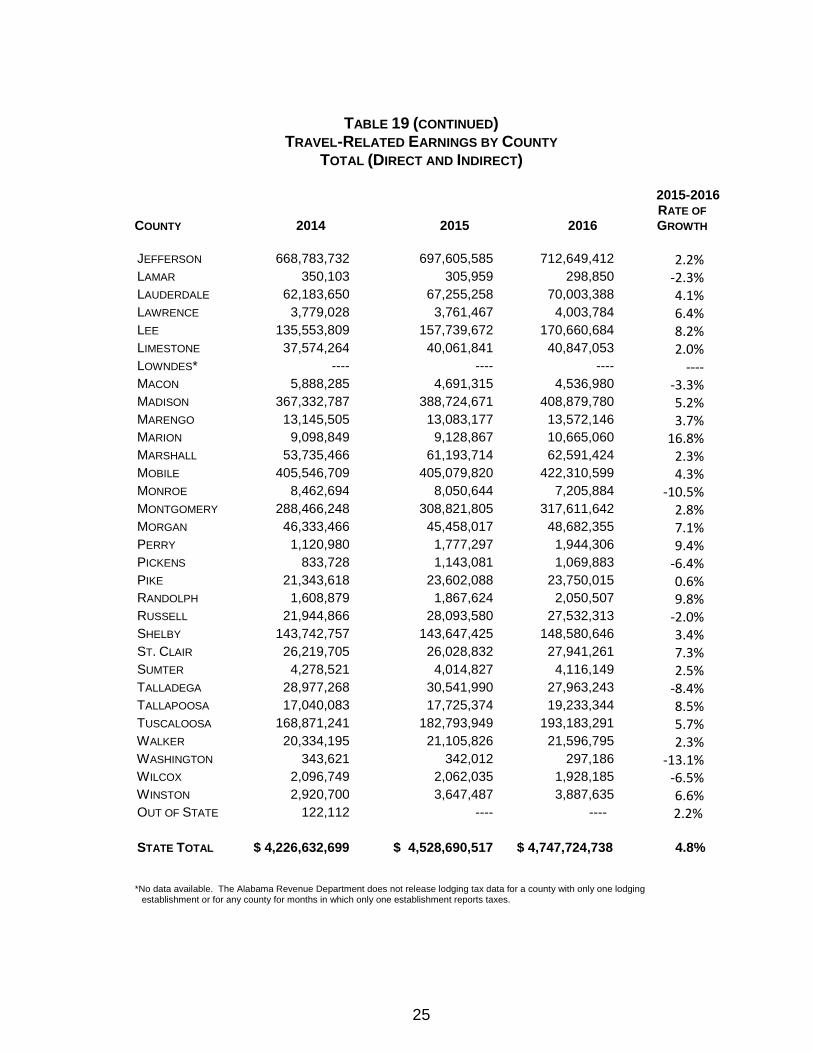
TABLE 19 (CONTINUED)
TRAVEL-RELATED EARNINGS BY COUNTY TOTAL (DIRECT AND INDIRECT)
COUNTY
2014 2015 2016
2015-2016
RATE OF
GROWTH
JEFFERSON 668,783,732 697,605,585 712,649,412 2.2% LAMAR 350,103 305,959 298,850 -2.3% LAUDERDALE 62,183,650 67,255,258 70,003,388 4.1% LAWRENCE 3,779,028 3,761,467 4,003,784 6.4% LEE 135,553,809 157,739,672 170,660,684 8.2% LIMESTONE 37,574,264 40,061,841 40,847,053 2.0% LOWNDES* ---- ---- ---- ---- MACON 5,888,285 4,691,315 4,536,980 -3.3% MADISON 367,332,787 388,724,671 408,879,780 5.2% MARENGO 13,145,505 13,083,177 13,572,146 3.7% MARION 9,098,849 9,128,867 10,665,060 16.8% MARSHALL 53,735,466 61,193,714 62,591,424 2.3% MOBILE 405,546,709 405,079,820 422,310,599 4.3% MONROE 8,462,694 8,050,644 7,205,884 -10.5% MONTGOMERY 288,466,248 308,821,805 317,611,642 2.8% MORGAN 46,333,466 45,458,017 48,682,355 7.1% PERRY 1,120,980 1,777,297 1,944,306 9.4% PICKENS 833,728 1,143,081 1,069,883 -6.4% PIKE 21,343,618 23,602,088 23,750,015 0.6% RANDOLPH 1,608,879 1,867,624 2,050,507 9.8% RUSSELL 21,944,866 28,093,580 27,532,313 -2.0% SHELBY 143,742,757 143,647,425 148,580,646 3.4% ST. CLAIR 26,219,705 26,028,832 27,941,261 7.3% SUMTER 4,278,521 4,014,827 4,116,149 2.5% TALLADEGA 28,977,268 30,541,990 27,963,243 -8.4% TALLAPOOSA 17,040,083 17,725,374 19,233,344 8.5% TUSCALOOSA 168,871,241 182,793,949 193,183,291 5.7% WALKER 20,334,195 21,105,826 21,596,795 2.3% WASHINGTON 343,621 342,012 297,186 -13.1% WILCOX 2,096,749 2,062,035 1,928,185 -6.5% WINSTON 2,920,700 3,647,487 3,887,635 6.6% OUT OF STATE 122,112 ---- ---- 2.2% STATE TOTAL $ 4,226,632,699 $ 4,528,690,517 $ 4,747,724,738 4.8%
*No data available. The Alabama Revenue Department does not release lodging tax data for a county with only one lodging
establishment or for any county for months in which only one establishment reports taxes.
26
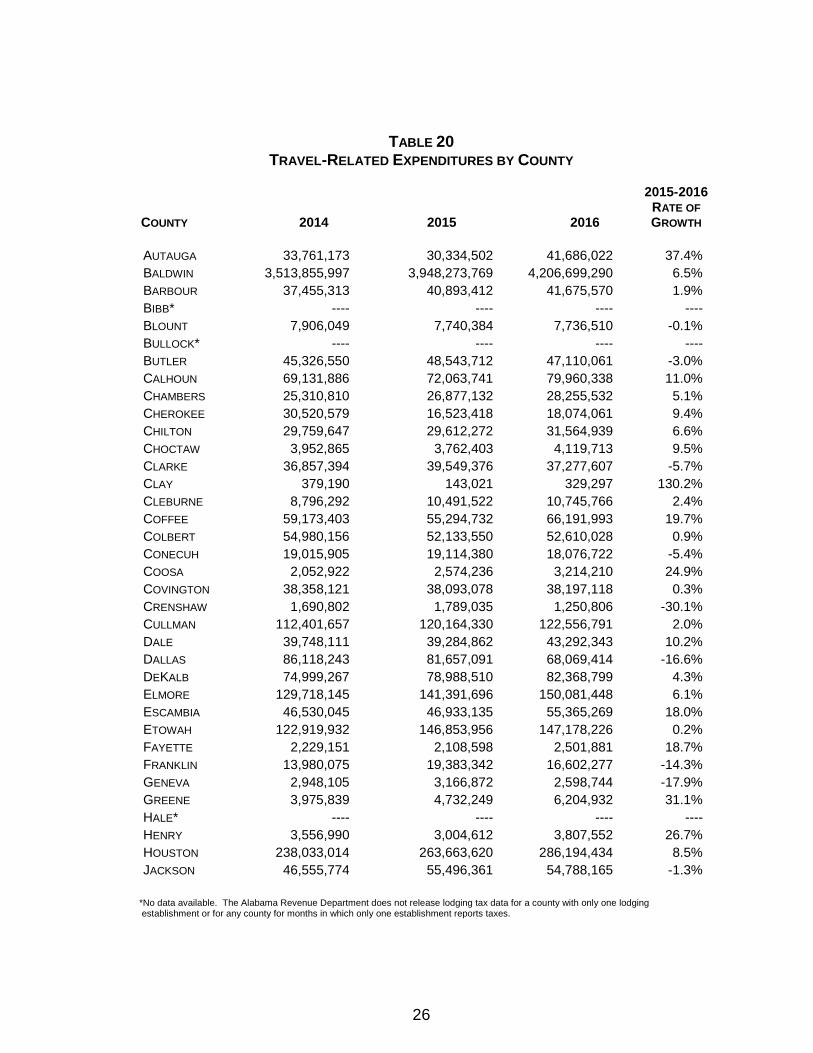
TABLE 20 TRAVEL-RELATED EXPENDITURES BY COUNTY
COUNTY 2014 2015 2016
2015-2016
RATE OF
GROWTH
AUTAUGA 33,761,173 30,334,502 41,686,022 37.4%
BALDWIN 3,513,855,997 3,948,273,769 4,206,699,290 6.5%
BARBOUR 37,455,313 40,893,412 41,675,570 1.9%
BIBB* ---- ---- ---- ----
BLOUNT 7,906,049 7,740,384 7,736,510 -0.1%
BULLOCK* ---- ---- ---- ----
BUTLER 45,326,550 48,543,712 47,110,061 -3.0%
CALHOUN 69,131,886 72,063,741 79,960,338 11.0%
CHAMBERS 25,310,810 26,877,132 28,255,532 5.1%
CHEROKEE 30,520,579 16,523,418 18,074,061 9.4%
CHILTON 29,759,647 29,612,272 31,564,939 6.6%
CHOCTAW 3,952,865 3,762,403 4,119,713 9.5%
CLARKE 36,857,394 39,549,376 37,277,607 -5.7%
CLAY 379,190 143,021 329,297 130.2%
CLEBURNE 8,796,292 10,491,522 10,745,766 2.4%
COFFEE 59,173,403 55,294,732 66,191,993 19.7%
COLBERT 54,980,156 52,133,550 52,610,028 0.9%
CONECUH 19,015,905 19,114,380 18,076,722 -5.4%
COOSA 2,052,922 2,574,236 3,214,210 24.9%
COVINGTON 38,358,121 38,093,078 38,197,118 0.3%
CRENSHAW 1,690,802 1,789,035 1,250,806 -30.1%
CULLMAN 112,401,657 120,164,330 122,556,791 2.0%
DALE 39,748,111 39,284,862 43,292,343 10.2%
DALLAS 86,118,243 81,657,091 68,069,414 -16.6%
DEKALB 74,999,267 78,988,510 82,368,799 4.3%
ELMORE 129,718,145 141,391,696 150,081,448 6.1%
ESCAMBIA 46,530,045 46,933,135 55,365,269 18.0%
ETOWAH 122,919,932 146,853,956 147,178,226 0.2%
FAYETTE 2,229,151 2,108,598 2,501,881 18.7%
FRANKLIN 13,980,075 19,383,342 16,602,277 -14.3%
GENEVA 2,948,105 3,166,872 2,598,744 -17.9%
GREENE 3,975,839 4,732,249 6,204,932 31.1%
HALE* ---- ---- ---- ----
HENRY 3,556,990 3,004,612 3,807,552 26.7%
HOUSTON 238,033,014 263,663,620 286,194,434 8.5%
JACKSON 46,555,774 55,496,361 54,788,165 -1.3%
*No data available. The Alabama Revenue Department does not release lodging tax data for a county with only one lodging
establishment or for any county for months in which only one establishment reports taxes.
27
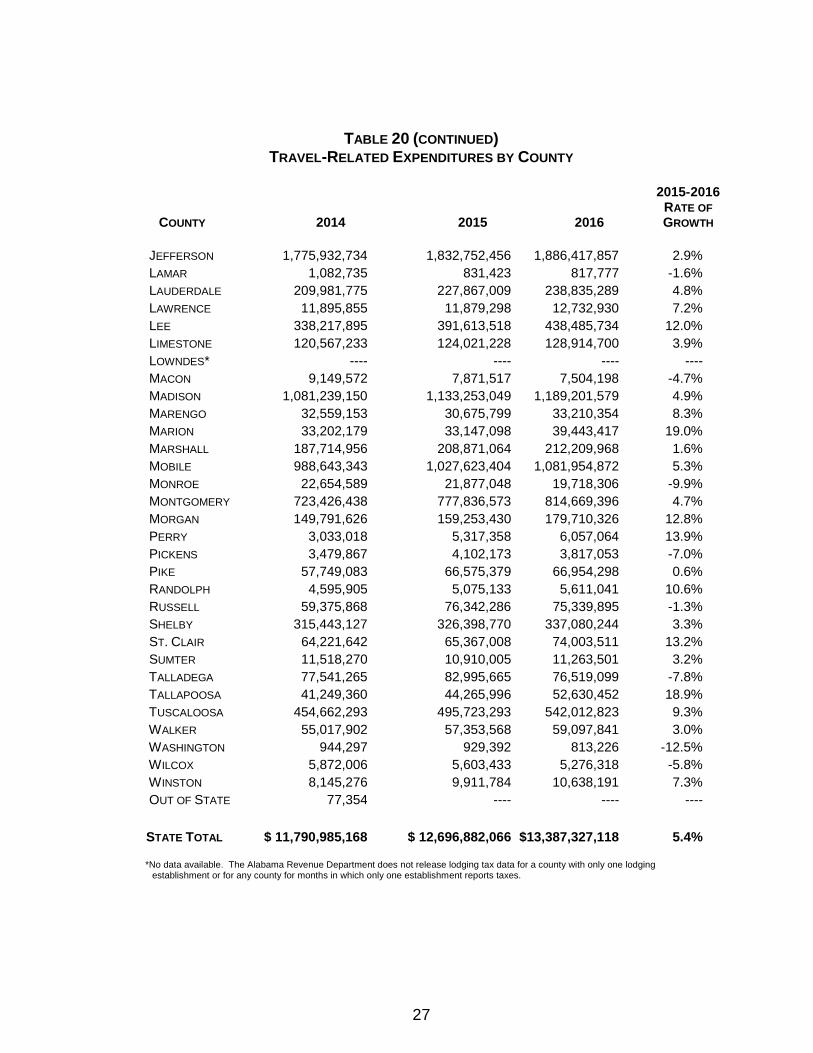
TABLE 20 (CONTINUED) TRAVEL-RELATED EXPENDITURES BY COUNTY
COUNTY 2014 2015 2016
2015-2016
RATE OF
GROWTH
JEFFERSON 1,775,932,734 1,832,752,456 1,886,417,857 2.9%
LAMAR 1,082,735 831,423 817,777 -1.6%
LAUDERDALE 209,981,775 227,867,009 238,835,289 4.8%
LAWRENCE 11,895,855 11,879,298 12,732,930 7.2%
LEE 338,217,895 391,613,518 438,485,734 12.0%
LIMESTONE 120,567,233 124,021,228 128,914,700 3.9%
LOWNDES* ---- ---- ---- ----
MACON 9,149,572 7,871,517 7,504,198 -4.7%
MADISON 1,081,239,150 1,133,253,049 1,189,201,579 4.9%
MARENGO 32,559,153 30,675,799 33,210,354 8.3%
MARION 33,202,179 33,147,098 39,443,417 19.0%
MARSHALL 187,714,956 208,871,064 212,209,968 1.6%
MOBILE 988,643,343 1,027,623,404 1,081,954,872 5.3%
MONROE 22,654,589 21,877,048 19,718,306 -9.9%
MONTGOMERY 723,426,438 777,836,573 814,669,396 4.7%
MORGAN 149,791,626 159,253,430 179,710,326 12.8%
PERRY 3,033,018 5,317,358 6,057,064 13.9%
PICKENS 3,479,867 4,102,173 3,817,053 -7.0%
PIKE 57,749,083 66,575,379 66,954,298 0.6%
RANDOLPH 4,595,905 5,075,133 5,611,041 10.6%
RUSSELL 59,375,868 76,342,286 75,339,895 -1.3%
SHELBY 315,443,127 326,398,770 337,080,244 3.3%
ST. CLAIR 64,221,642 65,367,008 74,003,511 13.2%
SUMTER 11,518,270 10,910,005 11,263,501 3.2%
TALLADEGA 77,541,265 82,995,665 76,519,099 -7.8%
TALLAPOOSA 41,249,360 44,265,996 52,630,452 18.9%
TUSCALOOSA 454,662,293 495,723,293 542,012,823 9.3%
WALKER 55,017,902 57,353,568 59,097,841 3.0%
WASHINGTON 944,297 929,392 813,226 -12.5%
WILCOX 5,872,006 5,603,433 5,276,318 -5.8%
WINSTON 8,145,276 9,911,784 10,638,191 7.3%
OUT OF STATE 77,354 ---- ---- ----
STATE TOTAL $ 11,790,985,168 $ 12,696,882,066 $13,387,327,118 5.4%
*No data available. The Alabama Revenue Department does not release lodging tax data for a county with only one lodging
establishment or for any county for months in which only one establishment reports taxes.
28
TABLE 21 ANNUAL STATE LODGING TAX
COUNTY 2014 2015 2016
2015-2016 DOLLAR
INCREASE/ DECREASE
2015-2016
RATE OF
GROWTH
AUTAUGA 163,444 146,855 201,809 54,954 37.4%
BALDWIN 17,777,992 19,975,884 21,283,361 1,307,477 6.5%
BARBOUR 181,328 197,972 201,759 3,787 1.9%
BIBB# ---- ---- ---- ---- ----
BLOUNT* 41,657 40,784 40,764 -20 0.0%
BULLOCK# ---- ---- ---- ---- ----
BUTLER 215,444 230,736 223,921 -6,815 -3.0%
CALHOUN ± 910,648 949,268 1,053,287 104,019 11.0%
CHAMBERS 123,679 131,333 138,068 6,735 5.1%
CHEROKEE* 148,359 80,320 87,857 7,537 9.4%
CHILTON 144,072 143,358 152,811 9,453 6.6%
CHOCTAW 19,873 18,915 20,711 1,796 9.5%
CLARKE 178,433 191,465 180,467 -10,998 -5.7%
CLAY 1,906 719 1,656 937 130.3%
CLEBURNE 44,222 52,745 54,023 1,278 2.4%
COFFEE 294,653 275,340 329,602 54,262 19.7%
COLBERT* 270,847 256,824 259,171 2,347 0.9%
CONECUH 95,600 96,095 90,878 -5,217 -5.4%
COOSA 10,321 12,942 16,159 3,217 24.9%
COVINGTON 166,123 164,975 165,426 451 0.3%
CRENSHAW 25,221 26,687 18,658 -8,029 -30.1%
CULLMAN* 560,967 599,708 611,648 11,940 2.0%
DALE 192,427 190,185 209,586 19,401 10.2%
DALLAS 262,357 248,766 207,372 -41,394 -16.6%
DEKALB* 383,274 403,660 420,935 17,275 4.3%
ELMORE 652,141 710,829 754,515 43,686 6.1%
ESCAMBIA 233,924 235,950 278,342 42,392 18.0%
ETOWAH* 615,232 735,025 736,648 1,623 0.2%
FAYETTE 10,674 10,338 12,266 1,928 18.6%
FRANKLIN* 87,017 120,649 103,339 -17,310 -14.3%
GENEVA 14,821 15,921 13,065 -2,856 -17.9%
GREENE 25,710 30,601 40,124 9,523 31.1%
HALE# ---- ---- ---- ---- ----
HENRY 17,882 15,105 19,142 4,037 26.7%
HOUSTON 1,152,359 1,276,441 1,385,517 109,076 8.5% * Denotes the Alabama Mountain Lakes Tourist Association area counties with a 5 percent rate. The state lodging tax rate is 4 percent, except for counties in the AMLTA area.
± Denotes areas where local lodging tax data were used for the economic model due to inconsistent trends in state lodging tax data.
#No data available. The Alabama Revenue Department does not release lodging tax data for a county with only one lodging establishment or for any county for months in which only one establishment reports taxes.
29
TABLE 21 (CONTINUED)
ANNUAL STATE LODGING TAX
COUNTY 2014 2015 2016
2015-2016 DOLLAR
INCREASE/ DECREASE
2015-2016
RATE OF GROWTH
JACKSON* ± 291,614 342,918 337,357 -5,561 -1.6%
JEFFERSON 8,677,948 8,955,593 9,217,825 262,232 2.9%
LAMAR 5,443 4,180 4,111 -69 -1.7%
LAUDERDALE* 1,009,816 1,095,827 1,148,575 52,748 4.8%
LAWRENCE* 63,711 63,622 68,194 4,572 7.2%
LEE 1,637,371 1,895,869 2,122,785 226,916 12.0%
LIMESTONE* 600,634 617,841 642,219 24,378 3.9%
LOWNDES# ---- ---- ---- ---- ----
MACON 45,998 39,573 37,726 -1,847 -4.7%
MADISON* 5,218,322 5,469,354 5,739,375 270,021 4.9%
MARENGO 163,687 154,219 166,961 12,742 8.3%
MARION* 168,347 168,068 199,992 31,924 19.0%
MARSHALL* ± 610,559 641,954 695,330 53,376 8.3%
MOBILE 4,699,171 4,884,450 5,142,695 258,245 5.3%
MONROE 113,893 109,984 99,131 -10,853 -9.9%
MONTGOMERY ± 3,281,158 3,527,940 3,694,998 167,058 4.7%
MORGAN* 751,674 799,155 901,810 102,655 12.8%
PERRY 15,103 26,478 30,161 3,683 13.9%
PICKENS 11,167 13,164 12,249 -915 -7.0%
PIKE 290,326 334,699 336,604 1,905 0.6%
RANDOLPH 23,105 25,515 28,209 2,694 10.6%
RUSSELL 287,449 369,586 364,733 -4,853 -1.3%
SHELBY 1,513,104 1,565,656 1,616,892 51,236 3.3%
ST. CLAIR 322,866 328,624 372,043 43,419 13.2%
SUMTER 57,355 54,326 56,087 1,761 3.2%
TALLADEGA 371,947 398,110 367,044 -31,066 -7.8%
TALLAPOOSA 207,376 222,542 264,593 42,051 18.9%
TUSCALOOSA 2,161,079 2,356,248 2,576,269 220,021 9.3%
WALKER 276,595 288,338 297,107 8,769 3.0%
WASHINGTON 4,747 4,672 4,088 -584 -12.5%
WILCOX 28,964 27,639 26,026 -1,613 -5.8%
WINSTON* 50,699 61,695 66,216 4,521 7.3%
OUT OF STATE 389 ---- 13,501 ---- ----
STATE TOTAL $57,984,224 $62,434,234 $65,963,793
$3,529,559
5.7%
* Denotes the Alabama Mountain Lakes Tourist Association area counties with a 5 percent rate. The state lodging tax rate is 4 percent, except for counties in the AMLTA area.
± Denotes areas where local lodging tax data were used for the economic model due to inconsistent trends in state lodging tax data.
#No data available. The Alabama Revenue Department does not release lodging tax data for a county with only one lodging establishment or for any county for months in which only one establishment reports taxes.
Alabama Tourism DepartmentP.O. Box 4927
Montgomery, AL 36103-4927800-ALABAMA • www.Alabama.travel