Embed Size (px)
Citation preview
EMBARGOED UNTIL RELEASE AT 8:30 A.M. EST, WEDNESDAY, December 13, 2017 BEA 1766
Technical: Sarah OsborneSeth Markowitz
(301) 2789459(301) 2789486
Media: Jeannine Aversa (301) 2789003 [email protected]
Travel and Tourism Spending Accelerated in the Third Quarter Travel and Tourism Satellite Account: Third Quarter 2017
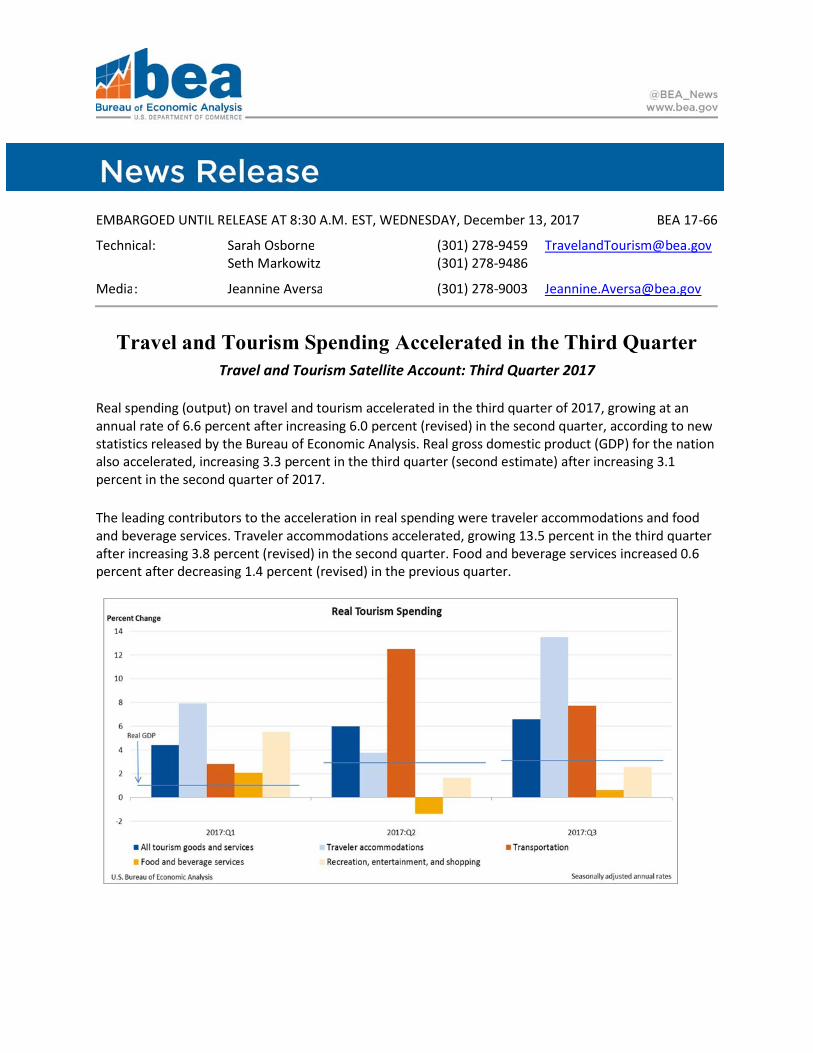
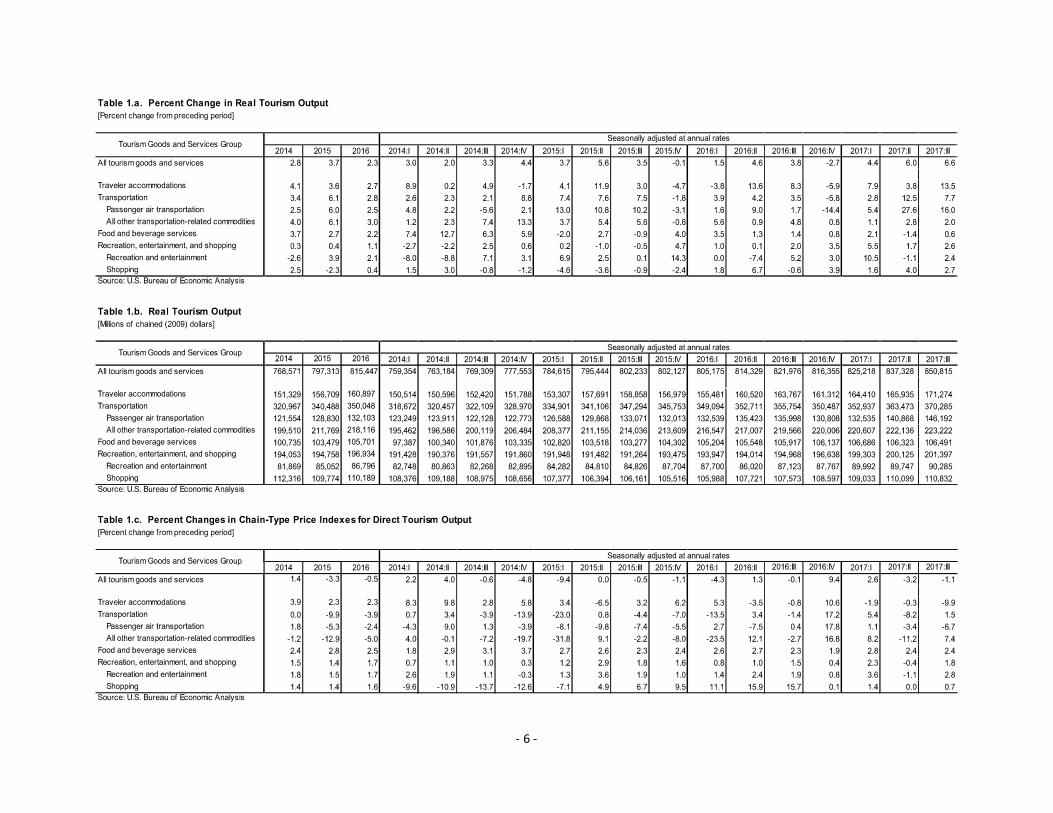
Real spending (output) on travel and tourism accelerated in the third quarter of 2017, growing at an annual rate of 6.6 percent after increasing 6.0 percent (revised) in the second quarter, according to new statistics released by the Bureau of Economic Analysis. Real gross domestic product (GDP) for the nation also accelerated, increasing 3.3 percent in the third quarter (second estimate) after increasing 3.1 percent in the second quarter of 2017.
The leading contributors to the acceleration in real spending were traveler accommodations and food and beverage services. Traveler accommodations accelerated, growing 13.5 percent in the third quarter after increasing 3.8 percent (revised) in the second quarter. Food and beverage services increased 0.6 percent after decreasing 1.4 percent (revised) in the previous quarter.
2
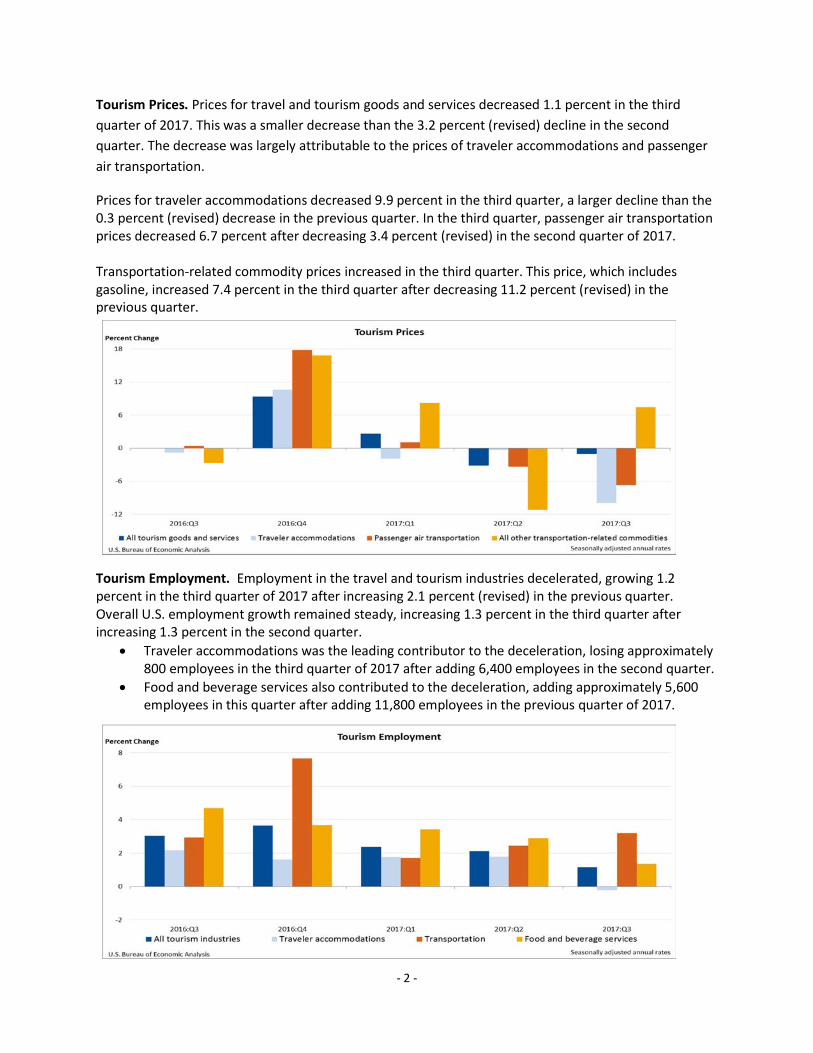
Tourism Prices. Prices for travel and tourism goods and services decreased 1.1 percent in the third quarter of 2017. This was a smaller decrease than the 3.2 percent (revised) decline in the second quarter. The decrease was largely attributable to the prices of traveler accommodations and passenger air transportation.
Prices for traveler accommodations decreased 9.9 percent in the third quarter, a larger decline than the 0.3 percent (revised) decrease in the previous quarter. In the third quarter, passenger air transportation prices decreased 6.7 percent after decreasing 3.4 percent (revised) in the second quarter of 2017.
Transportationrelated commodity prices increased in the third quarter. This price, which includes gasoline, increased 7.4 percent in the third quarter after decreasing 11.2 percent (revised) in the previous quarter.
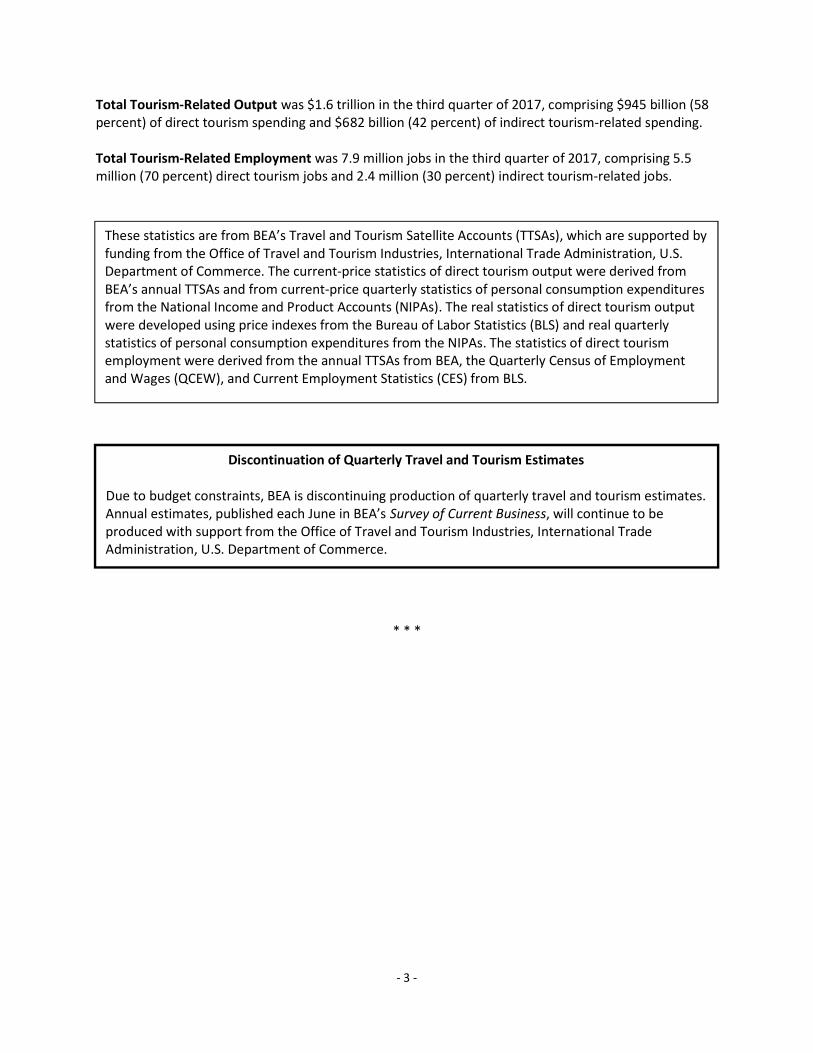
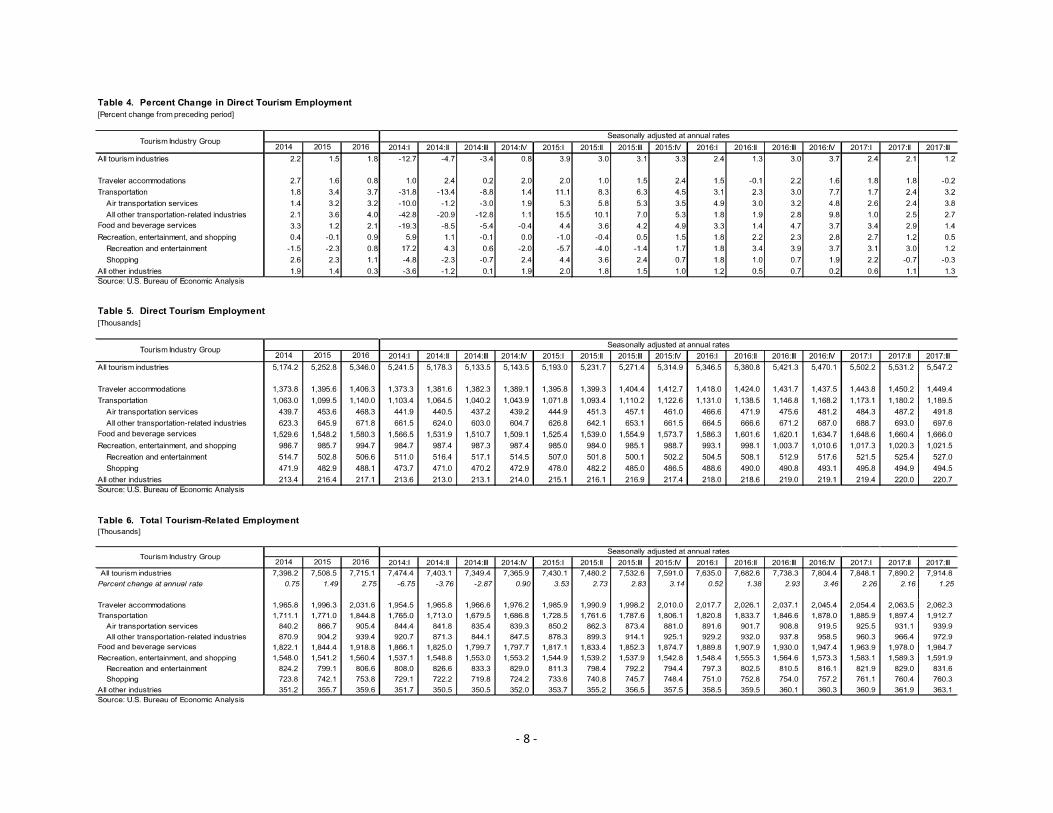
Tourism Employment. Employment in the travel and tourism industries decelerated, growing 1.2 percent in the third quarter of 2017 after increasing 2.1 percent (revised) in the previous quarter. Overall U.S. employment growth remained steady, increasing 1.3 percent in the third quarter after increasing 1.3 percent in the second quarter.
Traveler accommodations was the leading contributor to the deceleration, losing approximately 800 employees in the third quarter of 2017 after adding 6,400 employees in the second quarter. Food and beverage services also contributed to the deceleration, adding approximately 5,600 employees in this quarter after adding 11,800 employees in the previous quarter of 2017.
3
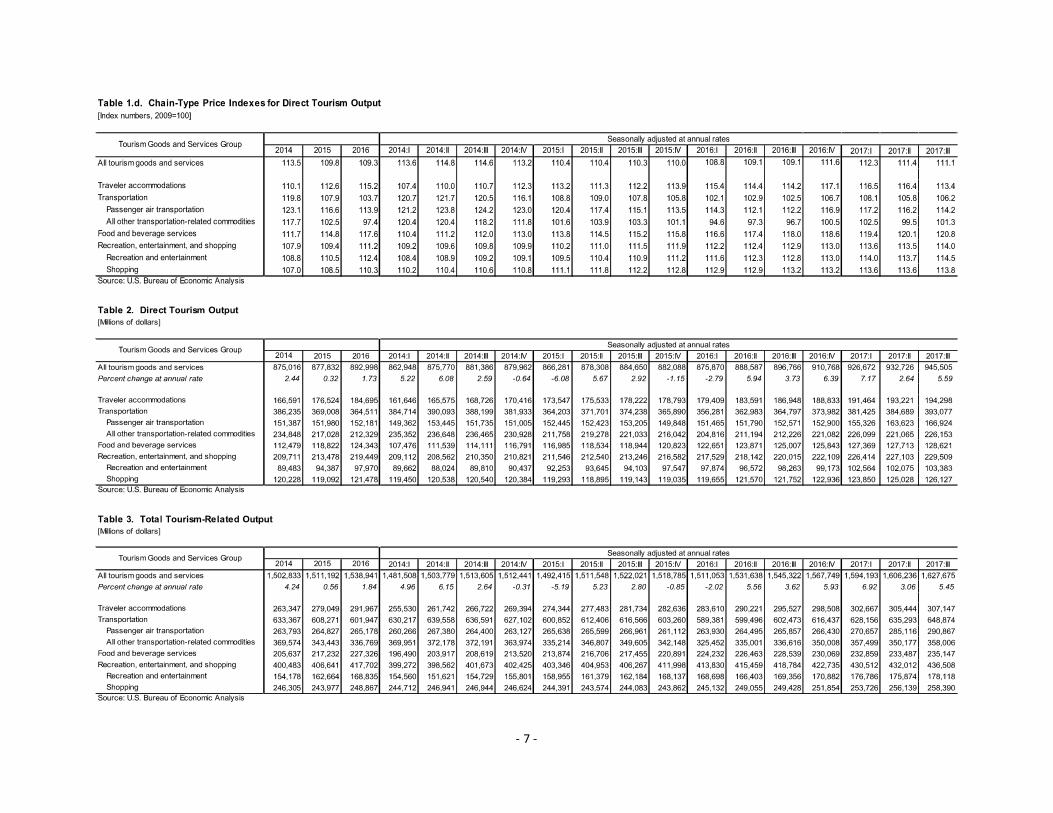
Total TourismRelated Output was $1.6 trillion in the third quarter of 2017, comprising $945 billion (58 percent) of direct tourism spending and $682 billion (42 percent) of indirect tourismrelated spending.
Total TourismRelated Employment was 7.9 million jobs in the third quarter of 2017, comprising 5.5 million (70 percent) direct tourism jobs and 2.4 million (30 percent) indirect tourismrelated jobs.
* * *
These statistics are from BEA’s Travel and Tourism Satellite Accounts (TTSAs), which are supported by funding from the Office of Travel and Tourism Industries, International Trade Administration, U.S. Department of Commerce. The currentprice statistics of direct tourism output were derived from BEA’s annual TTSAs and from currentprice quarterly statistics of personal consumption expenditures from the National Income and Product Accounts (NIPAs). The real statistics of direct tourism output were developed using price indexes from the Bureau of Labor Statistics (BLS) and real quarterly statistics of personal consumption expenditures from the NIPAs. The statistics of direct tourism employment were derived from the annual TTSAs from BEA, the Quarterly Census of Employment and Wages (QCEW), and Current Employment Statistics (CES) from BLS.
Discontinuation of Quarterly Travel and Tourism Estimates
Due to budget constraints, BEA is discontinuing production of quarterly travel and tourism estimates. Annual estimates, published each June in BEA’s Survey of Current Business, will continue to be produced with support from the Office of Travel and Tourism Industries, International Trade Administration, U.S. Department of Commerce.
4
Additional Information Resources
Additional resources available at www.bea.gov:
Stay informed about BEA developments by reading the BEA blog, signing up for BEA’s email subscription service, or following BEA on Twitter @BEA_News. The time series of detailed annual statistics for 1998 through 2016 are available at Travel and Tourism DataAccess BEA data by registering for BEA’s Data application programming interface (API). For more on BEA’s statistics, see our monthly online journal, the Survey of Current BusinessBEA's news release scheduleIndustry Concepts and Methods: Concepts and Methods of the U.S. InputOutput Accounts
Definitions
Tourism spending Total tourismrelated spending consists of direct tourism output and indirect tourism output. Direct tourism output comprises all domestically produced goods and services purchased by travelers (for example, traveler accommodations and passenger air transportation). Indirect tourism output comprises all output required to support the production of direct tourism output (for example, toiletries for hotel guests and fuel for airplanes).
Tourism employment Total tourismrelated employment consists of direct tourism employment plus indirect tourism employment. Direct tourism employment comprises all jobs where the workers are engaged in the production of direct tourism output (for example, hotel staff and airlines pilots). Indirect tourism employment comprises all jobs where the workers are engaged in the production of indirect tourism output (for example, workers producing hotel toiletries and delivering fuel to airlines).
Gross domestic product (GDP) or value added is the value of the goods and services produced by the nation’s economy less the value of the goods and services used up in production. GDP is also equal to the sum of personal consumption expenditures, gross private domestic investment, net exports of goods and services, and government consumption expenditures and gross investment.
Gross output (GO) is the value of the goods and services produced by the nation’s economy. It is principally measured using industry sales or receipts, including sales to final users (GDP) and sales to other industries (intermediate inputs).
Current-dollar estimates are valued in the prices of the period when the transactions occurred—that is, at “market value.” Also referred to as “nominal estimates” or as “currentprice estimates.”
Real values are inflationadjusted estimates—that is, estimates that exclude the effects of price changes.
Statistical conventions
Annual rates Quarterly values are expressed at seasonallyadjusted annual rates (SAAR). Dollar changes are calculated as the difference between these SAAR values. For details, see the FAQ “Why does BEA publish estimates at annual rates?”
Quantities and prices Quantities, or “real” measures, and prices are expressed as index numbers with a specified reference year equal to 100 (currently 2009). Quantity and price indexes are calculated using a Fisherchained weighted formula that incorporates weights from two adjacent periods (quarters for quarterly data and annuals for annual data). “Real” dollar series are calculated by multiplying the published quantity index by the current dollar value in the reference year (2009) and then dividing by 100. Percent changes calculated from chaineddollar levels and quantity indexes are conceptually the same; any differences are due to rounding.
Chained-dollar values are not additive because the relative weights for a given period differ from those of the reference year. In tables that display chaineddollar values, the value of the "Not allocated by industry" line reflects the difference between the first line and the sum of the most detailed lines. For the real value added by industry table, this value also reflects differences in source data used to estimate GDP by industry and the expenditures measure of real GDP.
List of News Release Tables
Table 1.a. Percent Change in Real Tourism Output
Table 1.b. Real Tourism Output
Table 1.c. Percent Changes in ChainType Price Indexes for Direct Tourism Output
Table 1.d. ChainType Price Indexes for Direct Tourism Output
Table 2. Direct Tourism Output
Table 3. Total TourismRelated Output
Table 4. Percent Change in Direct Tourism Employment
Table 5. Direct Tourism Employment
Table 6. Total TourismRelated Employment
6
7
8