Embed Size (px)
Citation preview
Travel context:
Development of a model to measure destination brand
performance across different travel situations
Samantha Murdy
Bachelor of Business (Honours)
Submitted to the
School of Advertising, Marketing and Public Relations,
Queensland University of Technology
For the qualification of
Doctor of Philosophy (PhD)
2012
i
Abstract
Purpose: There is a lack of theory relating to destination brand performance
measurement in the destination branding literature, which emerged in the late 1990s
(see for example Dosen, Vransevic, & Prebezac, 1998). Additionally, there is a lack
of research about the importance of travel context in consumers’ destination decision
making (Hu & Ritchie, 1993). This study develops a structural model to measure
destination brand performance across different travel situations. The theory of
planned behaviour (TpB) was utilised as a framework to underpin the consumer-
based brand equity (CBBE) hierarchy to develop a model of destination brand
performance.
Research approach: A proposed model of destination brand performance was
developed through a review of the literature. The first study was used to identify
destination image attributes (the core construct) using an analysis of the literature, a
document analysis, and personal interviews using the Repertory Test qualitative
technique. Underpinned by Personal Construct Theory (PCT), the Repertory Test
enables the elicitation of attributes consumers use to evaluate destinations when
considering travel. Data was examined in the first study to i) identify any attribute
differences in travel contexts and ii) create a scale for use in a questionnaire. A
second study was conducted to test the proposed model using a questionnaire with
eight groups of participants to assess four destinations across two travel contexts.
The model was tested utilising structural equation modelling.
Findings: The first study resulted in a list of 29 destination image attributes for use
in a scale index. Attributes were assessed across travel contexts and few differences
were identified. The second study assessed the congruence of destination brand
identity (the destination marketing organisation’s desired image) and destination
brand image (the actual perceptions held by consumers) using importance-
performance analyses. Finally, the proposed model of destination brand performance
was tested. Overall the data supported the model of destination brand performance
across travel contexts and destinations. Additionally, this was compared to
consumers’ decision sets, further supporting the model.
ii
Value: This research provides a contribution to the destination marketing literature
through the development of a measurement of destination brand performance
underpinned by TpB. Practically; it will provide destination marketing organisations
with a tool to track destination brand performance, relative to key competing places,
over time. This is important given the development of a destination brand is a long
term endeavour.
Keywords: destination branding; consumer-based brand equity (CBBE); travel
context

iii
Statement of Original Authorship
The work contained in this thesis has not been previously submitted to meet
requirements for an award at this or any other higher education institution. To the
best of my knowledge and belief, the thesis contains no material previously
published or written by another person except where due reference is made.
Signature: Samantha Murdy
Date: 20th
July, 2012
iv
Contents
Chapter One: Introduction ....................................................................................... 1
1.0 Background to research ................................................................................. 1
1.1 Research problem .......................................................................................... 3
1.2 Methodology ................................................................................................. 5
1.3 Chapter summary .......................................................................................... 6
1.4 Contributions of the research ........................................................................ 7
1.4.1 Brand identity: The Gold Coast. ............................................................ 9
1.4.2 Brand identity: The Sunshine Coast. ...................................................... 9
1.4.3 Brand identity: The Moreton Bay Islands. ............................................. 9
1.4.4 Brand identity: Northern New South Wales. ....................................... 10
Chapter Two: Literature Review ........................................................................... 11
2.0 Introduction ................................................................................................. 11
2.1 Bounded rationality ..................................................................................... 11
2.1.1 Theory of planned behaviour. .............................................................. 11
2.2 Branding ...................................................................................................... 14
2.2.1 Components of branding. ..................................................................... 17
2.3 Destination branding ........................................................................................ 18
2.3.1 Importance of destination branding. .................................................... 19
2.3.2 Complexities when branding destinations. .......................................... 21
2.3.3 Travel context....................................................................................... 23
2.4 Measuring brand performance ..................................................................... 26
2.4.1 Brand performance: Using financial measures. ................................... 27
2.4.2 Brand equity: Using consumer-based measures. ................................. 28
2.4.3 Measuring a destination’s brand performance. .................................... 29
2.4.4 Consumer-based brand equity. ............................................................. 30
2.5 Towards the development of a model of destination brand performance ........ 32
2.5.1 Destination image (cognitive beliefs and affective evaluations). ........ 35
2.5.2 Perceived quality beliefs. ..................................................................... 38
2.5.3 Subjective norms. ................................................................................. 39
2.5.4 Perceived behavioural control. ............................................................. 39
2.5.5 Intentions – destination loyalty. ........................................................... 39
2.5.6 Awareness. ........................................................................................... 40
v
2.6 Summary ..................................................................................................... 41
Chapter Three: Study One ...................................................................................... 43
3.0 Introduction ...................................................................................................... 43
3.1 Content analysis of the literature...................................................................... 44
3.1.1 Method: Content analysis of the literature. .......................................... 44
3.1.2 Results: Content analysis of the literature. ........................................... 46
3.2 Document analysis ...................................................................................... 50
3.2.1 Sampling: Document analysis. ............................................................. 51
3.2.2 Results: Document analysis. ................................................................ 52
3.3 Personal interviews with consumers ........................................................... 53
3.3.1 Method: Repertory Test technique. ...................................................... 56
3.3.2 Sampling: Personal interviews with consumers. .................................. 58
3.3.3 Data collection: Personal interviews with consumers. ......................... 60
3.3.4 Laddering: Personal interviews with consumers.................................. 62
3.3.5 Results: Personal interviews with consumers. ..................................... 64
3.3.5.1 Sample characteristics – Short-break. ........................................... 64
3.3.5.2 Cognitive attributes – Short-break. ............................................... 66
3.3.5.3 Cognitive destination image categories – Short-break. ................ 66
3.3.5.4 Sample characteristics – Longer holiday. ..................................... 68
3.3.5.5 Cognitive attributes – Longer holiday. ......................................... 70
3.3.5.6 Cognitive destination image categories – Longer holiday............ 70
3.3.5.7 Comparison of Repertory Test Interview Contexts. ..................... 72
3.3.5.8 Relating findings to the Theory of Planned Behaviour. ............... 75
3.3.5.9 Ethics. ........................................................................................... 76
3.4 Triangulation of results ............................................................................... 77
3.4.1 Implications for Study Two. ................................................................ 79
3.5 Summary ..................................................................................................... 81
Chapter Four: Study Two ....................................................................................... 82
4.0 Introduction ................................................................................................. 82
4.1 Research objectives and hypotheses ............................................................ 82
4.2 Research design ........................................................................................... 84
4.2.1 Sample considerations. ......................................................................... 84
4.2.2 Context. ................................................................................................ 84
vi
4.2.3 Questionnaire development. ................................................................. 85
4.2.4 Measures. ............................................................................................. 86
4.2.5 Pre-tests. ............................................................................................... 90
4.2.6 Questionnaire administration. .............................................................. 92
4.3 Ethical considerations .................................................................................. 93
4.4 Results ......................................................................................................... 94
4.4.1 Data file. ............................................................................................... 94
4.4.2 Sample characteristics. ......................................................................... 96
4.4.3 Descriptive statistics........................................................................... 100
4.4.4 Importance – performance analysis. .................................................. 104
4.4.4.1 Gold Coast – Performance. ......................................................... 106
4.4.4.2 Sunshine Coast – Performance. .................................................. 113
4.4.4.3 Moreton Bay Islands – Performance. ......................................... 119
4.4.4.4 Northern New South Wales – Performance. ............................... 125
4.4.5 Structural Equation Modelling. .......................................................... 132
4.4.5.1 Assumptions of SEM. ................................................................. 133
4.4.5.2 Exploratory factor analysis. ........................................................ 134
4.4.6 Confirmatory factor analysis. ............................................................. 135
4.4.6.1 Assessment of model fit. ............................................................. 136
4.4.6.2 Model re-specification. ............................................................... 137
4.4.6.3 Assessment of reliability and validity. ........................................ 139
4.4.7 Structural model. ................................................................................ 141
4.5 Comparison of proposed model and awareness ........................................ 143
4.6 Summary ................................................................................................... 146
Chapter Five: Discussion ....................................................................................... 147
5.0 Overall purpose of the research ................................................................. 147
5.1 Discussion of the research findings ........................................................... 147
5.1.1 Study One. .......................................................................................... 148
5.1.1.1 To identify image attributes salient to consumers when evaluating
destinations. ................................................................................................... 148
5.1.1.2 To identify if there is a difference in image attributes identified
across travel contexts. ................................................................................... 148
5.1.1.3 To develop a scale for the destination image dimension of
destination brand performance. ..................................................................... 150
vii
5.1.1.4 Summary. .................................................................................... 151
5.1.2 Study Two. ......................................................................................... 152
5.1.2.1 To test a model of consumer-based destination brand performance.
152
5.1.2.2 To identify if there is a difference in destination brand
performance relative to travel context........................................................... 155
5.1.2.3 To investigate the level of congruence between the destination
brand identity and destination brand image. ................................................. 156
5.1.3 Relating to the overall research objectives......................................... 163
5.2 Implications ............................................................................................... 164
5.2.1 Theoretical implications. .................................................................... 164
5.2.2 Practical implications. ........................................................................ 165
5.3 Limitations ................................................................................................. 167
5.3.1 Study One. .......................................................................................... 168
5.3.2 Study Two. ......................................................................................... 168
5.4 Future Research ......................................................................................... 169
5.4.1 Study One. .......................................................................................... 169
5.4.2 Study Two. ......................................................................................... 170
5.5 Conclusion ................................................................................................. 170
References ............................................................................................................... 172
References for analysis of literature table (Appendix One) ................................. 185
Appendix One: 2008-2011 Destination image literature table ............................ 191
Appendix Two: Document analysis summary ..................................................... 202
Appendix Three: Personal Construct Corollaries ................................................ 203
Appendix Four: Participant information sheet – Personal interviews ................. 206
Appendix Five: Consent form – Personal interviews .......................................... 207
Appendix Six: Demographic form for personal interviews ................................. 208
Appendix Seven: Short-break verbal statements ................................................. 209
Appendix Eight: Longer holiday verbal statements ............................................. 213
Appendix Nine: Ethics approval – Personal interviews ....................................... 216
Appendix Ten: Questionnaire – Short-break holidays ......................................... 217
Appendix Eleven: Questionnaire – Longer holiday ............................................. 226
Appendix Twelve: Ethics approval – Questionnaire ........................................... 235
viii
List of Figures
Figure 1: Proposed model of destination brand performance ...................................... 4
Figure 2: Theory of Planned Behaviour model .......................................................... 12
Figure 3: CBBE hierarchy .......................................................................................... 31
Figure 4: Proposed model of destination brand performance .................................... 34
Figure 5: Circumplex model of affect ........................................................................ 37
Figure 6: Laddering example using destinations ....................................................... 63
Figure 7: Short-break categories ................................................................................ 67
Figure 8: Longer holiday categories .......................................................................... 71
Figure 9: Proposed model of destination brand performance .................................... 83
Figure 10: Change to questionnaire ........................................................................... 91
Figure 11: IPA Matrix .............................................................................................. 105
Figure 12: IPA Matrix – Gold Coast short-break..................................................... 108
Figure 13: IPA Matrix – Gold Coast longer holiday................................................ 111
Figure 14: IPA Matrix – Sunshine Coast short-break .............................................. 114
Figure 15: IPA Matrix – Sunshine Coast longer holiday ......................................... 117
Figure 16: IPA Matrix – Moreton Bay Islands short-break ..................................... 120
Figure 17: IPA Matrix – Moreton Bay Islands longer holiday ................................ 123
Figure 18: IPA Matrix – Northern New South Wales short-break .......................... 127
Figure 19: IPA Matrix – Northern New South Wales longer holiday ..................... 130
Figure 20: Measurement model ............................................................................... 138
Figure 21: Structural model ..................................................................................... 142
Figure 22: Regression analysis of consideration set ................................................ 144
Figure 23: Regression analysis of proposed model of destination brand performance
.................................................................................................................................. 145
Figure 24: Model of destination brand performance................................................ 152
List of Tables
Table 1: Branding definitions .................................................................................... 16
Table 2: Components of usage context ...................................................................... 24
Table 3: Literature analysis comparisons ................................................................... 47
Table 4: Categories identified from the literature analysis ........................................ 49
Table 5: Document analysis results ........................................................................... 52
Table 6: Element examples ........................................................................................ 61
Table 7: Sample characteristics for short-break interviews ....................................... 65
Table 8: Short-break attribute categories by participant ............................................ 68
Table 9: Sample characteristics of participants from longer holiday interviews ....... 69
Table 10: Longer holiday attribute categories by participant .................................... 72
Table 11: Comparison of short-break and longer holiday attribute categories .......... 73
Table 12: Comparison of attribute rankings .............................................................. 78
Table 13: Removed respondents ................................................................................ 95
Table 14: Sample characteristics ................................................................................ 97
ix
Table 15: Sample characteristics for each questionnaire ........................................... 98
Table 16: Likelihood to travel .................................................................................. 100
Table 17: Previous visitation .................................................................................... 101
Table 18: Descriptive statistics of reflective variables ............................................ 101
Table 19: Independent samples t-test ....................................................................... 102
Table 20: Attribute importance ................................................................................ 103
Table 21: Independent samples t-test – Importance statistics .................................. 104
Table 22: Performance statistics – Gold Coast short-break ..................................... 107
Table 23: Gold Coast short-break quadrant table .................................................... 109
Table 24: Performance statistics – Gold Coast longer holiday ................................ 110
Table 25: Gold Coast longer holiday quadrant table ............................................... 112
Table 26: Performance statistics – Sunshine Coast short-break .............................. 113
Table 27: Sunshine Coast short-break quadrant table .............................................. 115
Table 28: Performance statistics – Sunshine Coast longer holiday ......................... 116
Table 29: Sunshine Coast longer holiday quadrant table ......................................... 118
Table 30: Performance statistics – Moreton Bay Islands short-break...................... 119
Table 31: Moreton Bay Islands short-break quadrant table ..................................... 121
Table 32: Performance statistics – Moreton Bay Islands longer holiday................. 122
Table 33: Moreton Bay Islands longer holiday quadrant table ................................ 124
Table 34: Independent samples t-test – Moreton Bay Islands ................................. 124
Table 35: Performance statistics – Northern New South Wales short-break ........... 126
Table 36: Northern New South Wales short-break quadrant table .......................... 128
Table 37: Performance statistics – Northern New South Wales longer holiday ...... 129
Table 38: Northern New South Wales longer holiday quadrant table ..................... 131
Table 39: Independent samples t-test – Northern New South Wales....................... 131
Table 40: Item codes ................................................................................................ 132
Table 41: Exploratory factor analysis loadings ........................................................ 135
Table 42: Original fit indices ................................................................................... 137
Table 43: Fit indices of the measurement model ..................................................... 138
Table 44: Recalculated descriptives ......................................................................... 139
Table 45: Average variance extracted ...................................................................... 140
Table 46: Inter-factor correlations ........................................................................... 140
Table 47: Fit indices after re-specification............................................................... 141
Table 48: Hypothesis outcomes ............................................................................... 142
Table 49: Literature search findings ........................................................................ 150
Table 50: Positioning for short-break market .......................................................... 157
Table 51: Positioning for longer holiday market ..................................................... 158
x
List of abbreviations
ABDC Australian Business Deans Council
ADMA Australian Direct Marketing Association
AVE Average variance extracted
CBBE Consumer-based brand equity
CFA Confirmatory factor analysis
CFI Comparative fit indices
CMIN/DF Chi-squared/ degrees of freedom
CVB Convention and visitors bureau
DF Degrees of freedom
DK Don’t know (option)
DMO Destination marketing organisation
EFA Exploratory factor analysis
EVT Expectancy-value theory
FAITH Facilities, attractions, infrastructure, transportation and hospitality
MVA Missing values analysis
IPA Importance-performance analysis
NTO National tourism organisation
RGA Repertory grid analysis
PCT
QUT
Personal construct theory
Queensland University of Technology
RMSEA Root mean square error of approximation
RTB Regional tourism board
RTO Regional tourism organisation
RQ Research question
SEM Structural equation modelling
SRC Standardised residual covariances
SRMR Standardised root square mean residual
STO State tourism organisation
TpB Theory of planned behaviour
VFR Visiting friends and relatives
xi
Acknowledgements
There are a number of people I would like to thank for supporting me over the
last three years.
First and foremost, I would like to thank my supervisors Dr. Steven Pike and
Professor Ian Lings. Thank you for your guidance, support and dedication over
the last three years. It was a privilege to be able to work with you both.
Thank you to my support network over the last three years. Especially:
Christopher McCombes, Kristy Brosnan, Matthew White, Joy Parkinson,
Dr. Dominique Greer, Paula Dootson, Dr. Timothy Donnet, Lisa Shuster and
Cameron Mackay. You all made sure the last three years were not dull.
I would like to acknowledge the financial support provided to me by the Faculty
of Business, and the School of Advertising, Marketing and Public Relations at
QUT. This support allowed research training, conference participation and data
collection which ultimately strengthened my thesis.
I would also like to acknowledge professional editor, Jane Todd, who provided
copyediting and proofreading services, according to the guidelines laid out in the
university-endorsed national guidelines, ‘The editing of research theses by
professional editors’.
Last, but definitely not least, I would like to thank my family. To my sister,
Brooke Murdy, thank you for being there for me. To my parents, Max and
Julie Murdy, thank you for encouraging me to always try my best. You made
this thesis possible. Without your love, support and guidance, I would not have
accomplished what I have.
1
Chapter One: Introduction
The purpose of this thesis was to develop and test a model of destination brand
performance. Two studies were undertaken to achieve this. The first was an
exploratory study, relative to a key construct of the model of destination brand
performance. The second study assessed the congruence between destination brand
identity and destination brand image, and developed and tested a model of
destination brand performance. The outcome of this thesis was a model of
destination brand performance, utilising a combination of the theory of planned
behaviour (TpB) and the consumer-based brand equity (CBBE) hierarchy as a
framework. This chapter outlines the background to the research, the research
problem and approach, as well as a summary of each of the chapters within this
thesis.
1.0 Background to research
It is argued that consumers make rational decisions based on the information
available to them, and any other constraints which can impact on their choice to
maximise the utility of their decision (Simon, 1978). That is, consumers will rank
alternative choices for a particular opportunity set (Arrow, 1996; Augier & Kreiner,
2000). The theory of planned behaviour (TpB) has previously been utilised to
empirically assess and predict the likelihood of someone participating in a behaviour
(Ajzen & Fishbein, 1980), including the selection of a brand, such as a destination
(Lam & Hsu, 2006; Sparks & Pan, 2009).
Branding has long been an important strategy for the differentiation of products and
services from competitors. Furthermore, it allows the creation of relationships
between consumers and organisations (Agres & Dubitsky, 1996; Feldwick, 2002;
Kapferer, 2008). Branding is important not only for products and services, but for
destinations.
Destination branding has only recently attained recognition within the academic
literature (see for example Dosen et al., 1998). Destination branding is conducted by
2
destination marketing organisations (DMOs), who are responsible for the marketing
of a place. DMOs can be responsible for a destination at a variety of levels, including
a country, state or province, region, or more specifically, a city or town (Blain, Levy,
& Ritchie, 2005). A DMO is defined as “any organisation, at any level, which is
responsible for the marketing of an identifiable destination” (Pike, 2004, p. 14).
Some of the most common types of DMOs are national tourism organisations
(NTOs), such as Tourism Australia, state tourism organisations (STOs), such as
Tourism Queensland, regional tourism organisations (RTOs), such as Brisbane
Marketing, or internationally, convention and visitor bureaus (CVBs) and regional
tourism boards (RTBs). As a result, the branding of a destination is crucial to allow
better competition with the vast number of destinations a consumer can consider for
a trip.
Consumers have a vast number of destinations available for a trip relative to the
travel context. That is, if they are backpacking they may have a different decision
set, or set of destinations they consider than if they were going on a short-break
holiday for a period of one to five nights (Pike, 2008). It is therefore crucial to
understand if the performance of a destination can be measured across various
reasons for travel, or travel contexts.
Brand performance has previously been measured both financially and using
consumer-based measures. However, difficulties exist when using financial
measures, such as identifying the economic contribution of tourism given the vast
number of organisations benefiting within a destination (Kozak & Rimmington,
1999; Wober, 2002), and the inaccuracies which exist when collecting visitor data
(Wober, 2002). Furthermore, a financial book value of brand equity measure is
irrelevant for a destination. This thesis therefore proposes the use of consumer-based
measures for a destination, which has recently attracted attention from academics as
an important area to examine (Boo, Busser, & Baloglu, 2009; Konecnik & Gartner,
2007; Pike, Bianchi, Kerr, & Patti, 2010).
Academically, this research contributes to the literature by synthesising theoretical
frameworks to better explain and understand the mechanisms of destination brand
performance. This research will assist by addressing both of these concepts within
3
the literature. Practically, this research enables DMOs to measure their brand’s
performance relative to competitors. This assists by ensuring that the correct
segmentation and positioning strategies are being utilised by the organisation.
Additionally, by understanding if there is a difference in travel context, organisations
are able to better segment their markets and, again, better their positioning strategies.
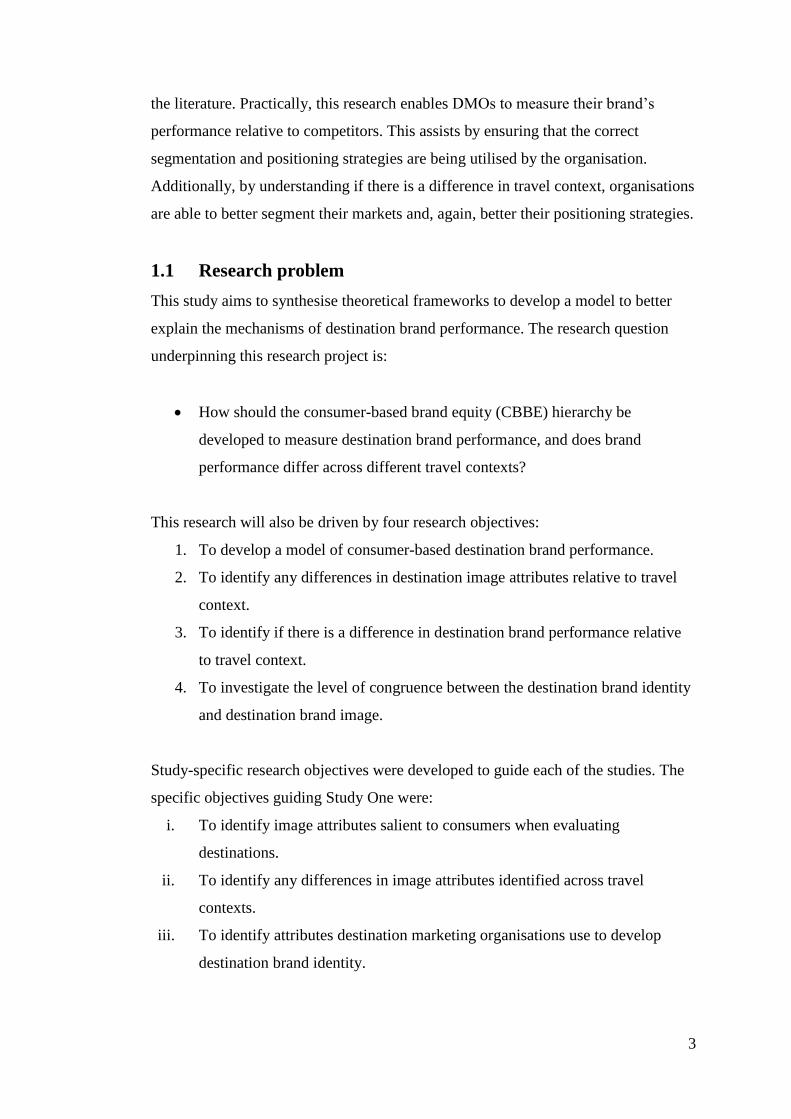
1.1 Research problem
This study aims to synthesise theoretical frameworks to develop a model to better
explain the mechanisms of destination brand performance. The research question
underpinning this research project is:
How should the consumer-based brand equity (CBBE) hierarchy be
developed to measure destination brand performance, and does brand
performance differ across different travel contexts?
This research will also be driven by four research objectives:
1. To develop a model of consumer-based destination brand performance.
2. To identify any differences in destination image attributes relative to travel
context.
3. To identify if there is a difference in destination brand performance relative
to travel context.
4. To investigate the level of congruence between the destination brand identity
and destination brand image.
Study-specific research objectives were developed to guide each of the studies. The
specific objectives guiding Study One were:
i. To identify image attributes salient to consumers when evaluating
destinations.
ii. To identify any differences in image attributes identified across travel
contexts.
iii. To identify attributes destination marketing organisations use to develop
destination brand identity.
4
The second study was also guided by specific research objectives. These were:
i. To test a model of consumer-based destination brand performance across
travel contexts.
ii. To identify if there is a difference in destination brand performance based on
travel context.
iii. To investigate the level of congruence between destination brand identity and
destination brand image.
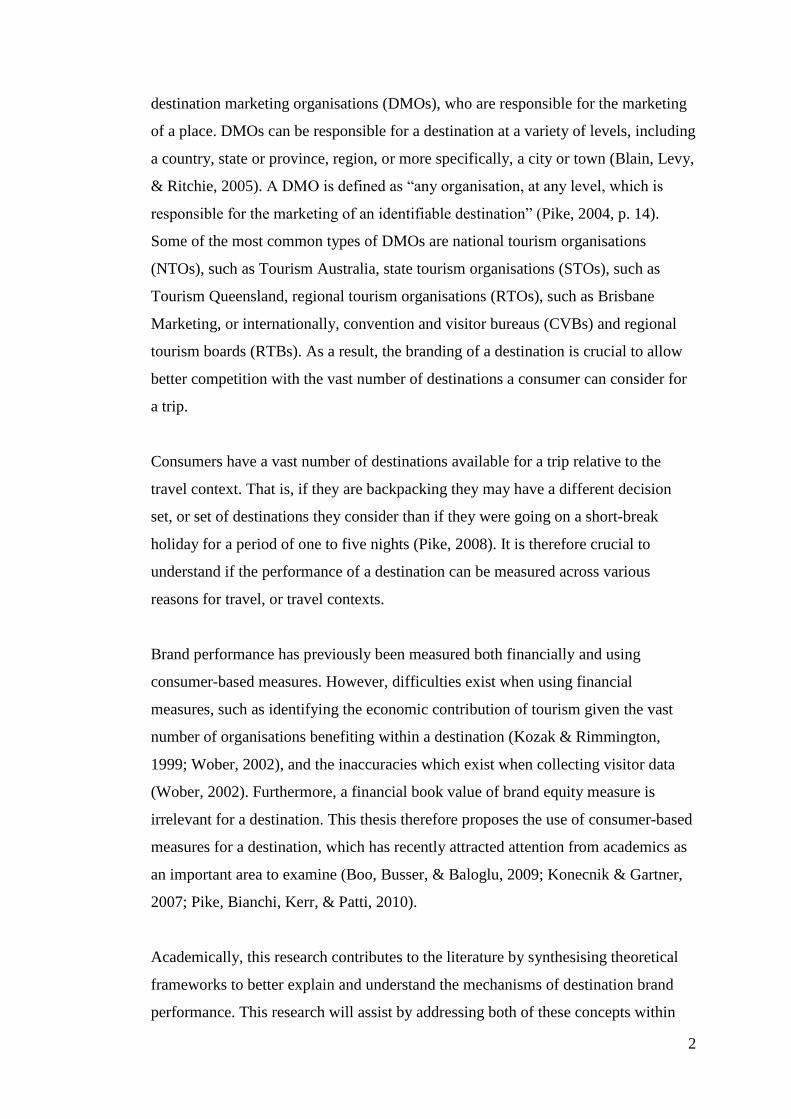
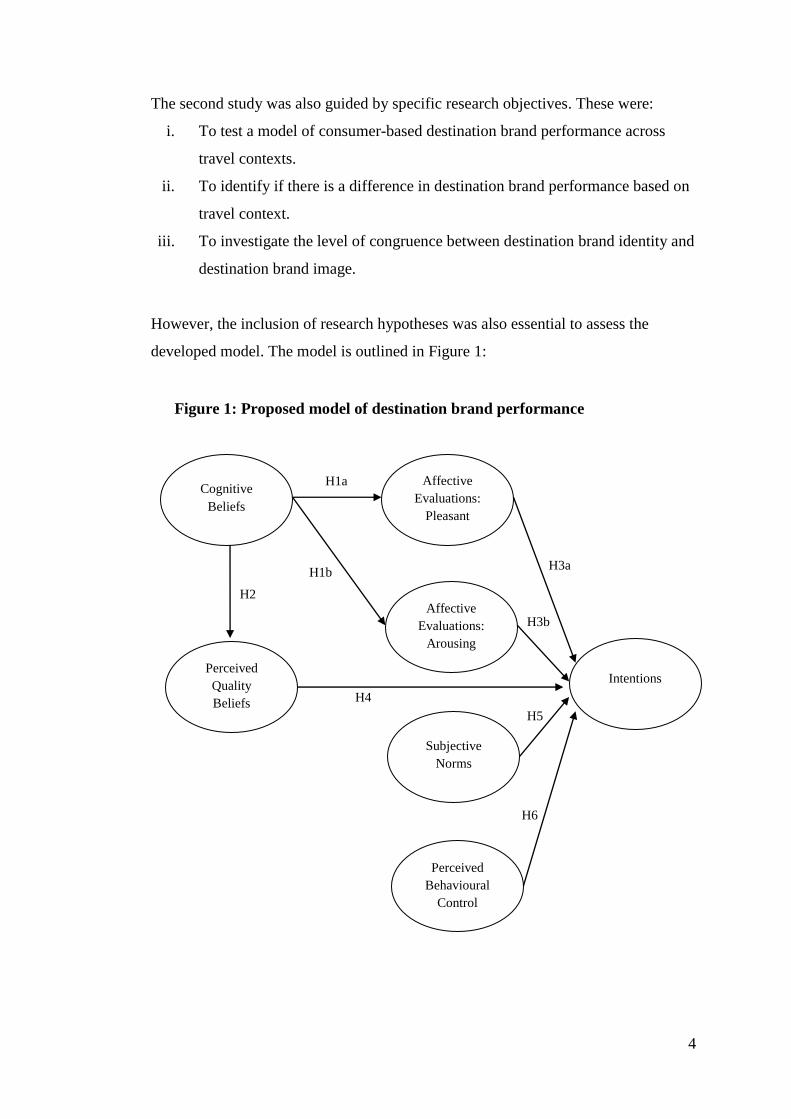
However, the inclusion of research hypotheses was also essential to assess the
developed model. The model is outlined in Figure 1:
Figure 1: Proposed model of destination brand performance
H1b
H4
H2
Affective
Evaluations:
Pleasant
Intentions
Subjective
Norms
Affective
Evaluations:
Arousing
Perceived
Quality
Beliefs
Perceived
Behavioural
Control
Cognitive
Beliefs
H1a
H3a
H3b
H5
H6
5
H1a: Cognitive beliefs are positively related to pleasant attitude (affective
evaluations).
H1b: Cognitive beliefs are positively related to arousing attitude (affective
evaluations).
H2: Cognitive beliefs are positively related to perceived quality.
H3a: Pleasant attitude (affective evaluations) is positively related to
intentions.
H3b: Arousing attitude (affective evaluations) is positively related to
intentions.
H4: Perceived quality is positively related to intentions.
H5: Subjective norms are positively related to intentions.
H6: Perceived behavioural control is positively related to intentions.
1.2 Methodology
The research approach undertaken in this thesis involved two studies. The first study
was an exploratory investigation relative to the cognitive destination image construct
to identify if any differences existed across travel contexts. The second study was
outlined to assess the congruence between destination brand identity and destination
brand image, and ultimately test a proposed model of destination brand performance.
Each study is outlined in greater depth.
A content analysis of the literature, document analysis, and personal interviews with
consumers were assessed within the first study. The purpose of the literature analysis
was to synthesise a destination image scale for use in the model tested in Study Two.
A document analysis was conducted to better understand the brand identity portrayed
by DMOs. Personal interviews with consumers, utilising the Repertory Test
technique, were conducted to identify if differences existed between attributes
considered by consumers for different travel contexts. The Repertory Test technique
was developed to operationalise personal construct theory, which was utilised to
better understand how people interpret and predict future events (Kelly, 1955).
The second study tested a model developed using the literature to measure
destination brand performance. This model was created using a combination of the
CBBE hierarchy and TpB. The model consisted of seven key constructs: i) cognitive
destination image beliefs; ii) pleasant attitude; iii) arousing attitude; iv) perceived
quality; v) subjective norm; vi) perceived behavioural control; and vii) intentions.
6
The synthesised destination image scale from Study One was utilised to measure the
cognitive destination image component of the model.
1.3 Chapter summary
This thesis consists of five chapters. Each of these chapters is outlined briefly:
Chapter One has outlined the background to the research approach. Furthermore,
the research problem was discussed, followed by an overview of the research
approach, or methodology.
Chapter Two examines the literature relative to bounded rationality, before linking
this to branding, and the importance of branding a destination. A discussion of travel
context precedes an evaluation of brand equity measures. An expanded discussion of
consumer-based brand equity is outlined before the proposal of a new model of
destination brand performance.
Chapter Three reports an exploratory investigation into destination image. Initially
study-specific research objectives are restated, before a discussion related to each of
the methods selected. This chapter reports the method and analysis of each
technique, before summarising Study One in its entirety. The first technique
discussed is a content analysis of the literature ranging from 1973 to 2011. Secondly,
a document analysis is examined, utilising tourism opportunity and destination
management plans, as well as official tourism websites. The final technique, personal
interviews with consumers, using the Repertory Test technique, is discussed and
compared across two interview rounds, examining two different travel contexts:
short-break and longer holidays. Finally, a comparison of each of the techniques is
provided before discussing the implications this study had for Study Two.
Chapter Four reports a quantitative study, utilising questionnaire data to assess
destination brand performance. Firstly, the methodological considerations of the
study are outlined before the sample characteristics and descriptive statistics are
discussed. Secondly, importance-performance analyses were conducted to address
the final research objective examining the congruence between destination brand
7
identity and destination brand image. Structural equation modelling was utilised to
test the proposed model of destination brand performance. Finally, regression
analyses were undertaken to evaluate and compare models of destination brand
performance.
Chapter Five, the final chapter of this thesis, discusses the key findings from both
Study One and Study Two. Furthermore, the theoretical and practical implications
are outlined. The main contribution of this thesis is the development of a model of
destination brand performance which stands across travel contexts. Furthermore, the
limitations of the research are outlined. The implications for future research are also
discussed, followed by the conclusion of the thesis.
1.4 Contributions of the research
Conceptually, this research contributes to the destination branding literature. As
destination branding is still in its early stages, having begun in 1998 (see Dosen et
al.) and measurement of the destination brand discussed since 2007 (Boo et al., 2009;
Konecnik & Gartner, 2007; Pike, 2009; Pike et al., 2010), this research aims to
contribute to the ever growing discussion. Finally, the impact of travel context has
not been examined to a great extent within the literature. A review of over 230
destination image studies found that only 37 explicitly discussed travel context.
There was no comparison or empirical identification to assess whether travel context
altered the travel decision, and the performance of the organisation explicitly for
destination image.
Practically, DMOs will have a measure of brand performance which they can utilise
to test the effectiveness of their brand. A greater understanding of whether or not
different messages should be sent for different travel contexts will better utilise the
marketing funds available. This is an incredibly important issue as DMOs can
struggle to achieve appropriate funding. Additionally, DMOs will be able to identify
whether there is congruence between the brand identity, or the message they are
sending to the consumers, and the image, or message the consumer is receiving. This
will also provide an analysis of the importance of measuring brand performance
8
across different travel contexts as the message may be perceived differently based on
a consumers’ reason for travel.
Practical implications for the studies conducted refer to near home destinations to
Brisbane, based on two travel contexts, and assessing Generation Y. Generation Y
was chosen due to the methodological considerations of having various age groups
(see Section 3.3.2), and as little research has been conducted on this generation in the
tourism literature. Furthermore, it has been predicted that Generation Y will have the
greatest spending potential (Brand, 2000), and the potential to become lifetime
consumers (Wolburg & Pokrywczynski, 2001). Additionally, having being raised
with the premise of choice, and increased access to information, Generation Y are
considered to be the most independent decision makers (Alch, 2000; Stevens,
Lathrop, & Bradish, 2005).
Travel contexts were chosen due to the varying motivations: short-break holidays
and longer holidays. That is, short-break holidays are defined by the literature as
trips to a destination lasting for a period of 1-5 days, which are within driving
distance (Pike, 2006). It is acknowledged to be one of the most competitive tourism
markets as there are numerous destinations within a short distance from one’s home
which are easy enough to get to (Pike, 2006). A longer holiday is defined as one
week or more. These holidays tend to occur less frequently than short-break
holidays. Therefore, different motivators exist for taking a longer holiday, such as to
escape and unwind versus family time and rest for a short-break holiday (Tourism
Queensland, 2010b).
Near home destinations were chosen for both Study One and Study Two for the
Brisbane market (Pike, 2007c). Study Two focused on four destinations to assess
congruence between destination brand identity and destination brand image: i) the
Gold Coast; ii) the Sunshine Coast; iii) the Moreton Bay Islands; and iv) Northern
New South Wales. The same destinations were tested across both travel contexts to
ensure variation in results referred to travel context only. Three of the destinations
were chosen as they were the most thought of destinations for Brisbane residents
when considering short-break destinations (Pike, 2007c), while Moreton Bay Islands
was chosen as it was not considered as often, allowing comparison.
9
A brand, or the brand identity of a destination, is more than just a name. It refers to
those associations with the brand, and the identity aspired to by DMOs (Aaker,
1995). It is those associations which differentiate a destination from competitors that
the DMO aspires to and attempts to project to prospective visitors. These
associations, or attributes, are summarised for each of the destinations near Brisbane
used in this study. These summaries were developed from promotional material used
by the DMO of each destination.
1.4.1 Brand identity: The Gold Coast.
Recently, the brand of the Gold Coast changed from ‘Very GC’ to ‘Gold Coast.
Famous for Fun’ (Tourism Queensland, 2011a). This change was developed through
research undertaken based on over 6000 consumers, and the Queensland tourism
industry. The new Gold Coast campaign is aimed at assessing the emotive appeal,
and focusing on four key themes: beaches, hinterland, theme parks and
entertainment. Furthermore, there is an emphasis on sharing the travel experience
with friends or other holidaymakers. The premise of the Gold Coast is that it is full
of excitement, boundless energy, a fun attitude, and joyous feeling (Tourism
Queensland, 2011a).
1.4.2 Brand identity: The Sunshine Coast.
The Sunshine Coast has also recently emphasised a new direction for the brand,
replacing the brand ‘Find your space’ with ‘Sunshine Coast. Naturally refreshing’
(Tourism Queensland, 2011b). The aim of this brand is not to impress others, but to
enjoy an authentic lifestyle, which is healthy and family-friendly. There is also an
emphasis on shops, cafes, beaches, hills and the hinterland, as well as the warm,
friendly personality of the Sunshine Coast locals.
1.4.3 Brand identity: The Moreton Bay Islands.
The brand identity of the Moreton Bay Islands is based on attracting both the young
and the old (Brisbane Marketing, 2011). Brisbane Marketing is responsible for
promoting the Moreton Bay Islands region, and emphasis is placed on the natural
experiences that Moreton Bay Islands has to offer (Tourism Queensland, 2011c).
Furthermore, Brisbane Marketing (2011) highlights the “rich tapestry of stories,
10
legends and characters” the area has to offer, as well as its charm, that it is away
from bright lights, and near the coast with many islands.
1.4.4 Brand identity: Northern New South Wales.
Tourism New South Wales works with the Central Coast RTO, the Mid North Coast
RTO, the Hunter RTO, and the Northern Rivers RTO to promote this region
(Tourism NSW, 2011a). The focus of the campaign is on sale fares and packages, as
well as promoting how close destinations are to the regional airports, providing
“easy access to a range of holiday choices” (Tourism NSW, 2011b). Furthermore,
advertisements had a focus on both nature and beaches, with the promotions
underpinned by the overall NSW slogan “New South Wales. See where it takes
you”.
11
Chapter Two: Literature Review
2.0 Introduction
This chapter discusses bounded rationality, and more specifically the theory of
planned behaviour (TpB). Furthermore, a discussion of branding in general precedes
an outline of destination branding, and travel context. This chapter will conclude
with the proposed research question and a proposed model of destination brand
performance.
2.1 Bounded rationality
It is argued that people make decisions rationally. In order to maximise an outcome,
an individual will balance the costs and benefits of a decision (Simon, 1978).
Rational decision making is also driven by the assumptions that: i) people have
access to all available, and perfect, information; ii) they have the cognitive ability to
assess the decision; and iii) they have the time to weigh up every available option.
These assumptions have previously received criticism as no decision is deemed to be
completely rational (Tversky & Kahneman, 1987). However, bounded rationality
theory was developed to take into account constraints: i) people will only use the
information they have available to them; ii) people make decisions relative to their
cognitive limitations; and iii) people only have a limited amount of time available to
them (Simon, 1978). The theory of planned behaviour (TpB) has previously been
used to empirically test rational decision making.
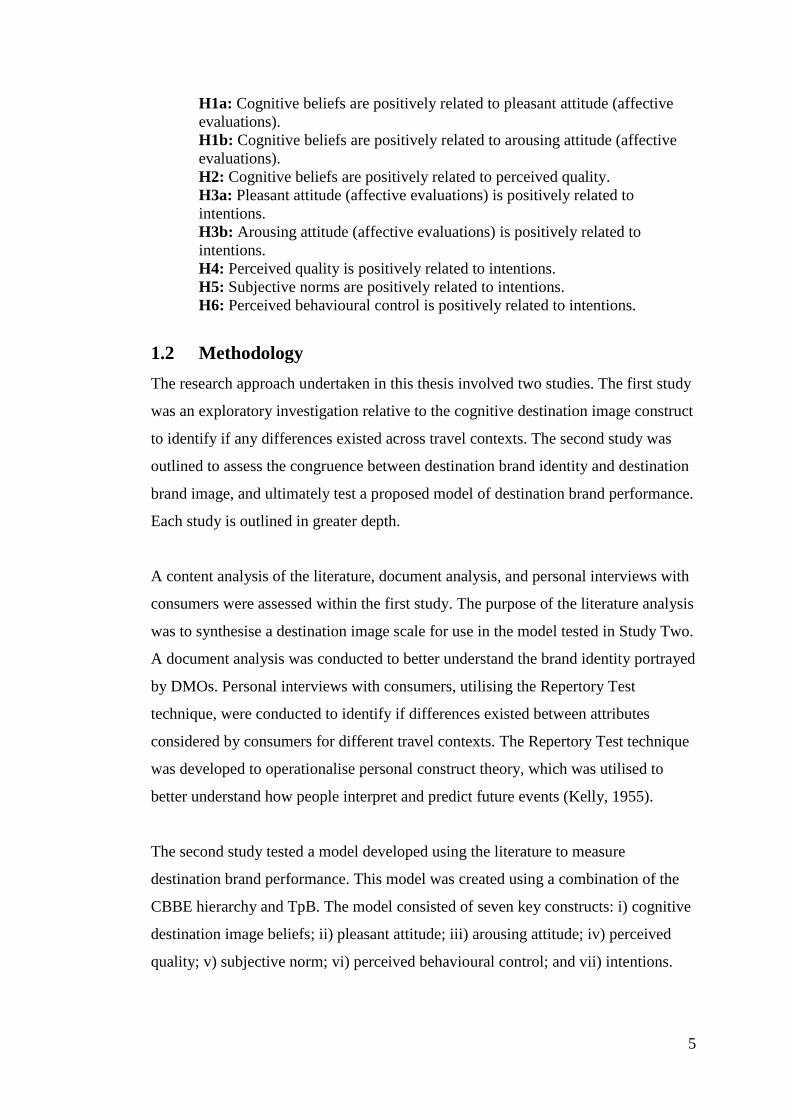
2.1.1 Theory of planned behaviour.
The theory of planned behaviour was developed with consideration to bounded
rationality. Ajzen and Fishbein (1980) argue that people use the available
information they have in a reasonable way to make a decision, even though the
information they have may be incorrect. However, people will make a logical and
systematic decision based on the information they have at the time.
TpB has been used with strong predictive utility in a variety of different contexts,
including dishonest actions (Beck & Ajzen, 1991), leisure choice (Ajzen & Driver,
12
1992), smoking cessation (Norman, Connor, & Bell, 1999), marketing (Vinson,
Scott, & Lamont, 1977), and destination choice (Lam & Hsu, 2006; Sparks & Pan,
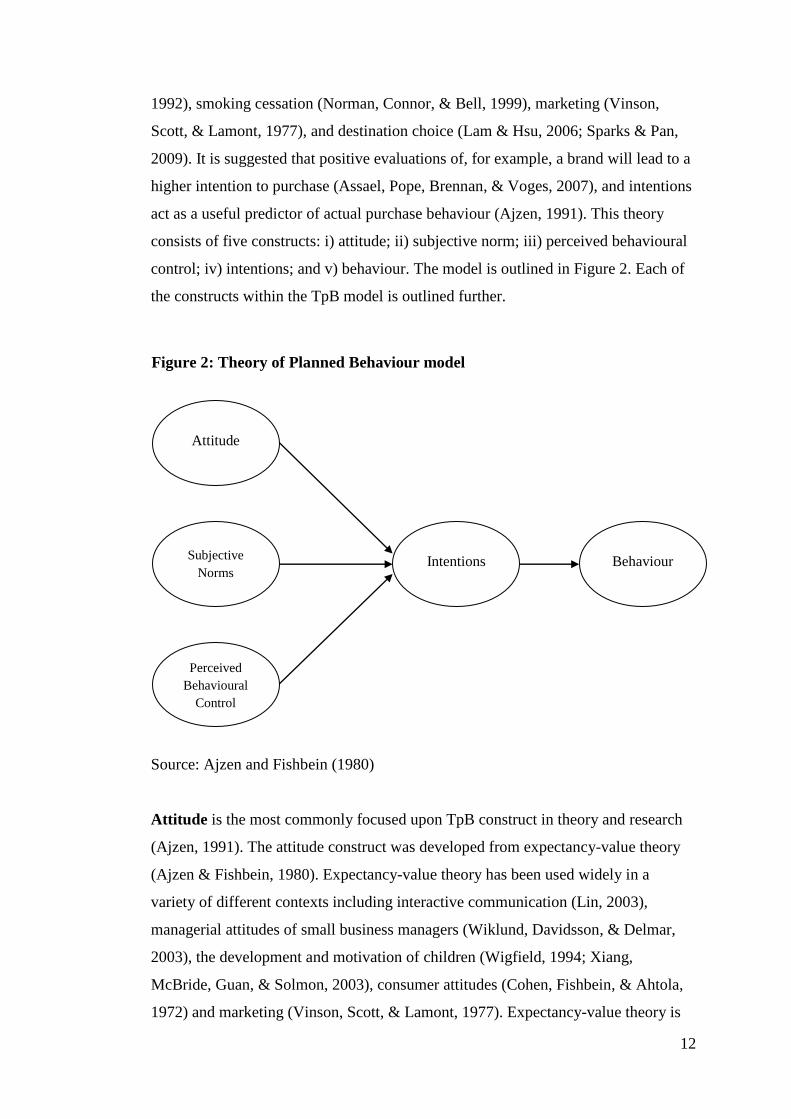
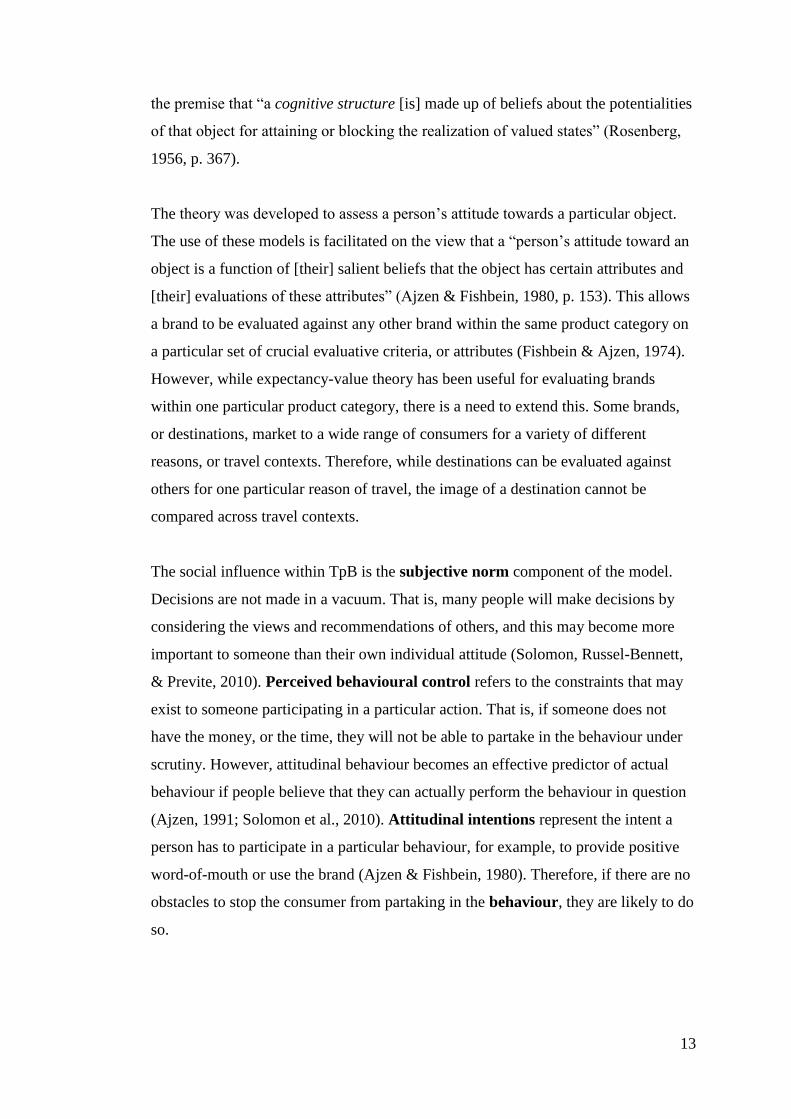
2009). It is suggested that positive evaluations of, for example, a brand will lead to a
higher intention to purchase (Assael, Pope, Brennan, & Voges, 2007), and intentions
act as a useful predictor of actual purchase behaviour (Ajzen, 1991). This theory
consists of five constructs: i) attitude; ii) subjective norm; iii) perceived behavioural
control; iv) intentions; and v) behaviour. The model is outlined in Figure 2. Each of
the constructs within the TpB model is outlined further.
Source: Ajzen and Fishbein (1980)
Attitude is the most commonly focused upon TpB construct in theory and research
(Ajzen, 1991). The attitude construct was developed from expectancy-value theory
(Ajzen & Fishbein, 1980). Expectancy-value theory has been used widely in a
variety of different contexts including interactive communication (Lin, 2003),
managerial attitudes of small business managers (Wiklund, Davidsson, & Delmar,
2003), the development and motivation of children (Wigfield, 1994; Xiang,
McBride, Guan, & Solmon, 2003), consumer attitudes (Cohen, Fishbein, & Ahtola,
1972) and marketing (Vinson, Scott, & Lamont, 1977). Expectancy-value theory is
Intentions Subjective
Norms
Attitude
Perceived
Behavioural
Control
Behaviour
Figure 2: Theory of Planned Behaviour model
13
the premise that “a cognitive structure [is] made up of beliefs about the potentialities
of that object for attaining or blocking the realization of valued states” (Rosenberg,
1956, p. 367).
The theory was developed to assess a person’s attitude towards a particular object.
The use of these models is facilitated on the view that a “person’s attitude toward an
object is a function of [their] salient beliefs that the object has certain attributes and
[their] evaluations of these attributes” (Ajzen & Fishbein, 1980, p. 153). This allows
a brand to be evaluated against any other brand within the same product category on
a particular set of crucial evaluative criteria, or attributes (Fishbein & Ajzen, 1974).
However, while expectancy-value theory has been useful for evaluating brands
within one particular product category, there is a need to extend this. Some brands,
or destinations, market to a wide range of consumers for a variety of different
reasons, or travel contexts. Therefore, while destinations can be evaluated against
others for one particular reason of travel, the image of a destination cannot be
compared across travel contexts.
The social influence within TpB is the subjective norm component of the model.
Decisions are not made in a vacuum. That is, many people will make decisions by
considering the views and recommendations of others, and this may become more
important to someone than their own individual attitude (Solomon, Russel-Bennett,
& Previte, 2010). Perceived behavioural control refers to the constraints that may
exist to someone participating in a particular action. That is, if someone does not
have the money, or the time, they will not be able to partake in the behaviour under
scrutiny. However, attitudinal behaviour becomes an effective predictor of actual
behaviour if people believe that they can actually perform the behaviour in question
(Ajzen, 1991; Solomon et al., 2010). Attitudinal intentions represent the intent a
person has to participate in a particular behaviour, for example, to provide positive
word-of-mouth or use the brand (Ajzen & Fishbein, 1980). Therefore, if there are no
obstacles to stop the consumer from partaking in the behaviour, they are likely to do
so.
14
2.2 Branding
Branding has been used for centuries to ensure differentiation for products or
services from competitors (Konecnik & Gartner, 2007; Moor, 2007; Newton, 2008).
At its earliest, branding has been traced back to Ancient Greece and Rome (Kochan,
1996; Moor, 2007). Various products were branded to allow identification of their
origin and for people to claim ownership. For example, farmers who branded their
cattle (Kochan, 1996), or the producers of wine who burnt their names on the top of
wine barrels to allow differentiation by consumers, and less substitution of cheaper
brands by taverns (Farquhar, 1989).
However, modern branding, or the push to provide branded consumer products can
be traced back to the 1870s. Branding was restricted to a few industries, including
patented medical and tobacco-related products. Later in the nineteenth century other
brands were developed, such as Gillette and Quakers Oats (Low & Fullerton, 1994).
An examination of the academic literature suggests branding was discussed as early
as 1917, in relation to the associations consumers make when selecting a brand
(Geissler, 1917). Other authors have discussed topics such as brand awareness
(Guest, 1942), brand loyalty (Guest, 1944, 1955; Harary & Lipstein, 1962), and
brand attitude (Barclay, 1964). However, while there has been much discussion in
the literature about branding, there are still various definitions.
Branding assists with adding value to an organisation, by increasing consumer desire
for a product or service, and in turn their likelihood of purchase. The foundation of a
brand is the brand name, and more aspects, such as emotional associations, are
combined with this to enhance the added value an organisation can receive from a
brand, by increasing consumer desire (Kochan, 1996). For example, this added value
can include the creation of relationships between the brand and the consumer which
will assist in decreasing risk for the consumer, and increasing the propensity of the
consumer to use that brand. Aaker (1991) was one of the first to define a brand and
many definitions have developed from this definition. A brand, as defined by Aaker
(1991, p. 7), is:
15
“a distinguishing name and/ or symbol (such as a logo, trademark, or package
design) intended to identify the goods or services of either one seller or a
group of sellers, and to differentiate those goods or services from those of
competitors”.
By differentiating a brand it enables a consumer to form an association, or
relationship, with the brand, minimising risk, and in turn increasing the likelihood of
the consumer selecting the brand. While other definitions have been created, many
follow Aaker’s explanation, which ensures that a brand is both distinguishing and
differentiable. However, other authors have contemplated a brand as: i) a way to
create emotional associations, or perceptions, with consumers (de Chernatony &
McDonald, 2003; Healey, 2008), and ii) a set of promises and trust which form a
relationship between the brand and the consumer (Agres & Dubitsky, 1996;
Feldwick, 2002; Kapferer, 2008). Therefore, the ability of branding, to shape “a
wealth of perceptions, beliefs, attitudes, and experiences” (Kochan, 1996), and to
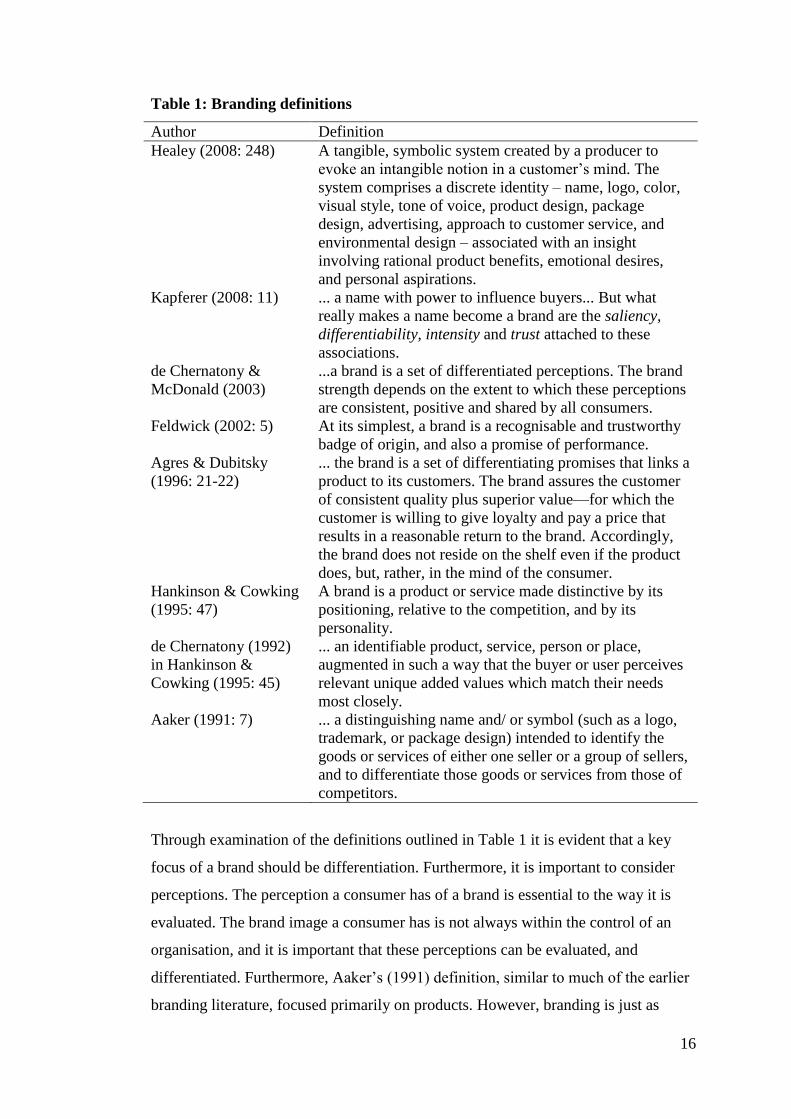
associate with something the consumer can relate to, is also important. Table 1
outlines some of these key definitions of a brand which include: i) a distinguishable
brand; ii) differentiation; iii) emotional associations or perceptions; and iv) a
relationship with the brand.
16
Table 1: Branding definitions
Author Definition
Healey (2008: 248) A tangible, symbolic system created by a producer to
evoke an intangible notion in a customer’s mind. The
system comprises a discrete identity – name, logo, color,
visual style, tone of voice, product design, package
design, advertising, approach to customer service, and
environmental design – associated with an insight
involving rational product benefits, emotional desires,
and personal aspirations.
Kapferer (2008: 11) ... a name with power to influence buyers... But what
really makes a name become a brand are the saliency,
differentiability, intensity and trust attached to these
associations.
de Chernatony &
McDonald (2003)
...a brand is a set of differentiated perceptions. The brand
strength depends on the extent to which these perceptions
are consistent, positive and shared by all consumers.
Feldwick (2002: 5) At its simplest, a brand is a recognisable and trustworthy
badge of origin, and also a promise of performance.
Agres & Dubitsky
(1996: 21-22)
... the brand is a set of differentiating promises that links a
product to its customers. The brand assures the customer
of consistent quality plus superior value—for which the
customer is willing to give loyalty and pay a price that
results in a reasonable return to the brand. Accordingly,
the brand does not reside on the shelf even if the product
does, but, rather, in the mind of the consumer.
Hankinson & Cowking
(1995: 47)
A brand is a product or service made distinctive by its
positioning, relative to the competition, and by its
personality.
de Chernatony (1992)
in Hankinson &
Cowking (1995: 45)
... an identifiable product, service, person or place,
augmented in such a way that the buyer or user perceives
relevant unique added values which match their needs
most closely.
Aaker (1991: 7) ... a distinguishing name and/ or symbol (such as a logo,
trademark, or package design) intended to identify the
goods or services of either one seller or a group of sellers,
and to differentiate those goods or services from those of
competitors.
Through examination of the definitions outlined in Table 1 it is evident that a key
focus of a brand should be differentiation. Furthermore, it is important to consider
perceptions. The perception a consumer has of a brand is essential to the way it is
evaluated. The brand image a consumer has is not always within the control of an
organisation, and it is important that these perceptions can be evaluated, and
differentiated. Furthermore, Aaker’s (1991) definition, similar to much of the earlier
branding literature, focused primarily on products. However, branding is just as
17
important for services, and even destinations. Yet, destinations have their own
complexities when considering the branding process, which will be addressed in
Section 2.3.2.
2.2.1 Components of branding.
Aaker (1996) also argued that a brand could be conceptualised as three different
components: i) brand identity; ii) brand positioning; and iii) brand image. These
three components work together when the brand is communicated by an organisation
and the message it sends is received by consumers.
Brand identity represents the message an organisation aspires to send to consumers.
An organisation aims to develop “a specific marketing mix to influence potential
customers’ overall perception of a brand, product line, or organization in general”
(Lamb, Hair, & McDaniel, 2001, p. 199). Brand identity can be portrayed through a
variety of communication strategies such as the communication of the mission/
vision, values, or the overall desired brand image (Pike, 2004). This leads the
organisation to the need to position the brand within the mind of the consumer.
Brand positioning is developed through the actions of the organisations. It is the
way it is communicated in comparison to competitors in direct competition with that
brand (Etzel, Walker, & Stanton, 2000). The brand’s position needs to be actively
communicated to a target audience with a message that provides a competitive
advantage. Therefore, positioning reflects the way the brand’s message has been
communicated in comparison to competitors, leading to the final component, brand
image, which is the actual image of the brand currently held by the consumer.
Brand image refers to how consumers and other stakeholders currently perceive and
assess the brand (Aaker, 1996). Unlike brand identity, which suggests the brand
should look to the future, brand image looks at past experiences one has with a brand
and the associations that have come from that.
The most appropriate way to examine the relationship between each of these
components in terms of a product, service, or even a destination, begins with the
18
identity considered by the organisation responsible for marketing. This brand
identity is then communicated, or positioned, by the organisation in the market place
to differentiate the destination from competitors. The brand image is the way the
consumer perceives and evaluates the information about the brand, and the way this
is influenced by previous experiences they, or others they know, have had with the
brand.
2.3 Destination branding
Branding has also been utilised for destinations. Destinations “are places that attract
visitors for a temporary stay, and range from continents to countries to states and
provinces to cities to villages to purpose built resort areas” (Pike, 2004). A
destination can be defined as a “bundle of goods and services” (Cai, 2002). The
selection of a destination to visit has far more complexity than merely selecting a
product that a customer can touch or examine before purchase. Destinations, like
services, are intangible. Therefore no ability to offer a try before you buy approach
exists. However, destinations are made up of many components and various other
businesses and for this reason the purchase of a “destination mix has an inherent
uncertainty and is usually expensive” (Cai, 2002; Eby, Molnar, & Cai, 1999;
Gartner, 1989; Kozak & Rimmington, 1999; Weaver & Lawton, 2006). Therefore,
the higher the risk associated with such a purchase, the more a consumer will need to
investigate whether or not a destination meets their needs by increasing the
information search element of the decision-making process (Cai, 2002).
It has been argued that destination branding is similar to corporate, shopping mall or
umbrella branding, where the brand encompasses a variety of different products and/
or services under the one brand (Park & Petrick, 2006). A destination must include
as its brand all products and services which could influence a person to visit (March
& Woodside, 2005). In a tourism context it is argued that a country, with its name,
flag and other symbols that relate to it, can be classed as a destination brand (Tasci,
Gartner, & Cavusgil, 2007).
The most comprehensive definition of destination branding to date was outlined in a
study developed by Blain, Levy, and Ritchie (2005):
19
...the set of marketing activities that (1) support the creation of a name,
symbol, logo, word, mark or other graphic that readily identifies and
differentiates a destination; that (2) consistently convey the expectation of a
memorable travel experience that is uniquely associated with the destination;
that (3) serve to consolidate and reinforce the emotional connection between
the visitor and the destination; and that (4) reduce consumer search costs and
perceived risk. Collectively, these activities serve to create a destination image
that positively influences destination choice (p. 337).
Even though there are suggestions the mass branding of consumer products has been
prominent since the late nineteenth century (Low & Fullerton, 1994), Blain, Levy,
and Ritchie (2005) suggest that destination branding only began to gain momentum
in the context of tourism in 1998. They argue that destination branding is still poorly
understood and many practitioners often misunderstand the concept. For example,
previous studies have focused on destination image, and many have had difficulty
distinguishing destination branding and destination image as two different
constructs. However, destination image is a core component of the destination brand
(Cai, 2002) and should be viewed as such, because it provides an insight as to how
the consumer perceives the brand and the associations they make with it. Crompton
(1979) defined destination image as “the sum of beliefs, ideas and impressions that a
person has of a destination”. Comparatively, Lawson and Baud-Bovy (1977) define
destination image as “the expression of all objective knowledge, impressions,
prejudice, imaginations, and emotional thoughts an individual or group might have
of a particular place”.
2.3.1 Importance of destination branding.
Branding is an important strategy, which should be implemented by organisations to
ensure they can differentiate themselves, gain a competitive advantage, position the
brand relative to competitors and form relationships with consumers to encourage
repeat usage. However, these same branding concepts can be utilised for
destinations.
20
Brand name awareness is defined as the ability to recall brands in certain situations
(Aaker, 1996). It is an important reason to brand as it ensures a destination can be
identified from other destinations (de Chernatony & McDonald, 2003). Once
branded, it is far easier for a consumer to remember, as well as to form positive
perceptions and emotional connections with a product, service, or even a destination
(Agres & Dubitsky, 1996; de Chernatony & McDonald, 2003; Gregory, 2004;
Healey, 2008; Kapferer, 2008; Kochan, 1996; Murphy, 1990; Stobart, 1994).
Previously, in some rare cases given political implications, names have been
changed to alter the perceptions consumers have of a destination and its brand.
Examples of this include Hog Island to Paradise Island to encourage cruise
operators to visit the destination more. Other examples include CuervoNation named
by the owners of the tequila brand, and Surfers Paradise in the 1930s, previously
named Elston (Pike, 2005).
A brand may give rise to a competitive advantage, to differentiate one organisation
from another, or in this case, one destination from another. Brands add value to an
organisation, or destination (Fombrun & Shanley, 1990), by providing a brand image
in the mind of the consumer (Aaker, 1991; Agres & Dubitsky, 1996; de Chernatony
& McDonald, 2003; Etzel et al., 2000; Hunt & Morgan, 1995; Kerin, Hartley, &
Rudelius, 2003; Murphy, 1990). This image positions a destination from competitors
and is an important element to take into consideration due to the almost limitless
number of destinations a consumer can select from (Pike, 2002a, Shani & Wang,
2011). The great number of destinations allows for easy substitution of brands by
consumers (Pike, 2005, Boo et al., 2009). A destination should utilise existing
resources, which it has an advantage with, and use them to enhance both the brand,
and the destination’s competitive position, leading to a possible increase in selection
by consumers in the marketplace (Kozak & Baloglu, 2011).
Positioning is an important action undertaken by organisations to effectively
differentiate a brand from competitors (Etzel et al., 2000). It identifies the position of
a brand within the mind of consumers relative to competitors. Positioning allows an
organisation to see how they are both perceived and associated in comparison to
competing brands. Using this information they can better market the brand to
consumers to increase the propensity of their purchase, or visit (de Chernatony &
21
McDonald, 2003; Lamb et al., 2001). By effectively positioning a destination, a
more favourable differentiation from competitors can be achieved (Day, Skidmore,
& Koller, 2002). Furthermore, by ensuring consumers continually select a brand,
because it offers more value and is more distinguishable than its competitors, a
reduction of the overall costs of marketing can be attained (Keller, 1993; Ozgener &
Iraz, 2006).
Branding also assists in allowing the destination and the consumer to form
relationships and add value to the consumer, and in turn the destination (Feldwick,
2002; Fombrun & Shanley, 1990). To form a relationship with a consumer, who will
continually revisit, has been suggested to be five times more cost effective than
continually acquiring new customers. Therefore, the creation of a relationship with
the consumer can add value to both the consumer and the organisation by enhancing
and adding value to the relationship. A relationship with the consumer can assist an
organisation by increasing customer loyalty (Aaker, 1991), decreasing promotional
costs and encouraging repeat visitation (Keller, 1993; Ozgener & Iraz, 2006; Piccoli,
O’Connor, Capaccioli, & Alvarez, 2003).
Therefore, branding adds value to a destination by differentiating it from competitors
in the mind of the consumer, creating positive perceptions and emotional
associations, as well as creating and enhancing relationships with consumers (Aaker,
1991; Agres & Dubitsky, 1996; de Chernatony & McDonald, 2003; Etzel et al.,
2000; Hunt & Morgan, 1995; Kerin et al., 2003; Murphy, 1990). Branding provides
organisations, and destinations, with a competitive advantage in the market place to
ensure they are selected over competing brands. Therefore, by becoming a
distinguishable and recognisable brand, offering more than competitors and forming
relationships with consumers, a destination has a greater propensity of being selected
by a consumer over competitors.
2.3.2 Complexities when branding destinations.
When branding a destination there are some key differences and complexities that
need to be considered. While the process is the same as branding products or
services, due to the vast combination of products and services under the one brand, it
22
is also believed to be more complex (Park & Petrick, 2006). This is for a number of
reasons, which include (March & Woodside, 2005; Park & Petrick, 2006; Pike,
2005): i) multidimensionality; ii) marketing to a wide range of segments; iii) various
stakeholders sending the one message; iv) political nature of decision making; v)
reliance on the host community; vi) measurement of brand loyalty and retention of
visitor data; vii) the economic contribution of tourism to the community; and viii) a
lack of funding for DMOs. Destination branding should be implemented to increase
the strength of the destination’s brand in a competitive market place. Each of the
reasons outlined will be discussed in more depth.
Multidimensionality is an important concept considering the need to “encapsulate a
destination’s diverse and often eclectic range of natural resources, built attractions,
culture, activities, amenities and accommodation” (Pike, 2005) under the one
destination positioning slogan. A destination is so complex that it cannot
communicate everything within that destination’s positioning strategy (March &
Woodside, 2005). In comparison to products, which are designed for consumers’
needs or wants, destinations must promote what they have to a consumer to
encourage them to visit, and position it in such a way that they find it attractive.
Therefore, DMOs must promote their destination to a wide range of geographic
markets and segments to encourage a large, more diverse audience to visit (Pike,
2005).
Many stakeholders send the destination’s message to visitors. This includes tourism
businesses and the way they are promoted, as well as the involvement of the host
community. Additionally, individual tourism businesses may have a different agenda
to that of the destination. The host community of a destination is another important
consideration, as they must agree with the positioning strategy utilised for a
destination. If there is a lack of acceptance, this can be portrayed through contact
with visitors, as the host community, through businesses in the region, is responsible
for directly delivering the brand to the consumers (Pike, 2005). Politically, there is
debate as to who is responsible for the decision making of a destination brand. The
parties, such as individual businesses, represented on tourism boards are sometimes
considered to have far more power, as DMOs have moved towards public-private
partnerships to enhance funding (Pike, 2005). This has resulted from the reliance
23
DMOs have on government funding, yet their funding, when compared to large
corporations, is relatively small and difficult for them to attain (Park & Petrick,
2006; Pike, 2005).
The previous reasons were identified as key differences; however both the loyalty
and retention of visitors and economic contribution of tourism can be viewed as
outcomes of branding. Each of these can be linked to measurement practices
currently utilised, including visitor numbers and financial measures, yet both are
relatively inaccurate (Wober, 2002). For example, visitor numbers would be
portrayed for consumers who revisit a destination, yet there is an assumption, if a
consumer revisits, that they could be visiting because they are loyal. However, there
could be other factors influencing this decision, including for example, discounts
from travel wholesalers. Additionally, communication with previous visitors to
encourage repeat visitation rarely happens, yet is an important source of loyalty and
cost-effectiveness for a destination to encourage previous visitors to return.
Financially, due to the many components making up the tourism industry, including
facilities, accommodation, infrastructure, transportation and hospitality (FAITH)
(Weaver & Lawton, 2006), and as there are so many individual businesses (Kozak &
Rimmington, 1999), it is difficult to distinguish where a specific visitor spends their
money. Their spending is complicated to distinguish from, for example, the host
community. Furthermore, communication with visitors is essential, however not
undertaken by DMOs (Murdy & Pike, 2012; Pike, Murdy, & Lings, 2011).
Therefore, it is difficult to evaluate the economic contribution of tourism alone.
2.3.3 Travel context.
Destination branding is important to ensure that a destination is competitively
positioned in the mind of consumers. However, it is suggested travel context, or the
reason for travel, can influence the evaluation of a destination brand. For example, if
someone wishes to have a relaxing and quiet weekend away, they will be less likely
to travel to a destination which is promoted as being exciting and fast-paced.
Travel context is defined as the purpose of a trip (Snepenger & Milner, 1990), and
can be linked to the concept of product usage from the general marketing literature.
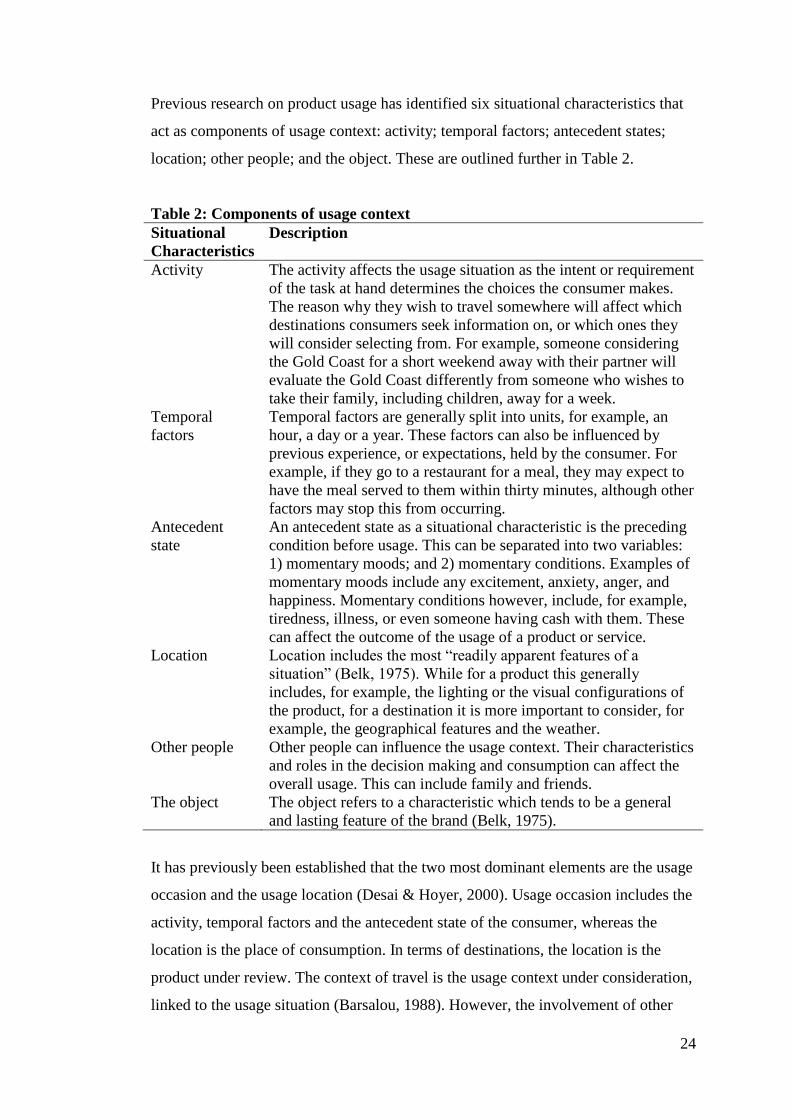
24
Previous research on product usage has identified six situational characteristics that
act as components of usage context: activity; temporal factors; antecedent states;
location; other people; and the object. These are outlined further in Table 2.
Table 2: Components of usage context
Situational
Characteristics
Description
Activity The activity affects the usage situation as the intent or requirement
of the task at hand determines the choices the consumer makes.
The reason why they wish to travel somewhere will affect which
destinations consumers seek information on, or which ones they
will consider selecting from. For example, someone considering
the Gold Coast for a short weekend away with their partner will
evaluate the Gold Coast differently from someone who wishes to
take their family, including children, away for a week.
Temporal
factors
Temporal factors are generally split into units, for example, an
hour, a day or a year. These factors can also be influenced by
previous experience, or expectations, held by the consumer. For
example, if they go to a restaurant for a meal, they may expect to
have the meal served to them within thirty minutes, although other
factors may stop this from occurring.
Antecedent
state
An antecedent state as a situational characteristic is the preceding
condition before usage. This can be separated into two variables:
1) momentary moods; and 2) momentary conditions. Examples of
momentary moods include any excitement, anxiety, anger, and
happiness. Momentary conditions however, include, for example,
tiredness, illness, or even someone having cash with them. These
can affect the outcome of the usage of a product or service.
Location Location includes the most “readily apparent features of a
situation” (Belk, 1975). While for a product this generally
includes, for example, the lighting or the visual configurations of
the product, for a destination it is more important to consider, for
example, the geographical features and the weather.
Other people Other people can influence the usage context. Their characteristics
and roles in the decision making and consumption can affect the
overall usage. This can include family and friends.
The object The object refers to a characteristic which tends to be a general
and lasting feature of the brand (Belk, 1975).
It has previously been established that the two most dominant elements are the usage
occasion and the usage location (Desai & Hoyer, 2000). Usage occasion includes the
activity, temporal factors and the antecedent state of the consumer, whereas the
location is the place of consumption. In terms of destinations, the location is the
product under review. The context of travel is the usage context under consideration,
linked to the usage situation (Barsalou, 1988). However, the involvement of other
25
people can affect the activity, or decision to be made when considering a holiday.
This should be taken into account when considering the travel context. Pike (2006,
p. 320) argued that an individual consumer “will likely hold different decision sets of
destinations for different types of holidays”. A decision set, as defined by Howard
and Sheth (1969, p. 98) consists of the “brands that the buyer considers acceptable
for [their] next purchase”. Therefore, based on the reason of travel, the consumer
must decide which destination out of those they consider for their next visit, is most
relevant to the travel context being considered.
Little research has been conducted on the effect of travel context in regard,
explicitly, to destination image (Pike, 2002b) and whether or not this context alters
the evaluation of the destination to a consumer. However, Hu and Ritchie’s (1993)
study identified and compared the attributes for destination choice in regard to
destination attractiveness. This was conducted using two different, and broad, travel
contexts: recreational travel and educational travel. It was suggested that to better
assess the attractiveness of a destination, the context of travel needed to be defined.
Additionally, Hu and Ritchie (1993) proposed that attributes could be judged
significantly differently based on the travel context. For this reason they utilised a
situation-specific multi-attribute model to evaluate the received weight of each
attribute on the destination choice, based on travel context. However, attributes
selected were pre-determined, and not elicited by consumers. This can pose a
problem as the attributes may not be important, or even relevant, to consumers.
Pike’s (2002b, 2007a) review of over 260 destination image studies between 1973
and 2007 identified only 37 studies which explicitly examined travel context (Pike,
2002b, 2007a). Therefore, while previous studies have examined different travel
contexts, for example, such as short-break holidays (Pike, 2006), family holidays
(Swarbrooke & Horner, 2007) and convention travel (Chacko & Fenich, 2000;
Crouch & Ritchie, 1998; Oppermann, 1996), little research has discussed the degree
in which consumer evaluations differ by comparing travel contexts (Hu & Ritchie,
1993).
While there is no one comprehensive typology of all the different travel contexts, or
market segments, some suggestions have been outlined (Swarbrooke & Horner,
26
2007). Examples of travel contexts, or reasons for travel include: travel with family,
hedonism, backpacking, conventions, visiting friends and relatives (VFR), day-
tripping, education, religion, seasonal travel, socialising, short-breaks, romantic
weekends, shopping trips, health spa breaks, special interest breaks, special events,
and relaxing trips away. There can be some overlap of contexts, for example, a short-
break holiday can be taken to see friends and relatives. Each of these reasons for
travel can also have an impact on the evaluation of the destination based on attributes
that will be most important in their destination choice.
Hu and Ritchie (1993) argued that it was important to consider travel context when
conducting research. However, Pike’s (2002b, 2007a) studies analysing destination
image, a core component of the destination brand, found from 231 publications only
37 reported travel context. Contrastingly, a study by Gertner (2010) found few
differences between education and recreation travel. However previous comparisons
of travel context have been conducted utilising pre-determined attributes not
identified by consumers (Gertner, 2010; Hu & Ritchie, 1993).
2.4 Measuring brand performance
A brand assists an organisation by adding value through differentiation from
competitors, and the relationships formed with consumers. A brand is something that
adds value to the consumer by reducing the risk of purchase, and in turn, making
decision making easier. This therefore increases their desire for the brand, leading to
more value to the organisation. The measure of the additional value provided by a
brand is traditionally referred to as brand equity. Brand equity is defined as “the
‘added value’ with which a given brand endows a product” (Farquhar, 1989, p. 24).
The functional benefit of a brand is the product alone, with no extra value added.
When considering a destination, this would be the location selected to go on holiday.
However, the added value by associating the destination with a particular brand, such
as the positive perceptions, should be measured to provide a more accurate
understanding of the brand’s performance. Overall, a brand adds value to the
consumer through a relationship as it reduces risk. This relationship emphasis leads
to the consumer selecting the destination, or organisation, and enhances value to the
firm (Agres & Dubitsky, 1996; Feldwick, 2002; Kapferer, 2008).
27
How a brand, and its equity, should be measured has been a topic of strong debate
within much of the literature. Equity can be measured from two perspectives, either
for the organisation, or for the consumer, and there are two main variations as to how
brand equity should be valued (Egan, 1998), either: financially (Barwise, Higson,
Likierman, & Marsh, 1989; Egan, 1998; Park & Srinivasan, 1994; Russell &
Kamakura, 1994; Simon & Sullivan, 1993; Winters, 1991), or utilising a consumer-
based perspective (Aaker, 1991; Agarwal & Rao, 1996; Arnett, Laverie, & Meiers,
2003; Boo et al., 2009; Cobb-Walgren, Beal, & Donthu, 1995; Egan, 1998; Keller,
1993; Konecnik & Gartner, 2007; Lassar, Mittal, & Sharma, 1995; Mackay, 2001;
Oh, 2000; Pappu, Quester, & Cooksey, 2005; Pike, 2009; Sweeney & Soutar, 2001,
Washburn & Plank, 2002; Yoo & Donthu, 2001).
While financial measures are generally utilised to measure the brand equity, or
performance, of a brand (Barwise et al., 1989; Egan, 1998; Park & Srinivasan, 1994;
Russell & Kamakura, 1994; Simon & Sullivan, 1993; Winters, 1991), consumer-
based measures have also been utilised (Aaker, 1991; Agarwal & Rao, 1996; Boo et
al., 2009; Cobb-Walgreen et al., 1995; Keller, 1993; Konecnik & Gartner, 2007;
Lassar et al., 1995; Pappu et al., 2005; Pike, 2009; Yoo & Donthu, 2001). This
measures the brand performance utilising the perceptions of consumers as a measure.
For the purposes of this study, equity to an organisation will hereinafter be called
brand performance, and equity to the consumer will hereinafter be called brand
value. Both of these variations of brand equity will be explained and evaluated,
before proposing a model of destination brand performance measurement.
2.4.1 Brand performance: Using financial measures.
Intangible assets, such as brands, can reflect the true brand performance of an
organisation and can contribute to the firm’s comparative advantage (Fombrun &
Shanley, 1990), by increasing consumer demand for a brand, and in turn, the added
value to the organisation (Kapferer, 2008). Financial measures tend to be used by
organisations to evaluate and establish an intangible asset value which can be placed
on the financial statements published by an organisation (Barwise et al. 1989). These
measures assist by providing one figure which can be used to establish the monetary
worth of a brand, including those intangible assets. Simon and Sullivan (1993, p. 29)
28
define brand performance, from a financial perspective, as “... the incremental cash
flows which accrue to branded products over and above the cash flows which would
result from the sale of unbranded products”.
Financially, there are various ways to measure brand performance. These can
include, for example, scanner data (Kamakura & Russell, 1993; Russell &
Kamakura, 1997) or financial market value (Simon & Sullivan, 1993). However, as
suggested by Aaker (1996), an emphasis on the financial performance of a firm
involves short-term objectives, such as sales figures, and does not focus on the long-
term objectives, including the consumer perceptions over time, of the organisation.
An organisation should strive to meet long-term goals to ensure continued
relationships with consumers and, in turn, greater profitability. Brands should be
managed by considering the long-term market position and objectives of the brand to
ensure a long relationship with the customer (Feldwick, 1996), including repeat
patronage, as it is more cost-effective for an organisation to retain existing
customers, rather than acquire new ones (Ozgener & Iraz, 2006). By measuring
brand performance, this provides a better indicator of the components that affect a
destination, and provides DMOs with an understanding of destination
competitiveness.
2.4.2 Brand equity: Using consumer-based measures.
Consumer measures have generally been utilised to assess brand value, or the value
of the brand to the consumer. Vazquez, Belen del Rio, and Iglesias (2002, p. 28)
define brand value as being “the overall utility that the consumer associates to the
use and consumption of the brand; including associations expressing both functional
and symbolic utilities”.
Therefore, the brand exists in the mind of the consumer, and what the consumer
thinks about the brand influences the additional value of the brand to that consumer
(Dyson, Farr, & Hollis, 1996). However, it is proposed that consumer-based
measures be utilised to measure the performance of a brand from an organisational
perspective. A brand is not just tangible, but exists in the mind of the consumer, and
the more positive perceptions the consumer has of the brand, the greater the value to
29
the organisation. “A brand’s foundations are, therefore, composed of peoples’
intangible mental associations about it. In placing a value on a brand, we are placing
a value on the strength and resilience of those associations” (Dyson et al., 1996, p. 9)
and in turn, assessing the performance of a brand. It has previously been suggested
that attitudes towards a brand, when combined with behaviour, can be an important
indicator to future measures of brand equity (Cobb-Walgreen et al., 1995).
Traditionally, brand performance, or equity for an organisation, tends to focus on
the financial measures that will provide the best short-term results, such as sales
figures, return on assets, profit and margins for a brand (Aaker, 1996). However, the
long-term goals, and the building of a brand, are less of a focus in this approach. A
stronger approach suggests the measurement of brand performance needs to focus on
the key drivers of the market place, which in regard to long-term results, should
recognise the five constructs of the consumer-based brand equity (CBBE) hierarchy:
i) brand salience; ii) brand associations; iii) perceived quality; iv) brand loyalty; and
v) other proprietary brand assets (Aaker, 1996). The CBBE hierarchy will be
discussed in greater depth in Section 2.4.4.
2.4.3 Measuring a destination’s brand performance.
The aim of this study is to assess the performance of a destination brand. Various
measures have previously been utilised to measure a destination brand, primarily
including financial information and visitor numbers. However, these are inaccurate
measures and will be discussed in more detail.
Destinations, from an organisational perspective, are unable to measure their brand
financially due to the number of components within the tourism industry, and
inaccuracies involved in assessing the performance of the brand. The most common
aspects of the destination mix include facilities, attractions, infrastructure,
transportation and hospitality services (FAITH) (Weaver & Lawton, 2006).
Therefore, measurement becomes problematic when dealing with a variety of
different categories within the one tourism industry for a destination mix. Specific
numbers cannot be recorded as consumers will visit a variety of different services
when staying at a destination. For example, if a consumer considers a destination
30
such as the Gold Coast, they may stay at a hotel near the beach (hospitality), buy
their food from a restaurant in Cavill Avenue (hospitality), visit the theme parks
(attractions) and catch buses between each of these locations (infrastructure). This
example demonstrates that the money spent by these visitors is collected by various
businesses. Therefore, the impact it has on the destination brand is difficult to
calculate due to the variety of components that make up a destination. Additionally,
when considering the money attained by businesses, it is just as difficult to identify
who spent the money, for example, whether it was a visitor or someone from the host
community.
Another problem, in terms of measuring a brand’s performance by collecting visitor
numbers is the inability to distinguish between visitors. For example, while visitor
numbers can be recorded for those people visiting the Sunshine Coast, data is not
always captured for the reason for their visit. Without knowing this, it may in fact
not have been the brand that enticed them to travel, but other factors, making the
collection of visitor numbers inaccurate (Wober, 2002). They may be visiting the
destination for a short-break, a longer annual holiday, or even visiting friends and
family (VFR). When considering VFR travel, the consumer has little choice where
they travel to. Their reason for travelling to the destination is not related to how
much they want to travel, based on the brand, but because that is where their family
or friends are. This provides little insight into the performance of the actual
destination brand. Additionally, it could be suggested that people will make different
evaluations about the performance of a brand depending on why they go there, or
their travel context (Pike, 2006, 2007b). Another example of travelling to the
destination, not for what the brand offers but the influence of other factors, includes
the promotion of the destination by other parties. For example, a tour operator may
have been offering specials at that particular time. In this case the special influenced
their visit and not their desire for the brand or destination.
2.4.4 Consumer-based brand equity.
Aaker’s (1991) consumer-based brand equity (CBBE) model identifies the building
and measurement of a brand using indicators which will provide a brand with a long-
term focus (Aaker, 1991; Keller, 2003). This hierarchy, developed by Aaker (1991)
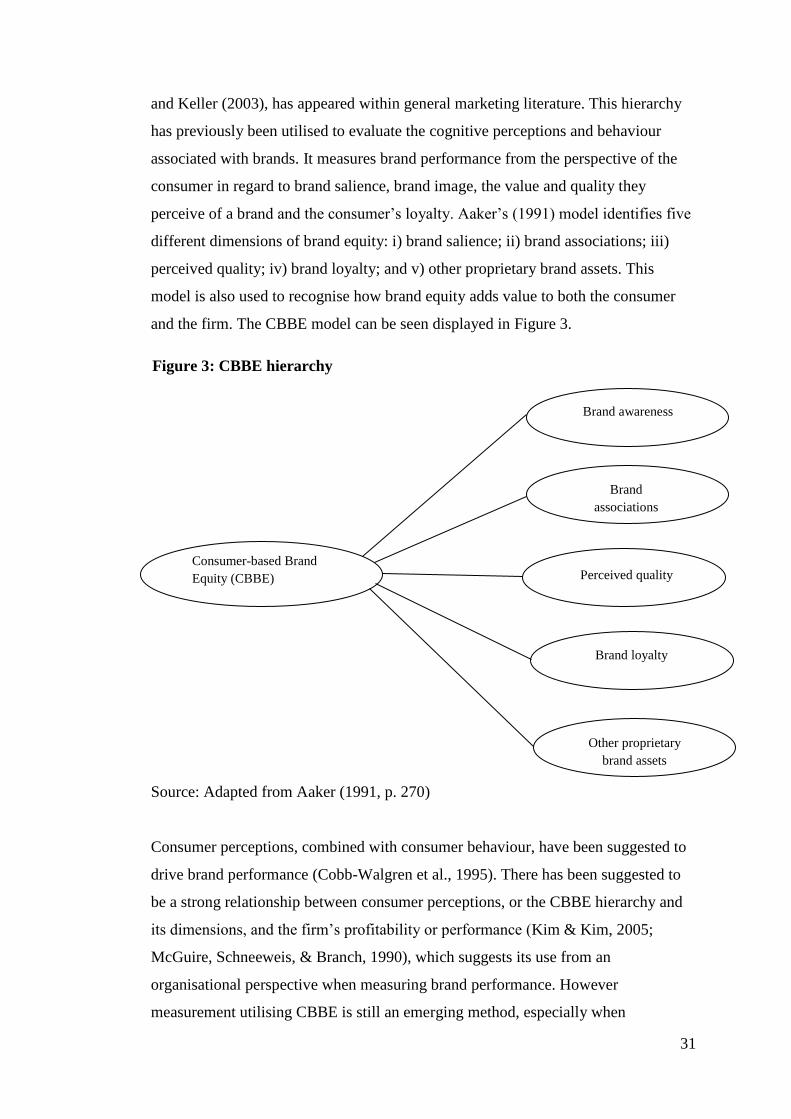
31
and Keller (2003), has appeared within general marketing literature. This hierarchy
has previously been utilised to evaluate the cognitive perceptions and behaviour
associated with brands. It measures brand performance from the perspective of the
consumer in regard to brand salience, brand image, the value and quality they
perceive of a brand and the consumer’s loyalty. Aaker’s (1991) model identifies five
different dimensions of brand equity: i) brand salience; ii) brand associations; iii)
perceived quality; iv) brand loyalty; and v) other proprietary brand assets. This
model is also used to recognise how brand equity adds value to both the consumer
and the firm. The CBBE model can be seen displayed in Figure 3.
Source: Adapted from Aaker (1991, p. 270)
Consumer perceptions, combined with consumer behaviour, have been suggested to
drive brand performance (Cobb-Walgren et al., 1995). There has been suggested to
be a strong relationship between consumer perceptions, or the CBBE hierarchy and
its dimensions, and the firm’s profitability or performance (Kim & Kim, 2005;
McGuire, Schneeweis, & Branch, 1990), which suggests its use from an
organisational perspective when measuring brand performance. However
measurement utilising CBBE is still an emerging method, especially when
Figure 3: CBBE hierarchy
Consumer-based Brand
Equity (CBBE)
Brand awareness
Brand
associations
Perceived quality
Brand loyalty
Other proprietary
brand assets
32
considering the organisational perspective. There is no one specific measure of
CBBE and its use considering brand performance must still be proven. A method of
analysis should be proposed to ensure differentiation and comparison of brands is
understood, and how this assists in offering value to both the organisation and the
consumer.
There are some differences in the number and identification of the constructs
presented within the CBBE hierarchy by different authors (see Aaker, 1991 and
Keller, 2003). A literature search, focused on reviewing the CBBE hierarchy,
identified that many authors tend to focus on only four of the five constructs: i)
brand loyalty; ii) brand awareness; iii) perceived quality; and iv) brand associations
as outlined by Aaker (1991) and Keller (2003) (Arnett et al., 2003; Konecnik &
Gartner, 2007; Pappu et al., 2005; Washburn & Plank, 2002; Yoo & Donthu, 2001).
However, variations of the CBBE hierarchy have been tested, based on either all
dimensions of the hierarchy as a whole or individually (Agarwal & Rao, 1996; Boo
et al., 2009; Cobb-Walgreen et al., 1995; Lassar et al., 1995; Mackay, 2001; Oh,
2000; Sweeney & Soutar, 2001). The fifth construct proposed by Aaker, other
proprietary brand assets, was added to include items such as channel relationships
and patents. The purpose of this construct was to complete the hierarchy, by taking
into consideration smaller aspects which did not fit within the other four categories.
2.5 Towards the development of a model of destination brand
performance
It is for the aforementioned reasons that a new model is proposed for destination
brand performance. A review of the literature shows that there are few studies that
have attempted to measure a destination’s brand performance (Boo et al., 2009;
Konecnik & Gartner, 2007).
The utilisation of the CBBE hierarchy and its dimensions to measure brand
performance was first broached by Konecnik and Gartner (2007) to identify a
brand’s performance within two separate markets. The brand, Slovenia, was
measured using consumers from both German and Croatian markets. The four key
CBBE dimensions were used: destination awareness; destination image; destination
33
quality; and destination loyalty. Konecnik and Gartner (2007) found their model was
useful in evaluating destination branding. However, their model was not created for
testing across travel contexts. Furthermore, it is proposed that other aspects such as
subjective norms and perceived behavioural control impact on destination brand
performance. These constructs reflect bounded rationality, and impact on intentions
(Ajzen & Fishbein, 1980).
Boo et al. (2009) also provided a measure of destination brand performance, utilising
two destinations. This hierarchy differed from the four dimension CBBE hierarchy
developed by Aaker (1991) and Keller (1993, 2003), and utilised by Konecnik and
Gartner (2007). Four dimensions were developed when measuring a destination’s
brand performance: destination brand awareness, destination brand experience,
destination brand value, and destination brand loyalty (Boo et al., 2009). They found
destination brand experience incorporated both destination brand image and
destination brand quality. The way image was measured differed from Konecnik and
Gartner’s (2007) approach by focusing on personality aspects within the image
dimension, and not the physical attributes. However, it is proposed that the original
CBBE hierarchy should be examined further with the inclusion of the theory of
planned behaviour utilised as a framework. Furthermore, Boo et al. (2009) and Pike
et al. (2010) suggested that measurement of destination brand performance could be
conducted utilising the CBBE hierarchy. However this recommendation by Boo et
al. (2009) was followed with the concept that destinations should be compared
within the same brand category. However, it is proposed that while evaluations such
as the performance of attributes may differ across destinations, one model of
destination brand performance can be used across travel contexts.
Pike’s (2009) paper examined the purpose of the CBBE hierarchy for destinations
and reviewed destination brand papers since their beginning. It was important to
recognise, however, that branding was a process that should be tracked over time
(Pike, 2009), which emphasises Aaker’s (1996) discussion in terms of the CBBE
hierarchy and long-term goals of an organisation. Each of these studies represents
the CBBE hierarchy for destinations, and each differs in their approach, much like
the general CBBE literature (Arnett et al., 2003; Pappu et al., 2005; Washburn &
Plank, 2002; Yoo & Donthu, 2001). Therefore, while studies have recently been
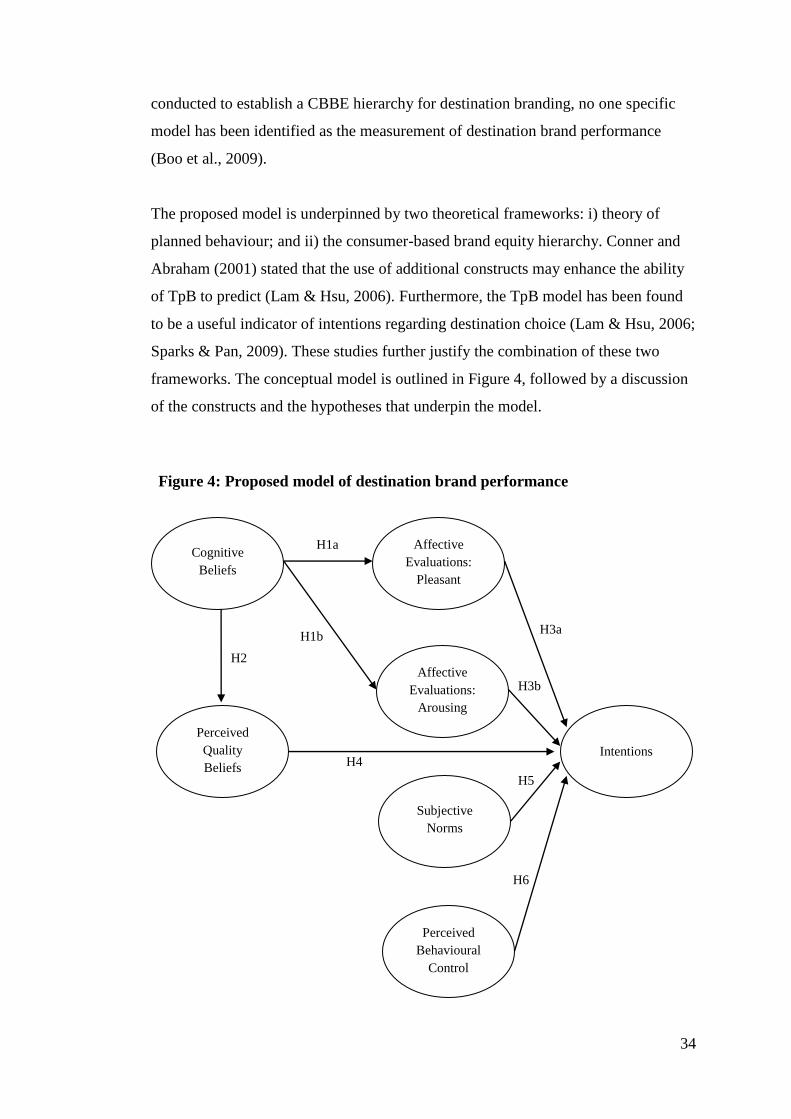
34
conducted to establish a CBBE hierarchy for destination branding, no one specific
model has been identified as the measurement of destination brand performance
(Boo et al., 2009).
The proposed model is underpinned by two theoretical frameworks: i) theory of
planned behaviour; and ii) the consumer-based brand equity hierarchy. Conner and
Abraham (2001) stated that the use of additional constructs may enhance the ability
of TpB to predict (Lam & Hsu, 2006). Furthermore, the TpB model has been found
to be a useful indicator of intentions regarding destination choice (Lam & Hsu, 2006;
Sparks & Pan, 2009). These studies further justify the combination of these two
frameworks. The conceptual model is outlined in Figure 4, followed by a discussion
of the constructs and the hypotheses that underpin the model.
Figure 4: Proposed model of destination brand performance
H1b
H4
H2
Affective
Evaluations:
Pleasant
Intentions
Subjective
Norms
Affective
Evaluations:
Arousing
Perceived
Quality
Beliefs
Perceived
Behavioural
Control
Cognitive
Beliefs
H1a
H3a
H3b
H5
H6
35
2.5.1 Destination image (cognitive beliefs and affective
evaluations).
The destination literature has emphasised the importance of destination image, as a
way of communicating with consumers (Cai, 2002). Destination image is a core
construct of destination brand, and has been widely discussed in the literature since
1973 (see Mayo, 1973). Given the various ways destination image has previously
been measured, this makes it a challenging construct to operationalise. The
destination image, or associations with the brand, refers to attributes consumers
consider for a holiday, and the aspects which they link to a particular destination.
The various associations a consumer makes about a destination can be linked to the
brand equity of the destination (Krishnan, 1996). However, it has been proposed that
the associations a consumer makes with a destination can be influenced by the travel
context (Gertner, 2010; Hu & Ritchie, 1993; Pike, 2006, 2007b). For example, some
attributes may be more important for a short-break holiday than a longer holiday for
a particular visitor.
It has previously been proposed that destination image consists of two components:
i) affective; and ii) cognitive. Both affective and cognitive components need to be
present when considering the destination image. It has been found that cognitive
image is an antecedent of affective image (Baloglu, 1999, Baloglu & McCleary,
1999, San Martin & del Bosque, 2008; Stern & Krakover, 1993).
Cognitive image consists of attributes which relate to those associations a consumer
makes directly with a brand. The various associations a consumer makes with a
variety of brands can also link to the brand equity for that particular brand (Krishnan,
1996). Studies analysing associative network theories have been utilised to
understand the links between various neuroids within the brain. Activation within
memory measures the closeness of the relationship between these neuroids, or the
information that is already stored, and associated information that is currently being
used (Anderson, 1996). Various neuroids link with others, which is how a person
associates something with an emotion or reaction based on their memory (Bloom &
Lazerson, 1988). The interactions the nodes have within the brain will affect how a
consumer perceives a particular brand, and will in turn affect the overall brand
36
equity. These associations are generally activated through the information already
stored by the consumer (Anderson, 1996), which occurs through the promotion of a
destination to consumers.
Cognitive image has previously been measured in two ways: i) as a summated scale
(Baloglu & Brinberg, 1997); or ii) using multi-attribute utility theory (Cracolici
&Nijkamp, 2009). When considering multi-attribute theory an index, or composite
measure, is used. Cognitive phenomena are frequently investigated using an index
(Zikmund, Ward, Lowe, Winzar & Babin, 2011). That is, several attributes, when
combined, create a “more accurate cumulative measure” (Zikmund et al., 2011, p.
246). This is based on multi-attribute utility theory or multi-attribute attitude models
in which each attribute discussed adds to the multidimensional image. There are
three components to multi-attribute decision models: i) attributes; ii) importance
weights; and iii) belief strength. In regard to destinations, a list of attributes can be
used to represent a destination’s image. These attributes can then be assessed on how
important they are to the consumer (Solomon et al., 2010), before assessing that
against the belief strength. The belief strength refers to the consumer’s belief that the
brand, or destination, in question has the attribute. This is then multiplied and can be
used to assess brands across a particular category (Solomon et al., 2010).
Affective image of a place was examined by Baloglu and Brinberg (1997).This was
derived from Russel’s (1980) circumplex model of affect. The affective component
of image has an orthogonal relationship, as outlined in Figure 5. This has resulted in
either a summated scale (Baloglu & McCleary, 1999; Russell & Snodgrass 1987), or
two components, or constructs, within affective image: pleasant and arousing.
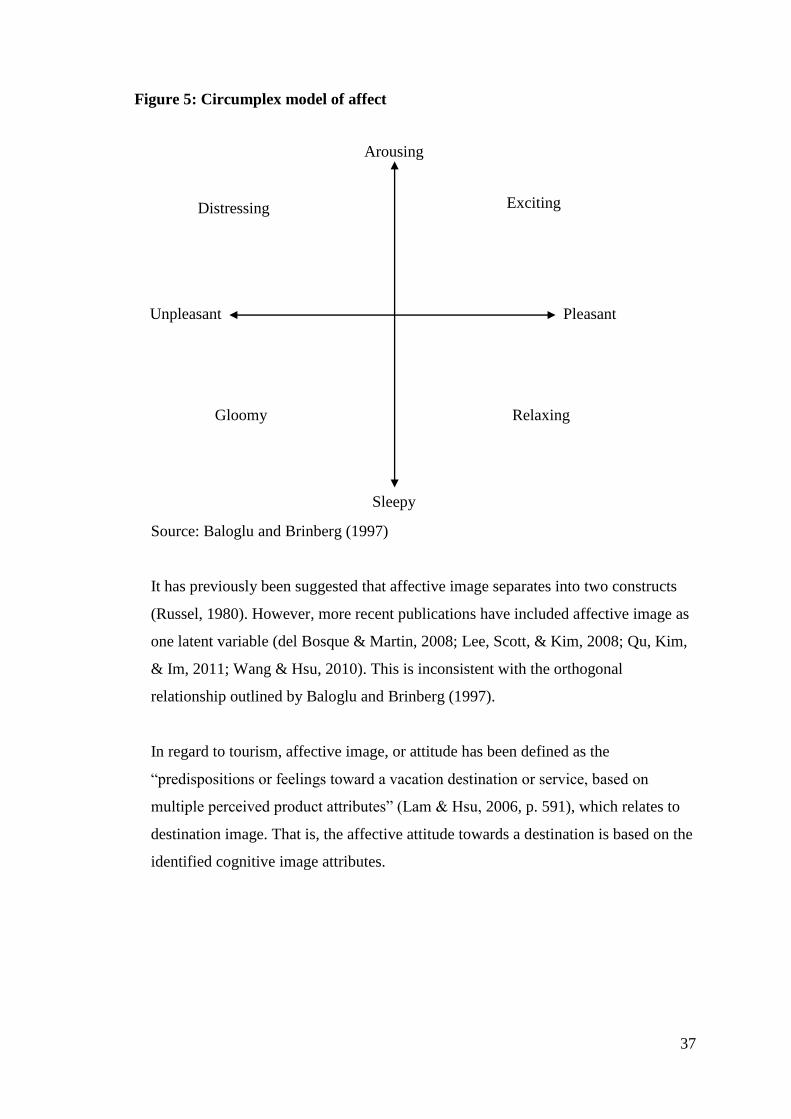
37
Source: Baloglu and Brinberg (1997)
It has previously been suggested that affective image separates into two constructs
(Russel, 1980). However, more recent publications have included affective image as
one latent variable (del Bosque & Martin, 2008; Lee, Scott, & Kim, 2008; Qu, Kim,
& Im, 2011; Wang & Hsu, 2010). This is inconsistent with the orthogonal
relationship outlined by Baloglu and Brinberg (1997).
In regard to tourism, affective image, or attitude has been defined as the
“predispositions or feelings toward a vacation destination or service, based on
multiple perceived product attributes” (Lam & Hsu, 2006, p. 591), which relates to
destination image. That is, the affective attitude towards a destination is based on the
identified cognitive image attributes.
Arousing
Sleepy
Pleasant Unpleasant
Distressing Exciting
Relaxing Gloomy
Figure 5: Circumplex model of affect
38
H1a: Cognitive beliefs are positively related to pleasant affective
evaluations.
H1b: Cognitive beliefs are positively related to arousing affective
evaluations.
H2: Cognitive beliefs are positively related to perceived quality beliefs.
H3a: Affective evaluations (pleasant) are positively related to intentions.
H3b: Affective evaluations (arousing) are positively related to intentions.
2.5.2 Perceived quality beliefs.
Perceived quality is defined as a “customer’s perception of the overall quality or
superiority of a product or service relative to relevant alternatives and with respect to
its intended purpose” (Keller, 2003, p. 238). It is therefore based on the subjective
evaluations of consumers (Pappu et al., 2005; Yoo & Donthu, 2001; Zeithaml,
1988). Perceived quality has been identified to be a core component of consumer-
based brand equity for destinations (Boo et al., 2009; Konecnik & Gartner, 2007,
Pike et al., 2010), and has previously been tested as it was developed by Aaker
(1991) (Kim & Kim, 2005; Pappu et al., 2005; Pappu & Quester, 2006; Sweeney &
Soutar, 2001). It has previously been suggested that image and quality are
dimensions which can be combined. However, it has been identified that image is an
antecedent of perceived quality (Low & Lamb, 2000) and perceived quality acts as
one dimension of a multi-dimensional measure of consumer-based brand equity
(Pappu et al., 2005).
It provides consumers with a reason to purchase a brand or visit a destination as it
assists in differentiating the brand from competitors (Pappu et al., 2005). Whether or
not the consumer sees quality in the destination, and is satisfied overall, links
directly to the brand’s performance. If a visitor expects the quality of the brand to be
high, they are likely to positively evaluate the destination, which results in higher
performance of the brand. It is theoretically understood that perceived quality adds
values to a consumer’s purchase (Boo et al., 2009; Low & Lamb, 2000).
Furthermore, a positive relationship has previously been proposed between perceived
quality and loyalty (Boo et al., 2009; Jayanti & Ghosh, 1996).
H4: Perceived quality beliefs are positively related to intentions.
39
2.5.3 Subjective norms.
Subjective norms, as outlined in Section 2.1.1, are the social influences which have
an impact on intentions. It is proposed that subjective norms are positively related to
intentions. That is, the more popular a destination is to family and friends of a
consumer, the more likely they are to have positive intentions relative to the
destination. Furthermore, subjective norms have been identified to have a significant
relationship with intentions when considering destinations (Lam & Hsu, 2006;
Sparks & Pan, 2009).
H5: Subjective norms are positively related to intentions.
2.5.4 Perceived behavioural control.
Perceived behavioural control, as outlined in Section 2.1.1, refers to the constraints
which could impact on someone’s intentions (Ajzen, 1991). This construct has been
shown to have a positive relationship with intentions (Lam & Hsu, 2006). For
example, the more time, money and control someone has, the more likely they will
be to have positive intentions (Sparks & Pan, 2009).
H6: Perceived behavioural control is positively related to intentions.
2.5.5 Intentions – destination loyalty.
Loyalty is defined in this study as the intentions one has to visit a destination, or
provide positive word-of-mouth. This acts as the dependent variable of a
destination’s brand performance, as this can be assessed by whether or not a
consumer has intent to visit a destination. If a consumer is not convinced by the
brand of the destination, they are less likely to visit and will travel to a competing
destination. Consumers have an almost limitless number of destinations to travel to
(Pike, 2002b), and it has been suggested that the higher the intent to visit, the more
likely the consumer is to visit and the better the destination’s future performance
(Pike, 2007c, 2010). This emphasises the importance of intent and its effect on brand
performance.
40
Repeat visitation is another important component of destination relationships. A
study by Gitelson and Crompton (1984) identified the main differences of repeat
visitation between retail store purchases and holidays, which were the cost of the
product, the choice of destinations, or the decision to take a holiday is not
spontaneous, and finally, a destination is intangible. The cost is relevant as there is a
greater level of decision making when considering a destination over a cheaper retail
store purchase. Secondly, the destination choice is not likely to be spontaneous. This
is because there is so much planning, time, money and overall involvement when
considering a holiday destination as opposed to a retail product, for example a book.
Thirdly, the destination is intangible, meaning the more visits, the more knowledge
that is attained of the product, or destination (Gitelson & Crompton, 1984).
Oh’s (2000) CBBE model for the hospitality industry utilised a loyalty aspect called
post-purchase intention as a dimension of CBBE. The purpose of this dimension was
to assess the likelihood of consumers to return to the restaurant, become a regular
customer and provide positive word-of-mouth about the restaurant. Word-of mouth
is an important concept to consider. Whether the consumer feels loyal to the brand,
whether they have previously visited and had a good experience, and would visit
again, effects whether or not they will disseminate positive or negative information
about the destination to others. This is also an important consideration for a
destination. Destinations should strive to ensure repeat visitation, as it is suggested to
be five-times more cost-effective than continually acquiring new customers
(Ozgener & Iraz, 2006). The higher the brand loyalty, the greater perception of each
of the loyalty components: experience, intent to visit, repeat visitation and word-of-
mouth. The more loyal the consumer is, the higher the brand performance.
2.5.6 Awareness.
Awareness refers to those destinations which can be recalled by a consumer (Milman
& Pizam, 1995). For a destination to be visited by a consumer, it has been proposed
that the destination must first appear in their consideration set (Narayana &Markin,
1975). Furthermore, research has shown that consumers only have between two and
six destinations in their consideration set (see Crompton, 1992; Pike, 2006; and
Woodside & Sherrell, 1977), and the destination which is top-of-mind is a source of
41
competitive advantage (Axelrod, 1968, Woodside & Wilson 1985). It is therefore a
challenge for DMOs to ensure that the destinations they are responsible for are
positioned in a consumer’s decision set. Contrastingly, Milman and Pizam (1995)
stated that the consideration set was not a strong indicator of intent to visit.
Furthermore, they suggest that consumers who are aware of a destination do not
necessarily make a more positive evaluation of the destination. It is therefore
proposed that awareness, or whether the destination is within a consumer’s decision
set, and its impact on intentions should be evaluated against the proposed model of
destination brand performance (see Figure 4) to identify the better indicator of
destination brand performance.
2.6 Summary
From a review of the literature, this research proposes the development of a model of
destination brand performance, utilising TpB as a framework, in combination with
the CBBE hierarchy. The proposed model contains seven constructs: cognitive
destination image as an index, two affective constructs, perceived quality, subjective
norms, perceived behavioural control, and intentions. The proposed model was
outlined in Figure 4.
Branding is an important strategy for an organisation as it allows differentiation for
competitors, a sustainable competitive advantage, and the ability to form
relationships with consumers through strong associations and perceptions. This
should be utilised for a destination as they, according to Aaker (1991), fulfil the
definition of a brand as being a distinguishable name and/ or symbol. The CBBE
hierarchy should be implemented to measure destination brand performance, rather
than financial measures, for two reasons: i) destinations are multidimensional
products; and ii) there are unknown influences which can affect consumers’ reason
for travel. These unknown influences, for example, can include sales promotions or
travel context.
Travel context has been discussed as an important consideration as the perception of
a destination can be affected by the consumers’ reason for travelling to a destination,
and ultimately the choice of destination. From a general discussion of TpB and
42
CBBE and more specifically, the implementation of the CBBE hierarchy into
destination literature, the following research question and research objectives are
proposed:
How should the consumer-based brand equity (CBBE) hierarchy be
developed to measure destination brand performance, and does brand
performance differ across different travel contexts?
1. To develop a model of consumer-based destination brand performance.
2. To identify any differences in destination image attributes relative to travel
context.
3. To identify if there is a difference in destination brand performance relative
to travel context.
4. To investigate the level of congruence between the destination brand identity
and destination brand image.
43
Chapter Three: Study One
3.0 Introduction
The purpose of this thesis is to identify the extent to which destination brand
performance differs across travel contexts. Study One reports an exploratory
investigation, combining an analysis of the literature, an analysis of organisational
documents and personal interviews with consumers. Three objectives, specific to this
first study, were used to guide the research:
i. To identify image attributes salient to consumers when evaluating
destinations.
ii. To identify any differences in image attributes identified across travel
contexts.
iii. To identify attributes destination marketing organisations use to
develop destination brand identity.
The purpose of this study was to develop an index, or composite measure, for
cognitive destination image. Cognitive phenomena are frequently investigated using
an index (Zikmund et al., 2011). That is, several attributes, when combined, create a
“more accurate cumulative measure” (Zikmund et al., 2011, p. 246) of a
multidimensional construct, and can be measured by assessing the importance, and
then strength of the belief that a product or object has of the attribute (Solomon et al.,
2010). This is based on multi-attribute utility theory, as outlined in Chapter Two
(Cracolici & Nijkamp, 2009).
While the development of a scale to measure destination image was the key outcome
of this study, the list of attributes was developed to assess destinations across travel
contexts. Therefore, the overall proposition of the first study is that similar attributes
will be used by consumers when evaluating a destination across different travel
contexts, however different levels of attribute importance will exist for consumers
across travel contexts.
44
In regard to the synthesisation of scales, the use of more than one technique is
recommended to increase the validity of the index (Cavana, Delahaye, & Sekaran,
2001), and likelihood of creating a complete list of items (Churchill, 1979; Echtner
& Ritchie, 1993). Previously, Echtner and Ritchie (1993) used a combination of
literature search and focus groups to identify attributes, while Goodrich (1977)
examined expert opinion, interviews with American Express travellers and previous
literature. This study used an analysis of the literature, document analysis and
personal interviews with consumers, to ensure: i) an adequate list of destination
image attributes was attained; ii) the identified attributes were suitable across travel
contexts; and iii) both the destination brand identity and destination brand image
were accounted for. The triangulation of these methods also ensured that a complete
and exhaustive list was identified, in line with multiple attribute decision making
(Yoon & Hwang, 1995). Triangulation of the results is outlined further in Section
3.4. This assisted in providing information for the second study of this research
project, to allow measurement of a model of destination brand performance across
travel contexts.
3.1 Content analysis of the literature
A content analysis of the literature was utilised as the first step in identifying salient
destination image attributes. Conducting a literature analysis was important to ensure
that attributes which had been previously tested were considered and compared with
those identified from personal interviews and the document analysis.
3.1.1 Method: Content analysis of the literature.
The analysis conducted examined a total of 318 publications that had studied
destination image. Pike’s (2002b, 2007a) studies were used as a basis for this study,
and included both conference papers and journal articles. These studies included
over 260 destination image publications from 1973 to 2007. However, a further
analysis of the literature was conducted on 87 journal articles from 2008 to March,
2011, resulting in over 1000 more attributes. This was conducted to ensure an
appropriate representation of the literature had been obtained, and to include any
new developments in the literature. The researcher used the Australian Business
Deans Council (ABDC) journal ratings list for tourism and hospitality as a basis for
45
the study (ABDC, 2010). Journal search engines from those listed were examined for
articles referring to destination image.
Destination image has also been researched under a variety of different terms,
including, destination attractiveness, destination perception, destination attributes, or
destination quality (Pike, 2007a). In other publications destination image has been
used as one construct within a larger study (Pike, 2007c; Tasci et al., 2007).
Therefore, a variety of previously used search terms were utilised to collect
destination image articles. Google Scholar was utilised to identify any articles that
did not appear from the search based on the ABDC tourism and hospitality list.
Attributes and scales identified were collated into a single list representing all
destination image attributes from the literature (Echtner & Ritchie, 1993). Attribute
relevance was assessed based on the frequency of occurrence within the literature
(Fishbein, 1963).
Some studies have used destination image scales from previous literature in their
entirety (Davis & Sternquist, 1987; Kale & Weir, 1986; Ritchie & Zins, 1978; Var,
Beck, & Loftus, 1977), while others have used a combination of previous studies
which are most relevant to the particular destination being studied (Beerli & Martin,
2004). By examining previous destination image studies, it is apparent that many of
the attributes identified are context specific to those destinations, times and segments
that were studied. For example, Gearing, Swart, and Var’s (1974) study examined
attributes when considering Turkey, which would not be directly transferrable to
near-home destinations to Brisbane, when considering attributes such as ancient
ruins.
Furthermore, when considering the concept of destination specific image scales,
Beerli and Martin (2004) proposed a framework of destination image attributes. This
framework resulted in 53 attributes, with subcategories and nine overall dimensions:
natural resources; general infrastructure; tourist infrastructure; tourist leisure and
recreation; culture, history and art; political and economic factors; natural
environment; social environment; and atmosphere of the place. The aim of Beerli
and Martin’s (2004) study was to enable researchers to select image attributes from
the categories identified based on the attractions of each destination under analysis,

46
the positioning of the destination, and the objectives of the perceived image. This not
only illustrates the number of attributes considered in previous literature, but the
concept that image can be very specific, depending on the destination being studied.
This emphasises that care needs to be taken in the identification and use of
appropriate attributes from previous studies to ensure one scale can be developed to
measure brand image, and performance, across multiple destinations and travel
contexts.
Therefore, the analysis of the literature was used to create a master list (Echtner &
Ritchie, 1993), and identify attribute categories which could be used to measure
destination image across destinations and travel contexts. Content analysis was
conducted on the attribute statements to identify attribute categories. The result of
the literature search is a list of attribute categories which are proposed to assess
destination image across destinations and travel contexts.
3.1.2 Results: Content analysis of the literature.
Articles from 2008 to 2011 were reviewed and tabulated, as outlined in Appendix 1.
Articles are presented in chronological order by year published and tabulated to
include: the number of destinations analysed; the number of independent variables
tested; the type of research conducted; the sample size; and the data analysis
conducted.
From the analysis, it is evident that Asian destinations and European destinations
were the focus of many studies, with 24 and 23 publications respectively. These
destinations were followed by North America (12), Australasia (12), Africa (7),
South America (3), Central America (2), the Arctic (1), and the Middle East (1). A
further three studies examined multiple destinations around the world. This is similar
to the studies represented within Pike’s (2007a) study. From the 87 studies, 67
measured one destination in isolation (77%). This is an increase from Pike’s (2002b,
2007a) previous studies, in which 75 from 142 (53%) and 54 from 89 (61%)
measured a destination in isolation. Table 3 summarises key findings from this study
and compares them to Pike’s (2002b, 2007a) studies.
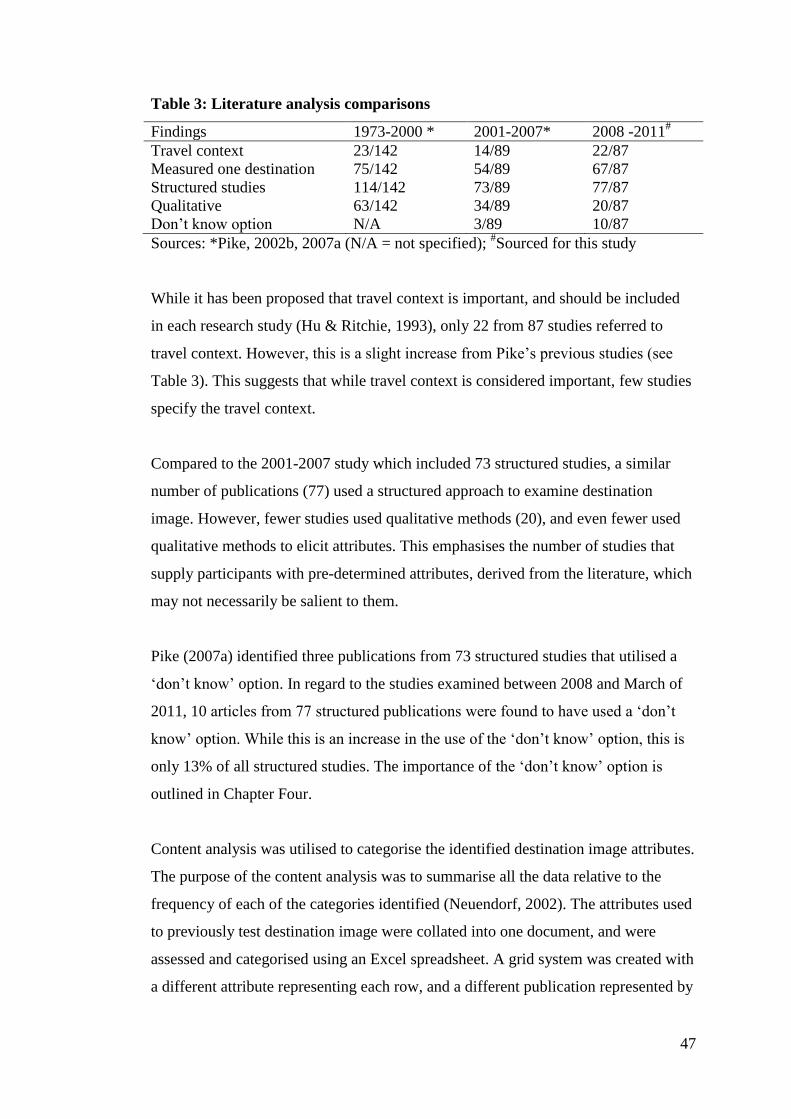
47
Table 3: Literature analysis comparisons
Findings 1973-2000 * 2001-2007* 2008 -2011#
Travel context 23/142 14/89 22/87
Measured one destination 75/142 54/89 67/87
Structured studies 114/142 73/89 77/87
Qualitative 63/142 34/89 20/87
Don’t know option N/A 3/89 10/87
Sources: *Pike, 2002b, 2007a (N/A = not specified); #Sourced for this study
While it has been proposed that travel context is important, and should be included
in each research study (Hu & Ritchie, 1993), only 22 from 87 studies referred to
travel context. However, this is a slight increase from Pike’s previous studies (see
Table 3). This suggests that while travel context is considered important, few studies
specify the travel context.
Compared to the 2001-2007 study which included 73 structured studies, a similar
number of publications (77) used a structured approach to examine destination
image. However, fewer studies used qualitative methods (20), and even fewer used
qualitative methods to elicit attributes. This emphasises the number of studies that
supply participants with pre-determined attributes, derived from the literature, which
may not necessarily be salient to them.
Pike (2007a) identified three publications from 73 structured studies that utilised a
‘don’t know’ option. In regard to the studies examined between 2008 and March of
2011, 10 articles from 77 structured publications were found to have used a ‘don’t
know’ option. While this is an increase in the use of the ‘don’t know’ option, this is
only 13% of all structured studies. The importance of the ‘don’t know’ option is
outlined in Chapter Four.
Content analysis was utilised to categorise the identified destination image attributes.
The purpose of the content analysis was to summarise all the data relative to the
frequency of each of the categories identified (Neuendorf, 2002). The attributes used
to previously test destination image were collated into one document, and were
assessed and categorised using an Excel spreadsheet. A grid system was created with
a different attribute representing each row, and a different publication represented by
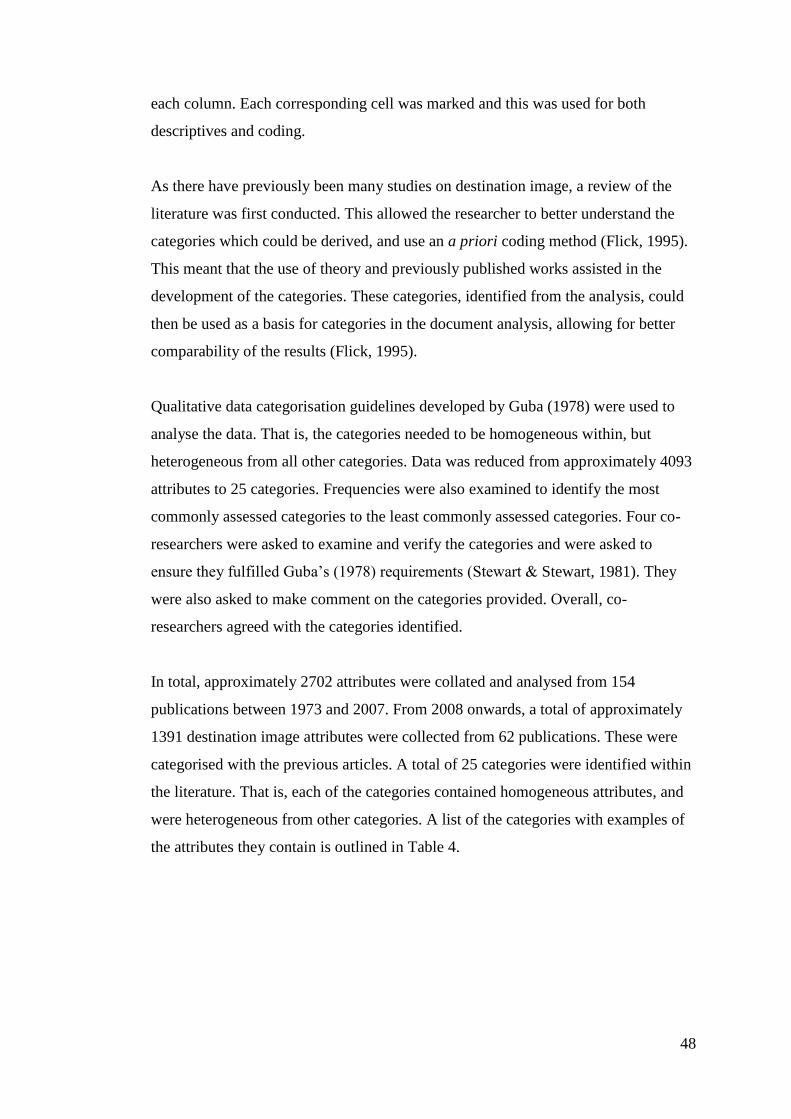
48
each column. Each corresponding cell was marked and this was used for both
descriptives and coding.
As there have previously been many studies on destination image, a review of the
literature was first conducted. This allowed the researcher to better understand the
categories which could be derived, and use an a priori coding method (Flick, 1995).
This meant that the use of theory and previously published works assisted in the
development of the categories. These categories, identified from the analysis, could
then be used as a basis for categories in the document analysis, allowing for better
comparability of the results (Flick, 1995).
Qualitative data categorisation guidelines developed by Guba (1978) were used to
analyse the data. That is, the categories needed to be homogeneous within, but
heterogeneous from all other categories. Data was reduced from approximately 4093
attributes to 25 categories. Frequencies were also examined to identify the most
commonly assessed categories to the least commonly assessed categories. Four co-
researchers were asked to examine and verify the categories and were asked to
ensure they fulfilled Guba’s (1978) requirements (Stewart & Stewart, 1981). They
were also asked to make comment on the categories provided. Overall, co-
researchers agreed with the categories identified.
In total, approximately 2702 attributes were collated and analysed from 154
publications between 1973 and 2007. From 2008 onwards, a total of approximately
1391 destination image attributes were collected from 62 publications. These were
categorised with the previous articles. A total of 25 categories were identified within
the literature. That is, each of the categories contained homogeneous attributes, and
were heterogeneous from other categories. A list of the categories with examples of
the attributes they contain is outlined in Table 4.
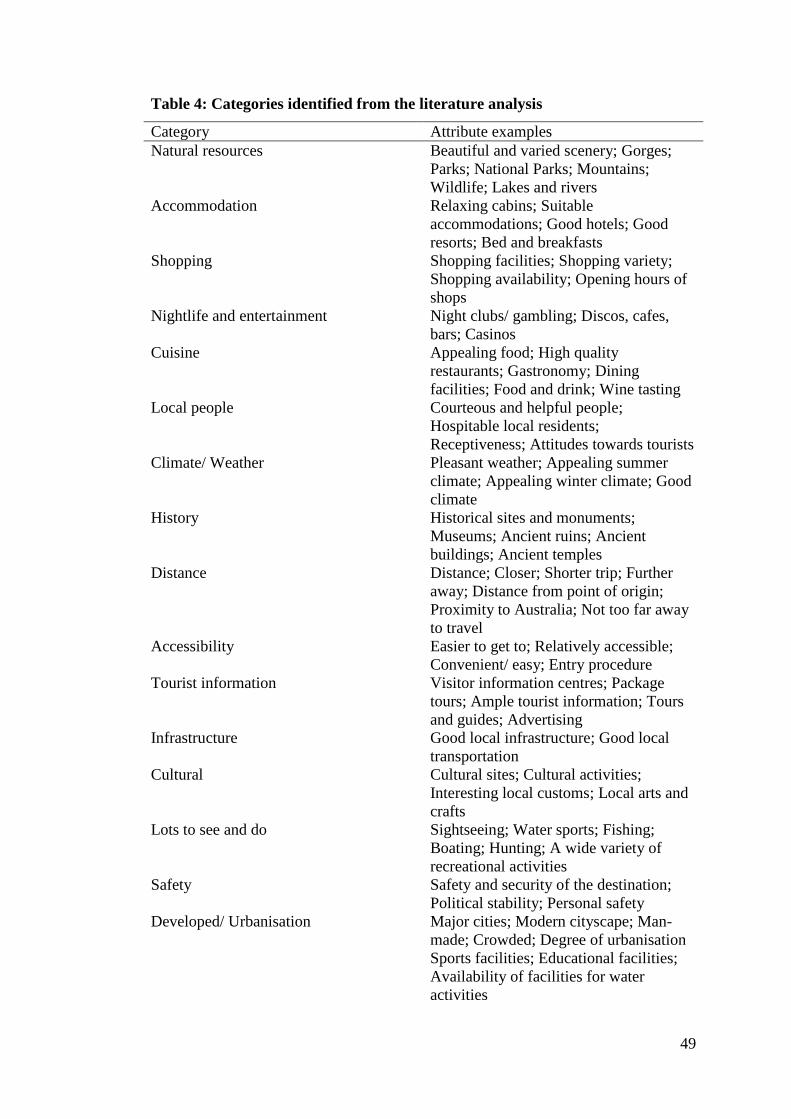
49
Table 4: Categories identified from the literature analysis
Category Attribute examples
Natural resources Beautiful and varied scenery; Gorges;
Parks; National Parks; Mountains;
Wildlife; Lakes and rivers
Accommodation Relaxing cabins; Suitable
accommodations; Good hotels; Good
resorts; Bed and breakfasts
Shopping Shopping facilities; Shopping variety;
Shopping availability; Opening hours of
shops
Nightlife and entertainment Night clubs/ gambling; Discos, cafes,
bars; Casinos
Cuisine Appealing food; High quality
restaurants; Gastronomy; Dining
facilities; Food and drink; Wine tasting
Local people Courteous and helpful people;
Hospitable local residents;
Receptiveness; Attitudes towards tourists
Climate/ Weather Pleasant weather; Appealing summer
climate; Appealing winter climate; Good
climate
History Historical sites and monuments;
Museums; Ancient ruins; Ancient
buildings; Ancient temples
Distance Distance; Closer; Shorter trip; Further
away; Distance from point of origin;
Proximity to Australia; Not too far away
to travel
Accessibility Easier to get to; Relatively accessible;
Convenient/ easy; Entry procedure
Tourist information Visitor information centres; Package
tours; Ample tourist information; Tours
and guides; Advertising
Infrastructure Good local infrastructure; Good local
transportation
Cultural Cultural sites; Cultural activities;
Interesting local customs; Local arts and
crafts
Lots to see and do Sightseeing; Water sports; Fishing;
Boating; Hunting; A wide variety of
recreational activities
Safety Safety and security of the destination;
Political stability; Personal safety
Developed/ Urbanisation Major cities; Modern cityscape; Man-
made; Crowded; Degree of urbanisation
Sports facilities; Educational facilities;
Availability of facilities for water
activities
50
Cleanliness Standards of hygiene and cleanliness;
Clean/ unpolluted; Sanitation
Tourist attractions Interesting tourist spots; Diversity of
attractions
Cost and value Currency exchange; Affordable place to
visit; Reasonable prices; Price levels;
Value for money
Beaches Beaches; Sea water suitable for bathing;
Seaside; Availability of sandy beach
areas
Popular/ well-known Prestigious place to be; Popular spot;
Well-known; The place to go; Fame/
reputation
Events Fairs; Festivals; Concerts; Special events
Atmosphere Family oriented; Atmosphere
Neighbouring destinations Accessibility to other neighbouring
countries; Convenient proximity;
Gateway to other countries
Conference resources* Quality of meeting facilities;
Sponsorship from CVB *Note: ‘Conference resources’ removed from final list of attributes.
‘Conferences resources’ was identified within the literature as a category to consider
in regard to destination image. However, this referred to the conference travel
context, and as this study examined leisure contexts, ‘conference resources’ was not
used on the final list of attributes. The categories identified were used as a basis for
undertaking analysis of organisation documents and websites.
3.2 Document analysis
As outlined in Chapter Two, there are three components to a brand: i) brand identity;
ii) brand positioning; and iii) brand image. The brand identity is the desired image,
while the brand positioning is the way this is communicated. Brand image represents
the actual perceptions held by consumers, which are developed by ‘organic’ means
as well as through ‘induced’ efforts of marketers (Aaker, 1996; Etzel et al., 2000;
Lamb et al., 2001). The purpose of the document analysis was to understand what
attributes destination marketing organisations (DMOs) focused on when creating
marketing communications about brand identity.
Content analysis has previously been utilised to identify attributes, including
promotional material, including guidebooks (Ferrario, 1979) and brochures
51
(Bramwell & Rawding, 1996; Crompton, 1979), and even strategy and committee
papers (Bramwell & Rawding, 1996). The aim of these studies was to better
understand the attributes of a destination which could be used in two ways: i) to
better understand the identity and image of a destination, or ii) to utilise the attributes
in further research. The purpose of examining the attributes identified in these
documents was to triangulate the identified attributes with the content analysis of the
literature and personal interviews with consumers (see Section 3.3). By assessing
organisational communication it was possible to attain attributes that are used as part
of the DMO brand identity, and furthermore, the destination image.
3.2.1 Sampling: Document analysis.
The unit of analysis was those websites and destination management plans of DMOs
near Brisbane. As the sample was selected based on its characteristics, and the
likelihood the destination would be most thought of by consumers (Pike, 2007c), this
resulted in the use of judgment sampling (Malhotra, Hall, Shaw, & Oppenheim,
2006; Zikmund & Babin, 2007). Documents and websites examined were:
Sunshine Coast – Destination management plan (Tourism Queensland,
2010a).
Gold Coast – Destination management plan (Tourism Queensland, 2010b).
Bundaberg – Fraser Coast –– Destination management plan (Tourism
Queensland, 2010c).
Western Downs – Destination management plan (Tourism Queensland.
2010d).
Brisbane Regional Tourism Investment and Infrastructure Plan (Moreton Bay
Islands) (Tourism Queensland, 2010e).
Central Queensland – Destination management plan (Tourism Queensland,
2010f).
South East Queensland Country – Destination management plan (Tourism
Queensland, 2010g).
Northern New South Wales – promotional planner (Tourism New South
Wales, 2010a).
Northern New South Wales – website (Tourism New South Wales, 2010b).
Moreton Bay Islands – website (Brisbane Marketing, 2010).
Capricorn Coast – website (Capricorn Tourism & Economic Development,
2010).
Sunshine Coast – website (Sunshine Coast Destination Limited, 2010).
Darling Downs – website (Toowoomba & Darling Downs, 2010).
Gold Coast – website (Gold Coast Tourism, 2010).
Fraser Coast – website (Tourism Fraser Coast, 2010).
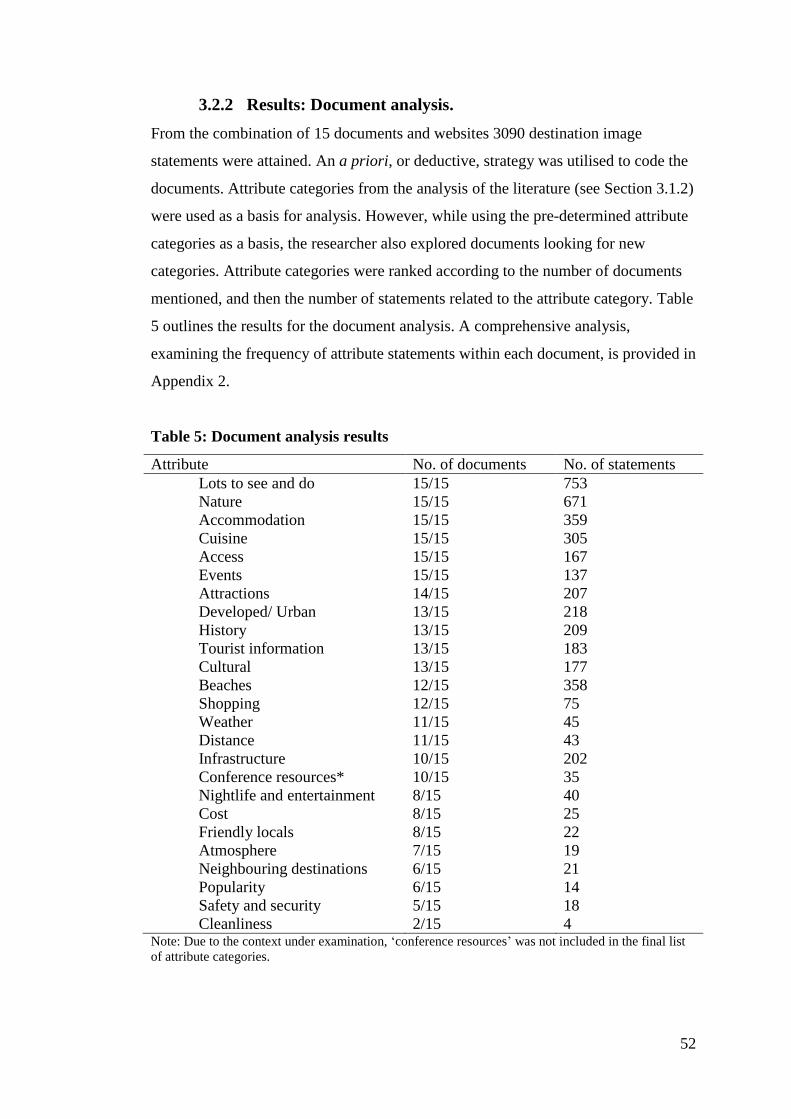
52
3.2.2 Results: Document analysis.
From the combination of 15 documents and websites 3090 destination image
statements were attained. An a priori, or deductive, strategy was utilised to code the
documents. Attribute categories from the analysis of the literature (see Section 3.1.2)
were used as a basis for analysis. However, while using the pre-determined attribute
categories as a basis, the researcher also explored documents looking for new
categories. Attribute categories were ranked according to the number of documents
mentioned, and then the number of statements related to the attribute category. Table
5 outlines the results for the document analysis. A comprehensive analysis,
examining the frequency of attribute statements within each document, is provided in
Appendix 2.
Table 5: Document analysis results
Attribute No. of documents No. of statements
Lots to see and do 15/15 753
Nature 15/15 671
Accommodation 15/15 359
Cuisine 15/15 305
Access 15/15 167
Events 15/15 137
Attractions 14/15 207
Developed/ Urban 13/15 218
History 13/15 209
Tourist information 13/15 183
Cultural 13/15 177
Beaches 12/15 358
Shopping 12/15 75
Weather 11/15 45
Distance 11/15 43
Infrastructure 10/15 202
Conference resources* 10/15 35
Nightlife and entertainment 8/15 40
Cost 8/15 25
Friendly locals 8/15 22
Atmosphere 7/15 19
Neighbouring destinations 6/15 21
Popularity 6/15 14
Safety and security 5/15 18
Cleanliness 2/15 4 Note: Due to the context under examination, ‘conference resources’ was not included in the final list
of attribute categories.
53
Attributes identified fit into the pre-determined themes from the literature. All
documents mentioned ‘lots to see and do’, ‘nature’, ‘accommodation’, ‘cuisine’,
‘access’ and ‘events’. However, ‘cleanliness’ was only mentioned in two of the 15
documents. Practical implications of the document analysis are outlined in Chapter
Five.
There were five themes which appeared in the document analysis, but did not appear
within the personal interview findings: ‘events’, ‘infrastructure’, ‘safety’,
‘cleanliness’ and ‘conference resources’ (see Section 3.3). The category ‘conference
resources’ was removed as the current study examined leisure holidays.
The overall purpose of the document analysis for Study One, was to identify those
attribute categories used by DMOs to develop and position the destination they are
responsible for. Furthermore, the document analysis allowed triangulation with the
results from the content analysis of the literature (see Section 3.1) and personal
interviews with consumers (see Section 3.3).
3.3 Personal interviews with consumers
Personal interviews were conducted with consumers to elicit attributes in the target
consumer language, and to identify any differences between travel contexts.
Elicitation of destination image attributes has been conducted to gain further insight
into the way consumers perceive and evaluate destinations, using a variety of
techniques. These elicitation methods include free elicitation (Reilly, 1990), focus
groups (Echtner & Ritchie, 1993; Milman & Pizam, 1995), in-depth interviews
(Goodrich, 1977; Kim, Crompton, & Botha, 2000), and the Repertory Test and
Repertory Grid interviews (Pearce, 1982). Each of these techniques and their
assessment of salient destination image attributes will be discussed in more depth.
Free elicitation is used as a method to obtain open responses from a participant in
regard to a destination, based on how well they know it. From this method,
adjectives are collected, much like word association (Reilly, 1990). Word association
has been used in marketing research since Dichter (1964) utilised the method in
regard to motivational research (Reilly, 1990). This method is advantageous, as it
54
can be used in different ways. That is, salient attributes can be attained from
consumers either by mail, telephone or interviews. It also allows the researcher to
understand if there is a lack of image in the mind of the consumer, with the
elicitation of less attributes. However, all associations are in isolation, and not
relative to other destinations. For example, if asked to provide a word associated
with a short-break holiday to the Gold Coast, a participant may say ‘beaches’.
However, this is specific to the word association, or destination, under investigation.
The purpose of this study was to identify scales which could be used across
destinations, and furthermore, across travel contexts through comparison. Thus, free
elicitation is considered more useful for image assessment of one destination in
isolation, which was not the purpose of this study.
Focus groups have previously been utilised in the destination image literature to
identify salient destination image attributes (Echtner & Ritchie, 1993; Milman &
Pizam, 1995). Focus groups have been used to identify attributes from people who
have visited a destination and those who have not (Milman & Pizam, 1995). As the
aim of focus groups is to attain new insights from free-flowing group discussions
(Malhotra et al., 2006) it enables a large amount of data to be obtained in regard to
destination image. The unstructured nature of focus groups results in difficulty
coding, analysing and interpreting data (Malhotra et al., 2006). Additionally, focus
groups are not only expensive, but require a significant amount of time to conduct
(Malhotra et al., 2006). The data is not structured, and difficulties exist in data
analysis when attempting to evaluate a variety of objects.
In-depth interviews, like focus groups, are an unstructured and free-flowing way to
attain attributes from consumers. However, they are conducted in a one-on-one
situation (Malhotra et al., 2006). Interviews have previously been utilised to identify
destination image attributes which are both relevant and important to consumers
(Goodrich, 1977). However, disadvantages are similar to focus groups, in that they
are expensive to conduct and also require a significant amount of time to both
perform and analyse the data (Malhotra et al., 2006). However, the purpose of this
study was to identify a scale which could be used across destinations. This could
result in difficulty coding through a large amount of data, especially when compared
to methods such as the Repertory Test, or Repertory Grid interviews. Furthermore,
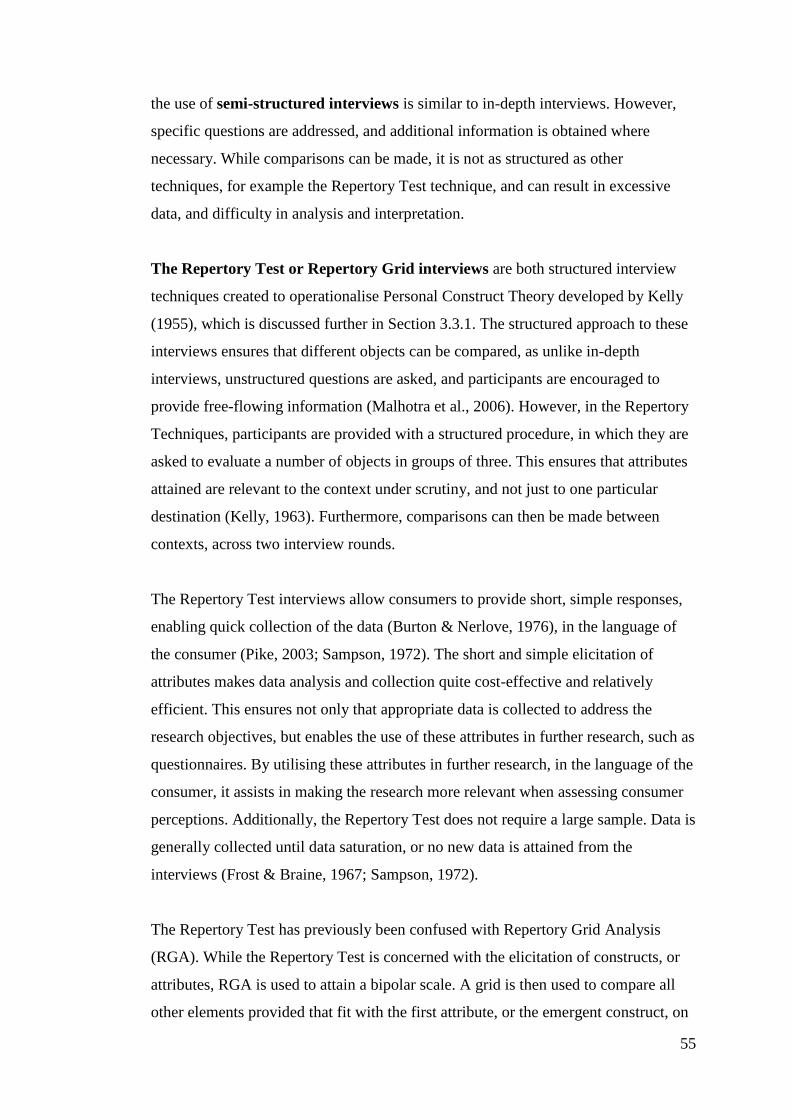
55
the use of semi-structured interviews is similar to in-depth interviews. However,
specific questions are addressed, and additional information is obtained where
necessary. While comparisons can be made, it is not as structured as other
techniques, for example the Repertory Test technique, and can result in excessive
data, and difficulty in analysis and interpretation.
The Repertory Test or Repertory Grid interviews are both structured interview
techniques created to operationalise Personal Construct Theory developed by Kelly
(1955), which is discussed further in Section 3.3.1. The structured approach to these
interviews ensures that different objects can be compared, as unlike in-depth
interviews, unstructured questions are asked, and participants are encouraged to
provide free-flowing information (Malhotra et al., 2006). However, in the Repertory
Techniques, participants are provided with a structured procedure, in which they are
asked to evaluate a number of objects in groups of three. This ensures that attributes
attained are relevant to the context under scrutiny, and not just to one particular
destination (Kelly, 1963). Furthermore, comparisons can then be made between
contexts, across two interview rounds.
The Repertory Test interviews allow consumers to provide short, simple responses,
enabling quick collection of the data (Burton & Nerlove, 1976), in the language of
the consumer (Pike, 2003; Sampson, 1972). The short and simple elicitation of
attributes makes data analysis and collection quite cost-effective and relatively
efficient. This ensures not only that appropriate data is collected to address the
research objectives, but enables the use of these attributes in further research, such as
questionnaires. By utilising these attributes in further research, in the language of the
consumer, it assists in making the research more relevant when assessing consumer
perceptions. Additionally, the Repertory Test does not require a large sample. Data is
generally collected until data saturation, or no new data is attained from the
interviews (Frost & Braine, 1967; Sampson, 1972).
The Repertory Test has previously been confused with Repertory Grid Analysis
(RGA). While the Repertory Test is concerned with the elicitation of constructs, or
attributes, RGA is used to attain a bipolar scale. A grid is then used to compare all
other elements provided that fit with the first attribute, or the emergent construct, on
56
a sorting grid. For example if a respondent were to say that two people are alike and
thereby different from the third because they are ‘kind’, and the other person is
‘mean’, they would be required to select all the people in the provided list of people,
or elements on the sorting grid, who are ‘kind’. However, the purpose of this study
was to identify salient attributes people use to evaluate and select destinations.
Therefore the Repertory Test technique was selected as the most appropriate
technique to elicit salient attributes, or constructs, as it is a structured, theoretically
based and cost-effective method which provides attributes in the language of
consumers. Constructs, are defined as the “way in which some things are construed
as being alike and yet different from others” (Kelly, 1963, p. 105). In this case, the
elicited constructs relate to those attributes that consumers use to evaluate a
destination’s image relative to competitors.
3.3.1 Method: Repertory Test technique.
The Repertory Test is a qualitative technique underpinned by Kelly’s (1955)
personal construct theory (PCT). The Repertory Test technique was originally
developed by Kelly (1955) to operationalise PCT. The basic postulate of PCT is
defined by Kelly (1963, p. 46) as the way “a person’s processes are psychologically
channelized by the ways in which he anticipates events”.
In other words, each person imposes their own constructs, or structure, on the world
(Levy & Dugan, 1956). This concept treats every person as a scientist, where they
attempt to predict future events using this structure, and validate the outcome (Kelly,
1955). Repertory Test was developed to operationalise PCT using 11 assumptions or
corollaries. Each of Kelly’s corollaries impacts the constructs, or attributes, elicited
(Fransella, Bell, & Bannister, 2004; Kelly, 1955). A summary of all corollaries and
their effects on personal constructs, including a discussion of their implications in
terms of tourism, are outlined in Appendix 3. The two most pertinent corollaries, the
individuality corollary and the commonality corollary, are outlined further.
The individuality corollary is defined as the concept that “persons differ from each
other in their constructions of events” (Kelly, 1963, p. 103). Therefore, when
57
considering two people who are in what appears to be the same situation, the
individuality corollary emphasises they are in fact not. That is, people view and
make sense of the world through their own lens. Each lens is different, and while
there may be similarities, no two people will construe an event in exactly the same
way (Bannister & Fransella, 1986).
The commonality corollary is defined as “the extent that one person employs a
construction of experience which is similar to that employed by another, [meaning
their] psychological processes are similar to those of the other person” (Kelly, 1963,
p. 104). That is, people are not similar because they experience similar events, or
because they have similar behavioural patterns, but because they view events in
similar ways (Bannister & Fransella, 1986). This corollary is a complement to the
individuality corollary, in that people do not construe events in exactly the same
way, but in similar ways, leading to commonalities between those that do. This
emphasises the use of an inductive approach to analyse data, outlined in Chapter
Four. Furthermore the use of these corollaries for Study One, had implications
relative to the second study, and is outlined further in Section 3.4.1.
Originally, Kelly (1955) developed the Repertory Test, previously called the Role
Construct Repertory Test, to understand interpersonal relationships. This provided a
list of constructs which could be used to identify the way people individually assess
their interpersonal relationships. The Repertory Test is conducted by providing
consumers with a list of elements in triads, and eliciting constructs, by assessing on
what aspect two of the elements are similar and thereby different from a third.
Elements are defined by Kelly (1963, p. 137) as the “things or events which are
abstracted” by a person’s use of a construct. That is, elements should be sufficiently
representative to the respondent in regard to the context at hand. For this study,
elements were destinations, which were used to elicit attributes consumers use to
evaluate destinations when considering travel. An assumption of The Repertory Test
is that the constructs elicited will be permeable, that is that the construct is still open
to the addition of other elements from that context.
58
3.3.2 Sampling: Personal interviews with consumers.
The aim of this study was to develop a synthesised destination image scale, and
identify any differences across travel contexts. To identify any differences across
travel contexts, a specific target population was defined. Previously, differences have
been found in RGA for different age groups based on the number of elements
elicited when considering interest in a museum (Caldwell & Coshall, 2002). To
ensure age had less influence than the overall travel context, one age group was
chosen. The target population under scrutiny was consumers from Generation Y.
To date, Generation Y has received little attention in the tourism marketing
literature. Furthermore, Generation Y was chosen as they are considered to be the
most independent decision makers, given that they have been raised within the
premise of choice, and have increased access to a variety of information (Alch, 2000;
Stevens et al., 2005). Additionally, it has been suggested that Generation Y
consumers have the potential to become lifetime customers (Wolburg &
Pokrywczynski, 2001) and will have the greatest spending potential of all the
generations (Brand, 2000). Generation Y, or the millennial generation, has been
defined by various dates. For the purposes of this study, Generation Y was defined
as those born between 1982 (Pendergast, 2008) and 1994 (Broadbridge, Maxwell, &
Ogden, 2007; Sheahan, 2005; Weiler, 2005). However, only those over the age of 18
were interviewed. To ensure that participants were aware of the destinations under
scrutiny, destinations near Brisbane were chosen. As two different travel contexts
were tested, destinations remained consistent across interviews to allow better
analysis of the results. Therefore Brisbane residents from Generation Y were chosen
as the sample.
The sampling frame consisted of students from both an undergraduate and a
postgraduate level, studying market research. Emails were sent to students through
official university subject websites offering them the opportunity to partake in the
research. Attached to the emails was both the participant information sheet and
consent form (Appendices 4 and 5). To ensure that the participants had not just
relocated to Brisbane they were required to have resided in Brisbane for at least 12
59
months. They were also required to have been away on holiday within the previous
12 months, or considering travelling in the upcoming 12 months.
A snowball sample was utilised to ensure that consumers who were both university
students and currently in the workforce were sampled. Participants were asked to
provide the name of someone they knew who would be willing to participate in the
interview, who was currently not attending university, and fit the criteria outlined
previously. This was to ensure that there was an adequate mix of university students
and people from the workforce, as a mix of the two would be tested in Study Two.
Interviews were conducted until data saturation.
Once interviews were accepted, they were conducted either in interview rooms at the
university, or at a mutually agreed upon location. Participants were offered a $20
entertainment voucher from JB Hi-Fi, a national entertainment retailer, as an
incentive to participate in the research.
During the interviews, constructs were collected and recorded on a sheet, which
adhered to laddering protocols. Laddering is outlined in Section 3.3.4. Participants
were required at the end of the interview to fill in a short demographic information
sheet, which is outlined in Appendix 6. This was to better report the characteristics
of the sample and ensure an adequate representation of, for example, males versus
females and students versus workers.
All information about participants and their responses to the Repertory Test was de-
identified to ensure that confidentiality and privacy of each participant was upheld.
Interviews were also audio-recorded with the prior permission of respondents to
ensure that if required the interview could be checked. Participants were informed
that the data would be identifiable to the interviewer only.
60
As the travel context was being examined, in regard to identifying differences of
destination image evaluation, two different travel contexts were under scrutiny.
These two travel contexts were:
Short-break holiday by car (one to five nights)
Longer holiday by car (one week or more)
Short-breaks have been previously defined as trips to a destination within driving
distance that last for a period of one to five days (Pike, 2006). However, others
suggest a short-break holiday is one to three days, with a long holiday beginning at
four days (Potier & Cockerell, 1995). For this thesis, a short-break holiday is defined
as being one to five nights. It is acknowledged to be one of the most competitive
tourism markets as there are many destinations within a short distance from one’s
home which are easy enough to get to (Pike, 2006). A longer holiday will be defined
as one week or more. These holidays tend to occur less frequently than short-break
holidays, and as such there are different motivators for taking a longer holiday, such
as to escape and unwind versus family time and rest for a short-break holiday
(Tourism Queensland, 2010b).
The Repertory Test interviews were conducted until data saturation was reached,
which is until no new information was discovered by the interviews. Saturation
generally occurs at approximately 10 interviews (Pearce, 1982). It was expected that
there would be approximately 10 interviews per travel context. Participants were
randomly assigned to each travel context interview.
3.3.3 Data collection: Personal interviews with consumers.
Elements are defined by Kelly (1963, p. 137) as the “things or events which are
abstracted” by a person’s use of a construct. As elements used to elicit constructs
need to be representative of those which a consumer would select when taking a
holiday by car, elements were selected based on those places, or regions, which were
most thought of for Brisbane residents (Pike, 2007c). A pilot study of six consumers
was conducted to identify any concerns in regard to the technique, such as, problems
regarding lack of awareness of destinations provided. While consumers were
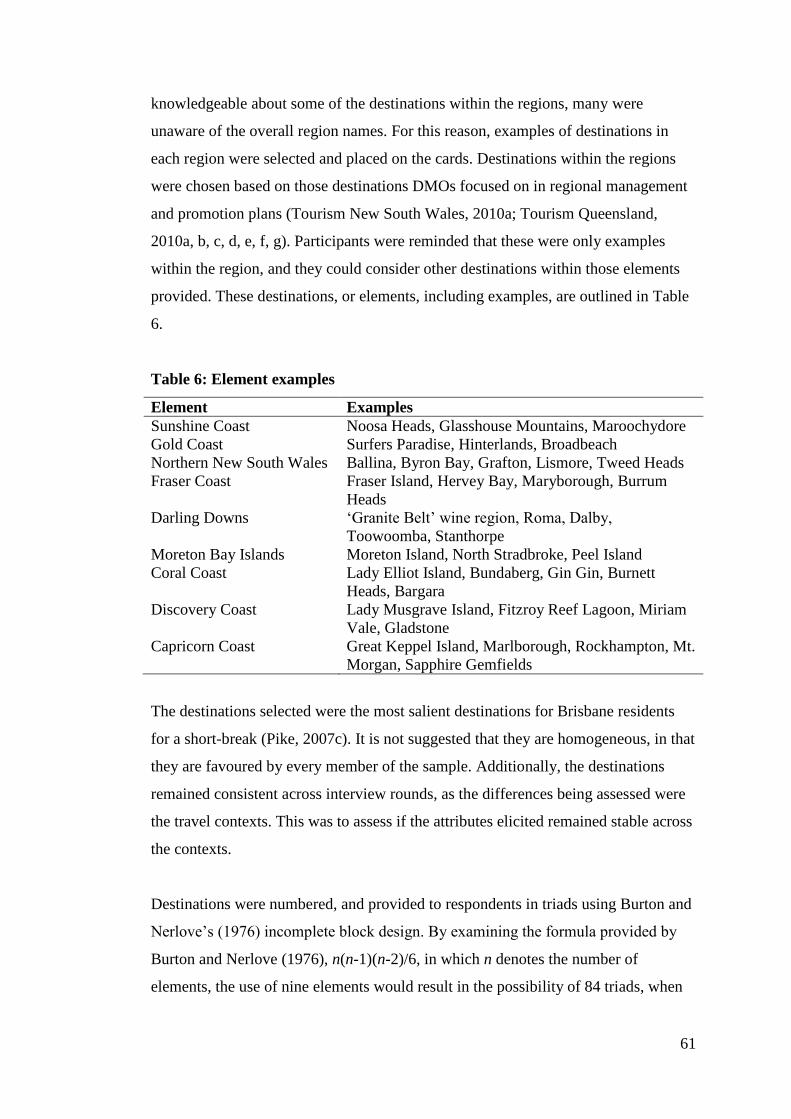
61
knowledgeable about some of the destinations within the regions, many were
unaware of the overall region names. For this reason, examples of destinations in
each region were selected and placed on the cards. Destinations within the regions
were chosen based on those destinations DMOs focused on in regional management
and promotion plans (Tourism New South Wales, 2010a; Tourism Queensland,
2010a, b, c, d, e, f, g). Participants were reminded that these were only examples
within the region, and they could consider other destinations within those elements
provided. These destinations, or elements, including examples, are outlined in Table
6.
Table 6: Element examples
Element Examples
Sunshine Coast Noosa Heads, Glasshouse Mountains, Maroochydore
Gold Coast Surfers Paradise, Hinterlands, Broadbeach
Northern New South Wales Ballina, Byron Bay, Grafton, Lismore, Tweed Heads
Fraser Coast Fraser Island, Hervey Bay, Maryborough, Burrum
Heads
Darling Downs ‘Granite Belt’ wine region, Roma, Dalby,
Toowoomba, Stanthorpe
Moreton Bay Islands Moreton Island, North Stradbroke, Peel Island
Coral Coast Lady Elliot Island, Bundaberg, Gin Gin, Burnett
Heads, Bargara
Discovery Coast Lady Musgrave Island, Fitzroy Reef Lagoon, Miriam
Vale, Gladstone
Capricorn Coast Great Keppel Island, Marlborough, Rockhampton, Mt.
Morgan, Sapphire Gemfields
The destinations selected were the most salient destinations for Brisbane residents
for a short-break (Pike, 2007c). It is not suggested that they are homogeneous, in that
they are favoured by every member of the sample. Additionally, the destinations
remained consistent across interview rounds, as the differences being assessed were
the travel contexts. This was to assess if the attributes elicited remained stable across
the contexts.
Destinations were numbered, and provided to respondents in triads using Burton and
Nerlove’s (1976) incomplete block design. By examining the formula provided by
Burton and Nerlove (1976), n(n-1)(n-2)/6, in which n denotes the number of
elements, the use of nine elements would result in the possibility of 84 triads, when
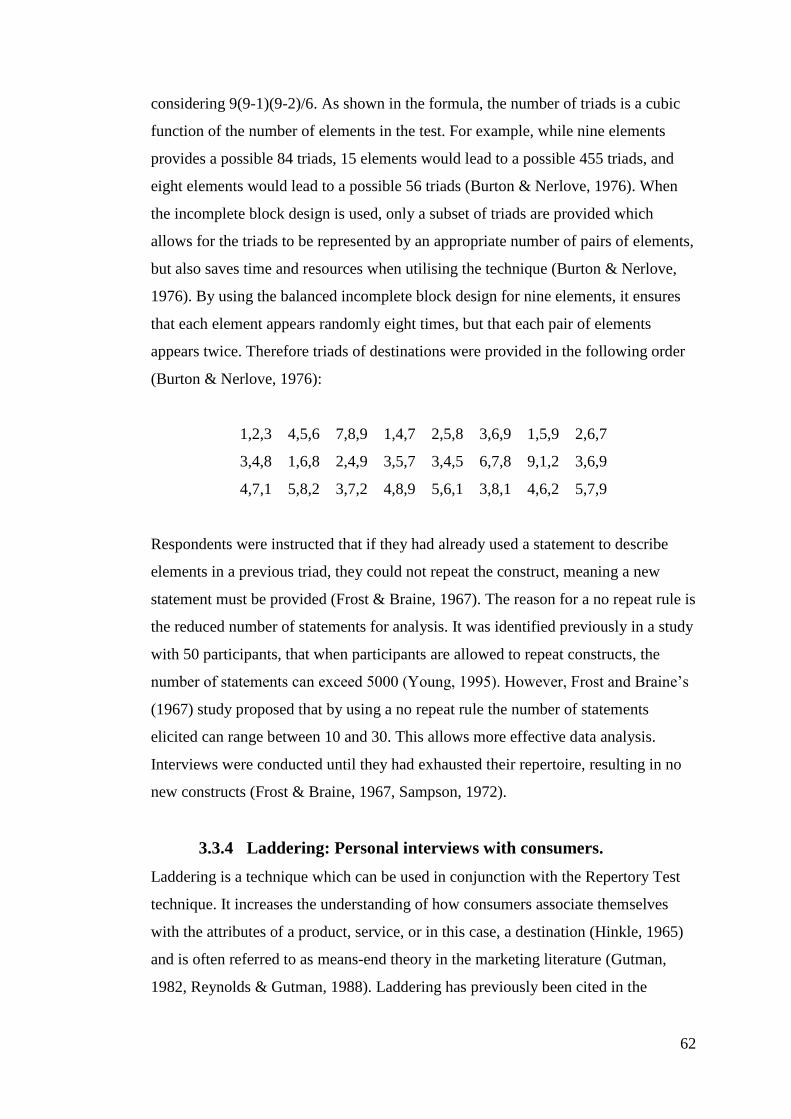
62
considering 9(9-1)(9-2)/6. As shown in the formula, the number of triads is a cubic
function of the number of elements in the test. For example, while nine elements
provides a possible 84 triads, 15 elements would lead to a possible 455 triads, and
eight elements would lead to a possible 56 triads (Burton & Nerlove, 1976). When
the incomplete block design is used, only a subset of triads are provided which
allows for the triads to be represented by an appropriate number of pairs of elements,
but also saves time and resources when utilising the technique (Burton & Nerlove,
1976). By using the balanced incomplete block design for nine elements, it ensures
that each element appears randomly eight times, but that each pair of elements
appears twice. Therefore triads of destinations were provided in the following order
(Burton & Nerlove, 1976):
1,2,3 4,5,6 7,8,9 1,4,7 2,5,8 3,6,9 1,5,9 2,6,7
3,4,8 1,6,8 2,4,9 3,5,7 3,4,5 6,7,8 9,1,2 3,6,9
4,7,1 5,8,2 3,7,2 4,8,9 5,6,1 3,8,1 4,6,2 5,7,9
Respondents were instructed that if they had already used a statement to describe
elements in a previous triad, they could not repeat the construct, meaning a new
statement must be provided (Frost & Braine, 1967). The reason for a no repeat rule is
the reduced number of statements for analysis. It was identified previously in a study
with 50 participants, that when participants are allowed to repeat constructs, the
number of statements can exceed 5000 (Young, 1995). However, Frost and Braine’s
(1967) study proposed that by using a no repeat rule the number of statements
elicited can range between 10 and 30. This allows more effective data analysis.
Interviews were conducted until they had exhausted their repertoire, resulting in no
new constructs (Frost & Braine, 1967, Sampson, 1972).
3.3.4 Laddering: Personal interviews with consumers.
Laddering is a technique which can be used in conjunction with the Repertory Test
technique. It increases the understanding of how consumers associate themselves
with the attributes of a product, service, or in this case, a destination (Hinkle, 1965)
and is often referred to as means-end theory in the marketing literature (Gutman,
1982, Reynolds & Gutman, 1988). Laddering has previously been cited in the
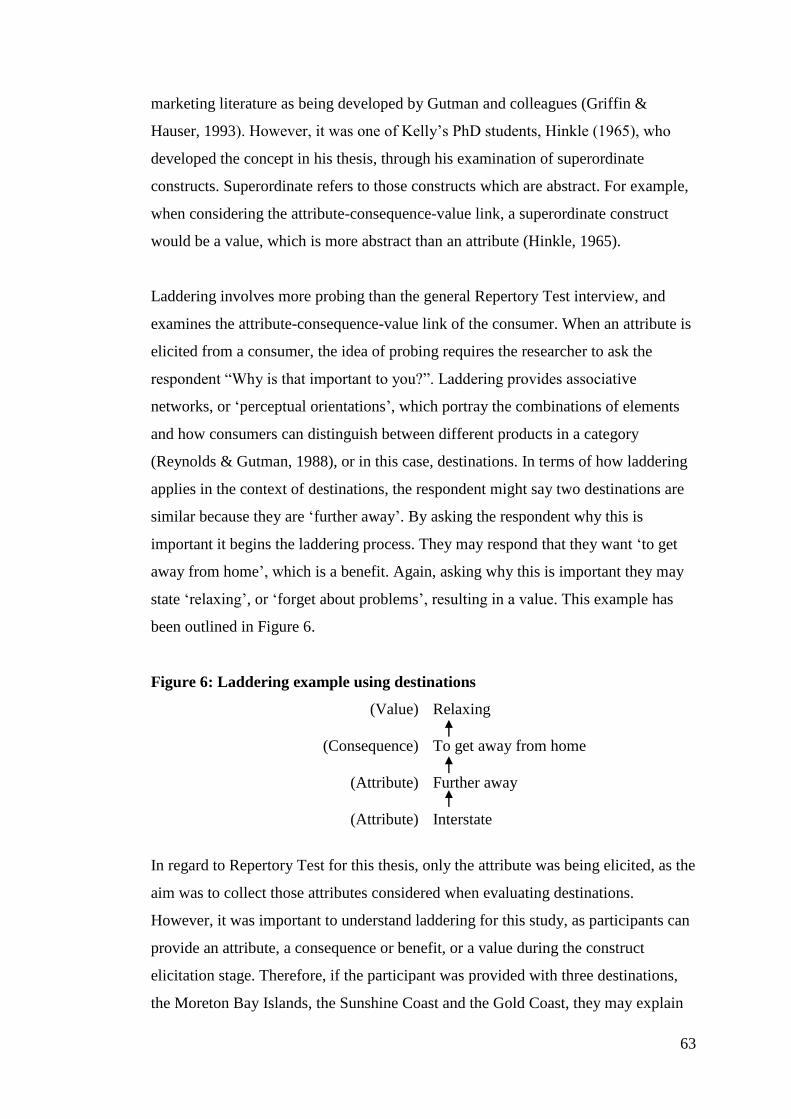
63
marketing literature as being developed by Gutman and colleagues (Griffin &
Hauser, 1993). However, it was one of Kelly’s PhD students, Hinkle (1965), who
developed the concept in his thesis, through his examination of superordinate
constructs. Superordinate refers to those constructs which are abstract. For example,
when considering the attribute-consequence-value link, a superordinate construct
would be a value, which is more abstract than an attribute (Hinkle, 1965).
Laddering involves more probing than the general Repertory Test interview, and
examines the attribute-consequence-value link of the consumer. When an attribute is
elicited from a consumer, the idea of probing requires the researcher to ask the
respondent “Why is that important to you?”. Laddering provides associative
networks, or ‘perceptual orientations’, which portray the combinations of elements
and how consumers can distinguish between different products in a category
(Reynolds & Gutman, 1988), or in this case, destinations. In terms of how laddering
applies in the context of destinations, the respondent might say two destinations are
similar because they are ‘further away’. By asking the respondent why this is
important it begins the laddering process. They may respond that they want ‘to get
away from home’, which is a benefit. Again, asking why this is important they may
state ‘relaxing’, or ‘forget about problems’, resulting in a value. This example has
been outlined in Figure 6.
Figure 6: Laddering example using destinations
(Value) Relaxing
(Consequence) To get away from home
(Attribute) Further away
(Attribute) Interstate
In regard to Repertory Test for this thesis, only the attribute was being elicited, as the
aim was to collect those attributes considered when evaluating destinations.
However, it was important to understand laddering for this study, as participants can
provide an attribute, a consequence or benefit, or a value during the construct
elicitation stage. Therefore, if the participant was provided with three destinations,
the Moreton Bay Islands, the Sunshine Coast and the Gold Coast, they may explain
64
that the Moreton Bay Islands and the Sunshine Coast are similar and thereby
different from the Gold Coast. This could be because those two destinations allow
them to unwind, which is a value. In this case laddering would need to be conducted
in the opposite way to that displayed in Figure 6, to ensure that the attribute was
attained and not a benefit, consequence or value. This can be conducted, for
example, by asking “What makes these destinations relaxing?”.
3.3.5 Results: Personal interviews with consumers.
Repertory test interviews were utilised to identify salient attributes when considering
both short-break holidays and longer holidays. This section will outline the results of
the interview round for each travel context separately. A comparison of the findings
of each will then be discussed.
3.3.5.1 Sample characteristics – Short-break.
To participate in the research, participants were required to be from Generation Y
and reside in the Brisbane area. Table 7 outlines the participants’ demographic
information, including gender, age bracket, recent holiday experience, education
attained, current employment and marital status. To ensure confidentiality,
participant information was de-identified, and only re-identifiable by the interviewer.
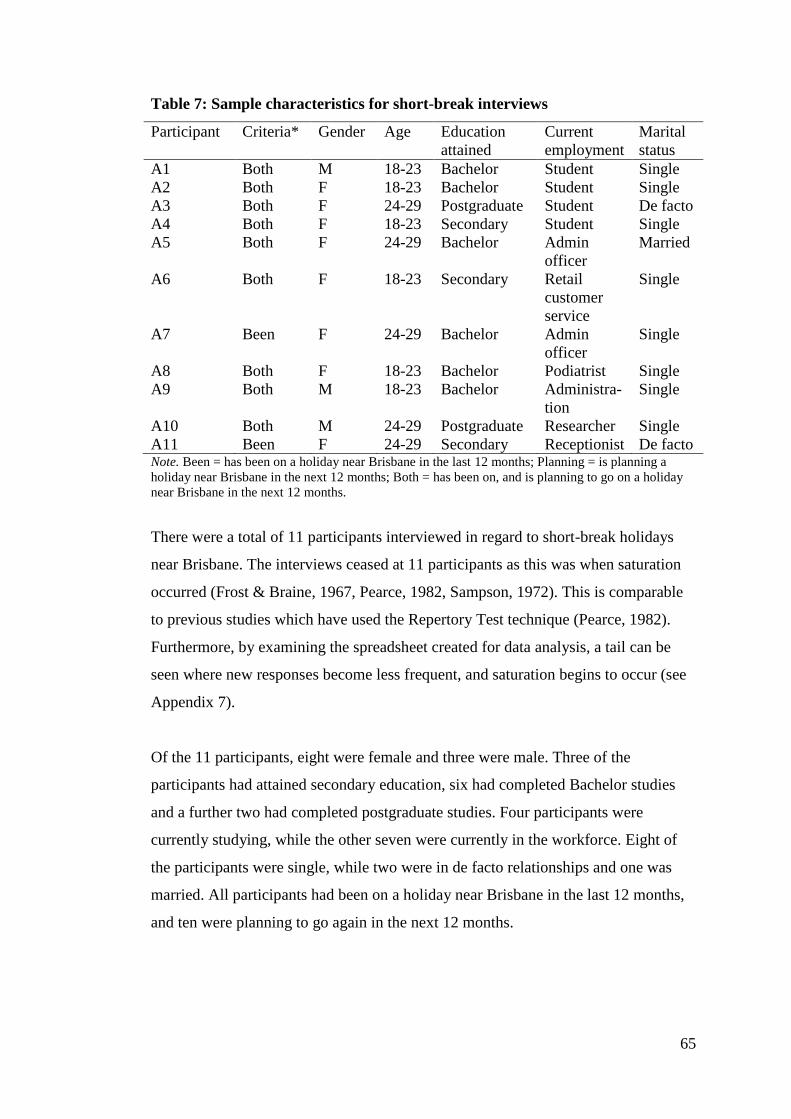
65
Table 7: Sample characteristics for short-break interviews
Participant Criteria* Gender Age Education
attained
Current
employment
Marital
status
A1 Both M 18-23 Bachelor Student Single
A2 Both F 18-23 Bachelor Student Single
A3 Both F 24-29 Postgraduate Student De facto
A4 Both F 18-23 Secondary Student Single
A5 Both F 24-29 Bachelor Admin
officer
Married
A6 Both F 18-23 Secondary Retail
customer
service
Single
A7 Been F 24-29 Bachelor Admin
officer
Single
A8 Both F 18-23 Bachelor Podiatrist Single
A9 Both M 18-23 Bachelor Administra-
tion
Single
A10 Both M 24-29 Postgraduate Researcher Single
A11 Been F 24-29 Secondary Receptionist De facto Note. Been = has been on a holiday near Brisbane in the last 12 months; Planning = is planning a
holiday near Brisbane in the next 12 months; Both = has been on, and is planning to go on a holiday
near Brisbane in the next 12 months.
There were a total of 11 participants interviewed in regard to short-break holidays
near Brisbane. The interviews ceased at 11 participants as this was when saturation
occurred (Frost & Braine, 1967, Pearce, 1982, Sampson, 1972). This is comparable
to previous studies which have used the Repertory Test technique (Pearce, 1982).
Furthermore, by examining the spreadsheet created for data analysis, a tail can be
seen where new responses become less frequent, and saturation begins to occur (see
Appendix 7).
Of the 11 participants, eight were female and three were male. Three of the
participants had attained secondary education, six had completed Bachelor studies
and a further two had completed postgraduate studies. Four participants were
currently studying, while the other seven were currently in the workforce. Eight of
the participants were single, while two were in de facto relationships and one was
married. All participants had been on a holiday near Brisbane in the last 12 months,
and ten were planning to go again in the next 12 months.
66
3.3.5.2 Cognitive attributes – Short-break.
As a Repertory Test interview was conducted with the aim to identify destination
image attributes, cognitive attributes were collected. Laddering was conducted
within these interviews only to ensure that if a benefit or a value was provided by the
participant, the researcher could ladder down to a cognitive attribute (Reynolds &
Gutman, 1988). That is, if a participant stated they wanted to ‘relax’, they would be
asked: “What makes these destinations relaxing?” and this would continue until an
attribute was derived. This was to identify those salient attributes that consumers
used to evaluate destinations when considering a short-break near Brisbane.
A total of 197 verbal statements were identified in the short-break interview round.
Verbal statements were allocated to categories throughout the interview round to
identify when saturation was reached. The process used to account for the attributes
attained from the interviews is outlined in Appendix 7. On average, interviews went
for approximately 14 minutes. Participants elicited an average of 18 constructs per
participant, and an average of 13 new attributes was elicited per participant. An
average of 13 triads was used per participant.
3.3.5.3 Cognitive destination image categories – Short-break.
Inductive reasoning was used to identify the possible categorisations of the data
relative to what participants had outlined (Saldaña, 2011). Therefore, based on what
participants had outlined in the interviews, categories were developed. Similarly to
the content analysis of the literature, Guba’s (1978) qualitative data analysis
guidelines were utilised. This was to ensure attribute categories were internally
homogeneous and externally heterogeneous. Seven co-researchers were used to
verify the categories based on Guba’s (1978) recommendations.
Categories were named using the most frequently discussed verbal statement. This
ensured that categories were both in the language of the consumer and relevant to
them. Categories are outlined in Figure 7.
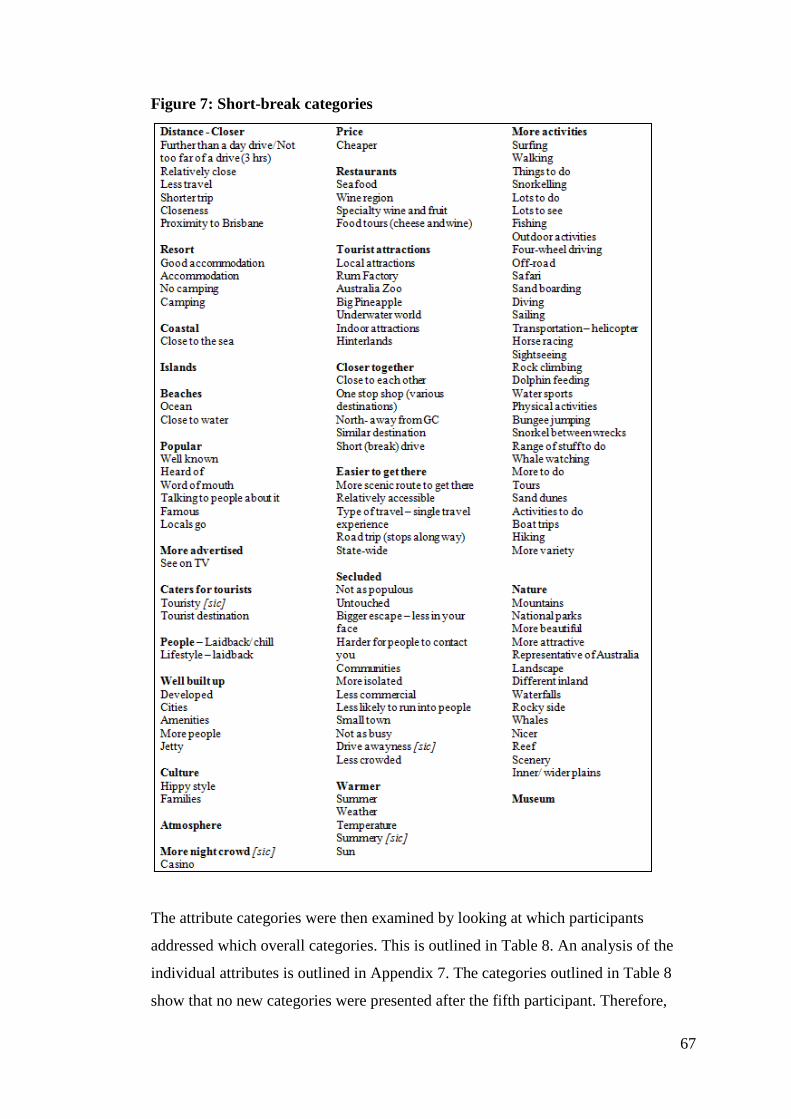
67
Figure 7: Short-break categories
The attribute categories were then examined by looking at which participants
addressed which overall categories. This is outlined in Table 8. An analysis of the
individual attributes is outlined in Appendix 7. The categories outlined in Table 8
show that no new categories were presented after the fifth participant. Therefore,
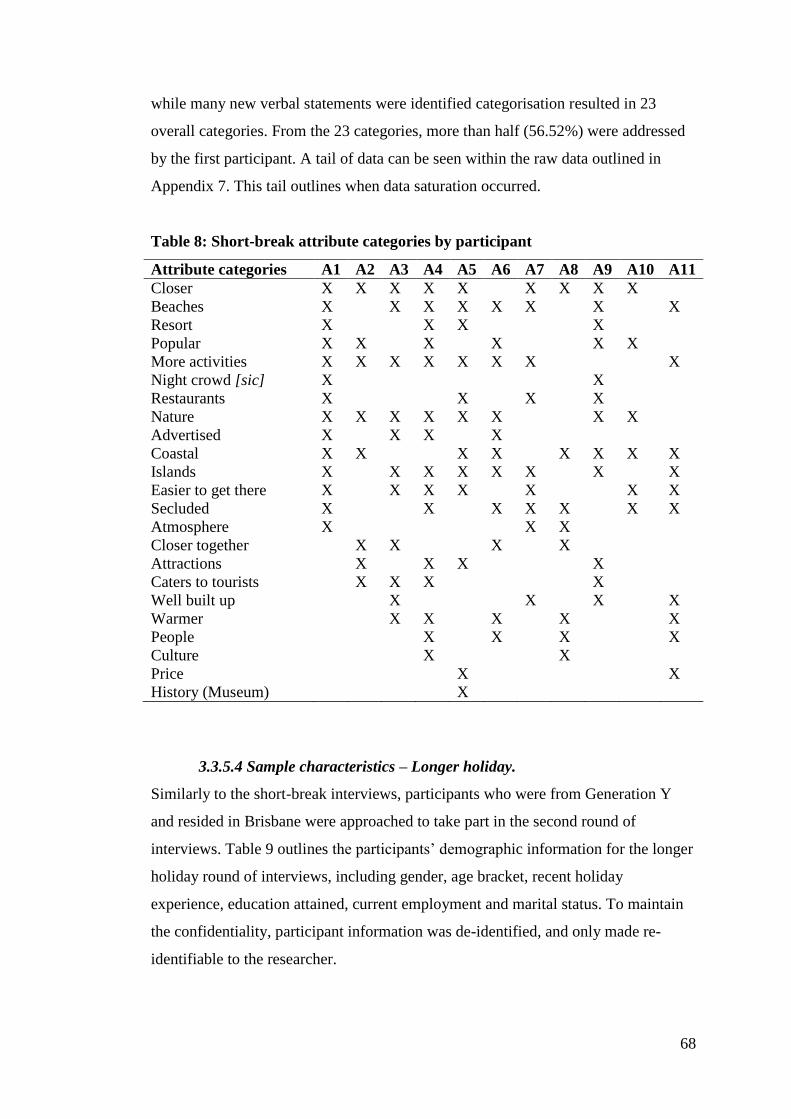
68
while many new verbal statements were identified categorisation resulted in 23
overall categories. From the 23 categories, more than half (56.52%) were addressed
by the first participant. A tail of data can be seen within the raw data outlined in
Appendix 7. This tail outlines when data saturation occurred.
Table 8: Short-break attribute categories by participant
Attribute categories A1 A2 A3 A4 A5 A6 A7 A8 A9 A10 A11
Closer X X X X X X X X X
Beaches X X X X X X X X
Resort X X X X
Popular X X X X X X
More activities X X X X X X X X
Night crowd [sic] X X
Restaurants X X X X
Nature X X X X X X X X
Advertised X X X X
Coastal X X X X X X X X
Islands X X X X X X X X
Easier to get there X X X X X X X
Secluded X X X X X X X
Atmosphere X X X
Closer together X X X X
Attractions X X X X
Caters to tourists X X X X
Well built up X X X X
Warmer X X X X X
People X X X X
Culture X X
Price X X
History (Museum) X
3.3.5.4 Sample characteristics – Longer holiday.
Similarly to the short-break interviews, participants who were from Generation Y
and resided in Brisbane were approached to take part in the second round of
interviews. Table 9 outlines the participants’ demographic information for the longer
holiday round of interviews, including gender, age bracket, recent holiday
experience, education attained, current employment and marital status. To maintain
the confidentiality, participant information was de-identified, and only made re-
identifiable to the researcher.
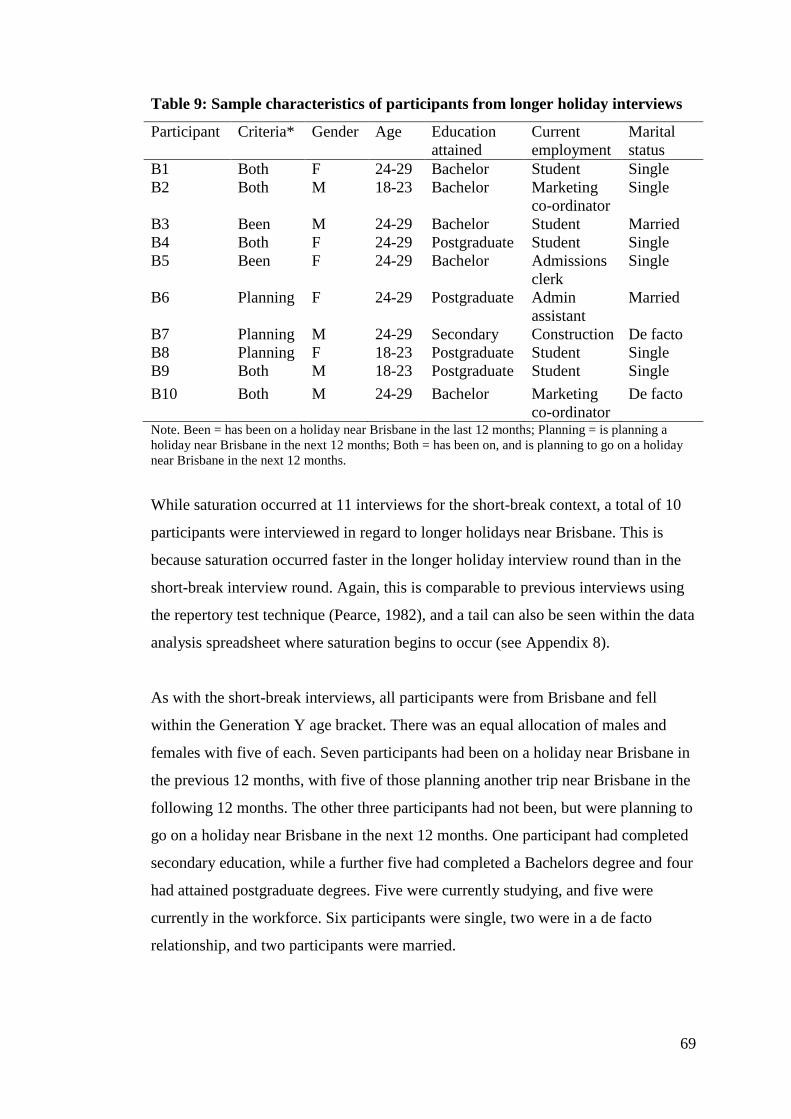
69
Table 9: Sample characteristics of participants from longer holiday interviews
Participant Criteria* Gender Age Education
attained
Current
employment
Marital
status
B1 Both F 24-29 Bachelor Student Single
B2 Both M 18-23 Bachelor Marketing
co-ordinator
Single
B3 Been M 24-29 Bachelor Student Married
B4 Both F 24-29 Postgraduate Student Single
B5 Been F 24-29 Bachelor Admissions
clerk
Single
B6 Planning F 24-29 Postgraduate Admin
assistant
Married
B7 Planning M 24-29 Secondary Construction De facto
B8 Planning F 18-23 Postgraduate Student Single
B9 Both M 18-23 Postgraduate Student Single
B10 Both M 24-29 Bachelor Marketing
co-ordinator
De facto
Note. Been = has been on a holiday near Brisbane in the last 12 months; Planning = is planning a
holiday near Brisbane in the next 12 months; Both = has been on, and is planning to go on a holiday
near Brisbane in the next 12 months.
While saturation occurred at 11 interviews for the short-break context, a total of 10
participants were interviewed in regard to longer holidays near Brisbane. This is
because saturation occurred faster in the longer holiday interview round than in the
short-break interview round. Again, this is comparable to previous interviews using
the repertory test technique (Pearce, 1982), and a tail can also be seen within the data
analysis spreadsheet where saturation begins to occur (see Appendix 8).
As with the short-break interviews, all participants were from Brisbane and fell
within the Generation Y age bracket. There was an equal allocation of males and
females with five of each. Seven participants had been on a holiday near Brisbane in
the previous 12 months, with five of those planning another trip near Brisbane in the
following 12 months. The other three participants had not been, but were planning to
go on a holiday near Brisbane in the next 12 months. One participant had completed
secondary education, while a further five had completed a Bachelors degree and four
had attained postgraduate degrees. Five were currently studying, and five were
currently in the workforce. Six participants were single, two were in a de facto
relationship, and two participants were married.
70
3.3.5.5 Cognitive attributes – Longer holiday.
Similarly to the short-break interview round, salient cognitive attributes were
collected from participants. A total of 173 verbal statements were identified for
analysis. Verbal statements identified by participants can be seen outlined in
Appendix 8. On average, interviews went for approximately 22.6 minutes. An
average of 17 constructs, with an average of 12 new constructs, were elicited per
participant. An average of 14 triads was used.
3.3.5.6 Cognitive destination image categories – Longer holiday.
The inductive reasoning strategy used in the short-break interviews was again used
(Saldaña, 2011). This was to ensure the results were relevant to participants, and in
the language of the consumer (Pike, 2003; Sampson, 1972). Attributes were again
placed into categories which were homogeneous within, yet heterogeneous to other
categories (Guba, 1978). Similarly to the short-break round, seven co-researchers
examined the categories. Three attributes, which were idiosyncratic in nature, were
removed from further analysis. These were ‘connected via mobile/ internet’, ‘unique’
and ‘guarantee’. Categories identified for the longer holiday round of interviews are
outlined in Figure 8.
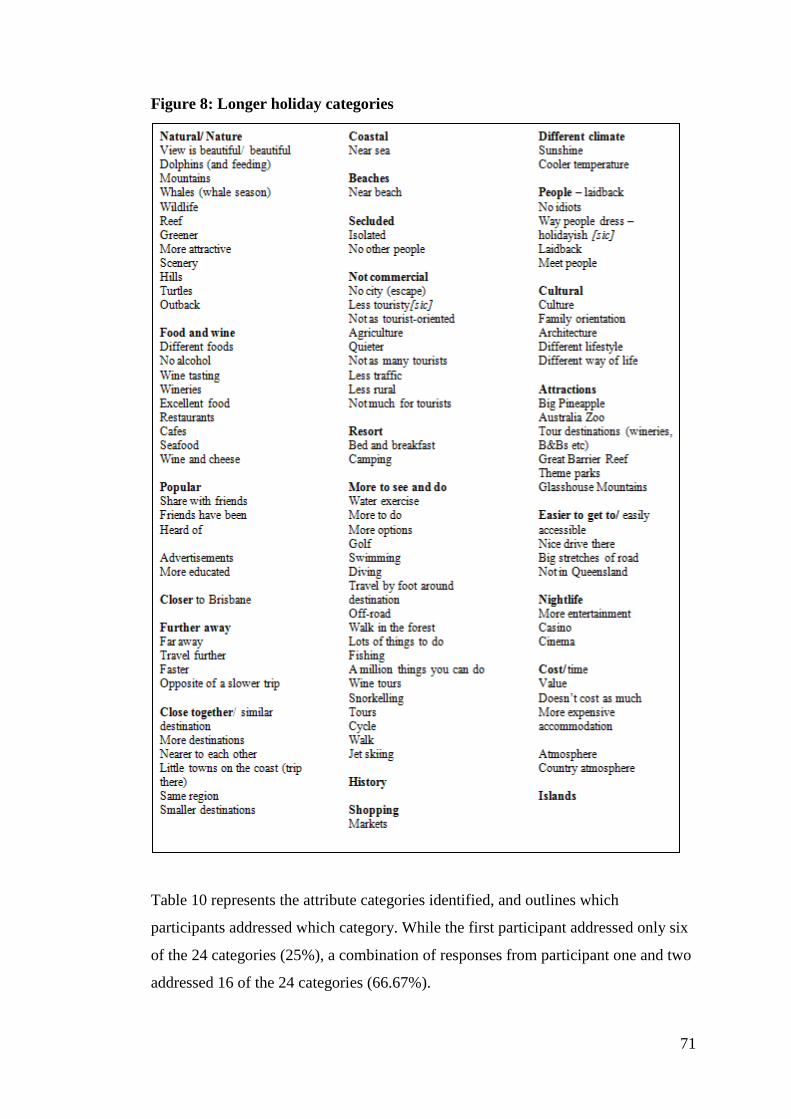
71
Figure 8: Longer holiday categories
Table 10 represents the attribute categories identified, and outlines which
participants addressed which category. While the first participant addressed only six
of the 24 categories (25%), a combination of responses from participant one and two
addressed 16 of the 24 categories (66.67%).
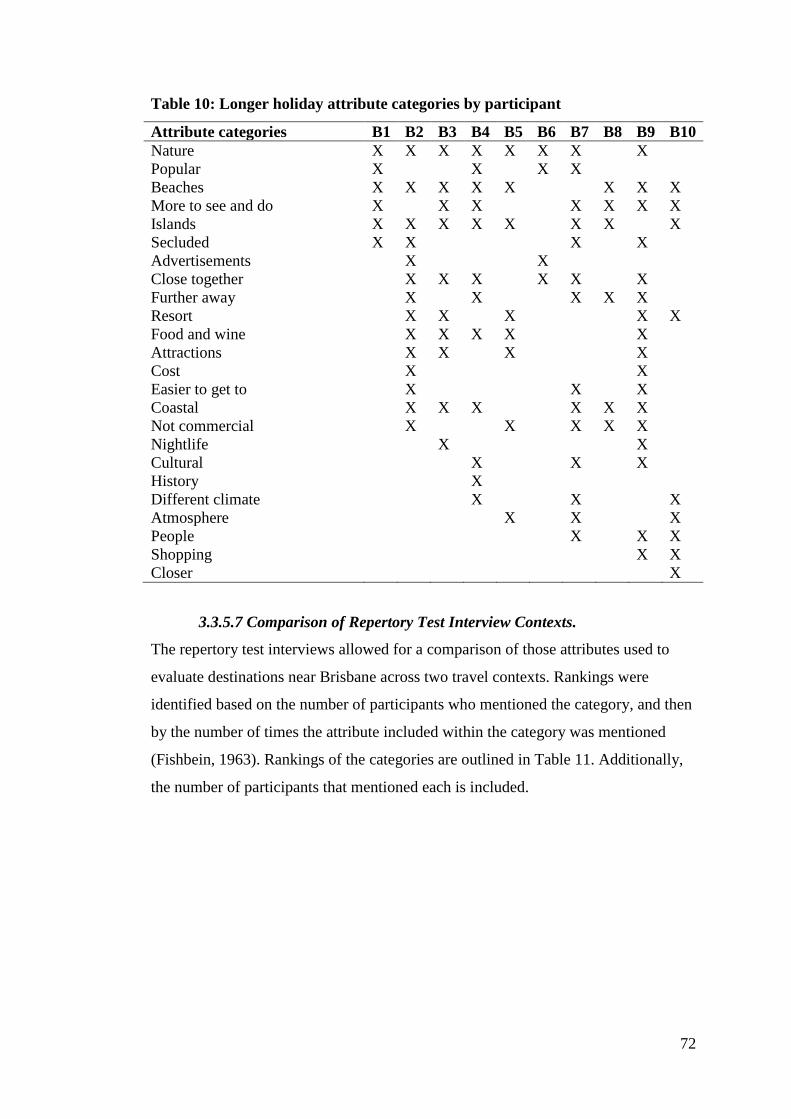
72
Table 10: Longer holiday attribute categories by participant
Attribute categories B1 B2 B3 B4 B5 B6 B7 B8 B9 B10
Nature X X X X X X X X
Popular X X X X
Beaches X X X X X X X X
More to see and do X X X X X X X
Islands X X X X X X X X
Secluded X X X X
Advertisements X X
Close together X X X X X X
Further away X X X X X
Resort X X X X X
Food and wine X X X X X
Attractions X X X X
Cost X X
Easier to get to X X X
Coastal X X X X X X
Not commercial X X X X X
Nightlife X X
Cultural X X X
History X
Different climate X X X
Atmosphere X X X
People X X X
Shopping X X
Closer X
3.3.5.7 Comparison of Repertory Test Interview Contexts.
The repertory test interviews allowed for a comparison of those attributes used to
evaluate destinations near Brisbane across two travel contexts. Rankings were
identified based on the number of participants who mentioned the category, and then
by the number of times the attribute included within the category was mentioned
(Fishbein, 1963). Rankings of the categories are outlined in Table 11. Additionally,
the number of participants that mentioned each is included.
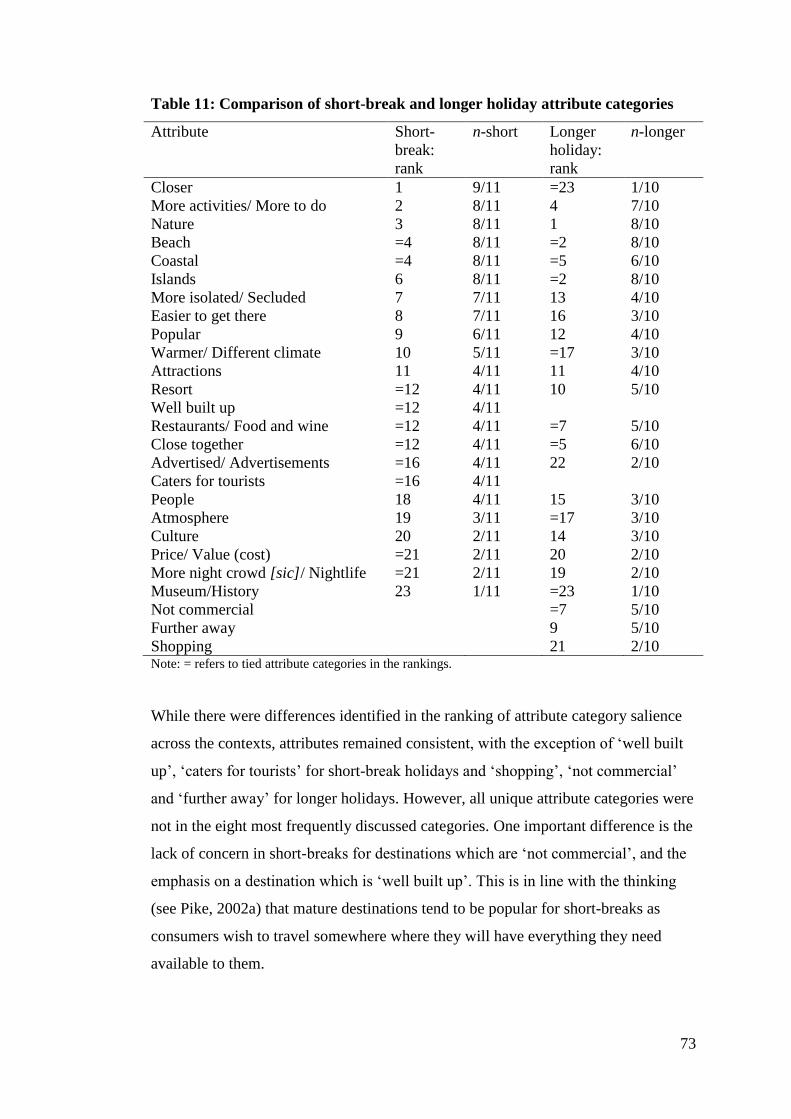
73
Table 11: Comparison of short-break and longer holiday attribute categories
Attribute Short-
break:
rank
n-short Longer
holiday:
rank
n-longer
Closer 1 9/11 =23 1/10
More activities/ More to do 2 8/11 4 7/10
Nature 3 8/11 1 8/10
Beach =4 8/11 =2 8/10
Coastal =4 8/11 =5 6/10
Islands 6 8/11 =2 8/10
More isolated/ Secluded 7 7/11 13 4/10
Easier to get there 8 7/11 16 3/10
Popular 9 6/11 12 4/10
Warmer/ Different climate 10 5/11 =17 3/10
Attractions 11 4/11 11 4/10
Resort =12 4/11 10 5/10
Well built up =12 4/11
Restaurants/ Food and wine =12 4/11 =7 5/10
Close together =12 4/11 =5 6/10
Advertised/ Advertisements =16 4/11 22 2/10
Caters for tourists =16 4/11
People 18 4/11 15 3/10
Atmosphere 19 3/11 =17 3/10
Culture 20 2/11 14 3/10
Price/ Value (cost) =21 2/11 20 2/10
More night crowd [sic]/ Nightlife =21 2/11 19 2/10
Museum/History 23 1/11 =23 1/10
Not commercial =7 5/10
Further away 9 5/10
Shopping 21 2/10 Note: = refers to tied attribute categories in the rankings.
While there were differences identified in the ranking of attribute category salience
across the contexts, attributes remained consistent, with the exception of ‘well built
up’, ‘caters for tourists’ for short-break holidays and ‘shopping’, ‘not commercial’
and ‘further away’ for longer holidays. However, all unique attribute categories were
not in the eight most frequently discussed categories. One important difference is the
lack of concern in short-breaks for destinations which are ‘not commercial’, and the
emphasis on a destination which is ‘well built up’. This is in line with the thinking
(see Pike, 2002a) that mature destinations tend to be popular for short-breaks as
consumers wish to travel somewhere where they will have everything they need
available to them.
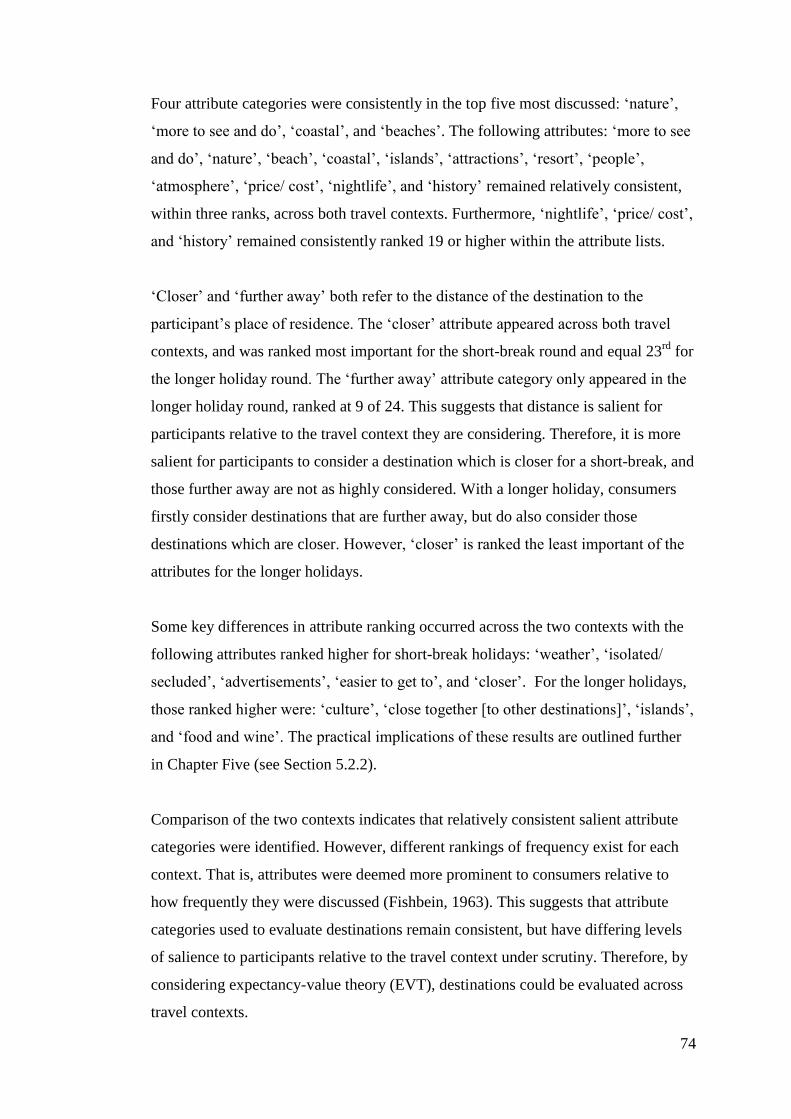
74
Four attribute categories were consistently in the top five most discussed: ‘nature’,
‘more to see and do’, ‘coastal’, and ‘beaches’. The following attributes: ‘more to see
and do’, ‘nature’, ‘beach’, ‘coastal’, ‘islands’, ‘attractions’, ‘resort’, ‘people’,
‘atmosphere’, ‘price/ cost’, ‘nightlife’, and ‘history’ remained relatively consistent,
within three ranks, across both travel contexts. Furthermore, ‘nightlife’, ‘price/ cost’,
and ‘history’ remained consistently ranked 19 or higher within the attribute lists.
‘Closer’ and ‘further away’ both refer to the distance of the destination to the
participant’s place of residence. The ‘closer’ attribute appeared across both travel
contexts, and was ranked most important for the short-break round and equal 23rd
for
the longer holiday round. The ‘further away’ attribute category only appeared in the
longer holiday round, ranked at 9 of 24. This suggests that distance is salient for
participants relative to the travel context they are considering. Therefore, it is more
salient for participants to consider a destination which is closer for a short-break, and
those further away are not as highly considered. With a longer holiday, consumers
firstly consider destinations that are further away, but do also consider those
destinations which are closer. However, ‘closer’ is ranked the least important of the
attributes for the longer holidays.
Some key differences in attribute ranking occurred across the two contexts with the
following attributes ranked higher for short-break holidays: ‘weather’, ‘isolated/
secluded’, ‘advertisements’, ‘easier to get to’, and ‘closer’. For the longer holidays,
those ranked higher were: ‘culture’, ‘close together [to other destinations]’, ‘islands’,
and ‘food and wine’. The practical implications of these results are outlined further
in Chapter Five (see Section 5.2.2).
Comparison of the two contexts indicates that relatively consistent salient attribute
categories were identified. However, different rankings of frequency exist for each
context. That is, attributes were deemed more prominent to consumers relative to
how frequently they were discussed (Fishbein, 1963). This suggests that attribute
categories used to evaluate destinations remain consistent, but have differing levels
of salience to participants relative to the travel context under scrutiny. Therefore, by
considering expectancy-value theory (EVT), destinations could be evaluated across
travel contexts.
75
3.3.5.8 Relating findings to the Theory of Planned Behaviour.
The findings from the personal interviews suggest Theory of Planned Behaviour
(TpB) components, such as subjective norm and perceived behavioural control, assist
in understanding the consumer’s destination choice, or the performance of the brand.
Findings relative to both subjective norms and perceived behavioural control will be
discussed further.
Within the personal interviews, it was evident that participants considered other
people in their decisions when evaluating destinations. The premise of subjective
norms is that decisions are not made in a vacuum, but are made when considering
social influences (Solomon et al., 2010). Participants discussed various aspects of
their decisions related to this construct, including references to the impact of word-
of-mouth (Participants A4; A6), popularity of the destination (Participants A1; A6;
A10; B1; B6), or that friends had been there (A6; B6). Within the short-break
interviews, one participant also stated they would prefer a destination where they
were “less likely to run into people” that they knew (Participant A6). Within the
longer holiday interviews, participants also discussed being able to share their
experiences with their friends and family (Participants B4; B7). This again suggests
the need for consumers to consider others in their decision-making process, which
relates to subjective norms.
In regard to perceived behavioural control, participants evaluated a destination
considering three key components of the construct: i) time; ii) money; and iii)
control (Sparks & Pan, 2009). Time was a frequently discussed consideration within
the short-break interviews, especially in regard to the distance of the destination.
Participants discussed wanting destinations that were closer, or not too far of a drive
(Participants A1; A2; A3; A4; A5; A7; A9; A10). Within the longer holiday
interviews, only one participant discussed going to a destination because it was
closer (B10). Half the participants (50%) from the longer holiday interviews
preferred a destination that was further away (Participants B2; B4; B7; B8; B9).
Furthermore, cost of the trip was also an important factor. Monetary considerations
were addressed by four participants across both travel contexts (Participants A5;
A11; B2; B9).Considering the control someone had over getting to the destination,
five participants specifically discussed ease of access to a destination (Participants
76
A1; A3; A4; A5; B10), and one elaborated by stating they wanted a destination that
would not be impacted by third parties (Participant B3). For example, they did not
want to have to wait for a ferry operator to load their car, so they could then head to
Fraser Island.
The findings from these interviews relate to the Theory of Planned Behaviour.
Furthermore, because of this suggested relationship, it is proposed that while Study
One was developed to identify an index for Study Two, these findings also support
the conceptual model to be tested in the second study.
3.3.5.9 Ethics.
Interviews were undertaken to attain consumer evaluation, and were conducted in
accordance with the QUT ethical standards and the National Statement on Ethical
Conduct in Human Research (QUT, 2010). A low-risk application was utilised and
approved in accordance with Queensland University of Technology’s ethical code of
conduct. The approval number provided for personal interviews with consumers was
1000000068, and is provided in Appendix 9.
The three traditional requirements of ethical conduct are: i) informed consent; ii)
right to privacy; and iii) protection from harm (Fontana & Frey, 1994). All three of
these were assessed and upheld by the QUT ethics board. It was proposed that every
participant would provide informed consent. That is, there was no covert research
conducted (Fontana & Frey, 1994) and all participants were told of the purpose of
the research from the beginning. Participants were informed beforehand of the
purpose of the research through the provision of the information sheet and consent
form (see Appendices 4 and 5). In terms of their right to privacy, participants were
ensured that all research would be confidential (Hair, Bush, & Ortinau, 2003;
Zikmund & Babin, 2007). Data was de-identified so that the identity of the
participant was only known to the researcher. Additionally, data was kept secure
(Wilson, 2003) by using a password locked computer and locked cabinet to store
files. To ensure participants protection from harm, they were also given the option
to opt out at any time during the interview. They were informed beforehand that
there would be no penalty if they decided to withdraw, and their recording would be
77
destroyed. Reciprocity is another key component of ethics (Fontana & Frey, 1994).
This was provided to consumers in the form of a gift voucher.
3.4 Triangulation of results
The comparison of all methods allows better understanding of destination image
relative to both the consumer and the organisational perspective. As expectancy-
value theory relies on a few key criteria when assessing a brand, or in this case a
destination (Ajzen & Fishbein, 1980), it was important to understand whether those
attributes which were salient to consumers were also salient to DMOs when
considering their development and promotion to consumers in regard to their overall
brand. It was identified that the document analysis addressed the same attribute
categories as the literature analysis, which was used as a basis for this study. The
comparison of the three methods suggests elicitation of attributes from consumers
was important to ensure adequate identification of those attributes which were salient
to them.
A total of 7553 attributes were collated through the use of a content analysis of the
literature, personal interviews with consumers, and a document analysis. This thesis
examined the image attributes identified, and evaluated those relative to destination
brand performance. All attributes were tested in the destination image construct of
the model of destination brand performance proposed at the conclusion of Chapter
Two. This provided a synthesised scale, or index, for analysis of destination image,
and in turn, a better measure of destination brand performance.
The results from each technique used within the first study are outlined in Table 12.
Table 12 examines the rankings of each of the destination image categories
comparative to the other sources analysed. This shows that there are some
differences in what consumers state they evaluate when considering destinations
when compared to what DMOs focus on, and what has previously been discussed in
the literature. For example, a destination that has ‘islands’ was considered by
participants for both contexts, however did not appear in the document analysis or
the literature. In contrast, attributes such as ‘infrastructure’, ‘safety and security’ and
‘cleanliness’ were mentioned within organisational documents, and tested previously
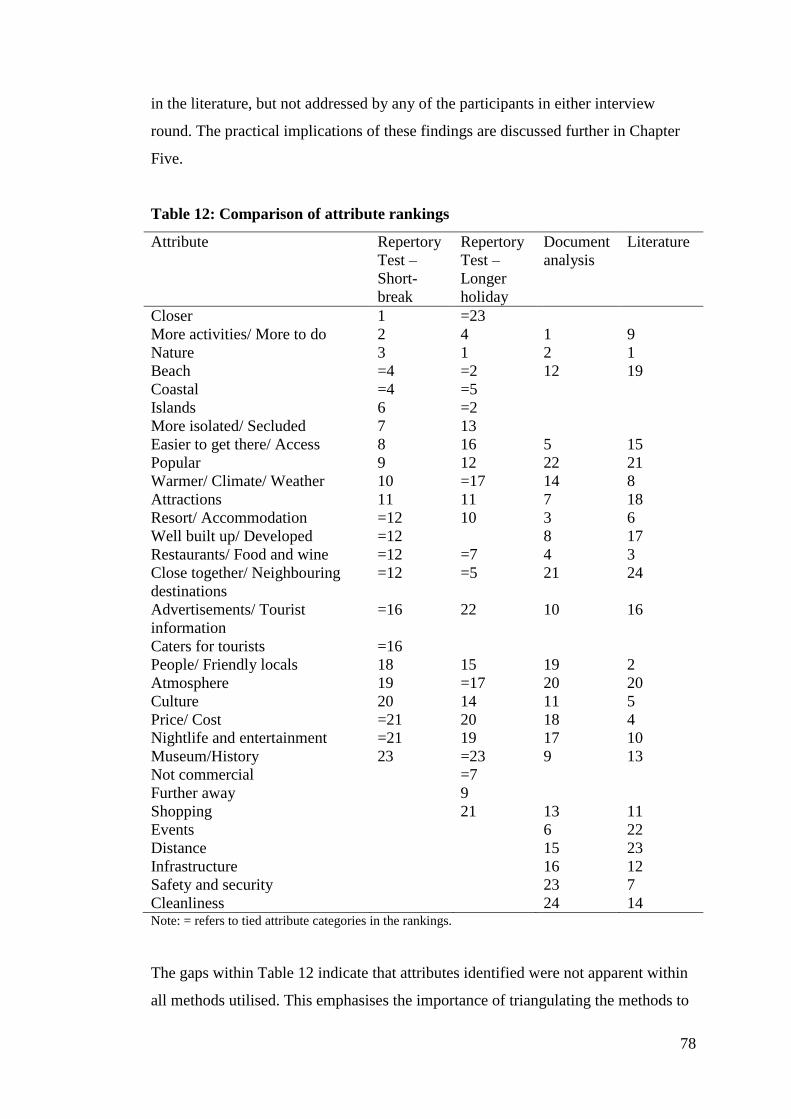
78
in the literature, but not addressed by any of the participants in either interview
round. The practical implications of these findings are discussed further in Chapter
Five.
Table 12: Comparison of attribute rankings
Attribute Repertory
Test –
Short-
break
Repertory
Test –
Longer
holiday
Document
analysis
Literature
Closer 1 =23
More activities/ More to do 2 4 1 9
Nature 3 1 2 1
Beach =4 =2 12 19
Coastal =4 =5
Islands 6 =2
More isolated/ Secluded 7 13
Easier to get there/ Access 8 16 5 15
Popular 9 12 22 21
Warmer/ Climate/ Weather 10 =17 14 8
Attractions 11 11 7 18
Resort/ Accommodation =12 10 3 6
Well built up/ Developed =12 8 17
Restaurants/ Food and wine =12 =7 4 3
Close together/ Neighbouring
destinations
=12 =5 21 24
Advertisements/ Tourist
information
=16 22 10 16
Caters for tourists =16
People/ Friendly locals 18 15 19 2
Atmosphere 19 =17 20 20
Culture 20 14 11 5
Price/ Cost =21 20 18 4
Nightlife and entertainment =21 19 17 10
Museum/History 23 =23 9 13
Not commercial =7
Further away 9
Shopping 21 13 11
Events 6 22
Distance 15 23
Infrastructure 16 12
Safety and security 23 7
Cleanliness 24 14 Note: = refers to tied attribute categories in the rankings.
The gaps within Table 12 indicate that attributes identified were not apparent within
all methods utilised. This emphasises the importance of triangulating the methods to
79
ensure that both the destination brand identity and destination brand image are
accounted for.
3.4.1 Implications for Study Two.
The implications of Study One, relative to Study Two, will be discussed further in
this section. The use of cognitive image attributes will be outlined both in general,
and relative to travel context. Furthermore, emphasis on the link between consumer-
based brand equity and the theory of planned behaviour relative to the personal
interviews will be discussed. Further conceptual and practical implications will be
outlined in Chapter Five.
The proposed model examines destination brand performance relative to both the
CBBE hierarchy, and TpB (see Section 2.5). The cognitive beliefs construct of the
model is defined as an index which consists of those attributes a consumer associates
with a destination. When considering cognitive attributes, multiple attribute decision
making is prevalent. That is, consumers consider multiple attributes when evaluating
destinations for travel (Cracolici & Nijkamp, 2009).When considering multiple
attribute decision making, attribute lists that should be selected for testing need to be
complete and exhaustive, relevant to the context at hand, attributes must differ to
other attributes listed, and should be important to the decision-making process at
hand (Yoon & Hwang, 1995). The attribute categories identified in Study One are
different from the other categories listed, the list is extensive, and to the best of the
researcher’s knowledge complete and exhaustive. Furthermore, the attributes are
important to the decision-making process at hand, as identified through triangulation
of appropriate methods. In regard to context, the aim of this study is to create a scale
of cognitive destination image attributes that can be used to measure cognitive image
across travel contexts. Therefore, the list of attribute categories identified in Study
One is proposed to measure image across travel contexts. The findings from Study
One are useful for Study Two, as the attributes identified can be used within the
model.
The overall aim of this study was to develop a list, or index, of cognitive destination
image attributes. The purpose of developing this index was to identify any
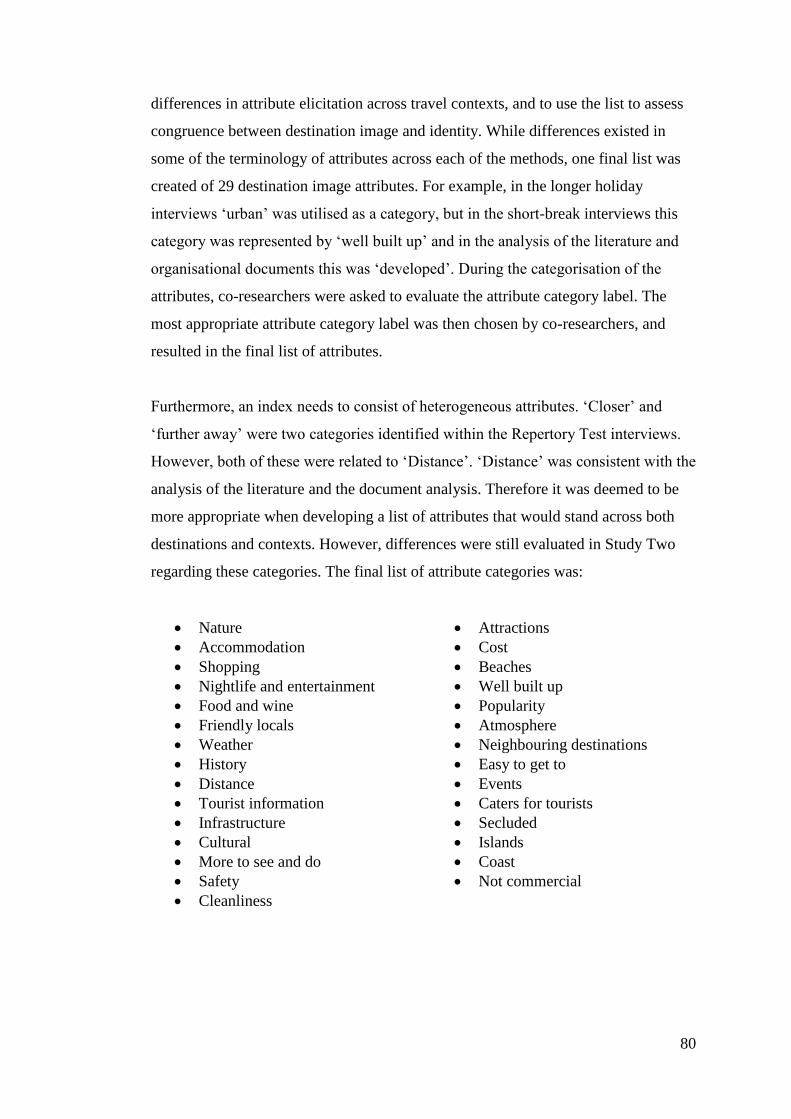
80
differences in attribute elicitation across travel contexts, and to use the list to assess
congruence between destination image and identity. While differences existed in
some of the terminology of attributes across each of the methods, one final list was
created of 29 destination image attributes. For example, in the longer holiday
interviews ‘urban’ was utilised as a category, but in the short-break interviews this
category was represented by ‘well built up’ and in the analysis of the literature and
organisational documents this was ‘developed’. During the categorisation of the
attributes, co-researchers were asked to evaluate the attribute category label. The
most appropriate attribute category label was then chosen by co-researchers, and
resulted in the final list of attributes.
Furthermore, an index needs to consist of heterogeneous attributes. ‘Closer’ and
‘further away’ were two categories identified within the Repertory Test interviews.
However, both of these were related to ‘Distance’. ‘Distance’ was consistent with the
analysis of the literature and the document analysis. Therefore it was deemed to be
more appropriate when developing a list of attributes that would stand across both
destinations and contexts. However, differences were still evaluated in Study Two
regarding these categories. The final list of attribute categories was:
Nature
Accommodation
Shopping
Nightlife and entertainment
Food and wine
Friendly locals
Weather
History
Distance
Tourist information
Infrastructure
Cultural
More to see and do
Safety
Cleanliness
Attractions
Cost
Beaches
Well built up
Popularity
Atmosphere
Neighbouring destinations
Easy to get to
Events
Caters for tourists
Secluded
Islands
Coast
Not commercial
81
3.5 Summary
A combination of a literature analysis, document analysis and personal interviews
with consumers was undertaken to allow triangulation (Cavana et al., 2001),
resulting in a more rigorous and reliable list of attributes (Churchill, 1979; Echtner &
Ritchie, 1993). Based on the aforementioned study-specific research objectives, the
overall aim of this study was to develop a set of attributes that are universally
applicable to all destinations and contexts. While some attributes may be rated as
unimportant in certain situations, the overall set of attributes can then be used to: i)
assess the congruence between brand identity and brand image; and ii) assess overall
brand performance.
It was important to assess similarities or differences that existed between the two
personal interview rounds to identify whether travel context affected the evaluation
of destination image. This linked to expectancy-value theory (Ajzen & Fishbein,
1980), and the proposal to extend this theory beyond evaluating image within one
product category, or travel context. In regard to differences between contexts,
attributes remained relatively consistent. However, differences may exist within
different travel contexts.
Comparisons with DMOs allowed better understanding of both the consumer and
organisational perspective. As differences can also be identified by comparing the
personal interviews with both the document analysis and the literature, this
emphasises the need to elicit attributes from consumers.
82
Chapter Four: Study Two
4.0 Introduction
Chapter Three outlined the findings from Study One, which identified cognitive
image attributes relevant to the conceptual model proposed in Chapter Two, and
outlined in Figure 9. This chapter outlines the methodology of Study Two, which
was undertaken to test the proposed model of destination brand performance across
two travel contexts. This chapter will address the overall research design, including
the sample considerations, questionnaire design and measures. Finally, this chapter
discusses the limitations and ethical considerations of this study.
4.1 Research objectives and hypotheses
This section addresses the study-specific research objectives, and hypotheses
developed from the proposed model. Three study-specific research objectives were
outlined for Study Two:
i. To test a model of consumer-based destination brand performance, across
travel contexts.
ii. To identify if there is a difference in destination brand performance based on
travel context.
iii. To investigate the level of congruence between destination brand identity and
destination brand image.
The proposed model of destination brand performance to be tested is outlined in
Figure 9.
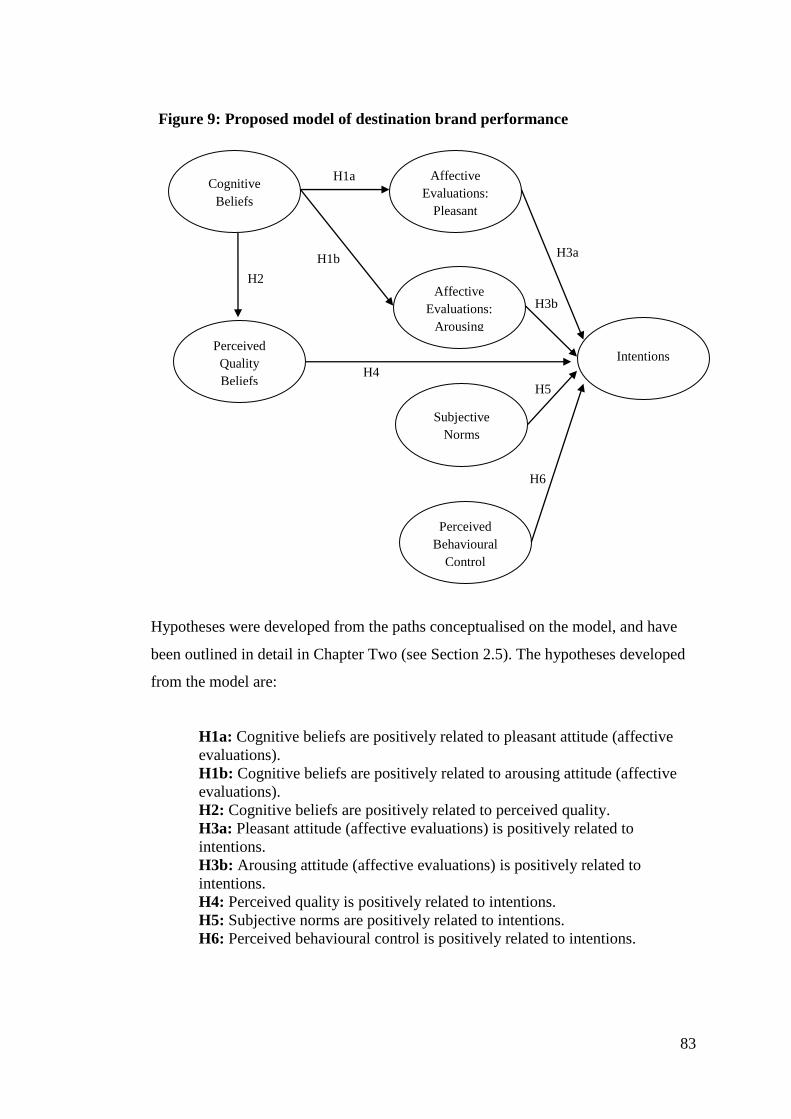
83
Hypotheses were developed from the paths conceptualised on the model, and have
been outlined in detail in Chapter Two (see Section 2.5). The hypotheses developed
from the model are:
H1a: Cognitive beliefs are positively related to pleasant attitude (affective
evaluations).
H1b: Cognitive beliefs are positively related to arousing attitude (affective
evaluations).
H2: Cognitive beliefs are positively related to perceived quality.
H3a: Pleasant attitude (affective evaluations) is positively related to
intentions.
H3b: Arousing attitude (affective evaluations) is positively related to
intentions.
H4: Perceived quality is positively related to intentions.
H5: Subjective norms are positively related to intentions.
H6: Perceived behavioural control is positively related to intentions.
Figure 9: Proposed model of destination brand performance
H1b
H4
H2
Affective
Evaluations:
Pleasant
Intentions
Subjective
Norms
Affective
Evaluations:
Arousing
Perceived
Quality
Beliefs
Perceived
Behavioural
Control
Cognitive
Beliefs
H1a
H3a
H3b
H5
H6
84
4.2 Research design
This section addresses the sample considerations and context of Study Two. The
development of the questionnaire used within this study is outlined, before a
discussion relating to the measures and administration used.
4.2.1 Sample considerations.
Convenience sampling was utilised to identify consumers who fit the proposed
criteria: Brisbane residents from Generation Y. The same sample criterion as Study
One were utilised in order to achieve consistency across the two studies. This was to
ensure any differences identified in the data were not related to different age groups.
An online panel was utilised to attain a sample of 800 respondents, purchased from
PureProfile. PureProfile is a corporate member of the Australian Direct Marketing
Association (ADMA), with a database of 550,000 consumers (PureProfile, 2011).
Panel data companies maintain a database of specific characteristics to allow
targeting of different segments. Furthermore, members are compensated for their
time through the data collection company (Zikmund, 2003). Considering the
criterion which needed to be met, panel access ensured that an adequate number of
respondents were obtained to test the model.
4.2.2 Context.
The purpose of testing the proposed model was to identify whether it could be used
to predict travel intentions across different travel contexts. Travel contexts analysed
in Study One were again used for Study Two: i) short-break holidays by car; and ii)
longer holidays by car. The model was tested on destinations near Brisbane.
Destinations were identified from a previous study which identified nearby places
that were most thought of by Brisbane residents (Pike, 2007c). The three most
recognised destinations were utilised: i) Sunshine Coast; ii) Gold Coast; and iii)
Northern New South Wales. A destination which was less recognised was also
chosen: Moreton Bay Islands. As a less popular destination, this was chosen to
identify any significant differences between destinations, in terms of awareness,
attitude and intentions. Moreton Bay Islands was ranked 6 from a list of 10 regions
(Pike, 2007c). It was identified in Study One that participants had difficulty
recognising some of the destinations provided, including the Coral Coast, the
85
Discovery Coast and the Capricorn Coast, ranked 8, 9 and 10 respectively. Moreton
Bay Islands was chosen as, comparatively, it did not require a lengthy explanation
within the questionnaire.
One questionnaire was created, and assessed across four destinations and two travel
contexts, or eight variations. That is, the same questions were provided, but were
asked relative to the destination and context that was randomly assigned to the
participant by the market research company. The use of eight variations of the
questionnaire was conducted for three different reasons. Firstly, using eight
variations allowed the researcher to assess whether the model would stand across
different contexts, and destinations. Secondly, if all eight variations were placed on
the one questionnaire, this would be too lengthy, and would result in both respondent
fatigue and increased costs (Brace, 2008). Finally, if a respondent was provided with
more than one destination, or context, when responding to the second travel scenario,
there was a risk the respondent would respond relative to the previously outlined
destination. That is, while questions should be in a logical order (Malhotra et al.,
2006), respondents would still be able to draw comparisons between the destinations
or contexts, and this could bias their responses.
4.2.3 Questionnaire development.
An online questionnaire was developed using the measures outlined in Section 4.2.4.
The order of the questions was considered carefully, and similar topics were kept
together to ensure the questionnaire was easy for participants to answer (Dillman,
2007). The layout was strongly considered to ensure: i) questions were not
overlooked by participants (Dillman, 2007); and ii) to ensure free elicitation was not
biased (Brace, 2008). That is, participants were asked to freely elicit destinations
they would consider for a holiday, and no mention of any destinations was made on
the first page. This was asked before considering the perception of a specific
destination relative to the proposed model to ensure no bias towards the specified
destination relative to free elicitation (Brace, 2008). Two filter questions were asked
to ensure the participants were Brisbane residents from Generation Y.
86
4.2.4 Measures.
The aim of the questionnaire was to collect data related to the proposed model of
destination brand performance, and to assess those destinations consumers consider
when thinking about a particular travel context relative to their intentions. Both free
elicitation items were utilised to assess awareness with intentions, and the measures
of each of the seven constructs outlined in the model in Figure 1 are discussed. The
questionnaire contained 20 questions, and is outlined further in this section.
Examples of both the short-break and longer holiday questionnaires are provided in
Appendix 10 and Appendix 11.
Screening questions were initially used to ensure respondents fitted the criteria to
participate in the research. Firstly, prospective respondents were asked if they were
between 18 and 29, inclusive. Secondly, they were asked if they were a Brisbane
resident. Selecting ‘yes’ to both allowed them access to the questionnaire.
Question 1 in the questionnaire asked if they were likely to travel, relative to the
travel context they were provided, in the next 12 months. This was a simple
dichotomous question to provide respondents with confidence to complete the
questionnaire (Brace, 2008), and identify if participants were familiar with the topic.
Question 2 was an unaided free elicitation question, to identify the first destination
consumers considered when thinking about a particular travel context. This was to
identify the destination which was considered by a consumer in view of a particular
travel context. Those destinations considered were assessed separately from the
model. Ordering of questions was important, as the remainder of the questionnaire
examined a specific destination, for example, the Gold Coast. If participants had
been asked about their perception of the Gold Coast, prior to being asked to freely
elicit destinations, this could have resulted in a bias towards the Gold Coast (Brace,
2008). Therefore, no mention was made of any destinations on the opening page.
87
Question 3 was also a free elicitation question. Participants were asked to state all
other destinations they would probably consider relative to the travel context. These
destinations, as well as those provided in Question 2, made up the decision set of the
consumer, relative to the travel context under investigation.
Question 4 was used to measure the ‘cognitive beliefs’ construct, using the attributes
identified in Study One. The 29 attributes utilised were outlined previously in
Section 3.4.1. Question 4 asked respondents to rate the importance of each attribute
to them, when considering the provided travel context. Respondents were asked
“How important are the following when considering a short-break holiday (1-5
nights) by car?”. Responses were measured on a Likert scale of 1 to 7, anchored at 1,
‘Not at all important’, and 7, ‘Very important’.
Question 5 asked respondents to rate the same attributes used in Question 4 for a
particular destination on a Likert scale, also anchored at 1 and 7, with 1 measuring
‘Unsatisfactory’, and 7 measuring ‘Satisfactory’. Attributes were rated relevant to
one of the four destinations the respondent was randomly assigned. They were asked,
for example, “With respect to a short-break (1-5 nights) on the Gold Coast, by car,
how satisfactory or unsatisfactory are the following?”. This rated the perceived
performance of the destination on each attribute. This is in line with attitude
measurement within marketing as outlined by Fishbein and Ajzen (1974), in which
models, such as the Theory of Planned Behaviour, which are based on expectancy-
value theory, have become popular as they provide a theoretical link between
evaluative criteria and attitude.
Within Question 5, a ‘don’t know’ (DK) option was also provided to respondents
when considering their perceived performance with the destination they were
provided. A DK option is useful for marketers, as it provides additional information
regarding those attributes which consumers may be unfamiliar with. This can
provide DMOs with a better understanding of which attributes may not be
appropriate for marketing, or may need additional focus within marketing strategies
(Pike, 2007d). Furthermore, as DK options were provided this ensured respondents
were not forced to provide un-informed responses (Pike, 2007d). This would result
in a false positive attitude (Gilljam & Granberg, 1993). That is, they do not have an
88
opinion on the topic under investigation, but must provide an opinion because they
have not been given the option to decline answering. Arguments against the DK
option refer to a false negative attitude, in which the respondent may have an
underlying attitude towards the topic under investigation, but will decline the
opportunity to provide their own opinion (Gilljam & Granberg, 1993). However,
attitudes not readily expressed are deemed to be relatively inaccessible, or not
something that the respondent may consciously think about. Furthermore,
respondents may not know the answer to a particular question and may be likely to
select a neutral point on the scale when forced. This provides no additional
information to the researcher, such as a lack of attitude towards a particular item, or
attribute. Within this study, a respondent may not know about the performance of a
particular attribute at the destination under investigation, as they may have had no
need to assess that particular attribute previously.
While the inclusion of a DK option can increase the amount of lost data, it also
ensures that respondents are only answering questions they have a conscious attitude
towards (Brace, 2008). However, Pike’s (2007d) study regarding the DK option
found only three destination image attributes had more than 10% of responses as
DK. This suggested those attributes were either not important to respondents, related
to niche markets (Pike, 2007d), or were not relevant to the travel situation at hand.
Furthermore, the use of the DK option can be beneficial as it can increase the
practical implications of the study for destination marketing organisations by
determining where participants may lack an attitude towards either attributes, or a
destination (Pike, 2007d). Within the survey the DK option was placed at the end of
the 7-point Likert scale, and a visual separation was included, which consisted of a
line emphasising there was a difference between the DK option and other response
options (Brace, 2008).
Question 6 assessed the ‘affective evaluations’ of a destination. The affective
evaluations construct refers to the feelings someone has towards an object (Baloglu
& Brinberg, 1997). This construct was split into two categories, ‘pleasant’ and
‘arousing’, as based on the circumplex model of affect outlined by Russel (1980),
and addressed in a tourism context by Baloglu and Brinberg (1997). This was
outlined in Chapter Two. Items were measured on a 5-point semantic differential
89
scale, adapted from Baloglu and Brinberg’s (1997) study of affective scales in a
tourism context.
Question 7 measured three constructs on the same anchors: i) perceived quality; ii)
subjective norms; and iii) perceived behavioural controls. Each item was measured
using a Likert scale, anchored at 1, ‘Strongly disagree’, and 7, ‘Strongly agree’. The
construct of ‘perceived quality beliefs’ was measured using 5 scale items (Boo et al.,
2009; Washburn & Plank, 2002; Yoo & Donthu, 2001). Perceived quality is the
overall quality of the destination as perceived by the consumer (Boo et al., 2009).
‘Subjective norm’ was measured using 4 scale items. ‘Subjective norm’ refers to the
social influences, as many people will consider the views and opinions of others
before making their own decision (Solomon et al., 2010). ‘Perceived behavioural
control’ was measured using 3 scale items. Items for each construct were anchored at
1 and 7 on a Likert scale, with 1 measuring ‘Strongly disagree’ and 7 measuring
‘Strongly agree’ (Sparks & Pan, 2009). ‘Perceived behavioural control’ refers to the
constraints that may exist to prevent someone from performing a particular
behaviour, such as travelling to a destination (Sparks & Pan, 2009). That is, if
someone does not have the money, or the time, they will not be able to partake in the
behaviour under scrutiny.
Question 8 was used to assess the dependant variable: ‘intention’. ‘Intention’ was
measured using 6 scale items. Each item was measured using a 7-point Likert scale,
anchored at ‘Unlikely’ (1) and ‘Likely’ (7) (Lam & Hsu, 2006, Lee, Lee & Lee,
2005). Intention examined the propensity to: i) provide positive word-of-mouth; ii)
to visit; and iii) to re-visit the destination. In regard to visitation, respondents were
asked whether they intended to visit the destination in the next 12 months for the
context being assessed. To assess repeat visitation respondents were asked, using a
dichotomous question, whether they had previously visited the assessed destination.
These were then analysed together when considering repeat visitation.
Questions 9 through 11 assessed the respondents’ previous visitation to the
destination. Question 9 asked whether the respondent had previously visited the
destination on a dichotomous scale, using ‘yes’ and ‘no’, regardless of travel context.
Respondents were also asked if they had visited the destination based on the travel
90
context they were assessed on, and this was also dichotomous. Question 11 asked
how many times they had been to the destination for the travel context under
investigation, using a categorical scale of: ‘Never’, ‘1-2 times’, ‘2-3 times’, ‘4-5
times’, ‘6-10 times’ or ‘More than 10 times’ (Lam & Hsu, 2006).
Questions 12 through 19 were socio-demographic questions and were asked to
better understand the sample and identify any key differences. Respondents were
asked their age, their Brisbane postcode, how long they had lived in Brisbane, their
gender, their highest level of education attained, marital status, whether they had any
dependent children, and their income. These sample characteristics are discussed
further in Section 4.4.2.
Question 20, asked respondents to provide any other comments they may have on
the travel context they were asked to examine. This was to identify any additional
information that participants wished to share about the particular travel context, and
attain any new insights.
4.2.5 Pre-tests.
A paper-based pre-test was conducted with six participants, consisting of two
colleagues and four participants that met the sample criteria: Brisbane residents from
Generation Y. Participants were timed, and all participants completed the
questionnaire in less than six minutes. The questionnaire was examined, and
comments were made by participants to the researcher. Discussion with the
researcher regarding the questionnaire has been shown to identify more errors than
simply administering the questionnaire (Reynolds & Diamantopoulos, 1996). This
resulted in minor changes made to the wording of some questions. Free elicitation
questions were utilised at the beginning of the questionnaire. However, questions
that followed addressed specific destinations, as previously outlined. Feedback
indicated that participants may be confused by providing destinations they thought
of, and then assessing those they had been provided. Therefore, comment was made
to ensure they understood the questions did not directly relate: “Note: The following
questions do not relate to the answers you provided for questions 1, 2 and 3”.
Furthermore, adequate space was provided for the open-ended free elicitation
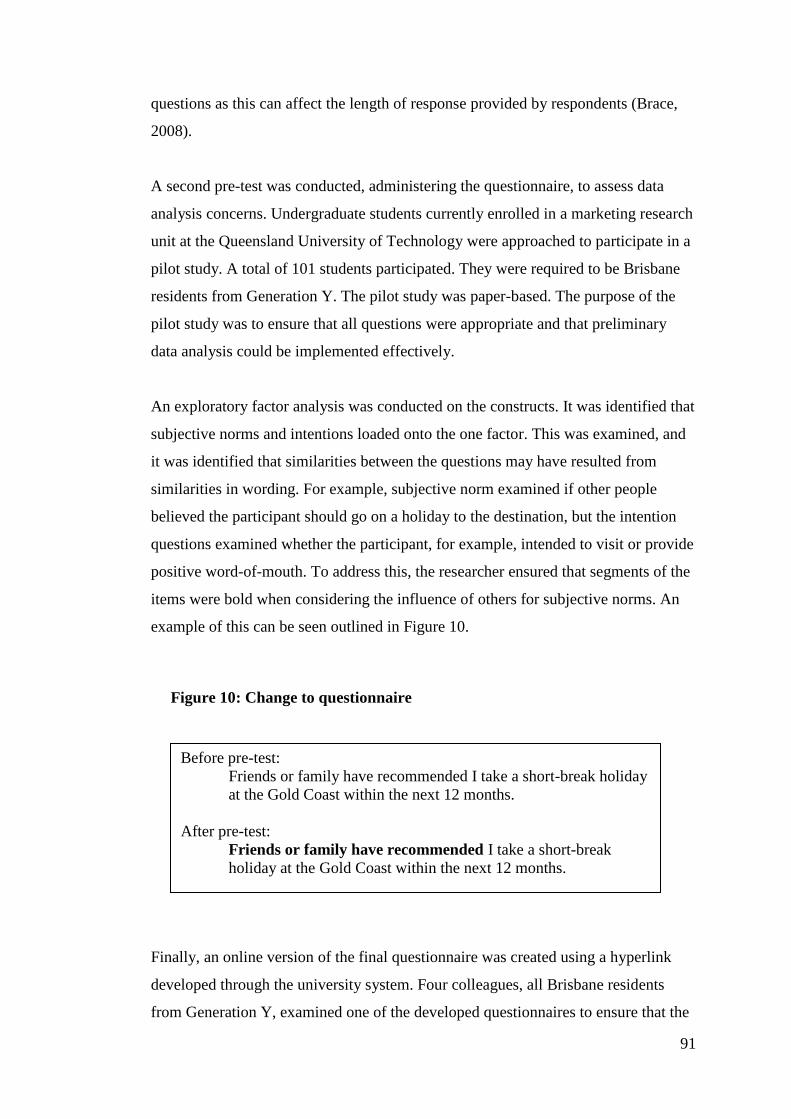
91
questions as this can affect the length of response provided by respondents (Brace,
2008).
A second pre-test was conducted, administering the questionnaire, to assess data
analysis concerns. Undergraduate students currently enrolled in a marketing research
unit at the Queensland University of Technology were approached to participate in a
pilot study. A total of 101 students participated. They were required to be Brisbane
residents from Generation Y. The pilot study was paper-based. The purpose of the
pilot study was to ensure that all questions were appropriate and that preliminary
data analysis could be implemented effectively.
An exploratory factor analysis was conducted on the constructs. It was identified that
subjective norms and intentions loaded onto the one factor. This was examined, and
it was identified that similarities between the questions may have resulted from
similarities in wording. For example, subjective norm examined if other people
believed the participant should go on a holiday to the destination, but the intention
questions examined whether the participant, for example, intended to visit or provide
positive word-of-mouth. To address this, the researcher ensured that segments of the
items were bold when considering the influence of others for subjective norms. An
example of this can be seen outlined in Figure 10.
Finally, an online version of the final questionnaire was created using a hyperlink
developed through the university system. Four colleagues, all Brisbane residents
from Generation Y, examined one of the developed questionnaires to ensure that the
Before pre-test:
Friends or family have recommended I take a short-break holiday
at the Gold Coast within the next 12 months.
After pre-test:
Friends or family have recommended I take a short-break
holiday at the Gold Coast within the next 12 months.
Figure 10: Change to questionnaire
92
instructions and questions were appropriately framed for an online format.
Participants were asked to provide feedback in regard to the instructions for the
online version of the questionnaire. A progress indicator was added to ensure that
participants could assess how much of the questionnaire they had completed, and
what percentage they had left to complete (Brace, 2008). On conclusion of the
changes, the other seven questionnaires were created and checked by the researcher.
4.2.6 Questionnaire administration.
There are a variety of methods utilised to collect questionnaire data: face-to-face,
telephone, paper-based, or online (Brace, 2008). Each of these is discussed in detail,
followed by justification of the chosen data collection method for this study.
Both face-to-face and telephone methods require an interviewer to conduct the
questionnaire verbally. The face-to-face method is advantageous as it allows
complex questions to be asked, and the ability to clarify items within the
questionnaire which respondents may find confusing. However, the interaction with
the interviewer can influence the results; for example, by increasing the likelihood of
social desirability. Furthermore, the face-to-face method is costly (Zikmund et al.,
2011). In terms of the telephone method, it is quite cost-effective and timely
considering the level of geographic dispersion which can be achieved. More
anonymity is also available, when compared to the face-to-face method. However, a
limitation of this type of research relates to the length of the instrument, as
questionnaires utilising the telephone should be relatively short (Zikmund et al.,
2011).
Paper-based and online questionnaires are both self-completion data collection
methods. Paper-based questionnaires are advantageous as respondents have minimal
time pressures, and can write lengthy responses to open-ended questions.
Furthermore, the paper-based method allows respondents to digest the information
before responding. However, a key disadvantage of this method, relative to this
study, is the inability to stop respondents from reading through all questions before
completing the questionnaire. Respondents are asked to freely elicit destinations they
would consider for the travel context under investigation before they are provided
93
the destination they need to assess. This is to ensure that respondents are not biased
in any way to answer with the destination assessed later in the questionnaire.
The online data collection method is advantageous as there is no interviewer,
resulting in less social desirability bias. Furthermore the method is quicker, allows
direct data entry (Sue & Ritter, 2007) and allows questions to be provided in a
particular sequence, without allowing participants to flip through the pages provided
(Brace, 2008). Greater geographic dispersion can also be attained (Zikmund et al.,
2011). A disadvantage of this collection method is the inability to clarify
misunderstandings the respondent may have. However, this should be reduced due to
the use of pre-tests, outlined in Section 4.2.5.
The chosen method for this study was an online data collection method. Relative to
face-to-face and telephone interviews it was more cost-effective. Furthermore, due to
the length of the questionnaire, self-completion was chosen over interviewer
methods, as it allowed respondents to participate at their own convenience (Zikmund
et al., 2011). The online data collection method was chosen over the paper-based
method as it was quicker. Utilising online panel data allowed targeting of the
questionnaire to the specific sample required. Furthermore, participants could not
read through the entirety of the questionnaire in advance. By using an online method,
respondents were required to insert destinations they would consider for a holiday,
relative to the travel context under investigation, without being biased by the
destination they would later have to evaluate.
4.3 Ethical considerations
In accordance with QUT ethical guidelines, respondents were provided with
information about the purpose of the research, and informed that they may withdraw
at any time before submission of the data. However, once submitted, due to the
confidentiality and anonymity of the questionnaire responses, it was impossible to
identify the participant’s response, and remove their questionnaire. Therefore,
participation in the questionnaire constituted consent. Respondents were also
informed that their participation would not have any impact on their relationship
with QUT. There were no health and safety risks. Therefore, a low-risk application
94
was approved (Approval number: 1100000492), and approval is outlined in
Appendix 12.
4.4 Results
This section begins with a description of cleaning the data and sample
characteristics. The data analyses are then presented. Descriptive statistics are
provided, along with results of tests of differences between responses relative to
travel context. Importance-performance analyses were conducted for each of the
travel contexts, for each destination separately. A structural model was tested based
on the developed model outlined in Figure 9 (see page 83). Finally, regression
analyses were conducted to assess the applicability of the proposed model.
4.4.1 Data file.
The QUT information technology system which was used to create the HTML
version of the questionnaire, automatically loads responses to a Microsoft Excel
spreadsheet. A different spreadsheet was provided for each destination/ travel
context combination. These eight Excel files were then imported into one PASW
18.0 file for data analysis. Travel contexts and destinations were coded relative to the
questionnaire undertaken by the respondent. Missing responses were coded as 99 to
allow pair wise deletion, where participants’ responses are taken into consideration
and only the incomplete answers are excluded. This differs from case wise deletion,
which would result in all answers from the one respondent being removed (Malhotra
et al., 2006). A don’t know (DK) option was used when considering the
performance of destination image attributes. DK responses were coded as ‘88’ and
treated as missing data in many of the analyses.
Responses with > 15% missing data (Hair, Black, Babin, & Anderson, 2010), or
those where DK was selected on all options were removed. From a total of 801
questionnaires, 638 usable responses were identified. The number of responses
removed for each questionnaire sample is outlined in Table 13.
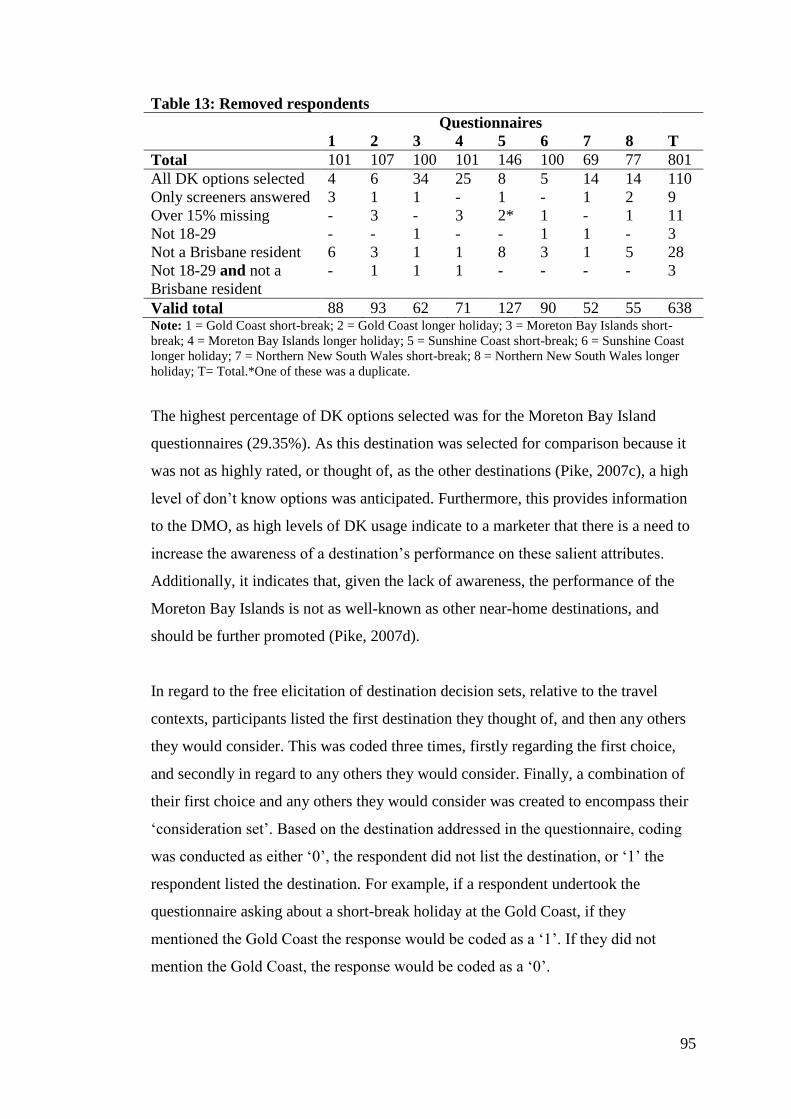
95
Table 13: Removed respondents
Questionnaires
1 2 3 4 5 6 7 8 T
Total 101 107 100 101 146 100 69 77 801
All DK options selected 4 6 34 25 8 5 14 14 110
Only screeners answered 3 1 1 - 1 - 1 2 9
Over 15% missing - 3 - 3 2* 1 - 1 11
Not 18-29 - - 1 - - 1 1 - 3
Not a Brisbane resident 6 3 1 1 8 3 1 5 28
Not 18-29 and not a
Brisbane resident
- 1 1 1 - - - - 3
Valid total 88 93 62 71 127 90 52 55 638 Note: 1 = Gold Coast short-break; 2 = Gold Coast longer holiday; 3 = Moreton Bay Islands short-
break; 4 = Moreton Bay Islands longer holiday; 5 = Sunshine Coast short-break; 6 = Sunshine Coast
longer holiday; 7 = Northern New South Wales short-break; 8 = Northern New South Wales longer
holiday; T= Total.*One of these was a duplicate.
The highest percentage of DK options selected was for the Moreton Bay Island
questionnaires (29.35%). As this destination was selected for comparison because it
was not as highly rated, or thought of, as the other destinations (Pike, 2007c), a high
level of don’t know options was anticipated. Furthermore, this provides information
to the DMO, as high levels of DK usage indicate to a marketer that there is a need to
increase the awareness of a destination’s performance on these salient attributes.
Additionally, it indicates that, given the lack of awareness, the performance of the
Moreton Bay Islands is not as well-known as other near-home destinations, and
should be further promoted (Pike, 2007d).
In regard to the free elicitation of destination decision sets, relative to the travel
contexts, participants listed the first destination they thought of, and then any others
they would consider. This was coded three times, firstly regarding the first choice,
and secondly in regard to any others they would consider. Finally, a combination of
their first choice and any others they would consider was created to encompass their
‘consideration set’. Based on the destination addressed in the questionnaire, coding
was conducted as either ‘0’, the respondent did not list the destination, or ‘1’ the
respondent listed the destination. For example, if a respondent undertook the
questionnaire asking about a short-break holiday at the Gold Coast, if they
mentioned the Gold Coast the response would be coded as a ‘1’. If they did not
mention the Gold Coast, the response would be coded as a ‘0’.
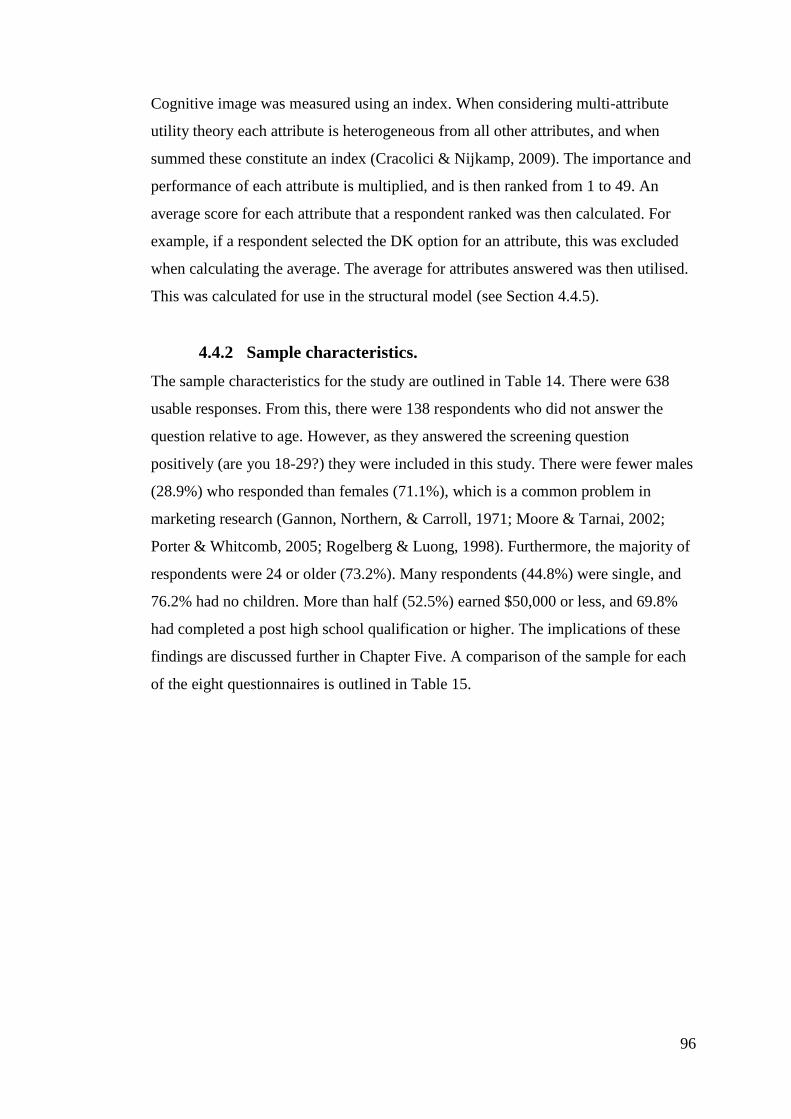
96
Cognitive image was measured using an index. When considering multi-attribute
utility theory each attribute is heterogeneous from all other attributes, and when
summed these constitute an index (Cracolici & Nijkamp, 2009). The importance and
performance of each attribute is multiplied, and is then ranked from 1 to 49. An
average score for each attribute that a respondent ranked was then calculated. For
example, if a respondent selected the DK option for an attribute, this was excluded
when calculating the average. The average for attributes answered was then utilised.
This was calculated for use in the structural model (see Section 4.4.5).
4.4.2 Sample characteristics.
The sample characteristics for the study are outlined in Table 14. There were 638
usable responses. From this, there were 138 respondents who did not answer the
question relative to age. However, as they answered the screening question
positively (are you 18-29?) they were included in this study. There were fewer males
(28.9%) who responded than females (71.1%), which is a common problem in
marketing research (Gannon, Northern, & Carroll, 1971; Moore & Tarnai, 2002;
Porter & Whitcomb, 2005; Rogelberg & Luong, 1998). Furthermore, the majority of
respondents were 24 or older (73.2%). Many respondents (44.8%) were single, and
76.2% had no children. More than half (52.5%) earned $50,000 or less, and 69.8%
had completed a post high school qualification or higher. The implications of these
findings are discussed further in Chapter Five. A comparison of the sample for each
of the eight questionnaires is outlined in Table 15.
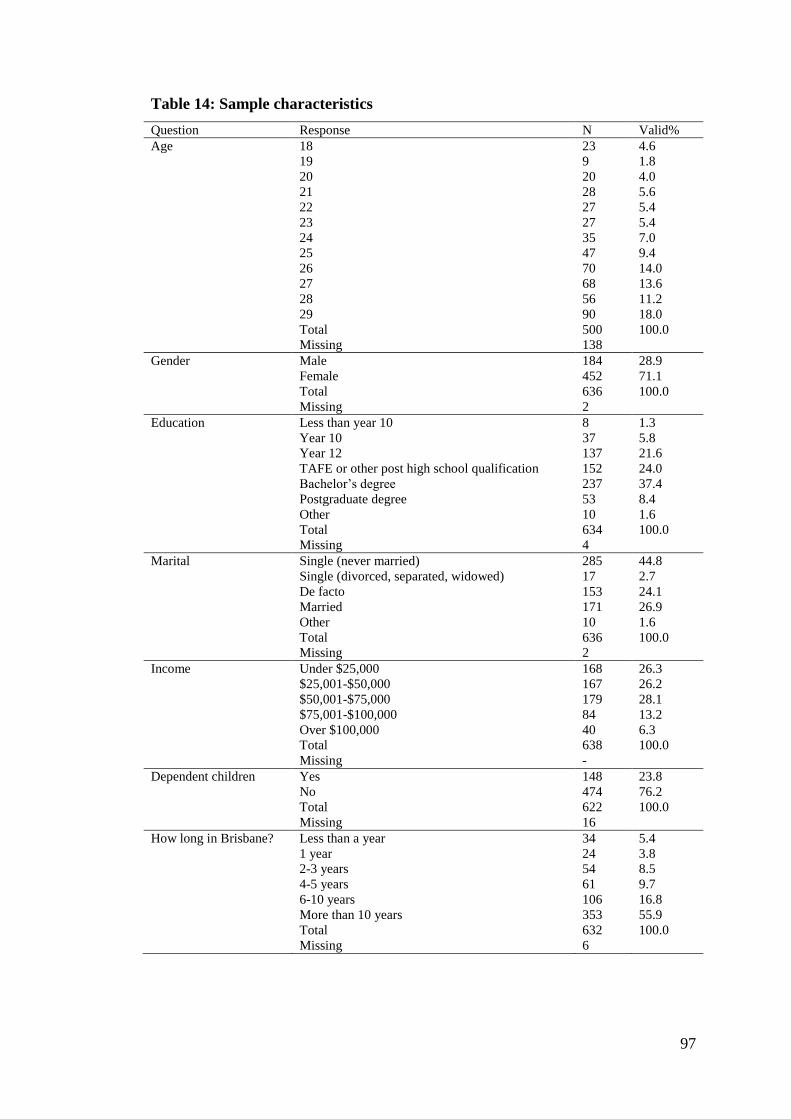
97
Table 14: Sample characteristics
Question Response N Valid%
Age 18 23 4.6
19 9 1.8
20 20 4.0
21 28 5.6
22 27 5.4
23 27 5.4
24 35 7.0
25 47 9.4
26 70 14.0
27 68 13.6
28 56 11.2
29 90 18.0
Total 500 100.0
Missing 138
Gender Male 184 28.9
Female 452 71.1
Total 636 100.0
Missing 2
Education Less than year 10 8 1.3
Year 10 37 5.8
Year 12 137 21.6
TAFE or other post high school qualification 152 24.0
Bachelor’s degree 237 37.4
Postgraduate degree 53 8.4
Other 10 1.6
Total 634 100.0
Missing 4
Marital Single (never married) 285 44.8
Single (divorced, separated, widowed) 17 2.7
De facto 153 24.1
Married 171 26.9
Other 10 1.6
Total 636 100.0
Missing 2
Income Under $25,000 168 26.3
$25,001-$50,000 167 26.2
$50,001-$75,000 179 28.1
$75,001-$100,000 84 13.2
Over $100,000 40 6.3
Total 638 100.0
Missing -
Dependent children Yes 148 23.8
No 474 76.2
Total 622 100.0
Missing 16
How long in Brisbane? Less than a year 34 5.4
1 year 24 3.8
2-3 years 54 8.5
4-5 years 61 9.7
6-10 years 106 16.8
More than 10 years 353 55.9
Total 632 100.0
Missing 6
98
Table 15: Sample characteristics for each questionnaire
GC-SB GC-LH MBI-SB MBI-LH SC-SB SC-LH NN-SB NN-LG
Characteristic Response N V% N V% N V% N V% N V% N V% N V% N V%
Age 18 6 8.3 2 2.7 0 0 3 5.5 5 5.3 4 5.8 2 5.0 1 2.3
19 1 1.4 1 1.4 1 1.9 1 1.8 2 2.1 2 2.9 0 0 1 2.3
20 3 4.2 3 4.1 1 1.9 3 5.5 3 3.2 4 5.8 1 2.5 2 4.7
21 5 6.9 4 5.4 3 5.7 1 1.8 8 8.5 3 4.3 1 2.5 3 7.0
22 5 6.9 2 2.7 3 5.7 1 1.8 10 10.6 1 1.4 1 2.5 4 9.3
23 5 6.9 4 5.4 3 5.7 3 5.5 5 5.3 3 4.3 2 5.0 2 4.7
24 2 2.8 5 6.8 4 7.5 2 3.6 14 14.9 3 4.3 4 10.0 1 2.3
25 11 15.3 8 10.8 8 15.1 5 9.1 4 4.3 6 8.7 2 5.0 3 7.0
26 11 15.3 7 9.5 5 9.4 9 16.4 9 9.6 13 18.8 7 17.5 9 20.9
27 10 13.9 11 14.9 10 18.9 9 16.4 9 9.6 11 15.9 4 10.0 4 9.3
28 4 5.6 9 12.2 3 5.7 7 12.7 12 12.8 8 11.6 5 12.5 8 18.6
29 9 12.5 18 24.3 12 22.6 11 20.0 13 13.8 11 15.9 11 27.5 5 11.6
Total 72 - 74 - 53 - 55 - 94 - 69 - 40 - 43 -
Missing 16 - 19 - 9 - 16 - 33 - 21 - 12 - 12 -
Gender Male 24 27.3 27 29.0 23 37.1 22 31.0 33 26.2 22 24.7 15 28.8 18 32.7
Female 64 72.7 66 71.0 39 62.9 49 69.0 93 73.8 67 75.3 37 71.2 37 67.3
Total 88 - 93 - 62 - 71 - 126 - 89 - 52 - 55 -
Missing - - - - - - - - 1 - 1 - - - - -
Education Less than year 10 0 0 0 0 1 1.6 1 1.4 1 .8 2 2.2 1 1.9 2 3.6
Year 10 5 5.7 5 5.4 3 4.9 2 2.9 11 8.7 6 6.7 0 0 5 9.1
Year 12 25 28.7 20 21.5 15 24.6 9 12.9 32 25.2 20 22.5 7 13.5 9 16.4
TAFE/post high school 16 18.4 20 21.5 10 16.4 22 31.4 35 27.6 22 24.7 15 28.8 12 21.8
Bachelor’s degree 34 39.1 34 36.6 27 44.3 28 40.0 39 30.7 31 34.8 20 38.5 24 43.6
Postgraduate degree 6 6.9 13 14.0 5 8.2 6 8.6 7 5.5 8 9.0 5 9.6 3 5.5
Other 1 1.1 1 1.1 0 0 2 2.9 2 1.6 0 0 4 7.7 0 0
Total 87 - 93 - 61 - 70 - 127 - 89 - 52 - 55 -
Missing 1 - - - 1 - 1 - - - 1 - - - - -
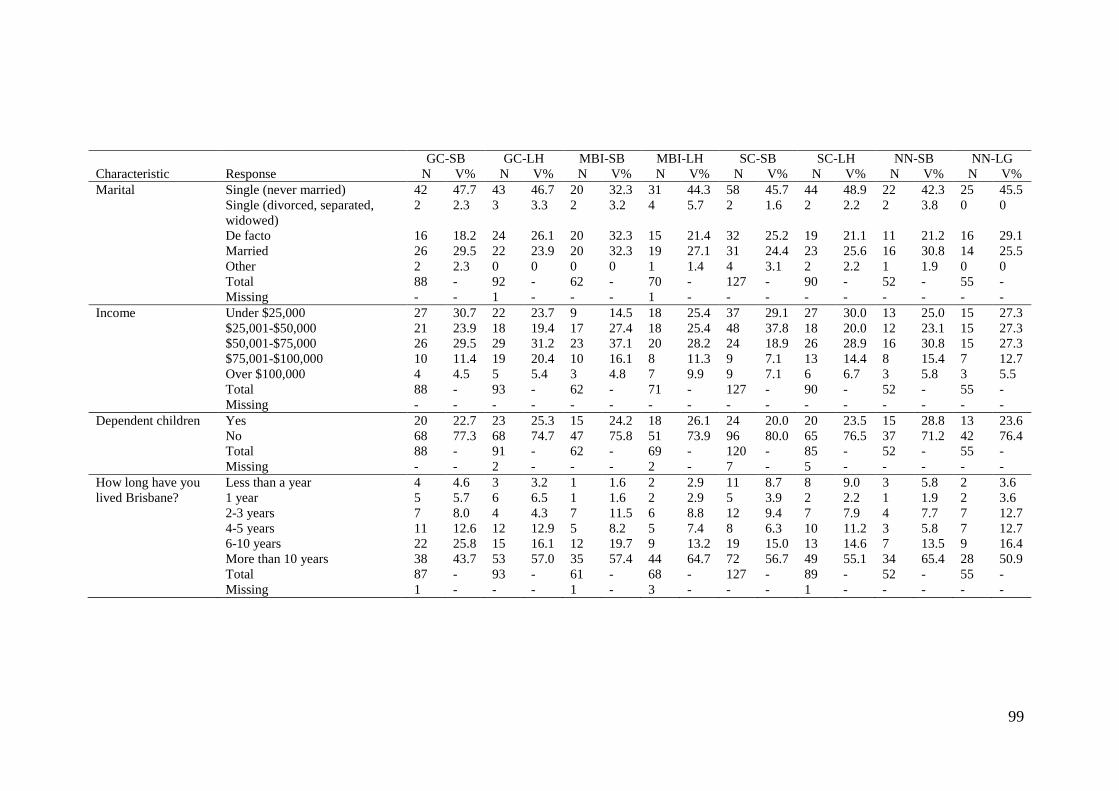
99
GC-SB GC-LH MBI-SB MBI-LH SC-SB SC-LH NN-SB NN-LG
Characteristic Response N V% N V% N V% N V% N V% N V% N V% N V%
Marital Single (never married) 42 47.7 43 46.7 20 32.3 31 44.3 58 45.7 44 48.9 22 42.3 25 45.5
Single (divorced, separated,
widowed)
2 2.3 3 3.3 2 3.2 4 5.7 2 1.6 2 2.2 2 3.8 0 0
De facto 16 18.2 24 26.1 20 32.3 15 21.4 32 25.2 19 21.1 11 21.2 16 29.1
Married 26 29.5 22 23.9 20 32.3 19 27.1 31 24.4 23 25.6 16 30.8 14 25.5
Other 2 2.3 0 0 0 0 1 1.4 4 3.1 2 2.2 1 1.9 0 0
Total 88 - 92 - 62 - 70 - 127 - 90 - 52 - 55 -
Missing - - 1 - - - 1 - - - - - - - - -
Income Under $25,000 27 30.7 22 23.7 9 14.5 18 25.4 37 29.1 27 30.0 13 25.0 15 27.3
$25,001-$50,000 21 23.9 18 19.4 17 27.4 18 25.4 48 37.8 18 20.0 12 23.1 15 27.3
$50,001-$75,000 26 29.5 29 31.2 23 37.1 20 28.2 24 18.9 26 28.9 16 30.8 15 27.3
$75,001-$100,000 10 11.4 19 20.4 10 16.1 8 11.3 9 7.1 13 14.4 8 15.4 7 12.7
Over $100,000 4 4.5 5 5.4 3 4.8 7 9.9 9 7.1 6 6.7 3 5.8 3 5.5
Total 88 - 93 - 62 - 71 - 127 - 90 - 52 - 55 -
Missing - - - - - - - - - - - - - - - -
Dependent children Yes 20 22.7 23 25.3 15 24.2 18 26.1 24 20.0 20 23.5 15 28.8 13 23.6
No 68 77.3 68 74.7 47 75.8 51 73.9 96 80.0 65 76.5 37 71.2 42 76.4
Total 88 - 91 - 62 - 69 - 120 - 85 - 52 - 55 -
Missing - - 2 - - - 2 - 7 - 5 - - - - -
How long have you Less than a year 4 4.6 3 3.2 1 1.6 2 2.9 11 8.7 8 9.0 3 5.8 2 3.6
lived Brisbane? 1 year 5 5.7 6 6.5 1 1.6 2 2.9 5 3.9 2 2.2 1 1.9 2 3.6
2-3 years 7 8.0 4 4.3 7 11.5 6 8.8 12 9.4 7 7.9 4 7.7 7 12.7
4-5 years 11 12.6 12 12.9 5 8.2 5 7.4 8 6.3 10 11.2 3 5.8 7 12.7
6-10 years 22 25.8 15 16.1 12 19.7 9 13.2 19 15.0 13 14.6 7 13.5 9 16.4
More than 10 years 38 43.7 53 57.0 35 57.4 44 64.7 72 56.7 49 55.1 34 65.4 28 50.9
Total 87 - 93 - 61 - 68 - 127 - 89 - 52 - 55 -
Missing 1 - - - 1 - 3 - - - 1 - - - - -
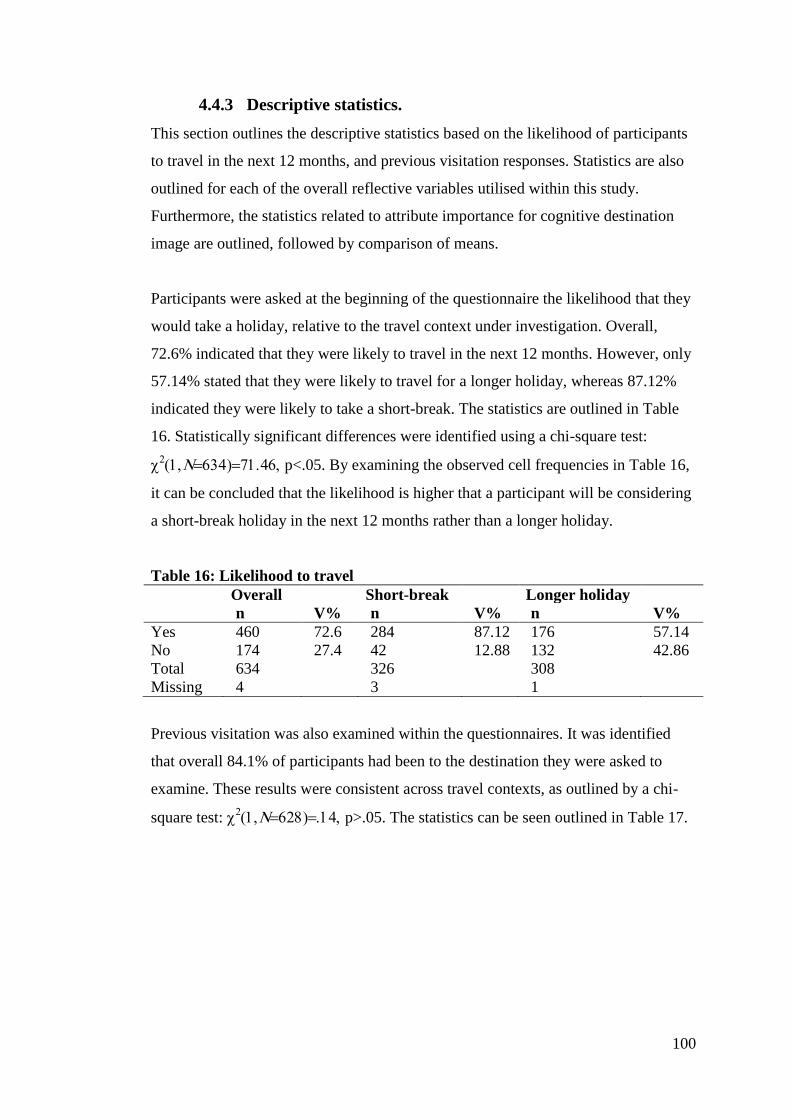
100
4.4.3 Descriptive statistics.
This section outlines the descriptive statistics based on the likelihood of participants
to travel in the next 12 months, and previous visitation responses. Statistics are also
outlined for each of the overall reflective variables utilised within this study.
Furthermore, the statistics related to attribute importance for cognitive destination
image are outlined, followed by comparison of means.
Participants were asked at the beginning of the questionnaire the likelihood that they
would take a holiday, relative to the travel context under investigation. Overall,
72.6% indicated that they were likely to travel in the next 12 months. However, only
57.14% stated that they were likely to travel for a longer holiday, whereas 87.12%
indicated they were likely to take a short-break. The statistics are outlined in Table
16. Statistically significant differences were identified using a chi-square test:
p<.05. By examining the observed cell frequencies in Table 16,
it can be concluded that the likelihood is higher that a participant will be considering
a short-break holiday in the next 12 months rather than a longer holiday.
Table 16: Likelihood to travel
Overall Short-break Longer holiday
n V% n V% n V%
Yes 460 72.6 284 87.12 176 57.14
No 174 27.4 42 12.88 132 42.86
Total 634 326 308
Missing 4 3 1
Previous visitation was also examined within the questionnaires. It was identified
that overall 84.1% of participants had been to the destination they were asked to
examine. These results were consistent across travel contexts, as outlined by a chi-
square test: p>.05. The statistics can be seen outlined in Table 17.
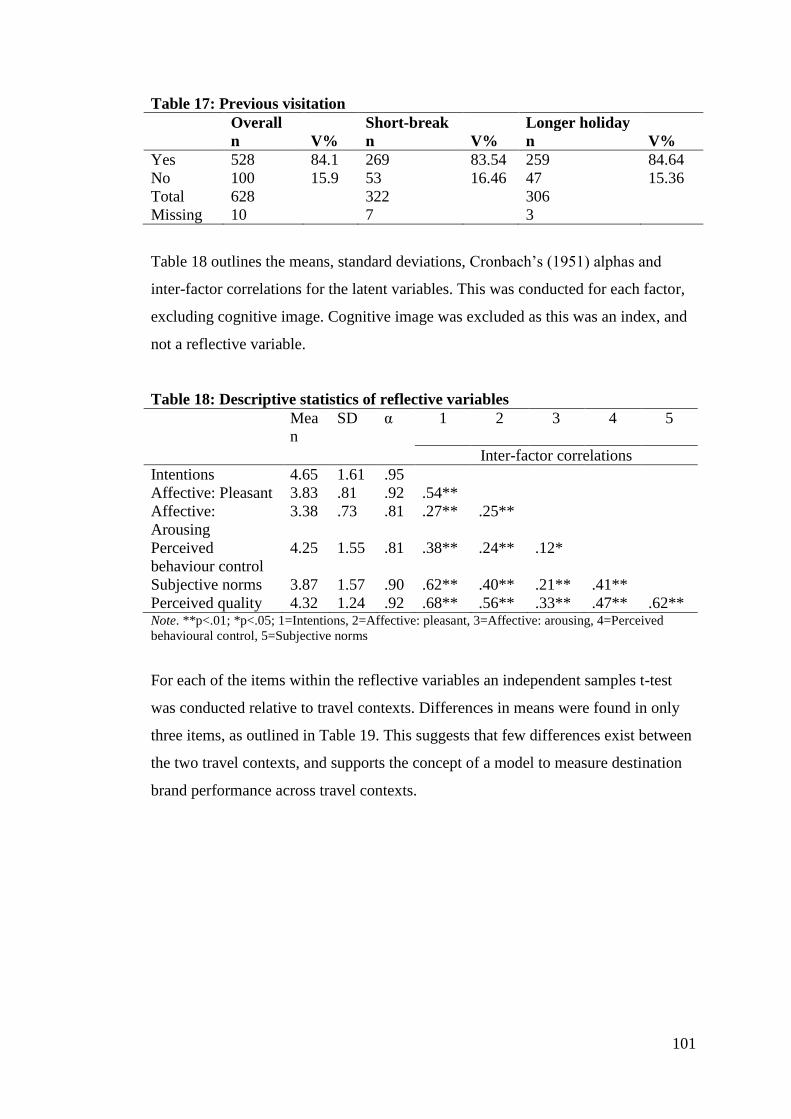
101
Table 17: Previous visitation
Overall Short-break Longer holiday
n V% n V% n V%
Yes 528 84.1 269 83.54 259 84.64
No 100 15.9 53 16.46 47 15.36
Total 628 322 306
Missing 10 7 3
Table 18 outlines the means, standard deviations, Cronbach’s (1951) alphas and
inter-factor correlations for the latent variables. This was conducted for each factor,
excluding cognitive image. Cognitive image was excluded as this was an index, and
not a reflective variable.
Table 18: Descriptive statistics of reflective variables
Mea
n
SD α 1 2 3 4 5
Inter-factor correlations
Intentions 4.65 1.61 .95
Affective: Pleasant 3.83 .81 .92 .54**
Affective:
Arousing
3.38 .73 .81 .27** .25**
Perceived
behaviour control
4.25 1.55 .81 .38** .24** .12*
Subjective norms 3.87 1.57 .90 .62** .40** .21** .41**
Perceived quality 4.32 1.24 .92 .68** .56** .33** .47** .62** Note. **p<.01; *p<.05; 1=Intentions, 2=Affective: pleasant, 3=Affective: arousing, 4=Perceived
behavioural control, 5=Subjective norms
For each of the items within the reflective variables an independent samples t-test
was conducted relative to travel contexts. Differences in means were found in only
three items, as outlined in Table 19. This suggests that few differences exist between
the two travel contexts, and supports the concept of a model to measure destination
brand performance across travel contexts.
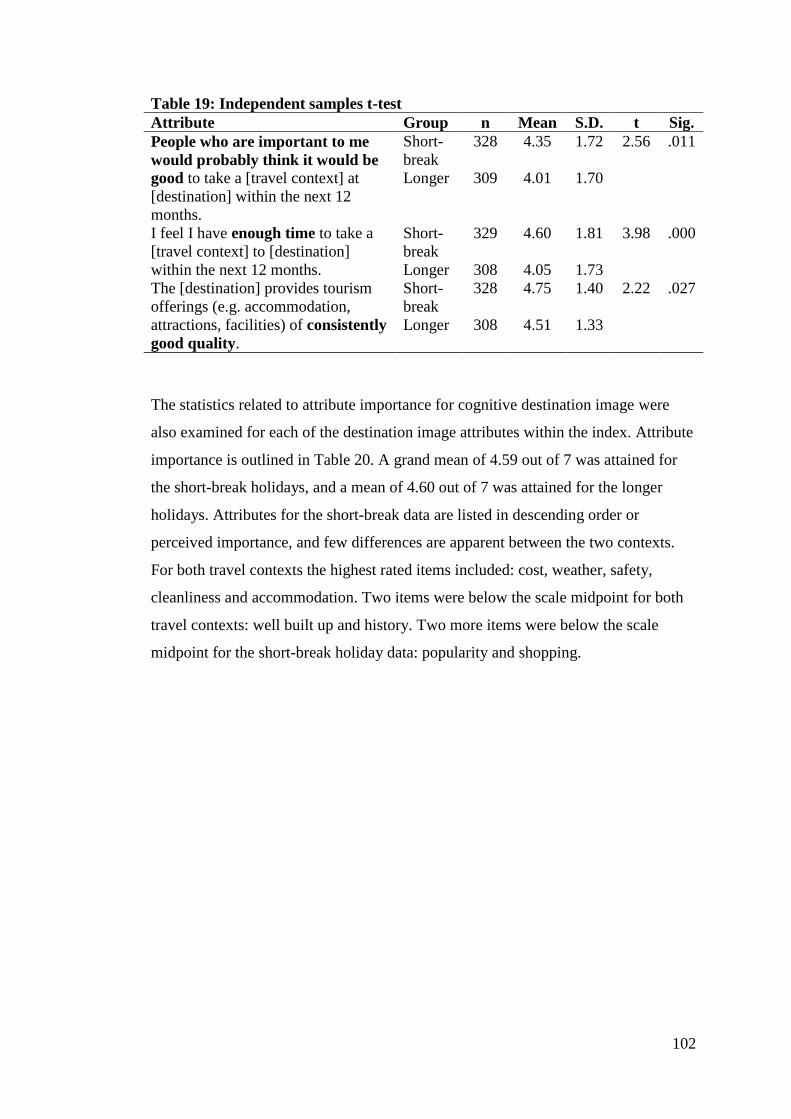
102
Table 19: Independent samples t-test
Attribute Group n Mean S.D. t Sig.
People who are important to me
would probably think it would be
good to take a [travel context] at
[destination] within the next 12
months.
Short-
break
328 4.35 1.72 2.56 .011
Longer 309 4.01 1.70
I feel I have enough time to take a
[travel context] to [destination]
within the next 12 months.
Short-
break
329 4.60 1.81 3.98 .000
Longer 308 4.05 1.73
The [destination] provides tourism
offerings (e.g. accommodation,
attractions, facilities) of consistently
good quality.
Short-
break
328 4.75 1.40 2.22 .027
Longer 308 4.51 1.33
The statistics related to attribute importance for cognitive destination image were
also examined for each of the destination image attributes within the index. Attribute
importance is outlined in Table 20. A grand mean of 4.59 out of 7 was attained for
the short-break holidays, and a mean of 4.60 out of 7 was attained for the longer
holidays. Attributes for the short-break data are listed in descending order or
perceived importance, and few differences are apparent between the two contexts.
For both travel contexts the highest rated items included: cost, weather, safety,
cleanliness and accommodation. Two items were below the scale midpoint for both
travel contexts: well built up and history. Two more items were below the scale
midpoint for the short-break holiday data: popularity and shopping.
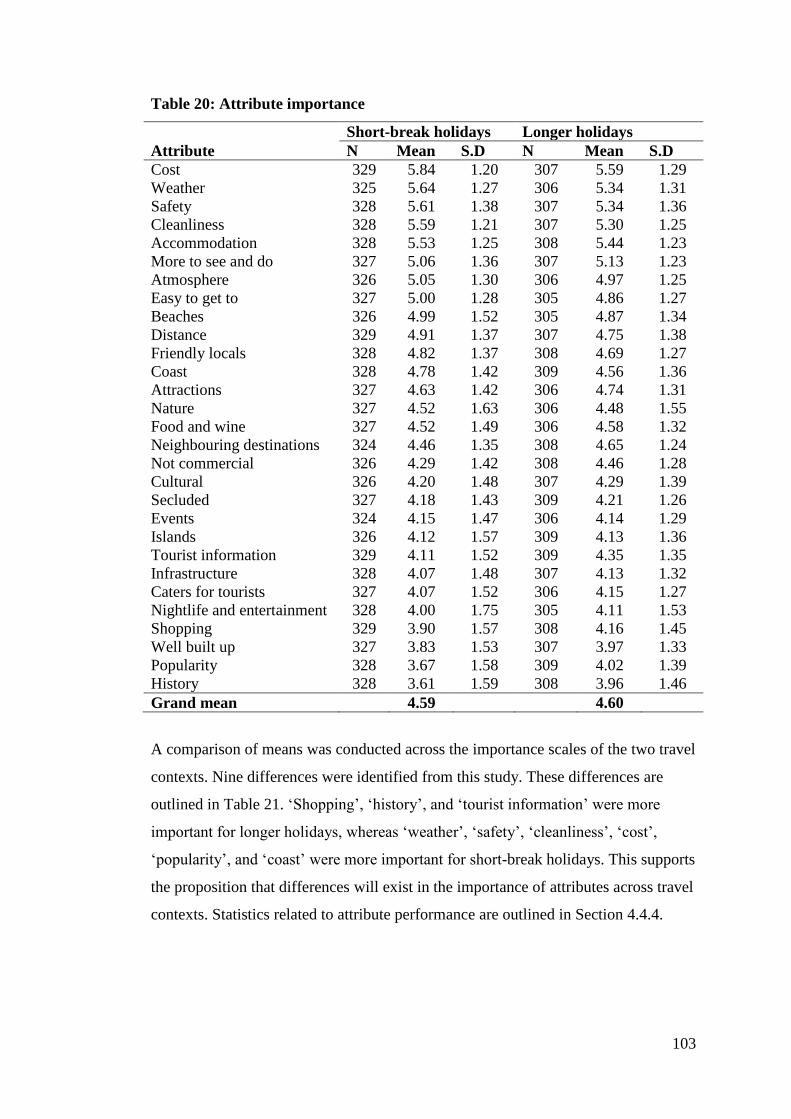
103
Table 20: Attribute importance
Short-break holidays Longer holidays
Attribute N Mean S.D N Mean S.D
Cost 329 5.84 1.20 307 5.59 1.29
Weather 325 5.64 1.27 306 5.34 1.31
Safety 328 5.61 1.38 307 5.34 1.36
Cleanliness 328 5.59 1.21 307 5.30 1.25
Accommodation 328 5.53 1.25 308 5.44 1.23
More to see and do 327 5.06 1.36 307 5.13 1.23
Atmosphere 326 5.05 1.30 306 4.97 1.25
Easy to get to 327 5.00 1.28 305 4.86 1.27
Beaches 326 4.99 1.52 305 4.87 1.34
Distance 329 4.91 1.37 307 4.75 1.38
Friendly locals 328 4.82 1.37 308 4.69 1.27
Coast 328 4.78 1.42 309 4.56 1.36
Attractions 327 4.63 1.42 306 4.74 1.31
Nature 327 4.52 1.63 306 4.48 1.55
Food and wine 327 4.52 1.49 306 4.58 1.32
Neighbouring destinations 324 4.46 1.35 308 4.65 1.24
Not commercial 326 4.29 1.42 308 4.46 1.28
Cultural 326 4.20 1.48 307 4.29 1.39
Secluded 327 4.18 1.43 309 4.21 1.26
Events 324 4.15 1.47 306 4.14 1.29
Islands 326 4.12 1.57 309 4.13 1.36
Tourist information 329 4.11 1.52 309 4.35 1.35
Infrastructure 328 4.07 1.48 307 4.13 1.32
Caters for tourists 327 4.07 1.52 306 4.15 1.27
Nightlife and entertainment 328 4.00 1.75 305 4.11 1.53
Shopping 329 3.90 1.57 308 4.16 1.45
Well built up 327 3.83 1.53 307 3.97 1.33
Popularity 328 3.67 1.58 309 4.02 1.39
History 328 3.61 1.59 308 3.96 1.46
Grand mean 4.59 4.60
A comparison of means was conducted across the importance scales of the two travel
contexts. Nine differences were identified from this study. These differences are
outlined in Table 21. ‘Shopping’, ‘history’, and ‘tourist information’ were more
important for longer holidays, whereas ‘weather’, ‘safety’, ‘cleanliness’, ‘cost’,
‘popularity’, and ‘coast’ were more important for short-break holidays. This supports
the proposition that differences will exist in the importance of attributes across travel
contexts. Statistics related to attribute performance are outlined in Section 4.4.4.
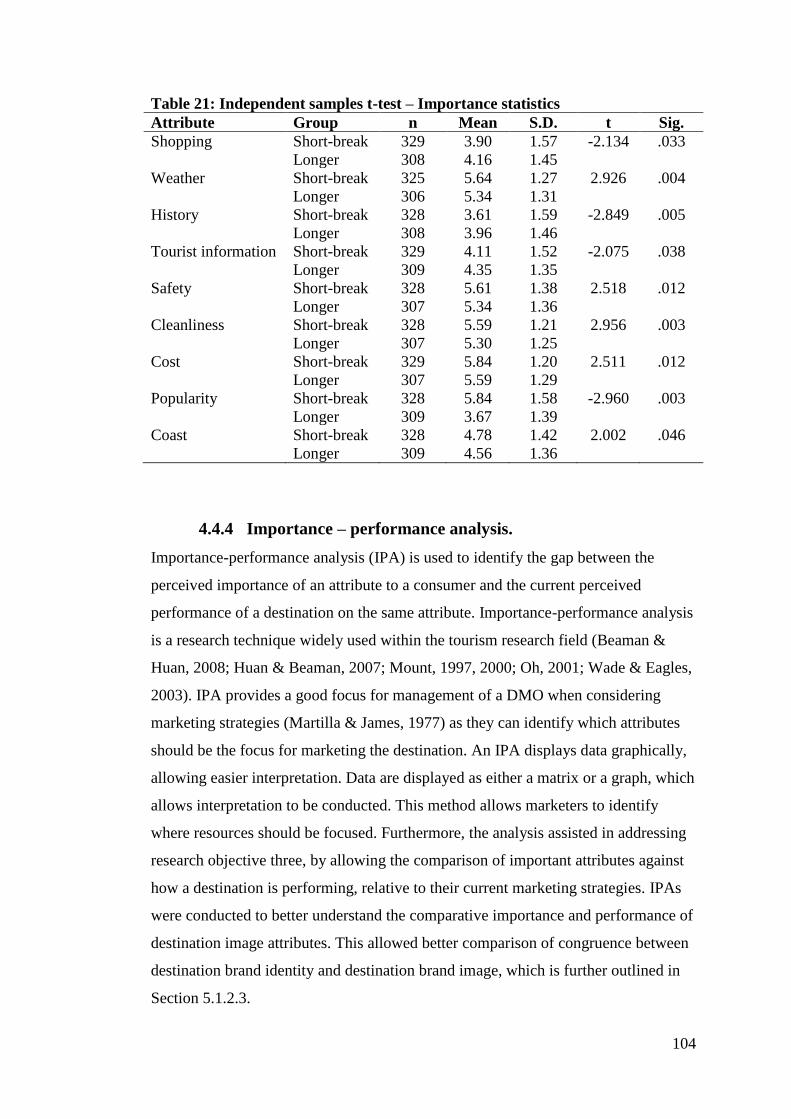
104
Table 21: Independent samples t-test – Importance statistics
Attribute Group n Mean S.D. t Sig.
Shopping Short-break 329 3.90 1.57 -2.134 .033
Longer 308 4.16 1.45
Weather Short-break 325 5.64 1.27 2.926 .004
Longer 306 5.34 1.31
History Short-break 328 3.61 1.59 -2.849 .005
Longer 308 3.96 1.46
Tourist information Short-break 329 4.11 1.52 -2.075 .038
Longer 309 4.35 1.35
Safety Short-break 328 5.61 1.38 2.518 .012
Longer 307 5.34 1.36
Cleanliness Short-break 328 5.59 1.21 2.956 .003
Longer 307 5.30 1.25
Cost Short-break 329 5.84 1.20 2.511 .012
Longer 307 5.59 1.29
Popularity Short-break 328 5.84 1.58 -2.960 .003
Longer 309 3.67 1.39
Coast Short-break 328 4.78 1.42 2.002 .046
Longer 309 4.56 1.36
4.4.4 Importance – performance analysis.
Importance-performance analysis (IPA) is used to identify the gap between the
perceived importance of an attribute to a consumer and the current perceived
performance of a destination on the same attribute. Importance-performance analysis
is a research technique widely used within the tourism research field (Beaman &
Huan, 2008; Huan & Beaman, 2007; Mount, 1997, 2000; Oh, 2001; Wade & Eagles,
2003). IPA provides a good focus for management of a DMO when considering
marketing strategies (Martilla & James, 1977) as they can identify which attributes
should be the focus for marketing the destination. An IPA displays data graphically,
allowing easier interpretation. Data are displayed as either a matrix or a graph, which
allows interpretation to be conducted. This method allows marketers to identify
where resources should be focused. Furthermore, the analysis assisted in addressing
research objective three, by allowing the comparison of important attributes against
how a destination is performing, relative to their current marketing strategies. IPAs
were conducted to better understand the comparative importance and performance of
destination image attributes. This allowed better comparison of congruence between
destination brand identity and destination brand image, which is further outlined in
Section 5.1.2.3.
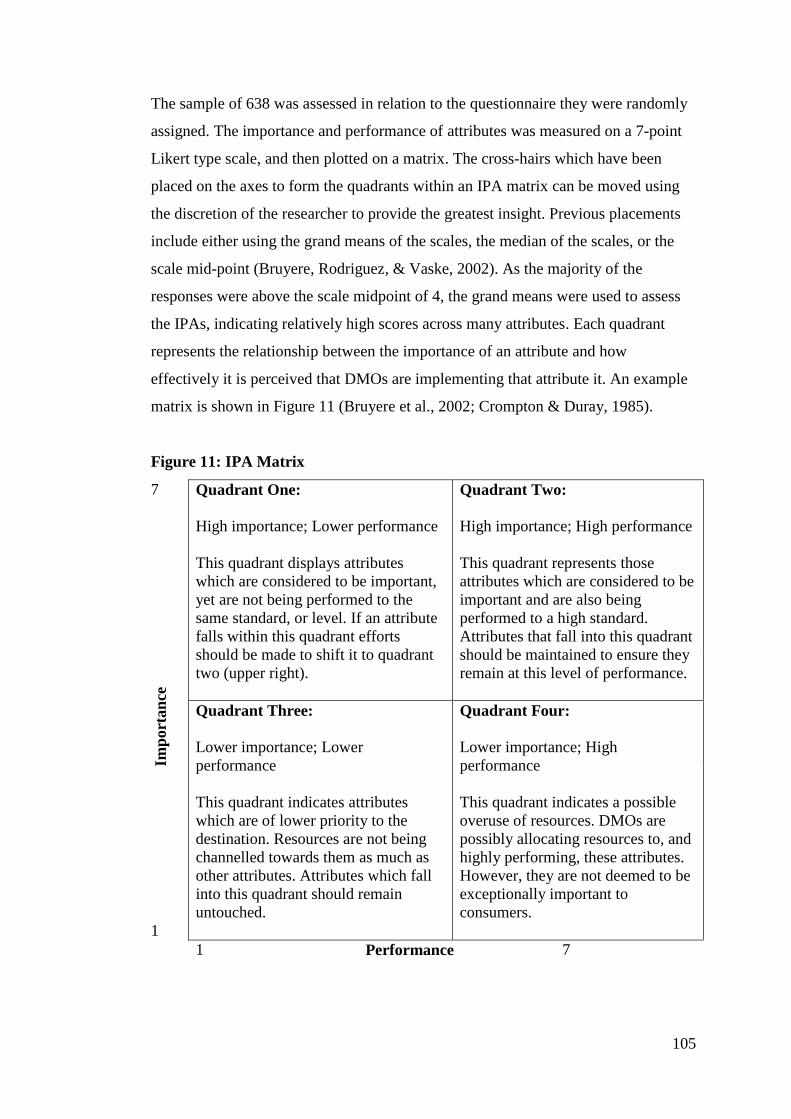
105
The sample of 638 was assessed in relation to the questionnaire they were randomly
assigned. The importance and performance of attributes was measured on a 7-point
Likert type scale, and then plotted on a matrix. The cross-hairs which have been
placed on the axes to form the quadrants within an IPA matrix can be moved using
the discretion of the researcher to provide the greatest insight. Previous placements
include either using the grand means of the scales, the median of the scales, or the
scale mid-point (Bruyere, Rodriguez, & Vaske, 2002). As the majority of the
responses were above the scale midpoint of 4, the grand means were used to assess
the IPAs, indicating relatively high scores across many attributes. Each quadrant
represents the relationship between the importance of an attribute and how
effectively it is perceived that DMOs are implementing that attribute it. An example
matrix is shown in Figure 11 (Bruyere et al., 2002; Crompton & Duray, 1985).
Figure 11: IPA Matrix
7 Quadrant One:
High importance; Lower performance
This quadrant displays attributes
which are considered to be important,
yet are not being performed to the
same standard, or level. If an attribute
falls within this quadrant efforts
should be made to shift it to quadrant
two (upper right).
Quadrant Two:
High importance; High performance
This quadrant represents those
attributes which are considered to be
important and are also being
performed to a high standard.
Attributes that fall into this quadrant
should be maintained to ensure they
remain at this level of performance.
Imp
ort
an
ce
Quadrant Three:
Lower importance; Lower
performance
This quadrant indicates attributes
which are of lower priority to the
destination. Resources are not being
channelled towards them as much as
other attributes. Attributes which fall
into this quadrant should remain
untouched.
Quadrant Four:
Lower importance; High
performance
This quadrant indicates a possible
overuse of resources. DMOs are
possibly allocating resources to, and
highly performing, these attributes.
However, they are not deemed to be
exceptionally important to
consumers.
1
1 Performance 7
106
The importance of each attribute was calculated for each travel context. The results
are outlined in Table 20 (see page 103). Independent samples t-tests were conducted
to identify any statistically significant differences between each of the travel contexts
(see Section 4.4.3).
The performance of each of the destinations was evaluated for each destination
image attribute. Performance refers to perception of the effectiveness that the
attribute is provided at the destination. To assess the IPAs the use of Figure 11 is
recommended. For example, if an attribute is located in Quadrant One (upper left),
this indicates that the attribute is important to consumers, but the destination is
perceived to be under-performing this attribute. Efforts should be made to shift this
attribute to Quadrant Two. Contrastingly, if an attribute is located in Quadrant Four
(lower right) it is perceived to be unimportant, even though the destination is
performing the attribute well. If an attribute is located in Quadrant Two (upper
right), it is well performed by an organisation, and also perceived to be important.
This attribute should become a focus of marketing strategies. Contrastingly, if an
attribute is located in Quadrant Three (lower left) it is perceived to be unimportant,
and underperformed. If an attribute falls into this category it should remain
untouched by the DMO.
4.4.4.1 Gold Coast – Performance.
IPAs were conducted for each of the travel contexts based on the data from the Gold
Coast questionnaires. The importance scores were utilised for the each context:
short-break (N= 329); longer holiday (N=309). Importance statistics are outlined in
Table 20 (see page 103). The performance statistics for a short-break holiday on the
Gold Coast are outlined in Table 22. This table outlines the sample size for each
attribute, mean of each attribute, standard deviation, and number of DK options
utilised. A grand mean is also provided. This refers to the average of all image
attributes means.
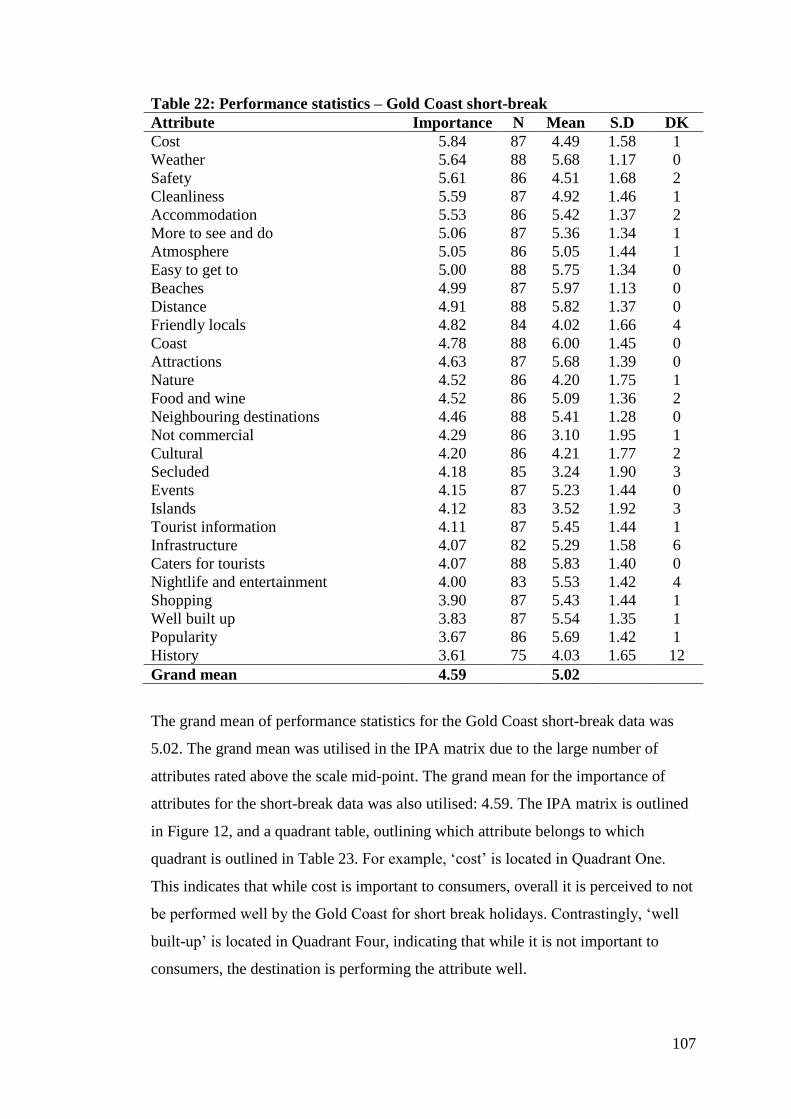
107
Table 22: Performance statistics – Gold Coast short-break
Attribute Importance N Mean S.D DK
Cost 5.84 87 4.49 1.58 1
Weather 5.64 88 5.68 1.17 0
Safety 5.61 86 4.51 1.68 2
Cleanliness 5.59 87 4.92 1.46 1
Accommodation 5.53 86 5.42 1.37 2
More to see and do 5.06 87 5.36 1.34 1
Atmosphere 5.05 86 5.05 1.44 1
Easy to get to 5.00 88 5.75 1.34 0
Beaches 4.99 87 5.97 1.13 0
Distance 4.91 88 5.82 1.37 0
Friendly locals 4.82 84 4.02 1.66 4
Coast 4.78 88 6.00 1.45 0
Attractions 4.63 87 5.68 1.39 0
Nature 4.52 86 4.20 1.75 1
Food and wine 4.52 86 5.09 1.36 2
Neighbouring destinations 4.46 88 5.41 1.28 0
Not commercial 4.29 86 3.10 1.95 1
Cultural 4.20 86 4.21 1.77 2
Secluded 4.18 85 3.24 1.90 3
Events 4.15 87 5.23 1.44 0
Islands 4.12 83 3.52 1.92 3
Tourist information 4.11 87 5.45 1.44 1
Infrastructure 4.07 82 5.29 1.58 6
Caters for tourists 4.07 88 5.83 1.40 0
Nightlife and entertainment 4.00 83 5.53 1.42 4
Shopping 3.90 87 5.43 1.44 1
Well built up 3.83 87 5.54 1.35 1
Popularity 3.67 86 5.69 1.42 1
History 3.61 75 4.03 1.65 12
Grand mean 4.59 5.02
The grand mean of performance statistics for the Gold Coast short-break data was
5.02. The grand mean was utilised in the IPA matrix due to the large number of
attributes rated above the scale mid-point. The grand mean for the importance of
attributes for the short-break data was also utilised: 4.59. The IPA matrix is outlined
in Figure 12, and a quadrant table, outlining which attribute belongs to which
quadrant is outlined in Table 23. For example, ‘cost’ is located in Quadrant One.
This indicates that while cost is important to consumers, overall it is perceived to not
be performed well by the Gold Coast for short break holidays. Contrastingly, ‘well
built-up’ is located in Quadrant Four, indicating that while it is not important to
consumers, the destination is performing the attribute well.
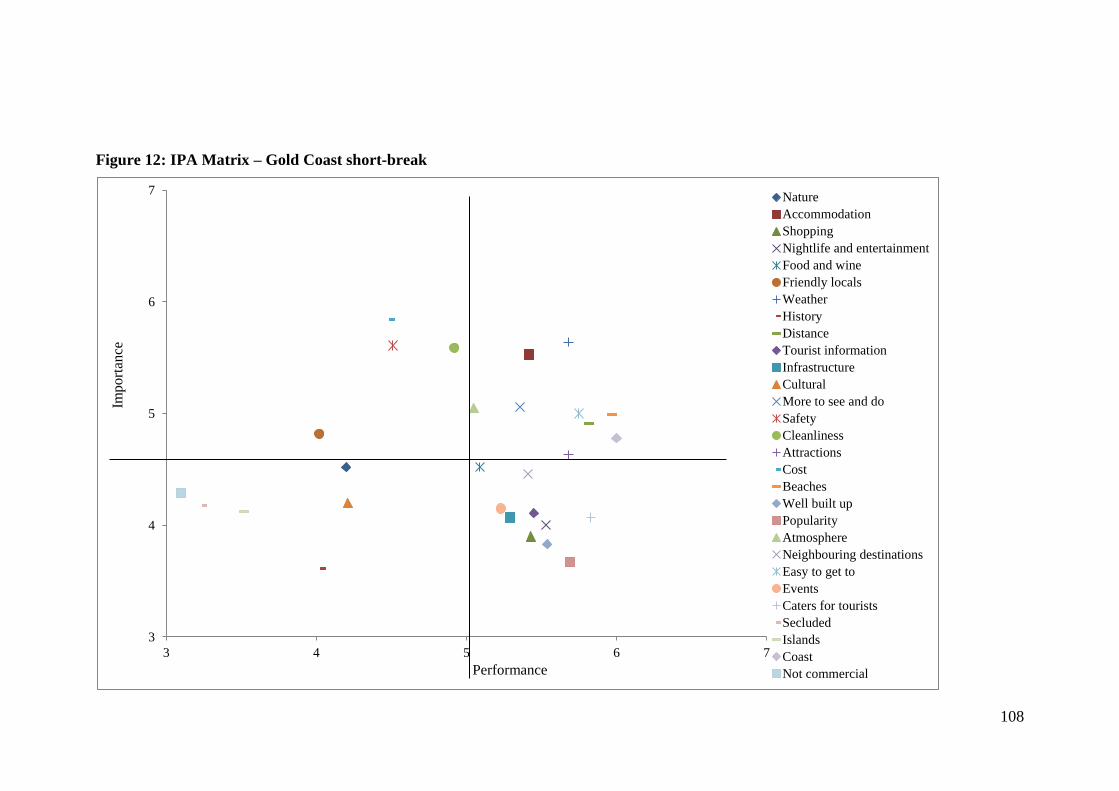
108
Figure 12: IPA Matrix – Gold Coast short-break
3
4
5
6
7
3 4 5 6 7
Nature
Accommodation
Shopping
Nightlife and entertainment
Food and wine
Friendly locals
Weather
History
Distance
Tourist information
Infrastructure
Cultural
More to see and do
Safety
Cleanliness
Attractions
Cost
Beaches
Well built up
Popularity
Atmosphere
Neighbouring destinations
Easy to get to
Events
Caters for tourists
Secluded
Islands
Coast
Not commercialPerformance
Imp
ort
ance
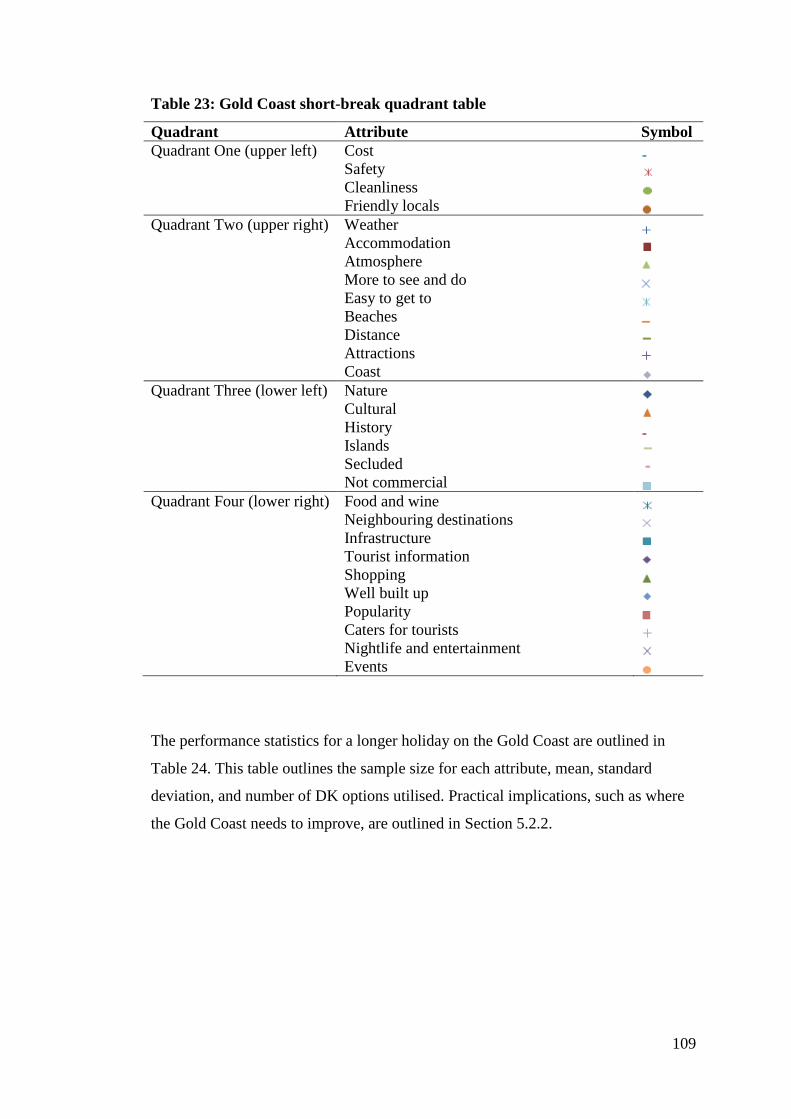
109
Table 23: Gold Coast short-break quadrant table
Quadrant Attribute Symbol
Quadrant One (upper left) Cost Safety Cleanliness Friendly locals Quadrant Two (upper right) Weather Accommodation Atmosphere More to see and do Easy to get to Beaches Distance Attractions Coast Quadrant Three (lower left) Nature Cultural History Islands Secluded Not commercial Quadrant Four (lower right) Food and wine Neighbouring destinations Infrastructure Tourist information Shopping Well built up Popularity Caters for tourists Nightlife and entertainment Events
The performance statistics for a longer holiday on the Gold Coast are outlined in
Table 24. This table outlines the sample size for each attribute, mean, standard
deviation, and number of DK options utilised. Practical implications, such as where
the Gold Coast needs to improve, are outlined in Section 5.2.2.
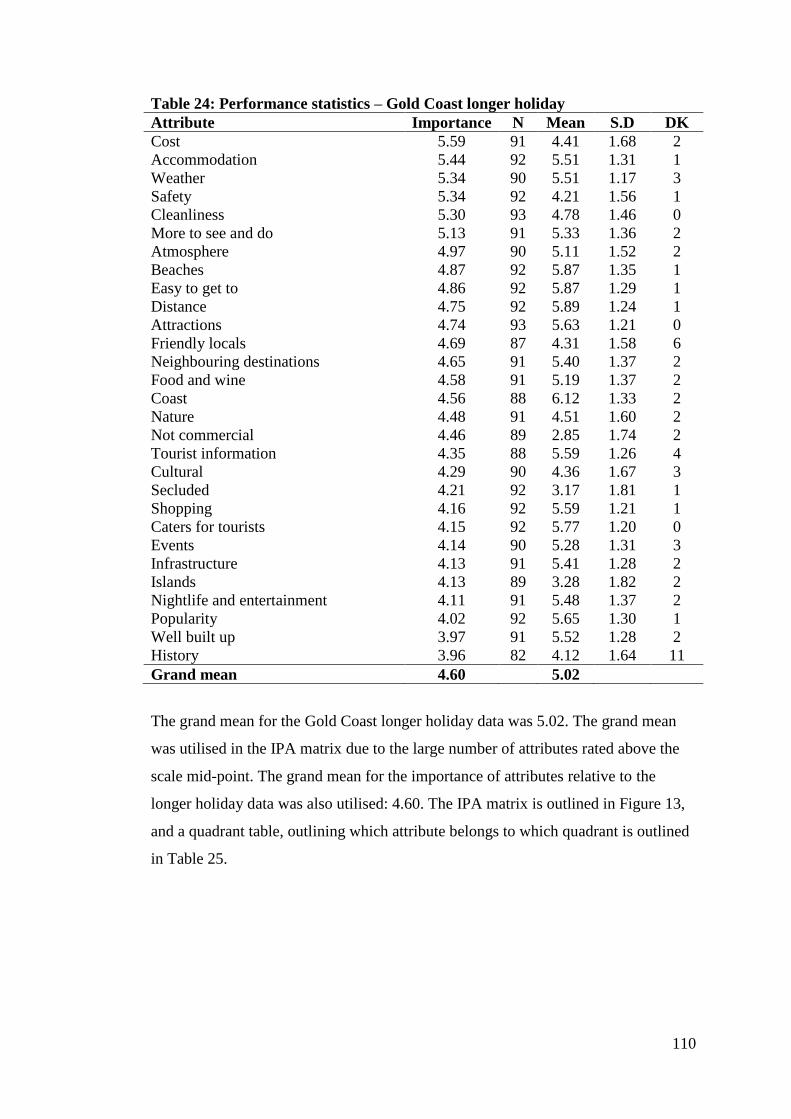
110
Table 24: Performance statistics – Gold Coast longer holiday
Attribute Importance N Mean S.D DK
Cost 5.59 91 4.41 1.68 2
Accommodation 5.44 92 5.51 1.31 1
Weather 5.34 90 5.51 1.17 3
Safety 5.34 92 4.21 1.56 1
Cleanliness 5.30 93 4.78 1.46 0
More to see and do 5.13 91 5.33 1.36 2
Atmosphere 4.97 90 5.11 1.52 2
Beaches 4.87 92 5.87 1.35 1
Easy to get to 4.86 92 5.87 1.29 1
Distance 4.75 92 5.89 1.24 1
Attractions 4.74 93 5.63 1.21 0
Friendly locals 4.69 87 4.31 1.58 6
Neighbouring destinations 4.65 91 5.40 1.37 2
Food and wine 4.58 91 5.19 1.37 2
Coast 4.56 88 6.12 1.33 2
Nature 4.48 91 4.51 1.60 2
Not commercial 4.46 89 2.85 1.74 2
Tourist information 4.35 88 5.59 1.26 4
Cultural 4.29 90 4.36 1.67 3
Secluded 4.21 92 3.17 1.81 1
Shopping 4.16 92 5.59 1.21 1
Caters for tourists 4.15 92 5.77 1.20 0
Events 4.14 90 5.28 1.31 3
Infrastructure 4.13 91 5.41 1.28 2
Islands 4.13 89 3.28 1.82 2
Nightlife and entertainment 4.11 91 5.48 1.37 2
Popularity 4.02 92 5.65 1.30 1
Well built up 3.97 91 5.52 1.28 2
History 3.96 82 4.12 1.64 11
Grand mean 4.60 5.02
The grand mean for the Gold Coast longer holiday data was 5.02. The grand mean
was utilised in the IPA matrix due to the large number of attributes rated above the
scale mid-point. The grand mean for the importance of attributes relative to the
longer holiday data was also utilised: 4.60. The IPA matrix is outlined in Figure 13,
and a quadrant table, outlining which attribute belongs to which quadrant is outlined
in Table 25.
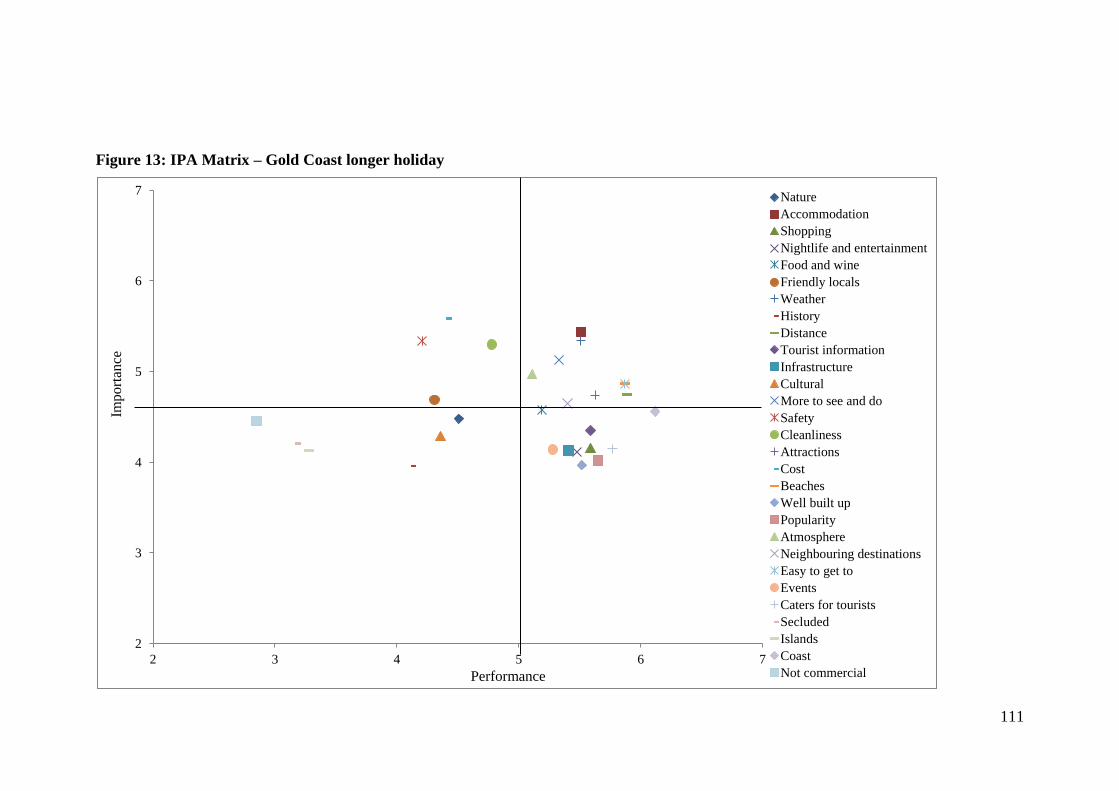
111
Figure 13: IPA Matrix – Gold Coast longer holiday
2
3
4
5
6
7
2 3 4 5 6 7
Nature
Accommodation
Shopping
Nightlife and entertainment
Food and wine
Friendly locals
Weather
History
Distance
Tourist information
Infrastructure
Cultural
More to see and do
Safety
Cleanliness
Attractions
Cost
Beaches
Well built up
Popularity
Atmosphere
Neighbouring destinations
Easy to get to
Events
Caters for tourists
Secluded
Islands
Coast
Not commercialPerformance
Import
ance
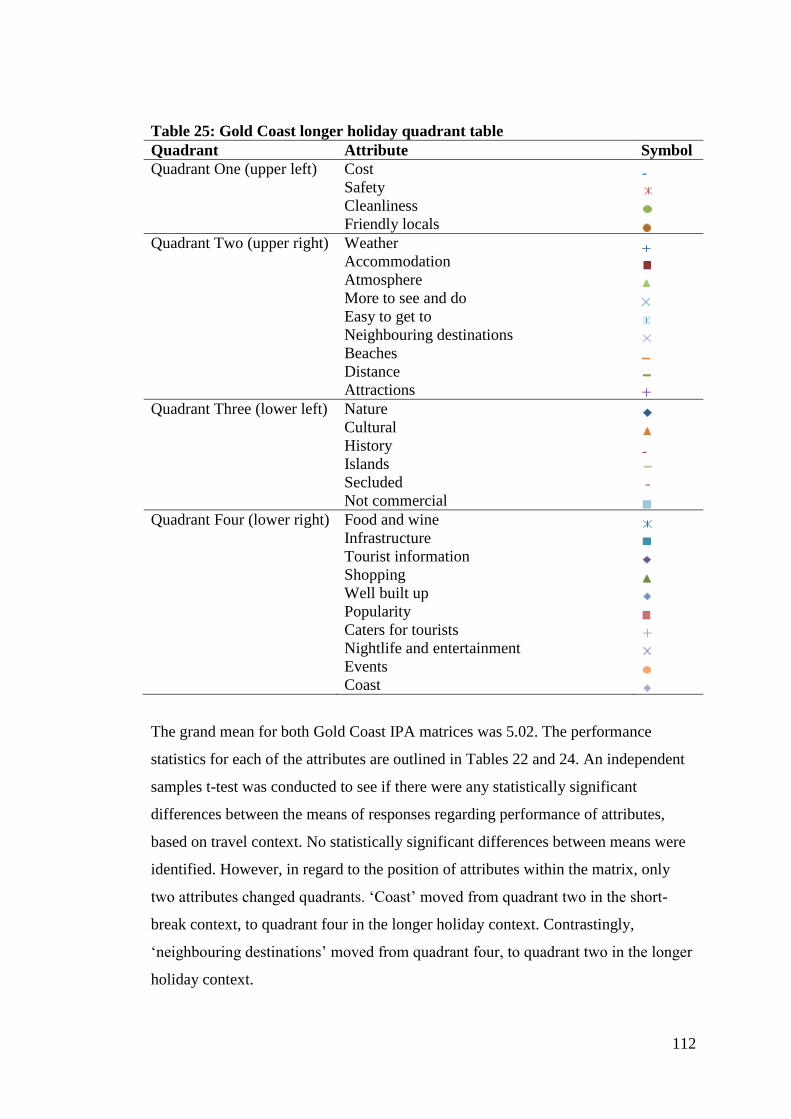
112
Table 25: Gold Coast longer holiday quadrant table
Quadrant Attribute Symbol
Quadrant One (upper left) Cost Safety Cleanliness Friendly locals Quadrant Two (upper right) Weather Accommodation Atmosphere More to see and do Easy to get to Neighbouring destinations Beaches Distance Attractions Quadrant Three (lower left) Nature Cultural History Islands Secluded Not commercial Quadrant Four (lower right) Food and wine Infrastructure Tourist information Shopping Well built up Popularity Caters for tourists Nightlife and entertainment Events Coast
The grand mean for both Gold Coast IPA matrices was 5.02. The performance
statistics for each of the attributes are outlined in Tables 22 and 24. An independent
samples t-test was conducted to see if there were any statistically significant
differences between the means of responses regarding performance of attributes,
based on travel context. No statistically significant differences between means were
identified. However, in regard to the position of attributes within the matrix, only
two attributes changed quadrants. ‘Coast’ moved from quadrant two in the short-
break context, to quadrant four in the longer holiday context. Contrastingly,
‘neighbouring destinations’ moved from quadrant four, to quadrant two in the longer
holiday context.
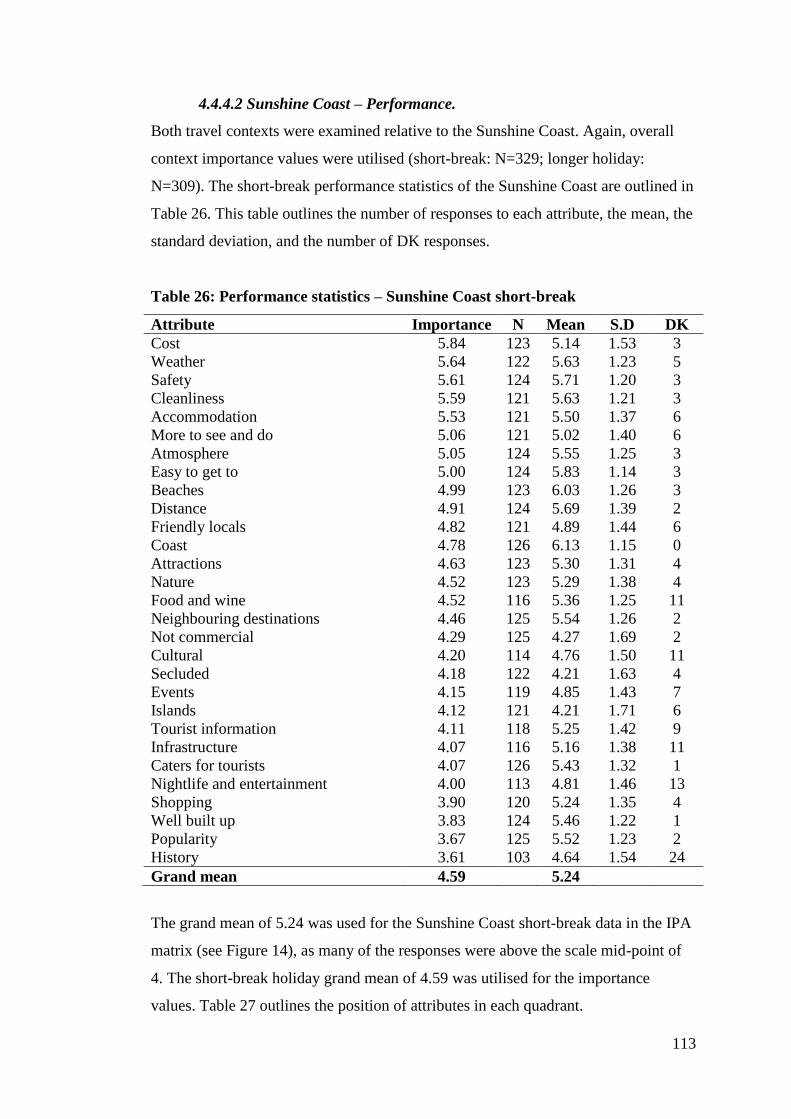
113
4.4.4.2 Sunshine Coast – Performance.
Both travel contexts were examined relative to the Sunshine Coast. Again, overall
context importance values were utilised (short-break: N=329; longer holiday:
N=309). The short-break performance statistics of the Sunshine Coast are outlined in
Table 26. This table outlines the number of responses to each attribute, the mean, the
standard deviation, and the number of DK responses.
Table 26: Performance statistics – Sunshine Coast short-break
Attribute Importance N Mean S.D DK
Cost 5.84 123 5.14 1.53 3
Weather 5.64 122 5.63 1.23 5
Safety 5.61 124 5.71 1.20 3
Cleanliness 5.59 121 5.63 1.21 3
Accommodation 5.53 121 5.50 1.37 6
More to see and do 5.06 121 5.02 1.40 6
Atmosphere 5.05 124 5.55 1.25 3
Easy to get to 5.00 124 5.83 1.14 3
Beaches 4.99 123 6.03 1.26 3
Distance 4.91 124 5.69 1.39 2
Friendly locals 4.82 121 4.89 1.44 6
Coast 4.78 126 6.13 1.15 0
Attractions 4.63 123 5.30 1.31 4
Nature 4.52 123 5.29 1.38 4
Food and wine 4.52 116 5.36 1.25 11
Neighbouring destinations 4.46 125 5.54 1.26 2
Not commercial 4.29 125 4.27 1.69 2
Cultural 4.20 114 4.76 1.50 11
Secluded 4.18 122 4.21 1.63 4
Events 4.15 119 4.85 1.43 7
Islands 4.12 121 4.21 1.71 6
Tourist information 4.11 118 5.25 1.42 9
Infrastructure 4.07 116 5.16 1.38 11
Caters for tourists 4.07 126 5.43 1.32 1
Nightlife and entertainment 4.00 113 4.81 1.46 13
Shopping 3.90 120 5.24 1.35 4
Well built up 3.83 124 5.46 1.22 1
Popularity 3.67 125 5.52 1.23 2
History 3.61 103 4.64 1.54 24
Grand mean 4.59 5.24
The grand mean of 5.24 was used for the Sunshine Coast short-break data in the IPA
matrix (see Figure 14), as many of the responses were above the scale mid-point of
4. The short-break holiday grand mean of 4.59 was utilised for the importance
values. Table 27 outlines the position of attributes in each quadrant.
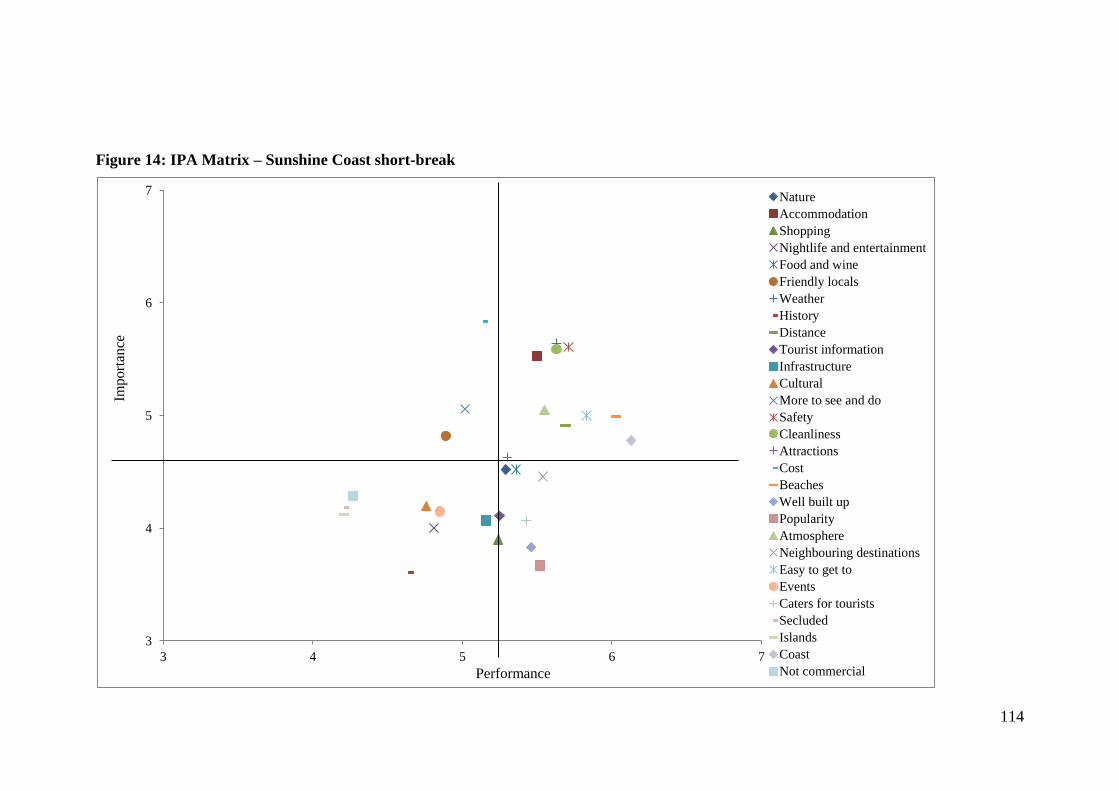
114
Figure 14: IPA Matrix – Sunshine Coast short-break
3
4
5
6
7
3 4 5 6 7
Nature
Accommodation
Shopping
Nightlife and entertainment
Food and wine
Friendly locals
Weather
History
Distance
Tourist information
Infrastructure
Cultural
More to see and do
Safety
Cleanliness
Attractions
Cost
Beaches
Well built up
Popularity
Atmosphere
Neighbouring destinations
Easy to get to
Events
Caters for tourists
Secluded
Islands
Coast
Not commercialPerformance
Import
ance
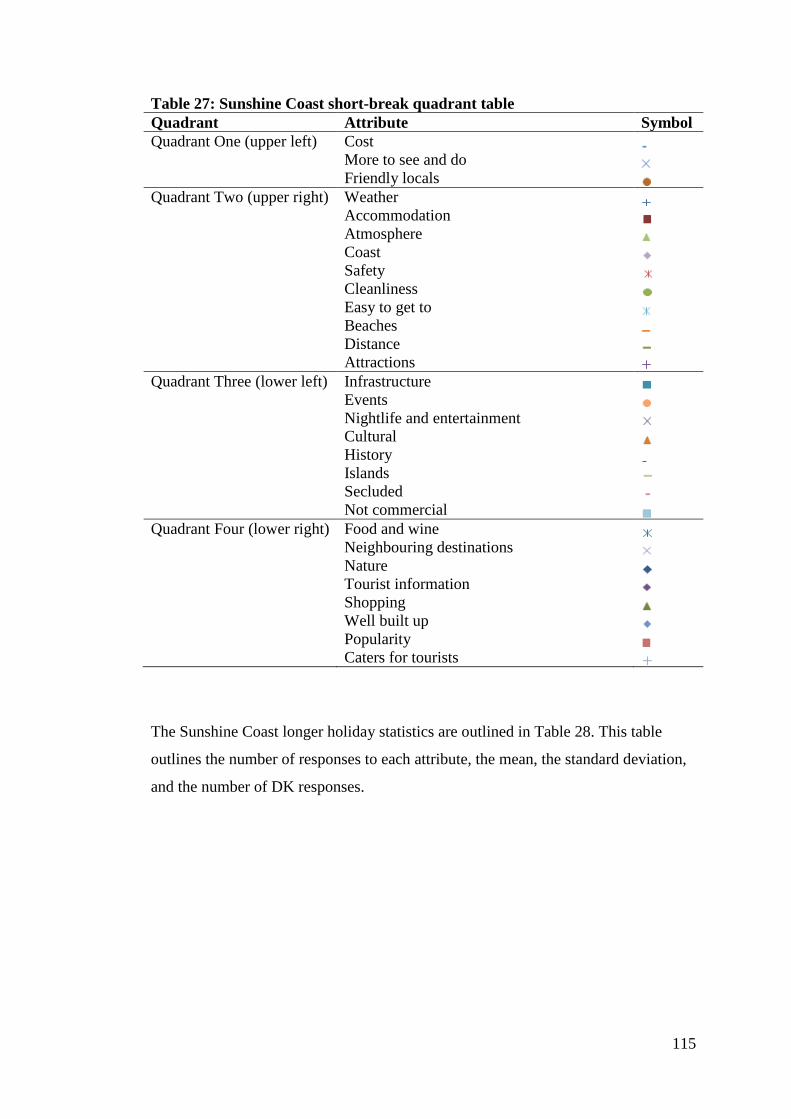
115
Table 27: Sunshine Coast short-break quadrant table
Quadrant Attribute Symbol
Quadrant One (upper left) Cost More to see and do Friendly locals Quadrant Two (upper right) Weather Accommodation Atmosphere Coast Safety Cleanliness Easy to get to Beaches Distance Attractions Quadrant Three (lower left) Infrastructure Events Nightlife and entertainment Cultural History Islands Secluded Not commercial Quadrant Four (lower right) Food and wine Neighbouring destinations Nature Tourist information Shopping Well built up Popularity Caters for tourists
The Sunshine Coast longer holiday statistics are outlined in Table 28. This table
outlines the number of responses to each attribute, the mean, the standard deviation,
and the number of DK responses.
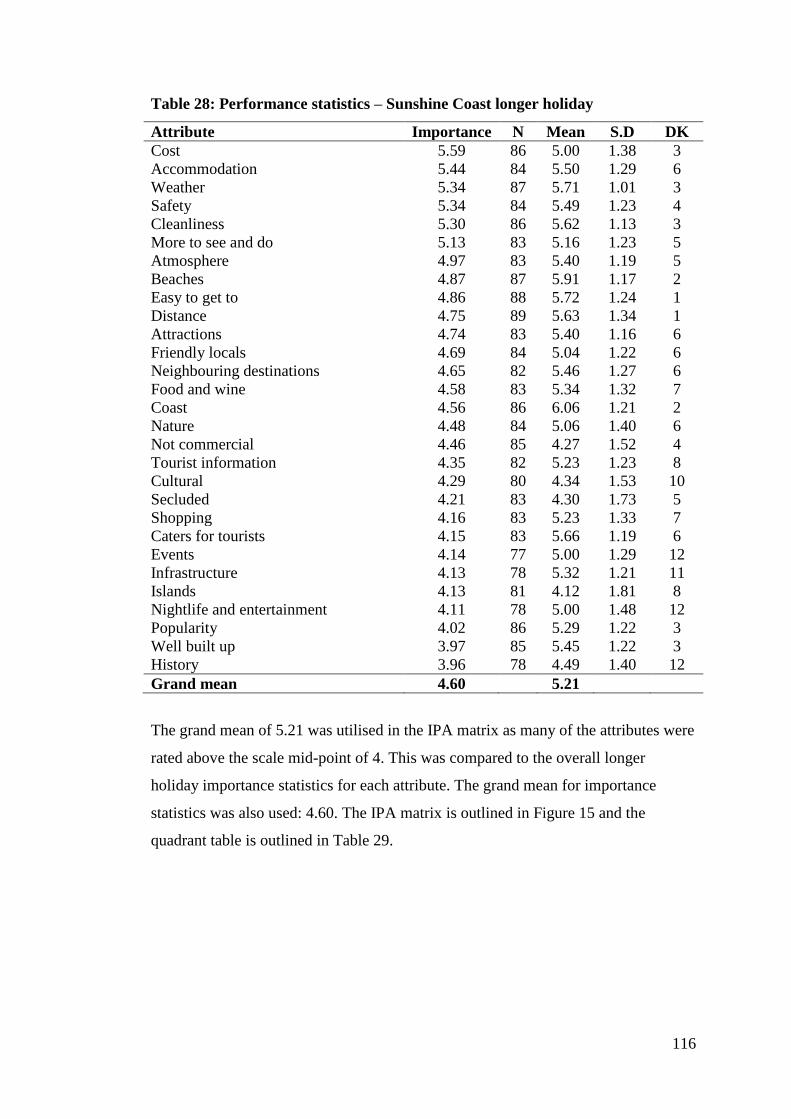
116
Table 28: Performance statistics – Sunshine Coast longer holiday
Attribute Importance N Mean S.D DK
Cost 5.59 86 5.00 1.38 3
Accommodation 5.44 84 5.50 1.29 6
Weather 5.34 87 5.71 1.01 3
Safety 5.34 84 5.49 1.23 4
Cleanliness 5.30 86 5.62 1.13 3
More to see and do 5.13 83 5.16 1.23 5
Atmosphere 4.97 83 5.40 1.19 5
Beaches 4.87 87 5.91 1.17 2
Easy to get to 4.86 88 5.72 1.24 1
Distance 4.75 89 5.63 1.34 1
Attractions 4.74 83 5.40 1.16 6
Friendly locals 4.69 84 5.04 1.22 6
Neighbouring destinations 4.65 82 5.46 1.27 6
Food and wine 4.58 83 5.34 1.32 7
Coast 4.56 86 6.06 1.21 2
Nature 4.48 84 5.06 1.40 6
Not commercial 4.46 85 4.27 1.52 4
Tourist information 4.35 82 5.23 1.23 8
Cultural 4.29 80 4.34 1.53 10
Secluded 4.21 83 4.30 1.73 5
Shopping 4.16 83 5.23 1.33 7
Caters for tourists 4.15 83 5.66 1.19 6
Events 4.14 77 5.00 1.29 12
Infrastructure 4.13 78 5.32 1.21 11
Islands 4.13 81 4.12 1.81 8
Nightlife and entertainment 4.11 78 5.00 1.48 12
Popularity 4.02 86 5.29 1.22 3
Well built up 3.97 85 5.45 1.22 3
History 3.96 78 4.49 1.40 12
Grand mean 4.60 5.21
The grand mean of 5.21 was utilised in the IPA matrix as many of the attributes were
rated above the scale mid-point of 4. This was compared to the overall longer
holiday importance statistics for each attribute. The grand mean for importance
statistics was also used: 4.60. The IPA matrix is outlined in Figure 15 and the
quadrant table is outlined in Table 29.
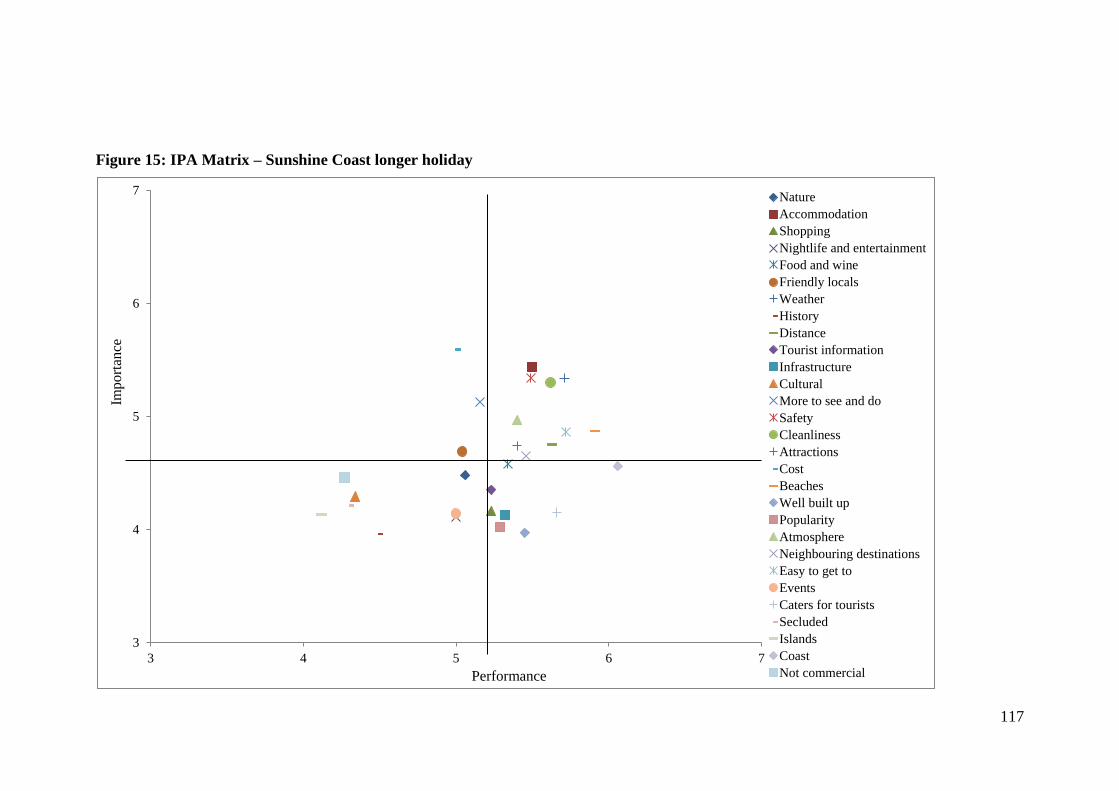
117
Figure 15: IPA Matrix – Sunshine Coast longer holiday
3
4
5
6
7
3 4 5 6 7
Nature
Accommodation
Shopping
Nightlife and entertainment
Food and wine
Friendly locals
Weather
History
Distance
Tourist information
Infrastructure
Cultural
More to see and do
Safety
Cleanliness
Attractions
Cost
Beaches
Well built up
Popularity
Atmosphere
Neighbouring destinations
Easy to get to
Events
Caters for tourists
Secluded
Islands
Coast
Not commercialPerformance
Import
ance
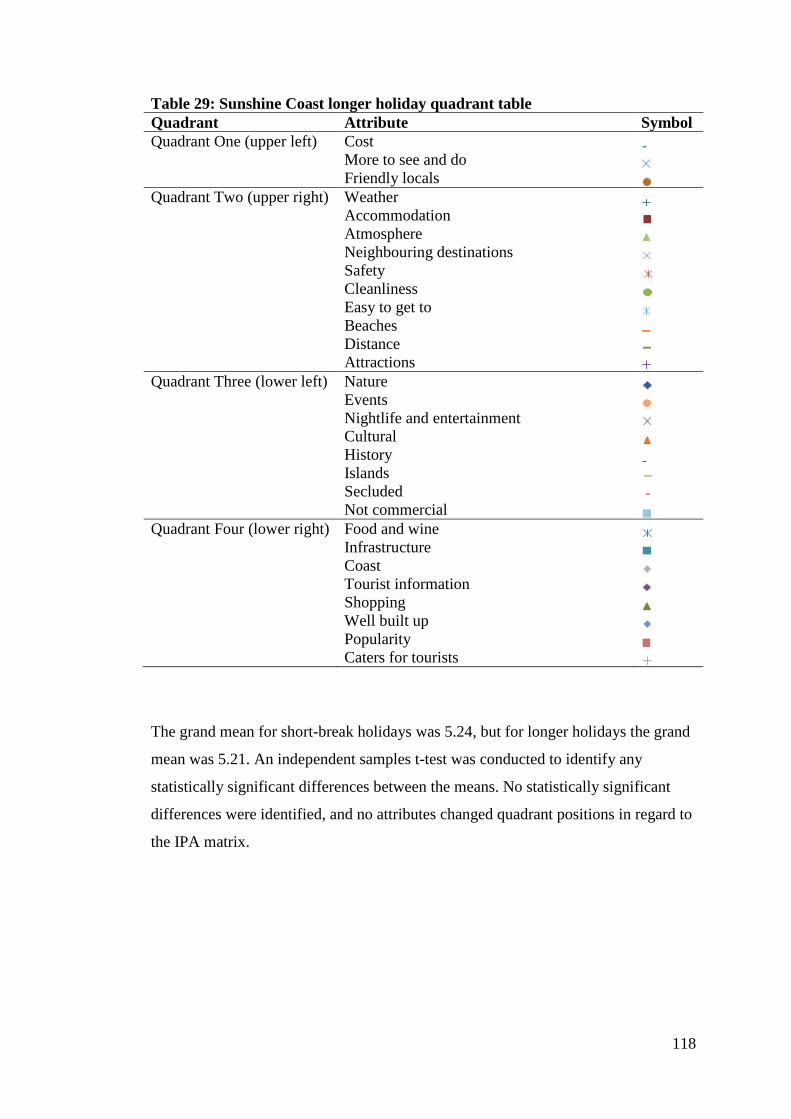
118
Table 29: Sunshine Coast longer holiday quadrant table
Quadrant Attribute Symbol
Quadrant One (upper left) Cost More to see and do Friendly locals Quadrant Two (upper right) Weather Accommodation Atmosphere Neighbouring destinations Safety Cleanliness Easy to get to Beaches Distance Attractions Quadrant Three (lower left) Nature Events Nightlife and entertainment Cultural History Islands Secluded Not commercial Quadrant Four (lower right) Food and wine Infrastructure Coast Tourist information Shopping Well built up Popularity Caters for tourists
The grand mean for short-break holidays was 5.24, but for longer holidays the grand
mean was 5.21. An independent samples t-test was conducted to identify any
statistically significant differences between the means. No statistically significant
differences were identified, and no attributes changed quadrant positions in regard to
the IPA matrix.
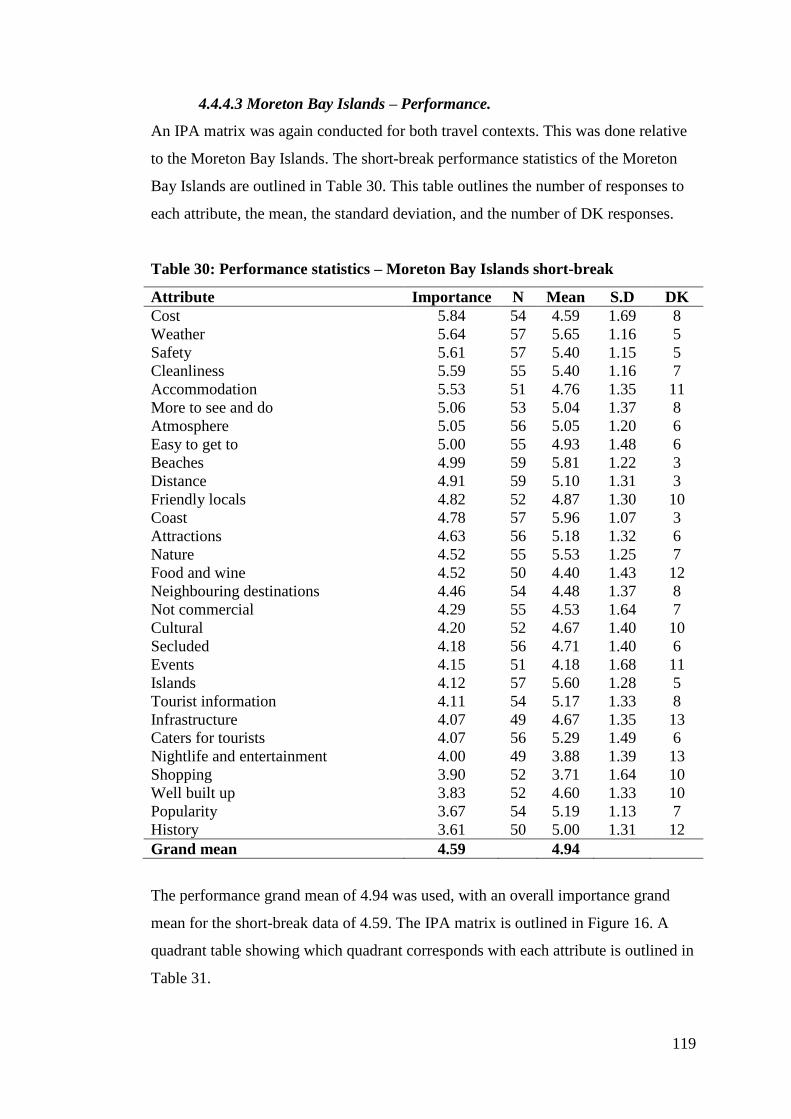
119
4.4.4.3 Moreton Bay Islands – Performance.
An IPA matrix was again conducted for both travel contexts. This was done relative
to the Moreton Bay Islands. The short-break performance statistics of the Moreton
Bay Islands are outlined in Table 30. This table outlines the number of responses to
each attribute, the mean, the standard deviation, and the number of DK responses.
Table 30: Performance statistics – Moreton Bay Islands short-break
Attribute Importance N Mean S.D DK
Cost 5.84 54 4.59 1.69 8
Weather 5.64 57 5.65 1.16 5
Safety 5.61 57 5.40 1.15 5
Cleanliness 5.59 55 5.40 1.16 7
Accommodation 5.53 51 4.76 1.35 11
More to see and do 5.06 53 5.04 1.37 8
Atmosphere 5.05 56 5.05 1.20 6
Easy to get to 5.00 55 4.93 1.48 6
Beaches 4.99 59 5.81 1.22 3
Distance 4.91 59 5.10 1.31 3
Friendly locals 4.82 52 4.87 1.30 10
Coast 4.78 57 5.96 1.07 3
Attractions 4.63 56 5.18 1.32 6
Nature 4.52 55 5.53 1.25 7
Food and wine 4.52 50 4.40 1.43 12
Neighbouring destinations 4.46 54 4.48 1.37 8
Not commercial 4.29 55 4.53 1.64 7
Cultural 4.20 52 4.67 1.40 10
Secluded 4.18 56 4.71 1.40 6
Events 4.15 51 4.18 1.68 11
Islands 4.12 57 5.60 1.28 5
Tourist information 4.11 54 5.17 1.33 8
Infrastructure 4.07 49 4.67 1.35 13
Caters for tourists 4.07 56 5.29 1.49 6
Nightlife and entertainment 4.00 49 3.88 1.39 13
Shopping 3.90 52 3.71 1.64 10
Well built up 3.83 52 4.60 1.33 10
Popularity 3.67 54 5.19 1.13 7
History 3.61 50 5.00 1.31 12
Grand mean 4.59 4.94
The performance grand mean of 4.94 was used, with an overall importance grand
mean for the short-break data of 4.59. The IPA matrix is outlined in Figure 16. A
quadrant table showing which quadrant corresponds with each attribute is outlined in
Table 31.
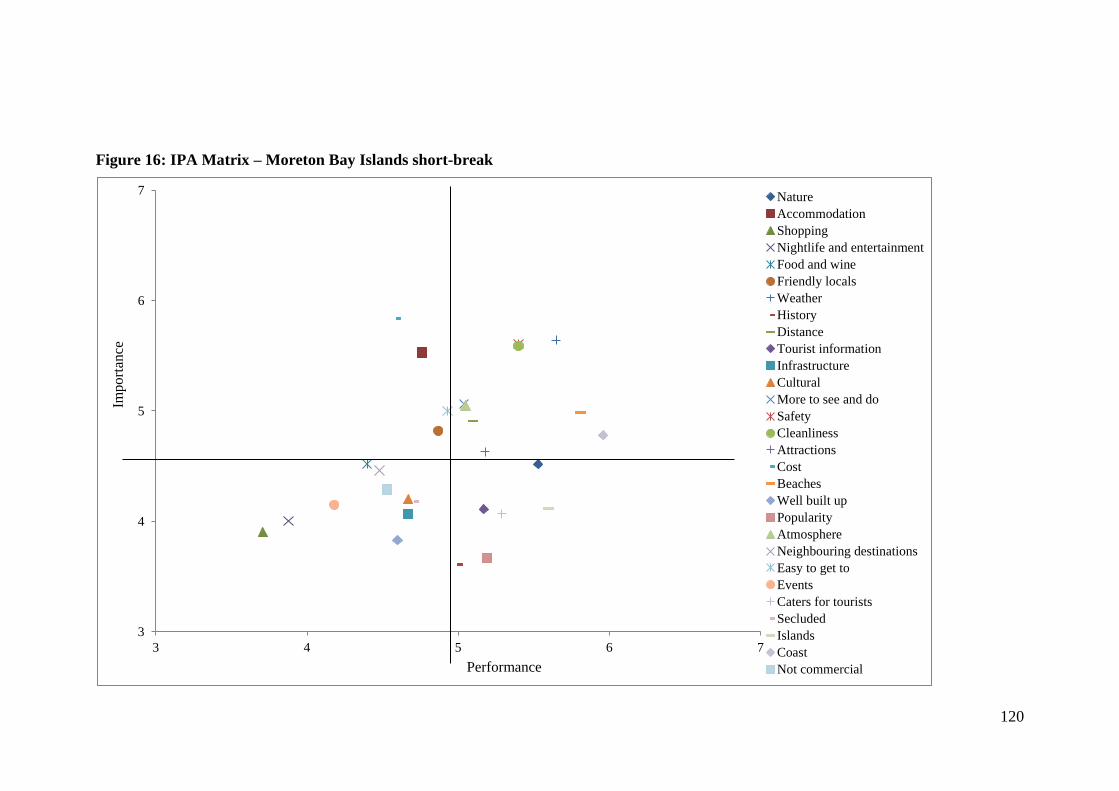
120
Figure 16: IPA Matrix – Moreton Bay Islands short-break
3
4
5
6
7
3 4 5 6 7
Nature
Accommodation
Shopping
Nightlife and entertainment
Food and wine
Friendly locals
Weather
History
Distance
Tourist information
Infrastructure
Cultural
More to see and do
Safety
Cleanliness
Attractions
Cost
Beaches
Well built up
Popularity
Atmosphere
Neighbouring destinations
Easy to get to
Events
Caters for tourists
Secluded
Islands
Coast
Not commercialPerformance
Impo
rtan
ce
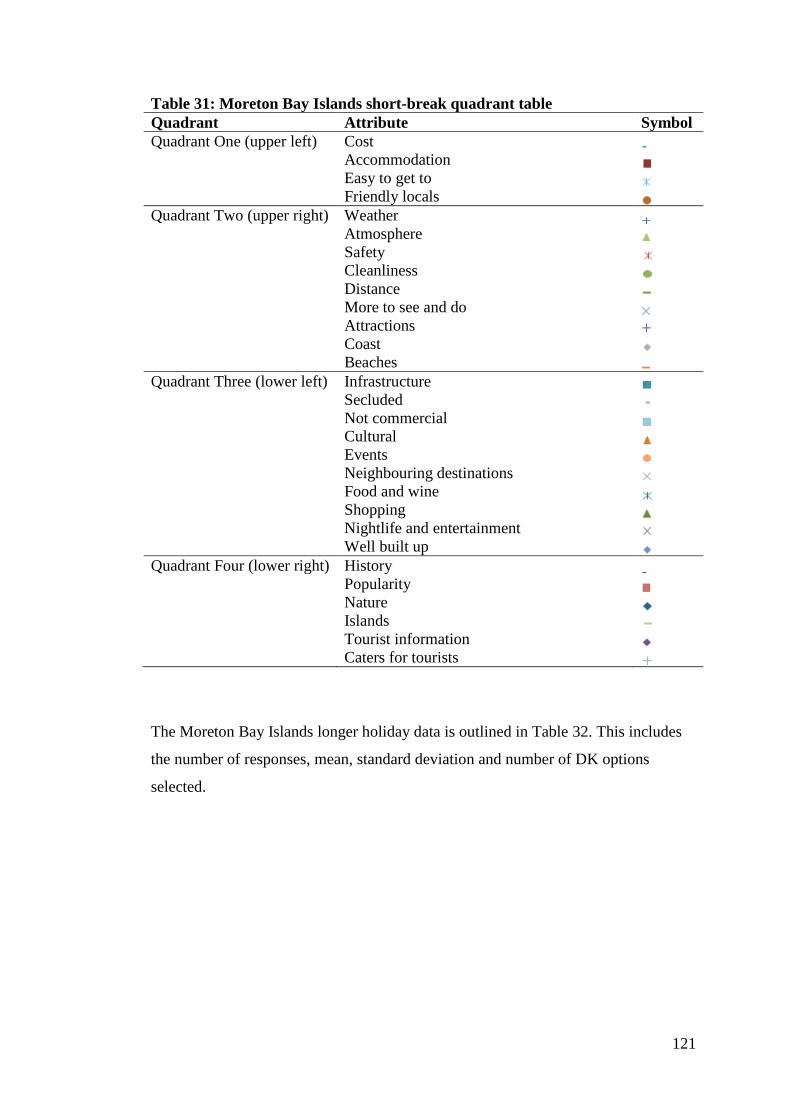
121
Table 31: Moreton Bay Islands short-break quadrant table
Quadrant Attribute Symbol
Quadrant One (upper left) Cost Accommodation Easy to get to Friendly locals Quadrant Two (upper right) Weather Atmosphere Safety Cleanliness Distance More to see and do Attractions Coast Beaches Quadrant Three (lower left) Infrastructure Secluded Not commercial Cultural Events Neighbouring destinations Food and wine Shopping Nightlife and entertainment Well built up Quadrant Four (lower right) History Popularity Nature Islands Tourist information Caters for tourists
The Moreton Bay Islands longer holiday data is outlined in Table 32. This includes
the number of responses, mean, standard deviation and number of DK options
selected.
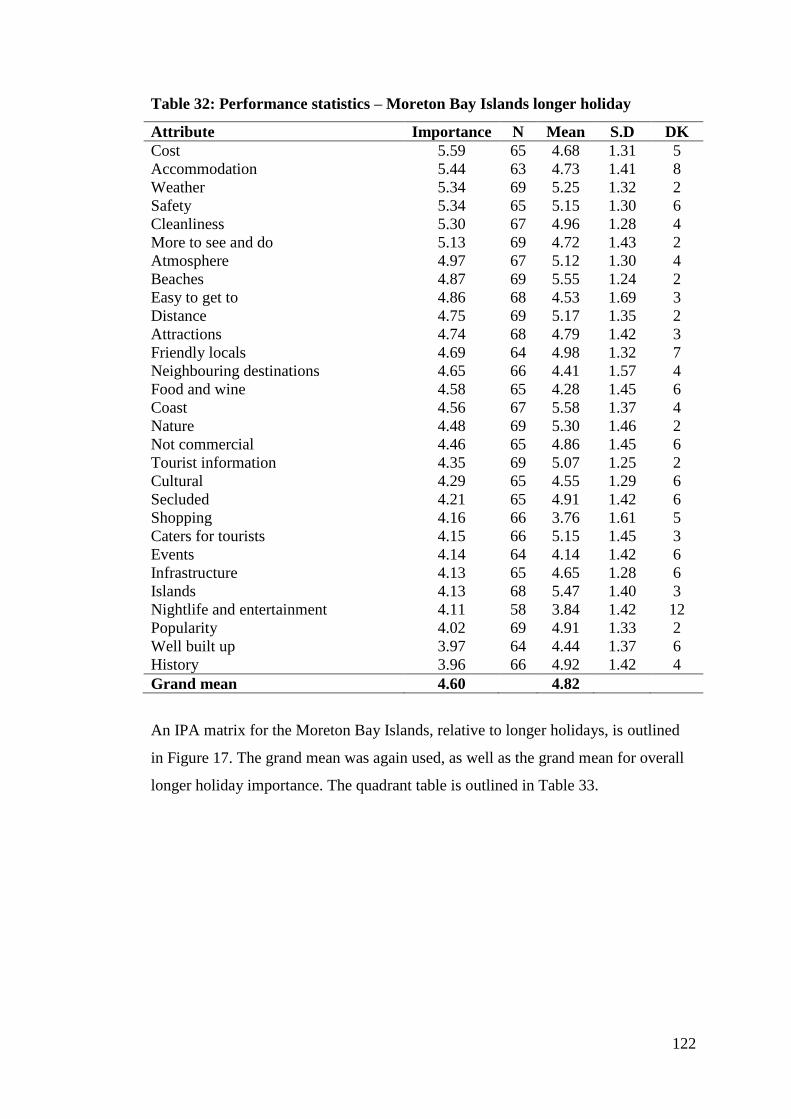
122
Table 32: Performance statistics – Moreton Bay Islands longer holiday
Attribute Importance N Mean S.D DK
Cost 5.59 65 4.68 1.31 5
Accommodation 5.44 63 4.73 1.41 8
Weather 5.34 69 5.25 1.32 2
Safety 5.34 65 5.15 1.30 6
Cleanliness 5.30 67 4.96 1.28 4
More to see and do 5.13 69 4.72 1.43 2
Atmosphere 4.97 67 5.12 1.30 4
Beaches 4.87 69 5.55 1.24 2
Easy to get to 4.86 68 4.53 1.69 3
Distance 4.75 69 5.17 1.35 2
Attractions 4.74 68 4.79 1.42 3
Friendly locals 4.69 64 4.98 1.32 7
Neighbouring destinations 4.65 66 4.41 1.57 4
Food and wine 4.58 65 4.28 1.45 6
Coast 4.56 67 5.58 1.37 4
Nature 4.48 69 5.30 1.46 2
Not commercial 4.46 65 4.86 1.45 6
Tourist information 4.35 69 5.07 1.25 2
Cultural 4.29 65 4.55 1.29 6
Secluded 4.21 65 4.91 1.42 6
Shopping 4.16 66 3.76 1.61 5
Caters for tourists 4.15 66 5.15 1.45 3
Events 4.14 64 4.14 1.42 6
Infrastructure 4.13 65 4.65 1.28 6
Islands 4.13 68 5.47 1.40 3
Nightlife and entertainment 4.11 58 3.84 1.42 12
Popularity 4.02 69 4.91 1.33 2
Well built up 3.97 64 4.44 1.37 6
History 3.96 66 4.92 1.42 4
Grand mean 4.60 4.82
An IPA matrix for the Moreton Bay Islands, relative to longer holidays, is outlined
in Figure 17. The grand mean was again used, as well as the grand mean for overall
longer holiday importance. The quadrant table is outlined in Table 33.
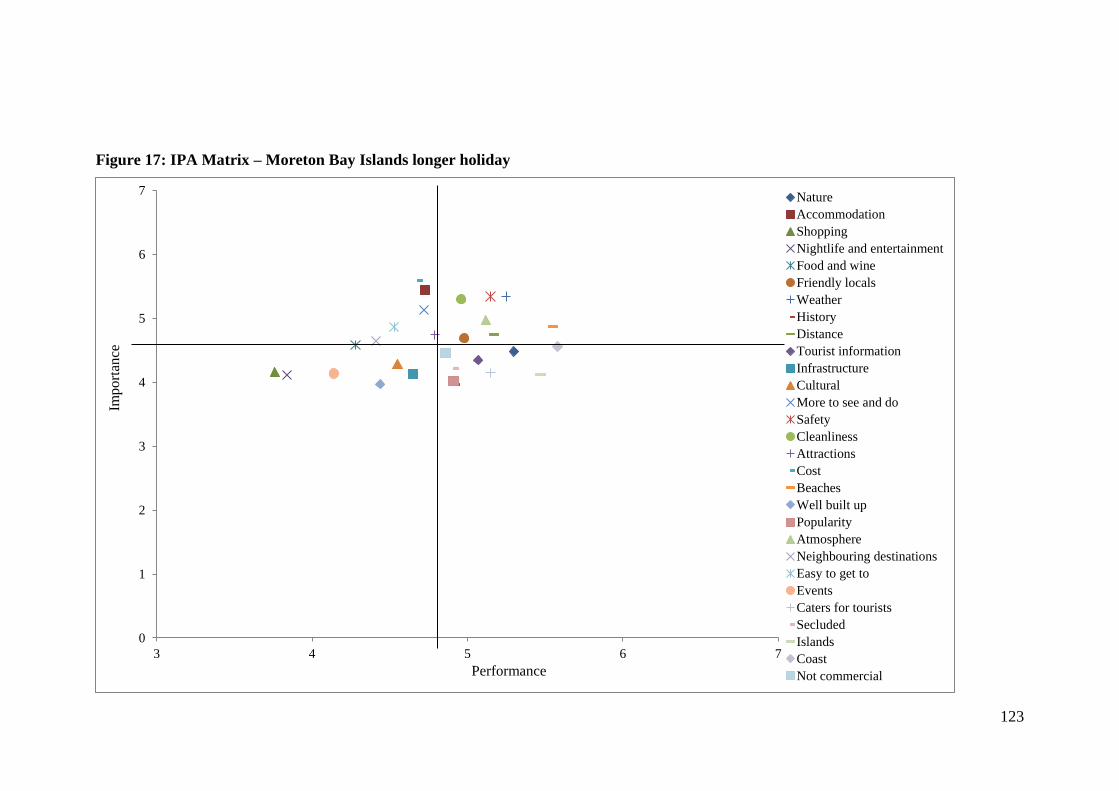
123
Figure 17: IPA Matrix – Moreton Bay Islands longer holiday
0
1
2
3
4
5
6
7
3 4 5 6 7
Nature
Accommodation
Shopping
Nightlife and entertainment
Food and wine
Friendly locals
Weather
History
Distance
Tourist information
Infrastructure
Cultural
More to see and do
Safety
Cleanliness
Attractions
Cost
Beaches
Well built up
Popularity
Atmosphere
Neighbouring destinations
Easy to get to
Events
Caters for tourists
Secluded
Islands
Coast
Not commercialPerformance
Import
ance
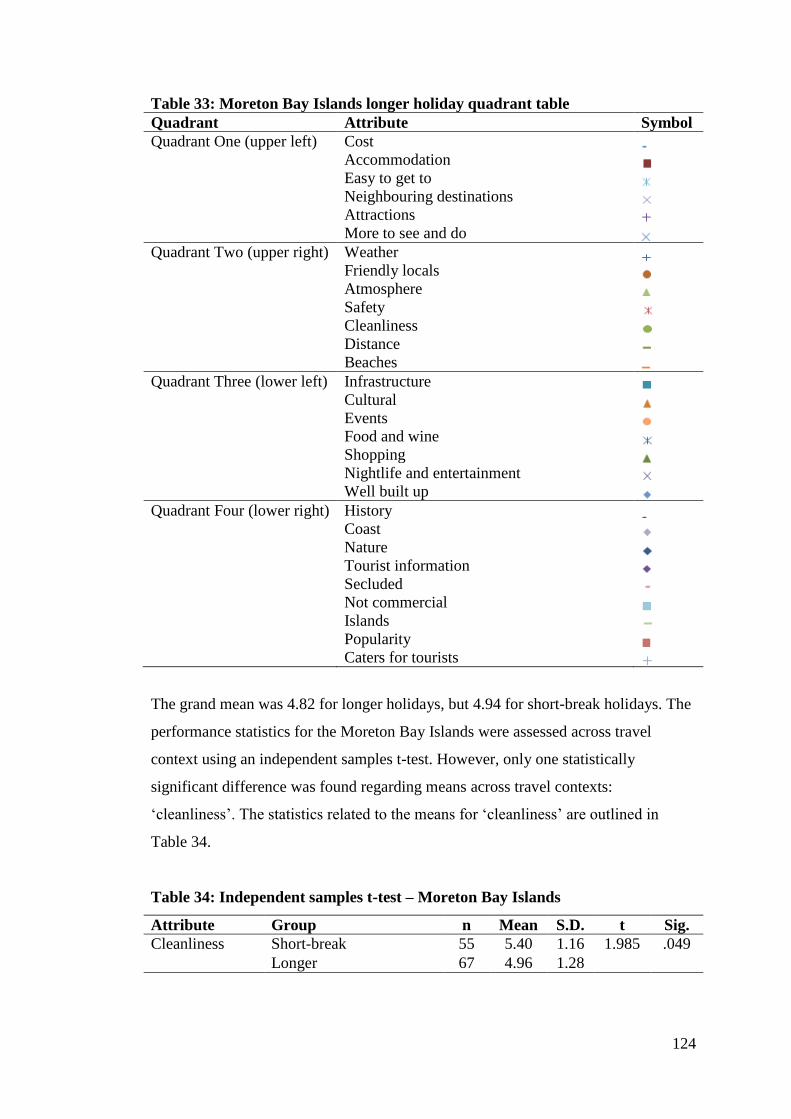
124
Table 33: Moreton Bay Islands longer holiday quadrant table
Quadrant Attribute Symbol
Quadrant One (upper left) Cost Accommodation Easy to get to Neighbouring destinations Attractions More to see and do Quadrant Two (upper right) Weather Friendly locals Atmosphere Safety Cleanliness Distance Beaches Quadrant Three (lower left) Infrastructure Cultural Events Food and wine Shopping Nightlife and entertainment Well built up Quadrant Four (lower right) History Coast Nature Tourist information Secluded Not commercial Islands Popularity Caters for tourists
The grand mean was 4.82 for longer holidays, but 4.94 for short-break holidays. The
performance statistics for the Moreton Bay Islands were assessed across travel
context using an independent samples t-test. However, only one statistically
significant difference was found regarding means across travel contexts:
‘cleanliness’. The statistics related to the means for ‘cleanliness’ are outlined in
Table 34.
Table 34: Independent samples t-test – Moreton Bay Islands
Attribute Group n Mean S.D. t Sig.
Cleanliness Short-break 55 5.40 1.16 1.985 .049
Longer 67 4.96 1.28
125
There were seven attributes that did not have statistically significant differences, but
still changed quadrants. ‘Neighbouring destinations’ moved from quadrant three to
quadrant one. Both ‘attractions’ and ‘more to see and do’ moved from quadrant two
to quadrant one. ‘Coast’ moved from quadrant two to quadrant four, while ‘friendly
locals’ moved from one to two. Finally, ‘secluded’ and ‘not commercial’ moved
from quadrant three to quadrant four.
4.4.4.4 Northern New South Wales – Performance.
An importance-performance analysis was also conducted on Northern New South
Wales data. Performance statistics, including response size, mean, standard deviation
and the number of DK options selected, is outlined in Table 35.
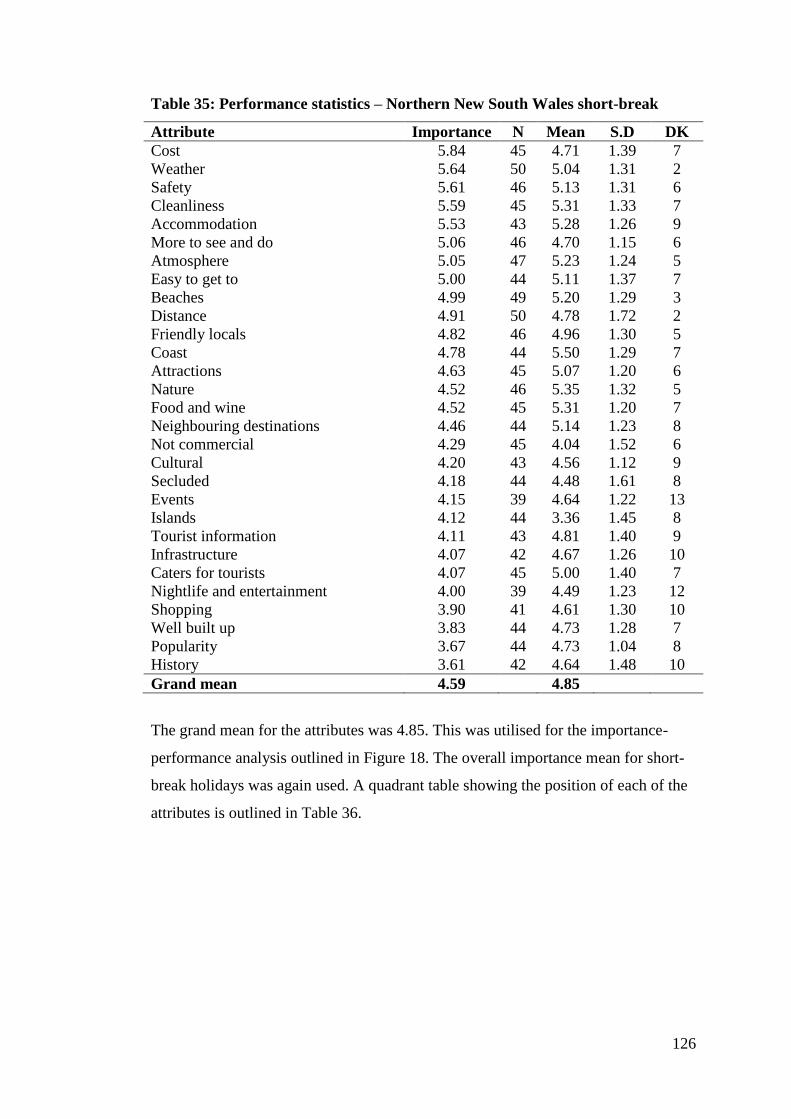
126
Table 35: Performance statistics – Northern New South Wales short-break
Attribute Importance N Mean S.D DK
Cost 5.84 45 4.71 1.39 7
Weather 5.64 50 5.04 1.31 2
Safety 5.61 46 5.13 1.31 6
Cleanliness 5.59 45 5.31 1.33 7
Accommodation 5.53 43 5.28 1.26 9
More to see and do 5.06 46 4.70 1.15 6
Atmosphere 5.05 47 5.23 1.24 5
Easy to get to 5.00 44 5.11 1.37 7
Beaches 4.99 49 5.20 1.29 3
Distance 4.91 50 4.78 1.72 2
Friendly locals 4.82 46 4.96 1.30 5
Coast 4.78 44 5.50 1.29 7
Attractions 4.63 45 5.07 1.20 6
Nature 4.52 46 5.35 1.32 5
Food and wine 4.52 45 5.31 1.20 7
Neighbouring destinations 4.46 44 5.14 1.23 8
Not commercial 4.29 45 4.04 1.52 6
Cultural 4.20 43 4.56 1.12 9
Secluded 4.18 44 4.48 1.61 8
Events 4.15 39 4.64 1.22 13
Islands 4.12 44 3.36 1.45 8
Tourist information 4.11 43 4.81 1.40 9
Infrastructure 4.07 42 4.67 1.26 10
Caters for tourists 4.07 45 5.00 1.40 7
Nightlife and entertainment 4.00 39 4.49 1.23 12
Shopping 3.90 41 4.61 1.30 10
Well built up 3.83 44 4.73 1.28 7
Popularity 3.67 44 4.73 1.04 8
History 3.61 42 4.64 1.48 10
Grand mean 4.59 4.85
The grand mean for the attributes was 4.85. This was utilised for the importance-
performance analysis outlined in Figure 18. The overall importance mean for short-
break holidays was again used. A quadrant table showing the position of each of the
attributes is outlined in Table 36.
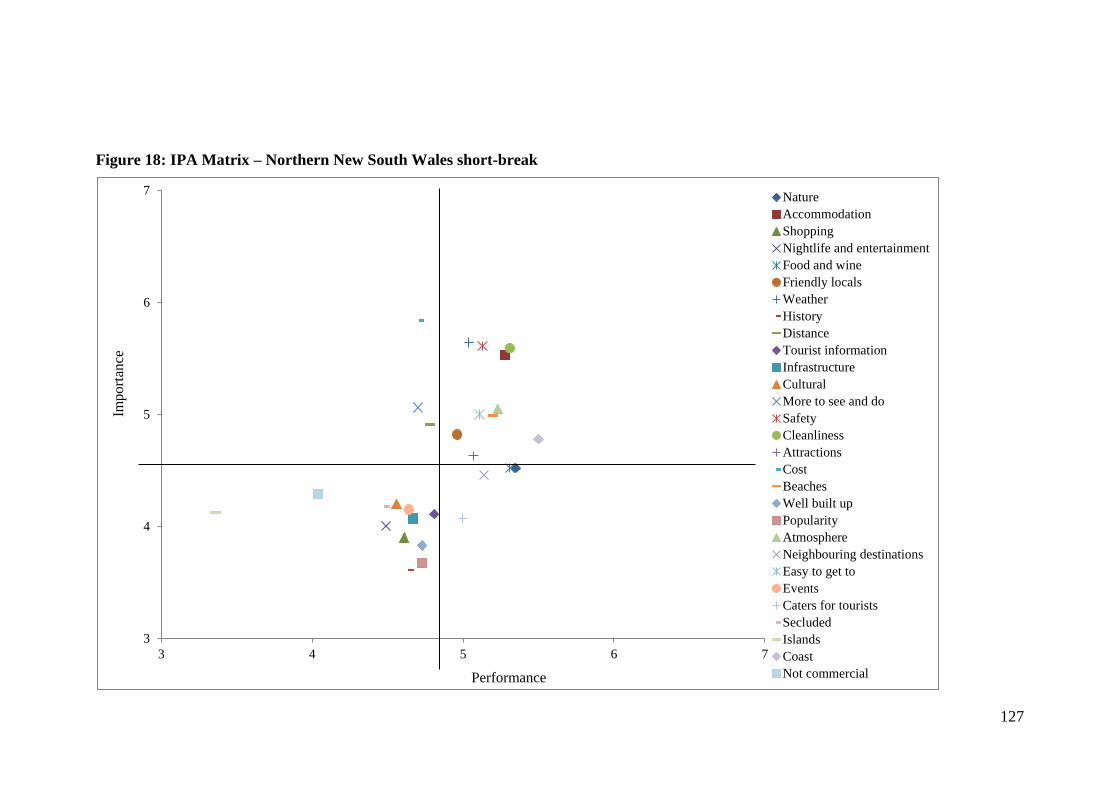
127
Figure 18: IPA Matrix – Northern New South Wales short-break
3
4
5
6
7
3 4 5 6 7
Nature
Accommodation
Shopping
Nightlife and entertainment
Food and wine
Friendly locals
Weather
History
Distance
Tourist information
Infrastructure
Cultural
More to see and do
Safety
Cleanliness
Attractions
Cost
Beaches
Well built up
Popularity
Atmosphere
Neighbouring destinations
Easy to get to
Events
Caters for tourists
Secluded
Islands
Coast
Not commercialPerformance
Import
ance
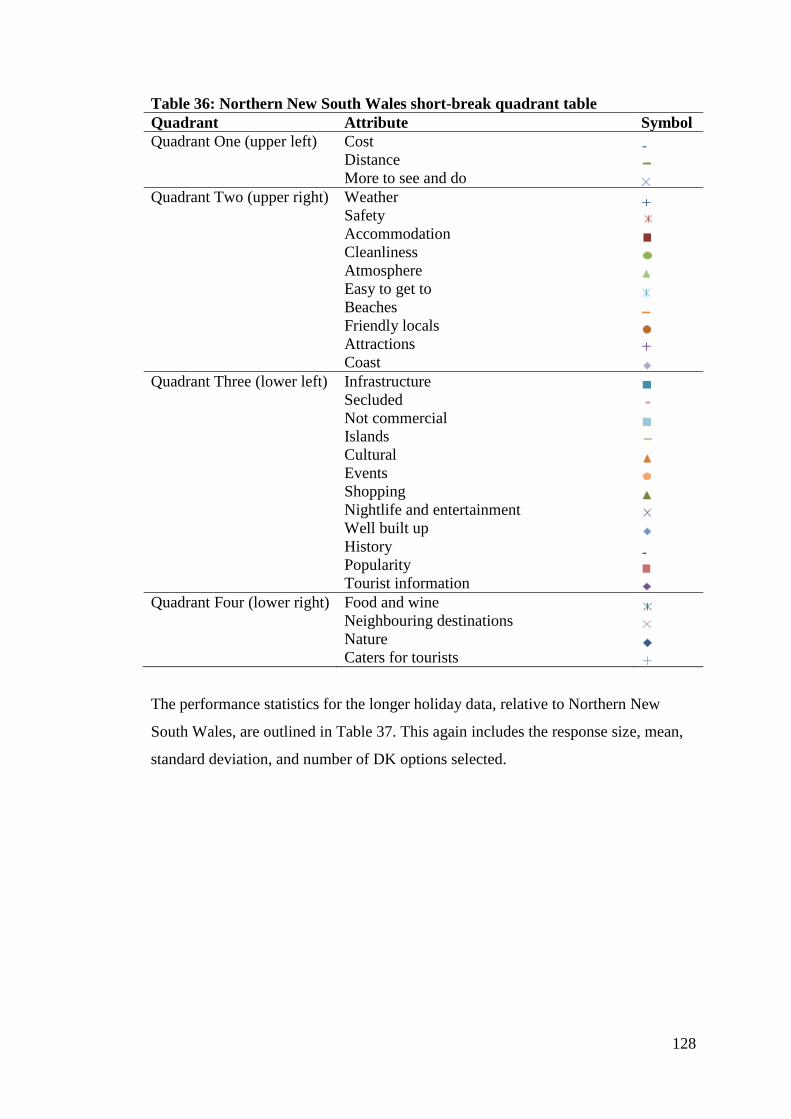
128
Table 36: Northern New South Wales short-break quadrant table
Quadrant Attribute Symbol
Quadrant One (upper left) Cost Distance More to see and do Quadrant Two (upper right) Weather Safety Accommodation Cleanliness Atmosphere Easy to get to Beaches Friendly locals Attractions Coast Quadrant Three (lower left) Infrastructure Secluded Not commercial Islands Cultural Events Shopping Nightlife and entertainment Well built up History Popularity Tourist information Quadrant Four (lower right) Food and wine Neighbouring destinations Nature Caters for tourists
The performance statistics for the longer holiday data, relative to Northern New
South Wales, are outlined in Table 37. This again includes the response size, mean,
standard deviation, and number of DK options selected.
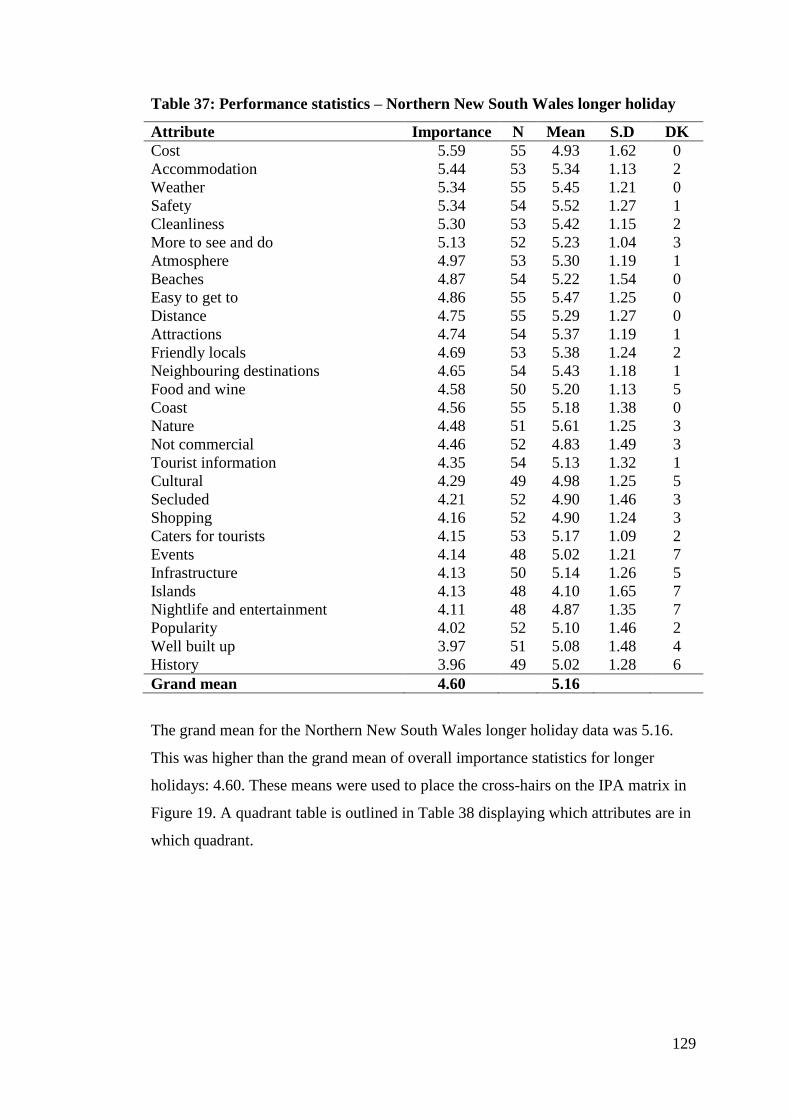
129
Table 37: Performance statistics – Northern New South Wales longer holiday
Attribute Importance N Mean S.D DK
Cost 5.59 55 4.93 1.62 0
Accommodation 5.44 53 5.34 1.13 2
Weather 5.34 55 5.45 1.21 0
Safety 5.34 54 5.52 1.27 1
Cleanliness 5.30 53 5.42 1.15 2
More to see and do 5.13 52 5.23 1.04 3
Atmosphere 4.97 53 5.30 1.19 1
Beaches 4.87 54 5.22 1.54 0
Easy to get to 4.86 55 5.47 1.25 0
Distance 4.75 55 5.29 1.27 0
Attractions 4.74 54 5.37 1.19 1
Friendly locals 4.69 53 5.38 1.24 2
Neighbouring destinations 4.65 54 5.43 1.18 1
Food and wine 4.58 50 5.20 1.13 5
Coast 4.56 55 5.18 1.38 0
Nature 4.48 51 5.61 1.25 3
Not commercial 4.46 52 4.83 1.49 3
Tourist information 4.35 54 5.13 1.32 1
Cultural 4.29 49 4.98 1.25 5
Secluded 4.21 52 4.90 1.46 3
Shopping 4.16 52 4.90 1.24 3
Caters for tourists 4.15 53 5.17 1.09 2
Events 4.14 48 5.02 1.21 7
Infrastructure 4.13 50 5.14 1.26 5
Islands 4.13 48 4.10 1.65 7
Nightlife and entertainment 4.11 48 4.87 1.35 7
Popularity 4.02 52 5.10 1.46 2
Well built up 3.97 51 5.08 1.48 4
History 3.96 49 5.02 1.28 6
Grand mean 4.60 5.16
The grand mean for the Northern New South Wales longer holiday data was 5.16.
This was higher than the grand mean of overall importance statistics for longer
holidays: 4.60. These means were used to place the cross-hairs on the IPA matrix in
Figure 19. A quadrant table is outlined in Table 38 displaying which attributes are in
which quadrant.
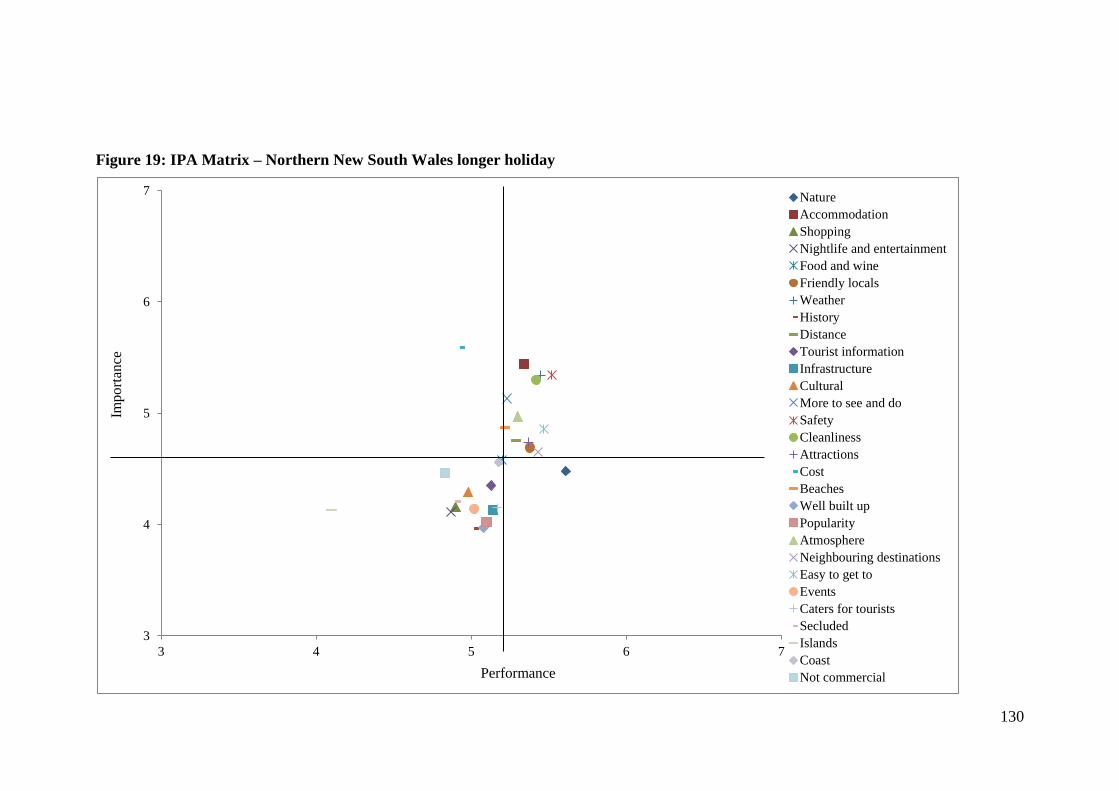
130
Figure 19: IPA Matrix – Northern New South Wales longer holiday
3
4
5
6
7
3 4 5 6 7
Nature
Accommodation
Shopping
Nightlife and entertainment
Food and wine
Friendly locals
Weather
History
Distance
Tourist information
Infrastructure
Cultural
More to see and do
Safety
Cleanliness
Attractions
Cost
Beaches
Well built up
Popularity
Atmosphere
Neighbouring destinations
Easy to get to
Events
Caters for tourists
Secluded
Islands
Coast
Not commercialPerformance
Impo
rtan
ce
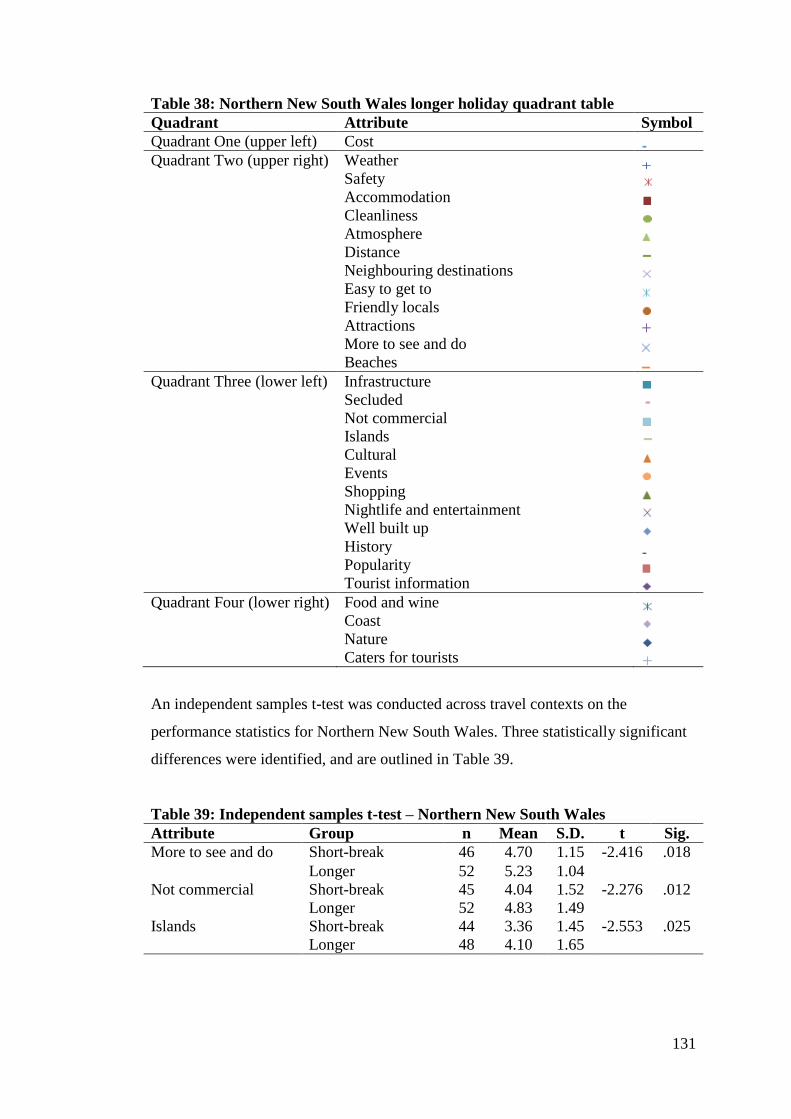
131
Table 38: Northern New South Wales longer holiday quadrant table
Quadrant Attribute Symbol
Quadrant One (upper left) Cost Quadrant Two (upper right) Weather Safety Accommodation Cleanliness Atmosphere Distance Neighbouring destinations Easy to get to Friendly locals Attractions More to see and do Beaches Quadrant Three (lower left) Infrastructure Secluded Not commercial Islands Cultural Events Shopping Nightlife and entertainment Well built up History Popularity Tourist information Quadrant Four (lower right) Food and wine Coast Nature Caters for tourists
An independent samples t-test was conducted across travel contexts on the
performance statistics for Northern New South Wales. Three statistically significant
differences were identified, and are outlined in Table 39.
Table 39: Independent samples t-test – Northern New South Wales
Attribute Group n Mean S.D. t Sig.
More to see and do Short-break 46 4.70 1.15 -2.416 .018
Longer 52 5.23 1.04
Not commercial Short-break 45 4.04 1.52 -2.276 .012
Longer 52 4.83 1.49
Islands Short-break 44 3.36 1.45 -2.553 .025
Longer 48 4.10 1.65
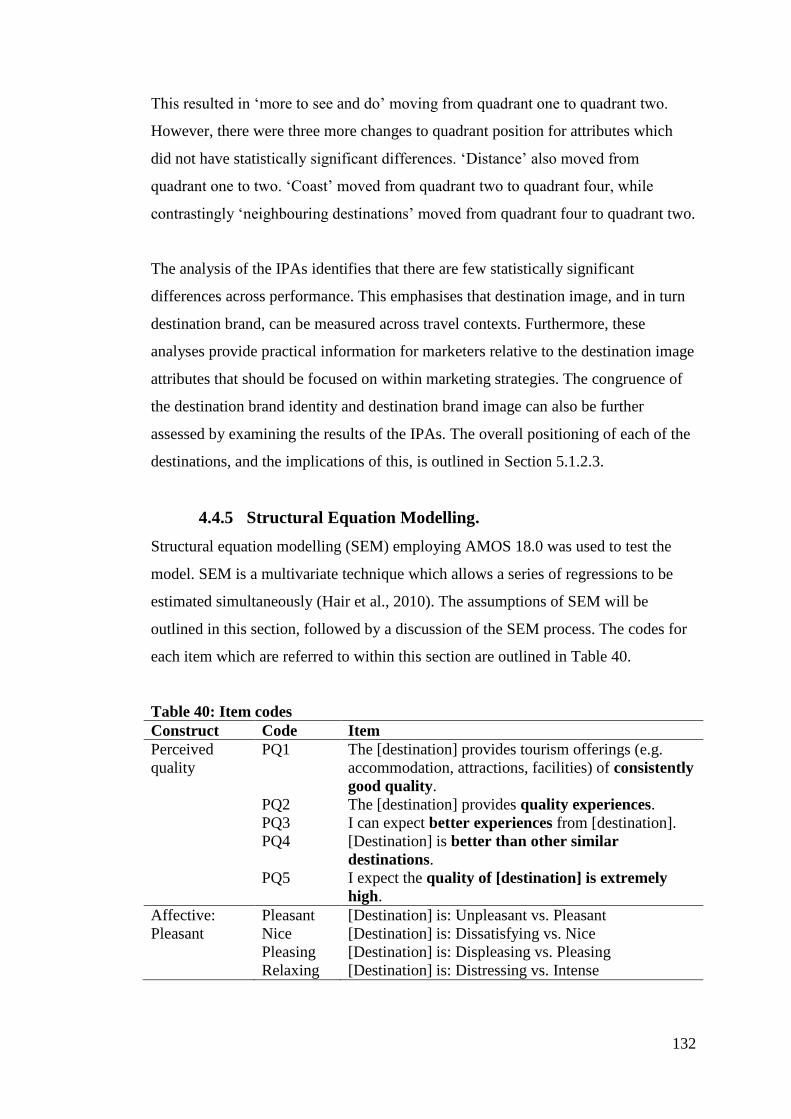
132
This resulted in ‘more to see and do’ moving from quadrant one to quadrant two.
However, there were three more changes to quadrant position for attributes which
did not have statistically significant differences. ‘Distance’ also moved from
quadrant one to two. ‘Coast’ moved from quadrant two to quadrant four, while
contrastingly ‘neighbouring destinations’ moved from quadrant four to quadrant two.
The analysis of the IPAs identifies that there are few statistically significant
differences across performance. This emphasises that destination image, and in turn
destination brand, can be measured across travel contexts. Furthermore, these
analyses provide practical information for marketers relative to the destination image
attributes that should be focused on within marketing strategies. The congruence of
the destination brand identity and destination brand image can also be further
assessed by examining the results of the IPAs. The overall positioning of each of the
destinations, and the implications of this, is outlined in Section 5.1.2.3.
4.4.5 Structural Equation Modelling.
Structural equation modelling (SEM) employing AMOS 18.0 was used to test the
model. SEM is a multivariate technique which allows a series of regressions to be
estimated simultaneously (Hair et al., 2010). The assumptions of SEM will be
outlined in this section, followed by a discussion of the SEM process. The codes for
each item which are referred to within this section are outlined in Table 40.
Table 40: Item codes
Construct Code Item
Perceived
quality
PQ1 The [destination] provides tourism offerings (e.g.
accommodation, attractions, facilities) of consistently
good quality.
PQ2 The [destination] provides quality experiences.
PQ3 I can expect better experiences from [destination].
PQ4 [Destination] is better than other similar
destinations.
PQ5 I expect the quality of [destination] is extremely
high.
Affective: Pleasant [Destination] is: Unpleasant vs. Pleasant
Pleasant Nice [Destination] is: Dissatisfying vs. Nice
Pleasing [Destination] is: Displeasing vs. Pleasing
Relaxing [Destination] is: Distressing vs. Intense
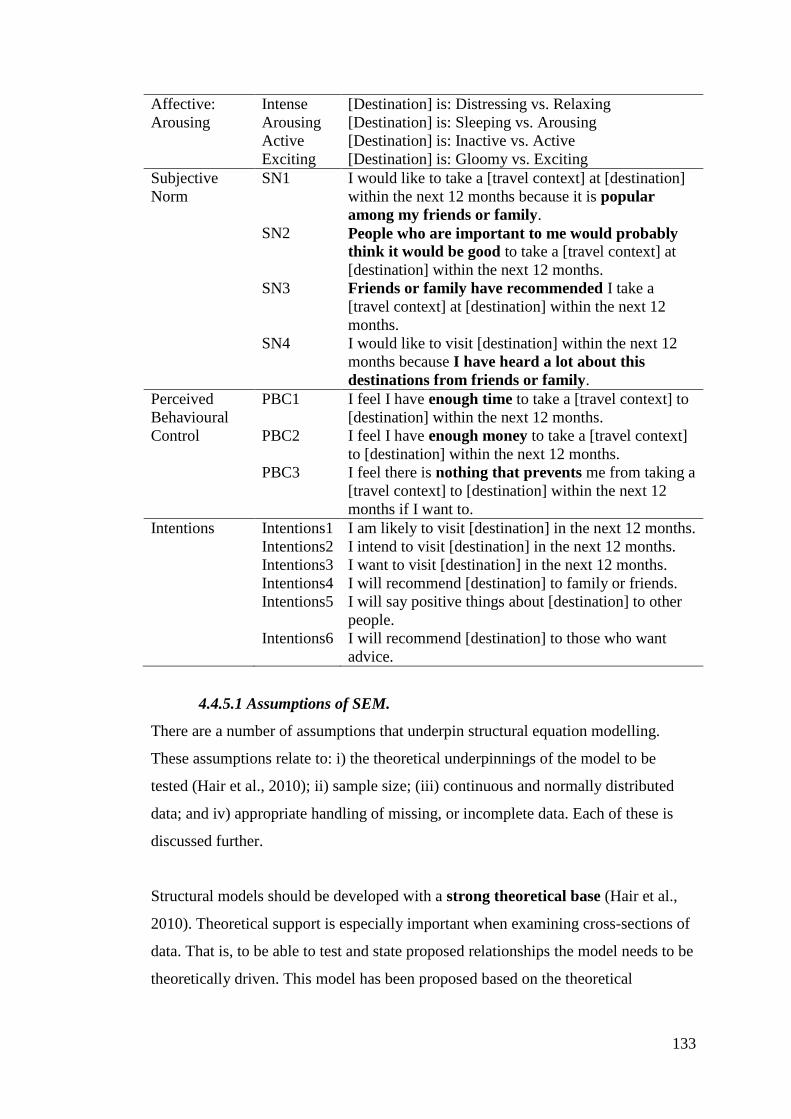
133
Affective: Intense [Destination] is: Distressing vs. Relaxing
Arousing Arousing [Destination] is: Sleeping vs. Arousing
Active [Destination] is: Inactive vs. Active
Exciting [Destination] is: Gloomy vs. Exciting
Subjective
Norm
SN1 I would like to take a [travel context] at [destination]
within the next 12 months because it is popular
among my friends or family.
SN2 People who are important to me would probably
think it would be good to take a [travel context] at
[destination] within the next 12 months.
SN3 Friends or family have recommended I take a
[travel context] at [destination] within the next 12
months.
SN4 I would like to visit [destination] within the next 12
months because I have heard a lot about this
destinations from friends or family.
Perceived
Behavioural
PBC1 I feel I have enough time to take a [travel context] to
[destination] within the next 12 months.
Control PBC2 I feel I have enough money to take a [travel context]
to [destination] within the next 12 months.
PBC3 I feel there is nothing that prevents me from taking a
[travel context] to [destination] within the next 12
months if I want to.
Intentions Intentions1 I am likely to visit [destination] in the next 12 months.
Intentions2 I intend to visit [destination] in the next 12 months.
Intentions3 I want to visit [destination] in the next 12 months.
Intentions4 I will recommend [destination] to family or friends.
Intentions5 I will say positive things about [destination] to other
people.
Intentions6 I will recommend [destination] to those who want
advice.
4.4.5.1 Assumptions of SEM.
There are a number of assumptions that underpin structural equation modelling.
These assumptions relate to: i) the theoretical underpinnings of the model to be
tested (Hair et al., 2010); ii) sample size; (iii) continuous and normally distributed
data; and iv) appropriate handling of missing, or incomplete data. Each of these is
discussed further.
Structural models should be developed with a strong theoretical base (Hair et al.,
2010). Theoretical support is especially important when examining cross-sections of
data. That is, to be able to test and state proposed relationships the model needs to be
theoretically driven. This model has been proposed based on the theoretical

134
frameworks of both the theory of planned behaviour and the consumer-based brand
equity hierarchy.
Hair et al. (2010) suggest a minimum sample size of 150 is acceptable for a model
with seven or fewer constructs, modest communalities, and no under identified
constructs. In the model tested, seven constructs are considered: six reflective
variables, and a formative variable. All communalities are above .50 (see Section
4.4.6.3), and no reflective variables were under identified, that is, they did not have
less than three items.
Another assumption of SEM is that data must be continuous and normally
distributed. However, if data is non-normal bootstrapping can be conducted to
allow examination (Byrne, 2001). Bootstrapping was conducted in this study.
The appropriate handling of missing data is also an important consideration for
SEM. Missing data must be addressed if more than 10% is missing, or it is non-
random (Hair et al., 2010). Data cleaning was conducted, and outlined in Section
4.4.1. Missing data for SEM did not exceed 10%, and was random.
4.4.5.2 Exploratory factor analysis.
Before conducting structural equation modelling, an exploratory factor analysis
(EFA) was examined. The purpose of conducting the EFA was to assess factor
loadings of the six variables identified within the literature, and outlined in the
proposed model. It must be noted that as the cognitive component of the model
represented a formative variable it was excluded from the EFA. The data were
combined (N=638) and using PASW 18.0 found to have a Kaiser-Meyer-Olkin
measure of sampling adequacy at .92, above the cut-off of .60, supporting the
adequacy of the sample for this study (Coakes, Steed, & Ong, 2010; Tabacknick &
Fidell, 2007). Bartlett’s Test of Sphericity addresses whether there are any
significant correlations within the overall correlation matrix of the data (Hair et al.,
2010). Bartlett’s Test of Sphericity was significant (p=.000) suggesting correlations
within the data. Principal axis factoring was conducted to identify the underlying
factors in the data (Malhotra et al., 2006). As it was presumed the factors would be
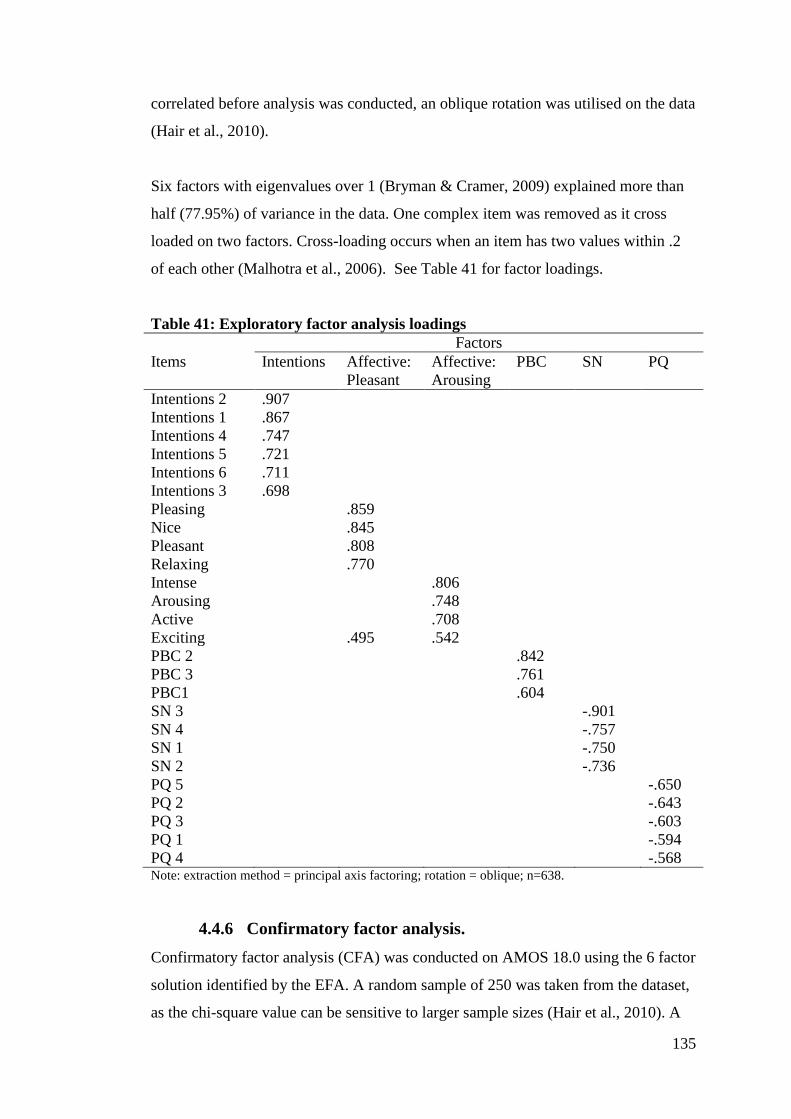
135
correlated before analysis was conducted, an oblique rotation was utilised on the data
(Hair et al., 2010).
Six factors with eigenvalues over 1 (Bryman & Cramer, 2009) explained more than
half (77.95%) of variance in the data. One complex item was removed as it cross
loaded on two factors. Cross-loading occurs when an item has two values within .2
of each other (Malhotra et al., 2006). See Table 41 for factor loadings.
Table 41: Exploratory factor analysis loadings
Factors
Items Intentions Affective:
Pleasant
Affective:
Arousing
PBC SN PQ
Intentions 2 .907
Intentions 1 .867
Intentions 4 .747
Intentions 5 .721
Intentions 6 .711
Intentions 3 .698
Pleasing .859
Nice .845
Pleasant .808
Relaxing .770
Intense .806
Arousing .748
Active .708
Exciting .495 .542
PBC 2 .842
PBC 3 .761
PBC1 .604
SN 3 -.901
SN 4 -.757
SN 1 -.750
SN 2 -.736
PQ 5 -.650
PQ 2 -.643
PQ 3 -.603
PQ 1 -.594
PQ 4 -.568 Note: extraction method = principal axis factoring; rotation = oblique; n=638.
4.4.6 Confirmatory factor analysis.
Confirmatory factor analysis (CFA) was conducted on AMOS 18.0 using the 6 factor
solution identified by the EFA. A random sample of 250 was taken from the dataset,
as the chi-square value can be sensitive to larger sample sizes (Hair et al., 2010). A
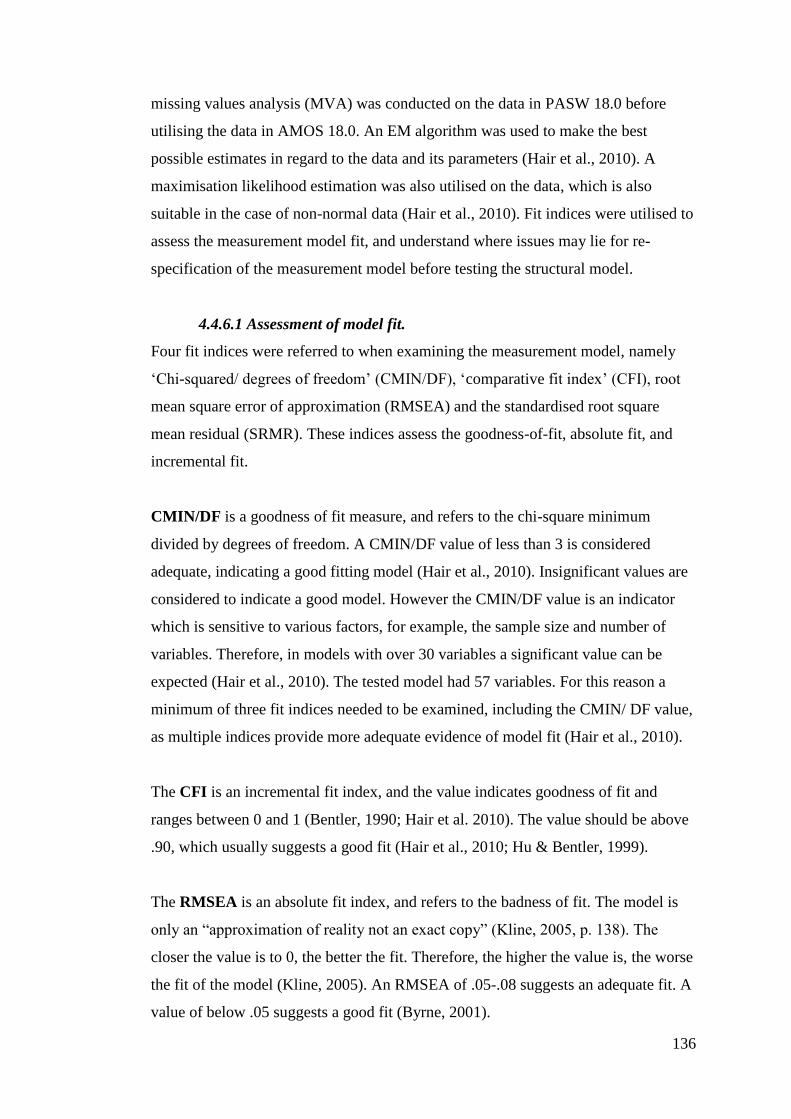
136
missing values analysis (MVA) was conducted on the data in PASW 18.0 before
utilising the data in AMOS 18.0. An EM algorithm was used to make the best
possible estimates in regard to the data and its parameters (Hair et al., 2010). A
maximisation likelihood estimation was also utilised on the data, which is also
suitable in the case of non-normal data (Hair et al., 2010). Fit indices were utilised to
assess the measurement model fit, and understand where issues may lie for re-
specification of the measurement model before testing the structural model.
4.4.6.1 Assessment of model fit.
Four fit indices were referred to when examining the measurement model, namely
‘Chi-squared/ degrees of freedom’ (CMIN/DF), ‘comparative fit index’ (CFI), root
mean square error of approximation (RMSEA) and the standardised root square
mean residual (SRMR). These indices assess the goodness-of-fit, absolute fit, and
incremental fit.
CMIN/DF is a goodness of fit measure, and refers to the chi-square minimum
divided by degrees of freedom. A CMIN/DF value of less than 3 is considered
adequate, indicating a good fitting model (Hair et al., 2010). Insignificant values are
considered to indicate a good model. However the CMIN/DF value is an indicator
which is sensitive to various factors, for example, the sample size and number of
variables. Therefore, in models with over 30 variables a significant value can be
expected (Hair et al., 2010). The tested model had 57 variables. For this reason a
minimum of three fit indices needed to be examined, including the CMIN/ DF value,
as multiple indices provide more adequate evidence of model fit (Hair et al., 2010).
The CFI is an incremental fit index, and the value indicates goodness of fit and
ranges between 0 and 1 (Bentler, 1990; Hair et al. 2010). The value should be above
.90, which usually suggests a good fit (Hair et al., 2010; Hu & Bentler, 1999).
The RMSEA is an absolute fit index, and refers to the badness of fit. The model is
only an “approximation of reality not an exact copy” (Kline, 2005, p. 138). The
closer the value is to 0, the better the fit. Therefore, the higher the value is, the worse
the fit of the model (Kline, 2005). An RMSEA of .05-.08 suggests an adequate fit. A
value of below .05 suggests a good fit (Byrne, 2001).
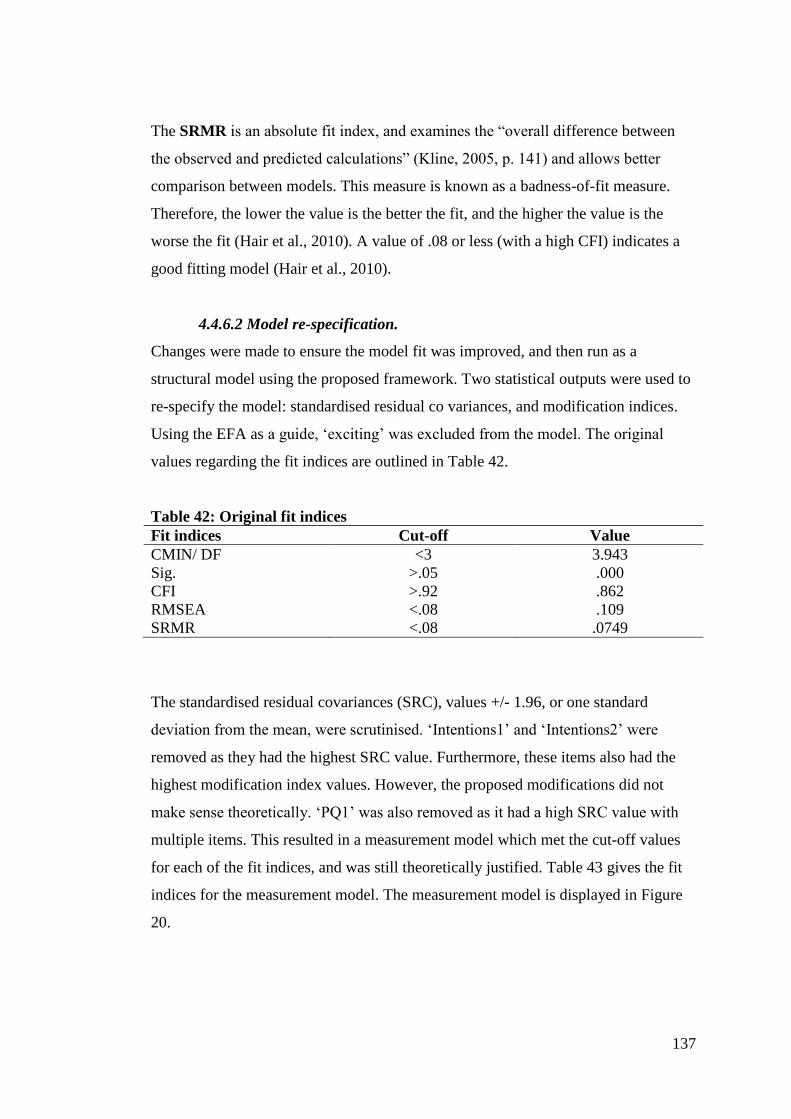
137
The SRMR is an absolute fit index, and examines the “overall difference between
the observed and predicted calculations” (Kline, 2005, p. 141) and allows better
comparison between models. This measure is known as a badness-of-fit measure.
Therefore, the lower the value is the better the fit, and the higher the value is the
worse the fit (Hair et al., 2010). A value of .08 or less (with a high CFI) indicates a
good fitting model (Hair et al., 2010).
4.4.6.2 Model re-specification.
Changes were made to ensure the model fit was improved, and then run as a
structural model using the proposed framework. Two statistical outputs were used to
re-specify the model: standardised residual co variances, and modification indices.
Using the EFA as a guide, ‘exciting’ was excluded from the model. The original
values regarding the fit indices are outlined in Table 42.
Table 42: Original fit indices
Fit indices Cut-off Value
CMIN/ DF <3 3.943
Sig. >.05 .000
CFI >.92 .862
RMSEA <.08 .109
SRMR <.08 .0749
The standardised residual covariances (SRC), values +/- 1.96, or one standard
deviation from the mean, were scrutinised. ‘Intentions1’ and ‘Intentions2’ were
removed as they had the highest SRC value. Furthermore, these items also had the
highest modification index values. However, the proposed modifications did not
make sense theoretically. ‘PQ1’ was also removed as it had a high SRC value with
multiple items. This resulted in a measurement model which met the cut-off values
for each of the fit indices, and was still theoretically justified. Table 43 gives the fit
indices for the measurement model. The measurement model is displayed in Figure
20.
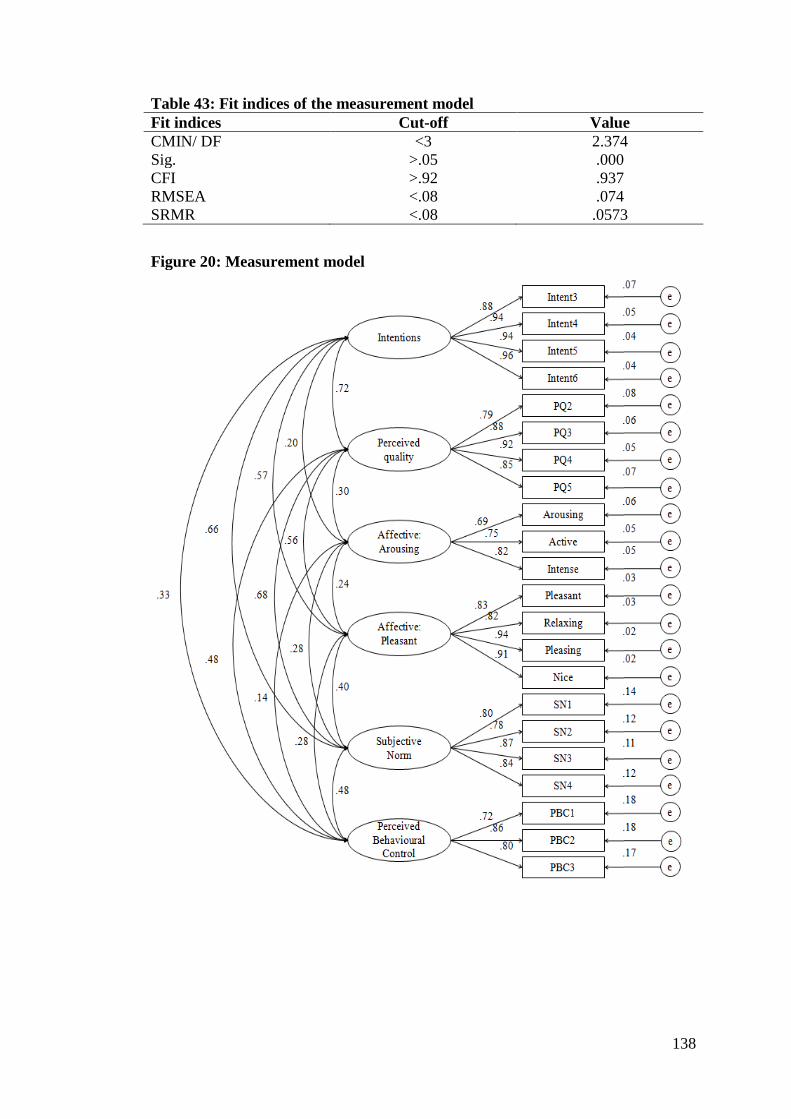
138
Table 43: Fit indices of the measurement model
Fit indices Cut-off Value
CMIN/ DF <3 2.374
Sig. >.05 .000
CFI >.92 .937
RMSEA <.08 .074
SRMR <.08 .0573
Figure 20: Measurement model
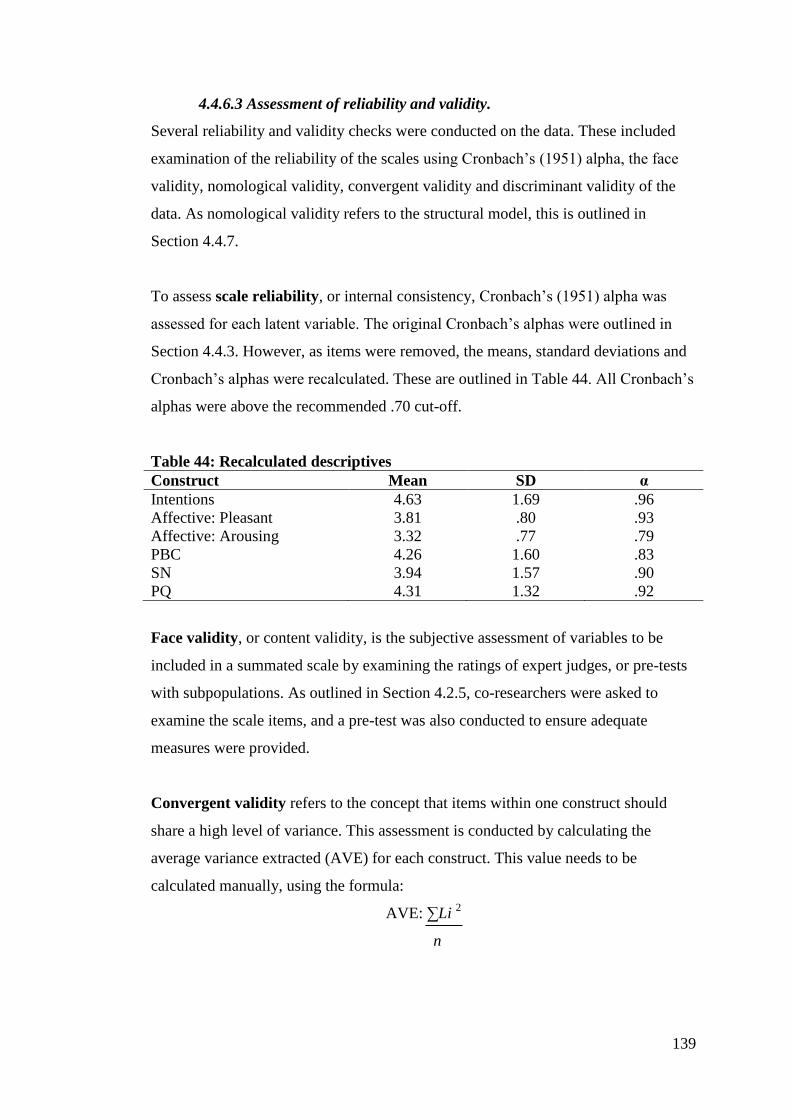
139
4.4.6.3 Assessment of reliability and validity.
Several reliability and validity checks were conducted on the data. These included
examination of the reliability of the scales using Cronbach’s (1951) alpha, the face
validity, nomological validity, convergent validity and discriminant validity of the
data. As nomological validity refers to the structural model, this is outlined in
Section 4.4.7.
To assess scale reliability, or internal consistency, Cronbach’s (1951) alpha was
assessed for each latent variable. The original Cronbach’s alphas were outlined in
Section 4.4.3. However, as items were removed, the means, standard deviations and
Cronbach’s alphas were recalculated. These are outlined in Table 44. All Cronbach’s
alphas were above the recommended .70 cut-off.
Table 44: Recalculated descriptives
Construct Mean SD α
Intentions 4.63 1.69 .96
Affective: Pleasant 3.81 .80 .93
Affective: Arousing 3.32 .77 .79
PBC 4.26 1.60 .83
SN 3.94 1.57 .90
PQ 4.31 1.32 .92
Face validity, or content validity, is the subjective assessment of variables to be
included in a summated scale by examining the ratings of expert judges, or pre-tests
with subpopulations. As outlined in Section 4.2.5, co-researchers were asked to
examine the scale items, and a pre-test was also conducted to ensure adequate
measures were provided.
Convergent validity refers to the concept that items within one construct should
share a high level of variance. This assessment is conducted by calculating the
average variance extracted (AVE) for each construct. This value needs to be
calculated manually, using the formula:
AVE: ∑Li 2
n
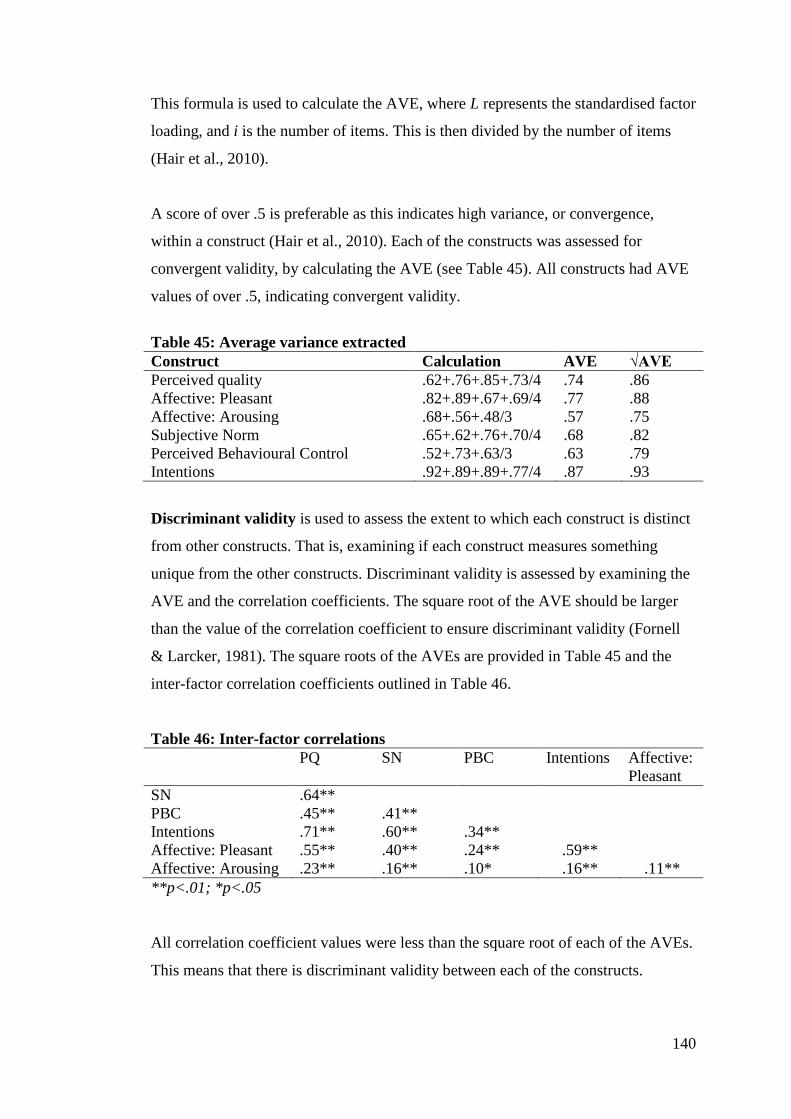
140
This formula is used to calculate the AVE, where L represents the standardised factor
loading, and i is the number of items. This is then divided by the number of items
(Hair et al., 2010).
A score of over .5 is preferable as this indicates high variance, or convergence,
within a construct (Hair et al., 2010). Each of the constructs was assessed for
convergent validity, by calculating the AVE (see Table 45). All constructs had AVE
values of over .5, indicating convergent validity.
Table 45: Average variance extracted
Construct Calculation AVE √AVE
Perceived quality .62+.76+.85+.73/4 .74 .86
Affective: Pleasant .82+.89+.67+.69/4 .77 .88
Affective: Arousing .68+.56+.48/3 .57 .75
Subjective Norm .65+.62+.76+.70/4 .68 .82
Perceived Behavioural Control .52+.73+.63/3 .63 .79
Intentions .92+.89+.89+.77/4 .87 .93
Discriminant validity is used to assess the extent to which each construct is distinct
from other constructs. That is, examining if each construct measures something
unique from the other constructs. Discriminant validity is assessed by examining the
AVE and the correlation coefficients. The square root of the AVE should be larger
than the value of the correlation coefficient to ensure discriminant validity (Fornell
& Larcker, 1981). The square roots of the AVEs are provided in Table 45 and the
inter-factor correlation coefficients outlined in Table 46.
Table 46: Inter-factor correlations
PQ SN PBC Intentions Affective:
Pleasant
SN .64**
PBC .45** .41**
Intentions .71** .60** .34**
Affective: Pleasant .55** .40** .24** .59**
Affective: Arousing .23** .16** .10* .16** .11**
**p<.01; *p<.05
All correlation coefficient values were less than the square root of each of the AVEs.
This means that there is discriminant validity between each of the constructs.
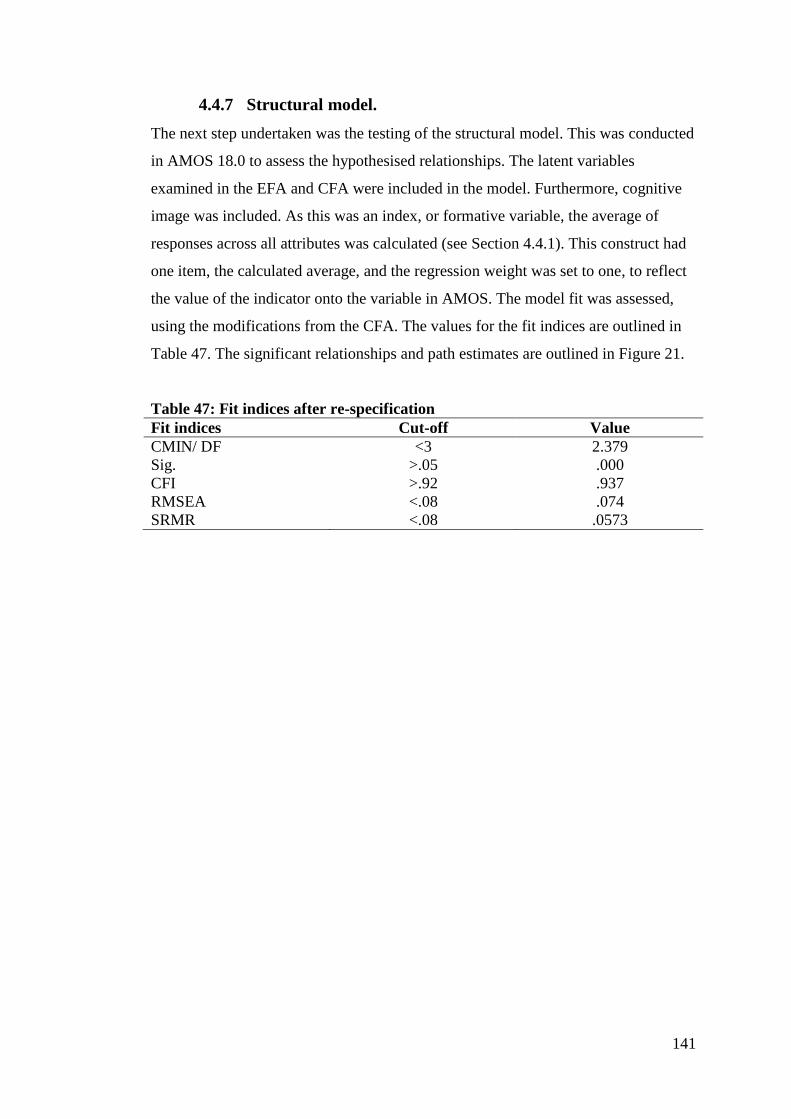
141
4.4.7 Structural model.
The next step undertaken was the testing of the structural model. This was conducted
in AMOS 18.0 to assess the hypothesised relationships. The latent variables
examined in the EFA and CFA were included in the model. Furthermore, cognitive
image was included. As this was an index, or formative variable, the average of
responses across all attributes was calculated (see Section 4.4.1). This construct had
one item, the calculated average, and the regression weight was set to one, to reflect
the value of the indicator onto the variable in AMOS. The model fit was assessed,
using the modifications from the CFA. The values for the fit indices are outlined in
Table 47. The significant relationships and path estimates are outlined in Figure 21.
Table 47: Fit indices after re-specification
Fit indices Cut-off Value
CMIN/ DF <3 2.379
Sig. >.05 .000
CFI >.92 .937
RMSEA <.08 .074
SRMR <.08 .0573
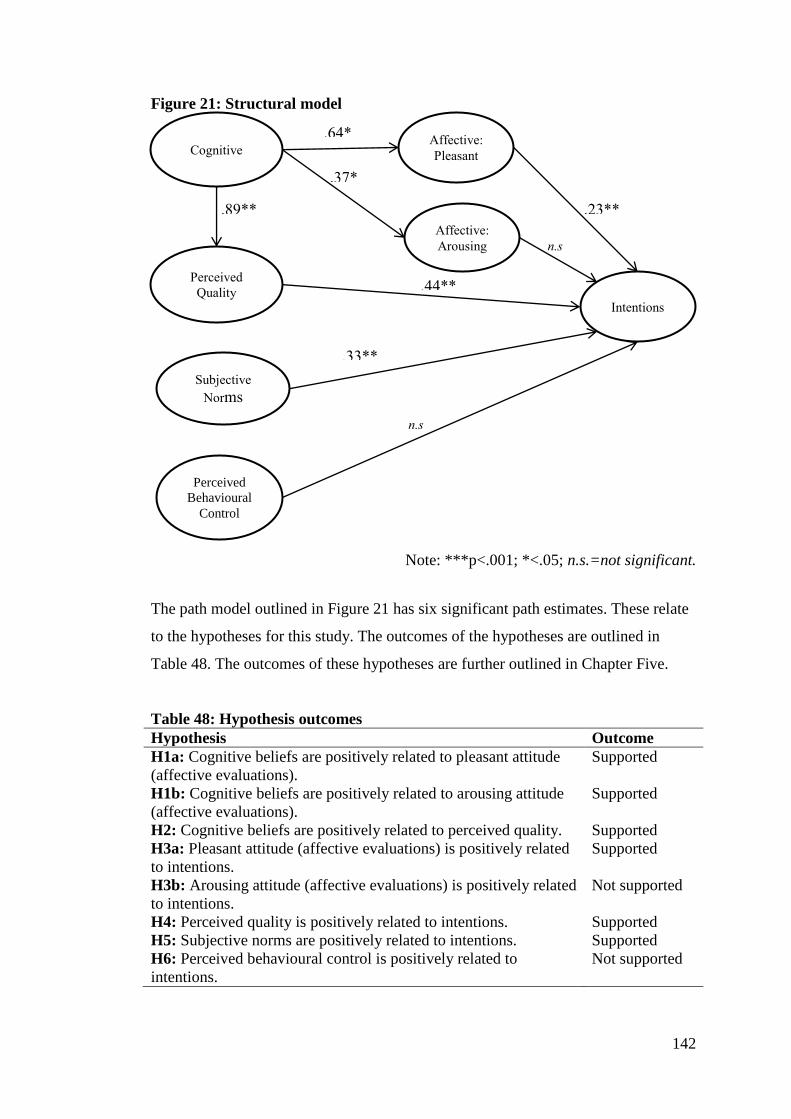
142
Figure 21: Structural model
Note: ***p<.001; *<.05; n.s.=not significant.
The path model outlined in Figure 21 has six significant path estimates. These relate
to the hypotheses for this study. The outcomes of the hypotheses are outlined in
Table 48. The outcomes of these hypotheses are further outlined in Chapter Five.
Table 48: Hypothesis outcomes
Hypothesis Outcome
H1a: Cognitive beliefs are positively related to pleasant attitude
(affective evaluations).
Supported
H1b: Cognitive beliefs are positively related to arousing attitude
(affective evaluations).
Supported
H2: Cognitive beliefs are positively related to perceived quality. Supported
H3a: Pleasant attitude (affective evaluations) is positively related
to intentions.
Supported
H3b: Arousing attitude (affective evaluations) is positively related
to intentions.
Not supported
H4: Perceived quality is positively related to intentions. Supported
H5: Subjective norms are positively related to intentions. Supported
H6: Perceived behavioural control is positively related to
intentions.
Not supported
Cognitive
Affective:
Arousing
Subjective
Norms
Perceived
Quality Intentions
Affective:
Pleasant
Perceived
Behavioural
Control
.89**
*
.33**
*
n.s
.64*
.23**
* n.s
.37*
**
.44**
*
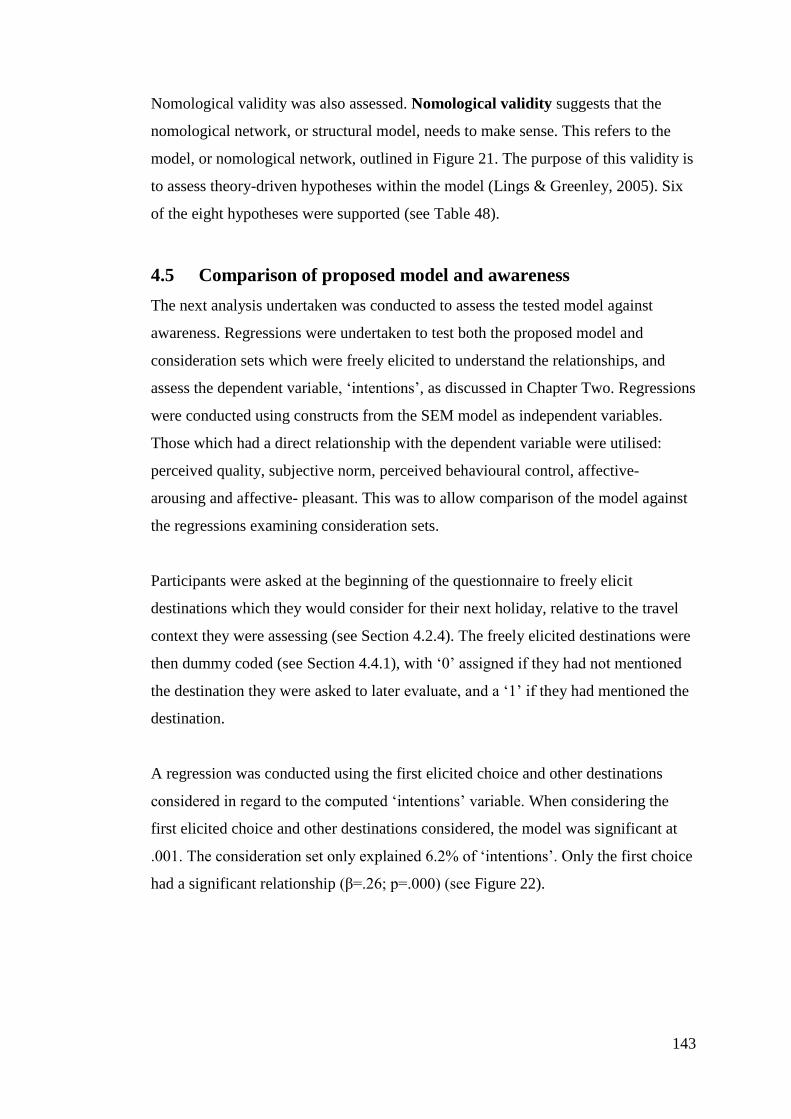
143
Nomological validity was also assessed. Nomological validity suggests that the
nomological network, or structural model, needs to make sense. This refers to the
model, or nomological network, outlined in Figure 21. The purpose of this validity is
to assess theory-driven hypotheses within the model (Lings & Greenley, 2005). Six
of the eight hypotheses were supported (see Table 48).
4.5 Comparison of proposed model and awareness
The next analysis undertaken was conducted to assess the tested model against
awareness. Regressions were undertaken to test both the proposed model and
consideration sets which were freely elicited to understand the relationships, and
assess the dependent variable, ‘intentions’, as discussed in Chapter Two. Regressions
were conducted using constructs from the SEM model as independent variables.
Those which had a direct relationship with the dependent variable were utilised:
perceived quality, subjective norm, perceived behavioural control, affective-
arousing and affective- pleasant. This was to allow comparison of the model against
the regressions examining consideration sets.
Participants were asked at the beginning of the questionnaire to freely elicit
destinations which they would consider for their next holiday, relative to the travel
context they were assessing (see Section 4.2.4). The freely elicited destinations were
then dummy coded (see Section 4.4.1), with ‘0’ assigned if they had not mentioned
the destination they were asked to later evaluate, and a ‘1’ if they had mentioned the
destination.
A regression was conducted using the first elicited choice and other destinations
considered in regard to the computed ‘intentions’ variable. When considering the
first elicited choice and other destinations considered, the model was significant at
.001. The consideration set only explained 6.2% of ‘intentions’. Only the first choice
had a significant relationship (β=.26; p=.000) (see Figure 22).
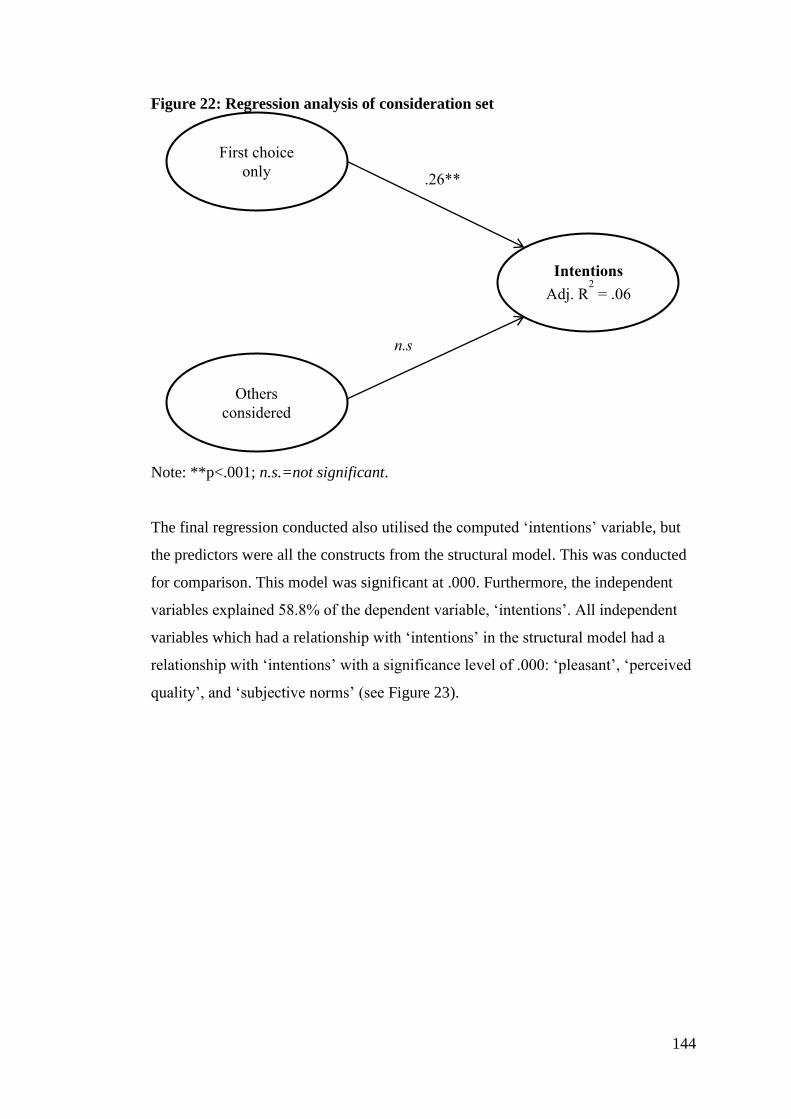
144
Figure 22: Regression analysis of consideration set
Note: **p<.001; n.s.=not significant.
The final regression conducted also utilised the computed ‘intentions’ variable, but
the predictors were all the constructs from the structural model. This was conducted
for comparison. This model was significant at .000. Furthermore, the independent
variables explained 58.8% of the dependent variable, ‘intentions’. All independent
variables which had a relationship with ‘intentions’ in the structural model had a
relationship with ‘intentions’ with a significance level of .000: ‘pleasant’, ‘perceived
quality’, and ‘subjective norms’ (see Figure 23).
First choice
only
Others
considered
Intentions
Adj. R2 = .06
.26**
n.s
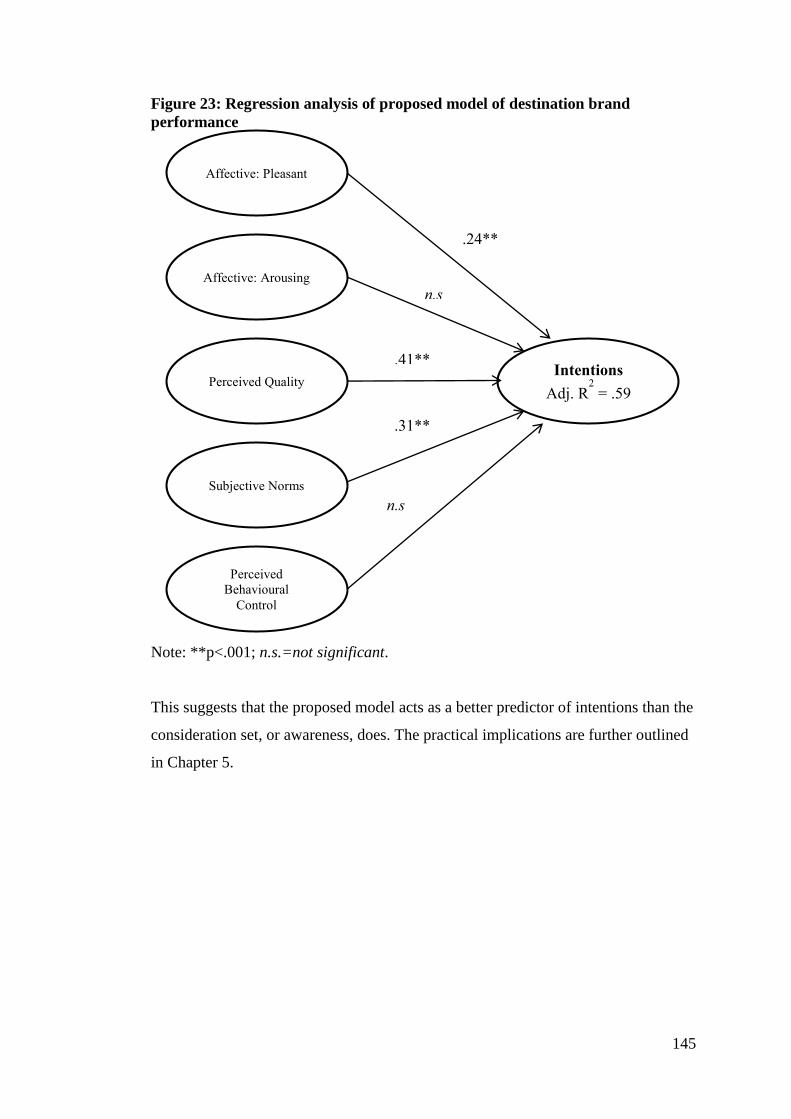
145
Figure 23: Regression analysis of proposed model of destination brand
performance
Note: **p<.001; n.s.=not significant.
This suggests that the proposed model acts as a better predictor of intentions than the
consideration set, or awareness, does. The practical implications are further outlined
in Chapter 5.
Affective: Arousing
Perceived Quality
Subjective Norms
Intentions
Adj. R2 = .59
n.s
.41**
.31**
Affective: Pleasant
Perceived
Behavioural
Control
n.s
.24**
146
4.6 Summary
This chapter outlined the utilised research design and data analysis. The descriptive
statistics were outlined and the sample characteristics were discussed overall before
an examination of each of the eight samples was provided. Importance-performance
analyses were conducted to better understand the use of the destination image
attributes across travel contexts for each destination. The use of questionnaires
ensured adequate data was attained to address the proposed research objectives, and
the overall aim to develop and test a model of destination brand performance. The
theoretical and practical implications are discussed in Chapter Five. Furthermore, a
discussion relative to each of the research objectives is outlined.
147
Chapter Five: Discussion
5.0 Overall purpose of the research
The overall purpose of this research was to develop and test a model of destination
brand performance across travel contexts. Each study had specific aims, which
addressed the overall research objectives. This chapter begins with a discussion of
the research findings, for each of the studies relative to the overall research question
(RQ) and research objectives:
RQ: How should the consumer-based brand equity (CBBE) hierarchy be developed
to measure destination brand performance, and does brand performance differ across
different travel contexts?
Research objectives:
1. To develop and test a model of consumer-based destination brand
performance.
2. To identify if there is a difference in destination image attributes relative to
travel context.
3. To identify if there is a difference in destination brand performance relative
to travel context.
4. To investigate the level of congruence between the destination brand identity
and destination brand image.
Secondly, the theoretical and practical implications are outlined, followed by the
limitations of the research and recommendations for future research. Finally, this
chapter will summarise and conclude the overall study to develop a model to
measure destination brand performance across travel contexts.
5.1 Discussion of the research findings
The discussion of findings is split into two core components, Study One and Study
Two. The findings from both studies are outlined in regard to the study-specific
research objectives, before addressing the overall research objectives.
148
5.1.1 Study One.
The discussion of Study One is split into three sections, based on the study-specific
research objectives. The study-specific research objectives for Study One were:
i. To identify image attributes salient to consumers when evaluating
destinations.
ii. To identify if there is a difference in image attributes identified across
travel contexts.
iii. To develop a scale for the destination image dimension of destination
brand performance.
5.1.1.1 To identify image attributes salient to consumers when evaluating
destinations.
Personal interviews with consumers were utilised. This was to better understand
those attributes which were salient, or important to them. Salience was assessed
using the level of frequency for each attribute examined (Fishbein, 1963). Personal
interviews with consumers resulted in 23 destination image attribute categories from
the short-break holiday interviews and 24 categories from the longer holiday
categories. These attribute categories were compared across travel contexts (see
Section 5.1.1.2), and triangulated with an analysis of the literature and a document
analysis (see Section 5.1.1.3).
5.1.1.2 To identify if there is a difference in image attributes identified
across travel contexts.
Attributes were elicited from consumers to ensure relevance for comparison across
two travel contexts. While there were differences identified in the ranking of
attribute category salience across the contexts, attributes remained consistent, with
the exception of ‘well built up’, ‘caters for tourists’ which were identified for short-
break holidays and ‘shopping’, ‘not commercial’ and ‘further away’ for longer
holidays. However, all unique attribute categories were not in the 10 most frequently
discussed categories. Comparison of the two contexts indicates that relatively
consistent salient attribute categories were identified. However, different rankings of
frequency exist for each context. Attribute categories were ranked firstly by the
149
number of participants that mentioned it, and secondly, by the number of verbal
statements elicited which were within the category. That is, attributes were deemed
more prominent to consumers relative to how frequently they were discussed
(Fishbein, 1963). This suggests that attribute categories used to evaluate destinations
remain consistent, as most attribute categories were elicited for both travel contexts,
but have differing levels of salience to participants relative to the travel context
under scrutiny.
As there were few differences between travel contexts examined this emphasises that
a destination brand can be measured across travel contexts. This relates to different
leisure contexts, and utilises elicited attributes. This further justifies Gertner’s (2010)
study which used pre-determined attributes. This research also contributes to the
expectancy-value theory (EVT). As outlined in Chapter Two, EVT is facilitated on
the view that a “person’s attitude toward an object is a function of [their] salient
beliefs that the object has certain attributes and [their] evaluations of these attributes”
(Ajzen & Fishbein, 1980, p. 153; Rosenberg, 1956). These attributes are generally
assessed within a particular category, for example wine tourism (Sparks, 2007).
However, the premise of this study was to create a scale which could be used across
travel contexts.
The findings from the Repertory Test interviews are also underpinned by personal
construct theory (PCT). As outlined in Chapter Three (see Section 3.3.1), Kelly’s
(1955) PCT is underpinned by 11 corollaries. A summary of the 11 corollaries is
outlined in Appendix 3. The two most pertinent corollaries to this study were the
individuality corollary and the commonality corollary. The individuality corollary
considers that different people will have different views or experiences of an event.
However, the commonality corollary suggests that while there are these inherent
differences, there will still be similarities among people (Kelly, 1955). Individuality
was identified through the range of different verbal statements elicited, however the
categories identified through the analysis resulted in common categories across
participants. Therefore, while differences were identified in the elicitation of
attributes, the commonality corollary emphasises that people, to an extent,
collectively view events or objects in similar ways. This highlights that the attribute
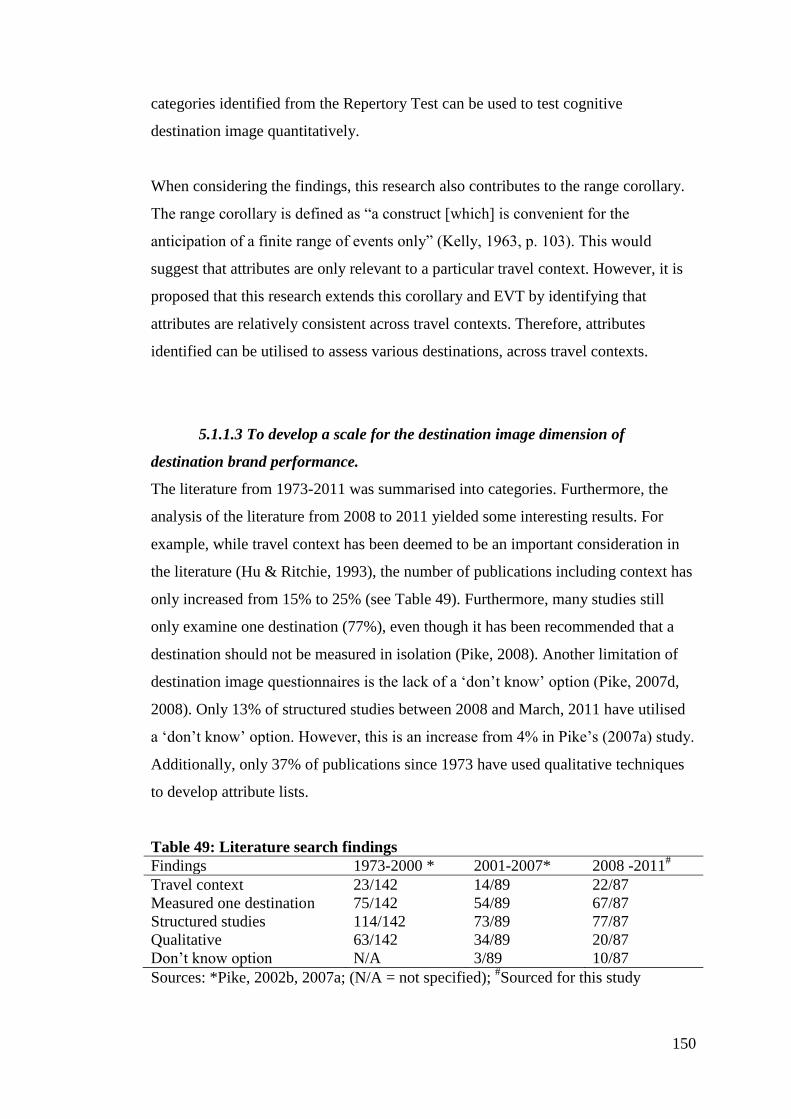
150
categories identified from the Repertory Test can be used to test cognitive
destination image quantitatively.
When considering the findings, this research also contributes to the range corollary.
The range corollary is defined as “a construct [which] is convenient for the
anticipation of a finite range of events only” (Kelly, 1963, p. 103). This would
suggest that attributes are only relevant to a particular travel context. However, it is
proposed that this research extends this corollary and EVT by identifying that
attributes are relatively consistent across travel contexts. Therefore, attributes
identified can be utilised to assess various destinations, across travel contexts.
5.1.1.3 To develop a scale for the destination image dimension of
destination brand performance.
The literature from 1973-2011 was summarised into categories. Furthermore, the
analysis of the literature from 2008 to 2011 yielded some interesting results. For
example, while travel context has been deemed to be an important consideration in
the literature (Hu & Ritchie, 1993), the number of publications including context has
only increased from 15% to 25% (see Table 49). Furthermore, many studies still
only examine one destination (77%), even though it has been recommended that a
destination should not be measured in isolation (Pike, 2008). Another limitation of
destination image questionnaires is the lack of a ‘don’t know’ option (Pike, 2007d,
2008). Only 13% of structured studies between 2008 and March, 2011 have utilised
a ‘don’t know’ option. However, this is an increase from 4% in Pike’s (2007a) study.
Additionally, only 37% of publications since 1973 have used qualitative techniques
to develop attribute lists.
Table 49: Literature search findings
Findings 1973-2000 * 2001-2007* 2008 -2011#
Travel context 23/142 14/89 22/87
Measured one destination 75/142 54/89 67/87
Structured studies 114/142 73/89 77/87
Qualitative 63/142 34/89 20/87
Don’t know option N/A 3/89 10/87
Sources: *Pike, 2002b, 2007a; (N/A = not specified); #Sourced for this study
151
Comparatively this thesis examined multiple destinations across two travel contexts,
allowing for better comparison of destination image. Furthermore, a qualitative stage
was utilised to develop an attribute list and travel context was assessed to identify
any differences.
In regard to the document analysis, using a deductive approach, consistent attributes
were identified with the analysis of the literature. However, when comparing these
two methods to the personal interviews with consumers, unique attributes were
identified. This suggests some incongruence with destination brand identity and
destination brand image. This is discussed further in Section 5.1.2.3. However, the
triangulation of these attributes resulted in one synthesised list of attributes relative
to cognitive destination image.
5.1.1.4 Summary.
Each of the study-specific objectives was used to guide Study One. The findings
from Study One assisted in addressing the second overall research objective: To
identify if there is a difference in destination image attributes relative to travel
context.
Additionally, the findings from the first study suggest the extension of both EVT,
and the range corollary within PCT. This research identifies that destinations can be
assessed across travel contexts, due to the relatively consistent attributes elicited
from the personal interviews with consumers.
Furthermore, the development of the list of destination image attributes, through
triangulation between personal interviews with consumers, document analysis and
the content analysis of the literature, emphasised the creation of one list of attributes
for testing. This list of 29 attributes was suitable for use in Study Two to test the
proposed model of destination brand performance.
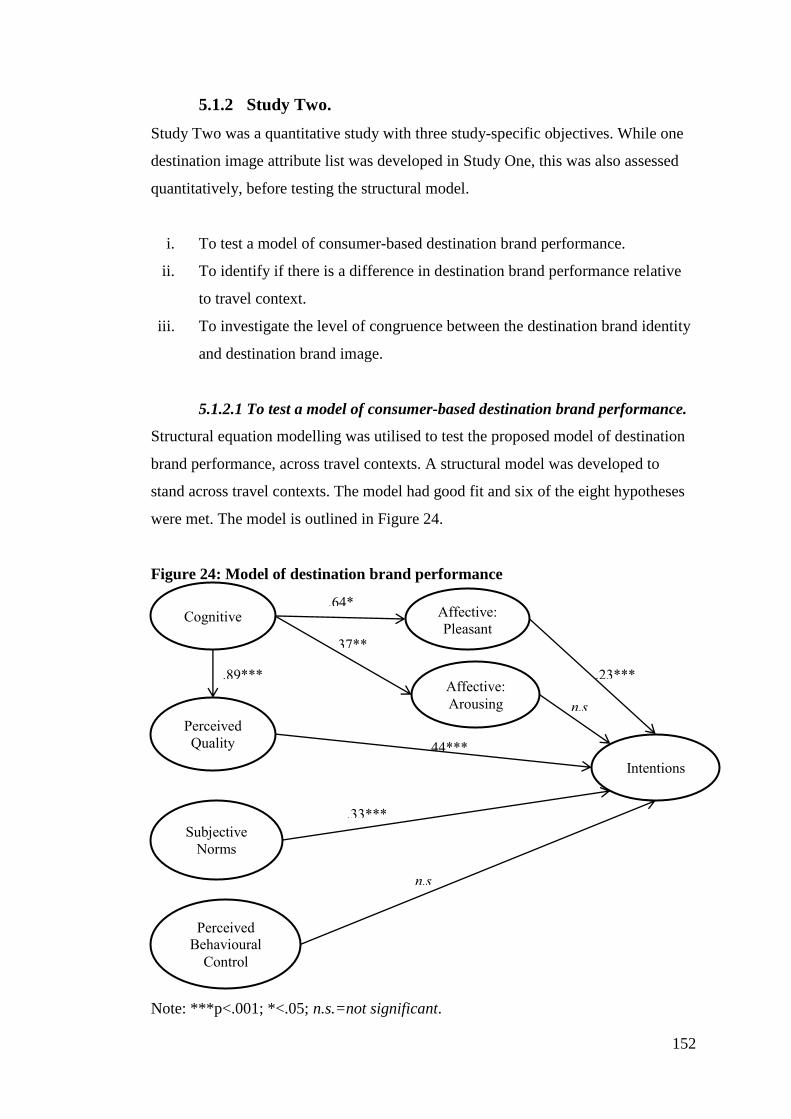
152
5.1.2 Study Two.
Study Two was a quantitative study with three study-specific objectives. While one
destination image attribute list was developed in Study One, this was also assessed
quantitatively, before testing the structural model.
i. To test a model of consumer-based destination brand performance.
ii. To identify if there is a difference in destination brand performance relative
to travel context.
iii. To investigate the level of congruence between the destination brand identity
and destination brand image.
5.1.2.1 To test a model of consumer-based destination brand performance.
Structural equation modelling was utilised to test the proposed model of destination
brand performance, across travel contexts. A structural model was developed to
stand across travel contexts. The model had good fit and six of the eight hypotheses
were met. The model is outlined in Figure 24.
Figure 24: Model of destination brand performance
Note: ***p<.001; *<.05; n.s.=not significant.
Cognitive
Affective:
Arousing
Subjective
Norms
Perceived
Quality
Intentions
Affective:
Pleasant
Perceived
Behavioural
Control
.89***
.33***
n.s
.64*
.23***
n.s
.37**
.44***
153
H1a: Cognitive beliefs Pleasant attitude
A positive and significant relationship was hypothesised in this study. As outlined, a
positive and significant relationship did exist (β=.64, p<.05). This is consistent with
the concept that cognitive image is an antecedent of affective attitude (Baloglu,
1999; Baloglu & McCleary, 1999; Li, Cai, Lehto, & Huang, 2010; San Martin & del
Bosque, 2008; Stern & Krakover, 1993). While this study did split the affective
component of the model in line with previous literature (see Section 2.5.1), a positive
relationship was still identified.
H1b: Cognitive beliefs Arousing attitude
A significant relationship was hypothesised in this study. As outlined, a positive and
significant relationship did exist (β= .37, p<.001). This is also consistent with the
literature, that cognitive image is an antecedent of affective image (Baloglu, 1999;
Baloglu & McCleary, 1999; San Martin & del Bosque, 2008; Stern & Krakover,
1993).
H2: Cognitive Perceived quality
This study hypothesised a significant and positive relationship between cognitive
beliefs and perceived quality. The relationship outlined in the model was both
positive and significant (β=.89; p<.001). This is consistent with previous literature
when considering the CBBE hierarchy (Low & Lamb, 2000).
H3a: Pleasant attitude Intentions
A significant and positive relationship was hypothesised by this study. The analysis
identified that a significant and positive relationship did exist (β=.23, p<.001). The
relationship between attitude and intentions is consistent with the literature (Bigne,
Sanchez, & Sanchez, 2001; Prayag, 2009).
154
H3b: Arousing attitude Intentions
A significant relationship was hypothesised in this study. However, no relationship
was identified in this study. Previously, it has been noted that differences may exist
between domestic and international visitors to a destination (Ryan & Pike, 2003). It
is suggested that further research be conducted examining both domestic and
international markets to further examine if differences exist based on place of
residence, or the evaluation of international destinations.
H4: Perceived quality Intentions
A significant and positive relationship was hypothesised by this study. The analysis
identified that a significant and positive relationship did exist (β=.44, p<.001). This
is consistent with the literature (Buhalis, 2000; Jayanti & Ghosh, 1996; Low &
Lamb, 2000; Pike et al., 2010)
H5: Subjective norms Intentions
A significant and positive relationship was hypothesised by this study (Lam & Hsu,
2006; Sparks & Pan, 2009). The analysis identified that a significant and positive
relationship did exist (β=.33, p<.001).
H6: Perceived behavioural control Intentions
A significant and positive relationship was hypothesised by this study. The analysis
identified that a non-significant relationship existed. However, Lam and Hsu (2006)
identified a significant and positive relationship for an international destination.
While it was considered that time, money and control (Sparks & Pan, 2009) would
have a significant impact on intentions, in retrospect this may not have occurred as
near home destinations were considered. It is therefore recommended that this study
be conducted considering international, or long haul destinations to assess whether
perceived behavioural control has a significant relationship.
The consideration set of a consumer was also discussed further in Chapter Two. It
was proposed that having a destination in a consumer’s decision set may be a better
indicator than using various constructs of destination brand performance.
Regressions were conducted to understand the relationships between the proposed
variables and intentions, as outlined in Chapter Two. It was identified that the
155
consideration set only explained 6.2% of intentions, and only the first choice of
destination had a significant relationship. When considering the overall proposed
model of destination brand performance, 58.8% was explained by the independent
variables. This suggests that when considering the factors of destination brand
performance, the overall proposed model is a better indicator of intentions than being
in a consumer’s consideration set is. The practical implications of this are outlined
further in Section 5.2.2.
5.1.2.2 To identify if there is a difference in destination brand performance
relative to travel context.
Comparison of means was conducted to identify if there is a difference in destination
brand performance based on travel context. Only three differences were found within
the latent variables: SN2, PBC1 and PQ1. PQ1 was removed from the model due to
high standardised residual covariance values. Within the index, or cognitive image,
nine differences were found for importance: ‘shopping’, ‘weather’, ‘history’, ‘tourist
information’, ‘safety’, ‘cleanliness’, ‘cost’, ‘popularity’, and ‘coast’. In regard to
performance, this was considered for each destination, and compared across travel
context. Few differences were found.
Both the Gold Coast and Sunshine Coast data showed no statistically significant
differences across travel contexts. Furthermore, there was only one difference across
travel contexts for the Moreton Bay Islands data: ‘cleanliness’. Three statistically
significant differences existed for the Northern New South Wales data: ‘more to see
and do’, ‘not commercial’, and ‘islands’. This indicates that while differences were
identified in importance, when considering destination performance, or the belief
that the destination has an attribute, performance was relatively consistent. This is
consistent with the proposition that importance of attributes will differ across travel
contexts, but not performance of the destination. This addresses the third overall
research objective, and the second study-specific objective, to identify if any
differences exist in regard to destination performance across travel contexts.
156
5.1.2.3 To investigate the level of congruence between the destination
brand identity and destination brand image.
Examination of the destination image attributes allowed comparison between
destination brand identity and destination brand image to assess congruence. That is,
the brand identities (see Chapter One, Section 1.4), were compared to the
performance of attributes for each destination, outlined in the importance-
performance analyses (IPAs). Table 50 and Table 51 summarise the performance of
the destinations across both image attributes, and items from the other latent
variables used as independent variables to assess destination brand performance. The
comparative positioning of the destinations investigated is also outlined for each
travel context. That is, a rank value is provided with ‘1’ representing the highest
performing destination, and ‘4’ representing the lowest performing destination
comparatively.
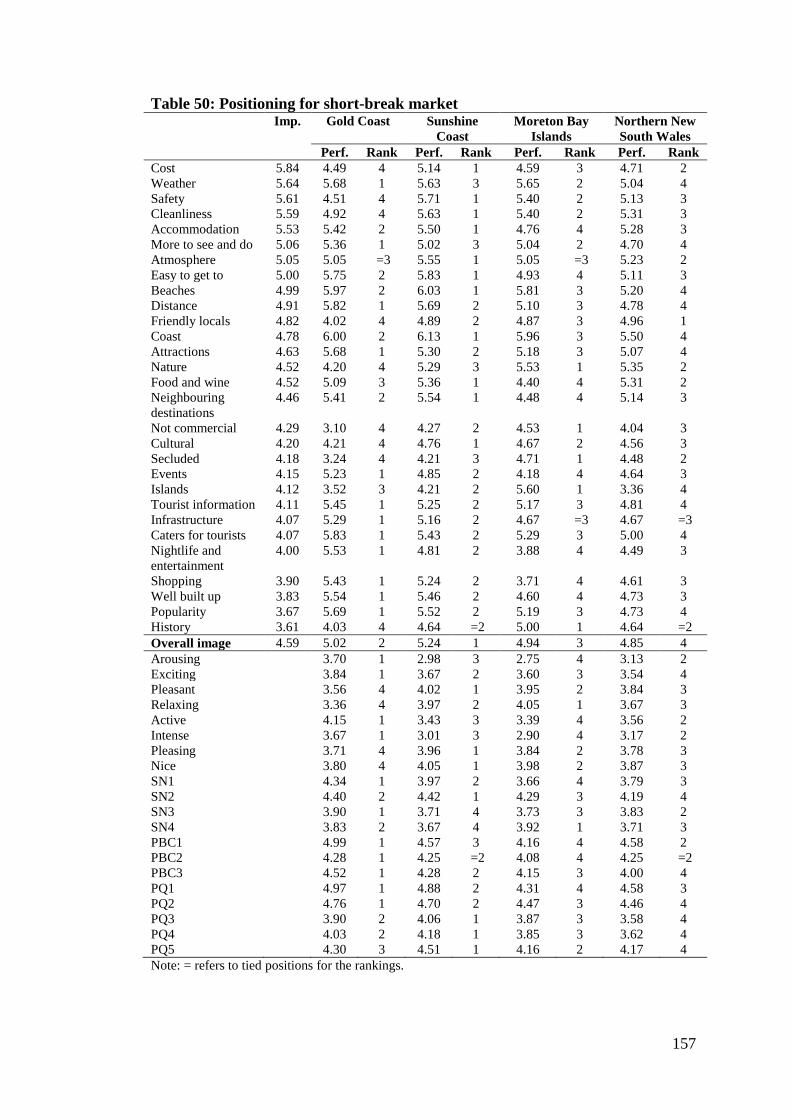
157
Table 50: Positioning for short-break market Imp. Gold Coast Sunshine
Coast
Moreton Bay
Islands
Northern New
South Wales
Perf. Rank Perf. Rank Perf. Rank Perf. Rank
Cost 5.84 4.49 4 5.14 1 4.59 3 4.71 2
Weather 5.64 5.68 1 5.63 3 5.65 2 5.04 4
Safety 5.61 4.51 4 5.71 1 5.40 2 5.13 3
Cleanliness 5.59 4.92 4 5.63 1 5.40 2 5.31 3
Accommodation 5.53 5.42 2 5.50 1 4.76 4 5.28 3
More to see and do 5.06 5.36 1 5.02 3 5.04 2 4.70 4
Atmosphere 5.05 5.05 =3 5.55 1 5.05 =3 5.23 2
Easy to get to 5.00 5.75 2 5.83 1 4.93 4 5.11 3
Beaches 4.99 5.97 2 6.03 1 5.81 3 5.20 4
Distance 4.91 5.82 1 5.69 2 5.10 3 4.78 4
Friendly locals 4.82 4.02 4 4.89 2 4.87 3 4.96 1
Coast 4.78 6.00 2 6.13 1 5.96 3 5.50 4
Attractions 4.63 5.68 1 5.30 2 5.18 3 5.07 4
Nature 4.52 4.20 4 5.29 3 5.53 1 5.35 2
Food and wine 4.52 5.09 3 5.36 1 4.40 4 5.31 2
Neighbouring
destinations
4.46 5.41 2 5.54 1 4.48 4 5.14 3
Not commercial 4.29 3.10 4 4.27 2 4.53 1 4.04 3
Cultural 4.20 4.21 4 4.76 1 4.67 2 4.56 3
Secluded 4.18 3.24 4 4.21 3 4.71 1 4.48 2
Events 4.15 5.23 1 4.85 2 4.18 4 4.64 3
Islands 4.12 3.52 3 4.21 2 5.60 1 3.36 4
Tourist information 4.11 5.45 1 5.25 2 5.17 3 4.81 4
Infrastructure 4.07 5.29 1 5.16 2 4.67 =3 4.67 =3
Caters for tourists 4.07 5.83 1 5.43 2 5.29 3 5.00 4
Nightlife and
entertainment
4.00 5.53 1 4.81 2 3.88 4 4.49 3
Shopping 3.90 5.43 1 5.24 2 3.71 4 4.61 3
Well built up 3.83 5.54 1 5.46 2 4.60 4 4.73 3
Popularity 3.67 5.69 1 5.52 2 5.19 3 4.73 4
History 3.61 4.03 4 4.64 =2 5.00 1 4.64 =2
Overall image 4.59 5.02 2 5.24 1 4.94 3 4.85 4
Arousing 3.70 1 2.98 3 2.75 4 3.13 2
Exciting 3.84 1 3.67 2 3.60 3 3.54 4
Pleasant 3.56 4 4.02 1 3.95 2 3.84 3
Relaxing 3.36 4 3.97 2 4.05 1 3.67 3
Active 4.15 1 3.43 3 3.39 4 3.56 2
Intense 3.67 1 3.01 3 2.90 4 3.17 2
Pleasing 3.71 4 3.96 1 3.84 2 3.78 3
Nice 3.80 4 4.05 1 3.98 2 3.87 3
SN1 4.34 1 3.97 2 3.66 4 3.79 3
SN2 4.40 2 4.42 1 4.29 3 4.19 4
SN3 3.90 1 3.71 4 3.73 3 3.83 2
SN4 3.83 2 3.67 4 3.92 1 3.71 3
PBC1 4.99 1 4.57 3 4.16 4 4.58 2
PBC2 4.28 1 4.25 =2 4.08 4 4.25 =2
PBC3 4.52 1 4.28 2 4.15 3 4.00 4
PQ1 4.97 1 4.88 2 4.31 4 4.58 3
PQ2 4.76 1 4.70 2 4.47 3 4.46 4
PQ3 3.90 2 4.06 1 3.87 3 3.58 4
PQ4 4.03 2 4.18 1 3.85 3 3.62 4
PQ5 4.30 3 4.51 1 4.16 2 4.17 4
Note: = refers to tied positions for the rankings.
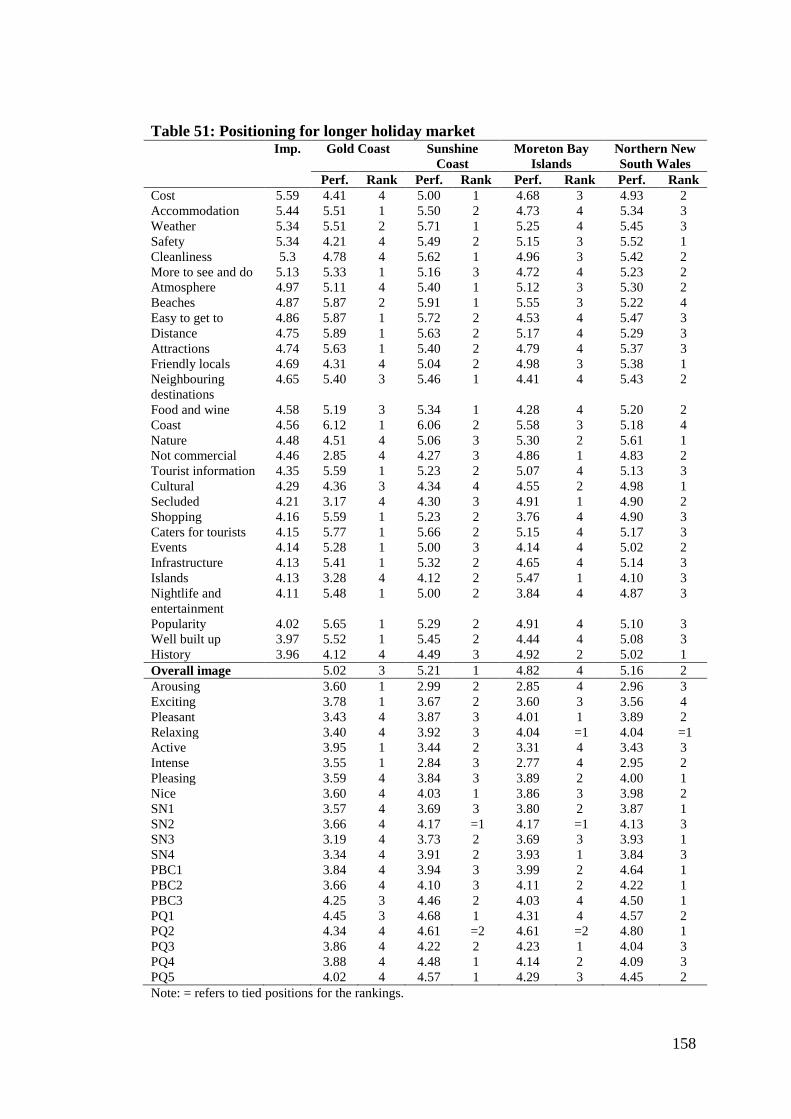
158
Table 51: Positioning for longer holiday market Imp. Gold Coast Sunshine
Coast
Moreton Bay
Islands
Northern New
South Wales
Perf. Rank Perf. Rank Perf. Rank Perf. Rank
Cost 5.59 4.41 4 5.00 1 4.68 3 4.93 2
Accommodation 5.44 5.51 1 5.50 2 4.73 4 5.34 3
Weather 5.34 5.51 2 5.71 1 5.25 4 5.45 3
Safety 5.34 4.21 4 5.49 2 5.15 3 5.52 1
Cleanliness 5.3 4.78 4 5.62 1 4.96 3 5.42 2
More to see and do 5.13 5.33 1 5.16 3 4.72 4 5.23 2
Atmosphere 4.97 5.11 4 5.40 1 5.12 3 5.30 2
Beaches 4.87 5.87 2 5.91 1 5.55 3 5.22 4
Easy to get to 4.86 5.87 1 5.72 2 4.53 4 5.47 3
Distance 4.75 5.89 1 5.63 2 5.17 4 5.29 3
Attractions 4.74 5.63 1 5.40 2 4.79 4 5.37 3
Friendly locals 4.69 4.31 4 5.04 2 4.98 3 5.38 1
Neighbouring
destinations
4.65 5.40 3 5.46 1 4.41 4 5.43 2
Food and wine 4.58 5.19 3 5.34 1 4.28 4 5.20 2
Coast 4.56 6.12 1 6.06 2 5.58 3 5.18 4
Nature 4.48 4.51 4 5.06 3 5.30 2 5.61 1
Not commercial 4.46 2.85 4 4.27 3 4.86 1 4.83 2
Tourist information 4.35 5.59 1 5.23 2 5.07 4 5.13 3
Cultural 4.29 4.36 3 4.34 4 4.55 2 4.98 1
Secluded 4.21 3.17 4 4.30 3 4.91 1 4.90 2
Shopping 4.16 5.59 1 5.23 2 3.76 4 4.90 3
Caters for tourists 4.15 5.77 1 5.66 2 5.15 4 5.17 3
Events 4.14 5.28 1 5.00 3 4.14 4 5.02 2
Infrastructure 4.13 5.41 1 5.32 2 4.65 4 5.14 3
Islands 4.13 3.28 4 4.12 2 5.47 1 4.10 3
Nightlife and
entertainment
4.11 5.48 1 5.00 2 3.84 4 4.87 3
Popularity 4.02 5.65 1 5.29 2 4.91 4 5.10 3
Well built up 3.97 5.52 1 5.45 2 4.44 4 5.08 3
History 3.96 4.12 4 4.49 3 4.92 2 5.02 1
Overall image 5.02 3 5.21 1 4.82 4 5.16 2
Arousing 3.60 1 2.99 2 2.85 4 2.96 3
Exciting 3.78 1 3.67 2 3.60 3 3.56 4
Pleasant 3.43 4 3.87 3 4.01 1 3.89 2
Relaxing 3.40 4 3.92 3 4.04 =1 4.04 =1
Active 3.95 1 3.44 2 3.31 4 3.43 3
Intense 3.55 1 2.84 3 2.77 4 2.95 2
Pleasing 3.59 4 3.84 3 3.89 2 4.00 1
Nice 3.60 4 4.03 1 3.86 3 3.98 2
SN1 3.57 4 3.69 3 3.80 2 3.87 1
SN2 3.66 4 4.17 =1 4.17 =1 4.13 3
SN3 3.19 4 3.73 2 3.69 3 3.93 1
SN4 3.34 4 3.91 2 3.93 1 3.84 3
PBC1 3.84 4 3.94 3 3.99 2 4.64 1
PBC2 3.66 4 4.10 3 4.11 2 4.22 1
PBC3 4.25 3 4.46 2 4.03 4 4.50 1
PQ1 4.45 3 4.68 1 4.31 4 4.57 2
PQ2 4.34 4 4.61 =2 4.61 =2 4.80 1
PQ3 3.86 4 4.22 2 4.23 1 4.04 3
PQ4 3.88 4 4.48 1 4.14 2 4.09 3
PQ5 4.02 4 4.57 1 4.29 3 4.45 2
Note: = refers to tied positions for the rankings.

159
The Gold Coast’s brand identity, or message the DMO wishes to send to consumers,
is an emotive appeal, focused on the slogan ‘Gold Coast. Famous for Fun’. The
brand identity utilised has a focus on four key themes: beaches, hinterland, theme
parks and entertainment. Examination of the attributes for both a short-break holiday
and longer holiday, based on the positioning outlined in Table 50 and Table 51,
shows relative congruence with three of the four attributes. From the four tested
destinations, the Gold Coast is positioned as the highest performing destination for
‘attractions’ and ‘nightlife and entertainment’. Based on the IPA conducted for the
Gold Coast, it was identified that for both travel contexts ‘attractions’ appeared in
quadrant two. This suggests that this attribute is performing well, and is important to
consumers. Therefore, the destination should continue to maintain attractions and
ensure that performance remains at this level (Bruyere et al., 2002).
In regard to ‘nightlife and entertainment’, this attribute appeared in quadrant four,
confirming the high level of performance outlined in the positioning (see tables 50
and 51). However, it also suggests this attribute is not important to consumers
relative to other destination image attributes. Therefore, it is suggested that resources
could be over allocated to the ‘nightlife and entertainment’ attribute (Bruyere et al.,
2002; Crompton & Duray, 1985), and less emphasis should be placed on it.
The Gold Coast was the second highest performing destination regarding ‘beaches’,
suggesting they are performing this attribute adequately. This also appeared in
quadrant two of the IPAs for both travel contexts, further emphasising congruence.
However, there was also an emphasis on the Hinterlands, which was not performing
well comparatively. The Gold Coast is ranked as the lowest performing destination
of the four investigated for ‘nature’. This attribute also appeared in quadrant three,
meaning it was not important, and was not being performed well comparatively. This
is incongruent with the identity, and suggests that the focus should be placed on the
other attributes, with which they currently have a competitive advantage.
Finally, in regard to the subjective norm component of the overall model, the four
items ranked the Gold Coast as either the highest, or second highest, destination for
the short-break data. This emphasises the aspect of the identity referring to sharing
the experience with friends and other holiday makers. However, for the longer
160
holiday data, the Gold Coast was the lowest performing destination, suggesting this
component of the identity is not congruent for longer holidays. It is proposed further
research should be conducted to better understand this finding.
The Sunshine Coast’s brand identity focuses on nature, and an authentic lifestyle,
emphasising a destination which is healthy and family-friendly. Furthermore, there is
a focus on shops, cafes, beaches, hills, and the hinterland, as well as friendly locals.
In both Table 50 and Table 51 the Sunshine Coast was rated third from the four
destinations investigated on ‘nature’, suggesting this is not an attribute which has a
competitive advantage for the destination, relative to the hinterlands and hills. This
was further emphasised in the longer holiday IPA, as the attribute was in quadrant
three, meaning it was not important, and underperformed. However, for a short-
break holiday, consumers felt that nature, while under important, was well performed
by the destination. It is suggested that this is not congruent, and the destination
should shift resources towards other attributes (Bruyere et al., 2002; Crompton &
Duray, 1985).
The Sunshine Coast was rated as the destination with the highest performance of
both ‘food and wine’, and ‘beaches’, as well as the second highest performance of
‘shopping’ and ‘friendly locals’. ‘Food and wine’ was allocated to quadrant four of
the IPAs for both contexts. This suggests that while the Sunshine Coast is
performing this attribute well, it is not important to consumers. However, in regard
to ‘beaches’ this appeared in quadrant two, suggesting it is performed well by the
destination, and important to consumers. Therefore ‘beaches’ should remain a focus
of the brand identity of the Sunshine Coast.
Finally, another aspect of the identity was to promote the Sunshine Coast as a
destination that was not travelled to so as to impress others (Tourism Queensland,
2011b). Differences were identified within the subjective norm items. However, the
destination was one of the lowest rated in regard to the item assessing whether a
destination is popular to the consumer’s family and friends. This suggests
congruence with the brand identity.
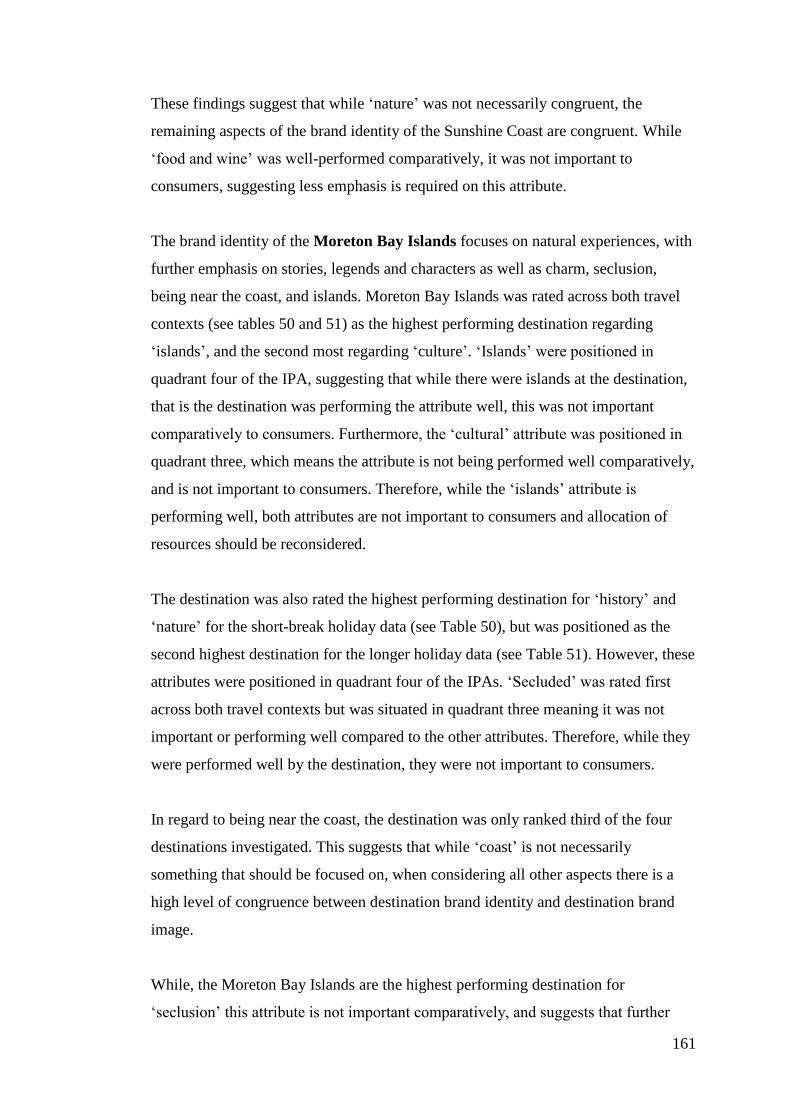
161
These findings suggest that while ‘nature’ was not necessarily congruent, the
remaining aspects of the brand identity of the Sunshine Coast are congruent. While
‘food and wine’ was well-performed comparatively, it was not important to
consumers, suggesting less emphasis is required on this attribute.
The brand identity of the Moreton Bay Islands focuses on natural experiences, with
further emphasis on stories, legends and characters as well as charm, seclusion,
being near the coast, and islands. Moreton Bay Islands was rated across both travel
contexts (see tables 50 and 51) as the highest performing destination regarding
‘islands’, and the second most regarding ‘culture’. ‘Islands’ were positioned in
quadrant four of the IPA, suggesting that while there were islands at the destination,
that is the destination was performing the attribute well, this was not important
comparatively to consumers. Furthermore, the ‘cultural’ attribute was positioned in
quadrant three, which means the attribute is not being performed well comparatively,
and is not important to consumers. Therefore, while the ‘islands’ attribute is
performing well, both attributes are not important to consumers and allocation of
resources should be reconsidered.
The destination was also rated the highest performing destination for ‘history’ and
‘nature’ for the short-break holiday data (see Table 50), but was positioned as the
second highest destination for the longer holiday data (see Table 51). However, these
attributes were positioned in quadrant four of the IPAs. ‘Secluded’ was rated first
across both travel contexts but was situated in quadrant three meaning it was not
important or performing well compared to the other attributes. Therefore, while they
were performed well by the destination, they were not important to consumers.
In regard to being near the coast, the destination was only ranked third of the four
destinations investigated. This suggests that while ‘coast’ is not necessarily
something that should be focused on, when considering all other aspects there is a
high level of congruence between destination brand identity and destination brand
image.
While, the Moreton Bay Islands are the highest performing destination for
‘seclusion’ this attribute is not important comparatively, and suggests that further
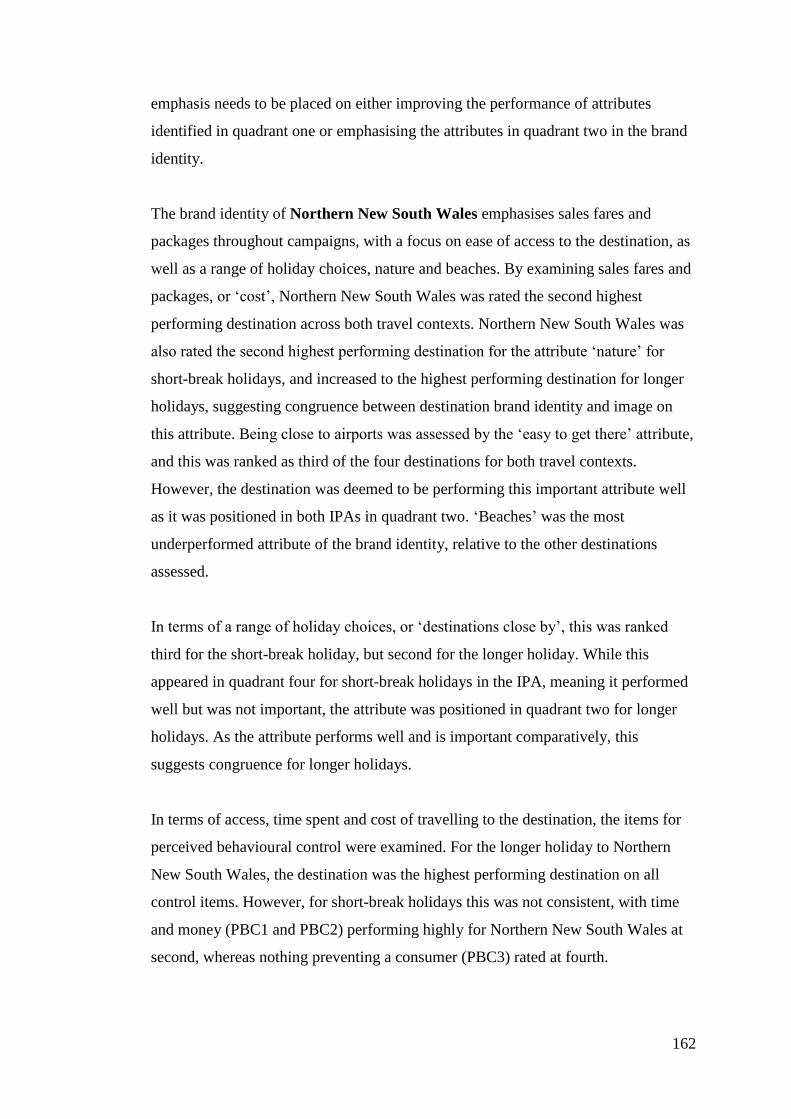
162
emphasis needs to be placed on either improving the performance of attributes
identified in quadrant one or emphasising the attributes in quadrant two in the brand
identity.
The brand identity of Northern New South Wales emphasises sales fares and
packages throughout campaigns, with a focus on ease of access to the destination, as
well as a range of holiday choices, nature and beaches. By examining sales fares and
packages, or ‘cost’, Northern New South Wales was rated the second highest
performing destination across both travel contexts. Northern New South Wales was
also rated the second highest performing destination for the attribute ‘nature’ for
short-break holidays, and increased to the highest performing destination for longer
holidays, suggesting congruence between destination brand identity and image on
this attribute. Being close to airports was assessed by the ‘easy to get there’ attribute,
and this was ranked as third of the four destinations for both travel contexts.
However, the destination was deemed to be performing this important attribute well
as it was positioned in both IPAs in quadrant two. ‘Beaches’ was the most
underperformed attribute of the brand identity, relative to the other destinations
assessed.
In terms of a range of holiday choices, or ‘destinations close by’, this was ranked
third for the short-break holiday, but second for the longer holiday. While this
appeared in quadrant four for short-break holidays in the IPA, meaning it performed
well but was not important, the attribute was positioned in quadrant two for longer
holidays. As the attribute performs well and is important comparatively, this
suggests congruence for longer holidays.
In terms of access, time spent and cost of travelling to the destination, the items for
perceived behavioural control were examined. For the longer holiday to Northern
New South Wales, the destination was the highest performing destination on all
control items. However, for short-break holidays this was not consistent, with time
and money (PBC1 and PBC2) performing highly for Northern New South Wales at
second, whereas nothing preventing a consumer (PBC3) rated at fourth.
163
Overall, it was identified that there was an emphasis on certain attributes by some
destinations that do not match. For example, for Northern New South Wales there
was a focus on beaches, and this attribute was rated fourth. While there were some
attributes which were inconsistent, overall three destinations had a component of the
brand identity which aligned with the image received by consumers. However, the
Moreton Bay Islands had little congruence, and emphasis should be placed on either
increasing the performance of attributes in quadrant one of the IPAs, or further
promoting those attributes from quadrant two.
5.1.3 Relating to the overall research objectives.
The overall research objectives were addressed through the study-specific objectives.
These are outlined again:
1. To develop and test a model of consumer-based destination brand
performance.
2. To identify if there is a difference in destination image attributes relative to
travel context.
3. To identify if there is a difference in destination brand performance relative
to travel context.
4. To investigate the level of congruence between the destination brand identity
and destination brand image.
To develop a model of consumer-based destination brand performance, the literature
was used to define constructs and hypothesise relationships. This model was tested
in Study Two (see Section 5.1.2.1). To identify if there are any differences in
destination image attributes relative to travel context an exploratory study was
conducted. This was also utilised to develop a list of destination image attributes for
use in Study Two (see Section 5.1.1). Furthermore, differences were assessed
utilising an independent samples t-test. To identify if any differences existed in
destination brand performance relative to travel context; each destination
investigated was assessed using an independent samples t-test. This assessed any key
differences across travel context for each destination. Few differences were
identified (see Section 5.1.2.2). The final objective was to assess the congruence
164
between destination brand identity and destination brand image. Incongruence was
found between some attributes relative to particular brand identities. However
triangulation of results from Study One suggests the destination image list is
adequate (see Section 5.1.2.3).
5.2 Implications
The theoretical and practical implications are outlined in this section. These are each
discussed regarding both the first and second study.
5.2.1 Theoretical implications.
Conceptually, the first study contributes to the literature by identifying minimal
differences between travel contexts. It is proposed, based on the attributes elicited,
that destinations could be evaluated across travel contexts. That is, this research
proposes that destinations could be measured across travel contexts, using
expectancy-value theory (EVT), and should not be constrained to one particular
category, or in this case, travel context. This addresses the overall research objective:
To identify if there is a difference in destination brand performance relative to travel
context.
As the findings from the Repertory Test interviews are also underpinned by personal
construct theory (PCT) (see Section 3.3.1) this study provides a theoretical
contribution by also extending the knowledge of the range corollary (see Appendix
3). The range corollary suggests that findings are only useful for a finite range of
events. However, the findings suggest that this extends for destinations across travel
contexts.
The second study provides key conceptual contributions. Firstly, Study Two
contributes by developing a model to measure destination brand performance across
travel contexts and destinations. Furthermore, it has resulted in a model which is
underpinned by both the theory of planned behaviour, and the consumer-based brand
equity (CBBE) hierarchy. Through the development and testing of the model, this
also addresses the research question, in assessing how the CBBE hierarchy should be
developed to measure destination brand performance.
165
The use of an index to assess cognitive destination image, measuring the importance
and performance of each destination for each of the travel contexts, identifies that
while differences in importance of attributes exist, performance remains relatively
consistent. This research also emphasises that one model can be developed to better
understand destination brand performance. The developed model stands across
destinations, and travel contexts.
Furthermore, affective image has recently been studied as one latent variable (del
Bosque & San Martin, 2008; Lee et al., 2008; del Bosque & Martin, 2008, Qu et al.,
2011; Wang & Hsu, 2010). This study suggests that by considering both the
founding literature, and the results of this study, that this construct is two
dimensional. This study emphasises, in line with previous destination literature
(Russel, 1980), that affective image is an orthogonal relationship represented by two
constructs: ‘pleasant’, and ‘arousing’. While ‘arousing’ was deemed to have no
significant relationship with intentions in the model, there was a significant
relationship from ‘cognitive image’ to ‘arousing’. It is proposed that future research
using, for example, international destinations, may provide a significant relationship
between arousing attitude and intentions.
5.2.2 Practical implications.
Practically, the first study addresses the challenge DMOs face in communicating the
features of their destination in a succinct way. The positioning strategies they use
focus on only a few key attributes. Destination marketers also operate in multiple
markets, and the challenge of designing different messages for different markets is
considerable. This research indicates that for Brisbane’s near home destinations, the
same positioning theme can be used for both short-break and longer holiday
segments. This finding will be of interest to marketers and researchers in other parts
of the world even though the findings in this study, in terms of salient attributes,
have limited generalisability.
Some key differences in attribute ranking occurred across the two contexts with the
following attributes six or more ranks apart: ‘closer’, ‘secluded’, ‘easier to get there’,
166
‘weather,’ ‘advertisements’, and ‘neighbouring destinations’. Each of these is
outlined briefly.
Having a destination that is ‘closer’ was the most salient attribute for the short-break
market. However, this was the lowest ranked attribute for the longer holiday. This
suggests that for a short-break holiday, having a destination which is close is most
important, with one participant mentioning that they would like to spend as much
time at the destination as possible, not travelling (Participant A4). Having a
destination which is ‘easier to get to’ was also more important for a short-break, as
participants wanted the destination to be easy to get to, and again not spend time
waiting for transport, for example ferries (Participant A11). ‘Advertisements’ ranked
higher for the short-break holiday round. It has previously been suggested that
consumers will place more emphasis on the information search component of travel
if they feel they will achieve more value from conducting it (Gursoy & McCleary,
2004). This could suggest that with a limited amount of time, consumers aim to get
more value for their stay, and rely on advertisements to inform them, and ensure they
derive adequate value. ‘Weather’ was also rated higher for short-break holidays. It is
suggested this could have been impacted upon by the amount of time at the
destination, and the effect this has on the visitor experience.
‘Secluded’ was more important for longer holidays, suggesting that this is more
about escapism than a short-break holiday. However, ‘neighbouring destinations’
ranked higher in the longer holiday round. One participant emphasised their need for
this in case they got bored where they were, as they could travel further (Participant
B6). This matches with the perception of risk management achieved by those for a
shorter break relative to information searches. By ensuring they have the option to
travel to, or explore, different locations over the longer holiday period, this enables
the consumer to manage the risk associated with travelling to a destination for an
extended period of time (Gursoy & McCleary, 2004).
DMOs face the challenge of positioning the destination they are responsible for
within different markets. While there were only six differences identified, DMOs can
use this information to ensure they do not alienate a particular segment when
positioning near home destinations to the Brisbane market.
167
Practical implications are outlined for the second study. Primarily this study was
used to develop a model of destination brand performance. This was to better
understand destination brand performance. The model can be used as a framework
for assessing a destination brand across destinations and travel contexts. While
perceived behavioural control had no significant relationship with intentions, it is
proposed that time, money and the control of a person to participate in a holiday with
a near home destination is not a prevalent concern.
Due to strong, positive and significant relationships between cognitive and perceived
quality, and cognitive and pleasant, it is proposed that the cognitive aspect of the
study plays an important role in the assessment and creation of destination brand
performance. This is consistent with previous literature (Konecnik & Gartner, 2007).
This research suggests that it is essential that an examination of destination image
attributes is conducted by a DMO, and that those which are important to consumers
for a particular travel context are utilised within marketing communication. While
one model was developed to assess a destination’s brand performance, it is still
essential to understand the differing levels of importance for each attribute based on
the travel context under investigation due to the significant differences in means
identified in this research.
Furthermore, it was also identified in Study Two that consumers were statistically
more likely to take a short-break holiday in the next 12 months versus a longer
holiday. This suggests that short-break holidays are a prominent market to target to
attain more visitors to a destination.
5.3 Limitations
Each research design contains inherent limitations. Therefore the research design
with the most appropriate research approach should be utilised (Zikmund et al.,
2011). Limitations of the approaches used in both Study One and Study Two are
outlined in this section.
168
5.3.1 Study One.
Two key limitations of this first study were the inclusion of only one age group,
Generation Y, and the examination of near-home destinations. While these were
essential to ensure that differences attained were only across travel contexts, this
does impact on the generalisability of findings. All respondents had previously had
some exposure to the destinations under scrutiny, and this may have impacted upon
the results. Furthermore, while there are many different travel contexts that could be
assessed, two common contexts were selected for the purposes of this study. A
convenience sample was utilised within this study. There are inherent biases
associated with a convenience sample, for example, respondent self-selection, and
the lack of meaningful generalisability of the sample (Malhotra & Birks, 2006).
However, it can be useful for generating insights, such as exploring those destination
image attributes which are important to consumers.
5.3.2 Study Two.
With regard to the limitations of Study Two, firstly, brand performance can alter
over time. To ensure greater understanding of the impact of the brand over time, and
more specifically, the impacts this could have on the proposed model, a longitudinal
study would be an appropriate approach (Malhotra et al., 2006). However, due to the
time constraints of a PhD study, a cross-sectional study was conducted to test the
proposed model.
Secondly, analysis of the model was conducted on near home destinations to
Brisbane relative to two travel contexts. While there are a variety of different travel
contexts, only two common contexts were used to test the model. Furthermore, the
sample focused only on Generation Y. Similarly to Study One a convenience sample
was used, which contains inherent limitations such as generalizability and
respondent self-selection (Malhotra & Birks, 2006). Data was collected from people
who subscribed to a market research company database. Two screening questions
were provided to the market research company to ensure that participants fulfilled
the criteria. The screening questions were: i) are you between 18 and 29 (inclusive)
years of age?; ii) are you a Brisbane resident?
169
All participants answered ‘yes’ to each question, agreeing that they fulfilled the
criteria. However, as the questionnaire was designed in case the need arose to collect
data elsewhere, similar, but more detailed, questions were presented later in the
questionnaire. Participants were again asked whether they were 18 to 29, but
required to select their age from a drop box. Furthermore, they were asked if they
were a Brisbane resident and required to provide a postcode. At this point in the
questionnaire participants selected options which suggested they were outside of the
required criterion. For example, one participant selected they were both: i) aged
between 18 and 29; and ii) a Brisbane resident, yet within the questionnaire selected
they were 37 and not a Brisbane resident. This could suggest that participants have
altered the way they respond to questions for monetary gain (Malhotra et al., 2006)
or that participants begin to view themselves as experts, or professional respondents,
and continually respond to surveys (Malhotra et al., 2006; Maronick, 2011).
5.4 Future Research
Future research is recommended to extend the findings of both studies. This section
outlines future research relative to both Study One and Study Two.
5.4.1 Study One.
It is recommended that further research be conducted into identifying differences
between travel contexts. Only two common contexts were assessed. However, as
there are many different travel contexts, it is proposed this research should be
conducted across a variety of travel situations in future. While expectancy-value
theory can be used to evaluate a destination’s image for a particular travel context,
little research has been conducted to see if evaluation can be conducted across travel
contexts. The consistency of the results suggests comparison is possible. The results
indicate consistency of attributes across contexts, and further research is
recommended to increase the validity and reliability of these findings. While
attribute categories remained relatively consistent across both short-breaks and
longer holidays, other contexts should be explored. Additionally, this research
should be tested outside of the sample of Generation Y, and near home destinations
to Brisbane. Furthermore, different sampling techniques should be undertaken to
better attain generalisability. The overall aim of this research was to identify if a
170
similar list of attributes would be elicited to allow evaluation of destinations across
travel contexts.
5.4.2 Study Two.
In terms of future research, it is recommended that Study Two be extended to
include a combination of near-home and international destinations. This would assist
in assessing if a significant relationship can be identified between ‘perceived
behavioural control’ and ‘intentions’. It is recommended that this study should
address a wider range of consumers, and sampling is conducted to better ensure
generalisability. While this study addressed Generation Y, based on the differences
identified for the Repertory Test technique, it is proposed that a variety of consumers
be examined to identify whether the results stand across segments. Given there is a
variety of different travel contexts, it is proposed that this research be conducted
across different travel contexts to better test the model.
Additionally, this study was cross-sectional. Brand performance is a measure which
may be impacted upon over time. It is therefore proposed that a longitudinal study be
conducted to identify changes to brand performance over time.
5.5 Conclusion
In conclusion, the proposed model can be used to assess destination brand
performance across destinations and travel contexts. When comparing this with the
consideration set of a consumer, while there was a significant relationship, the
proposed model is a better indicator of destination brand performance.
The findings from this thesis suggest that destinations can be assessed across travel
context, contributing to the literature. While there is incongruence between
destination brand identity and destination brand image on some attributes, the index
provided ensures that each component of destination image is accounted for.
The testing and development of the model indicates that a combination of TpB and
CBBE is a useful indicator of the mechanisms of destination brand performance.
While ‘perceived behavioural control’ and ‘arousing’ attitude did not have

171
significant relationships with ‘intentions’, it is recommended that future research into
international destinations should be completed which may yield significant results.
172
References
Aaker, D. (1991). Managing brand equity. New York: The Free Press.
Aaker, D. (1995). Strategic market management. New York: John Wiley & Sons,
Inc.
Aaker, D. (1996). Building strong brands. London: The Free Press.
ABDC (Australian Business Deans Council). (2010). Australian Business Deans
Council – Journal ratings list (Tourism and hospitality). Retrieved from
http://www.abdc.edu.au/ download.php?id=76707,188,1
Agarwal, M. K., & Rao, V. R. (1996). An empirical comparison of consumer-based
measures of brand equity. Marketing Letters, 7(3), 237-247.
Agres, S. J., & Dubitsky, T. M. (1996). Changing needs for brands. Journal of
Advertising Research, 36(1), 21-30.
Ajzen, I. (1991). The theory of planned behavior. Organizational Behavior and
Human Decision Processes, 50(2), 179-211.
Ajzen, I., & Driver, B. L. (1992). Application of the theory of planned behavior to
leisure choice. Journal of Leisure Research, 24(3), 207- 224.
Ajzen, I., & Fishbein, M. (1980). Understanding attitudes and predicting social
behavior. New Jersey: Prentice-Hall Inc.
Alch, M. L. (2000). The echo-boom generation. Futurist 34,42. In P. Benckendorff,
G. Moscardo, & D. Pendergast. (Eds.). (2010). Tourism and Generation Y.
Oxfordshire: CABI.
Anderson, J. (1996). The Architecture of Cognition. Cambridge: Harvard University
Press.
Arnett, D. B., Laverie, D. A., & Meiers, A. (2003). Developing parsimonious retailer
equity indexes using partial least squares analysis: a method and applications.
Journal of Retailing, 79(3), 161-170.
Arrow, K. (1996). Introduction. In K. Arrow, E. Columbatto, M. Perlman, & C.
Schmidt (Eds.). The rational foundations of economic behaviour. St Martin’s
Press: London.
Assael, H., Pope, N., Brennan L., & Voges, K. (2007). Consumer Behaviour.
Australia: John Wiley & Sons.
Augier, M., & Kreiner, K. (2000). Rationality, imagination and intelligence: Some
boundaries in human decision-making. Industrial and corporate change,
9(4), 659-681.
Axelrod, J. N. (1968). Attitude measures that predict purchase. Journal of
Advertising Research, 8(1), 3-17.
Baloglu, S. (1999). A path analytic model of visitation intention involving
information sources, sociopsychological motivations, and destination image.
Journal of Travel and Tourism Marketing, 8(3), 81–90.
Baloglu, S., & Brinberg, D. (1997). Affective images of tourism destinations.
Journal of Travel Research, 35(4), 11-15.
Baloglu, S., & McCleary, K.W. (1999). A model of destination image formation.
Annals of Tourism Research, 26(4), 868-897.
Bannister, D., & Fransella, F. (1986). Inquiring Man: the psychology of personal
constructs. (3rd
ed.). Routledge: London.
Barclay, W. (1964). The semantic differential as an index of brand attitude. Journal
of Advertising Research, 1964(1), 30-33.
173
Barsalou, L. W. (1988). The Content and Organization of Autobiographical
Memories. Remembering Reconsidered: Ecological and Traditional
Approaches to the Study of Memory. In K. K. Desai, & W. D. Hoyer. (2000).
Descriptive characteristics of memory-based consideration sets: influence of
usage occasion frequency and usage location familiarity. Journal of
Consumer Research, 27(3), 309-323.
Barwise, P., Higson, C., Likierman, A., & Marsh, P. (1989). Accounting for Brands.
London: London Business School.
Beaman, J., & Huan, T. (2008). Importance performance analysis (IPA): confronting
validity issues. In A. Woodside, & D. Martin (Eds). Advances in Tourism
Management. Cambridge: CABI Publishing.
Beck, L., & Ajzen, I. (1991). Predicting dishonest actions using the theory of
planned behavior. Journal of Research in Personality, 25(3), 285-301.
Beerli, A., & Martin, J.D. (2004). Factors influencing destination image. Annals of
Tourism Research, 31(3), 657-681.
Belk, R. W. (1975). Situational Variables and Consumer Behavior. Journal of
Consumer Research, 2(3), 157-164.
Bentler, P. M. (1990). Comparative fit indexes in structural models. Quantitative
methods in psychology, 10(2), 238-246.
Bigne, J. E., Sanchez, M. I., & Sanchez, J. (2001). Tourism image, evaluation
variables and after purchase behaviour inter-relationship. Tourism
Management, 22(6), 607-616.
Blain, C., Levy, S., & Ritchie, J. (2005). Destination branding: Insights and practices
from destination management organizations. Journal of Travel Research,
43(4), 328–338.
Bloom, F. E., & Lazerson, A. (1988). Brain, Mind and Behavior. (2nd
ed.). New
York: W.H. Freeman and Company.
Boo, S., Busser, J., & Baloglu, S. (2009). A model of customer-based brand equity
and its application to multiple destinations. Tourism Management, 30(2),
219-231.
Brace, I. (2008). Questionnaire design – How to plan, structure and write survey
material for effective market research. Kogan Page Limited: London.
Bramwell, B., & Rawding, L. (1996). Tourism marketing images of industrial cities.
Annals of Tourism Research, 23(1), 201-221.
Brand, R. (2000). Advertisers examined teens and their spending clout. Available at:
http://www.tcpalm. com/business/01jteenu.shtml. In P. Benckendorff, G.
Moscardo, & D. Pendergast (Eds). (2010). Tourism and Generation Y.
Oxfordshire: CABI.
Brisbane Marketing. (2010). Retrieved from
http://www.visitbrisbane.com.au/Travel/Destination-Maps/Moreton-Bay-
Islands.aspx
Brisbane Marketing. (2011). The MB&I Brand. Retrieved from
http://www.brisbanemarketing.com.au/Resources/Brand-Tool-
Kits/pages/Moreton-Bay-And-Islands/The-MBI-Brand.aspx
Broadbridge, A. M., Maxwell, G. A., & Ogden, S. M. (2007). Experiences,
perceptions and expectations of retail employment for Generation Y. Career
Development International, 12(6), 523-544.
Bruyere, B., Rodriguez, D., & Vaske, J. (2002). Enhancing Importance-Performance
Analysis through Segmentation. Journal of Travel & Tourism Marketing,
12(1), 81-95.
174
Bryman, A., & Cramer, D. (2009). Quantitative data analysis with SPSS 14, 15 &
16: A guide for social scientists. New York: Routledge.
Buhalis, D. (2000). Marketing the competitive destination of the future. Tourism
Management, 21(1), 97-116.
Burton, M. L., & Nerlove, S. B. (1976). Balanced designs for triads tests: Two
examples from English. Social Science Research, 5(3), 247-267.
Byrne, B. M. (2001). Structural equation modelling with AMOS: Basic concepts,
applications and programming. Mahwah, New Jersey: Lawrence Erlbaum
Associates.
Cai, L. A. (2002). Cooperative branding for rural destinations. Annals of Tourism
Research, 29(3), 720–742.
Caldwell, N., & Coshall, J. (2002). Measuring brand associations for museums and
galleries using repertory grid analysis. Management Decision, 40(4), 383-
392.
Capricorn Tourism & Economic Development. (2010). Capricorn Online. Retrieved
from http://www.capricornonline.com.au/
Cavana, R. Y. Delahaye. B. L., & Sekaran U. (2001). Applied business research.
Brisbane: John Wiley & Sons Australia, Ltd.
Chacko, H. E., & Fenich, G. G. (2000). Determining the importance of US
convention destination attributes. Journal of Vacation Marketing, 6(3), 211-
220.
Churchill Jr., G. A. (1979). A Paradigm for Developing Better Measures of
Marketing Constructs. Journal of Marketing Research, 16(1), 64-73.
Coakes, S.J., Steed, L., & Ong, C. (2010). SPSS version 17.0 for windows: Analysis
without anguish. Milton, Qld: John Wiley & Sons Australia.
Cobb-Walgren, C. J., Beal, C., & Donthu, N. (1995). Brand equity, brand
preferences, and purchase intent. Journal of Advertising, 24(3), 25-40.
Cohen, J. B., Fishbein, M., & Ahtola, O. T. (1972). The nature and uses of
expectancy-value models in consumer attitude research. Journal of Marketing
Research (pre-1986), 9(4), 456-460.
Conner, M., & Abraham, C. (2001). Conscientiousness and the theory of planned
behavior: Toward a more complete model of the antecedents of intentions
and behavior. Personality and Social Psychology Bulletin, 27(11), 1547-
1561.
Cracolici, M. F., & Nijkamp, P. (2009). The attractiveness and competitiveness of
tourist destinations: A study of Southern Italian regions. Tourism
Management, 30(3), 336-344.
Crompton, J. (1979). An assessment of the image of Mexico as a vacation
destination and the influence of geographical location upon that image.
Journal of Travel Research, 17(4), 18-23.
Crompton, J. (1992). Structure of destination choice sets. Annals of Tourism
Research, 19(3), 420-434.
Crompton, J., & Duray, N. (1985). An investigation of the relative efficacy of four
alternative approaches to importance-performance analysis. Academy of
Marketing Science (Journal pre-1986), 13(4), 69-80.
Cronbach, L. J. (1951). Coefficient alpha and the internal structure of tests.
Psychometrika, 16(3), 297-333.
Crouch, G. I., & Ritchie, J. (1998). Convention site selection research: A review,
conceptual model, and propositional framework. Journal of Convention and
Exhibition Management, 1(1), 48-69.

175
Day, J., Skidmore, S., & Koller, T. (2002). Image selection in destination
positioning: A new approach. Journal of Vacation Marketing, 8(2), 177-186.
Davis, B. D., & Sternquist, B. (1987). Appealing to the elusive tourist: an attribute
cluster strategy. Journal of Travel Research, 25(4), 25-31.
de Chernatony, L., & McDonald, M. (2003). Creating powerful brands in consumer,
service and industrial markets. Oxford: Elsevier/ Butterworth-Heinemann.
de Chernatony, L. (1992). Creating Powerful Brands. Butterworth Heinemann:
Oxford. In G. Hankinson, & P. Cowking (1995). What do you really mean by
a brand? Journal of Brand Management, 3(1), 43-50.
del Bosque, I. R., & San Martin, H. (2008). Tourist satisfaction a cognitive-affective
model. Annals of Tourism Research, 35(2), 551-573.
Desai, K. K., & Hoyer, W. D. (2000). Descriptive characteristics of memory-based
consideration sets: influence of usage occasion frequency and usage location
familiarity. Journal of Consumer Research, 27(3), 309-323.
Dichter, E. (1964). Handbook of Consumer Motivations. New York: McGraw-Hill.
In M. D. Reilly (1990). Free elicitation of descriptive adjectives for tourism
image assessment. Journal of Travel Research, 28(4), 21-26.
Dillman, D. A. (2007). Mail and internet surveys: The tailored design method. John
Wiley and Sons, Ltd: New Jersey.
Dosen, D. O., Vranesevic, T., & Prebezac, D. (1998). The importance of branding in
the development of marketing strategy of Croatia as tourist destination. Acta
Turistica, 10(2), 93-182.
Dyson, P., Farr, A., & Hollis, N. S. (1996). Measuring and using brand equity.
Journal of Advertising Research, 36(6), 9-21.
Eby, D. W., Molnar, L. J., & Cai, L. A. (1999). Content preferences for in-vehicle
tourist information systems: an emerging travel information source. Journal
of Hospitality and Leisure Marketing, 6(3), 41-58.
Echtner, C. M., & Ritchie, J. R. B. (1993). The measurement of destination image:
An empirical assessment. Journal of Travel Research, 31(3), 3-13.
Egan, C. (1998). Chasing the Holy Grail: A critical appraisal of ‘The Brand’ and the
brand valuation debate. The Journal of Brand Management, 5(4), 227-244.
Etzel, M. J., Walker, B. J., & Stanton, W. J. (2000). Fundamentals of marketing.
New York: McGraw Hill.
Farquhar, P. (1989). Managing brand equity. Marketing Research, 1(3), 1-11.
Feldwick, P. (1996). Do we really need Brand Equity? Journal of Brand
Management, 4(1), 9-28.
Feldwick, P. (2002). What is Brand Equity, Anyway? Henley-on-Thames: World
Advertising Research Centre.
Ferrario, F. F. (1979). The evaluation of tourist resources: an applied methodology.
Journal of Travel Research, 17(1), 18-22.
Fishbein, M. (1963). An investigation of the relationships between beliefs about an
object and the attitude toward that object. Human relations, 16(3), 233-239.
Fishbein, M., & Ajzen, I. (1974). Attitudes towards objects as predictors of single
and multiple behavioral criteria. Psychological review, 81(1), 59-74.
Flick, U. (1995). An introduction to qualitative research. London: Sage Publications.
Fombrun, C., & Shanley, M. (1990). What's in a name? Reputation building and
corporatestrategy. Academy of Management Journal, 33(2), 233-258.
Fontana, A., & Frey, J. H. (1994). Interviewing - The art of science. In N. K. Denzel,
& Y. S. Lincoln (Eds.), Handbook of Qualitative Research. Thousand Oaks,
California: Sage Publications.
176
Fornell, C., & Larcker, D. (1981). Structural equation models with unobservable
variables and measurement error. Journal of Marketing Research, 18(1), 39-
50.
Fransella, F., Bell, R., & Bannister, D. (2004). A manual for repertory grid technique
(2nd
ed.). West Sussex, England: John Wiley & Sons, Ltd.
Frost, W., & Braine, R. (1967). The application of the repertory grid technique to
problems in market research. Commentary, 9(3), 161-175.
Gannon, M. J., Northern, J., & Carroll, S. (1971). Characteristics of non-respondents
among workers. Journal of Applied Psychology, 55(6), 586-588.
Gartner, W. C. (1989). Tourism image: attribute measurement of state tourism
products using multidimensional scaling techniques. Journal of Travel
Research, 28(2), 16-20.
Gearing, C. E., Swart, W. W., & Var, T. (1974). Establishing a measure of touristic
attractiveness. Journal of Travel Research, 12(4), 1-8.
Gertner, R. K. (2010). Similarities and differences of the effect of country images on
tourist and study destinations. Journal of Travel & Tourism Marketing, 27(4),
383-395.
Geissler, L. R. (1917). Association-reactions applied to ideas of commercial brands
of familiar articles. Journal of Applied Psychology, 1(3), 275-290.
Gilljam, M., & Granberg, D. (1993). Should we take don’t know for an answer? The
Public Opinion Quarterly, 57(3), 348-357.
Gitelson, R., & Crompton, J. (1984). Insights into the Repeat Vacation Phenomenon.
Annals of Tourism Research, 11(1), 199-217.
Gold Coast Tourism. (2010). Visit Gold Coast. Retrieved from
http://www.visitgoldcoast.com/Gold%20Coast%20DMP05.pdf
Goodrich, J. N. (1977). Benefit bundle analysis: an empirical study of international
travelers. Journal of Travel Research, 16(2), 6-9.
Gregory, J. R. (2004). The best of branding: the best practices in corporate
branding. New York: McGraw-Hill.
Griffin, A., & Hauser, J. R. (1993). The voice of the customer. Marketing Science,
12(1), 1-27.
Guba, E. B. (1978). Toward a methodology of naturalistic inquiry in educational
evaluation. University of California, Los Angeles Center for the Study of
Evaluation, California.
Guest, L. P. (1942). The genesis of brand awareness. Journal of Applied Psychology,
26(6), 800-808.
Guest, L. P. (1944). A study of brand loyalty. Journal of Applied Psychology, 28(1),
16-27.
Guest, L. P. (1955). Brand loyalty – twelve years later. Journal of Applied
Psychology, 39(6), 405-408.
Gursoy, D., & McCleary, K. W. (2004). An Integrative Model of Tourists’
Information Search Behavior. Annals of Tourism Research, 31(2), 353-373.
Gutman, J. (1982). A means end chain model based on customer categorization
processes. Journal of Marketing, 46(2), 60-72.
Hair, J., Bush, R., & Ortinau, D. (2003). Marketing Research: Within a changing
information environment. Boston: McGraw-Hill Higher Education.
Hair, J. F, Jr., Black, W. C., Babin, B. J., & Anderson, R. E. (2010). Multivariate
data analysis: A global perspective (7th
ed.). Upper Saddle River, New
Jersey: Pearson Education Inc.
177
Hankinson, G., & Cowking, P. (1995). What do you really mean by a brand? Journal
of Brand Management, 3(1), 43-50.
Harary, F., & Lipstein, B. (1962). The dynamics of brand loyalty: A Markovian
approach. Operat. Res., 10(1), 19-39.
Healey, M. (2008). What is branding? Mies, Switzerland: Rotovision.
Hinkle, D. (1965). The change of personal constructs from the viewpoint of a theory
of construct implications. Unpublished thesis. Ohio State University.
Howard, J., & Sheth, J. (1969). The Theory of Buyer Behavior. New York: Wiley. In
M. Konecnik, & W. C. Gartner (2007). Customer-based brand equity for a
destination. Annals of Tourism Research, 34(2), 400-421.
Hu, L. & Bentler, P.M. (1999). Cutoff criteria for fit indexes in covariance structure
analysis: Coventional criteria versus new alternatives, Structural Equation
Modeling, 6(1), 1-55.
Hu, Y., & Ritchie, J. R. (1993). Measuring destination attractiveness: A contextual
approach. Journal of Travel Research, 32(2), 25-34.
Huan, T. & Beaman, J. (2007). Executive learning exercise and trainer's notes for
importance-performance analysis (IPA): Confronting validity issues.
International Journal of Culture, Tourism and Hospitality Research, 1(4),
315-327.
Hunt, S., & Morgan, R. (1995). The comparative advantage theory of competition.
Journal of Marketing, 59(2), 1-15.
Jayanti, R.K. & Ghosh, A.K. (1996). A structural analysis of value, quality, and
price perceptions of business and leisure travelers. Journal of Travel
Research, 39(1), 45-51.
Kale, S. H., & Weir, K. M. (1986). Marketing third world countries to the western
traveler: the case of India. Journal of Travel Research, 25(2), 2-7.
Kamakura, W. A., & Russell, G. J. (1993). Measuring brand value with scanner data.
International Journal of Research in Marketing, 10(1), 9-22.
Kapferer, J. N. (2008). The New Strategic Brand Management: Creating and
sustaining brand equity long term. Cornwall: MPG Books Ltd.
Keller, K. L. (1993). Conceptualizing, measuring, and managing customer-based
brand equity. Journal of Marketing, 57(1), 1-22.
Keller, K.L. (2003). Strategic Brand Management: Building, Measuring, and
Managing Brand Equity, (2nd
ed.). Upper Saddle River, NJ: Prentice Hall.
Kelly, G. A. (1955). The Psychology of Personal Constructs (Volume One). London:
Routledge.
Kelly, G. A. (1963). A theory of personality: The psychology of personal constructs.
New York: The Norton Library.
Kerin, R. A., Hartley, S. W., & Rudelius, W. (2003). Marketing: the core. New
York: McGraw-Hill.
Kim, H., & Kim, W. G. (2005). The relationship between brand equity and firms'
performance in luxury hotels and chain restaurants. Tourism Management,
26(4), 549-560.
Kim, S., Crompton, J., & Botha, C. (2000). Responding to competition: a strategy for
Sun/Lost City, South Africa. Tourism Management, 21(1), 33-41.
Kline, R. (2005). Principles and practise of structural equation modeling. (2nd
ed.).
New York: Guildford.
Kochan, N. (1996). The world’s greatest brands. Basingstoke: Macmillan Business.
Konecnik, M., & Gartner, W. C. (2007). Customer-based brand equity for a
destination. Annals of Tourism Research, 34(2), 400-421.
178
Kozak, M., & Baloglu, S. (2011). Managing and marketing tourist destinations:
Strategies to gain a competitive advantage. Routledge: New York.
Kozak, M., & Rimmington, M. (1999). Measuring tourist destination
competitiveness: conceptual considerations and empirical findings.
International Journal of Hospitality Management, 18(3), 273-284.
Krishnan, H. S. (1996). Characteristics of memory associations: A consumer-based
brand equity perspective. International Journal of Research in Marketing,
13(4), 389-405.
Lam, T., & Hsu, C. H. C. (2006). Predicting behavioural intention of choosing a
travel destination. Tourism Management, 27(4), 589-599.
Lamb, C. W, Hair, J. F., & McDaniel, C. (2001). Principles of Marketing. Mason,
USA: Southwestern College Publishing.
Lassar, W., Mittal, B., & Sharma, A. (1995). Measuring customer-based brand
equity. Journal of Consumer Marketing, 12(4), 11-19.
Lawson, F., & Baud-Bovy, M. (1977). Tourism and recreational development.
London: Architectural Press.
Lee, C., Lee, Y., & Lee, B. (2005). Korea’s destination image formed by the 2002
World Cup. Annals of Tourism Research, 32(4), 839-858.
Lee, S., Scott, D., & Kim, H. (2008). Celebrity fan involvement and destination
perceptions. Annals of Tourism Research, 35(3), 809-832.
Levy, L. H., & Dugan, R. D. (1956). A factorial study of personal constructs.
Journal of Consulting Pscyhology, 20(1), 53-57.
Li, M., Cai, L. A., Lehto, X. Y., & Huang, J. (2010). A missing link in understanding
revisit intention – The role of motivation and image. Journal of Travel &
Tourism Marketing, 27(4), 335-348.
Lin, C.A. (2003). An interactive communication technology adoption model.
Communication theory, 13(4), 345-365.
Lings, I. N., & Greenley, G. E. (2005). Measuring internal market orientation.
Journal of Service Research, 7(3), 290-305.
Low, G. S., & Fullerton, R. A. (1994). Brands, brand management, and the brand
manager system: a critical-historical evaluation. Journal of Marketing
Research, 31(2), 173-190.
Low, G. S., & Lamb, M. J. (2000). The measurement and dimensionality of brand
associations. Journal of Product & Brand Management, 9(6), 350-370.
Mackay, M. M. (2001). Evaluation of brand equity measures: further empirical
evidence. Journal of Product and Brand Management, 10(1), 38-51.
Malhotra, N. & Birks, .D.F. (2006). Marketing Research: an applied approach (2nd
European Ed.). Harlow, England: Prentice Hall.
Malhotra, N., Hall, J., Shaw, M., & Oppenheim, P. (2006). Marketing Research: An
Applied Orientation. Frenchs Forest: Pearson Education Australia.
March, R., & Woodside, A.G. (2005). Tourism behaviour: travellers’ decisions and
actions. Wallingford, UK: CABI Publishers.
Maronick, T. (2011). Pitting the mall against the internet in advertising research:
Completion internet panels are more popular. Are they more effective?
Journal of Advertising Research, 51(1), 321-331.
Martilla, J., & James, J. (1977). Importance-Performance Analysis. Journal of
Marketing (pre-1986), 41(000001), 77-79.
Mayo, E. J. (1973). Regional images and regional travel behaviour. In Proceedings
of The Travel Research Association Fourth Annual Conference. Sun Valley,
Idaho.
179
McGuire, J. B., Schneeweis, T., & Branch, B. (1990). Perceptions of firm quality: A
cause or result of firm performance. Journal of Management, 16(1), 167-180.
Milman, A., & Pizam, A. (1995). The role of awareness and familiarity with a
destination: The Central Florida case. Journal of Travel Research, 33(3), 21-
27.
Moor, L. (2007). The rise of brands. New York: Berg.
Moore, D. L., & Tarnai, J. (2002). Evaluating Nonresponse Error in Mail Surveys. In
R. M. Groves, D. A. Dillman, J. L. Eltinge, & R. J. A. Little (Eds.) Survey
Nonresponse. Wiley: New York (pp. 197-211).
Mount, D. (1997). Introducing the Relativity to Traditional Importance-Performance
Analysis. Journal of Hospitality & Tourism Research, 21(2), 111-119.
Mount, D. (2000). Determination of Significant Issues: Applying a Quantitative
Method to Importance-Performance Analysis. Journal of Quality Assurance
in Hospitality & Tourism, 1(3), 49-65.
Murdy, S., & Pike, S. (2012). Perceptions of visitor relationship marketing
opportunities by destination marketers: An importance-performance analysis.
Tourism Management, 33(5), 1281-1285.
Murphy, J. (1990). Brand Strategy. Cambridge: Director Books.
Narayana, C. L., & Markin, R. J. (1975). Consumer behaviour and product
performance: An alternative conceptualisation. Journal of Marketing, 39(4),
1-6.
Neuendorf, K. A. (2002). The Content Analysis Guidebook. Sage Publications, Inc.:
United Kingdom.
Newton, D. C. (2008). Trademarked: A history of well-known brands, from Aertex to
Wright’s Coal Tar. Stroud: Sutton Publishers.
Norman, P., Connor, M., & Bell, R. (1999). The theory of planned behaviour and
smoking cessation. Health Psychology, 18(1), 89-94.
Oh, H. (2000). Diner's perceptions of quality, value and satisfaction. Cornell Hotel
and Restaurant Administration Quarterly, 41(3), 58-66.
Oh, H. (2001). Revisiting importance-performance analysis. Tourism Management,
22(6), 617-627.
Oppermann, M. (1996). Convention destination images: analysis of association
meeting planners’ perceptions. Tourism Management, 17(3), 175-182.
Ozgener, S., & Iraz, R. (2006). Customer relationship management in small-medium
enterprises: The case of Turkish tourism industry. Tourism Management,
27(6), 1356-1363.
Pappu, R., & Quester, P. (2006). A consumer-based method for retailer equity
measurement: results of an empirical study. Journal of Retailing and
Consumer Services, 13(5), 317-329.
Pappu, R., Quester, P., & Cooksey, R. (2005). Consumer-based brand equity:
improving the measurement - empirical evidence. Journal of Product and
Brand Management, 14(3), 143-154.
Park, C. S., & Srinivasan, V. (1994). A survey-based method for measuring and
understanding brand equity and its extendibility. Journal of Marketing
Research, 31(2), 271-288.
Park, S. Y., & Petrick, J. F. (2006). Destinations’ perspectives of branding. Annals of
Tourism Research, 33(1), 262-265.
Pearce, P. L. (1982). Perceived changes in holiday destinations. Annals of Tourism
Research, 9(2), 145-164.
180
Pendergast, D. (2008). Generational dynamics–Y it matters 2 u & me. International
Federation for Home Economics. Lucerne, Switzerland. July.
Piccoli, G., O’Connor, P., Capaccioli, C., & Alvarez, R. (2003). Customer
Relationship Management – A Driver for Change in the Structure of the U.S.
Lodging Industry. Cornell Hotel and Restaurant Administration Quarterly,
44(4), 61-73.
Pike, S. (2002a). ToMA as a measure of competitive advantage for short break
holiday destinations. Journal of Tourism Studies, 13(1), 9-19.
Pike, S. (2002b). Destination image analysis: A review of 142 papers from 1973-
2000. Tourism Management, 23(5), 541-549.
Pike, S. (2003). The use of repertory grid analysis to elicit salient short break holiday
attributes. Journal of Travel Research, 41(3), 326-330.
Pike, S. (2004). Destination Marketing Organisations. United Kingdom: Elsevier.
Pike, S. (2005). Tourism destination branding complexity. Journal of Product and
Brand Management, 14(4), 258-259.
Pike, S. (2006). Destination decision sets: A longitudinal comparison of stated
destination preferences and actual travel. Journal of Vacation Marketing,
12(4), 319-328.
Pike, S. (2007a). Destination image literature – 2001 to 2007. Acta Turistica, 19(2),
107-125.
Pike, S. (2007b). Repertory Grid Analysis in group settings to elicit salient
destination image attributes. Current Issues in Tourism, 10(4), 378-392.
Pike, S. (2007c). Consumer-based brand equity for destinations: Practical DMO
performance measures. Journal of Travel & Tourism Marketing, 22(1), 51-
61.
Pike, S. (2007d). Destination image questionnaires – the trial of a ‘don’t know’
option. Journal of Travel & Tourism Research, 2(Fall), 151-160.
Pike, S. (2008). Five limitations of destination brand image questionnaires. Tourism
Recreation Research, 33(3), 361-363.
Pike, S. (2009). Destination brand positions of a competitive set of near-home
destinations. Tourism Management, 30(6), 857-866.
Pike, S. (2010). Destination branding case study: tracking brand equity for an
emerging destination between 2003 and 2007. Journal of Hospitality and
Tourism Research, 34(1), 124-139.
Pike, S., Bianchi, C., Kerr, G., & Patti, C. (2010). Consumer-based brand equity for
Australia as a long-haul destination in an emerging market. International
Marketing Review, 27(4), 434-449.
Pike, S., Murdy, S., & Lings, I. (2011). Visitor relationship orientation of destination
marketing organisations. Journal of Travel Research, 50(4), 443-453.
Porter, S. R., & Whitcomb, M. E. (2005). Non-response in Student Surveys: The
Role of Demographics, Engagement and Personality. Research in Higher
Education 46(2), 127-152.
Potier, F., & Cockerell, N. (1995). The European international short-break market.
Travel and Tourism Analyst. In Davidson, R. (1998). Travel and tourism in
Europe (2nd
ed.). Longman: New York.
Prayag, G. (2009). Tourists’ evaluations of destination image, satisfaction, and future
behavioral intentions – The case of Mauritius. Journal of Travel & Tourism
Marketing, 26(8), 836-853.
PureProfile (2011). PureProfile for advertisers. Retrieved from
http://advertisers.pureprofile.com/
181
Qu, H., Kim, L. H., & Im, H. H. (2011). A model of destination branding:
Integrating the concepts of branding and destination image. Tourism
Management, 32(3), 465-476.
QUT. (2010). University Research Ethics. Retrieved from
http://www.mopp.qut.edu.au/D/D_06_01.jsp
Reilly, M. D. (1990). Free elicitation of descriptive adjectives for tourism image
assessment. Journal of Travel Research, 28(4) 21-26.
Reynolds, N., & Diamantopoulos, A. (1996). The effect of pretest method on error
detection rates: Experimental evidence. European Journal of Marketing,
32(5/6), 480-498.
Reynolds, T. J., & Gutman, J. (1988). Laddering theory, method, analysis, and
interpretation. Journal of Advertising Research, 28(1), 11-31.
Ritchie, J. R. B., & Zins, M. (1978). Culture as determinant of the attractiveness of a
tourism region. Annals of Tourism Research, 5(2) 252-267.
Rogelberg, S. G., & Luong, A. (1998). Nonresponse to Mailed Surveys: A Review
and Guide. Current Directions in Psychological Science, 7(2), 60-65.
Rosenberg, M. J. (1956). Cognitive structure and attitudinal affect. Journal of
Abnormal and Social Psychology, 53(3), 367-372.
Russell, J. A., & Snodgrass, J. (1987). Emotion and the environment. In D. Stokols
& I. Altman (Eds.) Handbook of Environmental Psychology (Vol. 1) (pp.
246-280). New York: John Wiley & Sons.
Russel, J. A. (1980). A circumplex model of affect. Journal of Personality and
Social Psychology, 39(6), 1161-1178
Russell, G. J., & Kamakura, W. A. (1994). Understanding brand competition using
micro and macro scanner data. Journal of Marketing Research, 31(2), 289-
303.
Russell, G. J., & Kamakura, W. A. (1997). Modeling multiple category brand
preference with household basket data. Journal of Retailing, 73(4), 439-461.
Ryan, C., & Pike, S. (2003). Maori based tourism in Rotorua – Perceptions of place
by domestic visitors. Journal of Sustainable Tourism, 11(4), 307-321.
Saldaña, J. (2011). The coding manual for qualitative researchers. Sage
Publications: Arizona.
Sampson, P. (1972). Using the repertory grid test. Journal of Marketing Research,
9(1), 78-81.
San Martin, H., & del Bosque, I. A. R. (2008). Exploring the cognitive-affective
nature of destination image and the role of psychological factors in its
formation. Tourism Management, 29(2), 263-277.
Shani, A. & Wang, Y. (2011). Destination image development and communication.
In Y. Wang & A. Pizam (Eds.). Destination marketing and management:
Theories and applications. CABI International: Oxfordshire (pp. 130-148).
Sheahan, P. (2005). Generation Y: thriving and surviving with Generation Y at work.
Prahran, Vic.: Hardy Grant.
Simon, C. J., & Sullivan, M. W. (1993). The measurement and determinants of brand
equity: a financial approach. Marketing Science, 12(1), 28-52.
Simon, H. (1978). Rationality as process and as product of thought. American
Economic Review, 68(2), 1-16.
Snepenger, D., & Milner, L. (1990). Demographic and situational correlates of
business travel. Journal of Travel Research, 28(4), 27-32.
Solomon, M. R., Russel-Bennett, R., & Previte, J. (2010). Consumer behaviour:
Buying, behaving, being. Frenchs Forest: Pearson Australia,
182
Sparks, B. (2007). Planning a wine tourism vacation? Factors that help to predict
tourist behavioural intentions. Tourism Management, 28(5), 1180-1192.
Sparks, B., & Pan, G. W. (2009). Chinese Outbound tourists: Understanding their
attitudes, constraints and use of information sources. Tourism Management,
30(4), 483-494.
Stern, E., & Krakover, S. (1993). The formation of a composite urban image.
Geographical analysis, 25(2), 130-146.
Stevens, J., Lathrop, A., & Bradish, C. (2005). Tracking Generation Y: a
contemporary sport consumer profile. Journal of Sport Management, 19(3),
254-277. In P. Benckendorff, G. Moscardo, & D. Pendergast (Eds). (2010).
Tourism and Generation Y. Oxfordshire: CABI
Stewart, V., & Stewart, A. (1981). Business applications of repertory grid.
Berkshire: McGraw-Hill.
Stobart, P. (Ed.). (1994). Brand Power. London: Biddles Ltd.
Sue, V., & Ritter, L. (2007). Conducting Online Surveys. Sage Publications: London.
Sunshine Coast Destination Limited. (2010). Visit Sunshine Coast. Retrieved from
http://visitsunshinecoast.com.au/default.cfm
Swarbrooke, J., & Horner, S. (2007). Consumer behaviour in tourism (2nd ed.). The
Netherlands: Butterworth-Heinemann.
Sweeney, J., & Soutar, G. N. (2001). Consumer perceived value: the development of
a multiple item scale. Journal of Retailing, 77(2), 203-220.
Tabachnick, B. G., & Fidell, L .S. (2007). Using multivariate statistics (5th
ed).
Boston: Pearson Education.
Tasci, A. D. A., Gartner, W. C., & Cavusgil, S. T. (2007). Conceptualization and
operationalization of destination image. Journal of Hospitality & Tourism
Research, 31(2), 194-223.
Toowoomba & Darling Downs. (2010). Toowoomba & Darling Downs. Retrieved
from http://www.toowoombaholidays.com.au/
Tourism Fraser Coast. (2010). Tourism Fraser Coast. Retrieved from
http://www.tourismfrasercoast.com.au/site/welcome.html
Tourism New South Wales. (2010a). North Coast of NSW: Holiday Planner.
Retrieved from
http://www.visitnsw.com/Sites/SiteID3/objLib15/holplan_NC_all.pdf
Tourism New South Wales, (2010b). North Coast. Retrieved from
http://www.visitnsw.com/destinations/north-coast
Tourism New South Wales. (2011a). North Coast Tourism: Tourism Corporate Site.
Retrieved from http://archive.tourism.nsw.gov.au/
North_Coast_of_NSW_p1198.aspx.
Tourism New South Wales. (2011b). North Coast Tourism: Tourism Corporate Site
– campaign activity. Retrieved from http://archive.tourism.nsw.gov.au/North-
Coast-Campaign-Activity_p1402.aspx
Tourism Queensland. (2010a). Sunshine Coast Hinterland Nature Based Tourism
Plan. Retrieved from http://www.tq.com.au/destinations/sunshine-and-fraser-
coast-zone/sunshine-coast/plans-and-strategies/sunshine-coast-hinterland-
nature-based-tourism-plan/sunshine-coast-hinterland-nature-based-tourism-
plan_home.cfm
Tourism Queensland. (2010b). Gold Coast Destination Management Plan (April
2005). Retrieved from
http://www.tq.com.au/fms/tq_corporate/destinations/gold_coast/dmp/Gold%2
0Coast%20DMP05.pdf
183
Tourism Queensland. (2010c). Bundaberg-Fraser Coast: Tourism Opportunity Plan
(2009-2019). Retrieved from
http://www.tq.com.au/fms/tq_corporate/destinations/bundaberg/plans_and_st
rategies/Bundaberg-Fraser%20Coast%20TOP%20Lo%20Res%20pdf.pdf
Tourism Queensland. (2010d). Western Downs: Marketing and development plan
(November 2004). Retrieved from
http://www.tq.com.au/destinations/outback-gulf-and-western-downs-
zone/western-downs/plans-and-strategies/plans-and-strategies_home.cfm
Tourism Queensland. (2010e). Brisbane Regional Tourism Investment and
Infrastructure Plan (Incorporating: Brisbane City & Hinterland, Moreton Bay
Islands and Scenic Rim. Retrieved from
http://www.tq.com.au/fms/tq_corporate/destinations/brisbane/Plans%20and%
20strategies/Brisbane%20RTIIP.pdf
Tourism Queensland. (2010f). Central Queensland – Tourism Opportunity Plan
(2009-2019). Retrieved from
http://www.tq.com.au/fms/tq_corporate/destinations/central_queensland/plan
s_and_strategies/Central%20Queensland%20Tourism%20Opportunity%20Pl
an%20-%20Final%20version%2026th%20October%202009.pdf
Tourism Queensland. (2010g). South East Queensland Country – Tourism
Opportunity Plan (2009-2019). Retrieved from http://www.tq.com.au/fms/
tq_corporate/destinations/south_east_queensland_country/TOP/South%20Ea
st%20Queensland%20Country%20TOP%20%28RTIIP_%20Print%20Ready
%20HI%20RES%20pdf%20%2830_09_09%29.pdf
Tourism Queensland. (2011a). Brand Gold Coast. Retrieved from
http://www.tq.com.au/fms/tq_corporate/About%20TQ%20Brand/Brand%20
Gold Coast.pdf.
Tourism Queensland. (2011b). Brand Sunshine Coast. Retrieved from
http://www.tq.com.au/fms/tq_corporate/destinations/Sunshine_Coast/creative
_toolbox/Sunshine%20Coast%20brand.pdf.
Tourism Queensland. (2011c). Snapshot - Brisbane. Retrieved from
http://www.tq.com.au/destinations/brisbane-and-south-east-qld-country-
zone/brisbane/marketing/snapshot/snapshot_home.cfm
Tversky, A., & Kahneman, D. (1987). Rational choice and the framing of decisions.
In Smith, V.L. (1991). Rational choice: The contrast between economics and
psychology. Journal of Political Economy, 99(4), 877-897.
Var, T., Beck, R. A. D., & Loftus, P. (1977). Determination of touristic
attractiveness of the touristic areas in British Columbia. Journal of Travel
Research, 15(32) 23-29.
Vazquez, R., Belen del Rio, A. & Iglesias, V. (2002). Consumer-based Brand
Equity: Development and Validation of a Measurement Instrument. Journal
of Marketing Management, 18(1), 27-48.
Vinson, D. E., Scott, J. E., & Lamont, L. M. (1977). The role of personal values in
marketing and consumer behavior. Journal of Marketing (pre-1986), 41(2),
44-50.
Wade, D., & Eagles, P. (2003). The use of importance-performance analysis and
market segmentation for tourism management in parks and protected areas:
An application to Tanzania’s national parks. Journal of Ecotourism, 2(3),
196-212.
184
Wang, C-Y., & Hsu, M. K. (2010). The relationship of destination image,
satisfaction and behavioural intentions: An integrated model. Journal of
Travel & Tourism Marketing, 27(8), 829-843.
Washburn, J. H., & Plank, R. E. (2002). Measuring brand equity: an evaluation of a
consumer-based brand equity scale. Journal of Marketing, 10(1) 46-62.
Weaver, D. B., & Lawton, J. L. (2006). Tourism Management (3rd
Ed). Milton:
Wiley.
Weiler, A. (2005). Information-seeking behavior in Generation Y students:
Motivation, critical thinking, and learning theory. The Journal of Academic
Librarianship, 31(1), 46-53.
Wigfield, A. (1994). Expectancy-value theory of achievement motivation: A
developmental perspective. Educational Psychology Review, 6(1), 49-78.
Wiklund, J., Davidsson, P., & Delmar, F. (2003). What do they think and feel about
growth? An expectancy-value approach to small business managers’ attitudes
toward growth. Entrepeneurship Theory and Practice, 27(3), 247-269.
Wilson, A. M. (2003). Marketing research: an integrated approach. Prentice Hall:
Harlow, England.
Winters, L. C. (1991). Brand equity measures: some recent advances. Marketing
Research, 3(3), 70-73.
Wober, K. W. (2002). Benchmarking in tourism and hospitality industries: the
selection of benchmarking partners. Trowbridge: CABI publishing.
Wolburg, J. M., & Pokrywczynski, A. (2001). A psychographic analysis of
Generation Y. Journal of Advertising Research, 41(5), 33-53. In P.
Benckendorff, G. Moscardo, & D. Pendergast (Eds). (2010). Tourism and
Generation Y. Oxfordshire: CABI
Woodside, A.G. & Wilson, J.E. (1985). Effects of consumer awareness of brand
advertising on preference. Journal of Advertising Research, 25(4), 41-48.
Woodside, A. G., & Sherrell, D. (1977). Traveler evoked, inept, and inert sets of
vacation destinations. Journal of Travel Research, 16(1), 14-18.
Xiang, P., McBride, R., Guan, J., & Solmon, M. 2003. Children’s motivation in
elementary physical education: An expectancy-value model of achievement
choice. Research Quarterly for Exercise and Sport, 74(1), 25-35.
Yoo, B., & Donthu, N. (2001). Developing and validating a multidimensional
consumer-based brand equity scale. Journal of Business Research, 52(1), 1-
14.
Yoon, K. P., & Hwang, C-L. (1995). Multiple attribute decision making: An
introduction. Sage Publications: Thousand Oaks.
Young, M. (1995). Evaluative constructions of domestic tourism places. Australian
Geographical Studies, 33(2), 272-286.
Zeithaml, V.A. (1988). Consumer perceptions of price, quality, and value: A means-
end model and synthesis of evidence. The Journal of Marketing, 52(3), 2-22.
Zikmund, W. G. (2003). Business Research Methods. South-Western: United States
of America.
Zikmund, W. G., & Babin, B. (2007). Essentials of Marketing Research. Australia:
Thomson South-Western.
Zikmund, W. G., Ward, S., Lowe, B., Winzar, H., & Babin, B. J. (2011). Marketing
Research. Cengage Learning: South Melbourne.
185
References for analysis of literature table (Appendix One)
Alcaniz, E. B., Garcia, I. S., & Blas, S. S. (2009). The functional-psychological
continuum in the cognitive image of a destination: A confirmatory analysis.
Tourism Management, 30(5), 715-723.
Andersson, M., & Ekman, P. (2009). Ambassador networks and place branding.
Journal of Place Management and Development, 2(1), 41-51.
Barros, C. P., Butler. R., & Correia, A. (2008). Heterogeneity in destination choice:
Tourism in Africa. Journal of Travel Research, 47(2), 235-246.
Boo, S., Busser, J., & Baloglu, S. (2009). A model of customer-based brand equity
and its application to multiple destinations. Tourism Management, 30(2),
219-231.
Bosnjak, M. (2010). Negative symbolic aspects in destination branding: Exploring
the role of the ‘undesired self’ on web-based vacation information search
intentions among potential first-time visitors. Journal of Vacation Marketing,
16(4), 323-330.
Byon, K. K. (2010). Development of a scale measuring destination image. Marketing
Intelligence & Planning, 28(4), 508-532.
Byon, K.K. & Zhang, J.J. (2010). Development of a scale measuring destination
image. Marketing Intelligence & Planning, 28(4), 508-532.
Carlo, M. D., Canali, S., Pritchard, A., & Morgan, N. (2009). Moving Milan towards
Expo 2015: designing culture into a city brand. Journal of Place
Management and Development, 2(1), 8-22.
Chen, N., & Funk, D. (2010). Exploring destination image, experience and revisit
intentions: A comparison of sport and non-sport tourist perceptions. Journal
of Sport & Tourism, 15(3), 239-259.
Chens, C-Y., Sok, P., & Sok, K. (2008). Evaluating the competitive of the tourism
industry in Cambodia: Self-assessment from professionals. Asia Pacific
Journal of Tourism Research, 13(1), 41-66.
Chi, C., & Qu, H. (2008). Examining the structural relationships of destination
image, tourist satisfaction and destination loyalty: An integrated approach.
Tourism Management, 29(4), 624-636.
Choi, J. G., Tkachenko, T., & Sil, S. (2011). On the destination image of Korea by
Russian tourists. Tourism Management, 32(1), 193-194.
Correia, A. & Pimpao, A. (2008). Decision-making processes of Portugese tourist
travelling to South America and Africa. International Journal of Culture,
Tourism and Hospitality Research, 2(4), 330-373.
Correia, A., Silva, J. A., & Moco, C. (2008). Portuguese charter tourists to long-haul
destinations: A travel motive segmentation. Journal of Hospitality & Tourism
Research, 32(2), 169-186.
Cracolici, M. F., & Nijkamp, P. (2009). The attractiveness and competitiveness of
tourist destinations: A study of Southern Italian regions. Tourism
Management, 30(3), 336-344.
Crouch, G. I. (2010). Destination competitiveness: An analysis of determinant
attributes. Journal of Travel Research, 50(1), 27-45.
del Bosque, I. R., & San Martin, H. (2008). Tourist satisfaction a cognitive-affective
model. Annals of Tourism Research, 35(2), 551-573.
del Bosque, I. R., San Martin, H., Collado, J., & los Salmones, M. (2009). A
framework for tourist expectations. International Journal of Culture, Tourism
and Hospitality Research, 3(2), 139-147.
186
Dwivedi, M. (2009). Online destination image of India: a consumer based
perspective. International Journal of Contemporary Hospitality
Management, 21(2), 226-232.
Esper, F. S., & Rateike, J.A. (2010). Tourism destination image and motivations:
The Spanish perspective of Mexico. Journal of Travel & Tourism Marketing,
27(4), 349-360.
Faullant, R., Matzler, K., & Fuller, J. (2008). The impact of satisfaction and image in
loyalty: the case of Alpine ski resorts. Managing Service Quality, 18(2), 163-
178.
Frias, D. M., Rodriguez, M. A., & Castaneda, J. A. (2008). Internet vs. travel
agencies on pre-visit destination image formation: An information processing
view. Tourism Management, 29(1), 163-179.
Gartner, W. C., & Konecnik Ruzzier, M. (2010). Tourism Destination Brand Equity
Dimensions: Renewal versus Repeat Market. Journal of Travel Research,
50(5), 1-11.
Gertner, R. K. (2010). Similarities and differences of the effect of country images on
tourist and study destinations. Journal of Travel & Tourism Marketing, 27(4),
383-395.
Gomezelj, D. O., & Mihalic, T. (2008). Destination competitiveness – Applying
different models, the case of Slovenia. Tourism Management, 29(2), 294-307.
Hallmann, K., & Breuer, C. (2010). The impact of image congruence between sport
event and destination on behavioural intentions. Tourism Review, 65(1), 66-
74.
Hsu, C.H.C., Cai, L.A., & Li, M. (2010). Expectation, motivation, and attitude: A
tourist behavioral model. Journal of Travel Research, 49(3), 282-296.
Huang, S., & Gross, M.J. (2010). Australia’s destination image among Mainland
Chinese travelers: An exploratory study. Journal of Travel & Tourism
Marketing, 27(1), 63-81.
Hubner, A. (2009). Tourist images of Greenland and the Arctic: a perception
analysis. Polar Record, 45(233), 153-166.
Jalilvand, M. R., Esfahani, S. S., & Samiei, N. (2010). Destination branding and
tourists’ attitudes (The case of Isafhan as a tourism destination of Iran).
International Journal of Marketing Studies, 2(2), 235-244.
Kim, H., & Fesenmaier, D. R. (2008). Persuasive design of destination web sites: An
analysis of first impression. Journal of Travel Research, 47(1), 3-13.
Kim, K. (2008). Analysis of structural equation model for the student pleasure travel
market: Motivation, involvement, satisfaction and destination loyalty.
Journal of Travel & Tourism Marketing, 24(4), 297-313.
Kim, S-H., Han, H-S., Holland, S., & Byon, K.K. (2009). Structural relationships
among involvement, destination brand equity, satisfaction and destination visit
intentions: The case of Japanese outbound travelers. Journal of Vacation
Marketing, 15(4), 349-365.
Kim, S.S., McKercher, B., & Lee, H. (2009). Tracking tourism destination image
perception. Annals of Tourism Research, 36(4), 715-718.
Kneesel, E., Baloglu, S., & Millar, M. (2010). Gaming destination images:
Implications for branding. Journal of Travel Research, 49(1), 68-78.
Konu, H., Laukkanen, T., & Komppula, R. (2010). Using ski destination choice
criteria to segment Finnish ski resort customers. Tourism Management, 32(5),
1096-1105.
187
Law, R., & Cheung, S. (2010). The perceived destination image of Hong Kong as
revealed in the travel blogs of Mainland Chinese tourists. International
Journal of Hospitality & Tourism Administration, 11(4), 303-327.
Lee, M. J., & Back, K-J. (2008). Association meeting participation: A test of
competing models. Journal of Travel Research, 46(3) 300-310. DOI:
10.1177/0047287507308320.
Lee, S., Scott, D., & Kim, H. (2008). Celebrity fan involvement and destination
perceptions. Annals of Tourism Research, 35(3), 809-832.
Lee, T. H. (2009a). A structural model to examine how destination image. Attitude,
and motivation affect the future behaviour of tourists. Leisure Sciences,
31(3), 215-236.
Lee, T. H. (2009b). A structural model for examining how destination image and
interpretation services affect future visitation behavior: a case study of
Taiwan’s Taomi eco-village. Journal of Sustainable Tourism, 17(6), 727-745.
Lee, G. & Lee, C-K. (2009). Cross-cultural comparison of the image of Guam
perceived by Korean and Japanese leisure travelers: Importance-performance
analysis. Tourism Management, 30(6), 922-931.
Lepp, A., & Gibson, H. (2008). Sensation seeking and tourism: Tourist role,
perception of risk and destination choice. Tourism Management, 29(4), 740-
750.
Lepp, A., Gibson, H., & Lane, C. (2010). Image and perceived risk: A study of
Uganda and its official tourism website. Tourism Management, 32(3), 675-
684.
Li, M., Cai, L.A., Lehto, X.Y., & Huang, J. (2010). A missing link in understanding
revisit intention – The role of motivation and image. Journal of Travel &
Tourism Marketing, 27(4), 335-348.
Li, X., Pan, B., Zhang, L., & Smith, W.W. (2009). The effect of online information
search on image development: Insights from mixed-methods study. Journal
of Travel Research, 48(1) 45-57.
Llewellyn-Smith, C., & McCabe, V. S. (2008). What is the attractions for exchange
students: the host destination or host university? Empirical evidence from a
study from an Australian university. International Journal of Tourism
Research, 10(6), 593-607.
Loureiro, S. M. C. & Gonzalez. F. J. M. (2008). The importance of quality,
satisfaction, trust, and image in relation to rural tourist loyalty. Journal of
Travel & Tourism Marketing, 25(2), 117-136.
McCartney, G. (2008). Does on culture all think the same? An investigation of
destination image perceptions from several origins. Tourism Review, 63(4),
13-26.
McCartney, G., Butler, R., & Bennett, M. (2008). A strategic use of the
communication mix in the destination image-formation process. Journal of
Travel Research, 47(2), 183-196.
Meng, F., Tepanon, Y., & Uysal, M. (2008). Measuring tourist satisfaction by
attribute and motivation: The case of a nature-based resort. Journal of
Vacation Marketing, 14(1), 41-56.
Merrilees, B., Miller, D., & Herington, C. (2009). Antecedents of residents’ city
brand attitudes. Journal of Business Research, 62(3), 362-367.
Mestre, R., del Rey, A., & Stanishevski, K. (2008). The image of Spain as tourist
destination built through fictional cinema. Journal of Travel & Tourism
Marketing, 24(2-3), 185-194.
188
Nadeau, J., Heslop, L., O’Reilly, N., & Luk, P. (2008). Destination in a country
image context. Annals of Tourism Research, 35(1), 84-106.
Negrete, M. P. (2009). Santa Fe: a “global enclave” in Mexico city. Journal of Place
Management and Development, 2(1), 33-40.
O’Connor, N., Flanagan, S., & Gilbert, D. (2010). The use of film in re-imaging a
tourism destination: a case study of Yorkshire, UK. Journal of Vacation
Marketing, 16(1), 61-74.
Ozturk, A..B., & Qu, H. (2008). The impact of destination images on tourists
perceived value, expectations, and loyalty. Journal of Quality Assurance in
Hospitality & Tourism, 9(4), 275-297.
Pan, S. (2009). The role of TV commercial visuals in forming memorable and
impressive destination images. Journal of Travel Research, 50(2), 171-185.
Pearlman, D., & Melnik, O. (2008). Hurricane Katrina’s effect on the perception of
New Orleans leisure tourists. Journal of Travel & Tourism Marketing, 25(1),
58-67.
Phau, I., Shanka, T., & Dhayan, N. (2010). Destination image and choice intention of
university student travellers to Mauritius. International Journal of
Contemporary Hospitality Management, 22(5), 758-764.
Pike, S. (2009). Destination brand positions of a competitive set of near-home
destinations. Tourism Management, 30(6), 857-866.
Pike, S. (2010). Destination branding case study: Tracking brand equity for an
emerging destination between 2003 and 2007. Journal of Hospitality &
Tourism Research, 34(1), 124-139.
Pike, S., Bianchi, C., Kerr, G., & Patti, C. (2010). Consumer-based brand equity for
Australia as a long-haul destination in an emerging market. International
Marketing Review, 27(4), 434-449.
Pike, S., & Mason, R. (2011). Destination competitiveness through the lens of brand
positioning: the case of Australia’s Sunshine Coast. Current Issues in
Tourism, 14(2), 169-182.
Prayag, G. (2009). Tourists’ evaluations of destination image, satisfaction, and future
behavioral intentions – The case of Mauritius. Journal of Travel & Tourism
Marketing, 26(8), 836-853.
Qu, H., Kim, L. H., & Im, H. H. (2011). A model of destination branding:
Integrating the concepts of branding and destination image. Tourism
Management, 32(3), 465-476.
Reichel, A., Fuchs, G., & Uriely, N. (2009). Israeli backpackers: The role of
destination choice. Annals of Tourism Research, 36(2), 222-246.
Rewtrakunphaiboon, W., & Oppewal, H. (2008). Effects on package holiday
information presentation on destination choice. Journal of Travel Research,
47(2), 127-136. DOI: 10.1177/0047287508321190.
Royo-Vela, M. (2009). Rural-cultural excursion conceptualization: A local tourism
marketing management model based on tourist destination image
measurement. Tourism Management, 30(3), 419-428.
Ryan, C., & Aicken, M. (2010). The destination image gap – visitors’ and residents’
perceptions of place: evidence from Waiheke Island, New Zealand. Current
Issues of Tourism, 13(6), 541-561.
San Martin, H., & del Bosque, I. A. R. (2008). Exploring the cognitive-affective
nature of destination image and the role of psychological factors in its
formation. Tourism Management, 29(2), 263-277.
189
Sangpikul, A. (2008a). Travel motivations of Japanese senior travellers to Thailand.
International Journal of Tourism Research, 10(1), 81-94.
Sangpikul, A. (2008b). A factor-cluster analysis of tourist motivations: A case of
U.S. senior travelers. Tourism, 56(1), 23-40.
Shani, A., Wang, Y., Hudson, S., & Gil, S. M. (2009). Impacts of a historical film on
the destination image of South America. Journal of Vacation Marketing,
15(3), 229-242.
Shanka, T., & Phau, I. (2008). Tourism destination attributes: What the non-visitors
say – Higher education student’s perceptions. Asia Pacific Journal of
Tourism Research, 13(1), 81-94.
Smith, W.W., Carmichael, B.A., & Batovsky, N.M. (2008). Understanding the
potential impact on the image of Canada as a weekend travel destination as a
result of Western Hemisphere travel initiative passport requirements. Journal
of Travel & Tourism Marketing, 23(2), 113-126.
Stepchenkova, S., & Eales, J.S. (2010). Destination image as quantified media
messages: The effect of news on tourism demand. Journal of Travel
Research, 50(2), 1-15
Stepchenkova, S., & Morrison, A.M. (2008). Russia’s destination image among
American pleasure travelers: Revisiting Echtner and Ritchie. Tourism
Management, 29(3), 548-560.
Tasci, A. D. A. (2008). Social distance: The missing link in the loop of movies,
destination image, and tourist behaviour? Journal of Travel Research, 47(4),
494-507. DOI: 10.1177/0047287508326534
Truong, T-H., & King, B. (2009). An evaluation of satisfaction levels among
Chinese tourists in Vietnam. International Journal of Tourism Research,
11(6), 521-535.
Usakli, A., & Baloglu, S. (2010). Brand personality of tourist destinations: An
application of self-congruity theory. Tourism Management, 32(1), 114-127.
DOI: 10.1016/j.tourman.2010.06.006
Vengesayi, S. (2008). Destination attractiveness: Are there relationships with
destination attributes. The Business Review, Cambridge, 10(2), 289-294.
Wang, Y. & Davidson, M.C.G. (2008). Chinese student travel market to Australia:
An exploratory assessment of destination perceptions. International Journal
of Hospitality & Tourism Management, 9(4), 405-426.
Wang, C-Y., & Hsu, M. K. (2010). The relationship of destination image,
satisfaction and behavioural intentions: An integrated model. Journal of
Travel & Tourism Marketing, 27(8), 829-843.
Wenger, A. (2008). Analysis of travel bloggers’ characteristics and their
communication about Austria as a tourism destination. Journal of Vacation
Marketing, 14(2), 169-176.
Yilmaz, Y., Yilmaz, Y., Icigen, E.T., Ekin, Y., & Utku, B.D. (2009). Destination
image: A comparative study on pre and post trip image variations. Journal of
Hospitality Marketing & Management, 18(5), 461-479.
Yoo, J., & Chon, K. (2008). Factors affecting convention participation decision-
making: Developing a measurement scale. Journal of Travel Research, 47(1),
113-122.
Yuksel, A., Yuksel, F., & Bilim, Y. (2010). Destination attachment: Effects on
customer satisfaction and cognitive, affective and conative loyalty. Tourism
Management, 31(2), 274-284.

190
Zabkar, V., Brencic, M. M., & Dmitrovic, T. (2010). Modelling perceived quality,
visitor satisfaction and behavioural intentions at the destination level.
Tourism Management, 31(4), 537-546.
Zhou, Y., & Ap, J. (2009). Residents’ perceptions towards the impacts of the Beijing
2008 Olympic games. Journal of Travel Research, 48(1), 78-91.
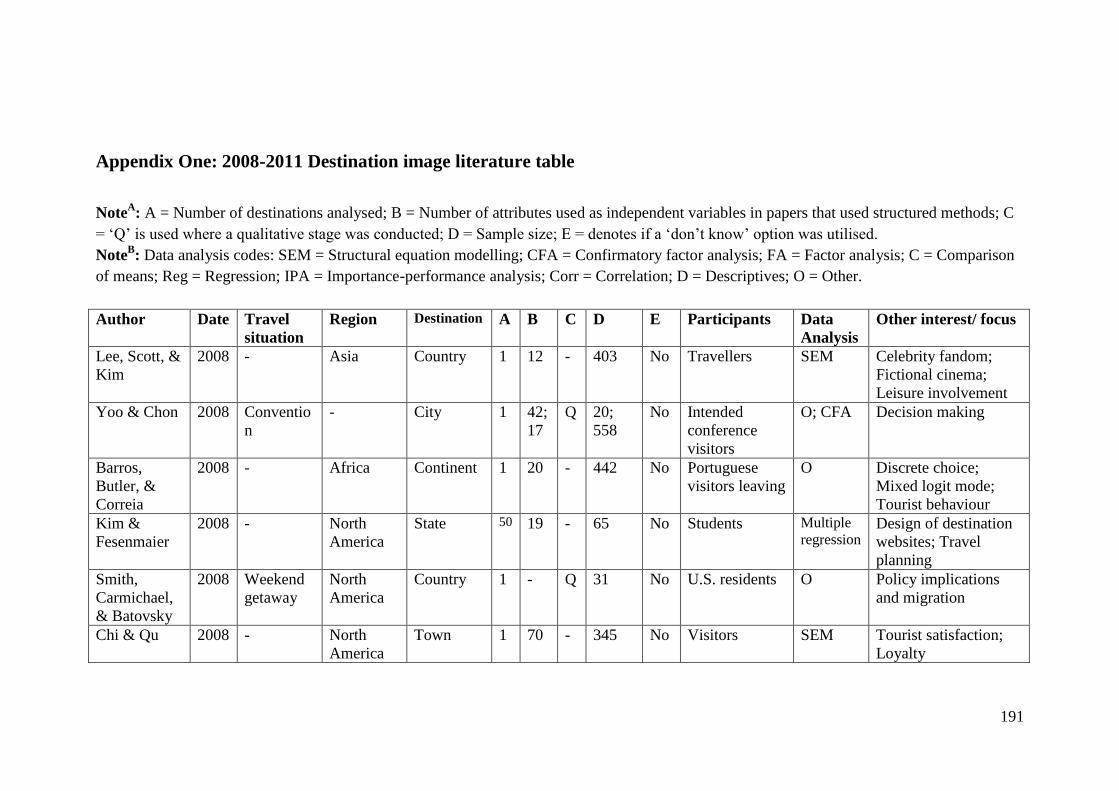
191
Appendix One: 2008-2011 Destination image literature table
NoteA: A = Number of destinations analysed; B = Number of attributes used as independent variables in papers that used structured methods; C
= ‘Q’ is used where a qualitative stage was conducted; D = Sample size; E = denotes if a ‘don’t know’ option was utilised.
NoteB: Data analysis codes: SEM = Structural equation modelling; CFA = Confirmatory factor analysis; FA = Factor analysis; C = Comparison
of means; Reg = Regression; IPA = Importance-performance analysis; Corr = Correlation; D = Descriptives; O = Other.
Author Date Travel
situation
Region Destination A B C D E Participants Data
Analysis
Other interest/ focus
Lee, Scott, &
Kim
2008 - Asia Country 1 12 - 403 No Travellers SEM Celebrity fandom;
Fictional cinema;
Leisure involvement
Yoo & Chon 2008 Conventio
n
- City 1 42;
17
Q 20;
558
No Intended
conference
visitors
O; CFA Decision making
Barros,
Butler, &
Correia
2008 - Africa Continent 1 20 - 442 No Portuguese
visitors leaving
O Discrete choice;
Mixed logit mode;
Tourist behaviour
Kim &
Fesenmaier
2008 - North
America
State 50 19 - 65 No Students Multiple
regression Design of destination
websites; Travel
planning
Smith,
Carmichael,
& Batovsky
2008 Weekend
getaway
North
America
Country 1 - Q 31 No U.S. residents O Policy implications
and migration
Chi & Qu 2008 - North
America
Town 1 70 - 345 No Visitors SEM Tourist satisfaction;
Loyalty
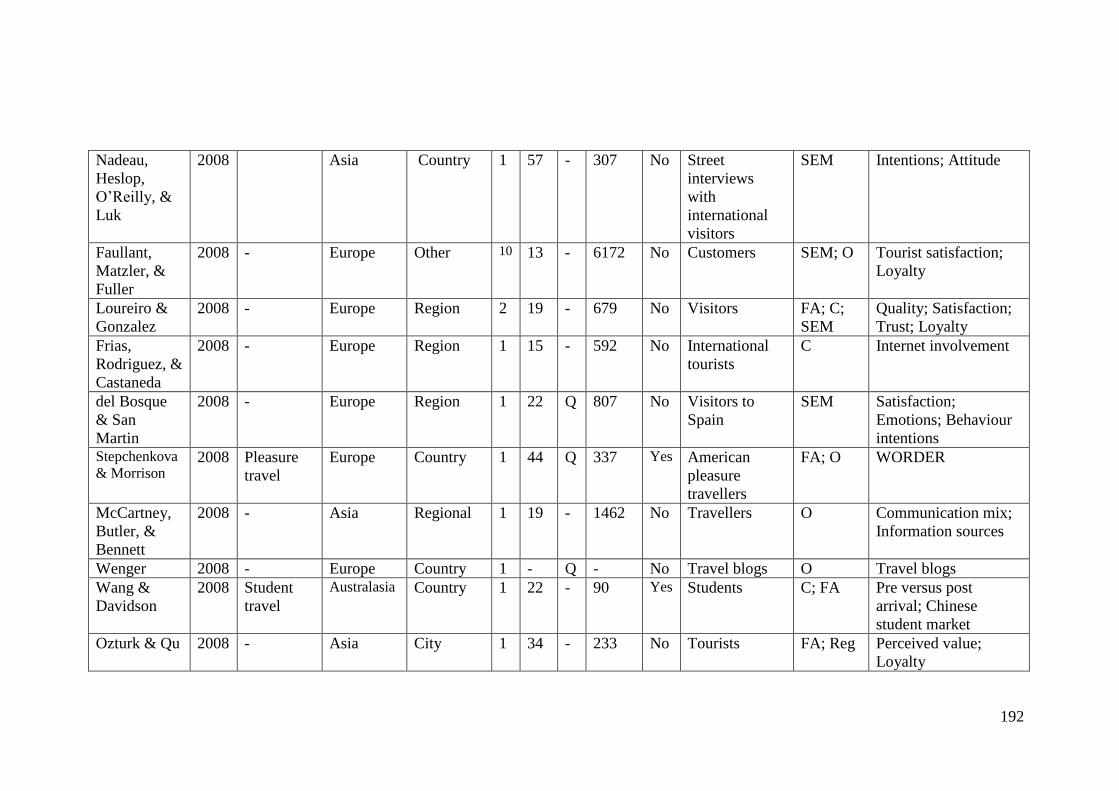
192
Nadeau,
Heslop,
O’Reilly, &
Luk
2008 Asia Country 1 57 - 307 No Street
interviews
with
international
visitors
SEM Intentions; Attitude
Faullant,
Matzler, &
Fuller
2008 - Europe Other 10 13 - 6172 No Customers SEM; O Tourist satisfaction;
Loyalty
Loureiro &
Gonzalez
2008 - Europe Region 2 19 - 679 No Visitors FA; C;
SEM
Quality; Satisfaction;
Trust; Loyalty
Frias,
Rodriguez, &
Castaneda
2008 - Europe Region 1 15 - 592 No International
tourists
C Internet involvement
del Bosque
& San
Martin
2008 - Europe Region 1 22 Q 807 No Visitors to
Spain
SEM Satisfaction;
Emotions; Behaviour
intentions Stepchenkova
& Morrison 2008 Pleasure
travel
Europe Country 1 44 Q 337 Yes American
pleasure
travellers
FA; O WORDER
McCartney,
Butler, &
Bennett
2008 - Asia Regional 1 19 - 1462 No Travellers O Communication mix;
Information sources
Wenger 2008 - Europe Country 1 - Q - No Travel blogs O Travel blogs
Wang &
Davidson
2008 Student
travel
Australasia Country 1 22 - 90 Yes Students C; FA Pre versus post
arrival; Chinese
student market
Ozturk & Qu 2008 - Asia City 1 34 - 233 No Tourists FA; Reg Perceived value;
Loyalty
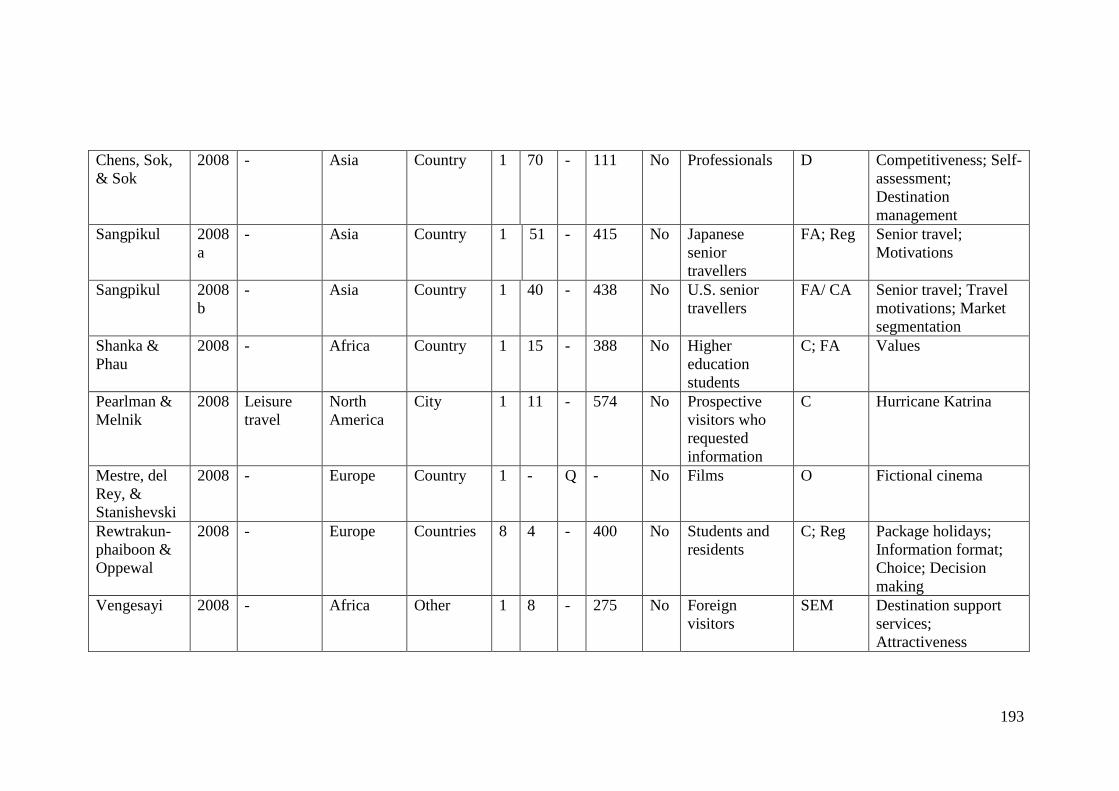
193
Chens, Sok,
& Sok
2008 - Asia Country 1 70 - 111 No Professionals D Competitiveness; Self-
assessment;
Destination
management
Sangpikul 2008
a
- Asia Country 1 51 - 415 No Japanese
senior
travellers
FA; Reg Senior travel;
Motivations
Sangpikul 2008
b
- Asia Country 1 40 - 438 No U.S. senior
travellers
FA/ CA Senior travel; Travel
motivations; Market
segmentation
Shanka &
Phau
2008 - Africa Country 1 15 - 388 No Higher
education
students
C; FA Values
Pearlman &
Melnik
2008 Leisure
travel
North
America
City 1 11 - 574 No Prospective
visitors who
requested
information
C Hurricane Katrina
Mestre, del
Rey, &
Stanishevski
2008 - Europe Country 1 - Q - No Films O Fictional cinema
Rewtrakun-
phaiboon &
Oppewal
2008 - Europe Countries 8 4 - 400 No Students and
residents
C; Reg Package holidays;
Information format;
Choice; Decision
making
Vengesayi 2008 - Africa Other 1 8 - 275 No Foreign
visitors
SEM Destination support
services;
Attractiveness
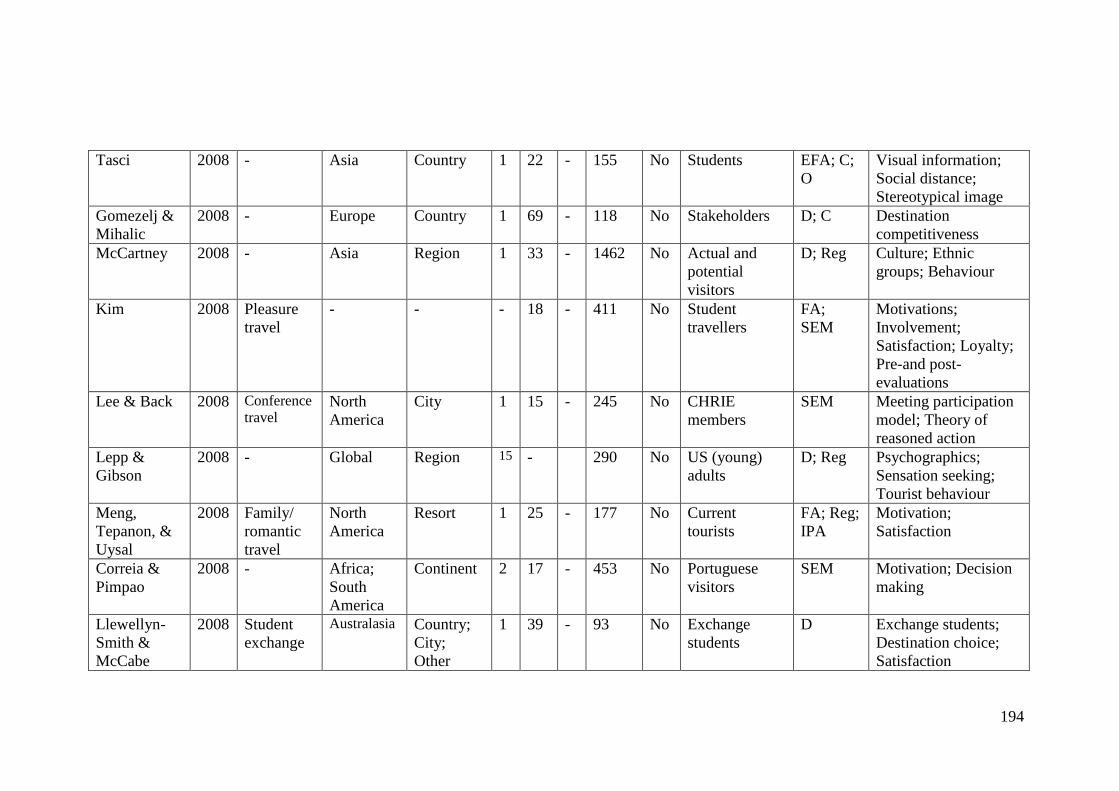
194
Tasci 2008 - Asia Country 1 22 - 155 No Students EFA; C;
O
Visual information;
Social distance;
Stereotypical image
Gomezelj &
Mihalic
2008 - Europe Country 1 69 - 118 No Stakeholders D; C Destination
competitiveness
McCartney 2008 - Asia Region 1 33 - 1462 No Actual and
potential
visitors
D; Reg Culture; Ethnic
groups; Behaviour
Kim 2008 Pleasure
travel
- - - 18 - 411 No Student
travellers
FA;
SEM
Motivations;
Involvement;
Satisfaction; Loyalty;
Pre-and post-
evaluations
Lee & Back 2008 Conference
travel North
America
City 1 15 - 245 No CHRIE
members
SEM Meeting participation
model; Theory of
reasoned action
Lepp &
Gibson
2008 - Global Region 15 - 290 No US (young)
adults
D; Reg Psychographics;
Sensation seeking;
Tourist behaviour
Meng,
Tepanon, &
Uysal
2008 Family/
romantic
travel
North
America
Resort 1 25 - 177 No Current
tourists
FA; Reg;
IPA
Motivation;
Satisfaction
Correia &
Pimpao
2008 - Africa;
South
America
Continent 2 17 - 453 No Portuguese
visitors
SEM Motivation; Decision
making
Llewellyn-
Smith &
McCabe
2008 Student
exchange
Australasia Country;
City;
Other
1 39 - 93 No Exchange
students
D Exchange students;
Destination choice;
Satisfaction
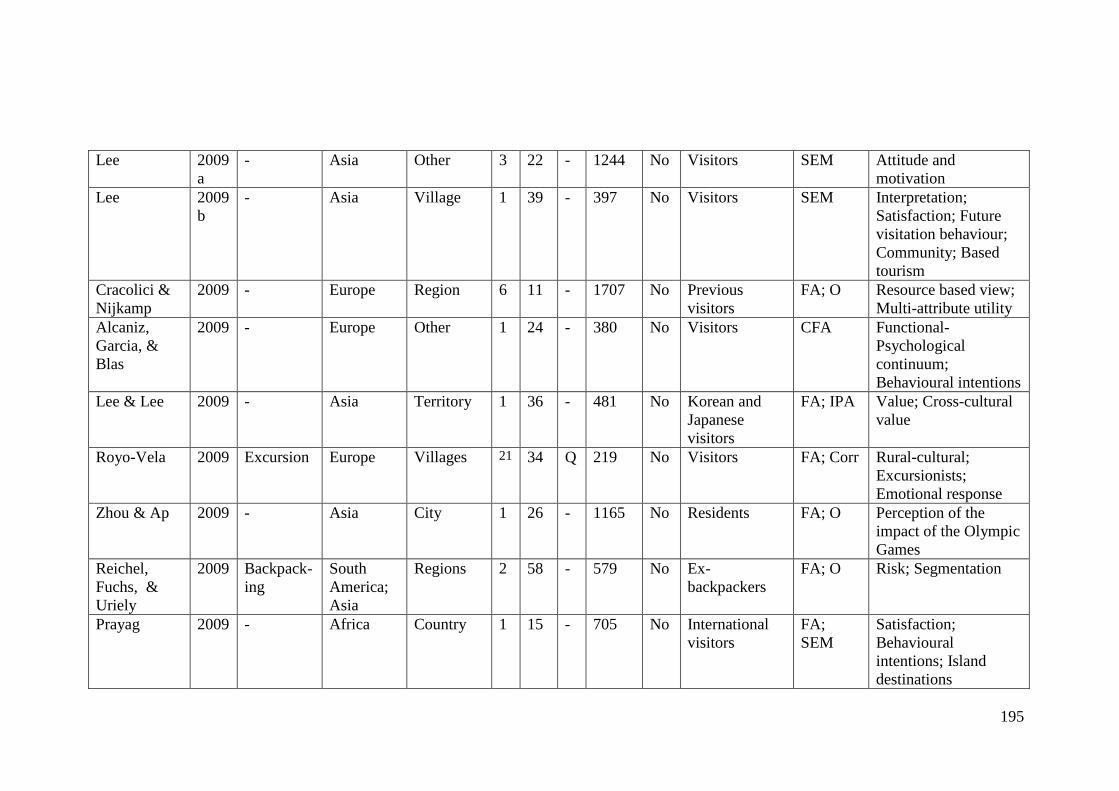
195
Lee 2009
a
- Asia Other 3 22 - 1244 No Visitors SEM Attitude and
motivation
Lee 2009
b
- Asia Village 1 39 - 397 No Visitors SEM Interpretation;
Satisfaction; Future
visitation behaviour;
Community; Based
tourism
Cracolici &
Nijkamp
2009 - Europe Region 6 11 - 1707 No Previous
visitors
FA; O Resource based view;
Multi-attribute utility
Alcaniz,
Garcia, &
Blas
2009 - Europe Other 1 24 - 380 No Visitors CFA Functional-
Psychological
continuum;
Behavioural intentions
Lee & Lee 2009 - Asia Territory 1 36 - 481 No Korean and
Japanese
visitors
FA; IPA Value; Cross-cultural
value
Royo-Vela 2009 Excursion Europe Villages 21 34 Q 219 No Visitors FA; Corr Rural-cultural;
Excursionists;
Emotional response
Zhou & Ap 2009 - Asia City 1 26 - 1165 No Residents FA; O Perception of the
impact of the Olympic
Games
Reichel,
Fuchs, &
Uriely
2009 Backpack-
ing
South
America;
Asia
Regions 2 58 - 579 No Ex-
backpackers
FA; O Risk; Segmentation
Prayag 2009 - Africa Country 1 15 - 705 No International
visitors
FA;
SEM
Satisfaction;
Behavioural
intentions; Island
destinations
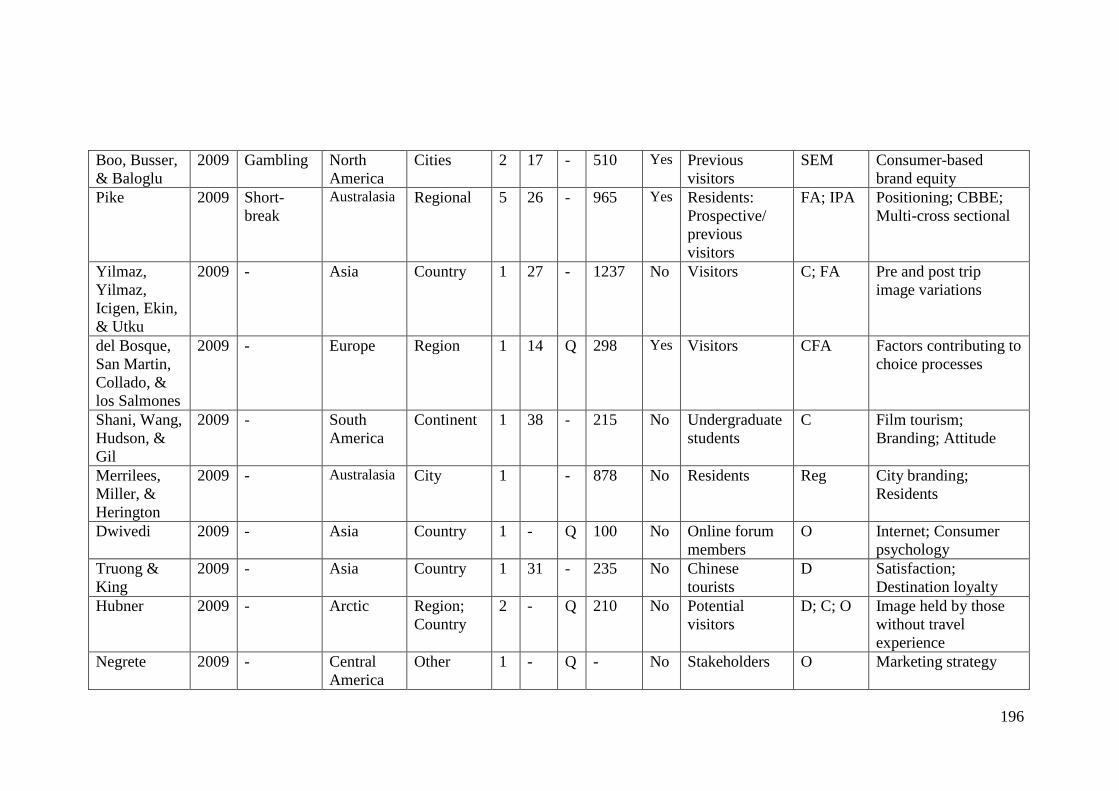
196
Boo, Busser,
& Baloglu
2009 Gambling North
America
Cities 2 17 - 510 Yes Previous
visitors
SEM Consumer-based
brand equity
Pike 2009 Short-
break
Australasia Regional 5 26 - 965 Yes Residents:
Prospective/
previous
visitors
FA; IPA Positioning; CBBE;
Multi-cross sectional
Yilmaz,
Yilmaz,
Icigen, Ekin,
& Utku
2009 - Asia Country 1 27 - 1237 No Visitors C; FA Pre and post trip
image variations
del Bosque,
San Martin,
Collado, &
los Salmones
2009 - Europe Region 1 14 Q 298 Yes Visitors CFA Factors contributing to
choice processes
Shani, Wang,
Hudson, &
Gil
2009 - South
America
Continent 1 38 - 215 No Undergraduate
students
C Film tourism;
Branding; Attitude
Merrilees,
Miller, &
Herington
2009 - Australasia City 1 - 878 No Residents Reg City branding;
Residents
Dwivedi 2009 - Asia Country 1 - Q 100 No Online forum
members
O Internet; Consumer
psychology
Truong &
King
2009 - Asia Country 1 31 - 235 No Chinese
tourists
D Satisfaction;
Destination loyalty
Hubner 2009 - Arctic Region;
Country
2 - Q 210 No Potential
visitors
D; C; O Image held by those
without travel
experience
Negrete 2009 - Central
America
Other 1 - Q - No Stakeholders O Marketing strategy
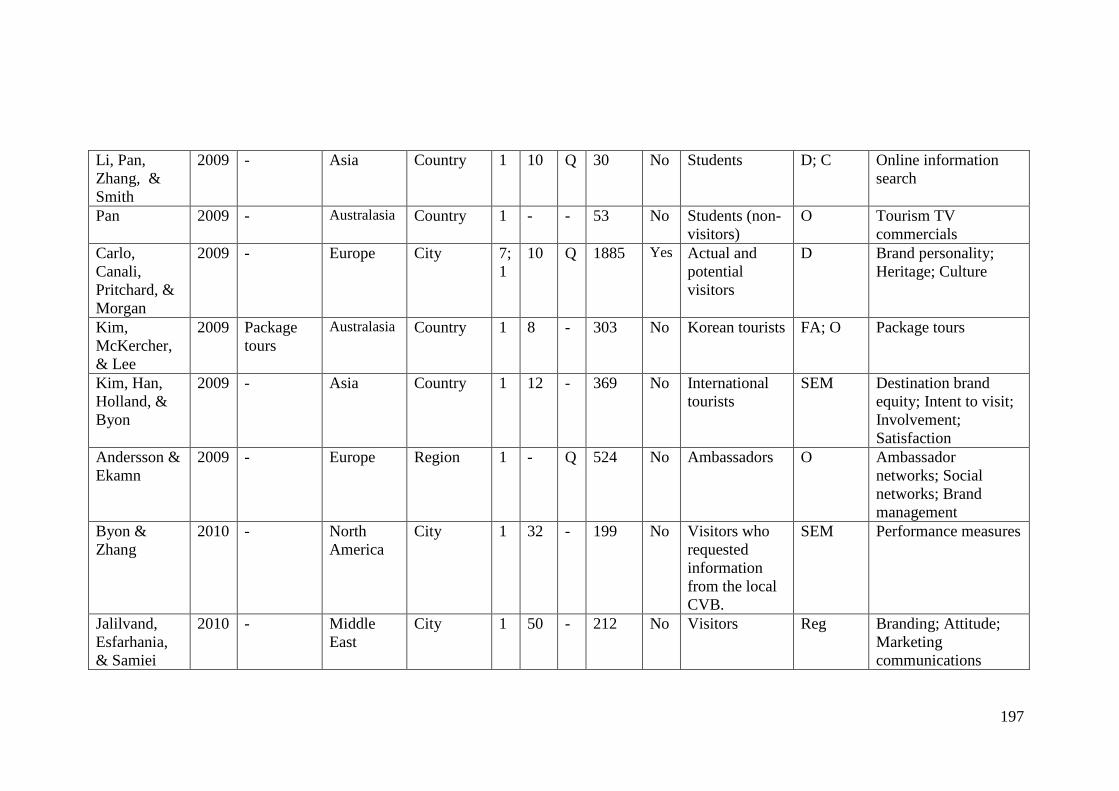
197
Li, Pan,
Zhang, &
Smith
2009 - Asia Country 1 10 Q 30 No Students D; C Online information
search
Pan 2009 - Australasia Country 1 - - 53 No Students (non-
visitors)
O Tourism TV
commercials
Carlo,
Canali,
Pritchard, &
Morgan
2009 - Europe City 7;
1
10 Q 1885 Yes Actual and
potential
visitors
D Brand personality;
Heritage; Culture
Kim,
McKercher,
& Lee
2009 Package
tours
Australasia Country 1 8 - 303 No Korean tourists FA; O Package tours
Kim, Han,
Holland, &
Byon
2009 - Asia Country 1 12 - 369 No International
tourists
SEM Destination brand
equity; Intent to visit;
Involvement;
Satisfaction
Andersson &
Ekamn
2009 - Europe Region 1 - Q 524 No Ambassadors O Ambassador
networks; Social
networks; Brand
management
Byon &
Zhang
2010 - North
America
City 1 32 - 199 No Visitors who
requested
information
from the local
CVB.
SEM Performance measures
Jalilvand,
Esfarhania,
& Samiei
2010 - Middle
East
City 1 50 - 212 No Visitors Reg Branding; Attitude;
Marketing
communications
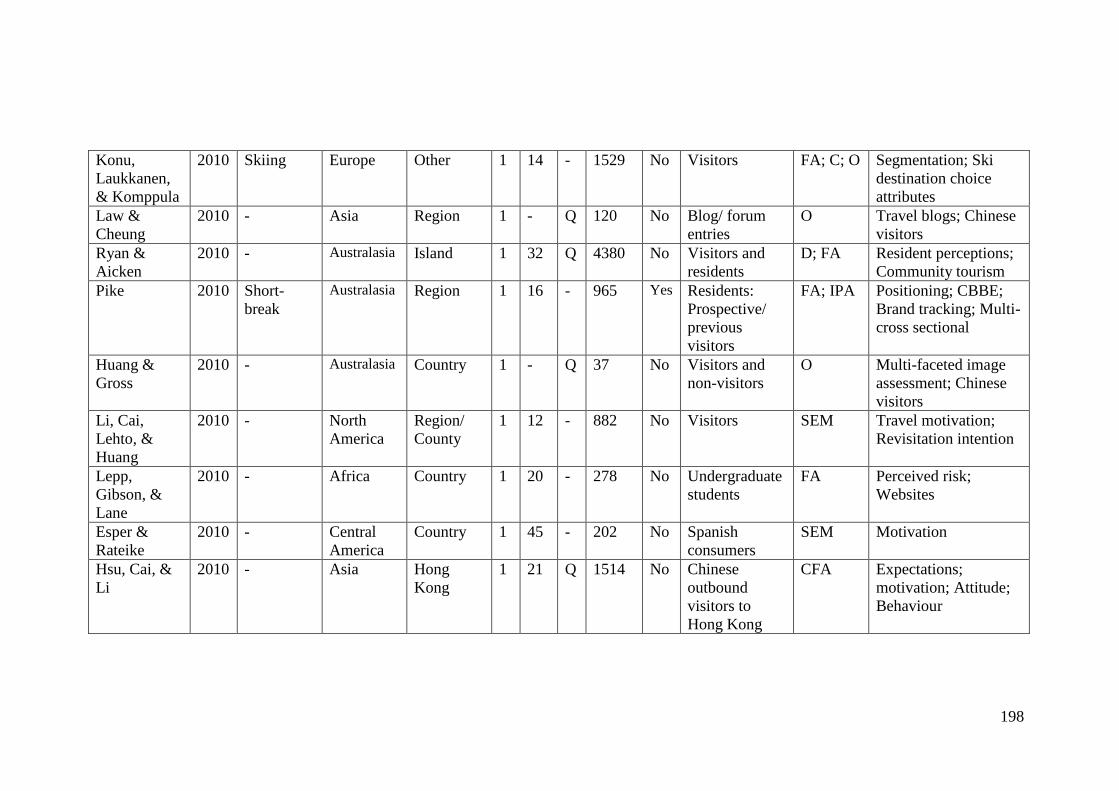
198
Konu,
Laukkanen,
& Komppula
2010 Skiing Europe Other 1 14 - 1529 No Visitors FA; C; O Segmentation; Ski
destination choice
attributes
Law &
Cheung
2010 - Asia Region 1 - Q 120 No Blog/ forum
entries
O Travel blogs; Chinese
visitors
Ryan &
Aicken
2010 - Australasia Island 1 32 Q 4380 No Visitors and
residents
D; FA Resident perceptions;
Community tourism
Pike 2010 Short-
break
Australasia Region 1 16 - 965 Yes Residents:
Prospective/
previous
visitors
FA; IPA Positioning; CBBE;
Brand tracking; Multi-
cross sectional
Huang &
Gross
2010 - Australasia Country 1 - Q 37 No Visitors and
non-visitors
O Multi-faceted image
assessment; Chinese
visitors
Li, Cai,
Lehto, &
Huang
2010 - North
America
Region/
County
1 12 - 882 No Visitors SEM Travel motivation;
Revisitation intention
Lepp,
Gibson, &
Lane
2010 - Africa Country 1 20 - 278 No Undergraduate
students
FA Perceived risk;
Websites
Esper &
Rateike
2010 - Central
America
Country 1 45 - 202 No Spanish
consumers
SEM Motivation
Hsu, Cai, &
Li
2010 - Asia Hong
Kong
1 21 Q 1514 No Chinese
outbound
visitors to
Hong Kong
CFA Expectations;
motivation; Attitude;
Behaviour
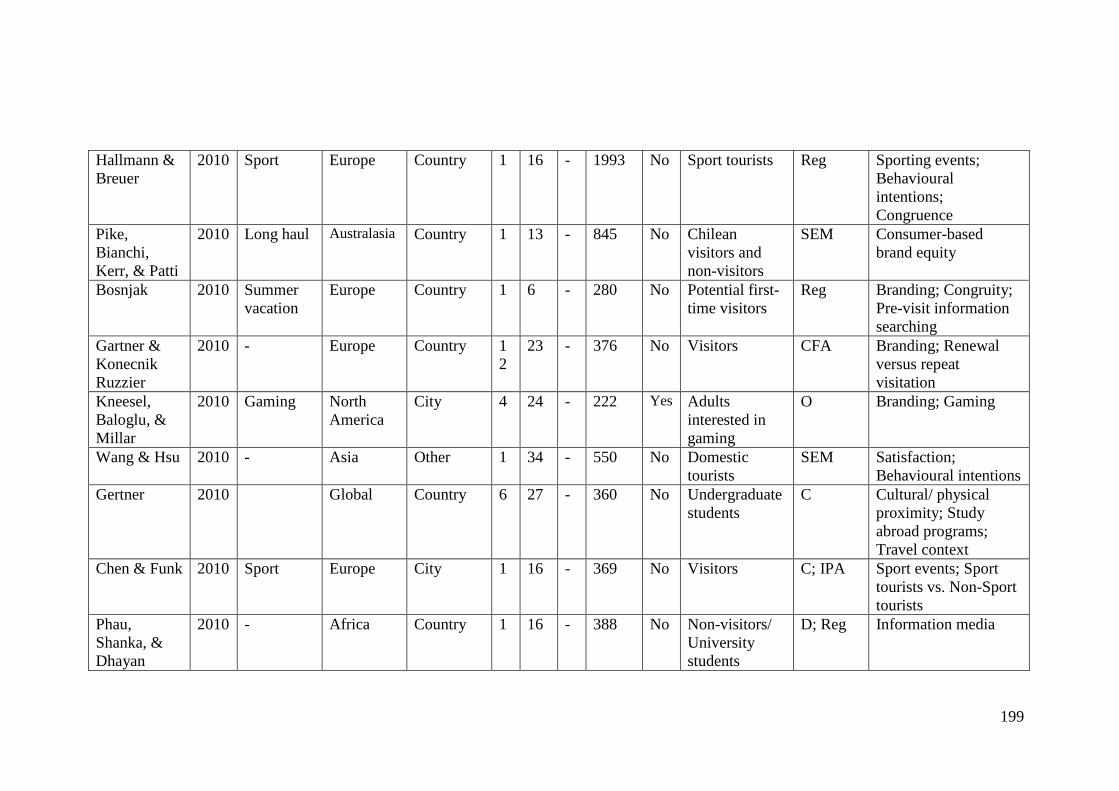
199
Hallmann &
Breuer
2010 Sport Europe Country 1 16 - 1993 No Sport tourists Reg Sporting events;
Behavioural
intentions;
Congruence
Pike,
Bianchi,
Kerr, & Patti
2010 Long haul Australasia Country 1 13 - 845 No Chilean
visitors and
non-visitors
SEM Consumer-based
brand equity
Bosnjak 2010 Summer
vacation
Europe Country 1 6 - 280 No Potential first-
time visitors
Reg Branding; Congruity;
Pre-visit information
searching
Gartner &
Konecnik
Ruzzier
2010 - Europe Country 1
2
23 - 376 No Visitors CFA Branding; Renewal
versus repeat
visitation
Kneesel,
Baloglu, &
Millar
2010 Gaming North
America
City 4 24 - 222 Yes Adults
interested in
gaming
O Branding; Gaming
Wang & Hsu 2010 - Asia Other 1 34 - 550 No Domestic
tourists
SEM Satisfaction;
Behavioural intentions
Gertner 2010 Global Country 6 27 - 360 No Undergraduate
students
C Cultural/ physical
proximity; Study
abroad programs;
Travel context
Chen & Funk 2010 Sport Europe City 1 16 - 369 No Visitors C; IPA Sport events; Sport
tourists vs. Non-Sport
tourists
Phau,
Shanka, &
Dhayan
2010 - Africa Country 1 16 - 388 No Non-visitors/
University
students
D; Reg Information media
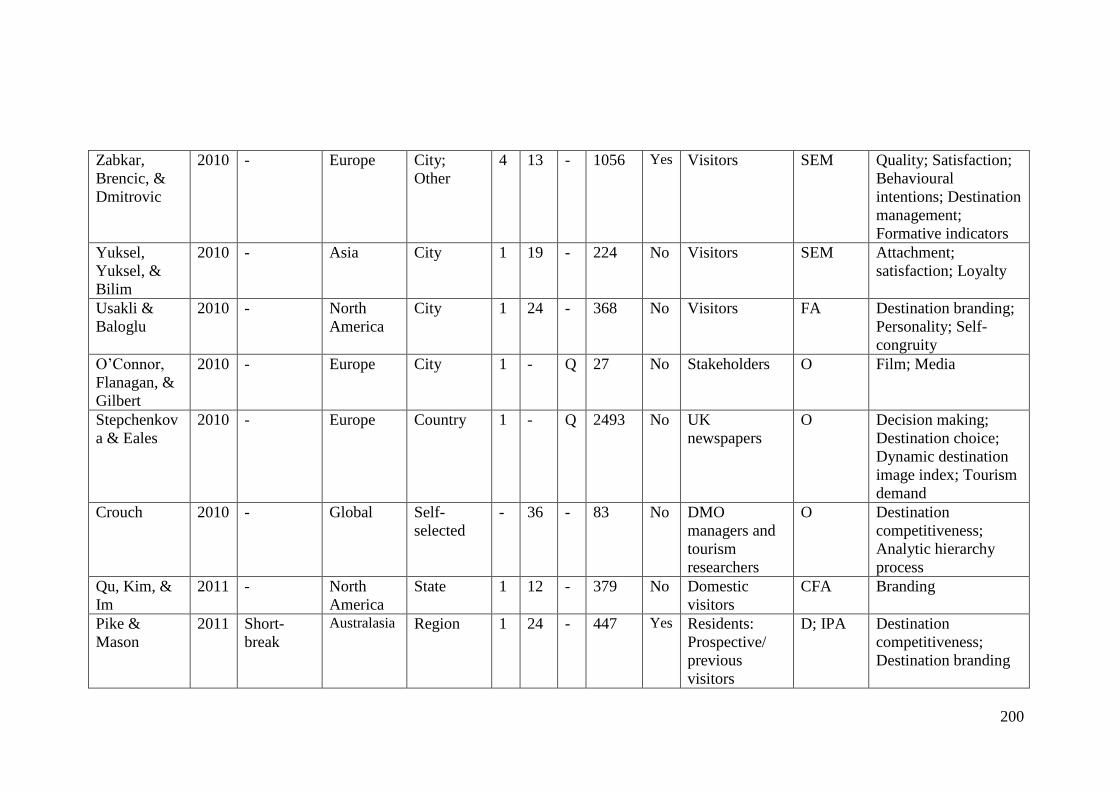
200
Zabkar,
Brencic, &
Dmitrovic
2010 - Europe City;
Other
4 13 - 1056 Yes Visitors SEM Quality; Satisfaction;
Behavioural
intentions; Destination
management;
Formative indicators
Yuksel,
Yuksel, &
Bilim
2010 - Asia City 1 19 - 224 No Visitors SEM Attachment;
satisfaction; Loyalty
Usakli &
Baloglu
2010 - North
America
City 1 24 - 368 No Visitors FA Destination branding;
Personality; Self-
congruity
O’Connor,
Flanagan, &
Gilbert
2010 - Europe City 1 - Q 27 No Stakeholders O Film; Media
Stepchenkov
a & Eales
2010 - Europe Country 1 - Q 2493 No UK
newspapers
O Decision making;
Destination choice;
Dynamic destination
image index; Tourism
demand
Crouch 2010 - Global Self-
selected
- 36 - 83 No DMO
managers and
tourism
researchers
O Destination
competitiveness;
Analytic hierarchy
process
Qu, Kim, &
Im
2011 - North
America
State 1 12 - 379 No Domestic
visitors
CFA Branding
Pike &
Mason
2011 Short-
break
Australasia Region 1 24 - 447 Yes Residents:
Prospective/
previous
visitors
D; IPA Destination
competitiveness;
Destination branding
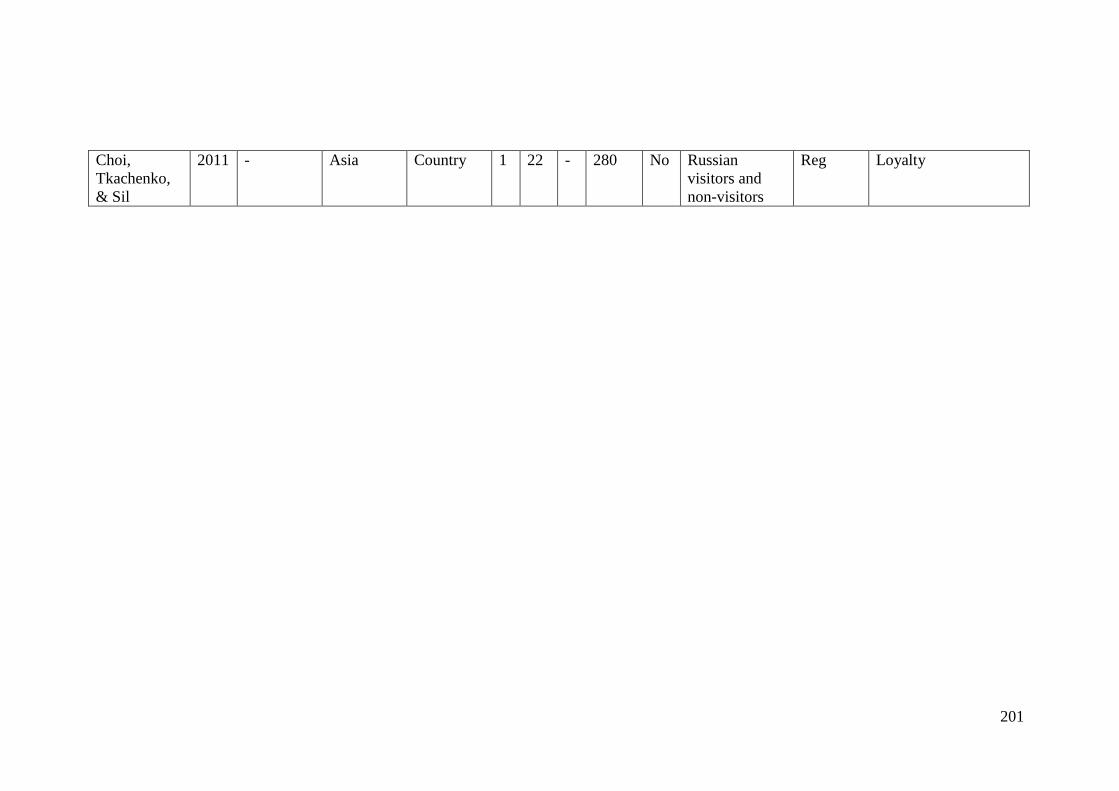
201
Choi,
Tkachenko,
& Sil
2011 - Asia Country 1 22 - 280 No Russian
visitors and
non-visitors
Reg Loyalty
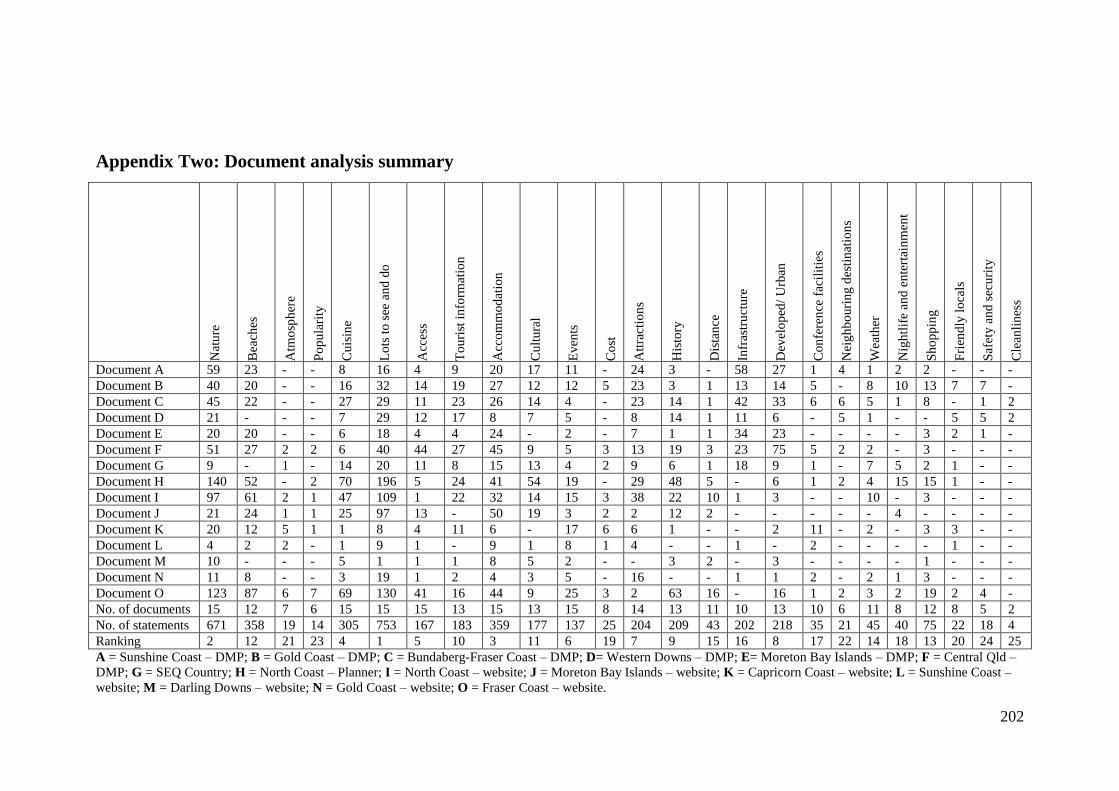
202
Appendix Two: Document analysis summary
Nat
ure
Bea
ches
Atm
osp
her
e
Po
pu
lari
ty
Cu
isin
e
Lo
ts t
o s
ee a
nd
do
Acc
ess
To
uri
st i
nfo
rmat
ion
Acc
om
mo
dat
ion
Cu
ltu
ral
Ev
ents
Co
st
Att
ract
ion
s
His
tory
Dis
tan
ce
Infr
astr
uct
ure
Dev
elo
ped
/ U
rban
Co
nfe
ren
ce f
acil
itie
s
Nei
gh
bo
uri
ng
des
tin
atio
ns
Wea
ther
Nig
htl
ife
and
en
tert
ain
men
t
Sh
op
pin
g
Fri
end
ly l
oca
ls
Saf
ety
an
d s
ecu
rity
Cle
anli
nes
s
Document A 59 23 - - 8 16 4 9 20 17 11 - 24 3 - 58 27 1 4 1 2 2 - - -
Document B 40 20 - - 16 32 14 19 27 12 12 5 23 3 1 13 14 5 - 8 10 13 7 7 -
Document C 45 22 - - 27 29 11 23 26 14 4 - 23 14 1 42 33 6 6 5 1 8 - 1 2
Document D 21 - - - 7 29 12 17 8 7 5 - 8 14 1 11 6 - 5 1 - - 5 5 2
Document E 20 20 - - 6 18 4 4 24 - 2 - 7 1 1 34 23 - - - - 3 2 1 -
Document F 51 27 2 2 6 40 44 27 45 9 5 3 13 19 3 23 75 5 2 2 - 3 - - -
Document G 9 - 1 - 14 20 11 8 15 13 4 2 9 6 1 18 9 1 - 7 5 2 1 - -
Document H 140 52 - 2 70 196 5 24 41 54 19 - 29 48 5 - 6 1 2 4 15 15 1 - -
Document I 97 61 2 1 47 109 1 22 32 14 15 3 38 22 10 1 3 - - 10 - 3 - - -
Document J 21 24 1 1 25 97 13 - 50 19 3 2 2 12 2 - - - - - 4 - - - -
Document K 20 12 5 1 1 8 4 11 6 - 17 6 6 1 - - 2 11 - 2 - 3 3 - -
Document L 4 2 2 - 1 9 1 - 9 1 8 1 4 - - 1 - 2 - - - - 1 - -
Document M 10 - - - 5 1 1 1 8 5 2 - - 3 2 - 3 - - - - 1 - - -
Document N 11 8 - - 3 19 1 2 4 3 5 - 16 - - 1 1 2 - 2 1 3 - - -
Document O 123 87 6 7 69 130 41 16 44 9 25 3 2 63 16 - 16 1 2 3 2 19 2 4 -
No. of documents 15 12 7 6 15 15 15 13 15 13 15 8 14 13 11 10 13 10 6 11 8 12 8 5 2
No. of statements 671 358 19 14 305 753 167 183 359 177 137 25 204 209 43 202 218 35 21 45 40 75 22 18 4
Ranking 2 12 21 23 4 1 5 10 3 11 6 19 7 9 15 16 8 17 22 14 18 13 20 24 25
A = Sunshine Coast – DMP; B = Gold Coast – DMP; C = Bundaberg-Fraser Coast – DMP; D= Western Downs – DMP; E= Moreton Bay Islands – DMP; F = Central Qld –
DMP; G = SEQ Country; H = North Coast – Planner; I = North Coast – website; J = Moreton Bay Islands – website; K = Capricorn Coast – website; L = Sunshine Coast –
website; M = Darling Downs – website; N = Gold Coast – website; O = Fraser Coast – website.
203
Appendix Three: Personal Construct Corollaries
Corollary Description
Construction
corollary
Kelly (1955) defined the construction corollary as the way that “a
person anticipates events by construing their replications” (Kelly,
1963, p. 103). That is, no two events are ever the same, but people
will construe similar events as being the same to better anticipate
future events. An example of how this corollary applies can be
outlined utilising the construct of dinner. That is dinner yesterday,
will not be the same as dinner today, but based on the concept of
replication, someone can construe similarities of an event such as
dinner to better predict the future. Therefore, based on dinner
yesterday, one can better predict the event of dinner today
(Bannister & Fransella, 1986).
Individual
corollary
“Persons differ from each other in their constructions of events”
(Kelly, 1963, p. 103). Therefore, when considering two people who
are in, what appears, to be the same situation, the individuality
corollary emphasises, that while people may appear to be in the
same situation, they are in fact not. People view and make sense of
the world through their own lens. Each lens is different, and while
there may be similarities, no two people will construe an event in
exactly the same way (Bannister & Fransella, 1986).
Organisation
corollary
“Each person characteristically evolves, for his convenience in
anticipating events, a construction system embracing ordinal
relationships between constructs” (Kelly, 1963, p. 103). The
organisation corollary emphasises the interrelated nature of
constructs, and the subsuming nature of some. Therefore, while the
construction corollary and the individuality corollary are reliant on
the ideas that people perceive events similarly, the organisation
corollary identifies that people will organise similar events in
opposing constructs to allow better analysis of the situation. For
example, someone may perceive a person to be kind, but can only
do so if they have something to compare it to (e.g. rude). It is also
evident that people organise their constructs similar to a hierarchy.
For example, when one considers dichotomous constructs, such as
good vs. bad, this could include other constructions, such as
intelligent vs. stupid, which would act as good representing
intelligent and bad representing stupid.
Dichotomy
corollary
“A person’s construction system is composed of a finite number of
dichotomous constructs” (Kelly, 1963, p. 103). That is, that each
elicited construct, has a bipolar contrast. When considering a triad,
for example, consisting of elements A, B and C, the construct
elicited refers to an aspect that refers to all three elements.
Therefore, the construct elicited does not mean that A and B are
similar in terms of one construct, and C is different in terms of
another construct. It means that A and B are similar based on a
particular construct, and they are contrasts to C in regard to that
construct (Kelly, 1955). This creates the opposite end of the bipolar
scale, or the contrasting component. For example, someone may
consider two elements to be similar because they are nice, and
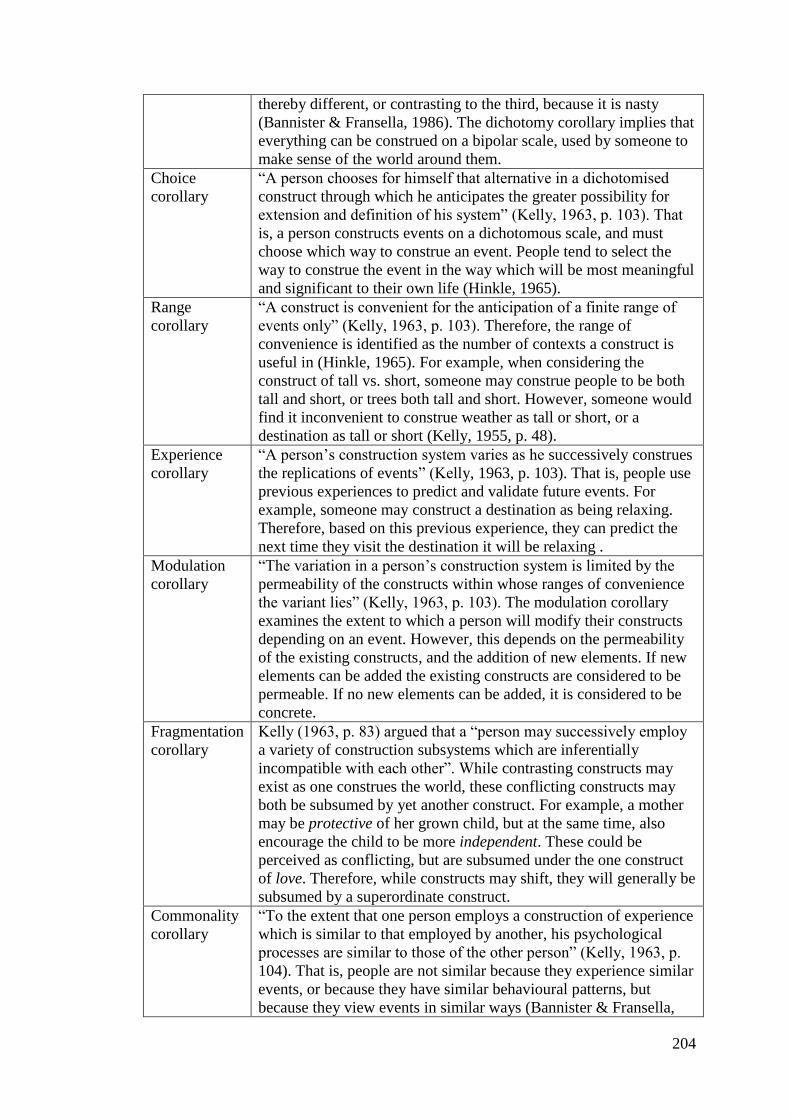
204
thereby different, or contrasting to the third, because it is nasty
(Bannister & Fransella, 1986). The dichotomy corollary implies that
everything can be construed on a bipolar scale, used by someone to
make sense of the world around them.
Choice
corollary
“A person chooses for himself that alternative in a dichotomised
construct through which he anticipates the greater possibility for
extension and definition of his system” (Kelly, 1963, p. 103). That
is, a person constructs events on a dichotomous scale, and must
choose which way to construe an event. People tend to select the
way to construe the event in the way which will be most meaningful
and significant to their own life (Hinkle, 1965).
Range
corollary
“A construct is convenient for the anticipation of a finite range of
events only” (Kelly, 1963, p. 103). Therefore, the range of
convenience is identified as the number of contexts a construct is
useful in (Hinkle, 1965). For example, when considering the
construct of tall vs. short, someone may construe people to be both
tall and short, or trees both tall and short. However, someone would
find it inconvenient to construe weather as tall or short, or a
destination as tall or short (Kelly, 1955, p. 48).
Experience
corollary
“A person’s construction system varies as he successively construes
the replications of events” (Kelly, 1963, p. 103). That is, people use
previous experiences to predict and validate future events. For
example, someone may construct a destination as being relaxing.
Therefore, based on this previous experience, they can predict the
next time they visit the destination it will be relaxing .
Modulation
corollary
“The variation in a person’s construction system is limited by the
permeability of the constructs within whose ranges of convenience
the variant lies” (Kelly, 1963, p. 103). The modulation corollary
examines the extent to which a person will modify their constructs
depending on an event. However, this depends on the permeability
of the existing constructs, and the addition of new elements. If new
elements can be added the existing constructs are considered to be
permeable. If no new elements can be added, it is considered to be
concrete.
Fragmentation
corollary
Kelly (1963, p. 83) argued that a “person may successively employ
a variety of construction subsystems which are inferentially
incompatible with each other”. While contrasting constructs may
exist as one construes the world, these conflicting constructs may
both be subsumed by yet another construct. For example, a mother
may be protective of her grown child, but at the same time, also
encourage the child to be more independent. These could be
perceived as conflicting, but are subsumed under the one construct
of love. Therefore, while constructs may shift, they will generally be
subsumed by a superordinate construct.
Commonality
corollary
“To the extent that one person employs a construction of experience
which is similar to that employed by another, his psychological
processes are similar to those of the other person” (Kelly, 1963, p.
104). That is, people are not similar because they experience similar
events, or because they have similar behavioural patterns, but
because they view events in similar ways (Bannister & Fransella,

205
1986, p. 17). This corollary is a complement to the individuality
corollary, in that people do not construe events in exactly the same
way, but in similar ways, leading to commonalities between those
that do.
Sociality
corollary
“To the extent that one person construes the construction processes
of another, he may play a role in a social process involving the other
person” (Kelly, 1963, p. 104). It is not to say that the construction
systems are exactly the same, but that someone can understand the
constructs of others.
206
Appendix Four: Participant information sheet – Personal interviews
PARTICIPANT INFORMATION for QUT RESEARCH PROJECT
Travel context: Development of a model to measure destination brand performance across different
travel situations.
Research Team Contacts
Samantha Murdy,
PhD student
0407 729 982
Dr. Steven Pike
Senior Lecturer
(07) 3138 2702
Associate Professor
Ian Lings
(07) 3138 4329
Description
This project is being undertaken as part of a PhD project for Samantha Murdy.
The purpose of this project is to attain a list of attributes consumers associate with destinations based
on their reason for travelling there.
The research team requests your assistance as we would like to understand how you compare
destinations near Brisbane against each other.
Participation
Your participation in this project is voluntary. If you do agree to participate, you can withdraw from
participation at any time during the project without comment or penalty. Your decision to participate
will in no way impact upon your current or future relationship with QUT (for example your grades) or
with any external bodies.
Your participation will involve an interview. Each interview takes approximately 30 minutes. The
interview will be conducted at a mutually agreeable location. Once the interview has been conducted,
your interview will be coded to ensure anonymity.
Expected benefits
It is expected that this project will enhance understanding of the different reasons for selecting a
destination based on why someone is travelling there.
Risks
There are no risks beyond normal day-to-day living associated with your participation in this project.
Confidentiality
All comments and responses are anonymous and will be treated confidentially. The names of
individual persons are not required in any of the responses. Data will be de-identified. All interviews
will be recorded.
Responses/ data will be utilised within this PhD project, and any subsequent journal articles or
conference papers which evolve from this project.
Again, participants have the right to withdraw at any point and their recording will be destroyed.
Consent to Participate
We would like to ask you to sign a written consent form (enclosed) to confirm your agreement to
participate.
Questions / further information about the project
Please contact the researcher team members named above to have any questions answered or if you
require further information about the project.
Concerns / complaints regarding the conduct of the project
QUT is committed to researcher integrity and the ethical conduct of research projects. However, if
you do have any concerns or complaints about the ethical conduct of the project you may contact the
QUT Research Ethics Officer on +61 7 3138 2091 or [email protected]. The Research Ethics
Officer is not connected with the research project and can facilitate a resolution to your concern in an
impartial manner.
207
Appendix Five: Consent form – Personal interviews
CONSENT FORM for QUT RESEARCH PROJECT
Travel context: Development of a model to measure destination brand performance
across different travel situations.
Statement of consent
By signing below, you are indicating that you:
have read and understood the information document regarding this project
have had any questions answered to your satisfaction
understand that if you have any additional questions you can contact the
research team
understand that you are free to withdraw at any time, without comment or
penalty
understand that you can contact the Research Ethics Officer on +61 7 3138
2091 or [email protected] if you have concerns about the ethical
conduct of the project
agree to participate in the project
understand that the project will include audio recording
Name
Signature
Date / /
208
Appendix Six: Demographic form for personal interviews
1. Have you either (can select more than option):
Been on a holiday near Brisbane in the last 12 months; or
Planning to go on a holiday near Brisbane in the next 12 months
2. Please indicate your gender:
Male Female
3. Please select your age bracket:
18-23 24-29
4. Postcode of your Brisbane residence:
___ ___ ___ ___
5. Please indicate your highest level of education attained:
Secondary education
TAFE
Bachelor degree
Postgraduate degree
Other ________________________________
6. Are you currently studying?
Yes No
If yes, what are you currently studying towards?
________________________________________
7. What is your current occupation?
______________________________________________
8. Please indicate your marital status.
Single (never married)
Single (divorced, separated, or widowed)
De facto
Married
Other _______________________________
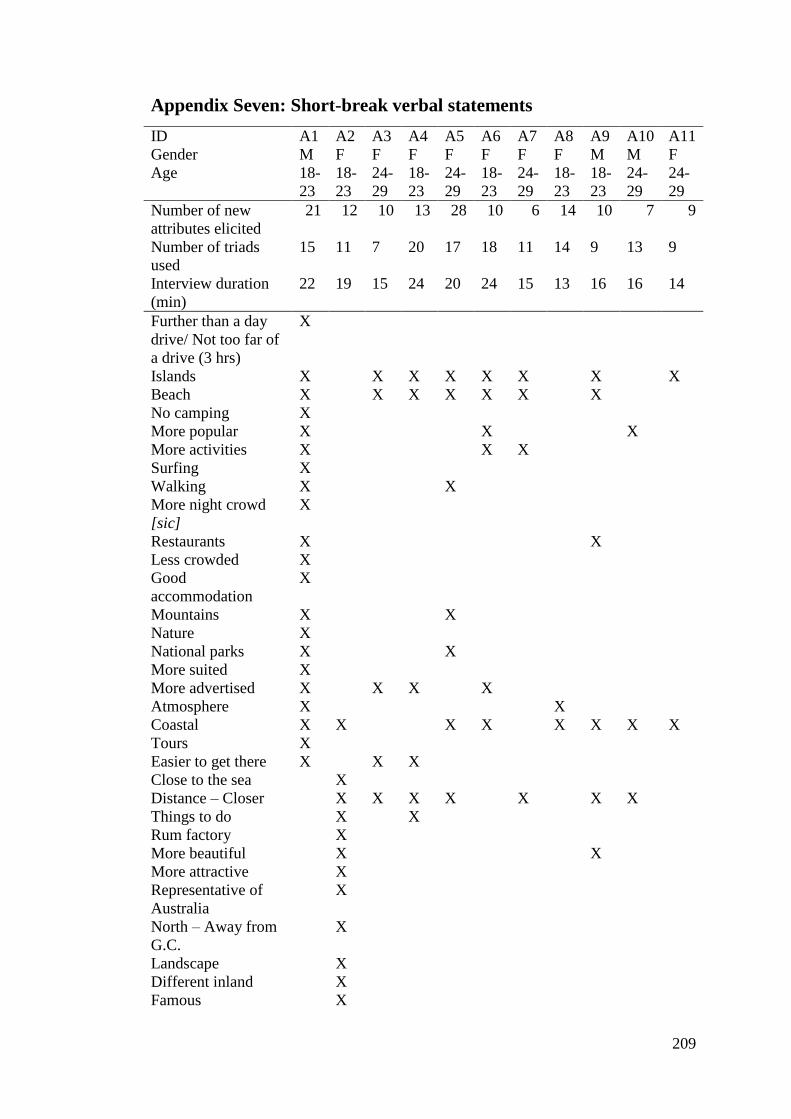
209
Appendix Seven: Short-break verbal statements
ID A1 A2 A3 A4 A5 A6 A7 A8 A9 A10 A11
Gender M F F F F F F F M M F
Age 18-
23
18-
23
24-
29
18-
23
24-
29
18-
23
24-
29
18-
23
18-
23
24-
29
24-
29
Number of new
attributes elicited
21 12 10 13 28 10 6 14 10 7 9
Number of triads
used
15 11 7 20 17 18 11 14 9 13 9
Interview duration
(min)
22 19 15 24 20 24 15 13 16 16 14
Further than a day
drive/ Not too far of
a drive (3 hrs)
X
Islands X X X X X X X X
Beach X X X X X X X
No camping X
More popular X X X
More activities X X X
Surfing X
Walking X X
More night crowd
[sic]
X
Restaurants X X
Less crowded X
Good
accommodation
X
Mountains X X
Nature X
National parks X X
More suited X
More advertised X X X X
Atmosphere X X
Coastal X X X X X X X X
Tours X
Easier to get there X X X
Close to the sea X
Distance – Closer X X X X X X X
Things to do X X
Rum factory X
More beautiful X X
More attractive X
Representative of
Australia
X
North – Away from
G.C.
X
Landscape X
Different inland X
Famous X
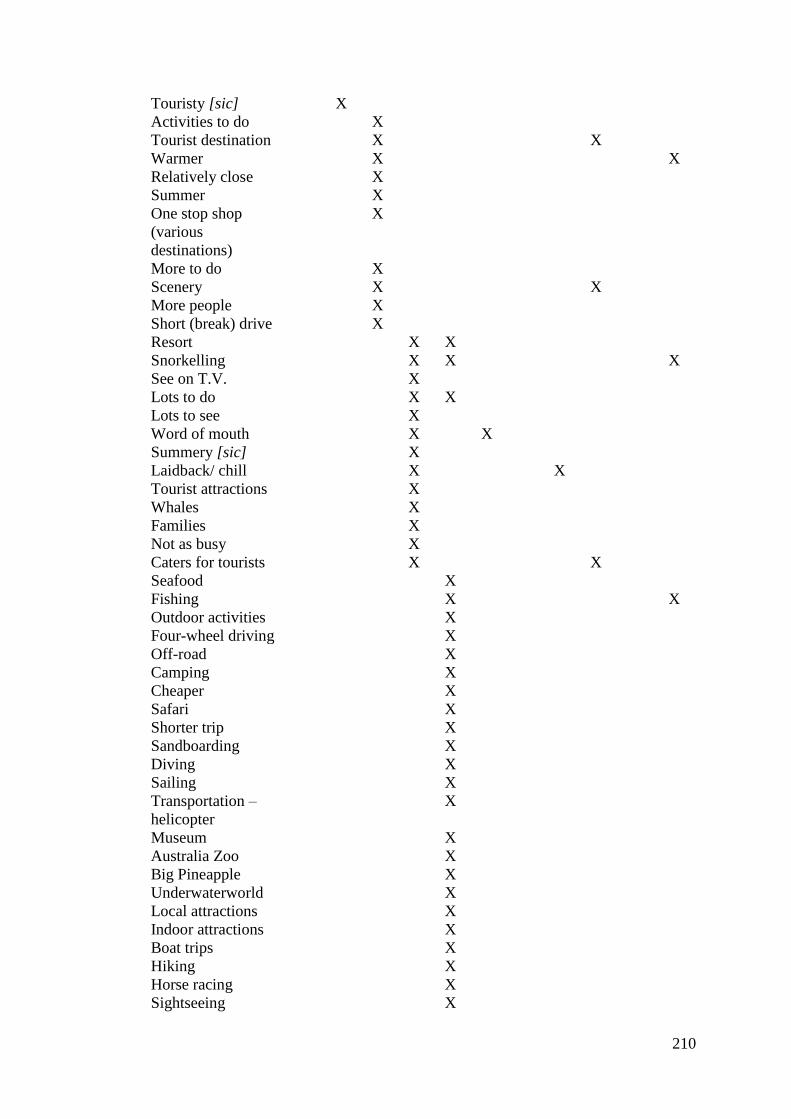
210
Touristy [sic] X
Activities to do X
Tourist destination X X
Warmer X X
Relatively close X
Summer X
One stop shop
(various
destinations)
X
More to do X
Scenery X X
More people X
Short (break) drive X
Resort X X
Snorkelling X X X
See on T.V. X
Lots to do X X
Lots to see X
Word of mouth X X
Summery [sic] X
Laidback/ chill X X
Tourist attractions X
Whales X
Families X
Not as busy X
Caters for tourists X X
Seafood X
Fishing X X
Outdoor activities X
Four-wheel driving X
Off-road X
Camping X
Cheaper X
Safari X
Shorter trip X
Sandboarding X
Diving X
Sailing X
Transportation –
helicopter
X
Museum X
Australia Zoo X
Big Pineapple X
Underwaterworld X
Local attractions X
Indoor attractions X
Boat trips X
Hiking X
Horse racing X
Sightseeing X
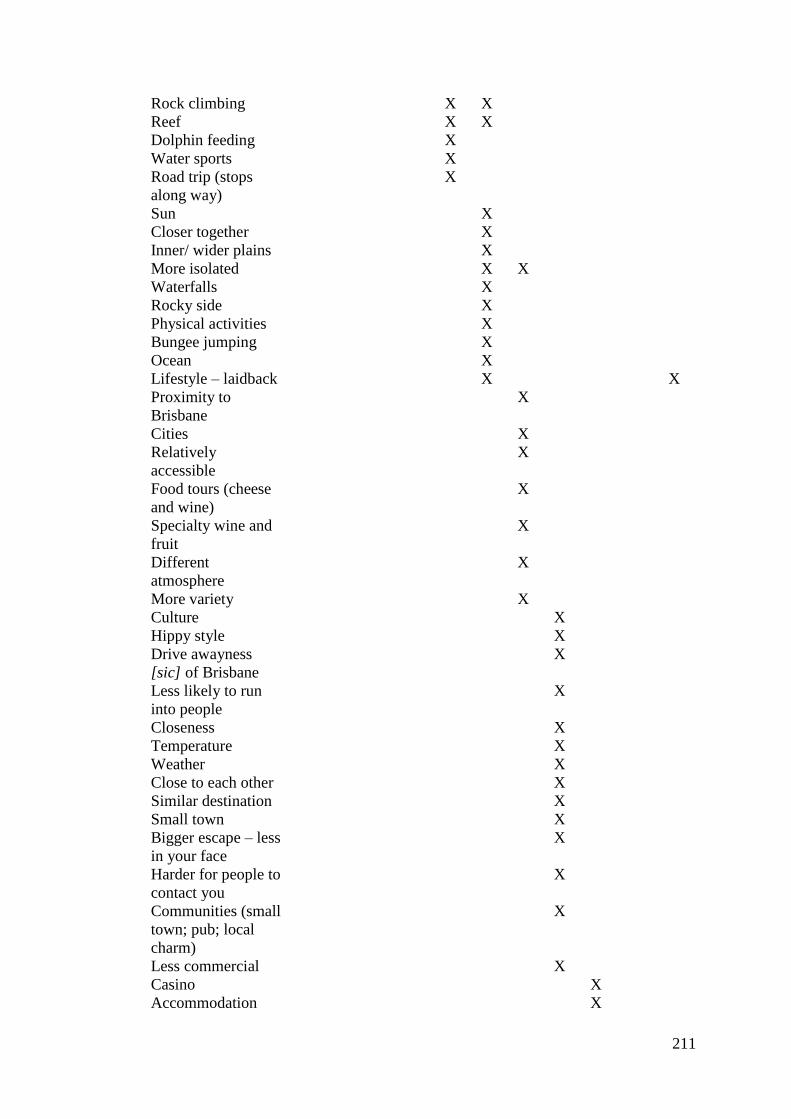
211
Rock climbing X X
Reef X X
Dolphin feeding X
Water sports X
Road trip (stops
along way)
X
Sun X
Closer together X
Inner/ wider plains X
More isolated X X
Waterfalls X
Rocky side X
Physical activities X
Bungee jumping X
Ocean X
Lifestyle – laidback X X
Proximity to
Brisbane
X
Cities X
Relatively
accessible
X
Food tours (cheese
and wine)
X
Specialty wine and
fruit
X
Different
atmosphere
X
More variety X
Culture X
Hippy style X
Drive awayness
[sic] of Brisbane
X
Less likely to run
into people
X
Closeness X
Temperature X
Weather X
Close to each other X
Similar destination X
Small town X
Bigger escape – less
in your face
X
Harder for people to
contact you
X
Communities (small
town; pub; local
charm)
X
Less commercial X
Casino X
Accommodation X
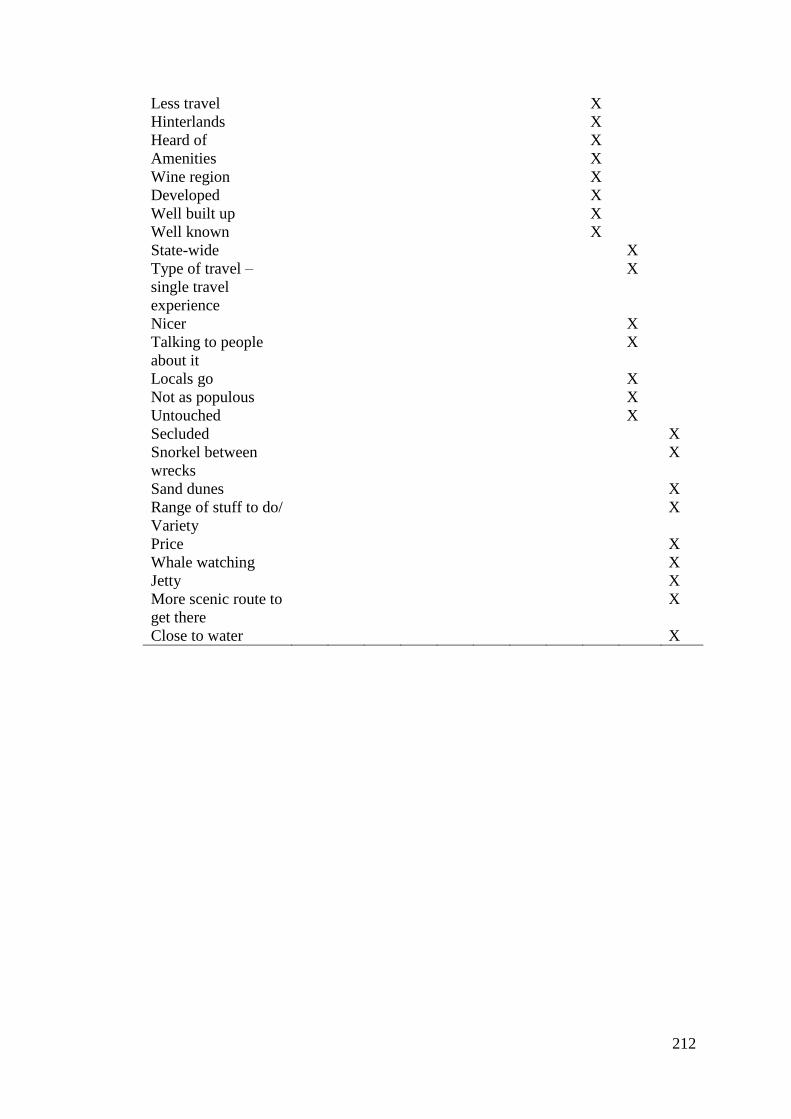
212
Less travel X
Hinterlands X
Heard of X
Amenities X
Wine region X
Developed X
Well built up X
Well known X
State-wide X
Type of travel –
single travel
experience
X
Nicer X
Talking to people
about it
X
Locals go X
Not as populous X
Untouched X
Secluded X
Snorkel between
wrecks
X
Sand dunes X
Range of stuff to do/
Variety
X
Price X
Whale watching X
Jetty X
More scenic route to
get there
X
Close to water X
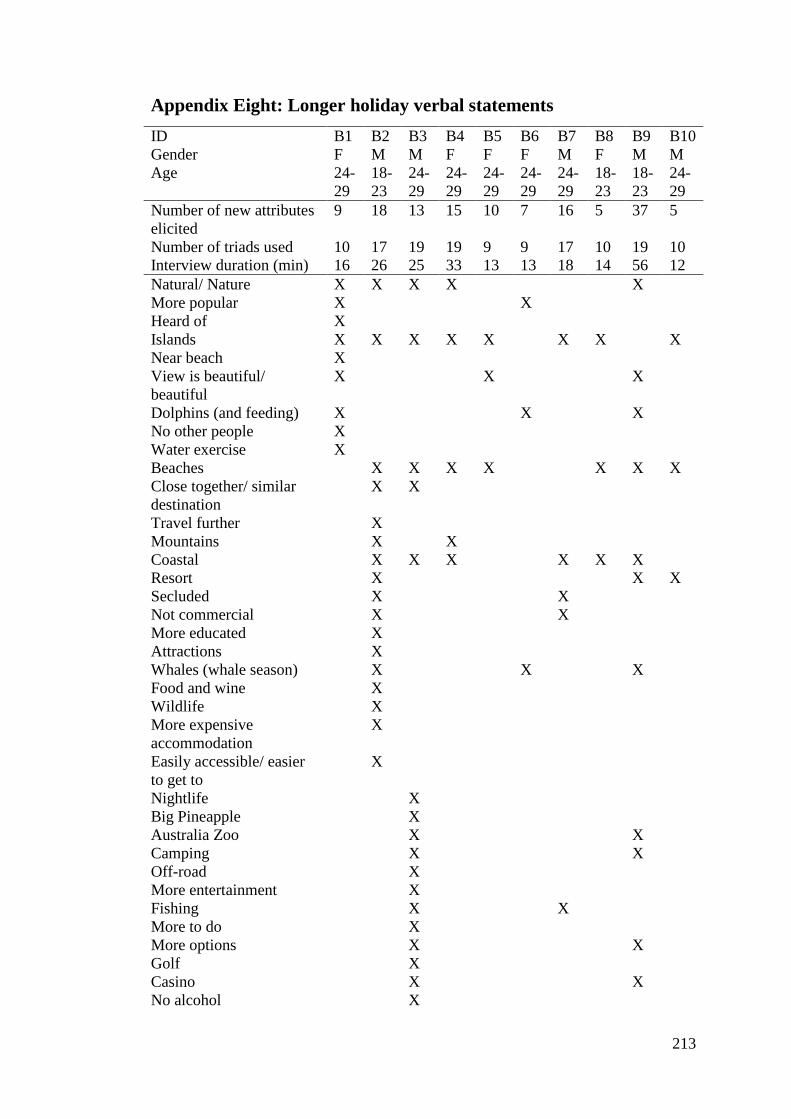
213
Appendix Eight: Longer holiday verbal statements
ID B1 B2 B3 B4 B5 B6 B7 B8 B9 B10
Gender F M M F F F M F M M
Age 24-
29
18-
23
24-
29
24-
29
24-
29
24-
29
24-
29
18-
23
18-
23
24-
29
Number of new attributes
elicited
9 18 13 15 10 7 16 5 37 5
Number of triads used 10 17 19 19 9 9 17 10 19 10
Interview duration (min) 16 26 25 33 13 13 18 14 56 12
Natural/ Nature X X X X X
More popular X X
Heard of X
Islands X X X X X X X X
Near beach X
View is beautiful/
beautiful
X X X
Dolphins (and feeding) X X X
No other people X
Water exercise X
Beaches X X X X X X X
Close together/ similar
destination
X X
Travel further X
Mountains X X
Coastal X X X X X X
Resort X X X
Secluded X X
Not commercial X X
More educated X
Attractions X
Whales (whale season) X X X
Food and wine X
Wildlife X
More expensive
accommodation
X
Easily accessible/ easier
to get to
X
Nightlife X
Big Pineapple X
Australia Zoo X X
Camping X X
Off-road X
More entertainment X
Fishing X X
More to do X
More options X X
Golf X
Casino X X
No alcohol X
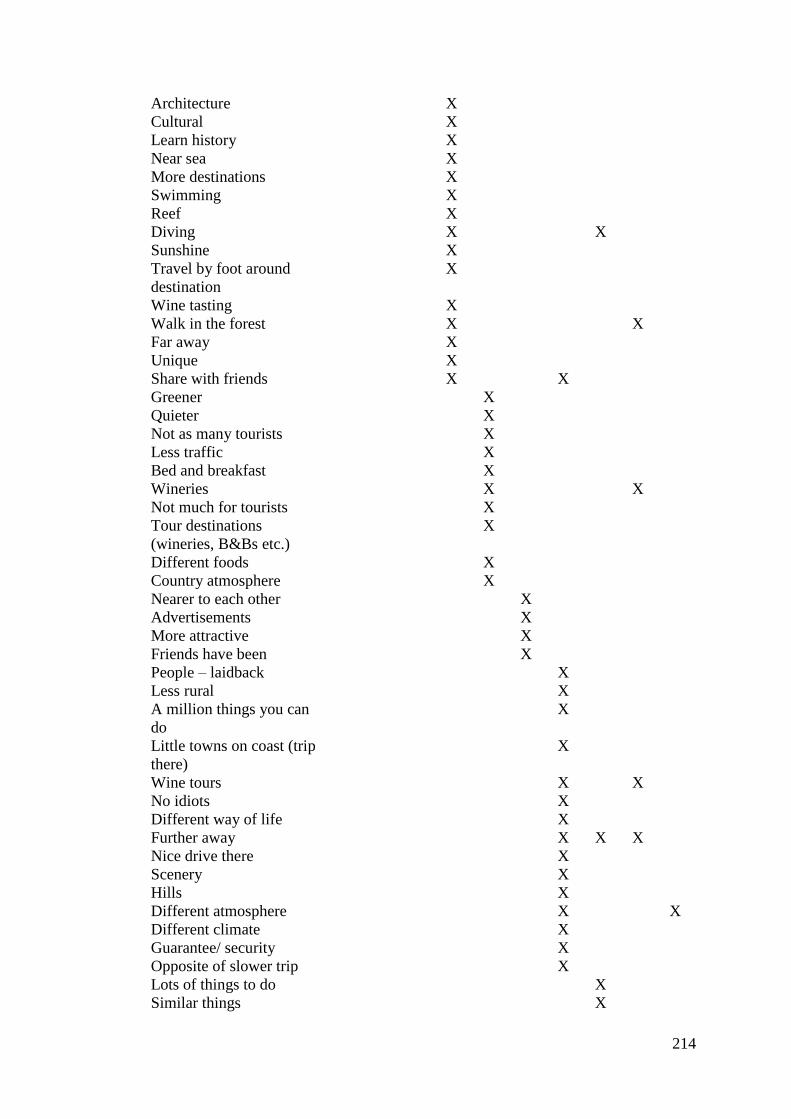
214
Architecture X
Cultural X
Learn history X
Near sea X
More destinations X
Swimming X
Reef X
Diving X X
Sunshine X
Travel by foot around
destination
X
Wine tasting X
Walk in the forest X X
Far away X
Unique X
Share with friends X X
Greener X
Quieter X
Not as many tourists X
Less traffic X
Bed and breakfast X
Wineries X X
Not much for tourists X
Tour destinations
(wineries, B&Bs etc.)
X
Different foods X
Country atmosphere X
Nearer to each other X
Advertisements X
More attractive X
Friends have been X
People – laidback X
Less rural X
A million things you can
do
X
Little towns on coast (trip
there)
X
Wine tours X X
No idiots X
Different way of life X
Further away X X X
Nice drive there X
Scenery X
Hills X
Different atmosphere X X
Different climate X
Guarantee/ security X
Opposite of slower trip X
Lots of things to do X
Similar things X
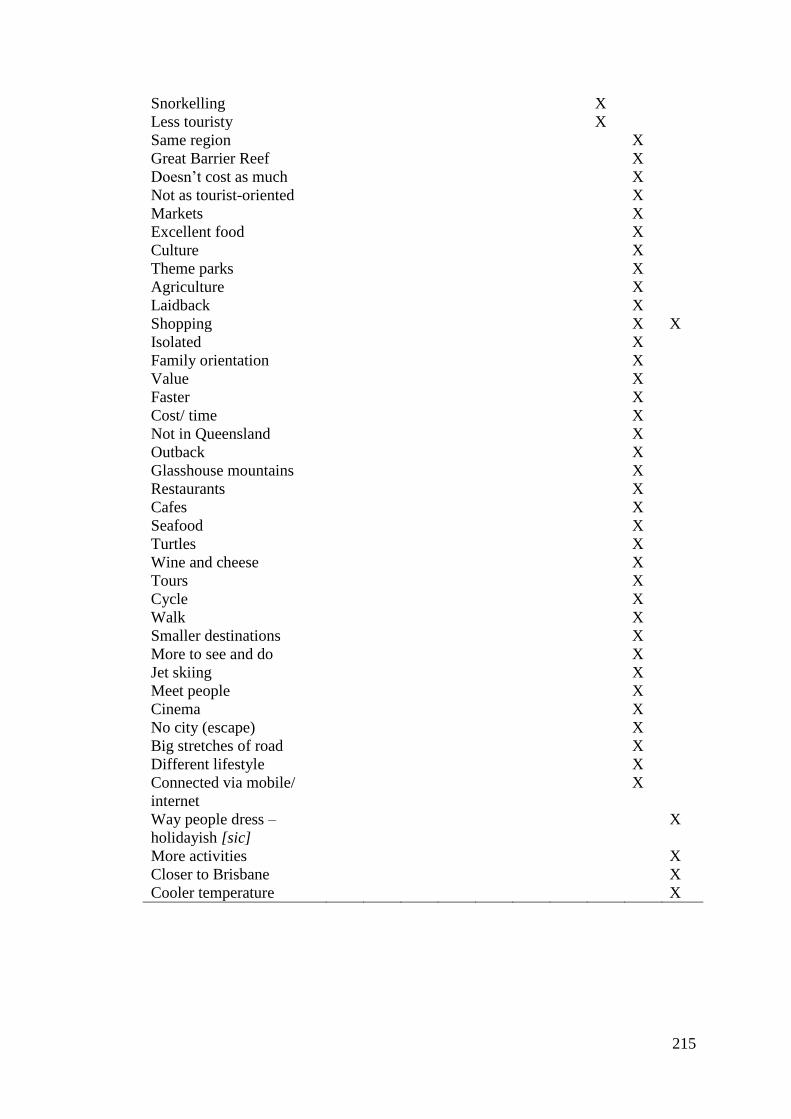
215
Snorkelling X
Less touristy X
Same region X
Great Barrier Reef X
Doesn’t cost as much X
Not as tourist-oriented X
Markets X
Excellent food X
Culture X
Theme parks X
Agriculture X
Laidback X
Shopping X X
Isolated X
Family orientation X
Value X
Faster X
Cost/ time X
Not in Queensland X
Outback X
Glasshouse mountains X
Restaurants X
Cafes X
Seafood X
Turtles X
Wine and cheese X
Tours X
Cycle X
Walk X
Smaller destinations X
More to see and do X
Jet skiing X
Meet people X
Cinema X
No city (escape) X
Big stretches of road X
Different lifestyle X
Connected via mobile/
internet
X
Way people dress –
holidayish [sic]
X
More activities X
Closer to Brisbane X
Cooler temperature X

216
Appendix Nine: Ethics approval – Personal interviews
Dear Ms Sam Murdy
Project Title:
Travel context: development of a model to measure destination brand
performance across different travel situations
Approval Number: 1000000068
Clearance Until: 1/02/2013
Ethics Category: Human
As you are aware, your low risk application has been reviewed by your Faculty Research Ethics
Advisor and confirmed as meeting the requirements of the National Statement on Ethical Conduct in
Human Research.
Before data collection commences please ensure you attend to any changes requested by your Faculty
Research Ethics Advisor.
Whilst the data collection of your project has received ethical clearance, the decision to commence
and authority to commence may be dependent on factors beyond the remit of the ethics committee (eg
ethics clearance / permission from another institute / organisation) and you should not commence the
proposed work until you have satisfied these requirements.
If you require a formal approval certificate, please respond via reply email and one will be issued.
Decisions related to low risk ethical review are subject to ratification at the next available Committee
meeting. You will only be contacted again in relation to this matter if the Committee raises any
additional questions or concerns.
This project has been awarded ethical clearance until 1/02/2013 and a progress report must be
submitted for an active ethical clearance at least once every twelve months. Researchers who fail to
submit an appropriate progress report when asked to do so may have their ethical clearance revoked
and/or the ethical clearances of other projects suspended. When your project has been completed
please advise us by email at your earliest convenience.
For variations, please complete and submit an online variation form:
http://www.research.qut.edu.au/ethics/forms/hum/var/variation.jsp
Please do not hesitate to contact the unit if you have any queries.
Regards
Research Ethics Unit | Office of Research
Level 4 | 88 Musk Avenue | Kelvin Grove
p: +61 7 3138 5123
w: http://www.research.qut.edu.au/ethics/

217
Appendix Ten: Questionnaire – Short-break holidays
PARTICIPANT INFORMATION FOR
QUT RESEARCH PROJECT
Travel Context: Development of a model to measure destination brand
performance across travel situations
QUT Ethics Approval Number 1100000492
RESEARCH TEAM CONTACTS
Principal
Researcher: Samantha Murdy, PhD student, QUT
Associate
Researcher(s):
Dr. Steven Pike, QUT
Associate Professor Ian Lings, QUT
DESCRIPTION
This project is being undertaken as part of a PhD project for Samantha Murdy. The
purpose of this project is to better understand destination brand performance, and the
differences that exist when comparing between reasons for travel.
The research team requests your assistance as you are a Brisbane resident aged 18 to
29.
PARTICIPATION
Your participation in this project is voluntary. If you do agree to participate, you can
withdraw from participation before submission of the questionnaire without comment or
penalty. Your decision to participate will in no way impact upon your current or future
relationship with QUT (for example your grades).
Your participation will involve a questionnaire at that will take approximately 6
minutes of your time. Questions will include items such as: “Please name the
destination that first comes to mind when considering your next holiday” or
“Likelihood to visit this destination in the next 12 months”.
EXPECTED BENEFITS
It is expected that this project will not directly benefit you. However, it may benefit
organisations that market destinations. It may allow them to better understand what is
important when marketing to consumers with different reasons for travel.
RISKS
There are no risks beyond normal day-to-day living associated with your participation in
this project.
CONFIDENTIALITY
All comments and responses are anonymous and will be treated confidentially. The
names of individual persons are not required in any of the responses.
218
CONSENT TO PARTICIPATE
Submitting the completed online questionnaire is accepted as an indication of your
consent to participate in this project.
QUESTIONS / FURTHER INFORMATION ABOUT THE PROJECT
If have any questions or require any further information about the project please contact
one of the research team members below.
Samantha Murdy – PhD
student
School of Advertising
Marketing and Public Relations
QUT
0407 729 982
Dr. Steven Pike
School of Advertising
Marketing and Public
Relations
QUT
3138 2702
Associate Professor Ian
Lings
School of Advertising
Marketing and Public
Relations
QUT
3138 4329
CONCERNS / COMPLAINTS REGARDING THE CONDUCT OF THE
PROJECT
QUT is committed to research integrity and the ethical conduct of research projects.
However, if you do have any concerns or complaints about the ethical conduct of the
project (approval number: 1100000492) you may contact the QUT Research Ethics Unit
on 07 3138 5123 or email [email protected]. The QUT Research Ethics Unit is
not connected with the research project and can facilitate a resolution to your concern in
an impartial manner.
Thank you for helping with this research project. Please keep this sheet for your
information.
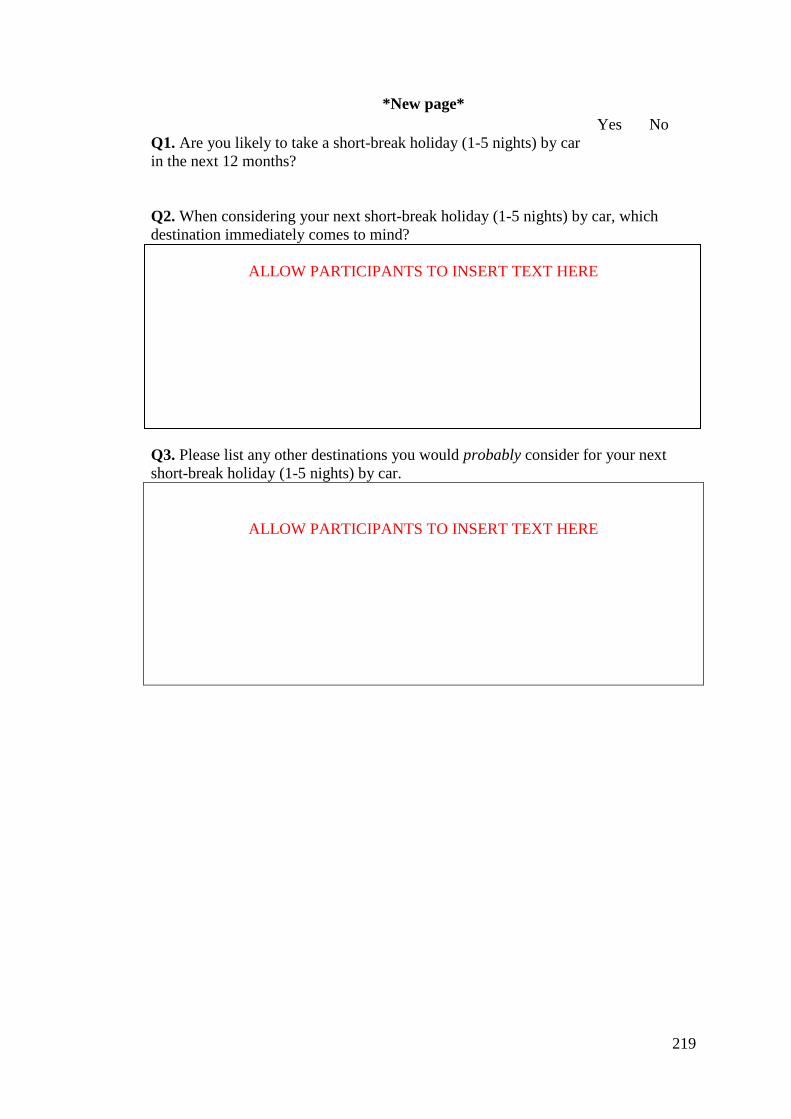
219
*New page*
Q1. Are you likely to take a short-break holiday (1-5 nights) by car
in the next 12 months?
Yes No
Q2. When considering your next short-break holiday (1-5 nights) by car, which
destination immediately comes to mind?
ALLOW PARTICIPANTS TO INSERT TEXT HERE
Q3. Please list any other destinations you would probably consider for your next
short-break holiday (1-5 nights) by car.
ALLOW PARTICIPANTS TO INSERT TEXT HERE

220
*New page*
Note: The following questions do not relate to the answers you provided for
questions 1, 2 and 3.
Q4. How important are the following when
considering a short-break holiday (1-5 nights) by
car?
Not at all
important
Very
important
Nature 1 2 3 4 5 6 7
Accommodation 1 2 3 4 5 6 7
Shopping 1 2 3 4 5 6 7
Nightlife and entertainment 1 2 3 4 5 6 7
Food and wine 1 2 3 4 5 6 7
Friendly local people 1 2 3 4 5 6 7
Weather 1 2 3 4 5 6 7
History of the destination 1 2 3 4 5 6 7
Distance to the destination 1 2 3 4 5 6 7
Tourist information 1 2 3 4 5 6 7
Infrastructure 1 2 3 4 5 6 7
Culture 1 2 3 4 5 6 7
More to see and do 1 2 3 4 5 6 7
Familiarity with the destination 1 2 3 4 5 6 7
Personal safety 1 2 3 4 5 6 7
Facilities 1 2 3 4 5 6 7
Cleanliness 1 2 3 4 5 6 7
Tourist attractions 1 2 3 4 5 6 7
Cost 1 2 3 4 5 6 7
Beaches 1 2 3 4 5 6 7
A destination that is well built up 1 2 3 4 5 6 7
Popularity of the destination 1 2 3 4 5 6 7
Atmosphere 1 2 3 4 5 6 7
Other destinations close by 1 2 3 4 5 6 7
A destination that is easy to get to 1 2 3 4 5 6 7
Closer 1 2 3 4 5 6 7
Events 1 2 3 4 5 6 7
A destination that caters for tourists 1 2 3 4 5 6 7
A secluded destination 1 2 3 4 5 6 7
Islands 1 2 3 4 5 6 7
Near the coast 1 2 3 4 5 6 7
A destination that is different 1 2 3 4 5 6 7
A destination that is not commercial 1 2 3 4 5 6 7
Less familiar destination 1 2 3 4 5 6 7
Further away 1 2 3 4 5 6 7
More advertised

221
*New page*
Q5. With respect to a short-
break holiday (1-5 nights) on the
Sunshine Coast by car, how
satisfactory or unsatisfactory are
the following:
Unsatisfactory Satisfactory Don’t
know
Nature 1 2 3 4 5 6 7 DK
Accommodation 1 2 3 4 5 6 7 DK
Shopping 1 2 3 4 5 6 7 DK
Nightlife and entertainment 1 2 3 4 5 6 7 DK
Food and wine 1 2 3 4 5 6 7 DK
Friendly local people 1 2 3 4 5 6 7 DK
Weather 1 2 3 4 5 6 7 DK
History of the destination 1 2 3 4 5 6 7 DK
Distance to the destination 1 2 3 4 5 6 7 DK
Tourist information 1 2 3 4 5 6 7 DK
Infrastructure 1 2 3 4 5 6 7 DK
Culture 1 2 3 4 5 6 7 DK
More to see and do 1 2 3 4 5 6 7 DK
Familiarity with the destination 1 2 3 4 5 6 7 DK
Personal safety 1 2 3 4 5 6 7 DK
Facilities 1 2 3 4 5 6 7 DK
Cleanliness 1 2 3 4 5 6 7 DK
Tourist attractions 1 2 3 4 5 6 7 DK
Cost 1 2 3 4 5 6 7 DK
Beaches 1 2 3 4 5 6 7 DK
A destination that is well built up 1 2 3 4 5 6 7 DK
Popularity of the destination 1 2 3 4 5 6 7 DK
Atmosphere 1 2 3 4 5 6 7 DK
Other destinations close by 1 2 3 4 5 6 7 DK
A destination that is easy to get to 1 2 3 4 5 6 7 DK
Closer 1 2 3 4 5 6 7 DK
Events 1 2 3 4 5 6 7 DK
A destination that caters for
tourists
1 2 3 4 5 6 7 DK
A secluded destination 1 2 3 4 5 6 7 DK
Islands 1 2 3 4 5 6 7 DK
Near the coast 1 2 3 4 5 6 7 DK
A destination that is different 1 2 3 4 5 6 7 DK
A destination that is not
commercial
1 2 3 4 5 6 7 DK
Less familiar destination 1 2 3 4 5 6 7 DK
Further away 1 2 3 4 5 6 7 DK
More advertised 1 2 3 4 5 6 7 DK
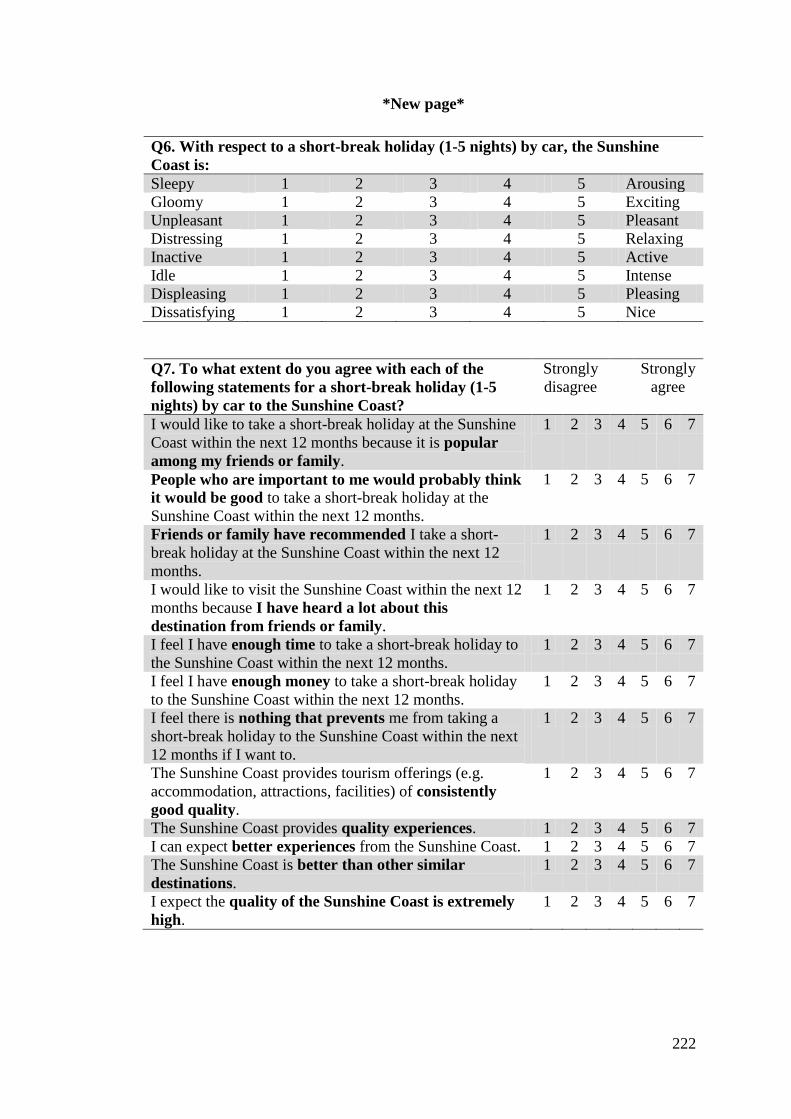
222
*New page*
Q6. With respect to a short-break holiday (1-5 nights) by car, the Sunshine
Coast is:
Sleepy 1 2 3 4 5 Arousing
Gloomy 1 2 3 4 5 Exciting
Unpleasant 1 2 3 4 5 Pleasant
Distressing 1 2 3 4 5 Relaxing
Inactive 1 2 3 4 5 Active
Idle 1 2 3 4 5 Intense
Displeasing 1 2 3 4 5 Pleasing
Dissatisfying 1 2 3 4 5 Nice
Q7. To what extent do you agree with each of the
following statements for a short-break holiday (1-5
nights) by car to the Sunshine Coast?
Strongly
disagree
Strongly
agree
I would like to take a short-break holiday at the Sunshine
Coast within the next 12 months because it is popular
among my friends or family.
1 2 3 4 5 6 7
People who are important to me would probably think
it would be good to take a short-break holiday at the
Sunshine Coast within the next 12 months.
1 2 3 4 5 6 7
Friends or family have recommended I take a short-
break holiday at the Sunshine Coast within the next 12
months.
1 2 3 4 5 6 7
I would like to visit the Sunshine Coast within the next 12
months because I have heard a lot about this
destination from friends or family.
1 2 3 4 5 6 7
I feel I have enough time to take a short-break holiday to
the Sunshine Coast within the next 12 months.
1 2 3 4 5 6 7
I feel I have enough money to take a short-break holiday
to the Sunshine Coast within the next 12 months.
1 2 3 4 5 6 7
I feel there is nothing that prevents me from taking a
short-break holiday to the Sunshine Coast within the next
12 months if I want to.
1 2 3 4 5 6 7
The Sunshine Coast provides tourism offerings (e.g.
accommodation, attractions, facilities) of consistently
good quality.
1 2 3 4 5 6 7
The Sunshine Coast provides quality experiences. 1 2 3 4 5 6 7
I can expect better experiences from the Sunshine Coast. 1 2 3 4 5 6 7
The Sunshine Coast is better than other similar
destinations.
1 2 3 4 5 6 7
I expect the quality of the Sunshine Coast is extremely
high.
1 2 3 4 5 6 7

223
*New page*
Q8. Please evaluate the likelihood of the following
statements when considering travelling to the
Sunshine Coast for a short-break holiday (1-5 nights)
by car.
Unlikely Likely
I am likely to visit the Sunshine Coast in the next twelve
months.
1 2 3 4 5 6 7
I intend to visit the Sunshine Coast next twelve months. 1 2 3 4 5 6 7
I want to visit the Sunshine Coast. 1 2 3 4 5 6 7
I will recommend the Sunshine Coast to family or friends. 1 2 3 4 5 6 7
I will say positive things about the Sunshine Coast to
other people
1 2 3 4 5 6 7
I will recommend the Sunshine Coast to those who want
advice.
1 2 3 4 5 6 7
Q9. Have you previously visited the Sunshine
Coast?
Yes
No
Q10. If yes, have you visited the Sunshine Coast in
the last 12 months for a longer holiday (more than a
week) by car?
Yes
No
Q11. How many times have you been to the
Sunshine Coast for a longer holiday of more than a
week?
Never
1 time
2-3 times
4-5 times
6-10 times
More than 10 times

224
*New page*
Q12. How old are you? [select from drop box] years
Q13. Are you a Brisbane resident?
Yes (Please insert your postcode ____________)
No
Q14. If yes, how long have you lived in Brisbane for?
Q15. Please indicate your gender.
Less than a year
1 year
2-3 years
4-5 years
6-10 years
More than 10
years
Male
Female
Q16. Please indicate your highest level of
education completed.
Less than year 10
Year 10
Year 12
TAFE or other post high school
qualification
Bachelor’s degree
Postgraduate degree
Other __________________
Q17. Please indicate your marital status. Single (never married)
Single (divorced, separated or widowed)
De facto
Married
Other_____________________________
Q18. Do you have any dependent children?
Q19. Please indicate your income.
Yes No
Under $25,000
$25,001-$50,000
$50,001-$75,000
$75,001-$100,000
Over $100,000
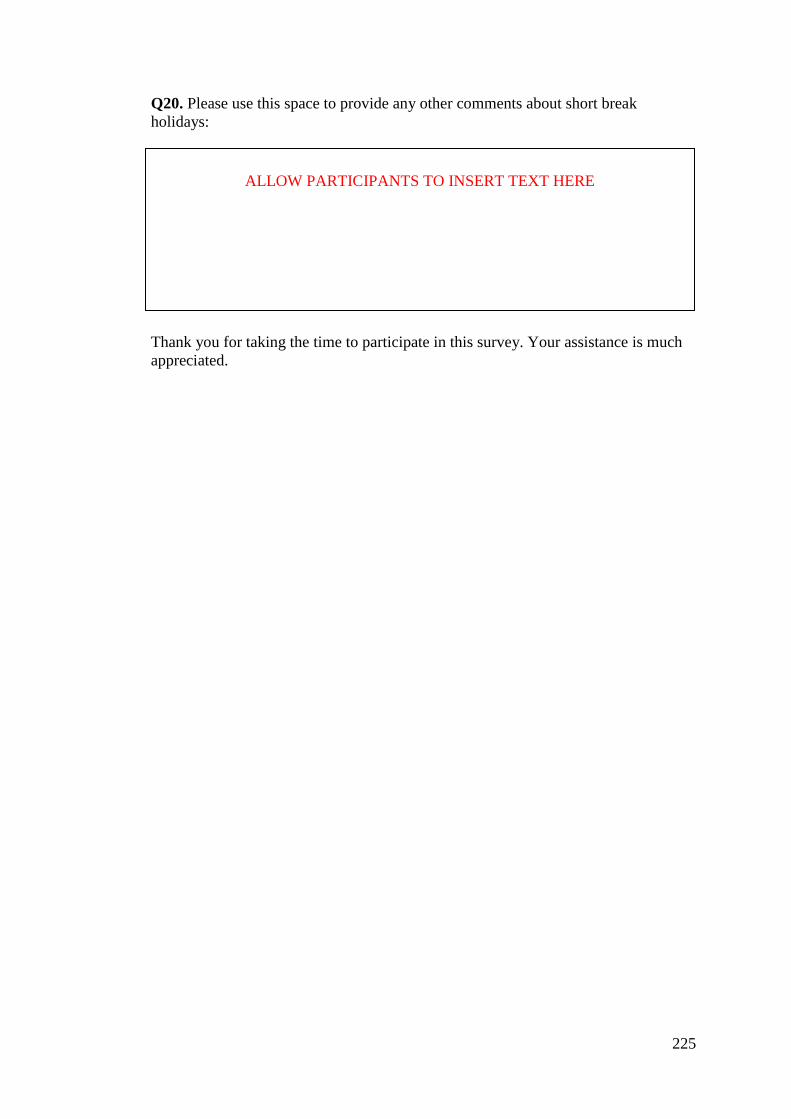
225
Q20. Please use this space to provide any other comments about short break
holidays:
Thank you for taking the time to participate in this survey. Your assistance is much
appreciated.
ALLOW PARTICIPANTS TO INSERT TEXT HERE
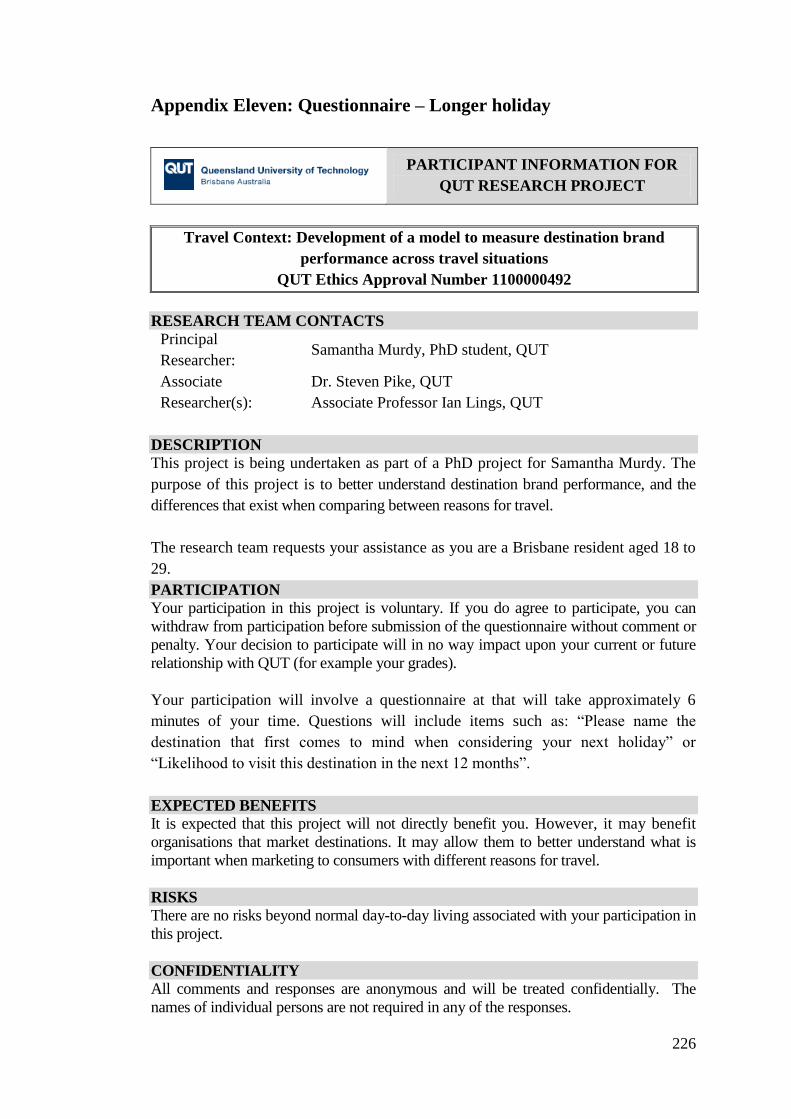
226
Appendix Eleven: Questionnaire – Longer holiday
PARTICIPANT INFORMATION FOR
QUT RESEARCH PROJECT
Travel Context: Development of a model to measure destination brand
performance across travel situations
QUT Ethics Approval Number 1100000492
RESEARCH TEAM CONTACTS
Principal
Researcher: Samantha Murdy, PhD student, QUT
Associate
Researcher(s):
Dr. Steven Pike, QUT
Associate Professor Ian Lings, QUT
DESCRIPTION
This project is being undertaken as part of a PhD project for Samantha Murdy. The
purpose of this project is to better understand destination brand performance, and the
differences that exist when comparing between reasons for travel.
The research team requests your assistance as you are a Brisbane resident aged 18 to
29.
PARTICIPATION
Your participation in this project is voluntary. If you do agree to participate, you can
withdraw from participation before submission of the questionnaire without comment or
penalty. Your decision to participate will in no way impact upon your current or future
relationship with QUT (for example your grades).
Your participation will involve a questionnaire at that will take approximately 6
minutes of your time. Questions will include items such as: “Please name the
destination that first comes to mind when considering your next holiday” or
“Likelihood to visit this destination in the next 12 months”.
EXPECTED BENEFITS
It is expected that this project will not directly benefit you. However, it may benefit
organisations that market destinations. It may allow them to better understand what is
important when marketing to consumers with different reasons for travel.
RISKS
There are no risks beyond normal day-to-day living associated with your participation in
this project.
CONFIDENTIALITY
All comments and responses are anonymous and will be treated confidentially. The
names of individual persons are not required in any of the responses.
227
CONSENT TO PARTICIPATE
Submitting the completed online questionnaire is accepted as an indication of your
consent to participate in this project.
QUESTIONS / FURTHER INFORMATION ABOUT THE PROJECT
If have any questions or require any further information about the project please contact
one of the research team members below.
Samantha Murdy – PhD
student
School of Advertising
Marketing and Public Relations
QUT
0407 729 982
Dr. Steven Pike
School of Advertising
Marketing and Public
Relations
QUT
3138 2702
Associate Professor Ian
Lings
School of Advertising
Marketing and Public
Relations
QUT
3138 4329
CONCERNS / COMPLAINTS REGARDING THE CONDUCT OF THE
PROJECT
QUT is committed to research integrity and the ethical conduct of research projects.
However, if you do have any concerns or complaints about the ethical conduct of the
project (approval number: 1100000492) you may contact the QUT Research Ethics Unit
on 07 3138 5123 or email [email protected]. The QUT Research Ethics Unit is
not connected with the research project and can facilitate a resolution to your concern in
an impartial manner.
Thank you for helping with this research project. Please keep this sheet for your
information.
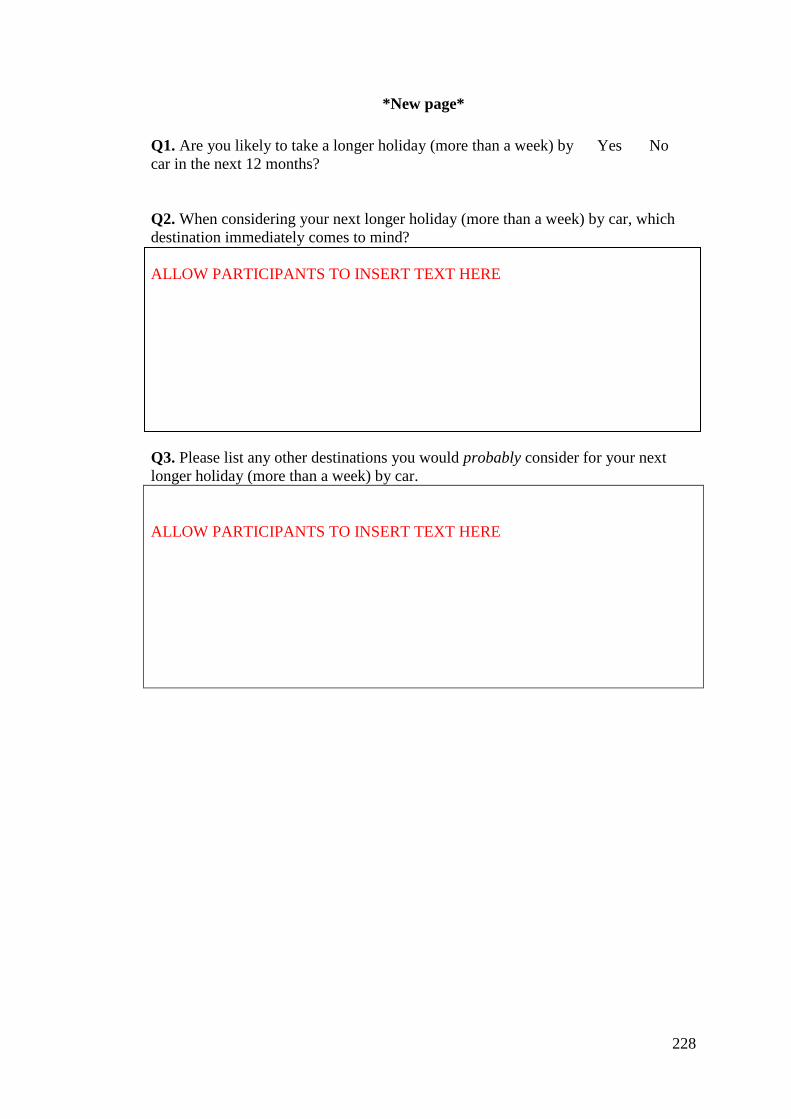
228
*New page*
Q1. Are you likely to take a longer holiday (more than a week) by
car in the next 12 months?
Yes No
Q2. When considering your next longer holiday (more than a week) by car, which
destination immediately comes to mind?
ALLOW PARTICIPANTS TO INSERT TEXT HERE
Q3. Please list any other destinations you would probably consider for your next
longer holiday (more than a week) by car.
ALLOW PARTICIPANTS TO INSERT TEXT HERE
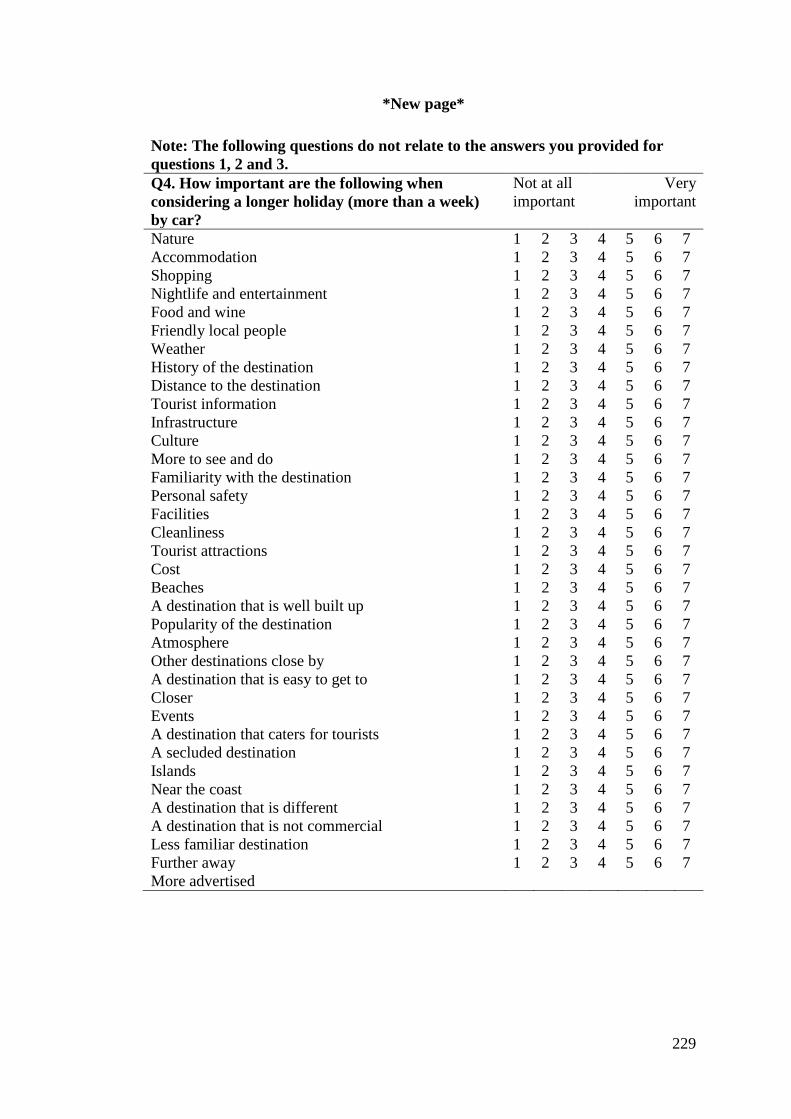
229
*New page*
Note: The following questions do not relate to the answers you provided for
questions 1, 2 and 3.
Q4. How important are the following when
considering a longer holiday (more than a week)
by car?
Not at all
important
Very
important
Nature 1 2 3 4 5 6 7
Accommodation 1 2 3 4 5 6 7
Shopping 1 2 3 4 5 6 7
Nightlife and entertainment 1 2 3 4 5 6 7
Food and wine 1 2 3 4 5 6 7
Friendly local people 1 2 3 4 5 6 7
Weather 1 2 3 4 5 6 7
History of the destination 1 2 3 4 5 6 7
Distance to the destination 1 2 3 4 5 6 7
Tourist information 1 2 3 4 5 6 7
Infrastructure 1 2 3 4 5 6 7
Culture 1 2 3 4 5 6 7
More to see and do 1 2 3 4 5 6 7
Familiarity with the destination 1 2 3 4 5 6 7
Personal safety 1 2 3 4 5 6 7
Facilities 1 2 3 4 5 6 7
Cleanliness 1 2 3 4 5 6 7
Tourist attractions 1 2 3 4 5 6 7
Cost 1 2 3 4 5 6 7
Beaches 1 2 3 4 5 6 7
A destination that is well built up 1 2 3 4 5 6 7
Popularity of the destination 1 2 3 4 5 6 7
Atmosphere 1 2 3 4 5 6 7
Other destinations close by 1 2 3 4 5 6 7
A destination that is easy to get to 1 2 3 4 5 6 7
Closer 1 2 3 4 5 6 7
Events 1 2 3 4 5 6 7
A destination that caters for tourists 1 2 3 4 5 6 7
A secluded destination 1 2 3 4 5 6 7
Islands 1 2 3 4 5 6 7
Near the coast 1 2 3 4 5 6 7
A destination that is different 1 2 3 4 5 6 7
A destination that is not commercial 1 2 3 4 5 6 7
Less familiar destination 1 2 3 4 5 6 7
Further away 1 2 3 4 5 6 7
More advertised
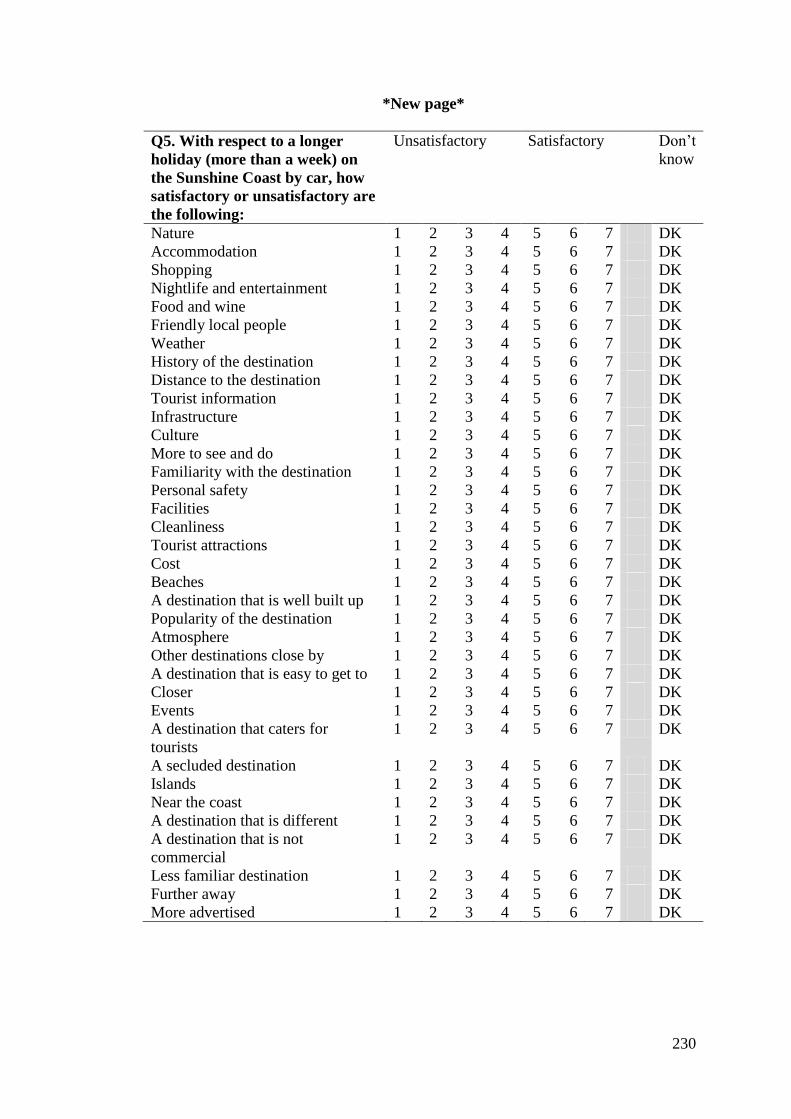
230
*New page*
Q5. With respect to a longer
holiday (more than a week) on
the Sunshine Coast by car, how
satisfactory or unsatisfactory are
the following:
Unsatisfactory Satisfactory Don’t
know
Nature 1 2 3 4 5 6 7 DK
Accommodation 1 2 3 4 5 6 7 DK
Shopping 1 2 3 4 5 6 7 DK
Nightlife and entertainment 1 2 3 4 5 6 7 DK
Food and wine 1 2 3 4 5 6 7 DK
Friendly local people 1 2 3 4 5 6 7 DK
Weather 1 2 3 4 5 6 7 DK
History of the destination 1 2 3 4 5 6 7 DK
Distance to the destination 1 2 3 4 5 6 7 DK
Tourist information 1 2 3 4 5 6 7 DK
Infrastructure 1 2 3 4 5 6 7 DK
Culture 1 2 3 4 5 6 7 DK
More to see and do 1 2 3 4 5 6 7 DK
Familiarity with the destination 1 2 3 4 5 6 7 DK
Personal safety 1 2 3 4 5 6 7 DK
Facilities 1 2 3 4 5 6 7 DK
Cleanliness 1 2 3 4 5 6 7 DK
Tourist attractions 1 2 3 4 5 6 7 DK
Cost 1 2 3 4 5 6 7 DK
Beaches 1 2 3 4 5 6 7 DK
A destination that is well built up 1 2 3 4 5 6 7 DK
Popularity of the destination 1 2 3 4 5 6 7 DK
Atmosphere 1 2 3 4 5 6 7 DK
Other destinations close by 1 2 3 4 5 6 7 DK
A destination that is easy to get to 1 2 3 4 5 6 7 DK
Closer 1 2 3 4 5 6 7 DK
Events 1 2 3 4 5 6 7 DK
A destination that caters for
tourists
1 2 3 4 5 6 7 DK
A secluded destination 1 2 3 4 5 6 7 DK
Islands 1 2 3 4 5 6 7 DK
Near the coast 1 2 3 4 5 6 7 DK
A destination that is different 1 2 3 4 5 6 7 DK
A destination that is not
commercial
1 2 3 4 5 6 7 DK
Less familiar destination 1 2 3 4 5 6 7 DK
Further away 1 2 3 4 5 6 7 DK
More advertised 1 2 3 4 5 6 7 DK
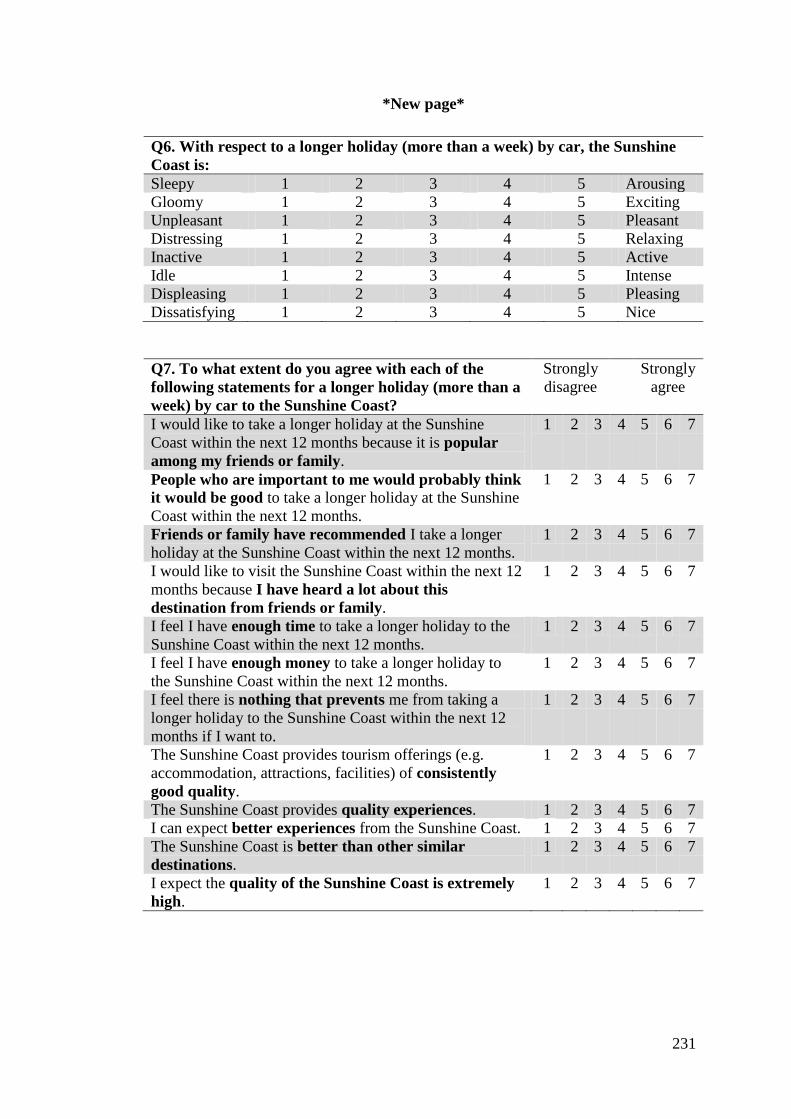
231
*New page*
Q6. With respect to a longer holiday (more than a week) by car, the Sunshine
Coast is:
Sleepy 1 2 3 4 5 Arousing
Gloomy 1 2 3 4 5 Exciting
Unpleasant 1 2 3 4 5 Pleasant
Distressing 1 2 3 4 5 Relaxing
Inactive 1 2 3 4 5 Active
Idle 1 2 3 4 5 Intense
Displeasing 1 2 3 4 5 Pleasing
Dissatisfying 1 2 3 4 5 Nice
Q7. To what extent do you agree with each of the
following statements for a longer holiday (more than a
week) by car to the Sunshine Coast?
Strongly
disagree
Strongly
agree
I would like to take a longer holiday at the Sunshine
Coast within the next 12 months because it is popular
among my friends or family.
1 2 3 4 5 6 7
People who are important to me would probably think
it would be good to take a longer holiday at the Sunshine
Coast within the next 12 months.
1 2 3 4 5 6 7
Friends or family have recommended I take a longer
holiday at the Sunshine Coast within the next 12 months.
1 2 3 4 5 6 7
I would like to visit the Sunshine Coast within the next 12
months because I have heard a lot about this
destination from friends or family.
1 2 3 4 5 6 7
I feel I have enough time to take a longer holiday to the
Sunshine Coast within the next 12 months.
1 2 3 4 5 6 7
I feel I have enough money to take a longer holiday to
the Sunshine Coast within the next 12 months.
1 2 3 4 5 6 7
I feel there is nothing that prevents me from taking a
longer holiday to the Sunshine Coast within the next 12
months if I want to.
1 2 3 4 5 6 7
The Sunshine Coast provides tourism offerings (e.g.
accommodation, attractions, facilities) of consistently
good quality.
1 2 3 4 5 6 7
The Sunshine Coast provides quality experiences. 1 2 3 4 5 6 7
I can expect better experiences from the Sunshine Coast. 1 2 3 4 5 6 7
The Sunshine Coast is better than other similar
destinations.
1 2 3 4 5 6 7
I expect the quality of the Sunshine Coast is extremely
high.
1 2 3 4 5 6 7
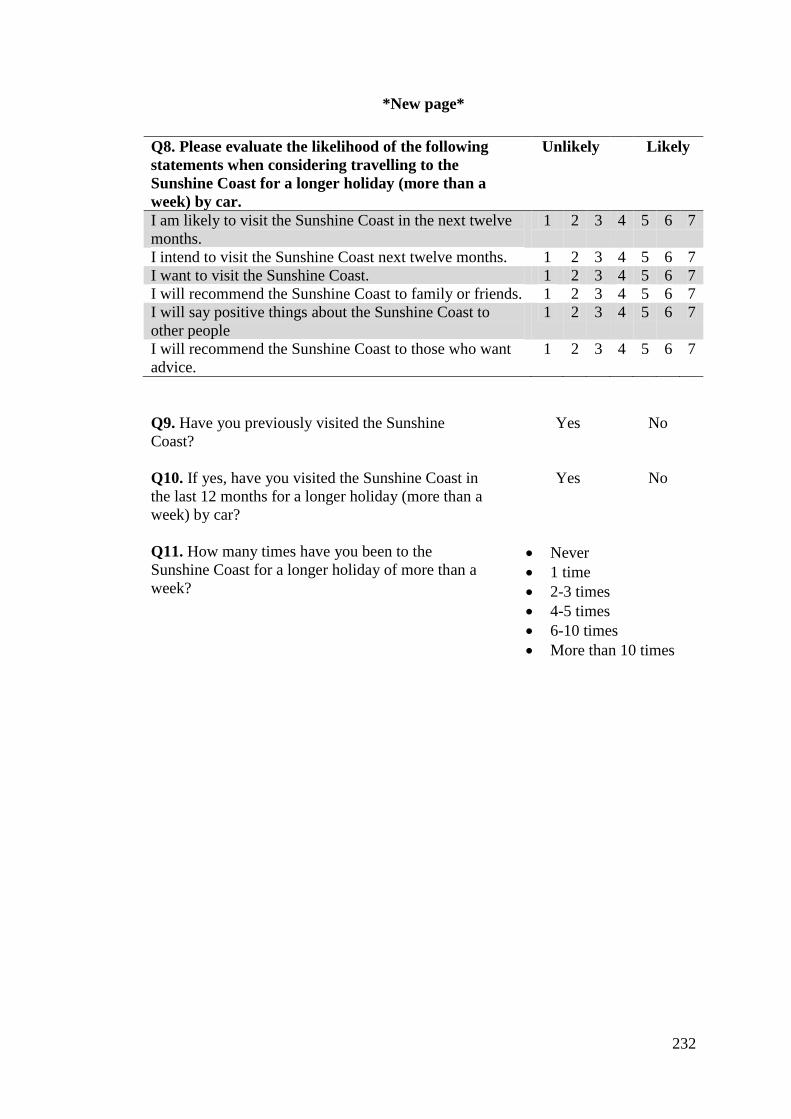
232
*New page*
Q8. Please evaluate the likelihood of the following
statements when considering travelling to the
Sunshine Coast for a longer holiday (more than a
week) by car.
Unlikely Likely
I am likely to visit the Sunshine Coast in the next twelve
months.
1 2 3 4 5 6 7
I intend to visit the Sunshine Coast next twelve months. 1 2 3 4 5 6 7
I want to visit the Sunshine Coast. 1 2 3 4 5 6 7
I will recommend the Sunshine Coast to family or friends. 1 2 3 4 5 6 7
I will say positive things about the Sunshine Coast to
other people
1 2 3 4 5 6 7
I will recommend the Sunshine Coast to those who want
advice.
1 2 3 4 5 6 7
Q9. Have you previously visited the Sunshine
Coast?
Yes
No
Q10. If yes, have you visited the Sunshine Coast in
the last 12 months for a longer holiday (more than a
week) by car?
Yes
No
Q11. How many times have you been to the
Sunshine Coast for a longer holiday of more than a
week?
Never
1 time
2-3 times
4-5 times
6-10 times
More than 10 times
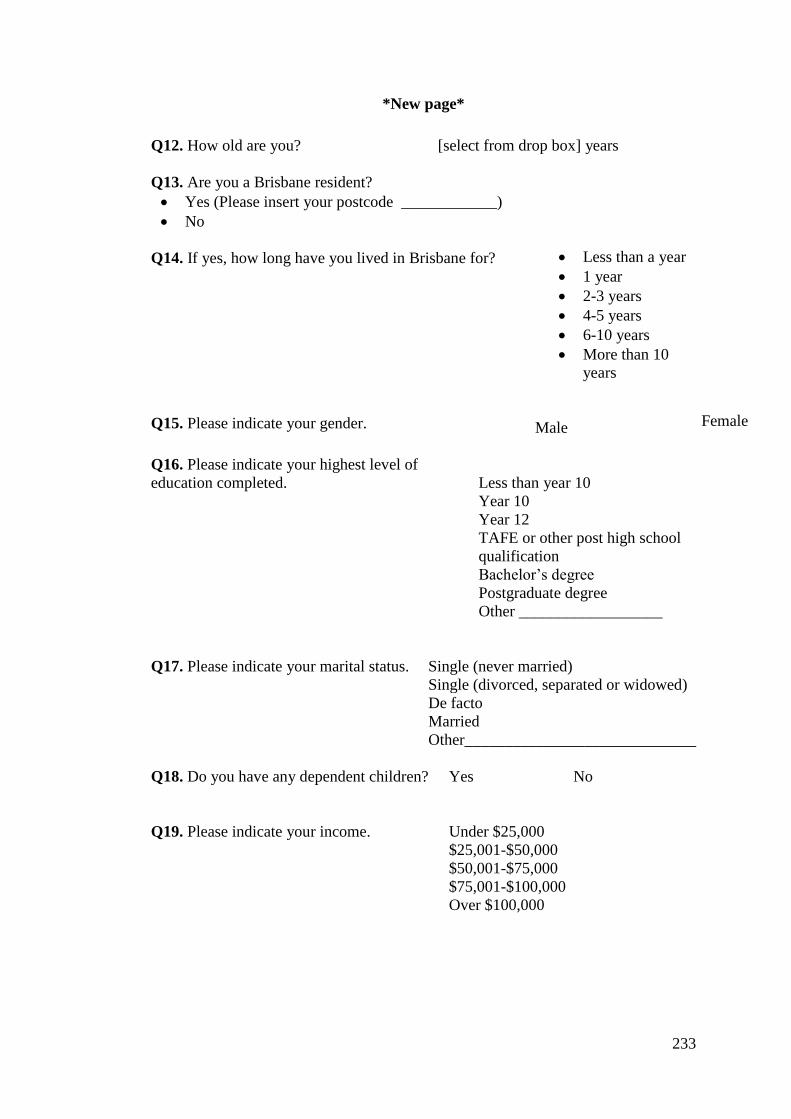
233
*New page*
Q12. How old are you? [select from drop box] years
Q13. Are you a Brisbane resident?
Yes (Please insert your postcode ____________)
No
Q14. If yes, how long have you lived in Brisbane for?
Q15. Please indicate your gender.
Less than a year
1 year
2-3 years
4-5 years
6-10 years
More than 10
years
Male
Female
Q16. Please indicate your highest level of
education completed.
Less than year 10
Year 10
Year 12
TAFE or other post high school
qualification
Bachelor’s degree
Postgraduate degree
Other __________________
Q17. Please indicate your marital status. Single (never married)
Single (divorced, separated or widowed)
De facto
Married
Other_____________________________
Q18. Do you have any dependent children?
Q19. Please indicate your income.
Yes No
Under $25,000
$25,001-$50,000
$50,001-$75,000
$75,001-$100,000
Over $100,000
234
Q20. Please use this space to provide any other comments about longer holidays:
Thank you for taking the time to participate in this survey. Your assistance is much
appreciated.
ALLOW PARTICIPANTS TO INSERT TEXT HERE
235
Appendix Twelve: Ethics approval – Questionnaire
Dear Ms Sam Murdy
Project Title:
Travel context: development of a model to measure destination brand
performance across different travel situations
Approval Number: 1100000492
Clearance Until: 12/04/2014
Ethics Category: Human
As you are aware, your low risk application has been reviewed by your Faculty Research Ethics
Advisor and confirmed as meeting the requirements of the National Statement on Ethical
Conduct in Human Research.
Before data collection commences please ensure you attend to any changes requested by your
Faculty Research Ethics Advisor.
Whilst the data collection of your project has received ethical clearance, the decision to
commence and authority to commence may be dependent on factors beyond the remit of the
ethics committee (e.g. ethics clearance/ permission from another institute / organisation) and you
should not commence the proposed work until you have satisfied these requirements.
If you require a formal approval certificate, please respond via reply email and one will be
issued.
Decisions related to low risk ethical review are subject to ratification at the next available
Committee meeting. You will only be contacted again in relation to this matter if the Committee
raises any additional questions or concerns.
This project has been awarded ethical clearance until 12/04/2014 and a progress report must be
submitted for an active ethical clearance at least once every twelve months. Researchers who fail
to submit an appropriate progress report when asked to do so may have their ethical clearance
revoked and/or the ethical clearances of other projects suspended. When your project has been
completed please advise us by email at your earliest convenience.
For variations, please complete and submit an online variation form:
http://www.research.qut.edu.au/ethics/forms/hum/var/variation.jsp
Please do not hesitate to contact the unit if you have any queries.
Regards
Janette Lamb on behalf of the Faculty Research Ethics Advisor
Research Ethics Unit | Office of Research
Level 4 | 88 Musk Avenue | Kelvin Grove
p: +61 7 3138 5123
w: http://www.research.qut.edu.au/ethics/


![[Infographic] How Does Your Incentive Travel Program Measure Up?](https://img.pdfslide.net/doc/110x75/58e75c7d1a28ab5b2a8b4fd1/infographic-how-does-your-incentive-travel-program-measure-up.jpg)