Embed Size (px)
Citation preview

2002TRAVELLERS ACCOMMODATION
Needs Assessment in Northern Ireland

> This document is available in alternative formats. Please contact Aengus Hannaway , Principal Officer, Northern IrelandHousing Executive, The Housing Centre, 2 Adelaide Street, Belfast BT2 8PB.
Tel: 028 90 240588 e-mail: [email protected]
>
1.0
2.0
2.1
2.2
2.3
2.4
2.5
2.6
2.7
2.8
3.0
3.1
3.2
3.3
3.4
3.5
3.6
3.7
4.0
4.1
4.2
4.3
4.4
CONTENTS
FOREWORD .. .. .. .. .. .. .. .. .. .. 5
BACKGROUND TO THE SURVEY .. .. .. .. .. .. .. 6
METHODOLOGY .. .. .. .. .. .. .. .. .. .. 7
RESPONSE RATE .. .. .. .. .. .. .. .. .. .. 8
EXECUTIVE SUMMARY .. .. .. .. .. .. .. .. .. 10
Characteristics of respondents & their households .. .. .. .. 15
Gender and age of heads of household .. .. .. .. .. .. 15
Employment status of heads of household .. .. .. .. .. 15
Household composition .. .. .. .. .. .. .. .. 17
Average household size .. .. .. .. .. .. .. .. 17
Age and gender of all household members .. .. .. .. .. 18
Traveller population compared with NI Population .. .. .. .. 18
1993 Northern Ireland Traveller Census .. .. .. .. .. .. 20
Location of Traveller households .. .. .. .. .. .. .. 20
ACCOMMODATION .. .. .. .. .. .. .. .. .. 21
Current accommodation .. .. .. .. .. .. .. .. 21
Length of time at current accommodation .. .. .. .. .. 21
Respondents’ assessment of size of accommodation .. .. .. .. 22
Satisfaction with current accommodation .. .. .. .. .. 22
Current accommodation by age (all household members) .. .. .. 23
Previous accommodation .. .. .. .. .. .. .. .. 23
Preferred accommodation .. .. .. .. .. .. .. .. 25
INTIMIDATION/HARASSMENT .. .. .. .. .. .. .. 27
Incidence of intimidation/harassment .. .. .. .. .. .. 27
Main types of intimidation/harassment .. .. .. .. .. .. 27
Other intimidation/harassment research .. .. .. .. .. .. 27
Experience of intimidation/harassment by current tenure .. .. .. 28

>
5.0
5.1
5.2
5.3
6.0
6.1
6.2
6.3
6.4
6.5
6.6
7.0
8.0
9.0
CONTENTS
TRAVELLING .. .. .. .. .. .. .. .. .. .. 29
Propensity to travel .. .. .. .. .. .. .. .. .. 29
Propensity to travel by age of heads of household .. .. .. .. 30
Secure base .. .. .. .. .. .. .. .. .. .. 30
DISABILITY .. .. .. .. .. .. .. .. .. .. .. 31
Disability in the household .. .. .. .. .. .. .. .. 31
NI health and wellbeing survey (2001) .. .. .. .. .. .. 31
Age of household members with a disability .. .. .. .. .. 32
Tenure of household members with a disability .. .. .. .. .. 32
Disability and accommodation needs .. .. .. .. .. .. 33
Nature of disability .. .. .. .. .. .. .. .. .. 33
FURTHER COMMENTS .. .. .. .. .. .. .. .. .. 34
CONCLUSIONS .. .. .. .. .. .. .. .. .. .. 35
RECOMMENDATIONS .. .. .. .. .. .. .. .. .. 37
APPENDIX 1 Appendix Tables .. .. .. .. .. .. .. 40
APPENDIX 2 List of Figures .. .. .. .. .. .. .. 58
List of Tables in text .. .. .. .. .. .. 58
Glossary of Accommodation Types .. .. .. .. 59
Other Sources .. .. .. .. .. .. .. 60
Acknowledgements .. .. .. .. .. .. 60

TRAVELLERS ACCOMMODATION NEEDS ASSESSMENT IN NORTHERN IRELAND
FOREWORD
In 1999 the New Policy on Accommodation for Travellers (D.O.E. (NI)) gave the Housing Executive the strategic role in the provision of accommodation for the Traveller Community, the Housing Executive has been working closely with our partner agencies in the statutory and voluntary sector and the Traveller Community to progress the development of Traveller specific accommodation.
I am pleased to report the successful completion of Group Housing schemes for the Traveller Community in Omagh and Magherafelt, and I look forward to the commencement and successful completion of the two remaining pilot group housing schemes in Belfast (at Glen Road and Monagh Road) which are currently at pre-development stage. Meetings with District Councils are also ongoing in preparation for the transfer of council owned Traveller serviced sites to the Housing Executive following the introduction of the Housing Bill.
Within this context I am pleased to present this report on the accommodation needs of the Traveller Community across Northern Ireland. The information contained in this document represents the first comprehensive record of Traveller Community accommodation needs, and is the most up-to-date demographic record of the Traveller community in Northern Ireland since the Traveller Census (DOE (NI) 1993).
I would like to take this opportunity to thank those who have contributed, both to the accommodation needs assessment exercise outlined in this document and to the wider process of the provision of accommodation. I include here the members of the needs assessment steering group and in particular Belfast City Council for facilitating the secondment of a member of staff on a part-time basis to assist with the fieldwork. I would also like to thank the various District Councils, Traveller support groups and Housing Executive district offices who helped in identifying Traveller Community households across Northern Ireland.
The information contained in the document will be used to inform and facilitate decisions around the planning of future accommodation schemes. This will go some way to alleviating the inadequate living conditions of many Traveller Community families in our society. There is still a long way to go in respect of meeting the needs of the Traveller Community and addressing social exclusion. I am confident that together the various statutory and voluntary organisations will work in partnership to tackle all areas of social disadvantage within the Traveller Community to bring about tangible improvements in their quality of life.
Paddy McIntyreChief Executive
5

BACKGROUND TO THE SURVEY
Promoting Social Inclusion (PSI) is a specific initiative within the Government’s policy of Targeting Social Need (TSN), which aims to bring different departments and organisations together to determine how to most effectively address the problems facing particular groups.
The needs of the Traveller Community were among the first issues identified by Government that should be addressed within this initiative and an inter-agency working group was established. The group’s final report was released for consultation by OFM/DFM in December 2000 containing 33 recommendations in respect of issues around Accommodation, Health, Education, Training and Employment and Policing. The closing date for comments was 30/04/01 and an Implementation Plan is still awaited.
In January 2002 the Housing Executive initiated a comprehensive assessment of the accommodation needs of all Traveller households in Northern Ireland. The impetus for this needs assessment arose from recommendations made in the final report of the Promoting Social Inclusion Working Group on Travellers. Recommendation 5 states:
‘The Northern Ireland Housing Executive should undertake a comprehensive strategic needs assessment of current and projected accommodation requirements of all Travellers in consultation with Traveller organisations, members of Traveller Communities and District Councils’.
Steering Group As a first step in undertaking this comprehensive strategic needs assessment the Housing Executive assembled a Steering Group of interested parties to oversee the project. Representatives from the following organisations agreed to join the steering group:
• Equality Commission
• Department for Social Development
• Northern Ireland Housing Executive
• Local Government Partnership on Traveller Issues
• Northern Ireland Federation of Housing Associations
• Office of the First Minister/Deputy First Minister
• Traveller Movement (NI)
The role of the group was varied and included the following;
• The group would quality assure and validate the findings of the research carried out.
6

TRAVELLERS ACCOMMODATION NEEDS ASSESSMENT IN NORTHERN IRELAND
• The wide membership of the group would ensure that agencies with an involvement in Traveller issues would be invited to bring expertise. The diverse yet complementary range of experiences of those attending would contribute to the effectiveness of the group.
• It was recognised at an early stage that it was important for the data collected and the means of collection to be open to scrutiny. This openness allowed everyone associated with the project to give it their full support.
Methodology Due to the nature of the survey it was decided that face-to-face interviews were required to maximise the response rate. A questionnaire was drawn up in consultation with Traveller Movement (NI) and agreed with members of the steering group.
In view of the significance of the project, it was felt that the involvement of someone with community development experience with Travellers could prove beneficial. Belfast City Council was approached, therefore, regarding the secondment of one of their Community Development Workers to the project. This person, along with a Research Officer from the Housing Executive’s Research Unit and members of the Traveller Project Team, carried out the research.
Questionnaire Following consultation with the steering group a needs assessment questionnaire was devised. The main aims of the questionnaire were to:
• ascertain the current tenure of the Traveller population and measure their satisfaction levels with their existing accommodation;
• determine the number of Travellers who exercised a nomadic way of life or still had aspirations to travel on an occasional basis;
• assess the preferred accommodation choice of Travellers;
• measure the extent of intimidation/harassment encountered by Travellers, whether the source of this was from the settled community or from fellow Travellers;
• assess the incidence of ill-health/disability in the Traveller Community.
In devising the questionnaire, all parties were conscious that Travellers had been the focus of research for some time and had become disillusioned with the process. In addition, this project looked specifically at accommodation and later projects may look at education, health and training and employment.
7

Fieldwork Team The survey was carried out over eight months from January 2002 to August 2002. The fieldwork was carried out by Housing Executive staff and the Community Development Worker for Belfast City Council. The Housing Executive’s Traveller Project Team drew the sample frame for this survey from various sources, including District Councils and Housing Executive district offices. Assistance was also received from several Traveller Support Groups and the Traveller Community itself.
Response Rate A total of 452 Traveller households were identified through the consultation with Traveller support groups, District Councils and the Housing Executive. A total of 316 face to face interviews were subsequently carried out across Northern Ireland, in line with a timetable agreed with the Traveller Movement (NI).
As a general rule, if an interview had not been achieved on the first visit to an address at least one further attempt was made to interview the household. These visits were made at varying times of the day. If, at the end of the fieldwork period, staff had been unable to contact a household member, the address was recorded as a non-contact. A breakdown of response is shown in Table 1a.
Table 1a
N %
Fully Completed Interviews 316 70
Non-contact 101 22
Refusal 35 8
Total number identified 452 100
As the exact number of Traveller households is prone to seasonal fluctuations, the completeness of the sample frame cannot be guaranteed. However, based on the figures above the response rate for this survey was relatively high at 70%.
Presentation of Findings The results from the Traveller Accommodation Needs Assessment in Northern Ireland (2002) are presented in nine sections, as follows:
• Executive Summary
• Characteristics of respondents and their households
8

TRAVELLERS ACCOMMODATION NEEDS ASSESSMENT IN NORTHERN IRELAND
• Accommodation
• Intimidation/Harassment
• Travelling
• Disability
• Further Comments
• Conclusions
• Recommendations
The data gathered by the survey on these topics have been analysed using the main variable of current tenure. Results of the survey are reported in percentages, except where questions were put to members of sub-sample groups of less than 100 respondents, in which case numbers and percentages are reported. For data protection purposes, if less than five respondents have responded to a question, actual numbers are not reported.
9

1.0 EXECUTIVE SUMMARY
1.1 Background
Recommendation 5 of the Final Report of the Promoting Social Inclusion Working Group on Travellers stated: The Northern Ireland Housing Executive should undertake a comprehensive strategic needs assessment of current and projected accommodation requirements of all Travellers in consultation with Traveller organisations, members of Traveller Communities and District Councils.
This needs assessment was carried out over an eight month period from January to August 2002 amongst Travellers identified by District Councils, Housing Executive district offices, Traveller support groups and individual Travellers. The fieldwork was carried out by Housing Executive staff and a community development worker seconded from Belfast City Council. A total of 452 Traveller households were identified, with 316 face to face interviews subsequently being carried out.
The information collected has been broken down by the following subject areas: household characteristics, current and preferred accommodation, intimidation/harassment, propensity to travel and incidence of disability. Responses in relation to each of these subject areas are outlined below.
1.2 Household Characteristics
• A total of 1,228 individuals were identified in 316 households across Northern Ireland.
• Half (50%) of heads of household were aged between 25 and 39 years. Only 5% were over 60.
• Forty-one percent of heads of household were looking after the family/ home and 37% were not working.
• Thirty-four percent of households were lone parents and one-quarter (25%) were large families.
• Fifty-three percent of all household members were female and 46% were male.
• More than half (52%) of all household members were aged under 16. Only 2% were over 60, which could possibly indicate higher mortality rates among this community.
1.3 Accommodation
• More than two-fifths (42%) of respondents were currently living in social housing. Twenty-one percent lived on serviced sites and 11% on the side of the road.
10

TRAVELLERS ACCOMMODATION NEEDS ASSESSMENT IN NORTHERN IRELAND
• Almost one-fifth (17%) of respondents lived in the Dungannon District Council area; 14% lived in the Belfast City Council area and 13% lived in the Derry City Council area.
• Almost two-fifths (38%) of respondents had lived in their current accommodation for more than one year but less than five years. Twenty-nine percent of respondents had lived there for more than 5 years.
• More than half (55%) of respondents said they had found their accommodation to be about the right size and a similar proportion (52%) were very satisfied/satisfied with their accommodation. Almost half (47%) were dissatisfied/very dissatisfied.
• Respondents living in grouped accommodation reported high levels of satisfaction (100%) as did those in social housing (78%). Those respondents living in non-permanent accommodation reported high levels of dissatisfaction; side of the road - 85% dissatisfied; co-operated sites 76% dissatisfied; serviced sites - 70% dissatisfied.
• The proportion of those in social housing had almost doubled (23% said their previous tenure was social housing compared to 42% whose current tenure was social housing). The proportion of those in serviced sites had decreased (34% said their previous tenure had been a serviced site compared to 21% whose current tenure was a serviced site). The proportion of respondents in co-operated sites had tripled (3% previous tenure; 9% current tenure).
• More than half (58%) said their current accommodation was better compared to their previous accommodation. The majority of these respondents (74%) said their current accommodation was social housing.
• More than one-fifth (21%) of those respondents who had been in previous accommodation said that they had lived previously in the Belfast area. Twelve percent said that they had lived outside Northern Ireland and a further 12% said that they had lived in the Dungannon area.
• The main reasons cited for leaving previous accommodation were an offer of social housing (16%) and unsuitable living conditions (16%).
• More than two-fifths (42%) of respondents said they would prefer social housing and a similar proportion (38%) said they would prefer grouped accommodation. Seventy-one percent (47) of those in serviced
11

sites said they would prefer grouped accommodation; 83% (24) of respondents in co-operated sites said they would prefer grouped accommodation.
• More than one-fifth (22%) of respondents said they would prefer to live in the Belfast area.
1.4 Intimidation/Harassment
• More than one-fifth (22%) of respondents said they or a member of their family had experienced intimidation/harassment in the previous 12 months.
• 78% (53) of these respondents said they thought the intimidation/ harassment had occurred because of their ethnicity.
• Sixteen percent (14) of comments detailing types of intimidation/ harassment experienced by respondents or their families related to ‘verbal abuse from the settled community’ and 14% (12) related to ‘trouble from other Travellers’.
1.5 Propensity to Travel
• One-fifth (20%) of respondents said they travelled. When asked if they would travel if they had a secure base, 28% said they would do so.
• Almost three-quarters (71%: 44) of respondents who travelled said they normally did so during the summer months. The same proportion (71%: 44) said they would travel for a duration of up to 3 months.
• Almost four-fifths (79%: 27) of respondents who travelled were currently living on the side of the road and 21% (6) were on co-operated sites.
• More than half (52%: 32) of respondents who travelled were aged between 25 and 39 years.
• More than half (57%: 51) of respondents who travelled said they did so for family reasons and 26% (23) travelled for economic reasons.
1.6 Disability
• More than two-fifths (44%) of respondents said that they or a member of their household considered themselves to have a disability.
• As a proportion of the Traveller population surveyed, less than one-sixth (15%) of household members had a disability, however, as disability is
12

1.7
TRAVELLERS ACCOMMODATION NEEDS ASSESSMENT IN NORTHERN IRELAND
linked to age it must be noted that only 2% of the Traveller population surveyed were over 60.
• Almost one-third (30%) of household members with a disability were under 16.
• The most common disability among all household members was depression, bad nerves or anxiety (25%).
• The majority (92%) of respondents were registered with a GP.
Recommendations
• That a five year rolling programme of schemes, to address the accommodation needs of Travellers, is drawn up by the Housing Executive, based on greatest need.
• That a process of consultation is set in place for each proposed scheme, irrespective of location, with those Travellers who are to be accommodated in that scheme and the local community.
• That the Northern Ireland Housing Executive continues to liaise with Traveller organisations, members of the Traveller Communities, District Councils and statutory and voluntary organisations in relation to future schemes and policy issues.
• That any tenancy/licence arrangement created should cater for those Travellers who wish to adhere to a nomadic lifestyle.
• That an evaluation of the 4 group housing schemes is carried out by the Housing Executive, within agreed timescales, to determine best practice in respect of the delivery of future schemes.
• Given the racial intimidation and harassment findings in this survey, it is recommended that all public bodies which interface with the Traveller Community should take account of these findings when providing staff guidance and in the delivery of other staff equality training programmes, as per recommendation 4 of the Promoting Social Inclusion Working Group Report on Travellers.
• That the Office of the First Minister/Deputy First Minister give consideration to the findings in the Report in relation to the drafting of future services for Travellers.
• That the Housing Executive, in partnership with the voluntary sector, take the lead role in activating the co-operation policy when necessary and approach Government Departments and statutory agencies regarding the use of their land for co-operated sites.
13

• That the Housing Executive, when planning future accommodation, take into consideration the predominantly young population within the Traveller Community and the implications this will have on future demand.
14

2.1
TRAVELLERS ACCOMMODATION NEEDS ASSESSMENT IN NORTHERN IRELAND
2.0 CHARACTERISTICS OF RESPONDENTS AND THEIR HOUSEHOLDS
Respondents were asked details about each member of their household including age, gender, employment status and their relationship to the head of household. A total of 1,228 individuals were identified in 316 households.
Gender and Age of Heads of Household
A higher proportion of heads of household were female (57%) than male (43%). The highest proportion (50%) of heads of household were aged between 25 and 39 years; one-quarter (25%) were aged between 40 and 59 years and one-fifth (20%) belonged to the 16 to 24 age group. The age profile shows a very small proportion (5%) of heads of household were over 60 years of age. Figure 1 shows a breakdown of gender within the different age groups (Appendix Tables 1 & 2).
Fig 1: Age of Heads of Household by Gender
53% 50%
46%
26% 25% 24%
20% 17%
23%
6%5% 5%
16-24 25-39 40-59 60+
Male Female All
Base: 316
2.2 Employment Status of Heads of Household
More than two-fifths (41%) of heads of household were looking after the family/home and more than one-third (37%) were not working. More than one-tenth (11%) were permanently sick/disabled and 5% were working. A further 5% refused to supply employment details.
15
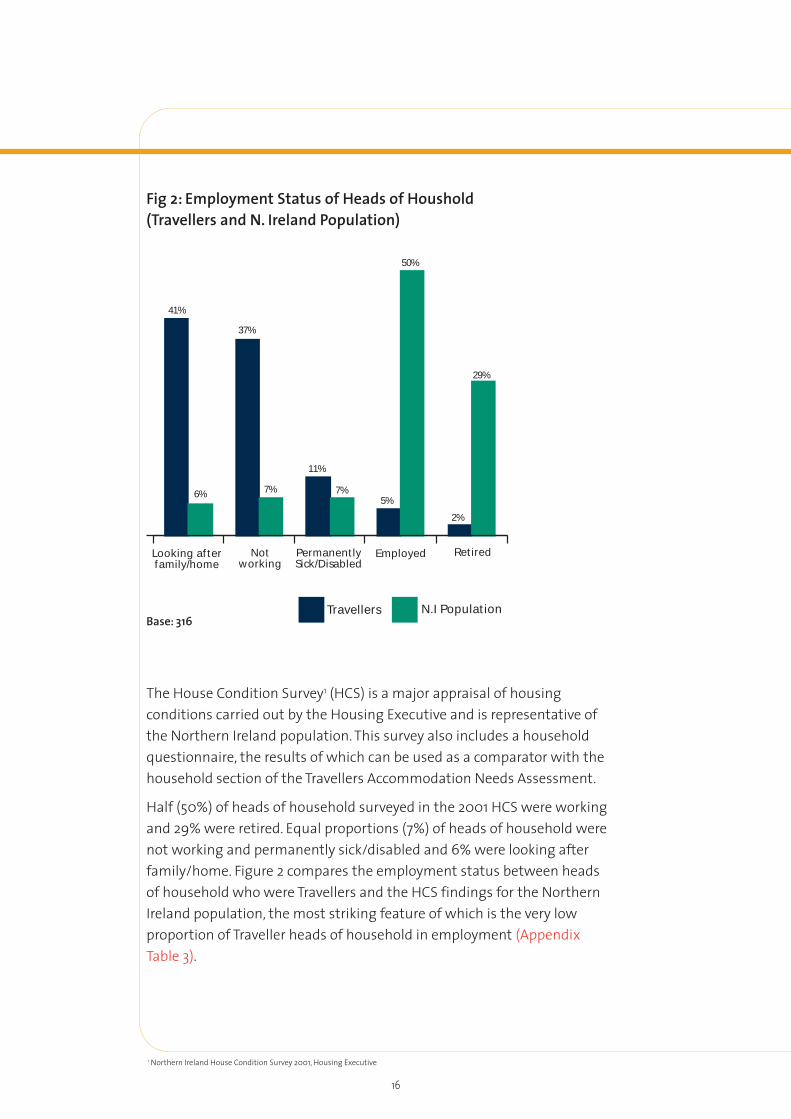
Fig 2: Employment Status of Heads of Houshold (Travellers and N. Ireland Population)
50%
41%
37%
29%
11%
7% 7%6% 5%
2%
Looking after Not family/home working
Base: 316
Permanently Employed Retired Sick/Disabled
Travellers N.I Population
The House Condition Survey1 (HCS) is a major appraisal of housing conditions carried out by the Housing Executive and is representative of the Northern Ireland population. This survey also includes a household questionnaire, the results of which can be used as a comparator with the household section of the Travellers Accommodation Needs Assessment.
Half (50%) of heads of household surveyed in the 2001 HCS were working and 29% were retired. Equal proportions (7%) of heads of household were not working and permanently sick/disabled and 6% were looking after family/home. Figure 2 compares the employment status between heads of household who were Travellers and the HCS findings for the Northern Ireland population, the most striking feature of which is the very low proportion of Traveller heads of household in employment (Appendix Table 3).
1 Northern Ireland House Condition Survey 2001, Housing Executive
16

2.3
TRAVELLERS ACCOMMODATION NEEDS ASSESSMENT IN NORTHERN IRELAND
Household Composition
Figure 3 shows the most common household type in the Traveller Community was Lone Parent (34%). The next largest grouping was Large Family (25%). More than one-tenth (12%) were Small Family and a similar proportion (11%) were Lone Adult.
The findings of the HCS 2001 showed the most common household types in the Northern Ireland population were Lone Older and Large Adult (both 15%). This contrasts with the predominance of lone parent households in the Traveller Community. In addition, a higher proportion of older households is apparent among the Northern Ireland population than among the Traveller population (Figure 3) (Appendix Table 4).
Fig 3: Household Type 34%
25%
15%15% 14%13% 13%
12% 12%12% 11%
8%
6%6%
3%
1%
Lone Large Small Lone Two Large Two Lone Parent Family Family Adults Adults Adult Older Older
N. Ireland Population All Travellers
Base: 316
2.4 Average Household Size
Whilst the average household size for the general population in Northern Ireland was 2.662 in 2001-02, the average Traveller household size at the time of this survey was higher at 4.48. However, analysis of the number of persons per household shows that the highest proportion (20%) of
2 Northern Ireland Housing Statistics 2001-02, NISRA/DSD
17

2.5
households contained two persons. A full breakdown of the number of persons per household can be seen in the appendix tables. (Appendix Table 5).
Age and gender of all household members
From a total population of 1,228 household members, analysis by age shows that, at the time of the survey, the Traveller population was predominantly youthful, with more than half (52%) of all household members aged under 16. Almost one-fifth (19%) of household members were between 25 and 39 years and a similar proportion (18%) were between 16 and 24 years. Disturbingly, less than one-tenth (9%) of household members were aged from 40 to 59 and only 2% were over 60. Further research would be required to identify reasons for the smaller proportions of older Travellers, which could possibly indicate higher mortality rates among this community.
A breakdown of age group by gender is given in Table 1b (Appendix Tables 6, 7 & 8).
Table 1b
Male Female Refused Total
Age Group N % N % N % N %
5 or under 132 23 122 19 <5 13 255 21
6-15 190 33 185 28 <5 38 378 31
16-24 99 17 119 18 - - 218 18
25-39 89 16 144 22 - - 233 19
40-59 45 8 64 10 - - 109 9
60-64 5 1 8 1 - - 13 1
65+ 5 1 7 1 - - 12 1
Refused <5 1 <5 <1 <5 50 10 1
Total 569 100 651 100 8 100 1228 100
2.6 Traveller Population Compared with Northern Ireland Population
The availability of 2001 Census3 data enables comparison of age and gender profiles of the Traveller population with that of the population of Northern Ireland as a whole. The diagrams below graphically show the differences in the composition of these populations. The most significant
3 Northern Ireland Census 2001 Population Report and Mid-Year Estimates, NISRA
18

TRAVELLERS ACCOMMODATION NEEDS ASSESSMENT IN NORTHERN IRELAND
feature of Figure 4 is the relatively young (under 20) population and the very low percentage of elderly people. This comparison is also detailed in the appendix tables (Figures 4 & 5) (Appendix Table 9).
Fig 4: Age Gender Pyramid
MALE
20 18 16 14 12 10 8 6 4 2 2 4 6 1412108 2018160
85+
80-84
75-79
70-74
65-69
60-64 55-59
50-54
45-49 40-44
35-39 30-34
25-29
20-24 15-19
10-14
5-9
0-4
2002 Traveller Needs Assessment in Northern Ireland
FEMALE
% of Traveller Population
Fig 5: Age Gender Pyramid
MALE
85+
80-84 75-79
70-74
65-69
60-64 55-59
50-54
45-49 40-44
35-39 30-34
25-29 20-24
15-19 10-14
5-9
0-4
% of N.I Population
2001 Northern Ireland Census
FEMALE
9 8 7 6 5 4 3 2 1 0 987654321
19

2.7 1993 Northern Ireland Traveller Census
Data from the 1993 Northern Ireland Traveller Census4 show that the total number of Travellers enumerated by DoE (NI) was 1,115, with 239 families living throughout Northern Ireland. Unfortunately this census did not include Traveller households living in settled accommodation, therefore direct comparisons with the findings from this survey are not possible. However, extraction of those Traveller households currently living in settled accommodation from this analysis shows that only 558 individuals (144 Traveller households) were living in non-permanent accommodation at the time of this study.
2.8 Location of Traveller Households
The highest proportion (17%) of respondents came from the Dungannon District Council area followed by 14% from Belfast, 13% from Derry and 12% from Newry and Mourne. The locations of the Traveller households surveyed are summarised in the appendix tables (Appendix Table 10).
Analysis of tenure by District Council Area shows that the highest proportion (17%) of those in social housing were living in Armagh District Council. A similar proportion (15%) were living in Derry and 11% of respondents in social housing said they were living in Newry and Mourne.
Of those living in serviced sites, almost two-fifths (38%: 25) were living in Dungannon District Council and 27% (18) were living in Derry. A further 18% (12) were living in Newry and Mourne. Of the respondents living in co-operated sites the majority (79%: 23) were living in Belfast and the remaining 21% (6) were living in Dungannon District Council area (Appendix Table 11).
4 Northern Ireland Travellers Census 1993, Central tatistics and Research Branch, DOE(NI)
20

3.1
3.2
TRAVELLERS ACCOMMODATION NEEDS ASSESSMENT IN NORTHERN IRELAND
3.0 ACCOMMODATION
Respondents were asked a series of questions relating to their current and past accommodation and also their future accommodation preferences.
Current Accommodation
More than two-fifths of respondents (42%) said their current accommodation was social housing (i.e Housing Executive or Housing Associations). Twenty-one percent said they lived on a serviced site; 11% said they lived by the side of the road and 9% lived on a co-operated site. Six percent of respondents said their tenure was privately rented accommodation and 4% were in grouped accommodation. The remaining 7% were in other types of accommodation, details of which can be found in the appendix tables (Figure 6) (Appendix Table 12).
Fig 6: Current Accomodation
Social Housing
Serviced Site
Side of the road
Cooperated Site
Privately rented home
Grouped Accommodation
Other
42%7% 4%
6%
9%
11%
21%
Length of time at current accommodation
Almost two-fifths (38%) of respondents said they had lived at their current accommodation for more than one year but less than five years. Twenty-nine percent had lived there for more than five years and the remaining 33% had been there for less than one year.
Analysis by length of time in current tenure shows that almost half (49%: 32) of those living in serviced sites had been there for more than five years. The majority (83%: 24) of those living in co-operated sites had also been living there for more than five years. Almost half (49%) had been living in social housing for more than one year but less than five years (Appendix Tables 13 & 14).
21

3.3 Respondents’ assessment of size of accommodation
More than half (55%) of respondents said their current accommodation was about the right size and 41% said it was too small. Only 2% thought their current accommodation was too big (Appendix Table 15).
3.4 Satisfaction with current accommodation
More than half (52%) of respondents said they were very satisfied/satisfied with their current accommodation and 47% were dissatisfied/very dissatisfied. Analysis of satisfaction by tenure shows that satisfaction levels were highest among respondents living in grouped accommodation (100% satisfied), followed by social housing (78%) and privately rented accommodation (72%). Those respondents in non-permanent accommodation such as ‘side of the road’, ‘co-operated sites’ and ‘serviced sites’ expressed high levels of dissatisfaction (85%, 76% and 70% respectively) (Figure 7) (Appendix Tables 16 & 17).
Fig 7: Satisfaction by Accommodation Type
All
Social Housing
Serviced Site
Side of the road
Co-operated site
Privately Rented
Grouped Accom
Other
52%
Satisfied Neutral Dissatisfied
85%
47%2%
78% 2% 20%
27% 3% 70%
12% 3%
24% 76%
72% 28%
100%
27% 73%
Base: 316
3.4.1 Data gathered from the 2001/02 Continuous Tenant Omnibus Survey5
shows that 82% of Housing Executive tenants were satisfied with their current home. Although a direct comparison cannot be made, this survey shows that a similar proportion (78%) of Traveller respondents in Social
5 Continuous Tenant Omnibus Survey 2001/02, Housing Executive
22

TRAVELLERS ACCOMMODATION NEEDS ASSESSMENT IN NORTHERN IRELAND
Housing (i.e. Housing Executive and Housing Association tenants) were satisfied with their current tenure. However, overall satisfaction falls to 52% of Traveller respondents across all tenure types.
3.4.2 Analysis by age of heads of household shows that satisfaction levels were highest among the over 60’s age group (59%: 10) while 53% of the 25-39 age group were very satisfied with their current accommodation. Almost one half (49%: 39) of the 40-59 age group were satisfied and a similar proportion (48%: 30) of 16-24 year olds were satisfied with their current accommodation (Appendix Table 18). The main reasons cited for dissatisfaction were lack of facilities (29% of comments) and dissatisfaction with the dwelling (27% of comments) (Appendix Table 19).
3.5 Current Accommodation by age (all household members)
Table 1c shows the current tenure for all household members by age. More than half (56%) of those living in social housing were under 16. Similar proportions of under 16s were resident in most of the other tenure types, except ‘side of the road’ which was lower at 41% (Table 1c).
Table 1c
Under 16 16-24 25-39 40-59 60+ Refused Total
N % N % N % N % N % N % N %
Social housing 292 56 79 15 100 19 43 8 10 2 <5 1 526 100
Serviced Site 114 49 51 22 44 19 22 9 <5 1 - - 234 100
Side of the road 65 41 43 27 29 18 13 8 <5 3 <5 3 158 100
Co-operated Site 28 51 21 19 25 22 8 7 <5 2 - - 113 100
Grouped accom. 25 57 <5 10 10 24 <5 5 <5 5 - - 42 100
Privately rented 34 57 <5 7 13 22 8 13 <5 2 - - 60 100
Other 47 49 16 17 12 13 13 14 3 3 <5 4 95 100
Total 633 52 218 18 233 20 109 9 25 2 10 1 1228 100
•All household members
3.6 Previous Accommodation
In order to measure any change in tenure trends among Travellers, the survey asked respondents for details of their accommodation immediately previous to their current accommodation. More than one-third (34%) of respondents said their previous accommodation had been a serviced site.
23

Almost one-quarter (23%) had been living in social housing and 14% had been living on the side of the road. Less than one-tenth (7%) said that they had had no previous accommodation and a further 6% said they had been in temporary/homeless accommodation (Appendix Table 20).
3.6.1 Table 1d below gives the breakdown of respondents’ current accommodation by their previous accommodation. Analysis by current and previous tenure shows that almost one-fifth (17%: 11) of respondents who were living in a serviced site at the time of the survey had been living at the side of the road immediately previously. Almost half (47%: 16) of those living on the side of the road had been living previously in a serviced site and all of those (100%: 11) living in grouped accommodation had been living previously in a serviced site. More than one-quarter (28%: 37) of those living in social housing had been living previously in a serviced site (Table 1d) (Appendix Table 21).
Table 1d
Current Accommodation
Previous Accommodation
Serviced Site
Side of the road
Social housing
Privately rented
Co-operated site
Other No previous Total
Serviced Site 44% 17% 9% 5% 5% 11% 11% 100%
Side of the road 47% 53% - - - - - 100%
Grouped accom. 100% - - - - - - 100%
Social housing 28% 6% 42% 3% 3% 17% - 100%
Privately rented 17% - 28% 22% - 22% 11% 100%
Co-operated Site 14% 21% 14% - 3% 7% 41% 100%
Other 31% 8% 8% 8% - 42% 4% 100%
Total 34% 14% 23% 4% 3% 15% 7% 100%
3.6.2 Of those respondents who said they had lived in previous accommodation, more than two-fifths (42%) had lived there for more than five years. One-third (33%) had lived there for more than one year but less than five years and 9% had lived there for more than six months but less than one year (Appendix Table 22).
3.6.3 More than half (58%) of these respondents said that they thought the condition of their current accommodation, compared to their previous accommodation, was better. More than one-quarter (26%) said it was
24

TRAVELLERS ACCOMMODATION NEEDS ASSESSMENT IN NORTHERN IRELAND
about the same and 16% said it was worse. Analysis by tenure shows that 74% of those in social housing thought the condition of their current accommodation was better than their previous accommodation. Sixteen percent thought it was about the same and 10% thought it was worse (Appendix Tables 23 & 24).
3.6.4 More than one-fifth (21%) of those respondents who had been in previous accommodation said that they had lived previously in the Belfast City Council area. Twelve percent said that they had lived outside Northern Ireland and a further 12% said that they had lived in the Dungannon District Council area. Eleven percent had lived in the Derry City Council area and 10% had lived in the Newry and Mourne District Council area immediately previously (Appendix Table 25).
3.6.5 Respondents who said they had lived in previous accommodation were asked their reasons for moving. A total of 294 respondents who had lived elsewhere immediately prior to their current accommodation gave 306 responses to this question. The most common reason for moving was the offer of alternative social housing (16%). The same proportion (16%) stated dissatisfaction with their living conditions. Nine percent cited marriage as their reason for leaving and the same percentage (9%) had moved for family reasons (Appendix Table 26).
3.7 Preferred Accommodation
Respondents were asked their preferred type of accommodation. More than two-fifths (42%) said they would prefer social housing and a similar proportion (38%) preferred grouped accommodation. Fourteen percent said they would prefer to live in a serviced site and the remaining 6% of respondents gave other types of preferred accommodation, details of which can be found in the appendix tables (Appendix Table 27). Table 1e below shows respondents’ current accommodation by their preferred accommodation. The highest proportion (71%: 47) of those currently living in serviced sites stated their preference for grouped accommodation; 18% (12) stated a preference for social housing. Of those living on the side of the road, the majority (68%: 23) stated their preference for serviced sites, followed by grouped accommodation (18%: 6). Of those respondents living in co-operated sites the majority (83%: 24) stated their preference for grouped accommodation. Of those already living in social housing, more than three-quarters (76%) stated that they preferred social housing and 17% preferred grouped accommodation (Table 1e) (Appendix Table 28).
25

Table 1e
Preferred Accommodation
Current Accommodation
Serviced Site
Grouped accom.
Social housing
Privately rented
Other Total
Serviced Site 6% 71% 18% - 5% 100%
Side of the road 68% 18% 6% - 9% 100%
Grouped accom. - 100% - - - 100%
Social housing 6% 17% 76% 1% 1% 100%
Co-operated Site - 83% 7% - 10% 100%
Privately rented - 22% 61% 17% - 100%
Other 31% 19% 27% - 23% 100%
Total 14% 38% 42% 1% 5% 100%
3.7.1 More than one-fifth (22%) of respondents said that they would prefer to live in the Belfast area; 16% said they preferred the Dungannon area and 13% preferred the Derry area. Newry and Mourne area was the preferred location of 11% of respondents, followed by Armagh (10%), Omagh (7%), Craigavon and Ballymena (both 5%) (Appendix Table 29).
26

TRAVELLERS ACCOMMODATION NEEDS ASSESSMENT IN NORTHERN IRELAND
4.0 INTIMIDATION/HARASSMENT
4.1 Incidence of intimidation/harassment
Respondents were asked a number of questions in order for the survey to measure the incidence of perceived intimidation or harassment within the Traveller Community. Three-quarters (75%) of respondents had not experienced any intimidation or harassment. More than one-fifth (22%) of respondents said they or a member of their family had experienced intimidation or harassment within the previous 12 months and 4% refused to answer this question (Appendix Table 30).
Respondents who had experienced intimidation or harassment were also asked if they thought this had occurred because they were members of the Traveller Community. More than three-quarters (78%: 53) of those who had experienced intimidation or harassment thought that that this was the case (Appendix Table 31).
4.2 Main types of intimidation/harassment
Respondents were asked to describe the main types of intimidation or harassment that they or their families had experienced. Their main comments were:
• ‘Verbal abuse from settled community’ 16%: 14 • ‘Trouble from other Travellers’ 14%: 12 • ‘Vandalism of property’ 11%: 9 • ‘Intimidation by the settled community’ 11%: 9
(Appendix Table 32)
4.3 Other intimidation/harassment research
As very little quantitative data have been gathered on the Traveller Community’s experience of intimidation or harassment, it is difficult to make direct comparisons with previous findings. However, the first major study of ethnic minority people’s experiences in Northern Ireland published in 1997 gave the first indications of the extent of the problem in the region. In Irwin and Dunn’s6 survey of a sample of Travellers, the percentages of those surveyed replying ‘yes’ to a range of questions relating to intimidation/harassment were:
• ‘Being treated differently’ 25% • ‘People reacting towards you in an unfriendly way’ 18% • ‘Directing verbal abuse towards you’ 19% • ‘Commit criminal damage on your property’ 5% • ‘Direct physical abuse towards you’ 5%
6 Greg Irwin and seamus Dunn(1997) ‘Ethnic Minorities in Northern Ireland’.
27
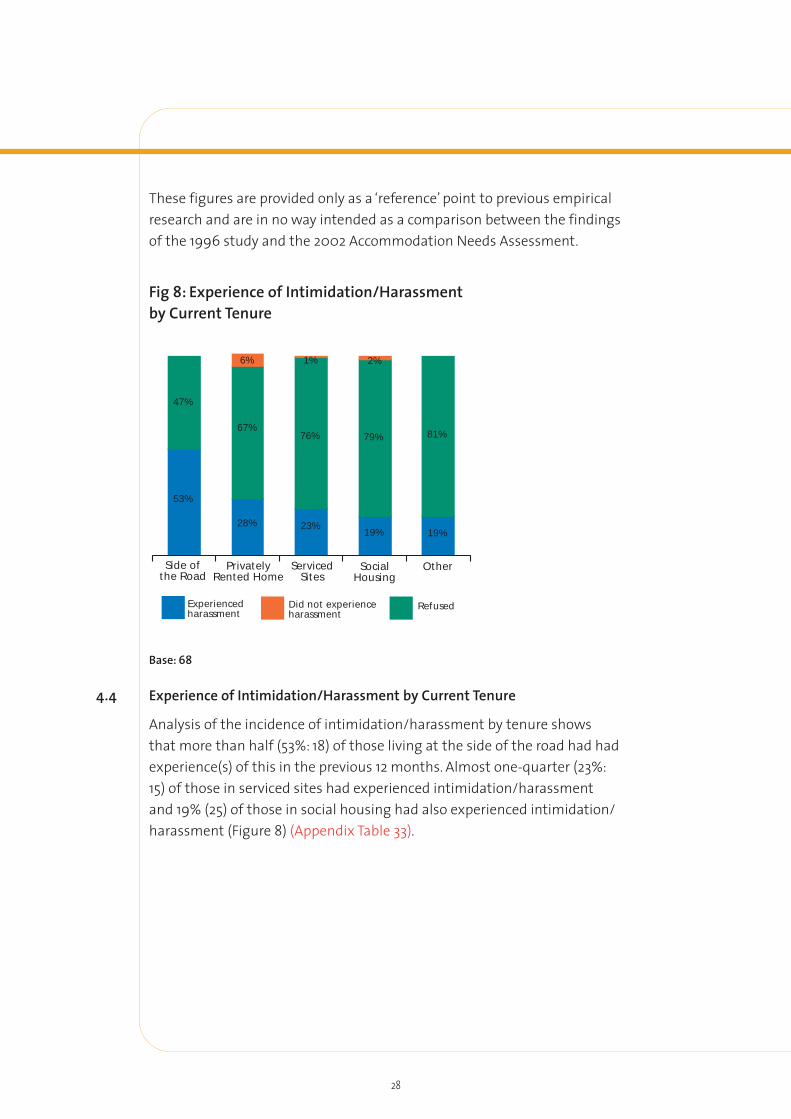
These figures are provided only as a ‘reference’ point to previous empirical research and are in no way intended as a comparison between the findings of the 1996 study and the 2002 Accommodation Needs Assessment.
Fig 8: Experience of Intimidation/Harassment by Current Tenure
47%
53%
67%
28%
6% 1%
76%
23%
79%
19%
2%
81%
19%
Side of Privately Serviced Social Other the Road Rented Home Sites Housing
Experienced Did not experience Refused harassment harassment
Base: 68
4.4 Experience of Intimidation/Harassment by Current Tenure
Analysis of the incidence of intimidation/harassment by tenure shows that more than half (53%: 18) of those living at the side of the road had had experience(s) of this in the previous 12 months. Almost one-quarter (23%: 15) of those in serviced sites had experienced intimidation/harassment and 19% (25) of those in social housing had also experienced intimidation/ harassment (Figure 8) (Appendix Table 33).
28

TRAVELLERS ACCOMMODATION NEEDS ASSESSMENT IN NORTHERN IRELAND
5.0 TRAVELLING
Respondents were asked questions on ‘travelling’ in order for the survey to measure the extent of nomadism within the Traveller Community.
5.1 Propensity to travel
One-fifth (20%) of respondents said that they travelled and the remaining 80% did not. When asked if they would travel if they had a secure base, 28% said they would do so. Of those who travelled, almost two-fifths (39%: 24) said they would normally travel for between one and three months per year and 32% (20) said they travelled for less than one month per year. When asked what season of the year they would normally travel, 71% (44) said they would normally travel during the summer months (Appendix Tables 34, 35 & 36).
5.1.2 Analysis by tenure shows differing incidences of travelling within each tenure type. Less than one-sixth (14%: 9) in serviced sites said they travelled, compared with 79% (27) of those living by the side of the road. Twenty-one percent (6) of respondents living in co-operated sites said they travelled as did 11% (15) in social housing and 6% (<5) in privately rented accommodation (Figure 9) (Appendix Table 37).
Fig 9: Propensity to Travel by Tenure
21%
79%
79% 86%
21% 14%
85%
15%
89% 94% 100%
11% 6%
Serviced Social PrivateSide of Cooperated Other Group the Road Site Sites Housing Rented Accom.
Don't travelTravel
Base: 68
29

5.2
5.3
Propensity to travel by Age of Heads of Household
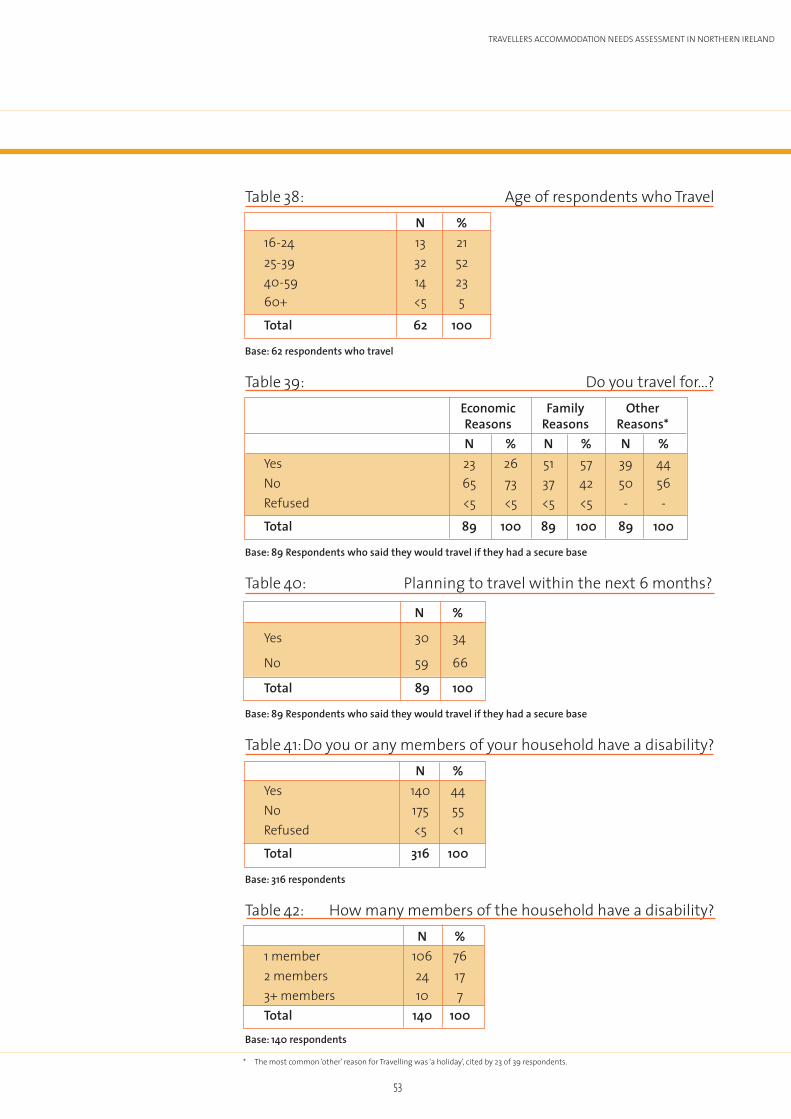
Analysis of propensity to travel by age of heads of household shows that more than one half (52%: 32) of those respondents who said they travelled were in the 25-39 age group. Almost one-quarter (23%: 14) were from the 40-59 age group and 21% (13) were from the 16-24 age group (Figure 10) (Appendix Table 38).
Fig 10: Propensity to Travel by Age of Heads of Household
5% 21%
52%
23%
16-24
25-39
40-59
60+
Base: 68
Secure Base
More than one-quarter (28%) of respondents said they would travel if they had a secure base (an increase of 8%). Reasons given for travelling were economic (26%: 23), family related (57%: 51) or ‘holiday’ (31%: 27). Of those who said they would travel if they had a secure base, more than one-third (34%: 30) said they were planning or intending to travel within the following six months (Appendix Tables 39 & 40).
30
TRAVELLERS ACCOMMODATION NEEDS ASSESSMENT IN NORTHERN IRELAND
6.0 DISABILITY
Respondents were asked questions on disability in order for the survey to assess the health of the Traveller Community. Disability was defined as:
‘A physical or mental impairment which has a substantial and long-term adverse effect on a persons ability to carry out normal day to day activities’.
They were also asked if they availed of basic medical care provided by GPs.
6.1 Disability in the household
More than two-fifths (44%) of respondents said that they or a member of their household considered themselves to have a disability. Of these, just over three-quarters (76%) said there was one disabled household member. Seventeen percent had two disabled household members and 7% had three or more sick/disabled household members. However, as a proportion of the Traveller population surveyed, less than one-sixth (15%) of household members were disabled. As disability is more prevalent in the elderly, this figure may be undersized due to the small proportion of Travellers who were elderly compared to the general population (Appendix Tables 41 & 42).
6.2 Northern Ireland Health and Wellbeing Survey (2001)
The Northern Ireland Health and Wellbeing Survey (2001) was commissioned by the Department of Health, Social Services and Public Safety to assess the health of a representative sample of adults living in Northern Ireland. In order to make a reasonable comparison between the characteristics of the Traveller population and those of the overall Northern Ireland population, it was decided that findings from the Health and Wellbeing Survey would be measured against those of the Traveller Survey.
Since the respondents to the Health and Wellbeing Survey were aged 16 or over, it was necessary to use only the information gathered by the Travellers Survey relating to people of the same age. Therefore, from the original total of 1,228 household members, data relating to 637 individuals under 16 were excluded. Findings relating to the remaining 591 household members were used in the comparison with the Health and Wellbeing Survey.
Although aspects of the two surveys differed, it is interesting to note that more than one-quarter (28%) of the Northern Ireland adult population had a limiting long standing illness or disability compared to 22% of Traveller adults. This lower figure for the Traveller population may be explained in part by the different age ranges of the two populations. As disability has been linked to age, it is important to note that 48% of Northern
31

Ireland’s adult population were aged under 45 compared to 81% of the Traveller population and consequently, a high proportion of elderly people with a disability was not a feature of the Traveller population.
Further analysis of the Northern Ireland adult population by age reveals that the proportion of respondents with a limiting long standing illness or disability increased with age. Only 6% of respondents aged between 16 and 24 had a limiting long standing illness or disability in comparison to 52% of those over 65. This finding is similar to the incidence of limiting long standing illness or disability in Traveller adults, of whom 10% (21) were aged between 16-24 and 67% (8) were over 65. However, this comparison must be treated with extreme caution as only 2% of Traveller adults were aged over 65 compared to 21% of the Northern Ireland adult population (Appendix Table 43 & 44).
Analysis of the Northern Ireland adult population by gender shows that 29% of women and 26% of men had a limiting long standing illness or disability, compared to 23% and 21% of Traveller women and men respectively (Appendix Table 45).
6.3 Age of disabled members with a disability
Analysis of disability by age groups shows that the highest proportion (30%) of household members with a disability were under 16. One-quarter (25%) of household members were aged between 25 and 39 and the same proportion (25%) were between 40 and 59. More than one-tenth (11%) were aged between 16 and 24 and a further 10% were over 60 (Appendix Table 46).
6.4 Tenure of all household members with a disability
Analysis of disability by tenure shows that disability was most prevalent within social housing, privately rented accommodation and serviced sites (19%, 17% and 15% respectively). See also Figure 11 (Appendix Table 47).
32

TRAVELLERS ACCOMMODATION NEEDS ASSESSMENT IN NORTHERN IRELAND
Fig 11: Disability within Tenure Type
Social Private Services Cooperated Other Side of
1% 4%
81%
19% 12%17% 15% 12%
6%
83% 85% 88% 84% 94%
Housing Rented Sites Site the Road
RefusedHave a disability No disability
Base: 68
6.5 Disability and accommodation needs
Half of respondents (50%) thought their current accommodation was suitable for the person with the disability and two-fifths (40%) thought the nature of the disability in their household would require some disabled facilities adaptations (Appendix Table 48).
The large majority (92%) of respondents said they were registered with a GP. Of the 23 respondents who were not registered with a GP, 20 lived in non-permanent accommodation such as serviced sites or side of the road (Appendix Table 49).
6.6 Nature of disability
Almost one-third (31%) of heads of household indicated that they had a disability. Of these, almost one-third (32%: 31) cited their disability as depression, bad nerves or anxiety; the majority (71%: 22) of these respondents were female. One fifth (20%: 20) of heads of household said they had disabilities connected with arms or hands (including arthritis or rheumatism) and 17% (17) said they had heart, blood pressure or blood circulation problems (Appendix Table 50).
A total of 140 households which had a member/members with a disability/ disabilities identified 185 medical conditions. The most prevalent disability across all household members was depression, bad nerves or anxiety, which accounted for 25% of all disabilities recorded, details of which can be found in the appendix tables (Appendix Tables 51 & 52).
33

7.0 FURTHER COMMENTS
Respondents were asked for further comments on any other circumstances regarding their accommodation needs, to give them an opportunity to raise issues of importance to them.
Forty-four percent of respondents made a total of 170 further comments on a range of issues. Almost one-quarter of the comments (24%) related to health/disability issues and more than one-fifth (21%) stated a preference for grouped accommodation. Fourteen percent of comments were accommodation related and 10% complained of the lack of facilities available for Travellers (Table 1f).
Table 1f
Comments N %
Health/Disability related comments-e.g. ‘Have a disability and need proper accommodation’
Want Grouped Housing
Accommodation related comments e.g.‘Prefer a house’
Facilities related comments-e.g. ‘Need toilets/electricity’
Prefer a serviced site
Not enough room to live in
Other comments
40
35
23
16
13
7
36
24
21
14
9
8
4
21
Total 170 100
140 respondents who gave 170 further comments
34

TRAVELLERS ACCOMMODATION NEEDS ASSESSMENT IN NORTHERN IRELAND
8.0 CONCLUSIONS
In recent years the provision of adequate and appropriate accommodation has assumed a central role in addressing the inequalities faced by Travellers. The issue of accommodation has been considered through the Traveller Census 1993, the DOE New Policy on Accommodation for Travellers 1999 and the Promoting Social Inclusion Report 2001.
The Final Report of the Promoting Social Inclusion Working Group on Travellers makes reference to the multiple disadvantage experienced by the Traveller Community, all of which are exacerbated by poor living conditions:
“The impact of other measures recommended in this report, in relation to such issues as health and education, are likely to be limited until the accommodation needs of Travellers are met.”6
The needs assessment, the first to be comprehensive in terms of which Travellers were contacted, was carried out over an 8-month period from January to August 2002, and for the first time Travellers in social housing were interviewed as well as those Travellers living in serviced sites and by the side of the road.
A total of 452 Traveller households were identified, 316 of which completed questionnaires. These households were spread across Northern Ireland and for the first time the greatest number of Travellers was not found to be living in Belfast. The greatest concentration of Traveller households were located in the Dungannon District Council area (17%), closely followed by Belfast (14%), Derry (13%), Newry & Mourne (12%) and Armagh (10%).
Of the 316 households surveyed, half (50%) of the heads of household were aged between 25-39 years, with only 5% over 60. Thirty-four percent of the heads of household were lone parents and more than half (52%) of household members were aged under 16.
A significant increase in the number of respondents in social housing is apparent; more than two-fifths of respondents (42%) were currently living in social housing compared to 23% who indicated their previous accommodation was also social housing.
As regards satisfaction/dissatisfaction with current accommodation, those living in social housing expressed the highest level of satisfaction (78%). This reduced significantly for those Travellers living in less permanent accommodation, with 70% of those in serviced sites expressing dissatisfaction and corresponding dissatisfaction levels of 85% (side of the road) and 76% (co-operated sites).
In respect of the type of accommodation which Travellers would like, grouped accommodation was the preferred choice of 71% of those living
6 Final Report of the Promoting Social Inclsion Working Group on Travellers
35

on serviced sites and 83% of those living on co-operated sites. In addition, 68% of those living on the side of the road wished to be accommodated on serviced sites. As far as the location of their preferred accommodation is concerned, the highest percentage of respondents expressed a desire to live in Belfast (22%), followed by Dungannon (16%), Derry (13%) and Newry (11%).
Respondents were asked questions on ‘travelling’ in order for the survey to measure the extent of nomadism within the Traveller Community. Eighty percent of respondents said they no longer travelled and of those who did many travelled only during the summer months. This subject will be examined more closely in the Nomadism Research currently being carried out by Traveller Movement (NI) and Irish Traveller Movement (RoI).
Depression, bad nerves or anxiety, cited by 32% (31) of heads of household with a disability, was the most common complaint among those inter viewed regarding disabilities. Disabilities connected with arms or hands (including arthritis or rheumatism) was the next most common complaint (20%: 20), followed by 17% (17) who had heart, blood pressure or blood circulation problems.
When asked about the incidence of intimidation/harassment, 22% (68) of respondents stated they had experienced some form of intimidation in the previous twelve months. Of those, 14 comments related to experience of verbal abuse from settled community and a further 12 comments indicated that the harassment had originated from fellow Travellers.
The Housing Executive, in giving consideration to the findings of the research, will draw up a programme of Traveller specific schemes to address the identified need over the next five years.
The following District Council areas (listed below alphabetically) have been identified as areas where the need is greatest:
• Armagh • Belfast* • Craigavon • Dungannon • Derry • Lisburn • Newry • Omagh
In drawing up a programme of schemes the Housing Executive will give consideration to greatest need, land availability, compatibility and consultation with individuals, families and the wider community.
* Two Group Housing Schemes are currently planned at Monagh Road and Glen Road.
36

TRAVELLERS ACCOMMODATION NEEDS ASSESSMENT IN NORTHERN IRELAND
9.0 RECOMMENDATIONS
The comprehensive accommodation needs assessment has now been completed and the resultant data considered by the steering group. The group would consequently put forward the following recommendations:
1. That a five year rolling programme of schemes to address the accommodation needs of Travellers, is drawn up by the Housing Executive, based on greatest need.
2. That a process of consultation is set in place for each proposed scheme, irrespective of location, with those Travellers who are to be accommodated in that scheme and the local community.
3. That the Northern Ireland Housing Executive continues to liaise with Traveller organisations, members of the Traveller Communities, District Councils and statutory and voluntary organisations in relation to future schemes and policy issues.
4. That any tenancy/licence arrangement created should cater for those Travellers who wish to adhere to a nomadic lifestyle.
5. That an evaluation of the 4 group housing schemes is carried out by the Housing Executive, within agreed timescales, to determine best practice in respect of the delivery of future schemes.
6. Given the racial intimidation and harassment findings in this survey, it is recommended that all public bodies which interface with the Traveller Community should take account of these findings when providing staff guidance and in the delivery of other staff equality training programmes, as per recommendation 4 of the Promoting Social Inclusion Working Group Report on Travellers.
7. That the Office of the First Minister/Deputy First Minister give consideration to the findings in the Report in relation to the drafting of future services for Travellers.
8. That the Housing Executive, in partnership with the voluntary sector, take the lead role in activating the co-operation policy when necessary and approach Government Departments and statutory agencies regarding the use of their land for co-operated sites.
9. That the Housing Executive, when planning future accommodation, take into consideration the predominantly young population within the Traveller Community and the implications this will have on future demand.
37

Appendices
Appendix 1: Appendix Tables
Appendix 2: List of Figures List of Tables in text Glossary of Accommodation Types Other Sources Acknowledgements
>

Appendix 1
TABULAR REPORT
TRAVELLERS ACCOMMODATION NEEDS ASSESSMENT IN N. IRELAND
(Note: Due to rounding some tables may not add to 100. Also in some cases where the number (N) of responses has been less than five, the actual figures have been omitted and theses are shown as <5)
Table 1: Gender of Head of Household
N % Male 136 43 Female 180 57 Total 316 100
Base: 316 respondents
Table 2: Age and Gender of Head of Household
Male Female Total N % N % N %
16-24 31 23 31 17 62 20 25-39 62 46 95 53 157 50 40-59 35 26 44 24 79 25 60+ 7 5 10 6 17 5 Refused <5 1 - - <5 1 Total 136 100 180 100 316 100
Base: 316 respondents
Table 3: Employment Status of Head of Household
Travellers N.I Population % %
Looking after family/home 41 6 Not working 37 7 Permanently Sick/Disabled 11 7 Employed 5 50 Retired 2 29 Refused 5 -Other - 1 Total 100 100
Traveller Base: 316 respondents House Condition Survey Base: 5546 respondents
40

TRAVELLERS ACCOMMODATION NEEDS ASSESSMENT IN NORTHERN IRELAND
Table 4 Household Type
Travellers N.I. Population % %
Lone Parent Sole Adult living with dependant child(ren)
under 16 years of age. Large Family Any two adults, related or unrelated, living
with 3 or more dependent children under 16 years of age OR 3 adults or more and 2 or more
34 6
dependent children under 16 years of age. Small Family Any two adults, related or unrelated living with
25 13
1 or 2 dependent children under 16 years of age. Lone Adult One person below pensionable age - 65 years
12 13
for men, 60 years for women. Two Adults Two people, related or unrelated, below
11 12
pensionable age. Large Adult Three or more adults, related or unrelated,
with or without 1 dependent child under 16
8 12
years of age. Two Older Two people, related or unrelated, at least one
6 15
of whom is of pensionable age. Lone Older Lone person of pensionable age, 65 years for
3 14
men, 60 years for women. 1 15 Refused Insufficient information available 1 -
Total 100 100
Traveller Base: 316 respondentsHouse Condition Survey Base: 5546 respondents
41
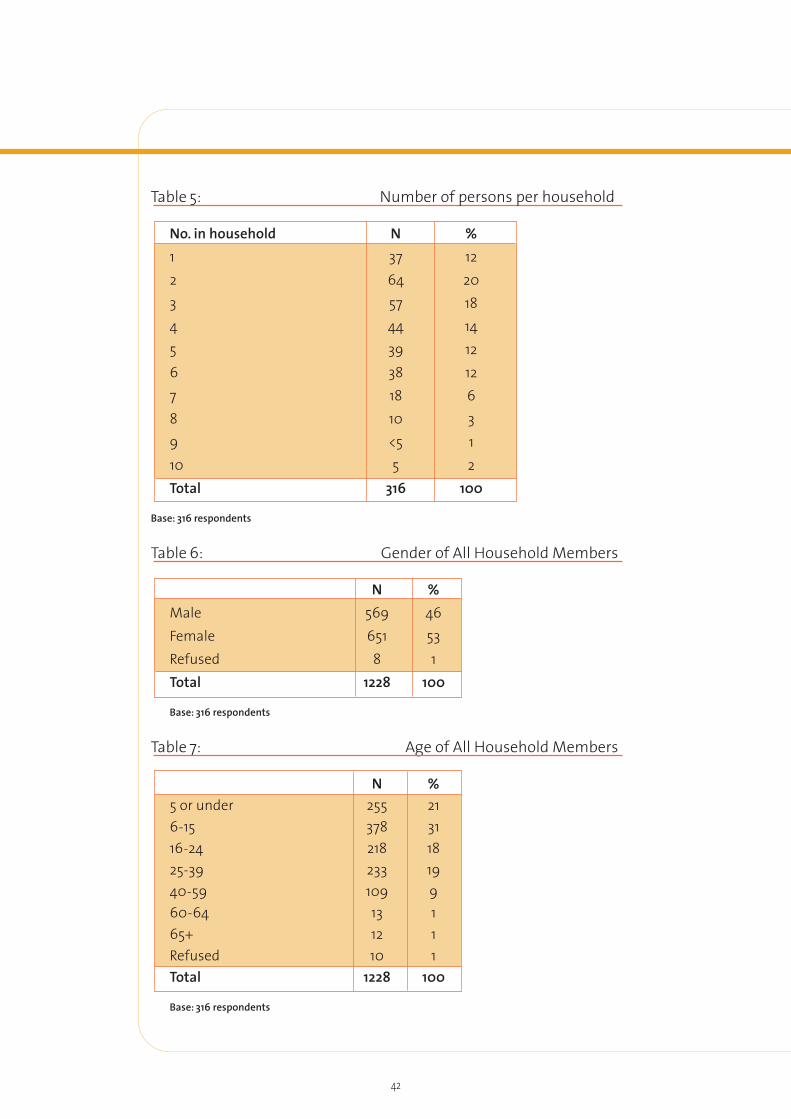
Table 5: Number of persons per household
No. in household N % 1 2 3 4 5 6 7 8 9 10
37 64 57 44 39 38 18 10 <5 5
12 20 18 14 12 12 6 3 1 2
Total 316 100
Base: 316 respondents
Table 6: Gender of All Household Members
N % Male 569 46 Female 651 53 Refused 8 1 Total 1228 100
Base: 316 respondents
Table 7: Age of All Household Members
N % 5 or under 255 21 6-15 378 31 16-24 218 18 25-39 233 19 40-59 109 9 60-64 13 1 65+ 12 1 Refused 10 1 Total 1228 100
Base: 316 respondents
42

TRAVELLERS ACCOMMODATION NEEDS ASSESSMENT IN NORTHERN IRELAND
Table 8: Age and Gender of All Household Members
Male Female Refused Total
N % N % N % N % 5 or under 132 23 122 19 <5 13 255 21 6-15 190 33 185 28 <5 38 378 31 16-24 99 17 119 18 - - 218 18 25-39 89 16 144 22 - - 233 19 40-59 45 8 64 10 - - 109 9 60-64 5 1 8 1 - - 13 1 65+ 5 1 7 1 - - 12 1
Refused <5 1 <5 <1 <5 50 10 1
Total 569 100 651 100 8 100 1228 100
Base: 316 respondents
Table 9: Traveller Population compared with N.Ireland Population
Traveller Population N.Ireland Population Male Female Total Male Female Total
N % N % N % N % N % N % 0-4 112 20 101 16 214 17 59213 7 56025 6 115238 7 5-9 114 20 91 14 206 17 63147 8 59903 7 123050 7 10-14 85 15 95 15 182 15 68014 8 64650 7 132664 8 15-19 72 13 85 13 157 13 65598 8 63603 7 129201 8 20-24 41 7 56 9 97 8 54913 7 54472 6 109385 6 25-29 43 8 54 8 97 8 56628 7 58076 7 114704 7 30-34 24 4 52 8 76 6 62487 8 65030 8 127517 8 35-39 22 4 38 6 60 5 63430 8 66209 8 129639 8 40-44 13 2 15 2 28 2 57432 7 59903 7 117335 7 45-49 11 2 22 3 33 3 51686 6 50778 6 102464 6 50-54 13 2 17 3 30 2 48484 6 49942 6 98426 6 55-59 8 1 10 2 18 2 43585 5 45147 5 88732 5 60-64 5 1 8 1 13 1 35401 4 38186 4 73587 4 65-69 <5 <1 4 1 6 1 30406 4 34935 4 65341 4 70-74 <5 <1 3 1 4 <1 25069 3 32783 4 57852 3 75-79 <5 <1 - - <5 <1 18562 2 27980 3 46542 3 80-84 <5 <1 - - <5 <1 11090 1 19199 2 30289 2 85-89 - - - - - - 4707 1 11409 1 16116 1 90+ - - - - - - 1597 <1 5588 1 7185 <1
TOTAL 569 46 651 53 1228 100 821449 49 863818 51 1685267 100
Traveller Base: 316 Census Base: 1.685 million
43

Table 10: Location of Traveller Households (District Council) N %
Dungannon Belfast Derry Newry and Mourne Armagh Omagh Craigavon Ballymena Lisburn Strabane Magherafelt Other
53 45 41 37 31 23 20 18 15 13 12 8
17 14 13 12 10 7 6 6 5 4 4 6
Total 316 100
Base: 316 respondents
Table 11: Current Tenure by District Council
Belfast Derry Newry Dungannon Armagh Other Total N % N % N % N % N % N % N %
Social Housing 7 5 20 15 15 11 13 10 22 17 55 42 132 100 Serviced Site <5 5 18 27 12 18 25 38 - - 7 12 66 100 Side of the road <5 3 - - 9 27 - - 8 24 16 47 34 100 Co-operated site 23 79 - - - - 6 21 - - - - 29 100 Privately rented home 6 33 - - <5 6 5 28 <5 6 5 28 18 100 Other 5 14 <5 8 - - <5 11 - - 25 68 37 100
Total 45 14 41 13 37 12 53 17 31 10 109 34 316 100
Base: 316 respondents
Table 12: Current Tenure
N % Social HousingServiced Site Side of the road Co-operated site Privately rented home Grouped Accommodation Privately owned land Privately rented site Privately owned home Homeless Accommodation Other
132 66 34 29 18 11 7 7 5
<5 <5
42 21 11 9 6 4 2 2 2 1 1
Total 316 100
Base: 316 respondents
44

TRAVELLERS ACCOMMODATION NEEDS ASSESSMENT IN NORTHERN IRELAND
Table 13: Length of time at Current Tenure
N % Less than one month More than 1 month but less than 6 months More than 6 months but less than 1 year More than 1 year but less than 5 years More than 5 years
36 29 41
120 90
11 9 13 38 29
Total 316 100
Base: 316 respondents
Table 14: Length of Time at Current Tenure (by Tenure type)
Less More than More than More than More than Total than 1 1 mth but 6 mths 1 year but 5 years mth less than but less less than
6 mths than 1 year 5 years
N % N % N % N % N % N % Social Housing <5 2 17 13 25 19 64 49 23 17 132 100 Serviced Site <5 6 <5 5 <5 5 24 36 32 49 66 100 Side of the road 20 59 <5 9 <5 3 6 18 <5 12 34 100 Co-operated site <5 3 - - - - <5 14 24 83 29 100 Privately rented home <5 6 <5 17 5 28 7 39 <5 11 18 100 Grouped Accommodation 5 46 - - 6 55 - - - - 11 100 Other <5 8 <5 12 <5 4 15 58 5 19 26 100
Total 36 11 29 9 41 13 120 38 90 29 316 100
Base: 316 respondents
Table 15: Size of accommodation
N % Too small About the right size Too big Don’t know
130 175 7
<5
41 55 2 1
Total 316 100
Base: 316 respondents
45

Table 16: Satisfaction with current tenure
N % Very satisfied 36 11 Satisfied 127 40 Neutral 5 2 Dissatisfied 75 24 Very Dissatisfied 73 23
Total 316 100
Base: 316 respondents
Table 17: Current Tenure by Satisfaction of Head of Household
Satisfied Neutral Dissatisfied Total N % N % N % N %
Social Housing 103 78 <5 2 27 20 132 100 Serviced Site 18 27 <5 3 46 70 66 100 Side of the road <5 12 <5 3 29 85 34 100 Co-operated site 7 24 - - 22 76 29 100 Privately rented home 13 72 - - 5 28 18 100 GroupedAccommodation 11 100 - - - - 11 100 Other 7 27 - - 19 73 26 100
Total 163 52 5 2 148 47 316 100
Base: 316 respondents
Table 18: Satisfaction by Age of Head of Household
Satisfied Neutral Dissatisfied Total N % N % N % N %
16-24 30 48 <5 2 31 50 62 100 25-39 83 53 <5 2 72 46 157 100 40-59 39 49 <5 3 38 48 79 100 60+ 10 59 - - 7 41 17 100 Refused <5 100 - - - - - 100
Total 163 52 5 <5 148 49 316 100
Base: 316 respondents
46

TRAVELLERS ACCOMMODATION NEEDS ASSESSMENT IN NORTHERN IRELAND
Table 19: Reasons for dissatisfaction N %
Need better facilities Dissatisfaction with dwelling Conditions are very bad Dissatisfaction with the area Dangerous/Busy Road nearby Dissatisfaction because of intimidation/harassment Dissatisfied for health reasons Other
57 53 26 25 15 14 5
<5
29 27 13 13 8 7 3 2
Total 199 100
Base: 148 respondents gave a total of 199 comments.
Table 20: Previous Accommodation N %
Serviced Site 108 34 Social Housing 73 23 Side of the road 45 14 No previous accommodation 22 7 Temporary/Homeless Accommodation 18 6 Privately rented 13 4 Privately owned home 10 3 Co-operated site 8 3 Always Travelling 7 2 Other 12 4 Total 316 100
Base: 316 respondents
Table 21: Current Accommodation by Previous Accommodation Serviced
Site Side
of the road
Social Housing
Privately rented
Co-operated Site
Other No Previous accom.
Total
N % N % N % N % N % N % N % N %
Serviced Site Side of the road Grouped accom. Social Housing Privately rented Co-operated Site Other
29 16 11 37 <5 <5 8
44 47
100 28 17 14 31
11 18 -8 -6 <5
17 53 -6 -
21 8
6 --
56 5
<5 <5
9 --
42 28 14 8
<5 --
<5 <5 -
<5
5 --3
22 -8
<5 --
<5 -
<5 -
5 --3 -3 -
7 --
23 <5 <5 11
11 --
17 22 7
42
7 ---
<5 12 <5
11 ---11 41 4
66 34 11
132 18 29 26
100 100 100 100 100 100 100
Total 108 34 45 14 73 23 13 4 8 3 47 15 22 7 316 100
Base: 316 respondents
47

Table 22: Length of time at previous accommodation N %
Less than one month 16 5 More than 1 month but less than 6 months 22 8 More than 6 months but less than 1 year 27 9 More than 1 year but less than 5 years 96 33 More than 5 years 124 42 Don’t know 8 3 Refused <5 <1
Total 294 100
Base: 294 respondents who had previous accommodation
Table 23: How does the condition of current accommodation compare with previous accommodation?
N % Better 169 58 About the same 76 26 Worse 48 16 Non Response <5 <1
Total 294 100
Base: 294 respondents who had previous accommodation
Table 24: Condition of current accommodation compared toprevious accommodation
Better About the Worse Total same
N % N % N % N % Social Housing 97 74 21 16 13 10 132 100 Serviced Site 25 42 16 27 18 31 59 100 Side of the road 8 24 18 53 8 24 34 100 Co-operated site 5 29 9 53 <5 18 17 100 Privately rented home 6 38 6 38 <5 25 16 100 Grouped Accommodation 11 100 - - - - 11 100 Other 17 68 6 24 <5 8 25 100
Total 169 54 76 26 48 16 294 100
Base: 294 respondents who had previous accommodation
48

TRAVELLERS ACCOMMODATION NEEDS ASSESSMENT IN NORTHERN IRELAND
Table 25: Previous Location of Traveller Households (District Council) N %
Belfast Outside NI Dungannon Derry Newry and Mourne Ballymena Armagh Omagh Craigavon Strabane Magherafelt Other/Refused
62 34 34 33 30 23 21 18 11 8 7 13
21 12 12 11 10 8 7 6 4 3 2 4
Total 294 100 Base: 294 respondents who had previous accommodation
Table 26: Reasons for leaving previous accommodation N %
Offered other accommodation by NIHE/ Housing Association Unsuitable Living Conditions Marriage Family reasons Intimidation Had to move on Too many Traveller families and trouble Bad Area Conditions very bad on site Other
50 48 28 27 17 15 12 11 10 88
16 16 9 9 6 5 4 4 3
29
Total 306 100 Base: 294 respondents made 306 comments
Table 27: Preferred Accommodation N %
Social Housing 134 42 Grouped Accommodation 119 38 Serviced Site 43 14 Privately owned home 7 2 Privately rented home <5 1 A series of transit sites <5 1 Chalets with small groups of other travellers <5 1 Serviced sites with better conditions <5 1
Total 316 100 Base: 316 respondents
49
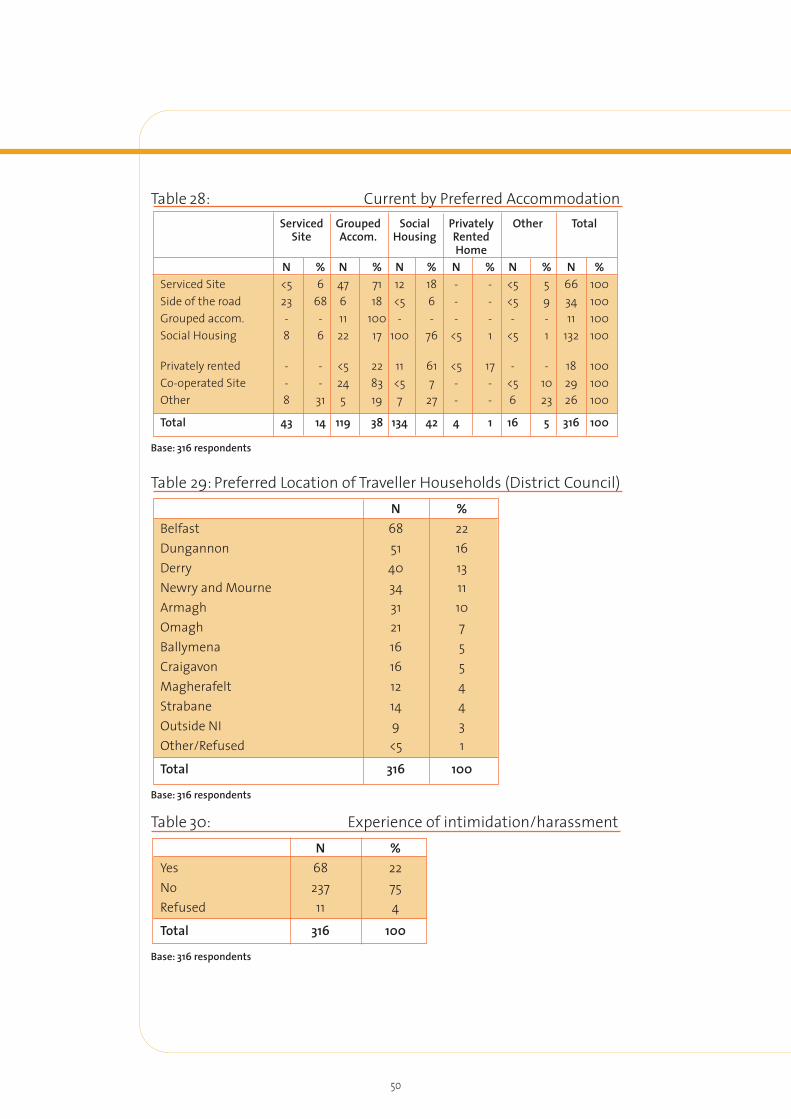
Table 28: Current by Preferred Accommodation Serviced Grouped Social Privately Other Total
Site Accom. Housing Rented Home
N % N % N % N % N % N % Serviced Site <5 6 47 71 12 18 - - <5 5 66 100 Side of the road 23 68 6 18 <5 6 - - <5 9 34 100 Grouped accom. - - 11 100 - - - - - - 11 100 Social Housing 8 6 22 17 100 76 <5 1 <5 1 132 100
Privately rented - - <5 22 11 61 <5 17 - - 18 100 Co-operated Site - - 24 83 <5 7 - - <5 10 29 100 Other 8 31 5 19 7 27 - - 6 23 26 100
Total 43 14 119 38 134 42 4 1 16 5 316 100
Base: 316 respondents
Table 29: Preferred Location of Traveller Households (District Council) N %
Belfast Dungannon Derry Newry and Mourne Armagh Omagh Ballymena Craigavon Magherafelt Strabane Outside NI Other/Refused
68 51 40 34 31 21 16 16 12 14 9 <5
22 16 13 11 10 7 5 5 4 4 3 1
Total 316 100
Base: 316 respondents
Table 30: Experience of intimidation/harassment N %
Yes 68 22 No 237 75 Refused 11 4
Total 316 100
Base: 316 respondents
50

TRAVELLERS ACCOMMODATION NEEDS ASSESSMENT IN NORTHERN IRELAND
Table 31: Do you think it is because you are a traveller that youexperienced this intimidation/harassment?
N % Yes 53 78 No 14 21 Refused <5 1
Total 68 100
Base: 68 respondents who experienced harassment/intimidation
Table 32: Details of Intimidation/Harassment N %
Verbal abuse from settled community 14 16 Trouble from other Travellers* 12 14 Vandalism of property 9 11 Intimidation from settled community 9 11 Refused service in public places 8 9 Discrimination by public bodies 6 7 PSNI harassment 6 7 Arson 5 6 Other 17 20
Total 86 100
Base: 68 respondents gave a total of 86 comments
Table 33: Experience of Intimidation by Tenure Yes No Refused Total
N % N % N % N % Social Housing Serviced Site Side of the road Co-operated site Privately rented home Grouped Accommodation Other
25 15 18 -5 -5
19 23 53 -
28 -
19
104 50 16 23 12 11 21
79 76 47 79 67
100 81
<5 <5 -6 <5 --
2 1 -
21 6 --
132 66 34 29 18 11 26
100 100 100 100 100 100 100
Total 68 22 237 75 11 4 316 100
Base: 316 Respondents
* All respondents who answered yes to the intimidation/harassment question were also asked if they thought this occurred because oftheir ethnicity. Of those who answered ‘Trouble from other Travellers’ none thought this occurred because of their ethnicity.
51

Table 34: Do you travel? Do you Travel? If you had a secure base, would you travel?
N % N % Yes 62 20 89 28 No 254 80 227 72
Total 316 100 316 100
Base: 316 respondents
Table 35: Duration of travel N %
Less than one month 20 32 More than one month but less than three months 24 39 More than three months but less than six months 6 10 More than six months 11 18 All Year Round <5 2
Total 62 100
Base: 62 respondents
Table 36: Time of year to travel N %
Summer 44 71 All year round 13 21 Spring <5 3 Winter <5 3 Autumn <5 2
Total 62 100
Base: 62 respondents
Table 37: Current Tenure by propensity to travel Yes No Total
N % N % N % Social Housing 15 11 117 89 132 100 Serviced Site 9 14 57 86 66 100 Side of the road 27 79 7 21 34 100 Co-operated site 6 21 23 79 29 100 Privately rented home <5 6 17 94 18 100 Grouped Accommodation - - 11 100 11 100 Other <5 15 22 85 26 100
Total 62 20 254 80 316 100 Base: 316 respondents
52
TRAVELLERS ACCOMMODATION NEEDS ASSESSMENT IN NORTHERN IRELAND
Table 38: Age of respondents who Travel N %
16-24 13 21 25-39 32 52 40-59 14 23 60+ <5 5
Total 62 100
Base: 62 respondents who travel
Table 39: Do you travel for...? Economic Family Other Reasons Reasons Reasons* N % N % N %
Yes 23 26 51 57 39 44 No 65 73 37 42 50 56 Refused <5 <5 <5 <5 - -
Total 89 100 89 100 89 100
Base: 89 Respondents who said they would travel if they had a secure base
Table 40: Planning to travel within the next 6 months?
N %
Yes 30 34
No 59 66
Total 89 100
Base: 89 Respondents who said they would travel if they had a secure base
Table 41:Do you or any members of your household have a disability? N %
Yes 140 44 No 175 55 Refused <5 <1
Total 316 100
Base: 316 respondents
Table 42: How many members of the household have a disability? N %
1 member 106 76 2 members 24 17 3+ members 10 7 Total 140 100
Base: 140 respondents
* The most common ‘other’ reason for Travelling was ‘a holiday’, cited by 23 of 39 respondents.
53

Table 43: Limiting long standing illness or disability by age(N.I population)
All persons aged Age group of respondent 16 and over 16-24 25-34 35-44 45-54 55-64 65+ Total
N % N % N % N % N % N % N % Limiting longstanding illness Yes No
34561
6 94
109 704
13 87
135 713
16 84
235 582
29 71
265 369
42 58
515 468
52 48
1293 3397
28 72
Total 595 100 813 100 848 100 817 100 634 100 983 100 4690 100
Health and Wellbeing Survey Base: 5000 respondents
Table 44: Limiting long standing illness or disability by age(Traveller population)
All persons Age group of respondent aged 16 16-24 25-34 35-44 45-54 55-64 65+ Refused Total and over N % N % N % N % N % N % N % N % Limitinglongstandingillness Yes No Refused
21 198
-
10 90 -
31 139
3
18 80 2
22 65 1
25 74 1
2835 -
44 56 -
21 10 -
68 32 -
8 4 -
67 33 -
-1 4
-20 80
131 452
8
22 77 1
Total 219 100 173 100 88 100 63 100 31 100 12 100 5 100 591 100
Traveller Survey Base: 316 respondents
Table 45: Limiting long standing illness or disability by gender Travellers N.I. Population
N % N % Male Yes
No Refused Total
52 193 <5
247
21 78 1
100
516 1452
-1968
26 74 -
100 Female Yes
No Refused Total
79 263 <5
344
23 77 1
100
777 1945
-2722
29 71 -
100 All Yes
No Refused
Total
131 456 <5
591
22 77 1
100
1293 3397
-
4690
28 72 -
100 Traveller Survey Base: 316 respondentsHealth and Wellbeing Survey Base: 5000 respondents
54

TRAVELLERS ACCOMMODATION NEEDS ASSESSMENT IN NORTHERN IRELAND
Table 46: Age of Household members with disability N %
5 or under 18 10 6-15 36 20 16-24 21 11 25-39 46 25 40-59 46 25 60+ 18 10 Total 185 100
Base: 140 respondents
Table 47: Tenure of all disabled household members Have a
disability No disability Refused Total
N % N % N % N % Social Housing Serviced Site Side of the road Co-operated site Privately rented home Grouped Accommodation Other
99 36 10 14 10 <5 15
19 15 6 12 17 2 17
424 203 148 99 50 41 70
81 85 94 88 83 98 78
3 -----5
1 -----6
526 239 158 113 60 42 90
100 100 100 100 100 100 100
Total 185 15 1035 84 8 1 1228 100
Base: 140 respondents
Table 48: Disability and accommodation needs Does this disability make Is your accommodation it necessary for specially Suitable for the person(s)
adapted accommodation? who have the disability? N % N %
Yes 56 40 70 50 No 80 57 69 49 Refused <5 3 <5 1 Total 140 100 140 100
Base: 140 respondents
Table 49: Are you registered with a doctor? N %
Yes 292 92 No 23 7 Refused <5 <1 Total 316 100
Base: 316 respondents
55

Table 50: Head of household main disability
N % Depression, bad nerves or anxiety 31 32 Disabilities connected with arms or hands (including arthritis or rheumatism) 20 20 Heart, blood pressure or blood circulation problems 17 17 Disabilities connected with legs or feet 10 10 Chest or breathing problems, asthma, bronchitis 6 6 Disabilities connected with back or neck 6 6 Other 8 8
Total 98 100
Base: 98 Heads of household who were disabled
Table 51: Main disability in household N %
Depression, Bad Nerves or Anxiety 47 25 Disabilities connected with arms or hands (including arthritis or rheumatism) 28 15 Chest or breathing problems, asthma, bronchitis 27 15 Heart, blood pressure or bloodcirculation problems 24 13 Disabilities connected with legs or feet 15 8 Hyperactivity 10 5 Disabilities connected with back or neck 6 3 Progressive illness not included elsewhereeg cancer, multiple sclerosis, Parkinson’sdisease, muscular dystrophy 6 3 Learning difficulties 5 3 Other 17 9
Total 185 100
140 households who had a disability/disabilities gave 185 medical conditions
56

TRAVELLERS ACCOMMODATION NEEDS ASSESSMENT IN NORTHERN IRELAND
Table 52: Main disability in household by tenure
Depression bad nerves or anxiety
Disability connected with arms/
hands
Chest or breathing problems
Heart , blood
pressure or
circulatoryproblems
Disabilities connected
with the legsor feet
Other Total
N % N % N % N % N % N % N % Serviced Site Social Housing Side of the road Privately rented Co-operated site Other
10
25
<5
<5
<5 <5
28
25
40
20
21 19
8
11
<5
<5
<5 <5
22
11
30
20
7 19
3
20
<5
-
<5 <5
8
20
10
-
7 13
<5
10
<5
-
<5 5
11
10
10
-
29 31
<5
10
<5
<5
<5 -
3
10
10
10
14 -
10
23
-
5
<5 <5
28
23
-
50
21 19
36
99
10
10
14 16
100
100
100
100
100 100
Total 47 25 28 15 27 15 24 13 15 8 44 24 185 100
Base: 140 respondents
57

LIST OF FIGURES
Figure 1 Age of Heads of Household by Gender .. .. .. 15
Figure 2 Employment Status of Heads of Household .. .. 16
Figure 3 Household Type .. .. .. .. .. .. .. 17
Figure 4 Age Gender Pyramid (Traveller population) .. .. 19
Figure 5 Age Gender Pyramid (N. Ireland population) .. .. 19
Figure 6 Current Accommodation .. .. .. .. .. 21
Figure 7 Satisfaction by Accommodation Type .. .. .. 22
Figure 8 Experience of Intimidation/Harassment by Current Tenure 28
Figure 9 Propensity to Travel by Tenure .. .. .. .. 29
Figure 10 Propensity to Travel by Age of Head of Household .. 30
Figure 11 Disability within Tenure Type .. .. .. .. .. 33
LIST OF TABLES IN TEXT
Table 1a Breakdown of Response .. .. .. .. .. 8
Table 1b Age by Gender profile of all Household Members .. 18
Table 1c Age of all Household Members by Current Accommodation 23
Table 1d Current Accommodation by Previous Accommodation 24
Table 1e Current Accommodation by Preferred Accommodation 26
Table 1f Further Comments .. .. .. .. .. .. 34
>
58

TRAVELLERS ACCOMMODATION NEEDS ASSESSMENT IN NORTHERN IRELAND
GLOSSARY OF ACCOMMODATION TYPES
Social Housing - This describes any public sector housing (Housing Executive or Housing Association).
Grouped Housing - This describes residential housing developments with additional facilities and amenities specifically designed to accommodate extended families of Travellers on a permanent basis.
Serviced Sites - This describes a range of managed accommodation where Traveller families have a permanent base to park their caravan or erect timber framed Sectional Building (sometimes known as ‘Park Home’); where electricity, water and sewerage is provided and where other facilities such as communal or individual amenity units (providing toilet, washing and daytime living arrangements) may be provided.
Co-operated Sites - This describes those sites (formerly known as Tolerated Sites) on land owned by Government Departments where Travellers are located on a temporary basis.
59

OTHER SOURCES
Continuous Tenant Omnibus Survey 2001/02 (Housing Executive) Northern Ireland Housing Statistics 2001/02 DSD (NISRA) Northern Ireland Census 2002 Population Report (NISRA)
Northern Ireland Traveller Census 1993 (DOE) Ethnic Minorities Northern Ireland (Irwin and Dunn 1997)
Consultation on the Final Report of the PSI Working Group on Travellers 2000
RELEVANT LEGISLATION Northern Ireland Act 1998
Race Relations (N.I.) Order 1997
> ACKNOWLEDGEMENTS
The Housing Executive’s Research Unit wishes to acknowledge the contribution of all those who were involved in the Travellers Accommodation Needs Assessment in Northern Ireland (2002), particularly the following:
The Traveller Community who participated in the survey, whose goodwill, patience and co-operation made the survey possible;
The fieldwork team who brought valuable expertise and professionalism to the data collection stage of the survey;
The Travellers Accommodation Needs Steering Group who provided valuable advice and guidance on the design and conduct of the survey;
The Housing Executive’s Visual Communications staff for designing the published report.
Production Team:
Author Paddy Finucane
Fieldwork Staff Veronica McEneaney Joan Finn Kate O’Loughlin Kevin Devlin Aengus Hannaway
60