Embed Size (px)
Citation preview

Month End
Market Value ($)*
Month End Book
Value ($)
Paper Gain or
Loss ($)
Paper Gain
or Loss (%)
Book
Yield (%)
Yrs to
Maturity
Modified
Duration
April 5,582,276,144.63 5,577,075,042.55 5,201,102.08 0.09 0.37 1.20 1.18
March 5,129,896,695.89 5,125,734,196.18 4,162,499.71 0.08 0.37 1.21 1.20
February 4,898,119,579.11 4,893,898,502.93 4,221,076.18 0.09 0.38 1.20 1.18
January 5,090,799,909.66 5,086,685,931.93 4,113,977.73 0.08 0.37 1.24 1.23
December 5,999,501,448.83 5,993,822,631.12 5,678,817.71 0.09 0.32 1.01 1.00
November 5,060,842,259.48 5,054,763,131.75 6,079,127.73 0.12 0.39 1.11 1.09
County of Riverside Treasurer’s Pooled Investment Fund
“April Showers May Bring Flowers”
With the automatic federal spending cuts (sequestration) kicking in on March 1st as well as nega-tive economic reports recently on retail sales, factory production and household spending, all are seemingly pointing to a slowdown in economic growth in the near term. If Congress takes no action, federal spending will be reduced by $85 billion this year and over $1.2 trillion over the next nine years. This will ensure that lowered government spending will remain a drag on growth as spending at the federal and local levels is cut back to a more sustainable amount.
In addition, consumers are also contending with the two-percentage point increase in the payroll tax that took effect in January. These two factors are contrib-uting to a drop in retail sales in March and April, which was the most in nine months. Manufacturing is also showing signs of weakness with the ISM factory index falling to 50.7 in April from the prior month’s 51.3 reading; anything below 50 usually is a sign of contraction in the economy.
There is a silver lining, however, and that is unemploy-ment and housing. Nonfarm payrolls rose in both March and April and the national unemployment rate dropped to 7.6% from 7.7%, with further declines like-ly. The unemployment rate is still above 10% here in the I.E. but has come down from above 14% at its worst point. Housing is our other bright spot as the Fed’s open market bond purchases of $85 billion per month continue to push down rates to record lows making mortgages more affordable to the home buying public. Also, the S&P/Case-Shiller index of home values in 20
cities surged 9.3% in February from a year earlier, the most since May 2006.
A drop in available home inventory is leading to price increases in most areas around the country, with the Inland Empire leading the pack; according to Data Quick, these factors have increased the median home price in Riverside County year-over-year by 22.5% to $245,000 from $200,000 last year. This price apprecia-tion will likely compel the Assessor to increase the assessed value of the county on the whole by 3% or more for the coming 2013 - 2014 fiscal year, with resi-dential real estate being the leading contributing factor. We will know more about those details in early to mid-July after their review is complete. The increasing demand for new homes is also resulting in an increase in housing starts.
The Eurozone will continue to be a problem for some time to come, but the issue that will come back to haunt us here in the U.S. at some point is the massive boost in liquidity and central bank money printing activity that has continued since the Great Recession of 2008. Never before in our history have we seen such a high degree, and at some point, it will stop. The point of time in which it does will indicate the Fed has met their target rate on unemployment of 6.5% or less, and that infla-tionary pressure is building. It will likely not be a perfect intersection of the lines on a chart, however, so stay tuned as there promises to be much more on that subject.
Don Kent
Treasurer-Tax Collector
RIVERSIDE COUNTY TREASURER’S POOLED INVESTMENT FUND IS CURRENTLY RATED: Aaa-bf BY MOODY’S INVESTOR’S SERVICE AND AAA/V1 BY FITCH RATINGS
T h e T r e a s u r e r ' s P o o l e d I n v e s t m e n t F u n d i s c o m p r i s e d o f t h e C o u n t y , S c h o o l s , S p e c i a l D i s t r i c t s , a n d o t h e r D i s c r e t i o n a r y D e p o s i t o r s .
2 0 1 3 April
C a p i t a l M a r k e t s T e a m
I n v e s t m e n t O b j e c t i v e s
Don Kent Treasurer-Tax Collector
Jon Christensen Asst. Treasurer-Tax Collector
Giovane Pizano Investment Manager
Erika Clark Asst. Investment Manager
The primary objective
of the treasurer shall be to safeguard
the principal of the funds under the
treasurer's control, meet the liquidi-
ty needs of the depositor, and
achieve a return on the funds under
his or her control.


Release Date Indicator Consensus Actual
04/05/2013 193,000 88,000
04/05/2013 7.7% 7.6%
04/24/2013 -2.8% -5.7%
04/26/2013 3.1% 2.5%
04/30/2013 62.0 68.1
04/02/2013 2.9% 3.0%
04/16/2013 0.0% -0.2%Consumer Price Index - M/M change: The Consumer Price Index is a measure of the
average price level of a fixed basket of goods and services purchased by consumers.
Non-Farm Payrolls M/M change: Counts the number of paid employees working part-
time or full-time in the nation's business and government establishments.
Employment Situation: Measures the number of unemployed as a percentage of the
labor force.
Durable Goods Orders - M/M change: Reflects the new orders placed with domestic
manufacturers for immediate and future delivery of factory hard goods.
Real Gross Domestic Product - Q/Q change: The broadest measure of aggregate
economic activity and encompasses every sector of the economy. GDP is the country's most comprehensive economic scorecard.
Consumer Confidence: Measures consumer attitudes on present economic conditions
and expectations of future conditions.
Factory Orders M/M change: Represents the dollar level of new orders for both
durable and nondurable goods.
Value Change
Nymex Crude 93.46$ (3.77)$
Gold (USD/OZ) 1,476.75$ (122.00)$
Value Change
Dow Jones (DJIA) 14,839.80 261.26
S&P 500 Index 1,597.57 28.38
NASDAQ (NDX) 3,328.79 61.27
Fed Move 05/01/2013 06/19/2013
Decrease to 0.00% 52.0% 52.0%
Increase to 0.25% 48.0% 48.0%
Increase to 0.50% 0.0% 0.0%
Increase to 0.75% 0.0% 0.0%
Increase to 1% 0.0% 0.0%
Current Fed Funds Rate: 0-0.25%
Probability for FOMC Dates:
Current Market Data Economic Indicators
Stock Indices
Commodities
Fed Funds Target Rate
RIVERSIDE COUNTY TREASURER-TAX COLLECTOR 2
US Treasury Curve (M/M)

Month Monthly Receipts
Monthly Disbursements Difference
Required Matured
Investments Balance
Actual Investments
Maturing
Available to Invest >
1 Year 05/2013 150.73 05/2013 663.29 1,199.59 (536.30) 385.57 - 1,246.9906/2013 589.54 1,114.19 (524.65) 524.65 - 367.6307/2013 868.06 913.40 (45.34) 45.34 - 292.9908/2013 668.62 717.29 (48.67) 48.67 - 202.5009/2013 675.66 752.21 (76.55) 76.55 - 215.0010/2013 665.00 801.26 (136.26) 136.26 - 285.0011/2013 862.54 710.00 152.54 152.54 104.6012/2013 1,539.11 813.41 725.70 878.24 105.1001/2014 676.58 1,293.98 (617.40) 260.84 365.0002/2014 560.00 820.00 (260.00) 0.84 250.0003/2014 839.70 820.45 19.25 20.09 65.0004/2014 1,320.00 738.06 581.94 602.03 127.11TOTALS 9,928.10 10,693.84 (765.74) 1,217.04 3,626.92 4,360.04
21.82% 65.03% 78.18%* All values reported in millions ($).
Fund Symbol 7 Day YieldFidelity Prime Institutional MMF FIPXX 0.10%Federated Prime Obligations Fund POIXX 0.07%Wells Fargo Advantage Heritage WFJXX 0.11%Morgan Stanley Institutional Prime Liquidity Fund MPFXX 0.09%BlackRock Prime Cash Fund BPIXX 0.13%
AAA Rated Prime Institutional Money-Market Funds
0.44% 0.46% 0.45% 0.42% 0.42% 0.42% 0.43%0.32% 0.37% 0.38% 0.38% 0.37%
0.17% 0.16% 0.17% 0.16% 0.16% 0.17% 0.16% 0.14% 0.11% 0.12% 0.11% 0.10%
0.00%
0.20%
0.40%
0.60%
0.80%
1.00%
Apr-12 Jun-12 Aug-12 Oct-12 Dec-12 Feb-13 Apr-13
Pool YieldTIMMI
The Pooled Investment Fund cash flow requirements are based upon a 12 month historical cash flow model. Based upon projected cash receipts and maturing investments, there are sufficient funds to meet future cash flow disbursements over the next 12 months.
The Treasurer’s Institutional Money Market Index (TIMMI) is compiled and reported by the Riverside County Treasurer’s Capital Markets division. It is a composite index derived from five AAA rated prime institutional money market funds. Similar to the Treas-urer’s Office, prime money market funds invest in a diversified portfolio of U.S. dollar denominated money market instruments in-cluding U.S. Treasuries, government agencies, commercial paper, certificates of deposits, repurchase agreements, etc. TIMMI is cur-rently comprised of the five multi billion dollar funds listed below.
TIMMI
RIVERSIDE COUNTY TREASURER-TAX COLLECTOR 3
Cash Flows

Scheduled Par Scheduled Book Mkt/ Sch Book Yield WAL (Yr) Mat (Yr)
300,000.00 300,000.00 300,000.00 100.00% 0.10% .013 .013270,000.00 270,000.00
54,000.00 54,000.00 54,000.00 100.00% 0.31% .003 .00380,000.00 80,000.00 80,000.00 100.00% 0.08% .003 .003
510.00 510.00 510.00 100.00% 0.87% 7.132 7.132645,000.00 645,187.11 645,545.90 100.06% 0.21% .735 .735
75,000.00 74,939.28 74,972.00 100.04% 0.13% .452 .452523,725.00 523,656.99 525,069.14 100.27% 0.54% 1.134 1.695
25,000.00 24,961.50 24,998.25 100.15% 0.18% .170 .1701,010,492.00 1,010,820.48 1,012,777.73 100.19% 0.70% .782 3.278
40,000.00 39,924.42 39,991.07 100.17% 0.19% .370 .3701,338,435.00 1,338,616.70 1,339,482.57 100.06% 0.37% .453 .799
35,000.00 34,962.42 34,988.25 100.07% 0.15% .443 .443393,895.00 393,966.19 394,249.09 100.07% 0.33% 1.015 1.040192,218.00 192,203.39 192,341.66 100.07% 0.41% .739 1.808
55,320.00 55,443.52 55,443.52 100.00% 0.44% .498 .498338,000.00 337,876.56 337,900.47 100.01% 0.13% .132 .132200,000.00 200,006.49 200,006.49 100.00% 0.17% .122 .122
5,576,595.00 5,577,075.04 5,582,276.14 100.09% 0.37% 0.570 1.197Totals (000's):
FFCB DISC NOTES
FFCB BONDS
FHLB DISC NOTES
FHLB BONDS
FNMA DISC NOTES
FNMA BONDS
NCDS
MUNI BONDS
COMM PAPER
Assets (000's)
Scheduled
Market
FHLMC DISC NOTES
FHLMC BONDS
LOCAL AGCY OBLIG
US TREAS BONDS
CALTRUST FND
DDA/PASSBK
REPOS
FARMER MAC
100.00% 0.11% .003 .003MMKT 270,000.00
Asset Allocation
RIVERSIDE COUNTY TREASURER-TAX COLLECTOR 4

Maturity Distribution
Scheduled Par (000's) 0-1 Mos 1-3 Mos 3-12 Mos 1-2 Yr 2-3 Yr >3 Yr Totals (000's)
REPOS 300,000.00 - - - - - 300,000.00 MMKT 270,000.00 - - - - - 270,000.00 CALTRUST FND 54,000.00 - - - - - 54,000.00 DDA/PASSBK 80,000.00 - - - - - 80,000.00 LOCAL AGCY OBLIG - - - - - 510.00 510.00 US TREAS BONDS - - 505,000.00 140,000.00 - - 645,000.00 FHLMC DISC NOTES - - 75,000.00 - - - 75,000.00 FHLMC BONDS - - 218,100.00 85,000.00 171,000.00 49,625.00 523,725.00 FNMA DISC NOTES - 25,000.00 - - - - 25,000.00 FNMA BONDS - - 130,000.00 55,000.00 236,850.00 588,642.00 1,010,492.00 FHLB DISC NOTES - - 40,000.00 - - - 40,000.00 FHLB BONDS 254,500.00 273,085.00 536,500.00 115,000.00 89,250.00 70,100.00 1,338,435.00 FFCB DISC NOTES - - 35,000.00 - - - 35,000.00 FFCB BONDS - 42,900.00 120,995.00 190,000.00 40,000.00 - 393,895.00 FARMER MAC 22,500.00 - 50,000.00 50,000.00 33,718.00 36,000.00 192,218.00 MUNI BONDS 15,990.00 11,630.00 23,700.00 4,000.00 - - 55,320.00 COMM PAPER 100,000.00 213,000.00 25,000.00 - - - 338,000.00 NCDS 50,000.00 150,000.00 - - - - 200,000.00 Totals (000's): 1,146,990.00 715,615.00 1,759,295.00 639,000.00 570,818.00 744,877.00 5,576,595.00
% 20.57% 12.83% 31.55% 11.46% 10.24% 13.36%
Cumulative % 20.57% 33.40% 64.95% 76.41% 86.64% 100.00%
RIVERSIDE COUNTY TREASURER-TAX COLLECTOR 5

Credit Quality
0.40%
5,577,075.05 5,582,276.14
Aa1 157,146.49
291,901.00
572,851.66
100.09%5,576,595.00
572,728.00
100.00%
4,528,812.00
157,140.00
100.11%
100.00%
157,146.49
15,915.00 16,038.52 16,038.52
Aa 10,000.00
Aa2
4,529,294.24
Totals (000's):
Aa3 291,884.56
572,713.39
292,000.00
0.37%
NR 100.02% 0.21%
YieldAaa
Moody (000's) Par Book Market MKT/Book
4,534,313.02
100.01% 0.16%
9,997.85 10,025.45 100.28% 0.62%
0.41%
0.21%
MOODY’S S & P
S&P (000's)AAA
AA+
AA
AA- 307,285.00 307,263.96
NR
Totals (000's):
Par Book Market MKT/Book Yield
787,500.00 788,406.05
3,897,332.08 100.11% 0.39%
307,242.71 99.99% 0.16%
15,630.00 15,753.52 15,753.52 100.00% 0.43%
789,096.17 100.09% 0.47%
3,893,452.00 3,892,938.11
572,728.00 572,713.39 572,851.66 100.02% 0.21%
5,576,595.00 5,577,075.04 5,582,276.14 100.09% 0.37%
RIVERSIDE COUNTY TREASURER-TAX COLLECTOR 6


DescriptionMaturity
Date Coupon Par
Value BookValue
MarketPrice
MarketValue
UnrealizedGain/Loss
WELLS FARGO TRI 05/01/2013 .090 100,000,000.00 100,000,000.00 100.00 100,000,000.00 0.00UBS TRI PARTY REPO 05/06/2013 .100 100,000,000.00 100,000,000.00 100.00 100,000,000.00 0.00
WELLS FARGO TRI 05/07/2013 .120 100,000,000.00 100,000,000.00 100.00 100,000,000.00 0.00.103 300,000,000.00 300,000,000.00 100.00 300,000,000.00 0.00
FEDERATED GOV 05/01/2013 .010 5,000,000.00 5,000,000.00 100.00 5,000,000.00 0.00MORGAN STANLEY GOV 05/01/2013 .050 5,000,000.00 5,000,000.00 100.00 5,000,000.00 0.00BLACKROCK PRIME 05/01/2013 .134 5,000,000.00 5,000,000.00 100.00 5,000,000.00 0.00
CALTRUST HERITAGE 05/01/2013 .115 105,000,000.00 105,000,000.00 100.00 105,000,000.00 0.00FIDELITY PRIME 05/01/2013 .101 100,000,000.00 100,000,000.00 100.00 100,000,000.00 0.00FEDERATED PRIME 05/01/2013 .082 50,000,000.00 50,000,000.00 100.00 50,000,000.00 0.00
.101 270,000,000.00 270,000,000.00 100.00 270,000,000.00 0.00
CALTRUST SHT TERM 05/01/2013 .300 54,000,000.00 54,000,000.00 100.00 54,000,000.00 0.00.300 54,000,000.00 54,000,000.00 100.00 54,000,000.00 0.00
UB MANAGED RATE 05/01/2013 .082 80,000,000.00 80,000,000.00 100.00 80,000,000.00 0.00.082 80,000,000.00 80,000,000.00 100.00 80,000,000.00 0.00
US DIST COURTHOUSE 06/15/2020 .874 510,000.00 510,000.00 100.00 510,000.00 0.00.874 510,000.00 510,000.00 100.00 510,000.00 0.00
U.S. TREASURY BOND 07/31/2013 .375 25,000,000.00 25,033,200.00 100.08 25,019,500.00 -13,700.00U.S. TREASURY BOND 09/30/2013 .125 20,000,000.00 19,983,593.75 100.02 20,003,200.00 19,606.25U.S. TREASURY BOND 09/30/2013 .125 20,000,000.00 19,983,593.75 100.02 20,003,200.00 19,606.25U.S. TREASURY BOND 09/30/2013 .125 10,000,000.00 9,992,578.13 100.02 10,001,600.00 9,021.87U.S. TREASURY BOND 01/31/2014 .250 25,000,000.00 25,008,789.06 100.09 25,023,500.00 14,710.94U.S. TREASURY BOND 01/31/2014 .250 25,000,000.00 25,009,765.63 100.09 25,023,500.00 13,734.37U.S. TREASURY BOND 10/31/2013 .250 25,000,000.00 25,010,742.19 100.08 25,019,500.00 8,757.81U.S. TREASURY BOND 02/28/2014 .250 25,000,000.00 25,006,835.95 100.10 25,024,500.00 17,664.05U.S. TREASURY BOND 01/31/2014 .250 25,000,000.00 25,013,671.88 100.09 25,023,500.00 9,828.12U.S. TREASURY BOND 01/31/2014 .250 25,000,000.00 25,004,882.81 100.09 25,023,500.00 18,617.19U.S. TREASURY BOND 02/28/2014 .250 25,000,000.00 25,004,882.81 100.10 25,024,500.00 19,617.19U.S. TREASURY BOND 02/28/2014 .250 25,000,000.00 25,001,953.13 100.10 25,024,500.00 22,546.87U.S. TREASURY BOND 11/30/2013 .250 25,000,000.00 25,010,742.19 100.09 25,022,500.00 11,757.81U.S. TREASURY BOND 10/31/2013 .250 25,000,000.00 25,013,671.88 100.08 25,019,500.00 5,828.12
U.S. TREASURY BOND 11/30/2013 .250 10,000,000.00 10,005,078.13 100.09 10,009,000.00 3,921.87U.S. TREASURY BOND 05/31/2014 .250 20,000,000.00 19,998,437.50 100.11 20,021,800.00 23,362.50U.S. TREASURY BOND 06/30/2014 .250 20,000,000.00 20,002,343.75 100.11 20,021,800.00 19,456.25U.S. TREASURY BOND 02/28/2014 .250 25,000,000.00 25,008,787.89 100.10 25,024,500.00 15,712.11U.S. TREASURY BOND 05/31/2014 .250 25,000,000.00 25,007,812.50 100.11 25,027,250.00 19,437.50
U.S. TREASURY BOND 06/30/2014 .250 25,000,000.00 25,005,859.38 100.11 25,027,250.00 21,390.62U.S. TREASURY BOND 06/30/2014 .250 25,000,000.00 25,004,882.81 100.11 25,027,250.00 22,367.19U.S. TREASURY BOND 01/31/2014 .250 30,000,000.00 30,018,750.00 100.09 30,028,200.00 9,450.00U.S. TREASURY BOND 02/28/2014 .250 20,000,000.00 20,012,500.00 100.10 20,019,600.00 7,100.00U.S. TREASURY BOND 09/30/2013 .125 30,000,000.00 29,991,796.88 100.02 30,004,800.00 13,003.12U.S. TREASURY BOND 10/31/2013 .250 25,000,000.00 25,018,554.69 100.08 25,019,500.00 945.31U.S. TREASURY BOND 05/31/2014 .250 25,000,000.00 25,006,835.94 100.11 25,027,250.00 20,414.06U.S. TREASURY BOND 10/31/2013 .250 20,000,000.00 20,014,062.50 100.08 20,015,600.00 1,537.50U.S. TREASURY BOND 10/31/2013 .250 20,000,000.00 20,012,500.00 100.08 20,015,600.00 3,100.00
.239 645,000,000.00 645,187,105.13 100.08 645,545,900.00 358,794.87
FHLMC 01/14/2014 .160 25,000,000.00 24,965,777.78 99.93 24,982,000.00 16,222.22FHLMC 08/26/2013 .120 50,000,000.00 49,973,500.00 99.98 49,990,000.00 16,500.00
.133 75,000,000.00 74,939,277.78 99.96 74,972,000.00 32,722.22
FHLMC 3Yr 10/28/2013 .875 5,000,000.00 4,990,300.00 100.37 5,018,350.00 28,050.00FHLMC 3.5YrNc6MoE 03/03/2014 1.250 5,000,000.00 5,000,000.00 100.80 5,039,750.00 39,750.00FHLMC 3Yr 02/25/2014 1.375 5,000,000.00 5,000,000.00 101.00 5,050,000.00 50,000.00FHLMC 3Yr 02/25/2014 1.375 10,000,000.00 9,973,100.00 101.00 10,100,000.00 126,900.00FHLMC 3Yr 04/29/2014 1.350 5,000,000.00 5,027,800.00 101.18 5,059,100.00 31,300.00FHLMC 3Yr 10/28/2013 .875 11,000,000.00 11,022,330.00 100.37 11,040,370.00 18,040.00FHLMC 2.25Yr 08/13/2013 .875 5,000,000.00 5,028,775.00 100.19 5,009,700.00 -19,075.00FHLMC 2Yr 10/15/2013 .375 15,000,000.00 14,967,300.00 100.12 15,017,400.00 50,100.00FHLMC 2Yr 11/27/2013 .375 10,000,000.00 9,958,700.00 100.14 10,014,000.00 55,300.00FHLMC 2Yr 12/23/2013 .625 10,000,000.00 9,999,800.00 100.29 10,029,400.00 29,600.00FHLMC 3.5YrNc2YrE 06/30/2015 1.000 5,000,000.00 5,000,000.00 100.54 5,026,950.00 26,950.00FHLMC 3.5YrNc2YrE 06/30/2015 1.000 5,000,000.00 5,000,000.00 100.48 5,023,950.00 23,950.00FHLMC 1.5Yr 10/15/2013 .375 5,000,000.00 4,997,700.00 100.12 5,005,800.00 8,100.00FHLMC 2Yr 02/27/2014 .375 10,000,000.00 9,996,000.00 100.19 10,018,500.00 22,500.00FHLMC 3.5YrNc2YrE 08/28/2015 .650 5,000,000.00 5,000,000.00 100.41 5,020,450.00 20,450.00FHLMC 3.5YrNc2YrE 08/28/2015 .650 5,000,000.00 5,000,000.00 100.41 5,020,450.00 20,450.00FHLMC 3YrNc2YrE 02/24/2015 .500 5,000,000.00 4,988,000.00 100.17 5,008,600.00 20,600.00FHLMC 3YrNc2YrE 02/27/2015 .550 5,000,000.00 4,993,500.00 100.30 5,015,000.00 21,500.00FHLMC 2Yr 03/21/2014 .300 10,000,000.00 9,984,000.00 100.17 10,016,900.00 32,900.00FHLMC 3YrNc2YrE 03/06/2015 .625 5,000,000.00 5,000,000.00 100.37 5,018,650.00 18,650.00FHLMC 3YrNc2YrE 03/06/2015 .625 5,000,000.00 5,000,000.00 100.37 5,018,650.00 18,650.00FHLMC 3YrNc2YrE 03/12/2015 .650 10,000,000.00 10,000,000.00 100.40 10,040,200.00 40,200.00FHLMC 3YrNc2YrE 03/06/2015 .625 5,000,000.00 4,999,500.00 100.37 5,018,650.00 19,150.00FHLMC 2Yr 04/28/2014 .375 5,000,000.00 4,994,400.00 100.21 5,010,700.00 16,300.00FHLMC 19Mo 10/15/2013 .375 5,000,000.00 5,004,183.00 100.12 5,005,800.00 1,617.00FHLMC 2.16Yr 04/28/2014 .375 5,000,000.00 4,991,050.00 100.21 5,010,700.00 19,650.00FHLMC 3Yr 01/30/2015 .650 5,000,000.00 4,998,250.00 100.33 5,016,700.00 18,450.00FHLMC 3.5YrNc2YrB 09/28/2015 .900 5,000,000.00 5,000,000.00 100.64 5,031,900.00 31,900.00FHLMC 2Yr 04/28/2014 .375 10,000,000.00 9,972,500.00 100.21 10,021,400.00 48,900.00FHLMC 2Yr 04/28/2014 .375 5,000,000.00 4,993,250.00 100.21 5,010,700.00 17,450.00FHLMC 2Yr 04/28/2014 .375 5,000,000.00 4,992,015.05 100.21 5,010,700.00 18,684.95FHLMC 2Yr 04/28/2014 .375 12,000,000.00 11,984,880.00 100.21 12,025,680.00 40,800.00FHLMC 3YrNc1YrE 05/22/2015 .600 5,000,000.00 5,000,000.00 100.03 5,001,250.00 1,250.00FHLMC 2Yr 03/21/2014 .300 10,000,000.00 9,992,000.00 100.17 10,016,900.00 24,900.00FHLMC 2Yr 10/30/2013 .375 10,000,000.00 10,007,600.00 100.12 10,011,700.00 4,100.00FHLMC 2Yr 10/30/2013 .375 10,000,000.00 10,007,200.00 100.12 10,011,700.00 4,500.00
CUSIP
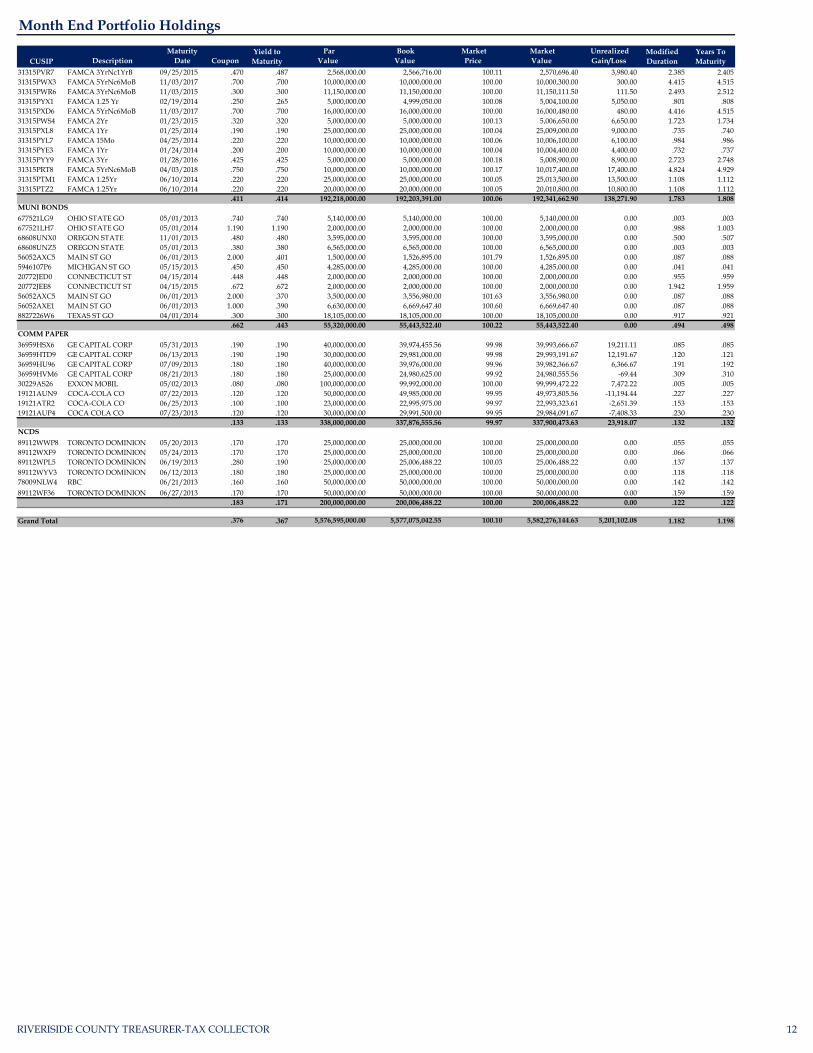
Month End Portfolio Holdings
Yield to Maturity
ModifiedDuration
Years ToMaturity
3137EACX5 .320 .500 .501
3134G3NS5 .345 .889 .8903137EACX5 .318 .500 .501
3134G3SB7 .437 .991 .9953134G3UU2 .600 2.040 2.060
3134G3SB7 .440 .991 .9953134G3SB7 .452 .991 .995
3134G3TL4 .900 2.378 2.4143134G3SB7 .509 .991 .995
3134G3SB7 .460 .991 .9953134G3JX9 .662 1.735 1.753
3134G3SB7 .427 .991 .9953134G2U42 .323 .459 .460
3134G3RP7 .650 1.851 1.8663134G3QW3 .628 1.835 1.849
3134G3QW3 .625 1.835 1.8493134G3QW3 .625 1.835 1.849
3134G3PD6 .594 1.811 1.8303134G3NS5 .378 .889 .890
3134G3MY3 .650 2.304 2.3293134G3NL0 .581 1.804 1.822
3134G3LA6 .394 .822 .8303134G3MY3 .650 2.304 2.329
3134G3EN6 1.000 2.131 2.1673134G2U42 .400 .459 .460
3134G3BF6 .626 .644 .6493134G3EB2 1.000 2.131 2.167
3134G2U42 .483 .459 .4603137EACZ0 .580 .572 .578
3137EACL1 .790 .494 .4963134G2FT4 .611 .287 .288
3137EACR8 1.465 .810 .8253134G2CL4 1.160 .988 .997
3134G1SG0 1.250 .833 .8413137EACR8 1.375 .810 .825
FHLMC BONDS
3137EACL1 .937 .493 .496
313397KX8 .120 .323 .323.133 .451 .452
FHLMC DISC NOTES
313397RU7 .160 .708 .710
912828RN2 .160 .503 .504.212 .732 .735
912828SW1 .230 1.080 1.085912828RN2 .157 .503 .504
912828RK8 .161 .419 .419912828RN2 .156 .503 .504
912828SB7 .195 .749 .756912828SG6 .198 .832 .833
912828TA8 .235 1.163 1.167912828TA8 .237 1.163 1.167
912828SG6 .222 .832 .833912828SW1 .229 1.080 1.085
912828SW1 .255 1.080 1.085912828TA8 .243 1.163 1.167
912828RN2 .192 .503 .504
912828RS1 .200 .582 .586
912828SG6 .244 .832 .833912828RS1 .209 .582 .586
912828SB7 .235 .748 .756912828SG6 .236 .832 .833
912828SG6 .231 .832 .833912828SB7 .209 .749 .756
912828SB7 .222 .749 .756912828RN2 .211 .503 .504
912828RK8 .189 .418 .419912828SB7 .225 .749 .756
912828RK8 .196 .418 .419912828RK8 .196 .418 .419
US TREAS BONDS
912828QW3 .251 .252 .252
LAO .874 3.596 7.132.874 3.596 7.132
.082 .003 .003LOCAL AGCY OBLIG
DDA/PASSBK
CASH .082 .003 .003
CLTR .300 .003 .003.300 .003 .003
.101 .003 .003CALTRUST FND
FIPXX .101 .003 .003POIXX .082 .003 .003
BPIXX .134 .003 .003
WFJXX .115 .003 .003
GOIXX .010 .003 .003MVRXX .050 .003 .003
.103 .013 .013MMKT
REPO .100 .016 .016
REPO .120 .019 .019
REPOS
REPO-WFF .090 .003 .003
RIVERISIDE COUNTY TREASURER-TAX COLLECTOR 7

DescriptionMaturity
Date Coupon Par
Value BookValue
MarketPrice
MarketValue
UnrealizedGain/Loss CUSIP
Month End Portfolio Holdings
Yield to Maturity
ModifiedDuration
Years ToMaturity
FHLMC 2Yr 02/27/2014 .375 10,000,000.00 10,011,600.00 100.19 10,018,500.00 6,900.00FHLMC 3.25Yr 08/28/2015 .500 15,000,000.00 15,000,000.00 100.38 15,057,000.00 57,000.00FHLMC 3.25Yr 08/28/2015 .500 15,000,000.00 14,997,150.00 100.38 15,057,000.00 59,850.00FHLMC 3.25Yr 08/28/2015 .500 15,000,000.00 14,991,300.00 100.38 15,057,000.00 65,700.00FHLMC 2.25Yr 12/05/2014 .350 10,000,000.00 10,000,000.00 100.19 10,018,500.00 18,500.00FHLMC 3YrNc1YrE 09/25/2015 .500 10,000,000.00 10,000,000.00 100.11 10,010,600.00 10,600.00FHLMC 3YrNc1YrE 09/25/2015 .500 10,000,000.00 10,000,000.00 100.11 10,010,600.00 10,600.00FHLMC 2Yr 12/05/2014 .350 5,000,000.00 5,001,182.30 100.19 5,009,250.00 8,067.70FHLMC 14 Mo 12/23/2013 .625 10,100,000.00 10,146,965.00 100.29 10,129,694.00 -17,271.00FHLMC 2Yr 12/05/2014 .350 10,000,000.00 10,001,900.00 100.19 10,018,500.00 16,600.00FHLMC 4Yr 11/01/2016 .625 10,000,000.00 9,991,200.00 100.39 10,039,300.00 48,100.00FHLMC 3YrNc6MoE 11/20/2015 .530 5,000,000.00 5,000,000.00 100.02 5,001,000.00 1,000.00FHLMC 2YrNc1YrE 11/26/2014 .350 5,000,000.00 5,000,000.00 100.06 5,003,150.00 3,150.00FHLMC 2YrNc1YrE 11/26/2014 .350 5,000,000.00 5,000,000.00 100.06 5,003,150.00 3,150.00FHLMC 3YrNc1YrE 11/27/2015 .500 5,000,000.00 5,000,000.00 100.12 5,006,000.00 6,000.00FHLMC 3YrNc1YrE 11/27/2015 .500 5,000,000.00 5,000,000.00 100.12 5,006,000.00 6,000.00FHLMC 2Yr 12/03/2014 .320 5,000,000.00 5,000,000.00 100.14 5,006,900.00 6,900.00FHLMC 2Yr 12/05/2014 .350 5,000,000.00 5,002,995.00 100.19 5,009,250.00 6,255.00FHLMC 10Mo 10/30/2013 .375 15,000,000.00 15,023,565.00 100.12 15,017,550.00 -6,015.00FHLMC 3YrNc1YrB 01/15/2016 .500 5,000,000.00 5,000,000.00 100.13 5,006,650.00 6,650.00FHLMC 3YrNc2YrB 01/28/2016 .500 5,000,000.00 5,000,000.00 100.12 5,005,850.00 5,850.00FHLMC 3YrNc2YrB 01/28/2016 .500 5,000,000.00 5,000,000.00 100.12 5,005,850.00 5,850.00FHLMC 3YrNc2YrE 01/28/2016 .500 5,000,000.00 5,000,000.00 100.12 5,005,850.00 5,850.00FHLMC 3YrNc2YrB 01/28/2016 .500 5,000,000.00 5,000,000.00 100.12 5,005,850.00 5,850.00FHLMC 3YrNc2YrB 01/28/2016 .500 5,000,000.00 5,000,000.00 100.12 5,005,850.00 5,850.00FHLMC 3YrNc2YrB 01/28/2016 .500 10,000,000.00 9,998,000.00 100.12 10,011,700.00 13,700.00FHLMC 3YrNc2YrE 01/28/2016 .500 6,000,000.00 5,998,800.00 100.12 6,007,020.00 8,220.00FHLMC 3YrNc1YrE 01/15/2016 .450 5,000,000.00 5,000,000.00 100.11 5,005,250.00 5,250.00FHLMC 4Yr 11/01/2016 .625 4,625,000.00 4,629,301.25 100.39 4,643,176.25 13,875.00FHLMC 3YrNc6MoB 03/28/2016 .600 5,000,000.00 5,000,000.00 100.10 5,005,000.00 5,000.00FHLMC 3.5YrNc3MoB 09/14/2016 .650 5,000,000.00 5,000,000.00 100.06 5,002,850.00 2,850.00FHLMC 2.5YrNc3MoB 09/14/2015 .500 5,000,000.00 5,000,000.00 100.03 5,001,550.00 1,550.00FHLMC 3YrNc3MoB 09/14/2016 .650 5,000,000.00 4,999,000.00 100.06 5,002,850.00 3,850.00FHLMC 3.5YrNc3MoB 09/14/2016 .650 5,000,000.00 5,000,000.00 100.06 5,002,850.00 2,850.00FHLMC 3Yr 05/13/2016 .500 10,000,000.00 9,999,900.00 100.28 10,027,700.00 27,800.00FHLMC 3Yr 05/13/2016 .500 5,000,000.00 5,000,000.00 100.28 5,013,850.00 13,850.00FHLMC 3Yr 05/13/2016 .500 5,000,000.00 5,000,000.00 100.28 5,013,850.00 13,850.00
.542 523,725,000.00 523,656,991.60 100.26 525,069,140.25 1,412,148.65
FNMA DISC NOTE 07/01/2013 .180 25,000,000.00 24,961,500.00 99.99 24,998,250.00 36,750.00.180 25,000,000.00 24,961,500.00 99.99 24,998,250.00 36,750.00
FNMA 3YrNc6MoE 09/03/2013 1.050 5,000,000.00 4,998,750.00 100.28 5,013,850.00 15,100.00FNMA 3YrNc6MoE 09/09/2013 1.050 5,000,000.00 5,000,000.00 100.33 5,016,700.00 16,700.00FNMA 3YrNc6MoE 09/09/2013 1.050 5,000,000.00 5,000,000.00 100.33 5,016,700.00 16,700.00FNMA 3YrNc6MoE 09/09/2013 1.050 5,000,000.00 5,000,000.00 100.33 5,016,700.00 16,700.00FNMA 3YrNc6MoE 09/09/2013 1.050 5,000,000.00 4,995,000.00 100.33 5,016,700.00 21,700.00FNMA 3YrNc6MoE 09/09/2013 1.050 5,000,000.00 5,000,000.00 100.33 5,016,700.00 16,700.00FNMA 3.25YrNc6MoE 12/17/2013 1.125 5,000,000.00 4,997,500.00 100.62 5,031,000.00 33,500.00FNMA 3.5YrNc6MoE 03/21/2014 1.350 5,000,000.00 5,000,000.00 101.07 5,053,250.00 53,250.00FNMA 3YrNc6MoE 10/08/2013 1.125 5,000,000.00 5,000,000.00 100.44 5,022,000.00 22,000.00FNMA 3YrNc6MoE 10/08/2013 1.125 5,000,000.00 5,000,000.00 100.44 5,022,000.00 22,000.00FNMA 3YrNc6MoE 10/08/2013 1.125 5,000,000.00 5,000,000.00 100.44 5,022,000.00 22,000.00FNMA 3YrNc6MoE 11/19/2013 .800 10,000,000.00 10,000,000.00 100.30 10,030,200.00 30,200.00
FNMA 3YrNc6MoE 11/19/2013 .800 5,000,000.00 5,000,000.00 100.30 5,015,100.00 15,100.00FNMA 5Yr 02/04/2016 .328 10,000,000.00 9,990,000.00 100.10 10,010,200.00 20,200.00FNMA 4Yr 03/14/2014 1.250 5,000,000.00 4,996,000.00 100.96 5,047,750.00 51,750.00
FNMA 3Yr 12/18/2013 .750 5,000,000.00 4,941,950.00 100.41 5,020,300.00 78,350.00FNMA 5Yr 03/13/2014 2.750 10,000,000.00 10,454,500.00 102.25 10,225,100.00 -229,400.00FNMA 3Yr 11/19/2013 .800 5,000,000.00 4,991,250.00 100.30 5,015,100.00 23,850.00FNMA 2.25Yr 08/09/2013 .500 10,000,000.00 9,983,000.00 100.11 10,010,600.00 27,600.00FNMA 2Yr 08/09/2013 .500 10,000,000.00 9,979,200.00 100.11 10,010,600.00 31,400.00FNMA 3Yr 12/18/2013 .750 10,000,000.00 10,063,305.58 100.41 10,040,600.00 -22,705.58FNMA 3YrNc2YrE 09/12/2014 .625 5,000,000.00 5,000,000.00 100.15 5,007,600.00 7,600.00FNMA 3YrNc2YrE 09/12/2014 .625 5,000,000.00 5,000,000.00 100.15 5,007,600.00 7,600.00FNMA 3YrNc2YrE 12/05/2014 .850 5,000,000.00 5,000,000.00 100.28 5,014,100.00 14,100.00FNMA 3YrNc2YrE 12/23/2014 .825 5,000,000.00 5,000,000.00 100.29 5,014,400.00 14,400.00FNMA 3YrNc2YrE 12/23/2014 .825 5,000,000.00 5,000,000.00 100.29 5,014,400.00 14,400.00FNMA 3Yr 03/16/2015 .375 5,000,000.00 4,973,800.00 100.22 5,011,200.00 37,400.00FNMA 1.4Yr 08/09/2013 .500 5,000,000.00 5,011,850.00 100.11 5,005,300.00 -6,550.00FNMA 2.75YrNc1YrB 02/10/2015 .560 5,000,000.00 5,000,000.00 100.01 5,000,400.00 400.00FNMA 3Yr 05/27/2015 .500 5,000,000.00 4,995,000.00 100.43 5,021,500.00 26,500.00FNMA 3YrNc1YrE 05/29/2015 .650 5,000,000.00 4,998,500.00 100.03 5,001,500.00 3,000.00FNMA 5YrNc1YrB 06/28/2017 .750 5,000,000.00 5,000,000.00 100.04 5,001,750.00 1,750.00FNMA 3Yr 07/02/2015 .500 10,000,000.00 9,988,000.00 100.42 10,041,600.00 53,600.00FNMA 5YrNc1YrB 07/26/2017 .875 5,000,000.00 5,000,000.00 99.93 4,996,550.00 -3,450.00FNMA 5YrNc1YrB 07/10/2017 .850 4,980,000.00 4,980,000.00 100.07 4,983,386.40 3,386.40FNMA 2YrNc1YrB 01/26/2015 .500 20,000,000.00 20,000,000.00 100.04 20,008,600.00 8,600.00FNMA 5YrNc1YrB 07/26/2017 1.150 5,000,000.00 5,000,000.00 100.23 5,011,300.00 11,300.00FNMA 5YrNc2YrB 07/25/2017 .750 10,000,000.00 10,000,000.00 100.90 10,090,300.00 90,300.00FNMA 5YrNc1YrB 07/26/2017 .875 10,000,000.00 10,000,000.00 99.93 9,993,100.00 -6,900.00FNMA 5YrNc1YrB 07/26/2017 .875 5,000,000.00 5,000,000.00 99.93 4,996,550.00 -3,450.00FNMA 3YrNc1YrE 07/17/2015 .600 5,000,000.00 5,000,000.00 100.08 5,004,050.00 4,050.00FNMA 4YrNc1YrB 08/16/2016 .500 5,000,000.00 5,000,000.00 100.08 5,004,000.00 4,000.00FNMA 5YrNc1YrB 08/15/2017 .750 5,000,000.00 5,000,000.00 100.19 5,009,700.00 9,700.00FNMA 5YrNc1YrB 08/14/2017 .625 5,000,000.00 5,000,000.00 100.17 5,008,700.00 8,700.00FNMA 5YrNc3MoB 08/16/2017 .625 4,850,000.00 4,850,000.00 100.02 4,851,018.50 1,018.50FNMA 5YrNc1YrB 08/16/2017 .750 5,000,000.00 5,000,000.00 100.20 5,009,800.00 9,800.00FNMA 5YrNc1YrB 08/14/2017 .625 10,000,000.00 9,995,000.00 99.99 9,998,500.00 3,500.00FNMA 4YrNc6MoB 02/22/2016 .600 5,000,000.00 5,000,000.00 100.02 5,001,150.00 1,150.00FNMA 4YrNc1YrB 08/16/2016 .500 5,000,000.00 5,000,000.00 100.08 5,004,000.00 4,000.00FNMA 3Yr 09/28/2015 .500 10,000,000.00 9,991,400.00 100.37 10,036,900.00 45,500.00FNMA 5YrNc1YrB 08/28/2017 .750 10,000,000.00 10,000,000.00 100.23 10,023,100.00 23,100.00FNMA 5YrNc1YrB 09/20/2017 .750 5,000,000.00 5,000,000.00 100.28 5,014,050.00 14,050.00FNMA 5YrNc1YrB 09/20/2017 .750 10,000,000.00 10,000,000.00 100.28 10,028,100.00 28,100.00
3136G0A27 .750 4.306 4.3953136G0A27 .750 4.306 4.395
3135G0NV1 .528 2.392 2.4143136G0YU9 .750 4.245 4.332
3135G0NJ8 .600 2.780 2.8163136G0UC3 .500 3.260 3.299
3136G0UX7 .750 4.212 4.2993136G0VA6 .635 4.220 4.293
3136G0VZ1 .625 4.220 4.293313380B63 .625 4.226 4.299
3136G0UC3 .500 3.260 3.2993136G0TZ4 .750 4.209 4.296
3136G0RP8 .875 4.143 4.2413135G0MP5 .600 2.192 2.214
3136G0RW3 .750 4.154 4.2383136G0RP8 .875 4.143 4.241
3135G0MQ3 .500 1.727 1.7423136G0RT0 1.150 4.114 4.241
3136G0RP8 .875 4.143 4.2413136G0PU9 .850 4.114 4.197
3136G0MZ1 .750 4.079 4.1643135G0LN1 .540 2.154 2.173
3135G0KM4 .533 2.057 2.0743135G0LG6 .660 2.058 2.079
3135G0BR3 .330 .276 .2773135G0KS1 .560 1.764 1.784
3135G0GM9 .825 1.628 1.6493135G0HG1 .550 1.867 1.877
3135G0GC1 .850 1.578 1.6003135G0GM9 .825 1.628 1.649
3135G0CU5 .625 1.358 1.3703135G0CU5 .625 1.358 1.370
3135G0BR3 .600 .276 .27731398A5W8 .480 .630 .636
31398A5Z1 .870 .548 .5563135G0BR3 .580 .276 .277
31398A5W8 1.194 .628 .63631398AVZ2 1.128 .858 .868
3136FP6X0 .362 2.744 2.76731398A3K6 1.278 .864 .871
31398A5Z1 .800 .549 .556
31398A5Z1 .800 .549 .556
31398A4H2 1.125 .438 .44131398A4H2 1.125 .438 .441
31398A3R1 1.350 .882 .89031398A4H2 1.125 .438 .441
3136FPEL7 1.050 .360 .3623136FPEX1 1.141 .624 .633
3136FPEL7 1.050 .360 .3623136FPEL7 1.084 .359 .362
3136FPEL7 1.050 .360 .3623136FPEL7 1.050 .360 .362
FNMA BONDS
31398A3A8 1.058 .343 .345
313589HP1 .180 .169 .170.180 .169 .170
.541 1.679 1.695FNMA DISC NOTES
3137EADQ9 .500 3.019 3.0383137EADQ9 .500 3.019 3.038
3134G36J4 .650 3.328 3.3783137EADQ9 .500 3.019 3.038
3134G36M7 .500 2.354 2.3753134G36J4 .656 3.327 3.378
3134G36A3 .600 2.880 2.9123134G36J4 .650 3.328 3.378
3134G33R9 .450 2.686 2.7123134G3S50 .600 3.446 3.510
3134G34B3 .507 2.725 2.7483134G34B3 .507 2.719 2.748
3134G34B3 .500 2.725 2.7483134G34B3 .500 2.725 2.748
3134G34B3 .500 2.719 2.7483134G34B3 .500 2.719 2.748
3134G33X6 .500 2.683 2.7123134G34B3 .500 2.719 2.748
3134G3H78 .320 1.589 1.6003137EACX5 .197 .501 .501
3134G3Y20 .500 2.550 2.5783134G32E9 .320 1.587 1.595
3134G3W71 .350 1.564 1.5753134G3Y20 .500 2.550 2.578
3134G3V23 .530 2.529 2.5593134G3W71 .350 1.564 1.575
3134G3H78 .341 1.589 1.6003134G3S50 .647 3.448 3.510
3134G3H78 .339 1.589 1.6003134G3BF6 .233 .645 .649
3134G3L24 .500 2.384 2.4053134G3L24 .500 2.384 2.405
3134G3ZA1 .519 2.309 2.3293134G3H78 .350 1.589 1.600
3134G3ZA1 .500 2.310 2.3293134G3ZA1 .506 2.309 2.329
3134G3LA6 .303 .823 .830
RIVERISIDE COUNTY TREASURER-TAX COLLECTOR 8

DescriptionMaturity
Date Coupon Par
Value BookValue
MarketPrice
MarketValue
UnrealizedGain/Loss CUSIP
Month End Portfolio Holdings
Yield to Maturity
ModifiedDuration
Years ToMaturity
FNMA 5YrNc1YrB 09/20/2017 .700 5,000,000.00 5,000,000.00 100.22 5,010,900.00 10,900.00FNMA 5YrNc1YrB 09/27/2017 .700 5,000,000.00 5,000,000.00 100.28 5,013,850.00 13,850.00FNMA 5YrNc1YrB 09/27/2017 .700 5,000,000.00 5,000,000.00 100.28 5,013,850.00 13,850.00FNMA 5YrNc1YrB 09/20/2017 .700 5,000,000.00 5,000,000.00 100.22 5,010,900.00 10,900.00FNMA 5YrNc1YrB 11/08/2017 .700 10,000,000.00 10,000,000.00 100.28 10,028,100.00 28,100.00FNMA 3YrNc1YrE 10/22/2015 .500 5,000,000.00 5,001,562.50 100.11 5,005,350.00 3,787.50FNMA 3Yr 09/28/2015 .500 5,000,000.00 5,004,150.00 100.37 5,018,450.00 14,300.00FNMA 3YrNc2YrE 11/06/2015 .500 10,000,000.00 10,000,000.00 100.17 10,017,300.00 17,300.00FNMA 3YrNc2YrE 11/25/2015 .480 10,000,000.00 10,000,000.00 100.17 10,016,700.00 16,700.00FNMA 3YrNc1YrE 11/27/2015 .500 5,000,000.00 5,000,000.00 100.11 5,005,600.00 5,600.00FNMA 3.5YrNc2YrE 05/26/2016 .550 5,000,000.00 5,000,000.00 100.18 5,009,200.00 9,200.00FNMA 4YrNc1YrB 11/07/2016 .400 5,000,000.00 5,000,000.00 100.08 5,004,050.00 4,050.00FNMA 5YrNc6MoB 11/07/2017 .600 5,250,000.00 5,250,000.00 100.12 5,256,300.00 6,300.00FNMA 3YrNc1YrE 11/27/2015 .500 5,000,000.00 5,000,000.00 100.11 5,005,600.00 5,600.00FNMA 5YrNc1YrB 12/18/2017 .750 10,000,000.00 10,000,000.00 100.27 10,027,300.00 27,300.00FNMA 3YrNc1YrE 11/06/2015 .500 5,000,000.00 5,000,000.00 100.17 5,008,650.00 8,650.00FNMA 5YrNc1YrB 12/13/2017 .800 5,000,000.00 5,000,000.00 100.36 5,017,850.00 17,850.00FNMA 5YrNc1YrB 12/18/2017 .750 8,752,000.00 8,752,000.00 100.27 8,775,892.96 23,892.96FNMA 5YrNc1YrB 12/13/2017 .650 5,000,000.00 5,000,000.00 100.14 5,007,050.00 7,050.00FNMA 3YrNc1YrB 12/24/2015 .520 5,000,000.00 5,000,000.00 100.12 5,005,850.00 5,850.00FNMA 3YrNc1YrB 12/24/2015 .450 5,000,000.00 5,000,000.00 100.03 5,001,700.00 1,700.00FNMA 3YrNc1YrB 12/24/2015 .450 10,000,000.00 10,000,000.00 100.03 10,003,400.00 3,400.00FNMA 3YrNc1YrB 12/24/2015 .450 10,000,000.00 9,998,000.00 100.03 10,003,400.00 5,400.00FNMA 3YrNc1YrB 12/24/2015 .450 10,000,000.00 10,000,000.00 100.03 10,003,400.00 3,400.00FNMA 5YrNc1YrB 12/26/2017 .750 10,000,000.00 10,000,000.00 100.24 10,023,500.00 23,500.00FNMA 3YrNc1YrB 12/24/2015 .450 5,000,000.00 5,000,000.00 100.03 5,001,700.00 1,700.00FNMA 2.5YrNc1YrB 06/24/2015 .400 11,850,000.00 11,848,815.00 100.10 11,861,613.00 12,798.00FNMA 3YrNc1YrB 12/24/2015 .450 5,000,000.00 5,000,000.00 100.03 5,001,700.00 1,700.00FNMA 3YrNc1YrB 12/24/2015 .450 10,000,000.00 10,000,000.00 100.03 10,003,400.00 3,400.00FNMA 3YrNc1YrB 12/24/2015 .450 10,000,000.00 10,000,000.00 100.03 10,003,400.00 3,400.00FNMA 5YrNc1YrB 12/27/2017 .625 5,000,000.00 5,000,000.00 100.16 5,007,850.00 7,850.00FNMA 5YrNc1YrB 12/13/2017 .800 5,000,000.00 5,000,000.00 100.36 5,017,850.00 17,850.00FNMA 5YrNc1YrB 12/26/2017 .650 8,750,000.00 8,750,000.00 100.26 8,772,487.50 22,487.50FNMA 3YrNc1YrB 12/30/2015 .450 10,000,000.00 10,000,000.00 100.13 10,012,800.00 12,800.00FNMA 5YrNc1YrB 12/26/2017 .700 10,000,000.00 10,000,000.00 100.36 10,036,100.00 36,100.00FNMA 3YrNc1YrB 12/24/2015 .450 10,000,000.00 10,000,000.00 100.03 10,003,400.00 3,400.00FNMA 5YrNc1YrB 01/30/2018 .750 5,000,000.00 5,000,000.00 100.41 5,020,700.00 20,700.00FNMA 5YrNc1YrB 01/30/2018 .700 5,000,000.00 5,000,000.00 100.41 5,020,700.00 20,700.00FNMA 5YrNc6MoB 01/30/2018 .700 7,200,000.00 7,200,000.00 100.17 7,211,952.00 11,952.00FNMA 3YrNc1YrB 01/29/2016 .480 5,000,000.00 4,999,000.00 100.06 5,003,150.00 4,150.00FNMA 3YrNc6MoB 01/15/2016 .500 5,000,000.00 4,999,750.00 100.04 5,002,150.00 2,400.00FNMA 5YrNc1YrB 01/29/2018 .800 10,000,000.00 10,000,000.00 100.49 10,049,300.00 49,300.00FNMA 3YrNc1YrB 01/29/2016 .500 5,000,000.00 5,000,000.00 100.11 5,005,450.00 5,450.00FNMA 5YrNc1YrB 01/30/2018 .700 10,000,000.00 10,000,000.00 100.29 10,029,300.00 29,300.00FNMA 5YrNc1YrB 01/30/2018 .750 4,500,000.00 4,500,000.00 100.50 4,522,275.00 22,275.00FNMA 5YrNc1YrB 01/30/2018 .700 10,000,000.00 10,000,000.00 100.10 10,009,600.00 9,600.00FNMA 3YrNc6MoB 02/22/2016 .520 5,000,000.00 4,996,500.00 100.07 5,003,650.00 7,150.00FNMA 3YrNc6MoB 02/22/2016 .520 5,000,000.00 4,995,000.00 100.07 5,003,650.00 8,650.00FNMA 5YrNc1YrB 02/28/2018 .800 15,000,000.00 15,000,000.00 100.30 15,045,300.00 45,300.00FNMA 5YrNc1YrB 02/28/2018 1.000 10,000,000.00 10,000,000.00 100.50 10,050,400.00 50,400.00FNMA 5YrNc1YrB 02/28/2018 1.000 5,000,000.00 4,998,500.00 100.50 5,025,200.00 26,700.00FNMA 5YrNc6MoB 02/28/2018 1.000 10,000,000.00 10,000,000.00 100.25 10,024,500.00 24,500.00FNMA 5YrNc1YrB 02/20/2018 .800 5,000,000.00 4,993,750.00 100.43 5,021,300.00 27,550.00FNMA 3YrNc1YrE 02/26/2016 .550 5,000,000.00 5,000,000.00 100.20 5,009,800.00 9,800.00FNMA 5YrNc6MoB 02/28/2018 1.000 10,000,000.00 10,000,000.00 100.25 10,024,500.00 24,500.00FNMA 3.5YrNc6MoB 08/26/2016 .700 10,000,000.00 10,000,000.00 100.14 10,013,600.00 13,600.00FNMA 5YrNc6MoB 03/06/2018 1.000 10,000,000.00 10,000,000.00 100.22 10,021,600.00 21,600.00FNMA 5YrNc6MoB 03/19/2018 1.000 5,000,000.00 4,998,750.00 100.23 5,011,450.00 12,700.00FNMA 5YrNc6MoB 03/19/2018 1.000 10,000,000.00 10,000,000.00 100.23 10,022,900.00 22,900.00FNMA 3.25YrNc6MoB 06/13/2016 .625 6,250,000.00 6,250,000.00 100.12 6,257,687.50 7,687.50FNMA 5YrNc6MoB 03/19/2018 1.000 5,000,000.00 5,000,000.00 100.23 5,011,450.00 11,450.00FNMA 5YrNc6MoB 03/27/2018 .500 5,000,000.00 5,000,000.00 100.05 5,002,700.00 2,700.00FNMA 5YrNc1YrB 03/27/2018 .800 5,000,000.00 5,000,000.00 100.41 5,020,650.00 20,650.00FNMA 3.5YrNc6MoB 09/27/2016 .625 5,500,000.00 5,498,350.00 100.12 5,506,765.00 8,415.00FNMA 3.5YrNc6MoB 09/27/2016 .625 5,000,000.00 5,000,000.00 100.12 5,006,150.00 6,150.00FNMA 5YrNc6MoB 03/19/2018 1.000 10,000,000.00 10,000,000.00 100.23 10,022,900.00 22,900.00FNMA 5YrNc1YrB 03/28/2018 .850 5,000,000.00 5,000,000.00 100.39 5,019,450.00 19,450.00FNMA 5YrNc1YrB 03/28/2018 .800 5,000,000.00 5,000,000.00 100.36 5,018,050.00 18,050.00FNMA 5YrNc6MoB 03/20/2018 .750 5,000,000.00 4,996,250.00 100.19 5,009,400.00 13,150.00FNMA 5YrNc1YrB 03/28/2018 .800 5,000,000.00 5,000,000.00 100.42 5,020,900.00 20,900.00FNMA 3YrNc6MoB 09/26/2016 .650 5,000,000.00 5,000,000.00 100.16 5,007,950.00 7,950.00FNMA 3.5YrNc6MoB 10/25/2016 .700 5,000,000.00 5,000,000.00 100.16 5,007,850.00 7,850.00FNMA 3.5YrNc6MoB 10/25/2016 .700 5,000,000.00 5,000,000.00 100.16 5,007,850.00 7,850.00FNMA 3.5YrNc6MoB 10/25/2016 .700 5,000,000.00 5,000,000.00 100.16 5,007,850.00 7,850.00FNMA 3.5YrNc6MoB 10/25/2016 .700 10,000,000.00 10,000,000.00 100.16 10,015,700.00 15,700.00FNMA 3.5YrNc6MoB 10/25/2016 .700 5,000,000.00 5,000,000.00 100.16 5,007,850.00 7,850.00FNMA 3.5YrNc6MoB 10/25/2016 .700 10,000,000.00 10,000,000.00 100.16 10,015,700.00 15,700.00FNMA 3.5YrNc6MoB 10/25/2016 .700 10,000,000.00 10,000,000.00 100.16 10,015,700.00 15,700.00FNMA 5YrNc6MoC 04/24/2018 .800 10,000,000.00 10,000,000.00 100.17 10,017,200.00 17,200.00FNMA 3YrNc6MoB 04/18/2016 .570 5,000,000.00 5,000,000.00 100.11 5,005,700.00 5,700.00FNMA 3YrNc6MoB 04/18/2016 .570 5,000,000.00 4,999,500.00 100.11 5,005,700.00 6,200.00FNMA 3.5YrNc6MoB 10/25/2016 .700 5,000,000.00 5,000,000.00 100.16 5,007,850.00 7,850.00FNMA 5YrNc6MoC 04/16/2018 .750 10,000,000.00 10,000,000.00 100.17 10,016,500.00 16,500.00FNMA 5YrNc6MoB 04/30/2018 .750 10,000,000.00 10,000,000.00 99.95 9,994,700.00 -5,300.00FNMA 3.5YrNc6MoB 10/25/2016 .625 5,000,000.00 5,000,000.00 100.11 5,005,600.00 5,600.00FNMA 3.5YrNc6MoB 10/25/2016 .625 10,000,000.00 10,000,000.00 100.11 10,011,200.00 11,200.00FNMA 3.5YrNc6MoB 10/25/2016 .625 10,000,000.00 10,000,000.00 100.11 10,011,200.00 11,200.00FNMA 5YrNc1YrB 04/16/2018 .750 5,000,000.00 5,000,000.00 100.17 5,008,250.00 8,250.00FNMA 3.5YrNc6MoB 10/25/2016 .625 20,000,000.00 20,000,000.00 100.11 20,022,400.00 22,400.00FNMA 5YrNc6MoB 04/18/2018 .750 5,610,000.00 5,610,000.00 100.14 5,618,022.30 8,022.30FNMA 3.5YrNc6MoB 12/27/2016 .680 12,000,000.00 12,006,600.00 100.14 12,017,280.00 10,680.00FNMA 5YrNc6MoB 04/30/2018 .750 5,000,000.00 5,000,000.00 99.95 4,997,350.00 -2,650.00
.715 1,010,492,000.00 1,010,820,483.08 100.23 1,012,777,730.16 1,957,247.08
FHLB DISC NOTE 09/12/2013 .190 40,000,000.00 39,924,422.40 99.98 39,991,066.67 66,644.27313385LQ7 .190 .369 .370
.703 3.218 3.277FHLB DISC NOTES
3136G14F3 .665 3.599 3.6633136G1KJ7 .750 4.898 5.003
3135G0WL3 .625 3.443 3.4903136G1JW0 .750 4.865 4.970
3135G0WL3 .625 3.443 3.4903136G1KB4 .750 4.860 4.964
3135G0WL3 .625 3.443 3.4903135G0WL3 .625 3.443 3.490
3136G1KB4 .750 4.860 4.9643136G1KJ7 .750 4.898 5.003
3135G0WC3 .573 2.937 2.9703135G0WE9 .700 3.438 3.490
3136G1JY6 .800 4.875 4.9863135G0WC3 .570 2.937 2.970
3135G0WE9 .700 3.438 3.4903135G0WE9 .700 3.438 3.490
3135G0WE9 .700 3.438 3.4903135G0WE9 .700 3.438 3.490
3135G0WE9 .700 3.438 3.4903135G0WE9 .700 3.438 3.490
3135G0VQ3 .650 3.361 3.4113135G0WE9 .700 3.438 3.490
3136G1HE2 .765 4.787 4.8903136G1HP7 .800 4.803 4.912
3136G1HC6 .850 4.797 4.9123136G1HB8 .800 4.803 4.912
3136G1GR4 .625 3.365 3.4143136G1FW4 1.000 4.752 4.888
3136G1GN3 .800 4.800 4.9103136G1GR4 .634 3.365 3.414
3136G1FW4 1.000 4.752 4.8883136G1GS2 .500 4.840 4.910
3136G1FW4 1.000 4.752 4.8883136G1FF1 .625 3.077 3.123
3136G1ET2 1.000 4.716 4.8523136G1FW4 1.005 4.752 4.888
3136G1DB2 1.000 4.699 4.8363136G1EX3 .700 3.274 3.326
3136G1CW7 .826 4.697 4.8143135G0US0 .550 2.794 2.827
3136G1DA4 1.006 4.699 4.8363136G1DB2 1.000 4.699 4.836
3136G1D97 .800 4.726 4.8363136G1DA4 1.000 4.699 4.836
3135G0UB7 .544 2.784 2.8163135G0UB7 .554 2.784 2.816
3136G1AY5 .750 4.649 4.7563136G1BF5 .700 4.656 4.756
3135G0TT0 .500 2.722 2.7513136G1AJ8 .700 4.656 4.756
3135G0TS2 .502 2.683 2.7123136G1C56 .800 4.640 4.753
3136G1AQ2 .700 4.656 4.7563135G0TH6 .487 2.723 2.751
3136G1B40 .750 4.649 4.7563136G1B32 .700 4.656 4.756
3136G1A66 .700 4.562 4.6603135G0ST1 .450 2.627 2.652
3136G17E3 .650 4.568 4.6603136G17A1 .450 2.644 2.668
3136G16J3 .625 4.575 4.6633136G13S6 .800 4.513 4.625
3135G0ST1 .450 2.627 2.6523135G0ST1 .450 2.627 2.652
3135G0SQ7 .404 2.136 2.1513135G0ST1 .450 2.627 2.652
3136G14Q9 .750 4.555 4.6603135G0ST1 .450 2.627 2.652
3135G0ST1 .457 2.627 2.6523135G0ST1 .450 2.627 2.652
3135G0ST1 .450 2.627 2.6523135G0ST1 .450 2.627 2.652
3136G12D0 .650 4.532 4.6253135G0SL8 .520 2.624 2.652
3136G13S6 .800 4.513 4.6253136G12F5 .750 4.533 4.638
3136G12F5 .750 4.533 4.6383135G0RS4 .500 2.492 2.521
3136G03B5 .600 4.439 4.5263135G0RX3 .500 2.550 2.578
3135G0RZ8 .550 3.035 3.0743136G0Y21 .400 3.485 3.526
3135G0RY1 .480 2.546 2.5733135G0RX3 .500 2.550 2.578
3135G0NV1 .471 2.393 2.4143135G0RS4 .500 2.492 2.521
3136G0W49 .700 4.429 4.5293135G0QB2 .489 2.459 2.479
3136G0E64 .700 4.331 4.4143136G0B59 .700 4.312 4.395
3136G0B59 .700 4.312 4.3953136G0E64 .700 4.331 4.414
RIVERISIDE COUNTY TREASURER-TAX COLLECTOR 9

DescriptionMaturity
Date Coupon Par
Value BookValue
MarketPrice
MarketValue
UnrealizedGain/Loss CUSIP
Month End Portfolio Holdings
Yield to Maturity
ModifiedDuration
Years ToMaturity
.190 40,000,000.00 39,924,422.40 99.98 39,991,066.67 66,644.27
FHLB 3Yr 06/14/2013 1.625 15,000,000.00 15,185,100.00 100.18 15,027,150.00 -157,950.00FHLB 3Yr 08/28/2013 .875 5,000,000.00 5,003,500.00 100.25 5,012,400.00 8,900.00FHLB 3Yr 07/29/2013 .850 5,000,000.00 5,001,442.61 100.18 5,009,050.00 7,607.39FHLB 2.6Yr 06/26/2013 .500 10,000,000.00 9,976,500.00 100.06 10,005,900.00 29,400.00FHLB 3.2Yr 12/27/2013 .875 10,000,000.00 9,982,000.00 100.48 10,048,200.00 66,200.00FHLB 4Yr 02/04/2015 .238 15,000,000.00 15,000,000.00 99.98 14,997,000.00 -3,000.00FHLB 3Yr 03/14/2014 2.375 5,000,000.00 5,140,200.00 101.93 5,096,600.00 -43,600.00FHLB 2.5Yr 09/26/2013 1.000 5,000,000.00 5,000,000.00 100.36 5,017,900.00 17,900.00FHLB 3Yr 05/27/2014 1.500 5,000,000.00 5,000,000.00 101.43 5,071,250.00 71,250.00FHLB 2.25Yr 08/15/2013 1.000 7,500,000.00 7,500,000.00 100.26 7,519,275.00 19,275.00FHLB 2.25Yr 08/28/2013 .750 5,000,000.00 5,008,850.00 100.21 5,010,400.00 1,550.00FHLB 3Yr 07/07/2014 .910 10,000,000.00 10,000,000.00 100.86 10,086,000.00 86,000.00FHLB 2Yr 05/30/2013 .500 10,000,000.00 10,000,000.00 100.03 10,003,100.00 3,100.00FHLB 2Yr 08/28/2013 .500 10,000,000.00 9,986,100.00 100.13 10,012,700.00 26,600.00FHLB 2Yr 11/29/2013 .450 5,000,000.00 4,997,944.55 100.19 5,009,250.00 11,305.45FHLB 1.5Yr 05/21/2013 .340 10,000,000.00 9,999,500.00 100.01 10,001,300.00 1,800.00FHLB 1.5Yr 05/21/2013 .340 10,000,000.00 9,999,500.00 100.01 10,001,300.00 1,800.00FHLB 1.5Yr 05/21/2013 .340 15,000,000.00 15,000,000.00 100.01 15,001,950.00 1,950.00FHLB 1.5Yr 05/21/2013 .340 15,000,000.00 15,000,000.00 100.01 15,001,950.00 1,950.00FHLB 1.5Yr 05/21/2013 .340 10,000,000.00 10,000,000.00 100.01 10,001,300.00 1,300.00FHLB 1.5Yr 05/21/2013 .340 5,000,000.00 5,000,000.00 100.01 5,000,650.00 650.00FHLB 1.5Yr 05/28/2013 .310 15,000,000.00 15,000,000.00 100.02 15,002,250.00 2,250.00FHLB 18Mo 05/16/2013 .340 15,000,000.00 15,000,000.00 100.01 15,001,500.00 1,500.00FHLB 1.5Yr 06/03/2013 .320 15,000,000.00 15,000,000.00 100.02 15,002,850.00 2,850.00FHLB 1.5Yr 05/07/2013 .300 10,000,000.00 9,994,300.00 100.00 10,000,300.00 6,000.00FHLB 1.5Yr 05/30/2013 .375 15,000,000.00 15,000,000.00 100.02 15,003,150.00 3,150.00FHLB 1.5Yr 07/09/2013 .375 10,000,000.00 10,000,000.00 100.05 10,005,000.00 5,000.00FHLB 1.5Yr 06/19/2013 .400 10,000,000.00 10,000,000.00 100.03 10,003,200.00 3,200.00
FHLB 1.5Yr 07/09/2013 .375 10,000,000.00 10,000,000.00 100.05 10,005,000.00 5,000.00FHLB 18Mo 06/21/2013 .400 10,000,000.00 10,000,000.00 100.04 10,003,600.00 3,600.00FHLB 18Mo 06/21/2013 .400 10,000,000.00 10,002,988.60 100.04 10,003,600.00 611.40FHLB 1.5Yr 05/30/2013 .350 15,000,000.00 15,001,381.80 100.02 15,002,850.00 1,468.20FHLB 1.5Yr 05/30/2013 .350 15,000,000.00 15,001,350.00 100.02 15,002,850.00 1,500.00FHLB 1.5Yr 06/21/2013 .400 15,000,000.00 15,011,550.00 100.04 15,005,400.00 -6,150.00FHLB 1.5Yr 06/21/2013 .400 8,000,000.00 8,003,520.00 100.04 8,002,880.00 -640.00
FHLB 1.5Yr 05/30/2013 .350 5,000,000.00 5,001,450.00 100.02 5,000,950.00 -500.00FHLB 1.5Yr 06/21/2013 .400 10,000,000.00 10,005,900.00 100.04 10,004,000.00 -1,900.00FHLB 1.5Yr 05/16/2013 .300 10,000,000.00 10,001,400.00 100.01 10,000,800.00 -600.00FHLB 1.5Yr 06/28/2013 .350 10,000,000.00 10,000,000.00 100.04 10,003,800.00 3,800.00FHLB 1.5Yr 07/09/2013 .375 10,085,000.00 10,088,810.82 100.05 10,090,042.50 1,231.68FHLB 1.5Yr 05/03/2013 .370 10,000,000.00 10,010,200.00 100.00 10,000,100.00 -10,100.00FHLB 2Yr 01/29/2014 .375 5,000,000.00 5,000,000.00 100.18 5,008,750.00 8,750.00FHLB 2Yr 07/30/2013 .250 5,000,000.00 4,998,690.00 100.04 5,001,750.00 3,060.00FHLB 1.5Yr 08/05/2013 .250 5,000,000.00 5,000,000.00 100.04 5,001,800.00 1,800.00FHLB 1.5Yr 07/30/2013 .250 5,000,000.00 4,997,191.10 100.04 5,001,750.00 4,558.90FHLB 1.5Yr 08/05/2013 .250 5,000,000.00 4,997,372.74 100.04 5,001,800.00 4,427.26FHLB 1.5Yr 08/05/2013 .250 5,000,000.00 5,000,000.00 100.04 5,001,800.00 1,800.00FHLB 1.5Yr 08/09/2013 .250 5,000,000.00 5,000,000.00 100.04 5,001,900.00 1,900.00FHLB 1.5Yr 07/30/2013 .250 5,000,000.00 4,998,800.00 100.04 5,001,750.00 2,950.00FHLB 3Yr 05/22/2015 .500 5,000,000.00 5,000,000.00 100.41 5,020,700.00 20,700.00FHLB 1.2Yr 05/07/2013 .260 15,000,000.00 15,000,000.00 100.00 15,000,300.00 300.00FHLB 1.5Yr 09/09/2013 .310 10,000,000.00 10,000,000.00 100.07 10,007,100.00 7,100.00FHLB 2YrNc 02/13/2014 .300 5,000,000.00 4,992,300.00 100.12 5,006,050.00 13,750.00FHLB 1.5Yr 09/09/2013 .300 5,000,000.00 5,000,000.00 100.07 5,003,350.00 3,350.00FHLB 3Yr 03/13/2015 .375 5,000,000.00 4,973,550.00 100.19 5,009,650.00 36,100.00FHLB 1.5Yr 09/09/2013 .310 5,000,000.00 5,001,450.00 100.07 5,003,550.00 2,100.00FHLB 3Yr 03/13/2015 .375 5,000,000.00 4,953,525.00 100.19 5,009,650.00 56,125.00FHLB 1.5Yr 09/12/2013 .280 5,000,000.00 4,994,950.00 100.06 5,003,100.00 8,150.00FHLB 2.25Yr 05/30/2014 .375 5,000,000.00 4,990,014.15 100.22 5,011,050.00 21,035.85FHLB 1.5Yr 10/09/2013 .400 15,000,000.00 15,000,000.00 100.12 15,018,600.00 18,600.00FHLB 3Yr 05/04/2015 .700 15,000,000.00 15,000,000.00 100.82 15,122,700.00 122,700.00FHLB 1.3Yr 05/10/2013 .200 20,000,000.00 19,985,000.00 100.00 20,000,400.00 15,400.00FHLB 1.5Yr 05/28/2013 .310 14,500,000.00 14,507,830.00 100.02 14,502,175.00 -5,655.00FHLB 1.5Yr 10/11/2013 .350 5,000,000.00 5,000,000.00 100.10 5,005,150.00 5,150.00FHLB 1.5Yr 10/15/2013 .350 5,000,000.00 5,000,000.00 100.10 5,005,200.00 5,200.00FHLB 1.5Yr 09/16/2013 .280 5,000,000.00 4,997,850.00 100.06 5,003,200.00 5,350.00FHLB 3YrNc2YrE 04/30/2015 .650 5,000,000.00 5,000,000.00 100.47 5,023,250.00 23,250.00FHLB 1Yr 05/03/2013 .230 5,000,000.00 5,000,000.00 100.00 5,000,050.00 50.00FHLB 1Yr 05/03/2013 .220 10,000,000.00 9,998,680.00 100.00 10,000,100.00 1,420.00FHLB 1Yr 05/03/2013 .220 5,000,000.00 4,999,340.00 100.00 5,000,050.00 710.00FHLB 2Yr 04/30/2014 .340 5,000,000.00 5,000,000.00 100.18 5,008,950.00 8,950.00FHLB 1.5Yr 12/03/2013 .290 10,000,000.00 10,000,000.00 100.09 10,009,300.00 9,300.00FHLB 1Yr 05/16/2013 .300 10,000,000.00 10,006,980.00 100.01 10,000,800.00 -6,180.00FHLB 18Mo 12/03/2013 .290 5,000,000.00 4,999,250.00 100.09 5,004,650.00 5,400.00FHLB 1Yr 05/17/2013 .220 20,000,000.00 19,997,400.00 100.01 20,001,000.00 3,600.00FHLB 12Mo 05/17/2013 .220 5,000,000.00 4,999,345.00 100.01 5,000,250.00 905.00FHLB 2Yr 05/19/2014 .350 5,000,000.00 5,000,000.00 100.19 5,009,650.00 9,650.00FHLB 18Mo 11/15/2013 .300 5,000,000.00 4,999,850.00 100.09 5,004,550.00 4,700.00FHLB 1Yr 05/17/2013 .230 15,000,000.00 14,999,250.00 100.01 15,000,750.00 1,500.00FHLB 2Yr 05/19/2014 .350 5,000,000.00 5,000,000.00 100.19 5,009,650.00 9,650.00FHLB 1Yr 05/29/2013 .240 10,000,000.00 10,000,000.00 100.01 10,001,000.00 1,000.00FHLB 1Yr 06/14/2013 .240 10,000,000.00 10,000,000.00 100.02 10,001,500.00 1,500.00FHLB 1Yr 06/04/2013 .230 5,000,000.00 4,999,850.00 100.01 5,000,550.00 700.00FHLB 1Yr 07/01/2013 .250 10,000,000.00 9,996,620.00 100.02 10,002,300.00 5,680.00FHLB 1Yr 07/02/2013 .250 5,000,000.00 4,999,580.00 100.02 5,001,200.00 1,620.00FHLB 1Yr 07/03/2013 .270 10,000,000.00 10,000,000.00 100.03 10,002,700.00 2,700.00FHLB 1Yr 07/03/2013 .270 5,000,000.00 5,000,000.00 100.03 5,001,350.00 1,350.00FHLB 1.5Yr 01/23/2014 .300 25,000,000.00 24,994,000.00 100.10 25,025,500.00 31,500.00FHLB 1Yr 07/17/2013 .250 5,000,000.00 5,000,000.00 100.03 5,001,450.00 1,450.00FHLB 1Yr 07/17/2013 .250 5,000,000.00 5,000,000.00 100.03 5,001,450.00 1,450.00FHLB 1Yr 08/28/2013 .230 10,000,000.00 10,000,000.00 100.04 10,003,900.00 3,900.00FHLB 1.75YrNc9MoB 05/28/2014 .300 10,000,000.00 10,000,000.00 100.01 10,001,400.00 1,400.00FHLB 1Yr 07/25/2013 .125 10,000,000.00 9,992,980.00 100.00 10,000,300.00 7,320.00
313376A47 .470 .578
313380B48 .202 .235 .236
313380LS4 .230 .328 .329313380FJ1 .300 1.075 1.077
3133803E5 .250 .213 .2143133803E5 .250 .213 .214
313379YZ6 .270 .175 .1753133803M7 .316 .729 .734
313379YR4 .258 .172 .173313379YZ6 .270 .175 .175
313379Q85 .233 .096 .096313379YQ6 .284 .170 .170
313379PX1 .240 .079 .079313379QW2 .240 .123 .123
313379G37 .235 .046 .047313379FL8 .350 1.048 1.052
313379FL8 .350 1.048 1.052313379FK0 .302 .540 .545
313379BZ1 .233 .046 .047313379BZ1 .233 .046 .047
313376D36 .233 .044 .0443133796L8 .300 .590 .595
313379AK5 .340 .997 1.0003133796L8 .290 .590 .595
313379A66 .233 .008 .008313379A66 .233 .008 .008
313378XS5 .650 1.984 2.000313379A90 .230 .008 .008
313378YX3 .350 .459 .460313378LH2 .310 .380 .381
313376DE2 .262 .077 .077313378YL9 .350 .448 .449
313378U58 .700 1.987 2.011313376XW0 .268 .027 .027
313378FY2 .468 1.078 1.082313378TT8 .400 .443 .444
313376ZQ1 .689 1.857 1.868313378LW9 .348 .369 .370
313376ZQ1 .551 1.859 1.868313378ED9 .291 .361 .362
3133783D1 .379 .784 .792313378H79 .300 .361 .362
313378CE9 .260 .019 .019313378ED9 .310 .361 .362
313376VB8 .266 .249 .249313378AC5 .500 2.044 2.060
313376UY9 .250 .265 .2663133784T5 .250 .276 .277
313376VB8 .288 .249 .249313376UY9 .285 .265 .266
313376VB8 .268 .249 .249313376UY9 .250 .265 .266
313376A96 .293 .008 .008313376UF0 .375 .745 .751
313376P58 .350 .161 .162313376J55 .350 .191 .192
313376KL8 .361 .142 .142313376D36 .290 .044 .044
313376KJ3 .371 .142 .142
313376GT6 .330 .082 .082
313376GT6 .344 .082 .082313376KJ3 .348 .142 .142
313376KJ3 .380 .142 .142313376GT6 .344 .082 .082
313376J55 .375 .191 .192313376KJ3 .400 .142 .142
313376J55 .375 .191 .192313376JY2 .400 .137 .137
313376C86 .340 .019 .019313376JE6 .375 .082 .082
313376D85 .340 .044 .044313376GK5 .320 .093 .093
313376CW3 .340 .057 .058313376DE2 .310 .077 .077
313376CW3 .340 .057 .058313376CW3 .340 .057 .058
313376CW3 .343 .057 .058313376CW3 .340 .057 .058
.584313376CW3 .343 .057 .058
313374N63 .500 .082 .082313374Y61
313373S37 .671 .327 .329313374FU9 .910 1.174
1.000 .291 .293
.567 .328 .329
3133736H0 1.000 .406 .408
1.186
313373CZ3 1.500 1.056 1.074313373F98
313372KE3 .238 1.756 1.7673133XWKV0 1.404 .860 .871
313371PM2 .590 .156 .156313371UC8 .934 .653 .660
313370TA6 .851 .327 .329313370TB4 .840 .245 .247
FHLB BONDS
3133XYHD0 1.198 .122 .123
.190 .369 .370
RIVERISIDE COUNTY TREASURER-TAX COLLECTOR 10

DescriptionMaturity
Date Coupon Par
Value BookValue
MarketPrice
MarketValue
UnrealizedGain/Loss CUSIP
Month End Portfolio Holdings
Yield to Maturity
ModifiedDuration
Years ToMaturity
FHLB 1Yr 08/20/2013 .125 10,000,000.00 9,993,130.00 100.00 10,000,400.00 7,270.00FHLB 1Yr 09/16/2013 .280 10,000,000.00 10,006,780.00 100.06 10,006,400.00 -380.00FHLB 9Mo 06/17/2013 .180 5,000,000.00 4,999,925.00 100.01 5,000,450.00 525.00FHLB 5YrNc3MoB 10/10/2017 .625 10,000,000.00 10,000,000.00 100.08 10,008,400.00 8,400.00FHLB 1Yr 10/18/2013 .190 5,000,000.00 4,999,365.00 100.03 5,001,550.00 2,185.00FHLB 1Yr 11/25/2013 .300 5,000,000.00 5,003,885.00 100.10 5,004,800.00 915.00FHLB 1Yr 11/27/2013 .375 11,000,000.00 11,018,106.00 100.14 11,015,400.00 -2,706.00FHLB 1YrNc6MoB 12/23/2013 .250 10,000,000.00 10,000,000.00 100.01 10,000,900.00 900.00FHLB 3Yr 01/16/2015 .250 5,000,000.00 4,994,000.00 100.05 5,002,550.00 8,550.00FHLB 1Yr 01/23/2014 .270 1,000,000.00 1,000,410.00 100.09 1,000,940.00 530.00FHLB 10Mo 10/01/2013 .125 9,000,000.00 8,996,202.00 100.01 9,000,540.00 4,338.00FHLB 1.5 Yr 01/23/2014 .260 20,000,000.00 20,014,720.00 100.09 20,017,400.00 2,680.00FHLB 1.5Yr 01/23/2014 .300 15,000,000.00 15,017,550.00 100.10 15,015,300.00 -2,250.00FHLB 1Yr 01/02/2014 .180 10,000,000.00 9,998,740.00 100.03 10,002,700.00 3,960.00FHLB 1.5Yr 01/23/2014 .260 25,000,000.00 25,015,200.00 100.09 25,021,750.00 6,550.00FHLB 1Yr 01/02/2014 .180 15,000,000.00 14,998,110.00 100.03 15,004,050.00 5,940.00FHLB 1Yr 01/02/2014 .180 15,000,000.00 14,998,050.00 100.03 15,004,050.00 6,000.00FHLB 3YrNc6MoB 01/29/2016 .500 5,000,000.00 5,000,000.00 100.06 5,002,950.00 2,950.00FHLB 2Yr 02/20/2015 .250 5,000,000.00 4,995,550.00 99.98 4,998,800.00 3,250.00FHLB 3YrNc3MoB 02/22/2016 .600 5,000,000.00 5,000,000.00 100.02 5,000,950.00 950.00FHLB 3.5YrNc6MoB 07/29/2016 .575 5,000,000.00 4,989,500.00 100.09 5,004,300.00 14,800.00FHLB 1Yr 02/07/2014 .125 15,000,000.00 14,992,155.00 100.02 15,003,600.00 11,445.00FHLB 5YrNc3MoB 02/13/2018 .500 7,350,000.00 7,350,000.00 100.02 7,351,176.00 1,176.00FHLB 1Yr 02/14/2014 .125 10,000,000.00 9,993,760.00 99.98 9,998,400.00 4,640.00FHLB 1Yr 01/07/2014 .180 18,000,000.00 17,999,640.00 100.03 18,004,860.00 5,220.00FHLB 1Yr 02/14/2014 .125 15,000,000.00 14,990,820.00 99.98 14,997,600.00 6,780.00FHLB 1Yr 02/14/2014 .125 10,000,000.00 9,994,100.00 99.98 9,998,400.00 4,300.00FHLB 1Yr 02/25/2014 .125 5,000,000.00 4,996,625.00 99.98 4,999,000.00 2,375.00FHLB 1Yr 03/06/2014 .180 5,000,000.00 4,999,600.00 100.03 5,001,250.00 1,650.00FHLB 1Yr 03/05/2014 .180 10,000,000.00 9,998,750.00 100.03 10,002,500.00 3,750.00FHLB 9Mo 12/11/2013 .160 5,000,000.00 4,999,890.00 100.02 5,000,800.00 910.00FHLB 1Yr 02/25/2014 .125 25,000,000.00 24,987,000.00 99.98 24,995,000.00 8,000.00FHLB 2YrNc1MoB 04/15/2015 .400 10,000,000.00 10,000,000.00 100.01 10,000,700.00 700.00FHLB 1YrNc1MoB 04/10/2014 .250 10,000,000.00 10,000,000.00 100.00 10,000,400.00 400.00FHLB 1YrNc1MoB 04/10/2014 .250 25,000,000.00 25,000,000.00 100.00 25,001,000.00 1,000.00FHLB 1YrNc1MoB 04/10/2014 .250 10,000,000.00 10,000,000.00 100.00 10,000,400.00 400.00FHLB 5YrNc6MoB 04/25/2018 .800 10,000,000.00 10,000,000.00 100.22 10,021,700.00 21,700.00FHLB 3YrNc1MoB 04/15/2016 .600 9,250,000.00 9,250,000.00 100.01 9,251,295.00 1,295.00FHLB 5YrNc3MoB 04/25/2018 .850 8,350,000.00 8,350,000.00 100.11 8,359,185.00 9,185.00FHLB 13Mo 05/16/2014 .205 25,000,000.00 25,000,000.00 100.04 25,010,250.00 10,250.00FHLB 3YrNC1MoB 04/22/2016 .600 10,000,000.00 10,000,000.00 100.02 10,002,100.00 2,100.00FHLB 3YrNc1MoB 04/22/2016 .600 10,000,000.00 10,000,000.00 100.02 10,002,100.00 2,100.00FHLB 3YrNc1MoB 04/22/2016 .600 5,000,000.00 5,000,000.00 100.02 5,001,050.00 1,050.00FHLB 3.5YrNc3MoB 10/11/2016 .625 9,400,000.00 9,400,000.00 100.07 9,406,956.00 6,956.00FHLB 3.5YrNc3MoB 10/24/2016 .550 10,000,000.00 10,000,000.00 100.04 10,003,900.00 3,900.00FHLB 3YrNc1MoB 04/22/2016 .600 20,000,000.00 20,000,000.00 100.02 20,004,200.00 4,200.00FHLB 4YrNc3MoA 10/11/2016 .700 10,000,000.00 10,000,000.00 100.01 10,000,600.00 600.00
.371 1,338,435,000.00 1,338,616,699.37 100.08 1,339,482,574.50 865,875.13
FFCB DISC NOTE 08/29/2013 .190 10,000,000.00 9,981,105.56 99.98 9,998,000.00 16,894.44FFCB DISC NOTE 10/25/2013 .130 25,000,000.00 24,981,312.50 99.96 24,990,250.00 8,937.50
.147 35,000,000.00 34,962,418.06 99.97 34,988,250.00 25,831.94
FFCB 3Yr 06/03/2013 1.600 10,000,000.00 10,211,890.00 100.13 10,013,200.00 -198,690.00FFCB 3Yr 12/23/2013 1.300 5,000,000.00 5,000,000.00 100.75 5,037,400.00 37,400.00FFCB 3Yr 12/23/2013 1.300 5,000,000.00 5,000,000.00 100.75 5,037,400.00 37,400.00FFCB 3Yr 12/23/2013 1.300 5,000,000.00 5,015,550.00 100.75 5,037,400.00 21,850.00FFCB 2.5Yr 09/23/2013 .980 10,000,000.00 9,988,000.00 100.34 10,034,300.00 46,300.00FFCB 5Yr 04/20/2016 .269 10,000,000.00 9,995,000.00 100.06 10,006,400.00 11,400.00FFCB 2.5Yr 11/20/2013 .625 5,000,000.00 4,991,100.00 100.27 5,013,650.00 22,550.00FFCB 2Yr 09/23/2013 .350 10,000,000.00 9,990,100.00 100.10 10,009,500.00 19,400.00FFCB 2Yr 10/03/2013 .350 5,000,000.00 4,995,050.00 100.10 5,005,000.00 9,950.00FFCB 2Yr 01/03/2014 .400 6,000,000.00 5,997,600.00 100.18 6,010,500.00 12,900.00FFCB 1.5YrNc3MoE 08/07/2013 .180 5,000,000.00 4,995,500.00 100.00 5,000,050.00 4,550.00FFCB 3Yr 03/16/2015 .520 5,000,000.00 4,988,430.00 100.48 5,024,050.00 35,620.00FFCB 1.5Yr 11/18/2013 .300 5,000,000.00 5,000,000.00 100.09 5,004,650.00 4,650.00FFCB 1.5YrNc3MoA 08/07/2013 .180 10,000,000.00 9,984,000.00 100.00 10,000,100.00 16,100.00FFCB 1.5YrNc3MoA 08/07/2013 .180 5,000,000.00 4,994,100.00 100.00 5,000,050.00 5,950.00FFCB 1.75Yr 12/23/2013 .300 10,000,000.00 9,999,600.00 100.10 10,010,400.00 10,800.00FFCB 3Yr 05/01/2015 .500 5,000,000.00 4,997,000.00 100.44 5,021,900.00 24,900.00FFCB 1Yr 06/04/2013 .220 5,000,000.00 4,999,350.00 100.01 5,000,500.00 1,150.00FFCB 1Yr 06/11/2013 .220 5,000,000.00 4,999,600.00 100.01 5,000,600.00 1,000.00FFCB 3YrNc3MoA 09/28/2015 .450 5,000,000.00 4,995,000.00 100.00 5,000,200.00 5,200.00FFCB 1Yr 10/22/2013 .200 10,000,000.00 9,998,500.00 100.04 10,003,600.00 5,100.00FFCB 1Yr 02/26/2014 .200 4,995,000.00 4,994,500.50 100.04 4,997,097.90 2,597.40FFCB 2.5Yr 07/24/2015 .239 15,000,000.00 14,996,061.75 100.06 15,009,600.00 13,538.25FFCB 2Yr 12/24/2014 .250 25,000,000.00 24,971,750.00 100.03 25,007,750.00 36,000.00FFCB 2Yr 12/24/2014 .250 10,000,000.00 9,990,170.00 100.03 10,003,100.00 12,930.00FFCB 2Yr 01/07/2015 .250 10,000,000.00 9,988,850.00 100.02 10,002,300.00 13,450.00FFCB 1Yr 01/17/2014 .150 20,000,000.00 19,995,860.00 100.01 20,001,400.00 5,540.00FFCB 4Mo 07/03/2013 .240 22,900,000.00 22,907,625.70 100.02 22,905,038.00 -2,587.70FFCB 1.25Yr 05/13/2014 .200 25,000,000.00 25,000,000.00 100.04 25,009,500.00 9,500.00FFCB 1.25Yr 05/13/2014 .200 25,000,000.00 25,000,000.00 100.04 25,009,500.00 9,500.00FFCB 1.25Yr 05/13/2014 .200 25,000,000.00 25,000,000.00 100.04 25,009,500.00 9,500.00FFCB 1.25Yr 05/13/2014 .200 25,000,000.00 25,000,000.00 100.04 25,009,500.00 9,500.00FFCB 1.25Yr 05/13/2014 .200 25,000,000.00 25,000,000.00 100.04 25,009,500.00 9,500.00FFCB 2Yr 01/07/2015 .250 15,000,000.00 14,991,750.00 100.02 15,003,450.00 11,700.00FFCB 3YrNc1YrC 04/11/2016 .430 5,000,000.00 4,994,250.00 100.02 5,001,000.00 6,750.00
.339 393,895,000.00 393,966,187.95 100.09 394,249,085.90 282,897.95
FAMCA 2Yr 05/10/2013 .760 5,000,000.00 5,000,000.00 100.01 5,000,550.00 550.00FAMCA 2Yr 05/10/2013 .760 5,000,000.00 5,000,000.00 100.01 5,000,550.00 550.00FAMCA 2Yr 05/10/2013 .760 12,500,000.00 12,502,375.00 100.01 12,501,375.00 -1,000.00FAMCA 3Yr 07/02/2015 .550 10,000,000.00 9,989,000.00 100.32 10,031,500.00 42,500.00FAMCA 3YrNc1YrB 09/25/2015 .470 5,000,000.00 4,996,250.00 100.11 5,005,250.00 9,000.00
3133ECFD1 .200 1.034.137 .175
3133ECBA1 .251
1.0363133ECFD1 .200 1.034 1.036
3133ECD35 .172 .713 .7183133EAWQ7
31315PQK8 .587 2.152 2.17331315PVR7 .495 2.385 2.405
31315PVU0 .760 .027 .02731315PVU0 .750 .027 .027
FARMER MAC
31315PVU0 .760 .027 .027
3133ECKZ6 .469 2.924 2.951.333 1.035 1.040
3133ECFD1 .200 1.034 1.0363133ECCE2 .281 1.680 1.690
3133ECFD1 .200 1.034 1.0363133ECFD1 .200 1.034 1.036
.175
3133ECAV6 .300 1.644 1.6523133ECCE2 .306 1.680 1.690
2.227 2.2333133ECAV6 .307 1.644 1.652
3133EA5S3 .215 .479 .4793133EC4P6 .208 .821 .827
3133EATQ1 .228 .115 .1153133EA2K3 .484 2.394 2.414
3133EANJ3 .520 1.985 2.0033133EASH2 .233 .096 .096
3133EACJ5 .271 .271 .2713133EAKT4 .302 .645 .649
3133EALT3 .300 .548 .5533133EACJ5 .302 .271 .271
3133EACJ5 .240 .271 .2713133EAHP6 .598 1.864 1.877
31331KB82 .400 .426 .42731331K5K2 .420 .673 .679
31331KPD6 .700 .552 .55931331KZJ2 .400 .399 .400
31331KET3 1.029 .398 .40031331KHV5 .286 2.959 2.975
31331J6A6 1.300 .640 .64931331J6A6 1.184 .640 .649
31331JQU0 .752 .093 .09331331J6A6 1.300 .640 .649
.147 .442 .443FFCB BONDS
313313LA4 .190 .331 .332313313NK0 .130 .487 .488
.367 .792 .800FFCB DISC NOTES
313382R21 .600 2.947 2.981313380S57 .700 3.399 3.452
313382LE1 .625 3.404 3.452313382SL8 .550 3.445 3.488
313382R21 .600 2.947 2.981313382R21 .600 2.947 2.981
313382NP4 .205 1.042 1.044313382R21 .600 2.947 2.981
313382LN1 .600 2.927 2.962313382PP2 .850 4.871 4.989
313382LY7 .250 .943 .945313382PH0 .800 4.878 4.989
313382LY7 .250 .943 .945313382LY7 .250 .943 .945
313382DF7 .179 .818 .825313382MP5 .400 1.948 1.959
313382EG4 .193 .846 .847313382FU2 .163 .613 .616
313382DF7 .194 .818 .825313382EC3 .188 .849 .849
313382BT9 .187 .788 .795313382BT9 .185 .788 .795
313382BT9 .187 .788 .795313381PS8 .182 .685 .690
3133823V3 .177 .768 .775313381XU4 .500 4.721 4.795
3133824P5 .600 2.780 2.816313381VK8 .636 3.207 3.249
313381SV8 .500 2.722 2.751313381YP4 .293 1.799 1.811
313381NB7 .193 .671 .677313381NB7 .193 .671 .677
313381NB7 .193 .671 .6773133805Q6 .203 .729 .734
3133805Q6 .193 .729 .7343133803M7 .193 .729 .734
3133805T0 .233 .729 .734313380W52 .177 .421 .422
313381F67 .250 .646 .649313381H24 .307 1.705 1.715
313379NS4 .228 .568 .5733133762C8 .213 .573 .578
313380UF2 .625 4.375 4.449313380YF8 .203 .468 .468
313378LH2 .213 .380 .381313380QX8 .182 .131 .132
313380HU4 .197 .306 .307
RIVERISIDE COUNTY TREASURER-TAX COLLECTOR 11
DescriptionMaturity
Date Coupon Par
Value BookValue
MarketPrice
MarketValue
UnrealizedGain/Loss CUSIP
Month End Portfolio Holdings
Yield to Maturity
ModifiedDuration
Years ToMaturity
FAMCA 3YrNc1YrB 09/25/2015 .470 2,568,000.00 2,566,716.00 100.11 2,570,696.40 3,980.40FAMCA 5YrNc6MoB 11/03/2017 .700 10,000,000.00 10,000,000.00 100.00 10,000,300.00 300.00FAMCA 3YrNc6MoB 11/03/2015 .300 11,150,000.00 11,150,000.00 100.00 11,150,111.50 111.50FAMCA 1.25 Yr 02/19/2014 .250 5,000,000.00 4,999,050.00 100.08 5,004,100.00 5,050.00FAMCA 5YrNc6MoB 11/03/2017 .700 16,000,000.00 16,000,000.00 100.00 16,000,480.00 480.00FAMCA 2Yr 01/23/2015 .320 5,000,000.00 5,000,000.00 100.13 5,006,650.00 6,650.00FAMCA 1Yr 01/25/2014 .190 25,000,000.00 25,000,000.00 100.04 25,009,000.00 9,000.00FAMCA 15Mo 04/25/2014 .220 10,000,000.00 10,000,000.00 100.06 10,006,100.00 6,100.00FAMCA 1Yr 01/24/2014 .200 10,000,000.00 10,000,000.00 100.04 10,004,400.00 4,400.00FAMCA 3Yr 01/28/2016 .425 5,000,000.00 5,000,000.00 100.18 5,008,900.00 8,900.00FAMCA 5YrNc6MoB 04/03/2018 .750 10,000,000.00 10,000,000.00 100.17 10,017,400.00 17,400.00FAMCA 1.25Yr 06/10/2014 .220 25,000,000.00 25,000,000.00 100.05 25,013,500.00 13,500.00FAMCA 1.25Yr 06/10/2014 .220 20,000,000.00 20,000,000.00 100.05 20,010,800.00 10,800.00
.411 192,218,000.00 192,203,391.00 100.06 192,341,662.90 138,271.90
OHIO STATE GO 05/01/2013 .740 5,140,000.00 5,140,000.00 100.00 5,140,000.00 0.00OHIO STATE GO 05/01/2014 1.190 2,000,000.00 2,000,000.00 100.00 2,000,000.00 0.00OREGON STATE 11/01/2013 .480 3,595,000.00 3,595,000.00 100.00 3,595,000.00 0.00OREGON STATE 05/01/2013 .380 6,565,000.00 6,565,000.00 100.00 6,565,000.00 0.00MAIN ST GO 06/01/2013 2.000 1,500,000.00 1,526,895.00 101.79 1,526,895.00 0.00MICHIGAN ST GO 05/15/2013 .450 4,285,000.00 4,285,000.00 100.00 4,285,000.00 0.00CONNECTICUT ST 04/15/2014 .448 2,000,000.00 2,000,000.00 100.00 2,000,000.00 0.00CONNECTICUT ST 04/15/2015 .672 2,000,000.00 2,000,000.00 100.00 2,000,000.00 0.00MAIN ST GO 06/01/2013 2.000 3,500,000.00 3,556,980.00 101.63 3,556,980.00 0.00MAIN ST GO 06/01/2013 1.000 6,630,000.00 6,669,647.40 100.60 6,669,647.40 0.00TEXAS ST GO 04/01/2014 .300 18,105,000.00 18,105,000.00 100.00 18,105,000.00 0.00
.662 55,320,000.00 55,443,522.40 100.22 55,443,522.40 0.00
GE CAPITAL CORP 05/31/2013 .190 40,000,000.00 39,974,455.56 99.98 39,993,666.67 19,211.11GE CAPITAL CORP 06/13/2013 .190 30,000,000.00 29,981,000.00 99.98 29,993,191.67 12,191.67GE CAPITAL CORP 07/09/2013 .180 40,000,000.00 39,976,000.00 99.96 39,982,366.67 6,366.67GE CAPITAL CORP 08/21/2013 .180 25,000,000.00 24,980,625.00 99.92 24,980,555.56 -69.44EXXON MOBIL 05/02/2013 .080 100,000,000.00 99,992,000.00 100.00 99,999,472.22 7,472.22COCA-COLA CO 07/22/2013 .120 50,000,000.00 49,985,000.00 99.95 49,973,805.56 -11,194.44COCA-COLA CO 06/25/2013 .100 23,000,000.00 22,995,975.00 99.97 22,993,323.61 -2,651.39COCA COLA CO 07/23/2013 .120 30,000,000.00 29,991,500.00 99.95 29,984,091.67 -7,408.33
.133 338,000,000.00 337,876,555.56 99.97 337,900,473.63 23,918.07
TORONTO DOMINION 05/20/2013 .170 25,000,000.00 25,000,000.00 100.00 25,000,000.00 0.00TORONTO DOMINION 05/24/2013 .170 25,000,000.00 25,000,000.00 100.00 25,000,000.00 0.00TORONTO DOMINION 06/19/2013 .280 25,000,000.00 25,006,488.22 100.03 25,006,488.22 0.00TORONTO DOMINION 06/12/2013 .180 25,000,000.00 25,000,000.00 100.00 25,000,000.00 0.00RBC 06/21/2013 .160 50,000,000.00 50,000,000.00 100.00 50,000,000.00 0.00
TORONTO DOMINION 06/27/2013 .170 50,000,000.00 50,000,000.00 100.00 50,000,000.00 0.00.183 200,000,000.00 200,006,488.22 100.00 200,006,488.22 0.00
.376 5,576,595,000.00 5,577,075,042.55 100.10 5,582,276,144.63 5,201,102.08Grand Total .367 1.182 1.198
.171 .122 .122
78009NLW4 .160 .142 .142
89112WF36 .170 .159 .159
89112WPL5 .190 .137 .13789112WYV3 .180 .118 .118
89112WWP8 .170 .055 .05589112WXF9 .170 .066 .066
.133 .132 .132NCDS
19121ATR2 .100 .153 .15319121AUP4 .120 .230 .230
30229AS26 .080 .005 .00519121AUN9 .120 .227 .227
36959HU96 .180 .191
56052AXE1 .390
.192.120 .121
.443
36959HVM6 .180 .309 .310
36959HSX6 .190 .085 .08536959HTD9 .190
.494 .498COMM PAPER
.087 .0888827226W6 .300 .917 .921
20772JEE8 .672 1.942 1.95956052AXC5 .370 .087 .088
5946107P6 .450 .041 .04120772JED0 .448 .955 .959
68608UNZ5 .380 .003 .00356052AXC5 .401 .087 .088
677521LH7 1.190 .988 1.00368608UNX0 .480 .500 .507
MUNI BONDS
677521LG9 .740 .003 .003
31315PTZ2 .220 1.108 1.112.414 1.783 1.808
31315PRT8 .750 4.824 4.92931315PTM1 .220 1.108 1.112
31315PYE3 .200 .732 .73731315PYY9 .425 2.723 2.748
31315PXL8 .190 .735 .74031315PYL7 .220 .984 .986
31315PXD6 .700 4.416 4.51531315PWS4 .320 1.723 1.734
31315PWR6 .300 2.493 2.51231315PYX1 .265 .801 .808
31315PVR7 .487 2.385 2.40531315PWX3 .700 4.415 4.515
RIVERISIDE COUNTY TREASURER-TAX COLLECTOR 12

1 Mutual Funds maturity may be interpreted as weighted average maturity not exceeding 60 days. 2 Or must have an investment advisor with not less than 5 years experience and with assets under management of $500,000,000.
THIS COMPLETES THE REPORT REQUIREMENTS OF CALIFORNIA GOVERNMENT C0DE 53646
Investment Category
Maximum
Maturity
Authorized
% Limit
S&P/
Moody's
Maximum
Maturity Authorized % Limit S&P/ Moody's Actual %
MUNICIPAL BONDS
(MUNI)
5 YEARS NO LIMIT NA 3 YEARS 15% AA-/Aa3/AA- 0.99%
U.S. TREASURIES 5 YEARS NO LIMIT NA 5 YEARS 100% NA 11.57%
LOCAL AGENCY
OBLIGATIONS (LAO)
5 YEARS NO LIMIT NA 3 YEARS 2.5% INVESTMENT
GRADE
0.01%
FEDERAL AGENCIES 5 YEARS NO LIMIT AAA 5 YEARS 100% NA 65.16%
COMMERCIAL PAPER (CP) 270 DAYS 40% A1/P1 270 DAYS 40% A1/P1/F1 6.06%
CERTIFICATE & TIME
DEPOSITS (NCD & TCD)
5 YEARS 30% NA 1 YEAR 25% Combined A1/P1/F1 3.59%
REPURCHASE
AGREEMENTS (REPO)
1 YEARS NO LIMIT NA 45 DAYS 40% max, 25% in term
repo over 7 days
A1/P1/F1 5.38%
REVERSE REPOS 92 DAYS 20% NA 60 DAYS 10% NA 0.00%
MEDIUM TERM NOTES
(MTNO)
5 YEARS 30% A 3 YEARS 20% AA/Aa2/AA 0.00%
CALTRUST SHORT TERM
FUND
NA NA NA DAILY
LIQUIDITY
1.0% NA 0.97%
MONEY MARKET MUTUAL
FUNDS (MMF)
60 DAYS (1) 20% AAA/Aaa (2)
DAILY
LIQUIDITY
20% AAA by 2 Of 3
RATINGS AGC.
4.84%
LOCAL AGENCY
INVESTMENT FUND (LAIF)
NA NA NA DAILY
LIQUIDITY
Max $50 million NA 0.00%
CASH/DEPOSIT ACCOUNT NA NA NA NA NA NA 1.43%
GOVERNMENT CODE COUNTY INVESTMENT POLICY
The Treasurer’s Pooled Investment Fund was in FULL COMPLIANCE with the Treasurer’s Statement of Investment Poli-cy. The County’s Investment Policy is more restrictive than the California Government Code. This policy is reviewed annually by the County’s Investment Oversight Committee and approved by the County Board of Supervisors.
Full Compliance
RIVERSIDE COUNTY TREASURER-TAX COLLECTOR 13

County o f R ive rs ide T r e a s u r e r - T a x C o l l e c t o r
C a p i t a l M a r k e t s
4 0 8 0 L e m o n S t r e e t , 4 t h F l o o r R i v e r s i d e , C A 9 2 5 0 2 - 2 2 0 5
www.treasurer-tax.co.riverside.ca.us
( 9 5 1 ) 9 5 5 - 3 9 6 7