Embed Size (px)
Citation preview


\r f- \ '.
I99X.
jr- i^jj^rxiixi-i-^-" •* •*-
LIBRARYROOM moMAR 16 1993
''^'^ASURY DEPAPTMF'
DEPARTMENT OF THE TREASURYFINANCIAL MANAGEMENT SERVICE
OFFICE OF THE COMMISSIONERWASHINGTON, D.C. 20227
OFFICIAL BUSINESSPENALTY FOR PRIVATE USE, .$300 New this Issue
FIRST-CLASS MAILPOSTAGE & FEES PAIDDepartment of the Treasury
Permit No. G-4
PROFILE OF THE ECONOMYLEADING INDICATORS
The index of leading indicators
edged up in a modest 0.2 percent in
March after gains of 0.8 percent in
February and 1 .0 percent in January.
It was the first time the index has
risen for 3 straight months since mid-
1991. The March increase was less
than expected and not broadly based-
only consumer expectations and
commodity prices were significantly
improved. Two other of the 1
1
components were slightly positive,
while the remaining seven were
weak. But several components, such
as initial unemployment claims, could
contribute to a rise in April.
150
Ratio Scale:1 982=1 00
M91 A
1 1 1 1 r
O N D J92 F M
69 70 71 72 73 74 75 76 77 78 79 80 81 82 83 84 85 86 87 88 89 90 91 92* Note: Gray bare indicale recessions. The end of the current recession, which off icially began in July of 1990. has not yet been determined
See page 23 for more of Profile of the Economy
SEPTEMBER 1992
:easur"bulletin
A
r^i:f ^
ra^f^^n
W
UnmjBDnrw^
UJ
/ Department ofthe Treasury
FinancialManagementService/ V
TMMMg/ [1/ // /; i; 1 1 \ \x\
Additional Financial Management Service
Releases on Federal Finances
Sold on a subscription basis only (exceptions noted) by the Superintendent ofDocuments,
U.S. Government Printing Office, Washington, D.C. 20402:^
• Daily Treasury Statement. Provides summary data on the Treasury's cash and debt
operations for the Federal Government. Published each Federal working day. Sub-
scription price: $204 per year (domestic), $255 per year (foreign).
Monthly Treasury Statement of Receipts and Outlays of the United States Gov-
ernment. Provides Federal budget results, including receipts and outlays of funds,
the surplus or deficit, and the means of financing the deficit or disposing of the
surplus. Preparation based on agency reporting. Subscription price: $27 per year
(domestic), $33.75 per year (foreign).
Consolidated Financial Statements of the United States Government (annual).
Provides information about Government financial operations on the accrual
basis. Single copy price: $3.75.
• United States Government Annual Report and Appendix. Annual Report presents
budgetary results at the summary level. Appendix presents the individual receipt and
appropriation accounts at the detail level. Annual Report single copy price: $2.25.
Appendix free from Financial Management Service.
•
t Subscription orderform on inside back cover of this issue.
ON THE COVER: A line drawingfrom an old photograph of
Treasury's West Porlico, looking toward the Washington Monument.
^Compiled and Published by Financial Management Service
// // W
Office of the Secretary • Department of the Treasury • Washington, D.C.
The Treasury Bulletin is for sale by the Superintendent of Documents,
U.S. Government Printing Office, Washington, D.C. 20402
'1 he Treasury Bulletin is issued quarter!} in March, .June, September, and December bj the
Financial Management Service. The Reports Management Division, Financial Information
compiles articles of general interest as well as statistical data from sources within several
Treasury departmental offices and bureaus. Readers can contact the Financial Reports
Branch at (202) 208-1709 to inquire about any of the published information. Suggestions for
article subjects, tables or graphs are welcome.
TREASURY BULLETIN STAFF
Editor-in-Chief: Regina M. Dennis-Downing Managing Editor: Karen Y. Shepard
Assistant Editor: Stephen T. Wiley
Editorial Assistants: Bertha M. Butts and Bernice T. James
Contents
SEPTEMBER 1992
FINANCIAL OPERATIONS
PRORLE OF THE ECONOMYPOE-A."Chart: Growth of real gross domestic product 3POE-B."Chart: Federal outlays and receipts as a percent of gross domestic product 3POE-C."Chart: Personal Saving 4POE-D."Chart: Federal deficit 4POE-E."Chart: Real disposable personal income; real personal spending 5POE-R"Chart: Merchandise trade deficit 6POE-G.--Chart: Leading indicators 7
FEDERAL FISCAL OPERATIONSAnaiysis.-Budget results for the third quarter, fiscal 1992; Second-quarter receipts 9FFO-A.-Chart: Monthly receipts and outlays 11
FFO-B."Chart: Budget receipts by source 11
FFO-1 ."Summary of fiscal operations 12
FF0-2."0n-budget and off-budget receipts by source 13FFO-3.-On-budget and off-budget outlays by agency 15
FEDERAL OBUGATIONSF0-1."Grossobllgationsincurred within and outside the Federal Government by object class 18FO-A."Chart: Gross Federal obligations; gross Federal obligations incurred outside the Federal Government 19
FO-B.--Chart: Total gross Federal obligations 19FO-2.~Gross obligations incurred outside the Federal Government by department or agency 20
ACCOUNT OF THE U.S. TREASURYUST-1 ."Elements of changes in Federal Reserve and tax and loan note account balances 23
FEDERAL DEBTFD-1 .--Summary of Federal debt 25FD-2."lnterest-bearing public debt 26FD-3."Government account series 27FD-4."Interest-bearing securities issued by Government agencies 28FD-5."Maturity distribution and average length of marketable interest-bearing public debt held by private investors 29FD-6.--Debt subject to statutory limitation 29FD-7."Treasury holdings of securities issued by Government corporations and other agencies 30FD-A.--Chart: Average length of marketable debt 31
FD-B."Private hokSngs of Treasury marketable debt by maturity 32
PUBUC DEBT OPERATIONSTREASURY Fir^NCING 34PDO-1 ."Maturity schedule of interest-bearing marketable public debt securities other than regular weekly and 52-week
Treasury bills outstanding 38PD0-2."0fferings of bills 44PD0-3.-Public offerings of marketable securities other than regular weekly Treasury bills 46PDO-4.--Allotments by investor classes for public martcetable securities 49
U.S. SAVINGS BONDS AND NOTESSBN-1 .--Sales and redemptions by series, cumulative 52SBN-2."Sales and redemptions by period, all series of savings bonds and notes combined 52SBN-3.--Sales and redemptions by period, series E, EE, H, and HH 53
OWNERSHIP OF FEDERAL SECURITIESOFS-1 ."Distribution of Federal securities by dass of investors and type of issues 550FS-2.--Estimated ownership of public debt securities by private investors 56
MARKET YIELDSMY-1 ."Treasury maricet bid yields at constant maturities: bills, notes, and bonds 58MY-A."Chart: Yields of Treasury securities 59MY-2.--Average yields of long-term Treasury, corporate, and municipal bonds by period 60MY-B.~Chart: Average yields of long-term Treasury, corporate, and municipal borids 62
IV
Contents
Page
U.S. CURRENCY AND COIN OUTSTANDING AND IN CIRCULATIONUSCC-1 .-Amounts outstanding and in circulation; currency, coin 64USCC-2.-Amounts outstanding and in circulation: by denomination, per capita comparative totals 65
INTERNATIONAL STATISTICS
INTERNATIONAL FINANCIAL STATISTICSIFS-1.--U.S. Reserve assets 70IFS-2.--Selected U.S. liabilities to foreigners 71
IFS-3.~Nonmarketable U.S. Treasury bonds and notes issued to official institutions and other residents of foreign countries ... 72IFS-4.-Trade-weighted index of foreign currency value of the dollar 73
CAPITAL MOVEMENTS
LIABILITIES TO FOREIGNERS REPORTED BY BANKS IN THE UNITED STATESCM-l-1.-Totalliabililiesby type of holder 75CM-l-2.-Total liabilities by type, payable in dollars 76CM-l-3.-Total liabilities by country 77CM-M.-Totel liabilities by type and country 79CM-A.-Chaul: International liabilities 81
CLAIMS ON FOREIGNERS REPORTED BY BANKS IN THE UNITED STATESCM-ll-1.-Total claims by type 82CM-ll-2.-Total claims by country 83CM-ll-3.-Total claims on foreigners by type and country 85
SUPPLEMENTARY LIABILITIES AND CLAIMS DATA REPORTED BY BANKS IN THE UNITED STATESCM-lll-1.-Dolar claims on nonbank foreigners 87CM-B.-Chart: Claims on intematkinals 88
LIABILITIES TO, AND CLAIMS ON. FOREIGNERS REPORTED BY NONBANKING ENTERPRISES IN
THE UNITED STATESCM-IV-1 .-Total liabilities and claims by type 89CM-IV-2.-Total liabilities by country 90CM-IV-3.-Total liabilities by type and country 92
CM-IV-4.-Total claims by country 94CM-IV-5 .-Total claims by type and country 96
TRANSACTIONS IN LONG-TERM SECURITIES BY FOREIGNERS REPORTED BY BANKS AND BROKERS IN
THE UNITED STATESCM-C.-Chart Net purchases of long-term domestic securities by selected countries 98CM-V-1 .-Foreign purchases and sales of long-term domestic securities by type 99CM-V-2.-Foreign purchases and sales of long-term foreign securities by type 99CM-\/-3.-Net foreign transactions in long-term domestic securities by typie and country 100CM-V-4.-Foreign purchases and sales of long-term securities, by type and countay 102CM-V-5.-Foreign purcheises and sales of long-term securities, by type and country 104
FOREIGN CURRENCY POSITIONS
SUMMARY POSITIONSFCP-l-1.~Nonbanking firms' positions 107FCP-l-2."Weekly bank positions 107
CANADIAN DOLLAR POSITIONSFCP-ll-1 ."Nonbanking firms' positions 108FCP-ll-2.-Weekly bank positions 108
Contents
Page
GERMAN MARK POSITIONSFCP-lll-1.--Nonb«inking firms' positions 109FCP-lll-2.--Weekly bank positions 109
JAPANESE YEN POSITIONSFCP-IV-1 .--Nonbanking firms' positions 110FCP-IV-2.--Weekly bank positions 110
SWISS FRANC POSITIONSFCP-V-1.~Nonbanking firms' positions Ill
FCP-V-2.--Weekly bank positions Ill
STERLING POSITIONSFCP-VI-1 .--Nonbanking firms' positions 112FCP-VI-2."Weekly bank positions 112
U.S. DOLLAR POSITIONS ABROADFCP-VII-1 ."Nonbanking firms' foreian subsidiaries' positions 113FCP-VII-2."Weekly bank foreign subsidiaries' positions 113
EXCHANGE STABIUZAT10N FUNDESF-1."Balance sheet 116ESF-2."lncome and expense 116
SPECIAL REPORTS
CONSOLIDATED FINANCIAL STATEMENTS OF THE UNITED STATES GOVERNMENT FISCAL 1991 (EXCERPTED)United States Government Consolidated Statements of Financial Position 119CHART: Revenues and expenses 120CHART: Major sources of revenues 121CHART: Major categories of assets 122CHART: Assets, liabilities, and accumulated position 122CHART: Gross accounts and toans receivable 123CHART: Federal debt 124CHART: Commitments and contingencies 125
TECHNICAL PAPERS
REPORTSRecent pifttltshed Treasury reports and studies 129Research paper series 134INDEXTreasury Bultetin index 135
GLOSSARY 137
NOTESDefinitions for words shown in italics can be found in the glossary.
Details offigures may not add to totals because of rounding.
r represents Revised, p Preliminary, n.a. Not available.

Nonquarterly Tables and Reports
For the convenience of the 'Treasury Bulletin ' user, nonquarterly tables and reports are listed below alongwith the issues in which they appear
Issues
March June Sept.
Federal Fiscal Operations
FFO-4.-Summary of internal revenue collections by States and other areas V
Capital Movements
CM-lll-2.-Dollar liabilities to, and dollar claims on, foreigners in countries and
areas not regulaily reported separately
Dec.
Special Reports
Consolidated Rnandal Statements of the United States Government ....
Statement of Liabilities and Other Rnancial Commitments of the United
States Government V
Trust Fund Reports:
Civil sen/ice retirement and disability fund
Airport and airway trust fund V
Ast)estos trust fund V
Black lung disability trust fund V
Federal disability insurance trust furxJ
Federal hospital insurance trust fund
Federal okj-age and sun/ivors insurance trust fund
Federal supplementary medical insurance tmst fund
Hartxx maintenance tmst fund V
Hazardous substance superfund V
Highway trust fund V
Iriand waterways trust fund V
Leaking underground storage tank trust fund V
fslational sen/ice life ir\suranc8 fund
Nuclear waste fund ^
Railroad retirement account
Reforestation trust fund '^
Unemployment trust fund
Investments of specified trust accounts » V

FINANCIALOPERATIONS

Profile of the Economy
Quarterly Annual Rate
91,11 91,11! 91, IV 92,1 92,
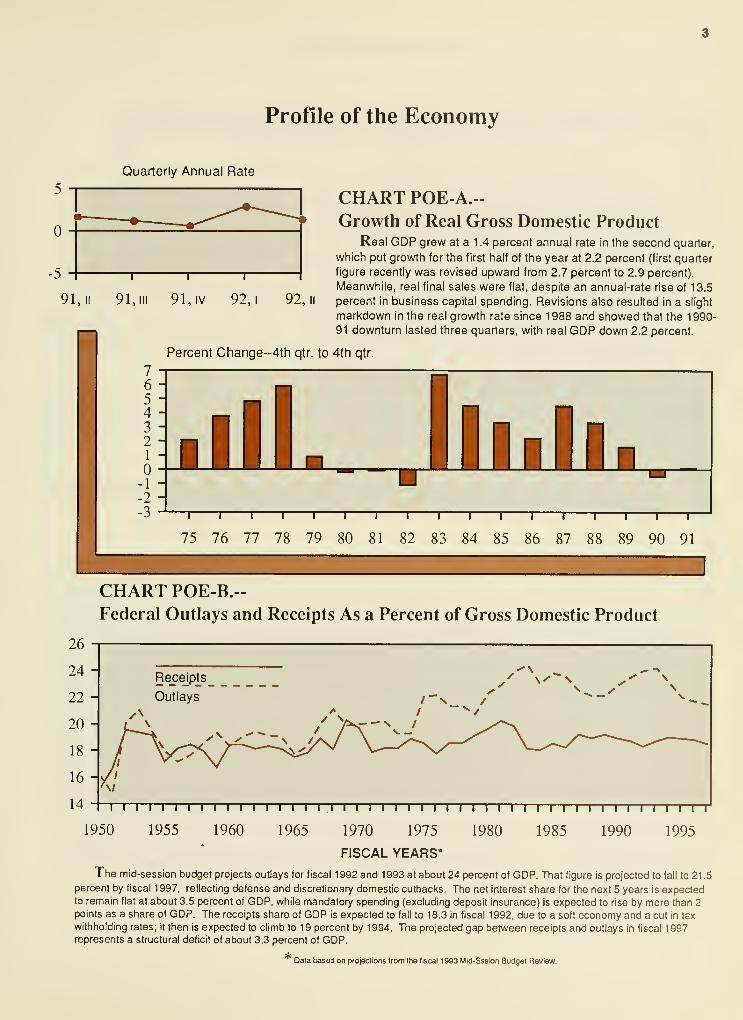
CHART POE-A.--
Growth of Real Gross Domestic ProductReal GDP grew at a 1 .4 percent annual rate in the second quarter,
which put growth for the first half of the year at 2.2 percent (first quarter
figure recently was revised upward from 2.7 percent to 2.9 percent).
Meanwhile, real final sales were flat, despite an annual-rate rise of 13.5
percent in business capital spending. Revisions also resulted in a slight
markdown in the real growth rate since 1 988 and showed that the 1 990-
91 downturn lasted three quarters, with real GDP down 2.2 percent.
Percent Change-4th qtr. to 4th qtr.
76543
21
-1
-2
-3
n
PROFILE OF THE ECONOMY
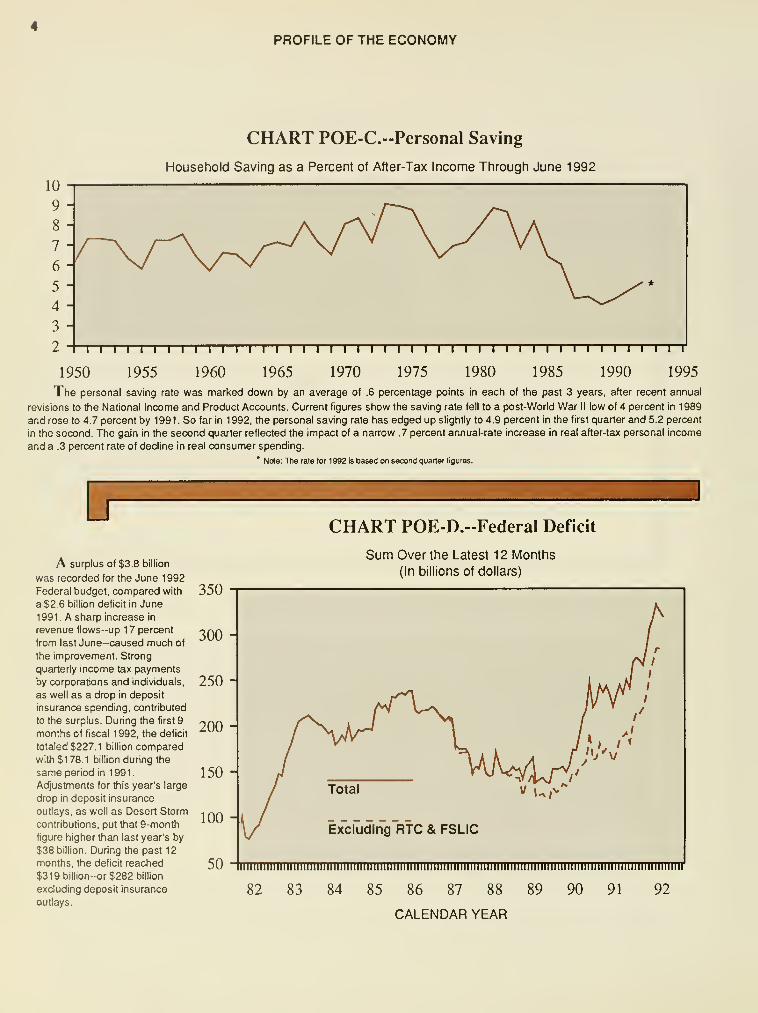
CHART POE-C.--Personal Saving
Household Saving as a Percent of After-Tax Income Through June 1992
1950 1955 1960 1965 1970 1975 1980 1985 1990 1995
The personal saving rate was marked down by an average of .6 percentage points in each of the past 3 years, after recent annual
revisions to the National Income and Product Accounts. Current figures show the saving rate fell to a post-World War II low of 4 percent in 1989
and rose to 4.7 percent by 1991. So far in 1992, the personal saving rate has edged up slightly to 4.9 percent in the first quarter and 5.2 percent
in the second. The gain in the second quarter reflected the impact of a narrow .7 percent annual-rate increase in real after-tax personal income
and a .3 percent rate of decline in real consumer spending.
* Note: The rate tor 1992 is based on second quarter (igures.
uCHART POE-D.--Federal DeHcit
A surplus of $3.8 billion
was recorded for the June 1992
Federal budget, compared with
a $2.6 billion deficit in June
1991 . A sharp increase in
revenue flows-up 1 7 percent
from last June-caused much of
the improvement. Strong
quarterly income tax payments
by corporations and individuals,
as well as a drop in deposit
insurance spending, contributed
to the surplus. During the first 9
months of fiscal 1992, the deficit
totaled $227.1 billion compared
with $178.1 billion during the
same period in 1991.
Adjustments for this year's large
drop in deposit insurance
outlays, as well as Desert Storm
contributions, put that 9-month
figure higher than last year's by
$38 billion. During the past 12
months, the deficit reached
$319 billion-or $282 billion
excluding deposit insurance
outlays.
Sum Over the Latest 1 2 Months
(in billions of dollars)
350
300 -
250 -
200 -
150 -
100 -
82 83 84 85 86 87 88
CALENDAR YEAR
PROFILE OF THE ECONOMY
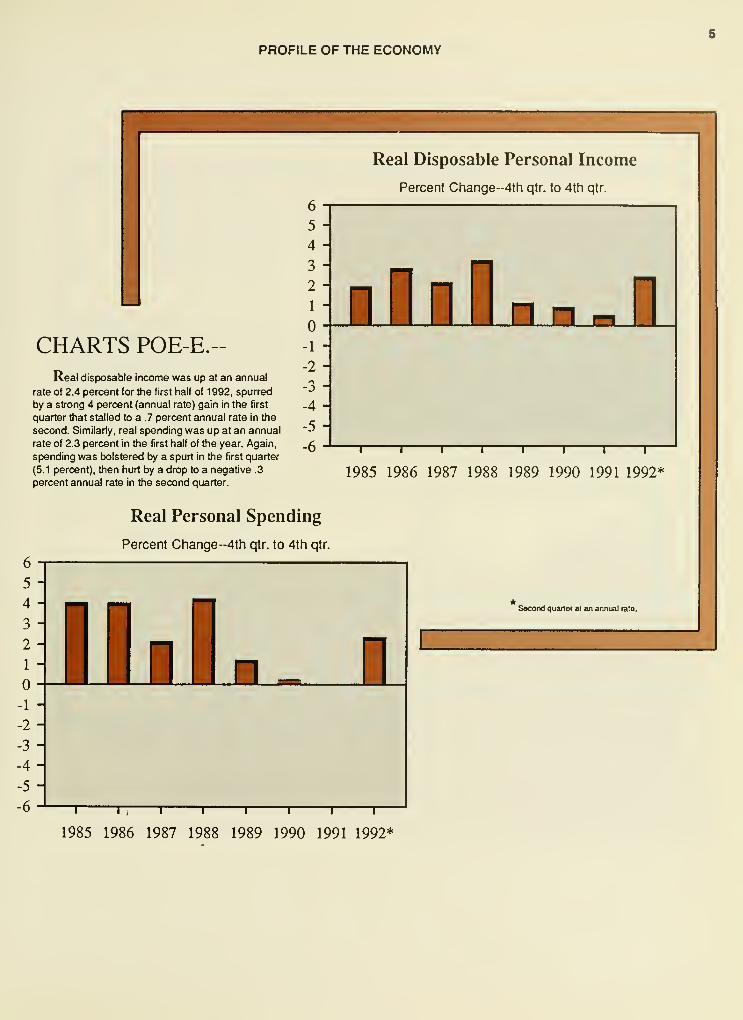
Real Disposable Personal Income
Percent Change--4th qtr. to 4th qtr.
CHARTS POE-E.--
Real disposable Income was up at an annual
rate of 2.4 percent for the first half of 1992, spurred
by a strong 4 percent (annual rate) gain in the first
quarter that stalled to a .7 percent annual rate in the
second. Similarly, real spending was up at an annual
rate of 2.3 percent in the first half of the year. Again,
spending was bolstered by a spurt in the first quarter
(5.1 percent), then hurt by a drop to a negative .3
percent annual rate in the second quarter.
Real Personal Spending
Percent Change--4th qtr. to 4th qtr.
T 1 1 1 1 1 1 r
1985 1986 1987 1988 1989 1990 1991 1992*
Second quarter al an annual rale.
T r 1 1 1 1 1 r
1985 1986 1987 1988 1989 1990 1991 1992*
PROFILE OF THE ECONOMY
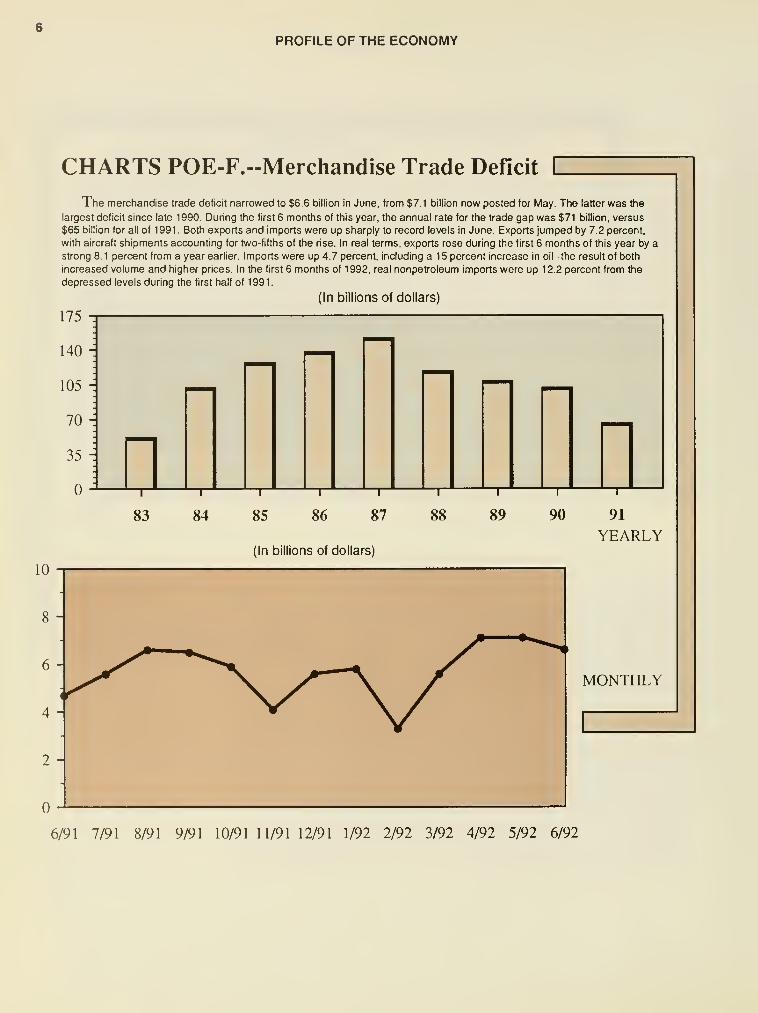
CHARTS POE-F.--Merchandise Trade Deficit
The merchandise trade deficit narrowed to $6.6 billion in June, from $7.1 billion now posted for May. The latter was the
largest deficit since late 1 990. During the first 6 months of this year, the annual rate for the trade gap was $71 billion, versus
$65 billion for all of 1991. Both exports and imports were up sharply to record levels in June. Exports jumped by 7.2 percent,
with aircraft shipments accounting for two-fifths of the rise. In real terms, exports rose during the first 6 months of this year by a
strong 8. 1 percent from a year earlier. Imports were up 4.7 percent, including a 1 5 percent increase in oil--the result of both
increased volume and higher prices. In the first 6 months of 1992, real nonpetroleum imports were up 12.2 percent from the
depressed levels during the first half of 1 99 1
.
(In billions of dollars)
175
6/91 7/91 8/91 9/91 10/91 11/91 12/91 1/92 2/92 3/92 4/92 5/92 6/92
PROFILE OF THE ECONOMY
CHARTS POE-G.-- Leading Indicators
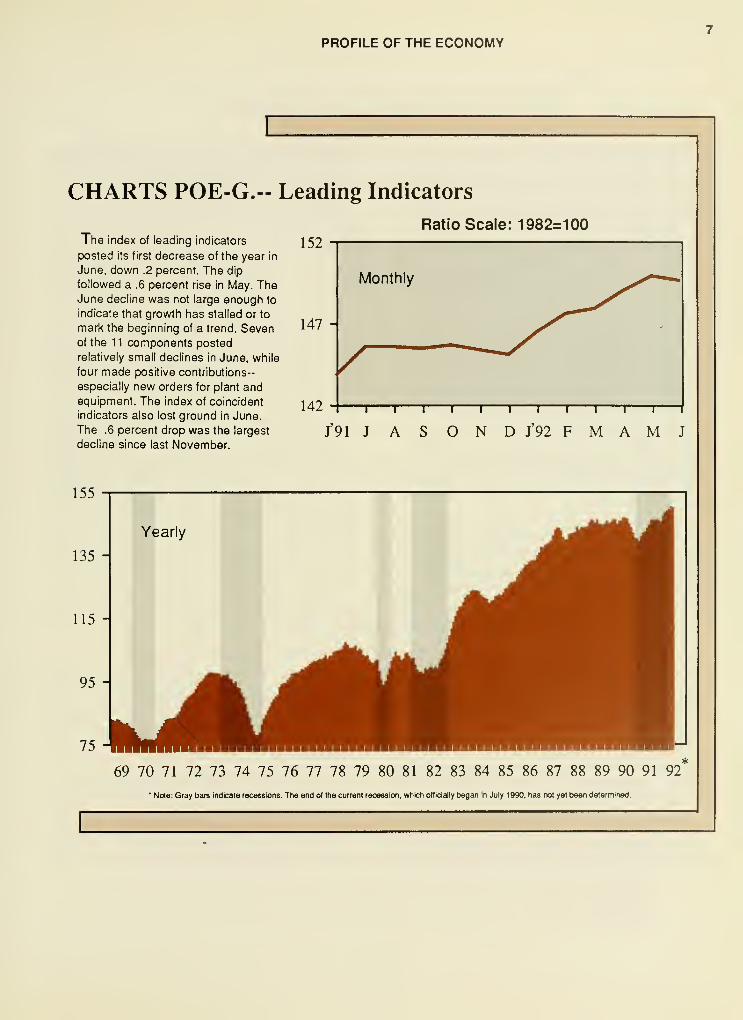
The index of leading indicators
posted its first decrease of the year in
June, down .2 percent. The dip
followed a .6 percent rise in l^ay. TheJune decline was not large enough to
indicate that growth has stalled or to
mark the beginning of a trend. Sevenof the 1 1 components posted
relatively small declines in June, while
four made positive contributions--
especially new orders for plant and
equipment. The index of coincident
indicators also lost ground in June.
The .6 percent drop was the largest
decline since last November.
Ratio Scale: 1982=100
/91 J A S O N D J'92 F M A M J
69 70 71 72 73 74 75 76 77 78 79 80 81 82 83 84 85 86 87 88 89 90 91 92
• No(e; Gray bars indicate recessions. The end of the current recession, which ofticially began in July 1990, has not yet been determined-
8
INTRODUCTION: Federal Fiscal Operations
Budget authority usually takes the form of appropriations that
allow obligations to be incurred and payments to be made. Reappro-
priatjons are Congressional actions that extend the availability of
unobligated amounts that have expired or would otherwise expire.
These are counted as new budget authority in the fiscal year of the
legislation in which the reappropriation act is included, regardless of
when the amounts were originally appropriated or when they would
otherwise lapse.
Obligations generally are liquidated by the issuance of checks or
the disbursement of cash-otrt/ays. Obiigatrons may also be liquidated
(arxi outlays recorded) by tlie accrual of interest on public issues of
Treasury debt securities (including ein increase in redemption value of
bonds outstancfing); or by the issuance of bonds, debentures, notes,
monetary credits, or electronic payments.
Refunds of collections generally are treated as reductions of
collections, whereas payments for eamed-income tax credits in excess
of tax liabilities are treated as outlays. Outlays during a fiscal year maybe for payment of obligations incurred in prior years or in ttie sameyear. Outlays, therefore, flow in part from unexpended balances of prior
year budget authority and from budget authority provided for the year
in which the money is spent Total outlays include both budget and
off-budget outlays and are stated net of offsetting oollectk>ns.
Receipts are reported in the tables as either budget receipts or
offsetting collections. They are collections from the public, excluding
receipts offset against outlays. These, also called governmental re-
ceipts, consist mainly of tax receipts (including social insurance taxes),
receipts from court fines, certain licenses, and deprosits of earnings by
the Federal Resen/e system. Refunds of receipts are treated as
deductions from gross receipts.
Offsetting collections from other Govemment accounts or the
public are of a business-type or mari<et-oriented nature. They are
classified as either collections credited to appropriations or fund ac-
counts, or offsetting receipts (i.e., amounts deposited in receipt ac-
counts). The fomier normally can be used without appropriation act by
Congress. These occur in two instances: (1) when authorized by law,
amounts collected for materials or services are treated as reimbwrse-
ments to appropriations, and (2) in the three types of revolving funds
(public enterprise, intragovemmental, and trust); collections are netted
against spending, and outlays are reported as the net amount
Offsetting receipts in receipt accounts cannot be used without
appropriation. They are subdivided into two categories; (1) proprietary
receipts, or collections from the public, offset against outlays by agencyand by function, and (2) intra-govemmsntal funds, or payments into
receipt accounts from govemment2il appropriation or fund accounts.
They finance operations within and between Govemment agencies
arxJ are credited with collections from other Govemment accounts.
Intrabudgetary transactions are subcfivided into three categories;
(1) interfund transactions-payments are from one fund group (either
Federal funds or trust funds) to a receipt account in tiie other fund
group; (2) Federal intrafund transactions-payments and receipts both
occur within the Federal fund group; and (3) trust intrafund transac-
tions-payments and receipts both occur within the tnjst fund group.
Offsetting receipts are generally deducted from budget authority
and outlays by function, subfunction, or agency. There are four types
of receipts, however, that are deducted from budget totals as undis-
tributed offsetting receipts. They are; (1 ) agencies' payments (including
payments by off-budget Federal entities) as employers into employees'
retirement funds; (2) interest received by trust funds; (3) rents androyalties on the Outer Continental Shelf lands; and (4) other interest
(i.e., that collected on Outer Continental Shelf money in deposit funds
when such money is transferred into the budget).
The Govemment has used the unified budget concept as afoundation for its budgetary analysis and presentation since 1 969. Theconcept calls for the budget to include all of the Govemmenfs fiscal
transactk)ns with the public. Since 1971, fiowever, various laws havebeen enacted removing several Federal entities from (or creating themoutside of) the budget. Other laws have moved certain off-budget
Federal entities onto the txidget. Under current law, the off-budget
Federal entities consist of the two Social Security trust funds. Federal
old-age arxJ survivors insurance, and Federal disability insurance.
Although an off-budget Federal entity's receipts, outlays, andsurplus or deficit ordinarily are not subject to targets set by the
congressional resolution, the Balanced Budget and Emergency Deficit
Control Act of 1985 (commonly known as the Gnamm-Rudman-Hollings Act) included off-budget surplus or deficit in calculating deficit
targets under that act and in calculating excess deficit. Partly for this
reason, attention has focused on both on- and off-budget receipts,
outlays, and deficit of the Govemment.
Tables FFO-1, FFO-2, and FFO-3 are published quatteriy andcover 5 years of data, estimates for 2 years, detail for 1 3 months, andfiscal year-to-date data. They provide a summary of data relating to
Federal fiscal operations reported by Federal entities and disbursing
officers, and daily reports from the Federal Reserve banks. They also
detail accounting transactions affecting receipts and outlays of the
Govemment and off-budget Federal entities and their related effect on
assets and liabilities of the Govemment. Data are derived from the
Monthly Treasury Statement of Receipts and Oubays of the United
States Govemment.
• Table FFO-1 summarizes the amount of total receipts, outlays,
and surplus or deficit, as well as transactions in Federal securities,
monetary assets, and balances in Treasury operating cash.
• Table FFO-2 includes on- and off-budget receipts by source.
Amounts represent income taxes, social insurance taxes, net contribu-
tions for other insurance and retirement, excise taxes, estate and gift
taxes, customs duties, and net miscellaneous receipts.
• Table FFO-3 details on- and off-budget outlays by agency.
• Table FFO-4 (Fall issue) summarizes intemal revenue collec-
tions by States and ottier areas and by type of tax. Amounts reported
are collections made in a fiscal year. They span several tax liability
years because they consist of prepayments (i.e., estimated tax pay-
ments and taxes withheld by employers for individual income andSocial Security taxes), of payments made with tax reUjms, and of
subsequent payments made after tax returns are due or are filed (i.e.,
payments wiUn delinquent returns or on delinquent accounts).
It is important to note Uiat Unese data do not necessarily reflect
the Federal tax burden of individual States. Amounts are reported
based on the primary filing address provided by each taxpayer or
reporting entity. For multistate corporations, tiie address may reflect
only tiie State where such a corporation reported its taxes from a
principal office ratiier than ottier States where income was eamed or
where individual income and Social Security taxes were withheld. In
addition, an individual may reside in one State and wori< in anoUier.
FEDERAL FISCAL OPERATIONS
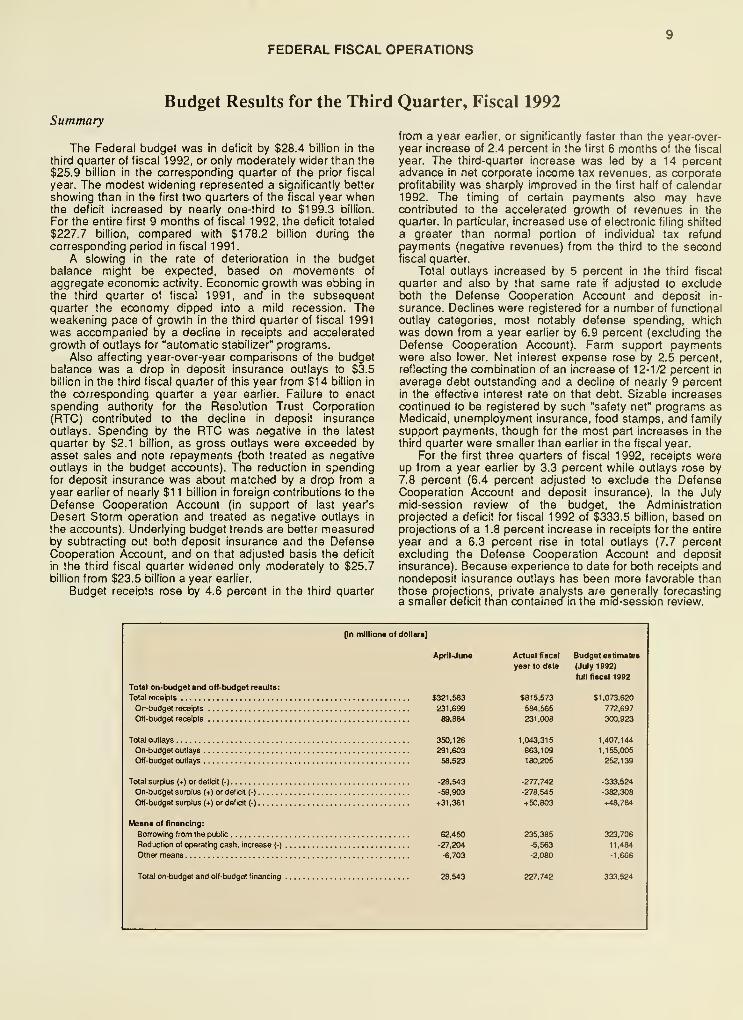
Budget Results for the Third Quarter, Fiscal 1992Summary
The Federal budget was in deficit by $28.4 billion in the
third quarter of fiscal 1992, or only moderately wider than the
$25.9 billion in the corresponding quarter of the prior fiscal
year. The modest widening represented a significantly better
showing than in the first two quarters of the fiscal year whenthe deficit increased by nearly one-third to $199.3 billion.
For the entire first 9 months of fiscal 1992, the deficit totaled
$227.7 billion, compared with $178.2 billion during the
corresponding period in fiscal 1991.
A slowing in the rate of deterioration in the budgetbalance might be expected, based on movements of
aggregate economic activity. Economic growth was ebbing in
the third quarter of fiscal 1991, and in the subsequentquarter the economy dipped into a mild recession. Theweakening pace of growth in the third quarter of fiscal 1991
was accompanied by a decline in receipts and accelerated
growth of outlays for "automatic stabilizer" programs.Also affecting year-over-year comparisons of the budget
balance was a drop in deposit insurance outlays to $3.5
billion in the third fiscal quarter of this year from $14 billion in
the corresponding quarter a year earlier. Failure to enactspending authority for the Resolution Trust Corporation(RTC) contributed to the decline in deposit insurance
outlays. Spending by the RTC was negative in the latest
quarter by $2.1 billion, as gross outlays were exceeded byasset sales and note repayments (both treated as negativeoutlays in the budget accounts). The reduction in spendingfor deposit insurance was about matched by a drop from ayear earlier of nearly $1 1 billion in foreign contributions to the
Defense Cooperation Account (in support of last year's
Desert Storm operation and treated as negative outlays in
the accounts). Underlying budget trends are better measuredby subtracting out both deposit insurance and the DefenseCooperation Account, and on that adjusted basis the deficit
in the third fiscal quarter widened only moderately to $25.7billion from $23.5 billion a year earlier.
Budget receipts rose by 4.6 percent in the third quarter
from a year earlier, or significantly faster than the year-over-year increase of 2.4 percent in the first 6 months of the fiscal
year. The third-quarter increase was led by a 14 percentadvance in net corporate income tax revenues, as corporateprofitability was sharply improved in the first half of calendar1992. The timing of certain payments also may havecontributed to the accelerated growth of revenues in the
quarter. In particular, increased use of electronic filing shifted
a greater than normal portion of individual tax refund
payments (negative revenues) from the third to the secondfiscal quarter.
Total outlays increased by 5 percent in the third fiscal
quarter and also by that same rate if adjusted to excludeboth the Defense Cooperation Account and deposit in-
surance. Declines were registered for a number of functional
outlay categories, most notably defense spending, whichwas down from a year earlier by 6.9 percent (excluding the
Defense Cooperation Account). Farm support paymentswere also lower. Net interest expense rose by 2.5 percent,
reflecting the combination of an increase of 12-1/2 percent in
average debt outstanding and a decline of nearly 9 percentin the effective interest rate on that debt. Sizable increases
continued to be registered by such "safety net" programs asMedicaid, unemployment insurance, food stamps, and family
support payments, though for the most part increases in the
third quarter were smaller than earlier in the fiscal year.
For the first three quarters of fiscal 1992, receipts wereup from a year earlier by 3.3 percent while outlays rose by7.8 percent (6.4 percent adjusted to exclude the DefenseCooperation Account and deposit insurance). In the July
mid-session review of the budget, the Administration
projected a deficit for fiscal 1992 of $333.5 billion, based onprojections of a 1.8 percent increase in receipts for the entire
year and a 6.3 percent rise in total outlays (7.7 percent
excluding the Defense Cooperation Account and deposit
insurance). Because experience to date for both receipts andnondeposit insurance outlays has been more favorable than
those projections, private analysts are generally forecastinga smaller deficit than contained in the mid-session review.
Total on-lxidget and oH-budget results:
Total receipls
On-budget receipts
Ot(-budget receipts
Total outlays
On-budget outlays
Otf-budget outlays
Total surplus () or delicit (-)
On-budget surplus (+) or deficit (-)
Off-budget surplus (*) or deficit (-)
Means of financing:
Borrowing from the public
Reduction of operating cash. Increase (-)
Otfief means
Total on-budget and off-budget financing 28,543
Pnmillions of dollars]
April-June
$321,583
10FEDERAL FISCAL OPERATIONS
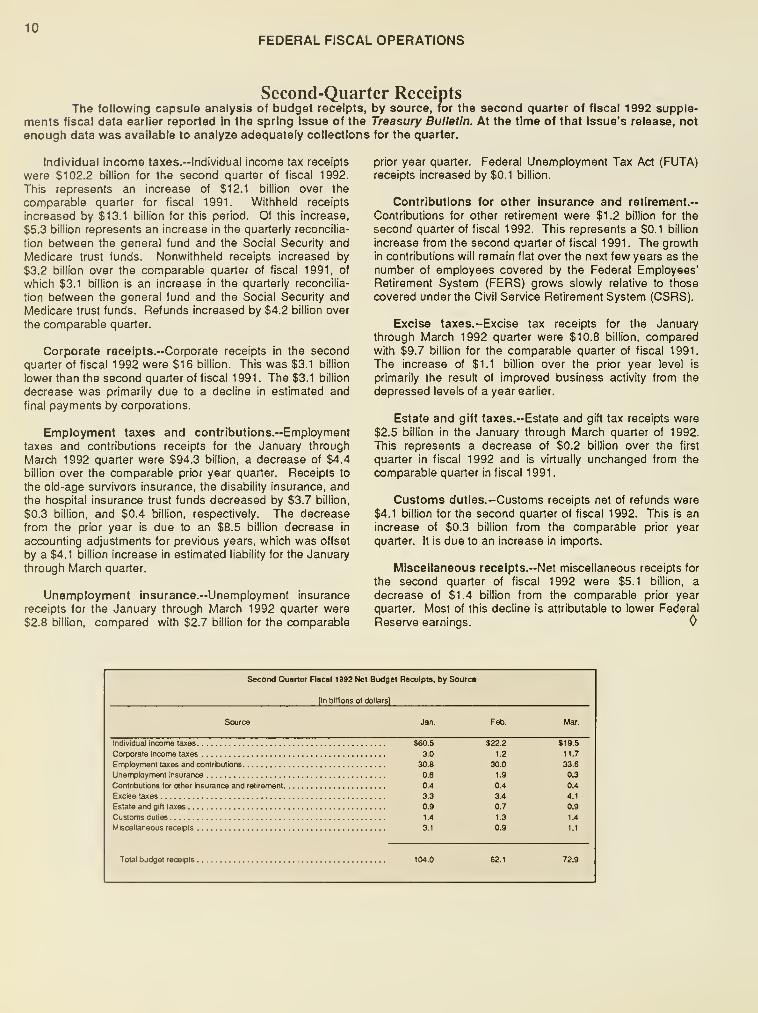
Second-Quarter ReceiptsThe following capsule analysis of budget receipts, by source, for the second quarter of fiscal 1992 supple-
ments fiscal data earlier reported in the spring issue of the Treasury Bulletin. At the time of that Issue's release, not
enough data was available to analyze adequately collections for the quarter.
Individual income taxes.--lndividual income tax receipts
were $102.2 billion for the second quarter of fiscal 1992.
This represents an increase of $12.1 billion over the
connparablG quarter for fiscal 1991. Withheld receipts
increased by $13.1 billion for this period. Of this increase,
$5.3 billion represents an increase in the quarterly reconcilia-
tion between the general fund and the Social Security and
Medicare trust funds. Nonwithheld receipts increased by
$3.2 billion over the comparable quarter of fiscal 1991, of
which $3.1 billion is an increase in the quarterly reconcilia-
tion between the general fund and the Social Security andMedicare trust funds. Refunds increased by $4.2 billion over
the comparable quarter.
Corporate receipts.-Corporate receipts in the second
quarter of fiscal 1992 were $16 billion. This was $3.1 billion
lower than the second quarter of fiscal 1 991 . The $3.1 billion
decrease was primarily due to a decline in estimated and
final payments by corporations.
Employment taxes and contributions.--Employment
taxes and contributions receipts for the January through
March 1992 quarter were $94.3 billion, a decrease of $4.4
billion over the comparable prior year quarter. Receipts to
the old-age survivors insurance, the disability insurance, andthe hospital insurance trust funds decreased by $3.7 billion,
$0.3 billion, and $0.4 billion, respectively. The decrease
from the prior year is due to an $8.5 billion decrease in
accounting adjustments for previous years, which was offset
by a $4.1 billion increase in estimated liability for the January
through March quarter.
Unemployment lnsurance.--Unemployment insurance
receipts for the January through March 1992 quarter were$2.8 billion, compared with $2.7 billion for the comparable
prior year quarter. Federal Unemployment Tax Act (FUTA)receipts increased by $0.1 billion.
Contributions for other insurance and retirement.--
Contributions for other retirement were $1.2 billion for the
second quarter of fiscal 1992. This represents a $0.1 billion
increase from the second quarter of fiscal 1991. The growth
in contributions will remain flat over the next few years as the
number of employees covered by the Federal Employees'Retirement System (FERS) grows slowly relative to those
covered under the Civil Service Retirement System (GSRS).
Excise taxes.-Excise tax receipts for the January
through March 1992 quarter were $10.8 billion, comparedwith $9.7 billion for the comparable quarter of fiscal 1991.
The increase of $1.1 billion over the prior year level is
primarily the result of improved business activity from the
depressed levels of a year earlier.
Estate and gift taxes.-Estate and gift tax receipts were
$2.5 billion in the January through March quarter of 1992.
This represents a decrease of $0.2 billion over the first
quarter in fiscal 1992 and is virtually unchanged from the
comparable quarter in fiscal 1 991
.
Customs duties.-Customs receipts net of refunds were
$4.1 billion for the second quarter of fiscal 1992. This is an
increase of $0.3 billion from the comparable prior year
quarter. It is due to an increase in imports.
Miscellaneous receipts.-Net miscellaneous receipts for
the second quarter of fiscal 1992 were $5.1 billion, a
decrease of $1.4 billion from the comparable prior year
quarter. Most of this decline is attributable to lower Federal
Reserve earnings.
Second Quarter Fiscal 1992 Net Budget Receipts, by Source
[In billions of dollars]
Source Jan.
Individual income taxes S60.5
Corporate income taxes 3.0
Employment taxes and contributions 30.8
Unemployment insurance 0.6
Contribulions for otiier insurance and retirement 0.4
Excise taxes 3.3
Estate and gift taxes 0.9
Customs duties 1 .4
Miscellaneous receipts 3.1
Total budget receipts 104.0
Feb. Mar.
S22.2
FEDERAL FISCAL OPERATIONS11
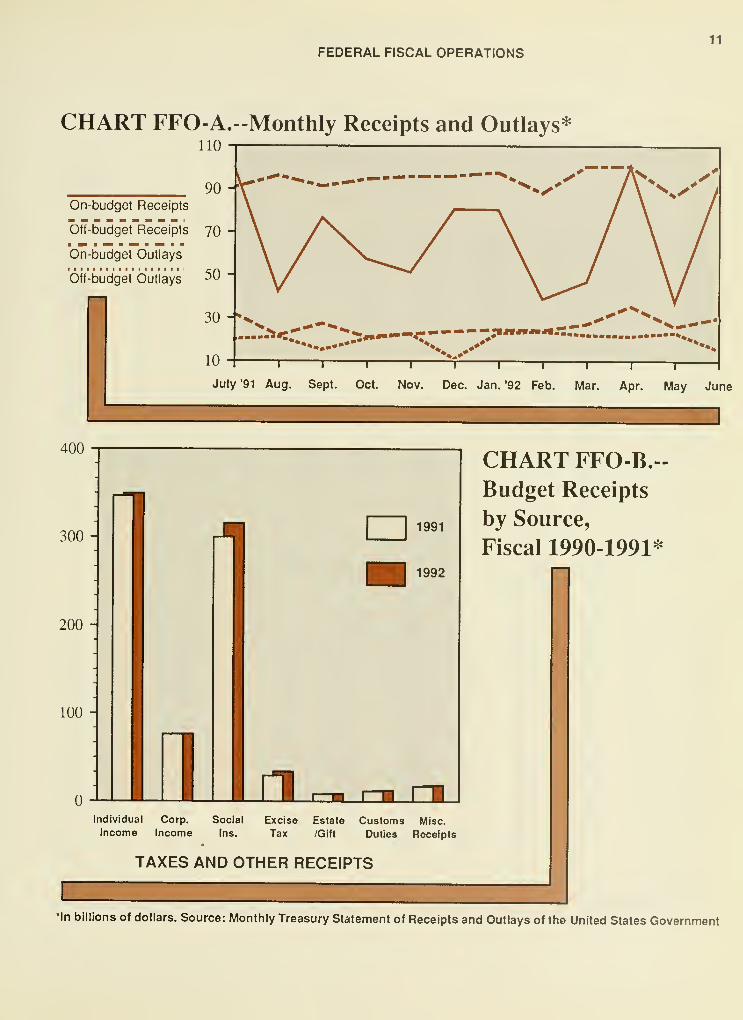
CHART FFO-A.-Monthly Receipts and Outlays*110
90 -^
On-budget Receipts
Off-budget Receipts 70
On-budget Outlays
bff-budget' Outlays 50
30
10
July '91 Aug. Sept. Oct. Nov. Dec. Jan. '92 Feb. Mar. Apr. May June
400
300 -
CHART FFO-B."Budget Receipts
by Source,
Fiscal 1990-1991*
200 -
100 -
Individual Corp. Social Excise Estate Customs Misc.
Income Income Ins. Tax /Gift Duties Receipts
TAXES AND OTHER RECEIPTS
*ln billions of dollars. Source: Monthly Treasury Statement of Receipts and Outlays of the United States Government
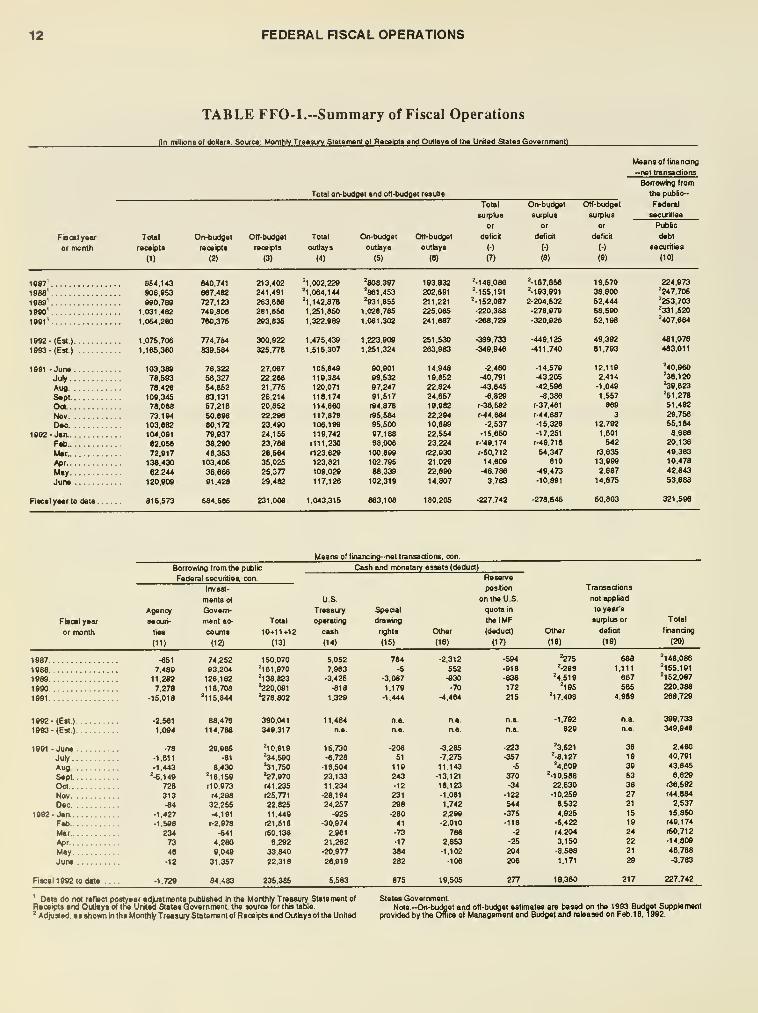
12 FEDERAL RSCAL OPERATIONS
TABLE FF0-1.--Summary of Fiscal Operations
(In nmlliona of dollara. Soure«: MonthMreasurv Staienwni ol Receipla and Omiavs ol the United Sales Govefnmeni)
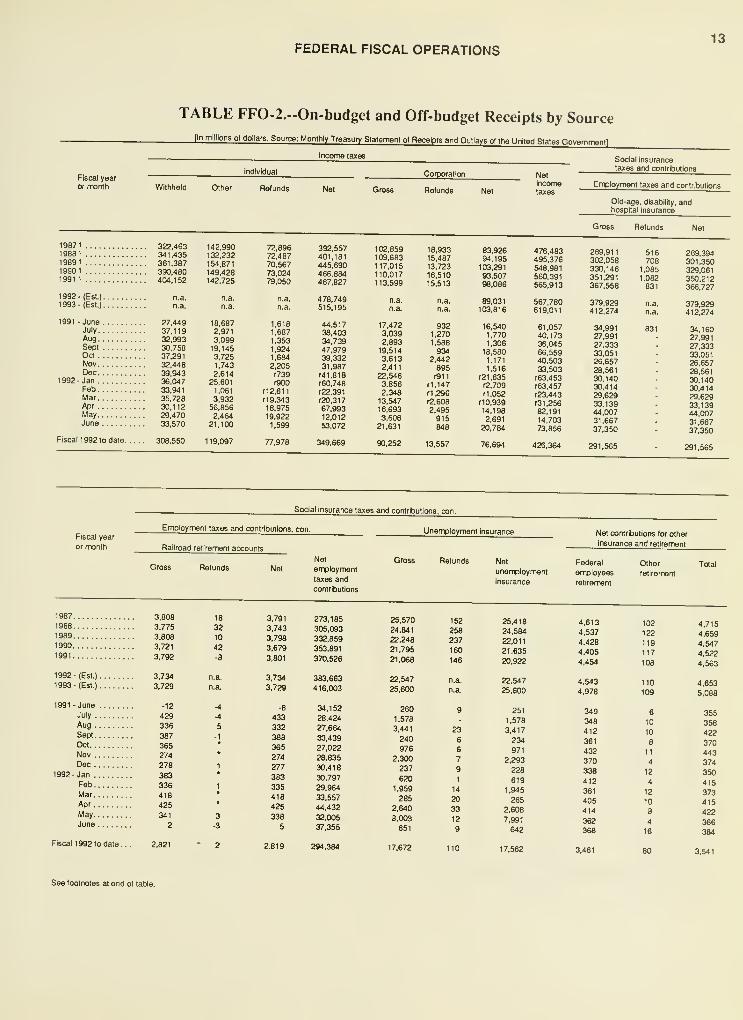
FEDERAL FISCAL OPERATIONS13
TABLE FF0-2.--0n-budget and Off-budget Receipts by Source
[In millions of dollars. Source: Monthly Treasury Slalement of Receipts and Outlays of the United Slates Governmenll
Fiscal year
or month Withheld Refunds
Income taxes
Net Gross
Corporation
Refunds
Netincometaxes
Social Insurancetaxes and contributions
Errployment taxes and contrbutions
Old-age. disability, andhospital insurance
Gross Refunds
1987
1
322.463 142.99019881 341.435 132.23219B91 361.387 154.8711990
1
390.480 149.4281991 1 404.152 142.725
1992- (Est.) n.a. n.a.1993 -(Est.) n.a. n.a.
1991 - June 27.449 18.687July 37.119 2.971Aug 32.993 3,099Sept 30.758 19.145Oct 37.291 3.725Nov 32.448 1.743Dec 39.943 2.614
1992 -Jan 36.047 25.601Feb 33.941 1.061Mar 35.728 3.932Apr 30.112 56.856May 29.470 2.464June 33.570 21.100
Fiscal 1 992 to date 308.550 1 19.097
72.89672.48770.56773.02479.050
n.a.
n.a.
1.618
1.687
1.353
1.9241.684
2.205f739f900
M2.611rl9.343
18.975
19.922
1.599
77.978
392,557401.181
445.690466.884467.827
478.749515.195
44.51738.40334.73947.97939.33231.987r41.818r60.748r22.391
r20.317
67.99312.012
53.072
349.669
102.859109.683117.015110.017113.599
n.a.
17.4723.0392.893
19.5143.6132.411
22.5463.856
2.34813.54716.693
3.60621.631
90.252
18.93315.487
13.723
16.51015.613
n.a.
n.a.
9321.270
1.588934
2.442895r911
r1.147
r1.296
r2.608
2.495915848
13.557
83.92694.195
103.291
93.50798.086
89.031103.816
16.5401.770
1.306
18.5801.171
1.516r21.635r2.709
r1.052
rlO.939
14.198
2.691
20.784
76.694
476.483495.376548.981
560.391565,913
567.780619.011
61.05740.17336.04566.55940.50333.503r63.453
r63.457
f23.443
r31.25682.191
14.703
73.856
426.364
269,911302.058330.146351.291367.558
379.929412.274
34,99127.991
27.33333.05126.65728.561
30.14030.41429.62933.13944.00731.667
37.350
291.565
516708
1.085
1.082831
n.a.
n.a.
269.394301.350329.061
350.212366.727
379.929412.274
34.16027.99127,33333.05126,65728,561
30,14030,41429,62933,13944,00731,66737,350
291,565
Social Insurance laxes and contrbutloris, con.
Fiscal year
or month
Employment taxes and contributions, con.
Railroad retirement accounts
Gross
1987
1988
1989
1990
1991
1992- (Est.)
1993- (Est.)
1991 -June
July
Aug
Sepi
Oct
NovDec
1992- Jan
Feb
Mar
Apr
MayJune
Fiscal 1992 to date.
3,808
3,775
3,808
3,721
3,792
3,734
3,729
-12
429336
387
365274
278
383
336
418425
341
2
Refunds
18
3210
42-8
n.a.
n.a
-4
-4
S
-1
Net
3.791
3.743
3.798
3.679
3.801
3.734
3.729
-8
433
332
388
365274
277
383335
418425
338
5
2.819
Net
employment
laxes and
contrbutions
273.185
305.093
332,859
353.891
370.526
333.663
416.003
34.152
28.424
27.664
33.439
27.022
28.835
M.418M.79729.964
33.557
44.432
32,005
37.355
294.384
Unemployment insurance
Gross
25.570
24,841
22.248
21.795
21.068
22.547
25.600
2601.578
3.441
240
976
2.300
237
620
1.959
285
2.640
8.003
651
17.672
Refunds
152
258
237160
146
n.a.
n.a.
23
6
6
7
9
1
14
20
33
12
9
25.418
24.584
22.011
21.635
20.922
22.547
25.600
251
1.578
3.417
234
971
2.293
228
613
1.945
265
2.608
7.991
642
17.562
Net contrbutions for other
insurance and retirement
Net
14
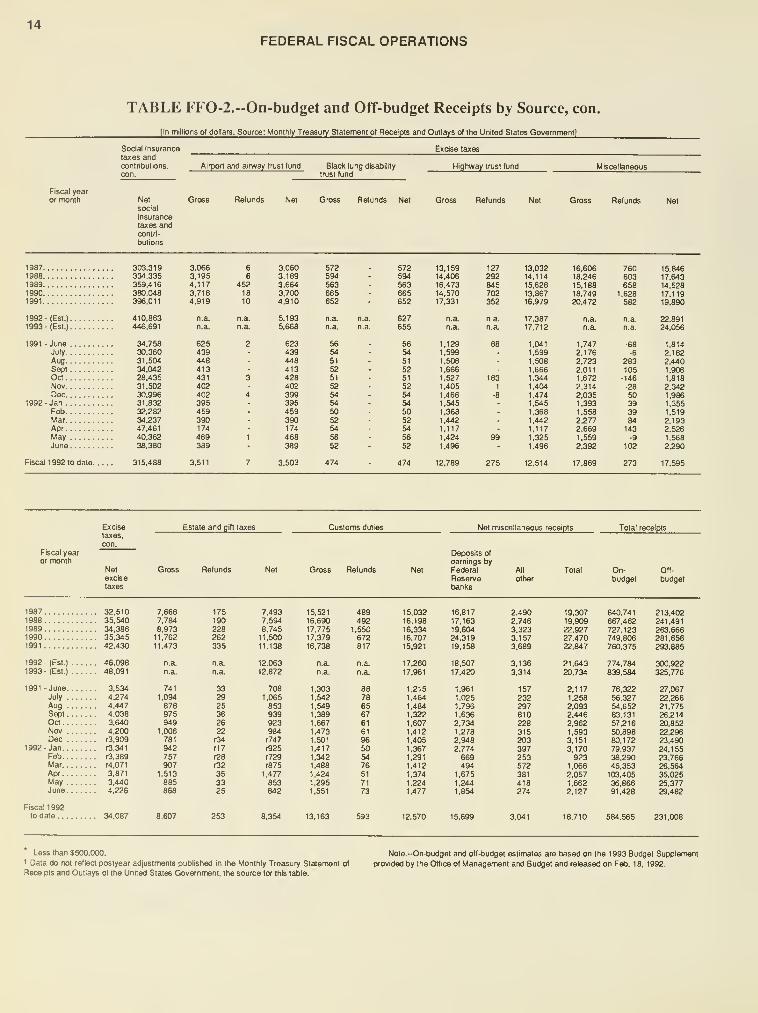
FEDERAL FISCAL OPERATIONS
TABLE FF0-2.--0n-budget and Off-budget Receipts by Source, con.
[In millions of dollars. Source:_MofHMy Treasury StatemefH of Receipts and Outlays of the United Slates Government]
Fiscal yearor month
Social insurance
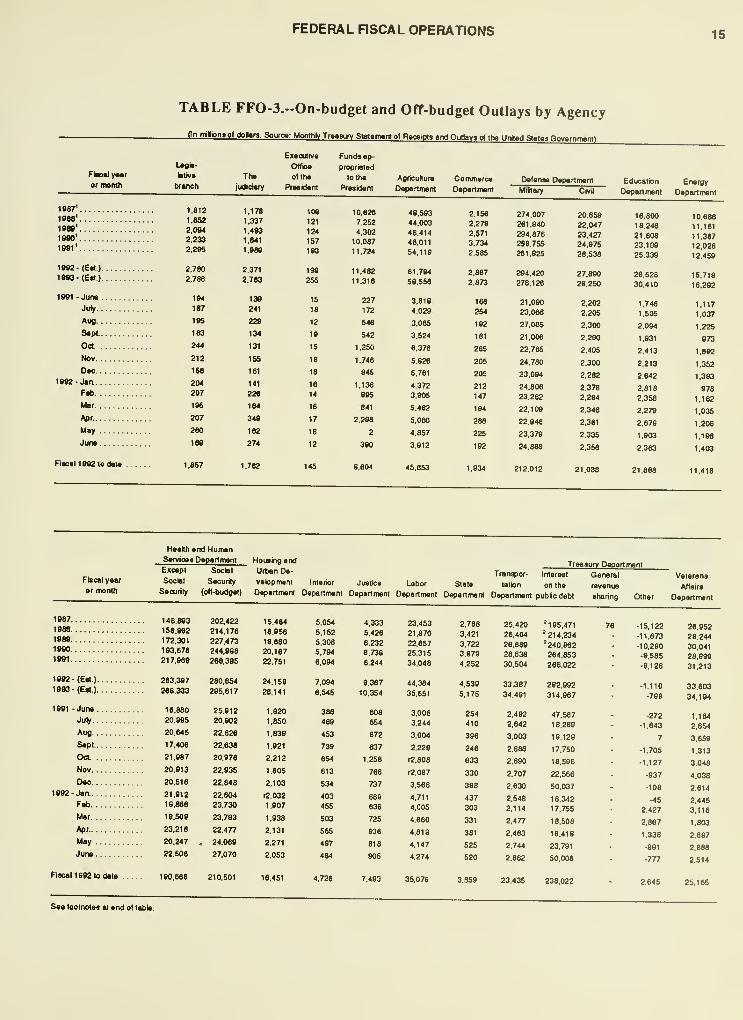
FEDERAL RSCAL OPERATIONS 15
Final /Mror month
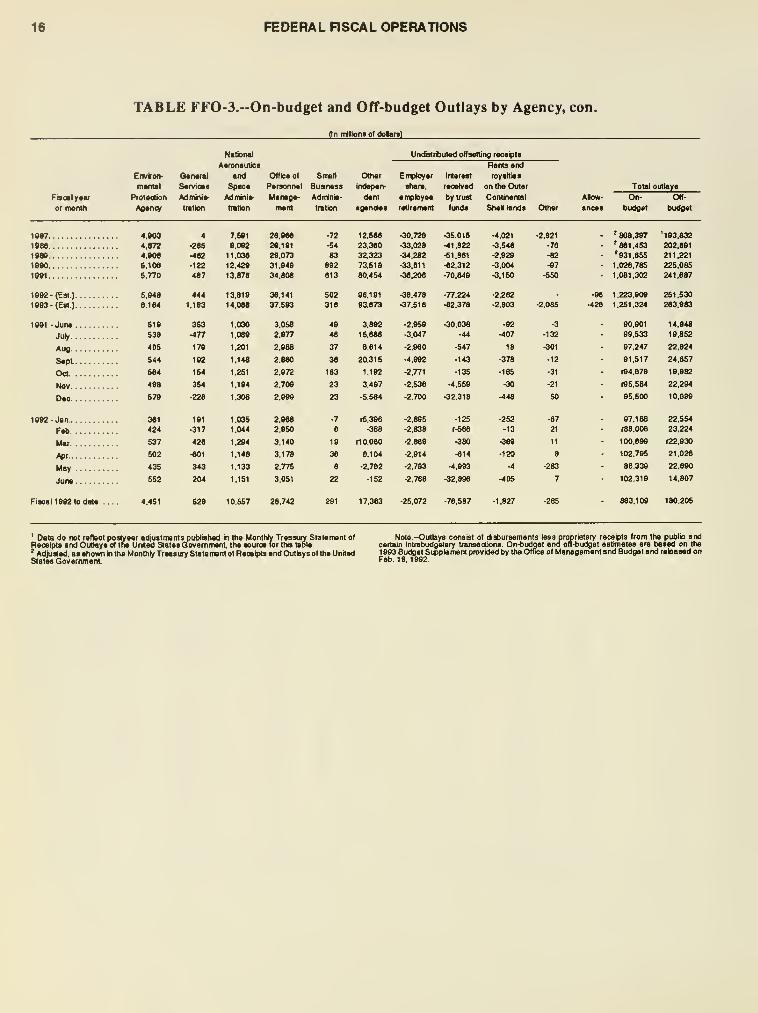
TABLE FFO-3."On-budget and Off-budget Outlays by Agency
H" niliont of dotera Soufo: Monthly Tr«a3ury SttlemenI ol Rgcaipo and Oudava o( lh» Unilad a«t8s Governmenll
Lagia-
lativa
branch
1»87' 1.8121»«8' 1,eS21989' 2.09419S0' 2.2331»81' 2.29S
1992 -(EH.) 2.7901093- (Eat.) 2.7M
1091 -Juno 194
July 187
Aug 195
S*pt 183
Oct 244
Nov 212
Dao 158
1992- Jan 204
Fab 207
Mar 196
Apr 207
May 260
Junt 180
RacaM992todaM 1,867
Tha
judiciary
1.178
1.337
1.493
1.841
1,989
2.371
2.783
139
241
229
134
131
155
181
141
226
164
349
182
274
1.762
Exacutiva
Olfio*
oltha
Praaidant
109
121
124
157
193
19G
25S
15
18
12
19
15
18
18
18
14
16
17
18
12
Fundaap-
propriatad
toiha
Praaidant
10,626
7.252
4.302
10,087
11.724
11,482
11,316
227
172
548
542
1,250
1.748
845
1.136
895
841
2.288
2
380
8.604
Agricullura
Oapartment
Commarca
Dapartmem
48,593
44.003
48.414
46.011
54.119
61.794
58.556
3.818
4.029
3.085
3.524
6.376
5.826
5.761
4.372
3.805
5,462
5,060
4,857
3,912
45,653
2,158
2.278
2.571
3.734
2.585
2.867
2.873
166
254
182
161
265
205
205
212
147
184
268
225
192
Dafanae Dapartmant
Mjfitary Civil
Education Enaryy
Dapatlment Dapartmant
274.007
281.840
284.876
289.755
261.825
294.420
278126
21.090
23.066
27.065
21.006
22.765
24.780
23.084
24.806
23.262
22.109
22.848
23.378
24.866
212.012
20.659
22.047
23.427
24.975
26.538
27.880
28.250
2.202
2.205
2.300
2,280
2,405
2.300
2.262
2.376
2.284
2.346
2.361
2.335
2.358
21.038
16.800
18.246
21.608
23.109
25.338
26.528
30.410
1.748
1.505
2.094
1.831
2.413
2.213
2.642
2.818
2,358
2,279
2,679
1,903
2,363
21,666
10,688
11.161
11.387
12.028
12.459
15.718
16.292
1.117
1.037
1.225
873
1.692
1.352
1.383
978
1.162
1.035
1.208
1.188
1.403
11.418
Haath and HumanSarvioaa DapartmonI
Fiscal yaar
or month
Excapt
Social
Social
Sacurity
Houaingand
Urban Da-
vaiopmantTran^or- Intarast
Intarior Justica Labor stats taiion on thaSacurily (ofl-budg*) Dapartmant Dapartmant Department Dapartment Departmani Department pubUcdebl
Treasury DepartmenI
General
revenue
sharing
Veterans
Affairs
Other Depart mant
1M7 148.883 20a4221988 158.992 214.1781989 172.301 227.4731990 193.678 244.9981991 217.888 286.396
1992 (Eal.) 263.397 280.8541993 -(E««) 288.333 285.817
1881 -June 16.880 25.912
July 20.905 20.902
Aug 20,845 22,626
Sapt 17.408 22.838
Oct 21.987 20.876
Nov 20.913 22.835
0*0 20.516 22.848
1992- Jaa 21.812 22.604
Fab 19.866 23.730
Mar 19.509 23.793
Apr. 23.218 22.477
May 20.247 . 24.069
Jura 22.608 27.070
Fiscal 1892 to dale 190,668 210.501
15.464
18.958
18.680
20.187
22.751
24,158
28.141
1.920
1.850
1.839
1.821
2.212
1.805
2.103
r2.032
1.907
1.838
2.131
2.271
2.053
18.451
5.054
5.152
5.308
5.784
6.094
7,084
6,545
388
468
453
739
654
613
534
403
455
503
585
487
484
4,333
5.426
6,232
6,738
8,244
9,367
10,354
808
654
672
637
1,258
786
737
689
636
725
936
816
905
23,453
21,870
22.657
25.315
34.048
44.384
35.651
3.008
3.244
3.004
2.228
r2.808
r2.087
3.568
4.711
4.005
4,660
4,819
4.147
4.274
35.078
2.788
3.421
3.722
3.878
4.252
4.539
5.175
254
410
386
246
633
330
388
437
303
331
381
525
520
3.858
25.420
26.404
28.688
28.638
30.504
33,367
34.481
2.482
2.642
3.003
2.686
2.880
2.707
2.630
2.548
2.114
2.477
2.463
2.744
2,862
23,435
'185,471
'214,234
'240,862
264,853
266,022
292,892
314,867
47.587
18.288
18.129
17.750
18586
22.566
50.037
1834217.755
18.508
18.418
23.791
50.008
238.022
•15.122
-11.673
-10.280
-9585
-8.128
-1,110
-788
-272
-1,843
7
-1.705
-1.127
-837
-108
-45
2.427
2.887
1,338
-991
-777
2.645
26.852
28.244
30.041
28.889
31.213
33.603
34.194
1.164
2.854
3.658
1.313
3.048
4.038
2,614
2.445
3.118
1.803
2.897
2.688
2.514
25.185
Sae footnotes at and ol table.
16 FEDERAL HSCAL OPERATIONS
TABLE FFO-3.--On-budget and Off-budget Outlays by Agency, con.
fln mlllona of dolaral
17
INTRODUCTION: Federal Obligations
The Federal Government controls the use of funds throughobligations. Obligations are recorded when the Government ma)<es acommitment to acquire goods or sen^ices. Obligations are the first offour key events that characterize the acquisition and use of resources:order, payment, delivery, and consumption. In general, they consist olorders placed, contracts awarded, services received, and similar trans-actions requiring the cfisbursement of money
The obligational stage of a Government transaction is a strategicpoint in gauging the impact of the Government's operations on thenational economy because it frequently represents a Governmentcommitment that stimulates txisiness Investments, such as inventorypurchases and employment Though payment may not occur for
months after the Government places its order, the order itself cancause immediate pressure on the private economy
An obligation is classified by the nature of the transaction, withoutregard to its ultimate purpose. For example, all salaries and wages arereported as personnel compensation, whether the services are usedin current operations or in the construction of capital items.
Federal agencies often do business with one another In doingso, the "buying" agency records obligations and the "performing"agency records reimbursements. In table FO-1 , these transactions arepresented. Conversely, table FO-2 shows only those transactionsincurred outside the Federal Government
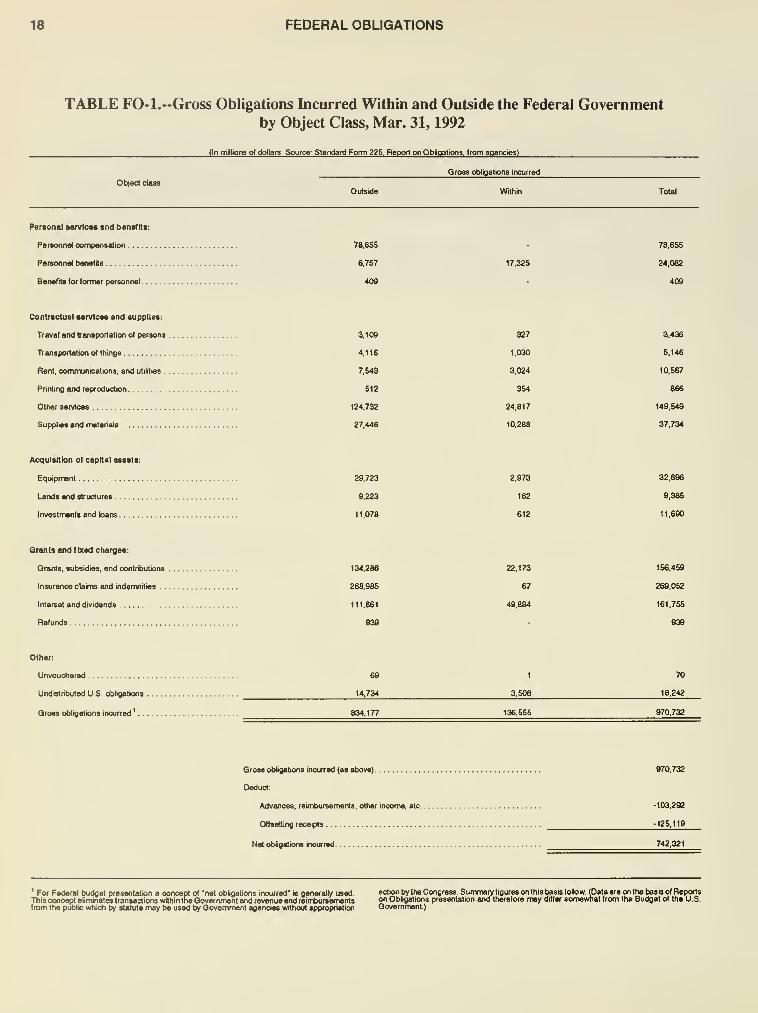
18 FEDERAL OBLIGATIONS
TABLE FO-l.-Gross Obligations Incurred Within and Outside the Federal Governmentby Object Class, Mar. 31, 1992
fin millions of dollars Source: Standard Form 225. Report on Obligalions. from agencies)
Obied class
Gross obligalions inctiffed
Total
Personal ssrvlcm and ben^lta:
Paraonnal oompansation
Paraonnel banefits
BanaTits fof fonnar personnel
Contractual aarvlcaa and auppUea:
Travel and transportation of persons .
Transportation of things
Rent, comnunicatlons, and utilities . .
Printing and reproduction
Other services
Suppliea arid materials
Acqulaltlon of capital aaaett:
EquipfTvnt
Lands and structures
investmants and bans
Qrants and ( Ixed charge*:
Qrants, sutraidies, and oontributioru .
Insurance clainis and indemnities . .
.
Interset and dividends
Refunds
Other:
Unvouchered
Undistnbuted US obligations
Qroas obligations iiKurred^
78.655
6,757
409
3,109
4,116
7,543
5t2
124,732
27.446
29.723
9.223
11.078
134,286
268,985
111,861
14.734
834,177
17,325
327
i.oao
3,024
354
24.817
10.288
2,973
162
612
22.173
67
49.894
1
3.508
Gross obligatioris incurred (as above)
Deduct:
Advances. reimt>uisements. ottier income, etc.
.
Otfsatting receipts
Net oblgatione incurred
78,655
24,082
409
3.436
5.146
10,567
866
149,549
37.734
32,696
9.385
11.690
156,459
269,052
161.755
936
70
16.242
970.732
970,732
-103,292
-125,110
742.321
For Federal budget presentation a concept of 'net obligations incurred* is generally used.This cor>cept eBminates transactions wittiin the Qovernment and revenue and reimtiursementsfrom trie public whi<^ by statute may be used ty Qovemment agencies without appropriation
action by the Congress. Sunvnary figures on tills basis follow (Data are on the t^asis of Reportson Obligations presentation and therefore may differ somewhat from tfie Budget of the U.S.Qovernment)
FEDERAL OBLIGATIONS19
Acquisition of Capital Asset
6%
Grants and Fixed Charge
62%
ontractual Services and Supplies
20%
ersonal Services and Benefits
10%
CHART FO-A.--
Gross Federal Obligations
Incurred Outside
the Federal Government,
March 31, 1992
CHART FO-B.--Total Gross Federal Obligations, March 31, 1992(In billions of dollars)
Personal Services & Benefits
Contractual Services & Supplies
Acquisition of Capital Assets
Grants & Fixed Cfiarges
Other
Outside Government
I IWithin Government
I I I
II I 11 I
II I I I I I I I I I I
II I I I I
II I I I I
IM I I I I I I I I I
II I I I I
50 100 150 200 250 300 350 400 450 500 550 600
20 FEDERAL OBLIGATIONS
TABLE FO-2."Gross Obligations Incurred Outside the Federal Government
by Department or Agency, Mar. 31, 1992
(In mlllom ol dollare Soucce: Slandafd Form 225. Report on Obtoalions. (rom agencies)
ClMMlloatian
Peraonal s«vtoe« and benelDa ConUacluat aen/taea and auppMea
Penonnel Pareonnel
oon^>«n»alk>n banefita
Benefits for Travel and Rent, conv Printing and
fomner trentportation Transportatton munloaUone, reproduo- Other SuppUee and
personnel of persons ol things and utibtJes tion setvices materials
LeglslaUve branch
'
S324 ' S13
Thejudlotaiy' ....Executive Ottice ot the Preeident 76
Funds appropriated to the PiesldenI 427 28
AgriouRure Depart/nerit:
Comnnodlly Credit Corporalton
Oth« 2,Bt4
Commerce Dapaftnwril 680 18
Detenee Depailmeril:
MilUiy:
Dep«1menlo( the Army 13,891 1,703 32 767 441
Oapaitnnent ol the Navy 11,310 3.669 29 370 603
Oepartmeni ol the Ait Faroe 9,038 166 19 424 416
Detenee i«enoiaa 8.886 7W 6 441 619_
Total n»SI«y 42,004 6,200 86 2,002 1,970
OMI 677 11
Education Oepartmeni Ill
Energy Department 473 • 1
Haalh & Human Seivloee, except SodalS«)urtty 1.306 17 44
HeaMi & Human San/Ices, Social Security 1.12S 16
Houslrig & UrtMtn DeveloprTwnl Department 284 23
Inlerioi Departnnent 1.017 1 16
Juatkie Departmei< 1.ES6 4 1
l^bor Department 388 80
State Depaitment 613 ' 3
Transportation Department 2.211 ' 223
Treasury Department:
Intereet on the putilic debt
Interest on ntunit, ale
Other 3.114 91 17
Veterans Attain Department 4,206 8 6
Envlronmenlal Pioleotlon Agency 400
General Seivioea Admlnlstiallon 370
National Aeronautics and SpaoeAdmlnMiatiofl 827
ONIce (A Personnel Management 101
Small Bueinees AdninMratlon 88
Other Independent agendas:
Poelal Sendee 12,483
Tenneesee Vidley Authority 466 68
Other 1,183 101
ToW 78.666 6.7S7 408 3.109 4.118
$16 t281 »66 $30
12
FEDERAL OBLIGATIONS 21
TABLE FO-2.--Gross Obligations Incurred Outside the Federal Governmentby Department or Agency, Mar. 31, 1992, con.
Classification
fin inPions of dolarsl
Aoqulsitton of
capital aaasefsGrants and fixed charpea
Equipment
Grants, sut> InsuranceLands and Investments sidles, and claims and Interest andstructures and loans contributions Indemnities dividends
ahor
Refunds
Undistributed Total grossUS obliga- obligations
Unvouchered tions incurred
Legislative branch
'
t56 t1
The judiciary'
Executive Office of the President 2
Funds appropriated to the President 3,627 4S
Agriculture Department:
Commodity Credit Corporation 3
Other 100 138
Commerce Departnwnl 50 *
Defense Department;
MaHary:
Department of the Army 1,928 487
Department of the Navy 8.658 351
Department of the Air Foroe 11,074 363
Defense agencies 1,419 646
Total military 23,079 1,747
Civil 24 473
Education Department •
Energy Department 731 1,641
Heatth & Human Services, except
Health & Human Services, except Social
Security 67
Health 4 Human Senricee, Social Security ..
.
15
Housing & Urtian Development Depaitmenl .
.
3
Interior Department 59
Justice Department 77
Labor Department 6
State Department 25
Transportation Department 222
Treasury Department:
Interest on tfw public debt
Interest on refunds, etc
Oilier 279
Veterans Affairs Department 142
Environmental Protection Agency 10
General Services Administration 194
National Aeronautics and SpaceAdministration 147 188
Office of Personnel Management 6 *
Small Business Administration *
Other independent agencies:
Postal Service 584
Tennessee Valley Authority 273
Other 51
Total 29,723 9,223
-
22
INTRODUCTION: Source and Availability of the
Balance in the Account of the U.S. Tireasury
The Treasury's operating cash is maintained in accounts with the
Federal Reserve banks (FRBs) and branches, as well as in tax andloan accounts in other financial institutions. Major information sources
include the Daily Balance Wire received from the FRBs and branches,
and electronic transfers through the Letter of Credit Payment, Fedline
Payment, and Fedwire Deposit Systems. As the FRB accounts are
depleted, funds are called in (withdrawn) from thousands of tax andloan accounts at financial institutions throughout the country.
Under authority of Public Law 95-147, Treasury implemented a
program on November 2, 1978, to invest a portion of its operating cash
in obligations of depositaries maintaining tax and loan accounts. Under
the Treasury tax and loan investment program, depositary rinanciai
institutions select the manner in which they will participate. Financial
institutions wishing to retain funds deposited Into their tax and loan
accounts in interest-bearing obligations participate under the Note
Option. The program permits Treasury to collect funds through financial
institutions and to leave the funds in Note Option depositaries and in
the financial communities in which tiiey arise until Treasury needs the
funds for its operations. In this way. Treasury is able to neutralize Uie
effect of its fluctuating operations on Note Option financial institution
reserves and on the economy. Likewise, those institutions wishing to
remit the funds to the Treasury's account at FRBs do so under ttie
Remittance Option.
Deposits to tax and kDan accounts occur as customers of financial
institutions deposit tax payments, which the financial institutions useto purchase Government securities. In most cases, this involves atransfer of funds from a customer's account to the tax and loan account
in the same financial institution. Also, Treasury can direct the FRBs to
invest excess funds in tax and loan accounts directiy from the Treasury
account at the FRBs.
ACCOUNT OF THE U.S. TREASURY 23
TABLE UST-l.-Elements of Changes in Federal Reserve
and Tax and Loan Note Account Balances
fln millioiw o( dolars Souroe: Financial Managament Service)
24
INTRODUCTION: Federal Debt
Treasury securitiea (i.e., puislic debt securities) comprise most of
the Federal debt, with securities issued by other Federal agenciesaccounting for the rest. Tables in this section of the Treasury Bulletin
reflect the total. Further detailed Information is published in the MonthlyStatement of the Public Debt of the United States. Likewise, informa-
tion on agency securities and on investments of Federal Governmentaccounts in Federal securities is published In the Monthly TreasuryStatement of Receipts and Outlays of the United States Government
• Table FD-1 summarizes the Federal debt by listing public debtarxl agency securities held by the pdbWc, includirig \he Federal Re-sen/e. It also includes debt held by Federal agencies, largely by the
Social Security and other Federal retirement trust turxJs. (For greater
detail on hddlngs of Federal securities tiy particular classes of inves-
tors, see Vne ownership tables, OFS-1 and OFS-2.)
• Table FD-2 categorizes by type interest-bearing mari<etable andnonmarketatjie Treasury securities. The difference between interest-
bearing and total public debt securities reflects outstanding maturedTreasury securities-that is, unredeemed securities that have maturedand are no longer accruing interest. Because the Federal RnancingBank is under U-ie supen/ision of Treasury, its securities are held by aU.S. Government account
• In table FD-3, nonmari<etable Treasury securities held by U.S.
Government accounts are summarized by issues to particular fundswithin Government Many of the funds invest in par value special series
nonmarketaUes at interest rates determined by law. Others invest in
mari<et-tiased special Treasury securities whose terms mirror those of
marketable securities.
• Table FD-4 presents interest-tearing securities issued by Gov-ernment agencies. Federal agency borrowing has declined in recent
years, in part because the Federal Financing Bank has providedfinancing to other Federal agencies. Meanw/hile, Government-spon-sored entities whose securities are presented are not Federal agen-cies, and their securities are not guaranteed by the Federal
Government (Federal agency borrowing from Treasury Is presentedin the Monthly Treasury Statement of Receipts and Outlays of theUnited States Government)
• Table FD-5 illustrates the average length of mari<etable inter-
est-bearing public debt held tiy private investors and the maturity
distribution of that debt Average maturity heis increased gradually
since it hit a k>w of 2 years, 5 montlis, in December 1975. In March1971, Congress enacted a limited exception to the 4-1/4-percentinterest rate ceiling on Treasury bonds. This permitted Treasury to offer
securities maturing in more than 7 years at current mart<et rates of
interest for the first time since 1965. This exception has expandedsince 1971 auttvxizing Treasury to continue to issue tong-term secu-rities, and the ceiling on Treasury borxJs was repealed on November1 0, 1 988. The volume of privately held Treasury mart<etable securities
by maturity dass reflects the remaining period to maturity of Treasurybills, notes, and bonds. The average length is comprised of an averageof remaining periods to maturity, weighted by the amount of eachsecurity held by private investors. In other words, computations of
average lengtii exclude Govemment accounts and the Federal Re-serve tanks.
• In table FD-6, the debt ceiling is compared m\h the outstandingdebt subject to limitation by law. The other debt category includes
Federal debt Congress has designated as being subject to the debt
ceiling. Changes in ttie non-intenest-t)earing debt shown in the last
colLffnn reflect mahjrities of Treasury securities on nonbusiness days,
which can be redeemed on the next business day.
• Table FD-7 details Treasury holdings of securities issued by
Govemment corporations and other agencies. Certain Federal agen-cies are authorized to borrow money from ttie Treasury, largely to
finarKe cfirect ban programs. In addition, agencies such as the Bon-neville Power Administration are auttiorized to bonow from the Treas-
ury to finarKe capital projects. Treasury, in turn, finances ttiese loaru
by selling Treasury securities to the public.
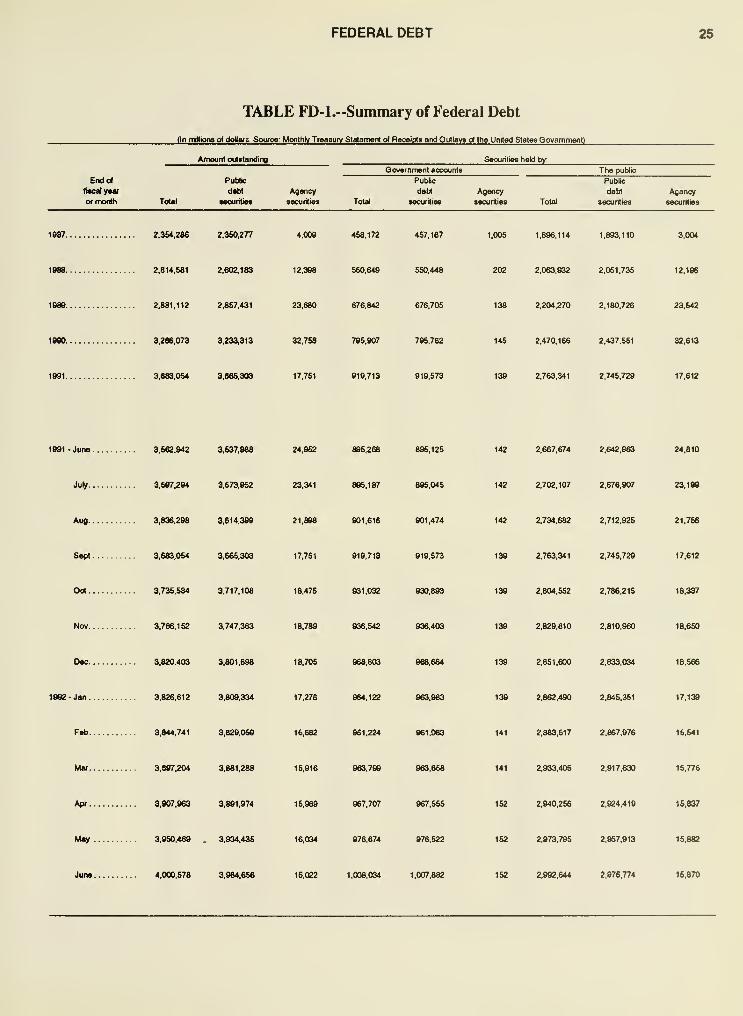
FEDERAL DEBT 25
TABLE FD-l.-Summary of Federal Debt
(In millioiis o( dollafs. Souroe: Monthly TreasuiY StiJement ot Receipts and OullavB ol tha United States Govemmentl
Endol
fiscal yeai
Of month
Amount outstanding
Publio
debt Agency
Total securities securities
Qovernment accounts
Securities held tff
The public
Total
Public
debt
securitiee
Agency
securities
Public
debt
securities
Agency
securities
1987. 2.354,286 2,350,277 4,008 458,172 1,005 1,896,114 1,883,110 3,004
1888. 2,614,581 2,602,183 12.388 560,649 550,448 202 2,063,932 2,051,735 12,196
1888. 2,881,112 2,857,431 23,680 676,842 676,705 136 2,204,270 2,180,726 23,642
1B80. 3,286,073 3,233,313 32,758 795,907 795,762 145 2,470,166 2.437,551
1991. },e83,054 3,865,303 17,751 819,713 919,573 139 2,763,341 2,745,729 17,612
1981 -June. 3,562,942 3,537,888 24,952 895,268 >,125 142 2,667,674 2,642,863 24,810
July. 3,507,294 3,573,852 23,341 885,187 885,045 142 2,702,107 2,678,907 23,199
Aug. 3,636,298 3,614,388 21,886 801,616 801,474 142 2,734,682 2,712,925 21,756
Sept 3,683.054 3,665.303 17,751 919,713 919.573 138 2.763,341 2.745,729 17,612
Ool. 3.735,584 3,717,108 18,476 931,032 830,883 139 2,804,552 2,786,215 18,337
Nov 3,766.152 3,747.363 18.789 936,542 936,403 139 2,829.610 2,810.960 18,650
Dec. 3,820,403 3,801,698 18,705 968,803 868,664 138 2,851,600 2,833,034 18,566
186e-Jan. 3,826.612 3.809.334 17.278 964.122 963,983 2.862.490 2.845,351
3,844,741 3,829,050 15,682 961,224 961.083 141 2,883,517 2,867,876 15,541
3,807,204 3.881,288 15.816 863.788 863.658 141 2,833,405 2.817,630
Apr. 3,907,863 3.881,874 15.968 867,707 967.555 152 2,940,256 2.924,419 16,837
May 3,850,469 . 3,834,435 16,034 876,674 976,522 152 2,973,795 2,957,913 15,882
June. 4,000.678 3,984,656 16,022 1,008.034 1,007,882 152 2,992,644 2,976,774 15,870
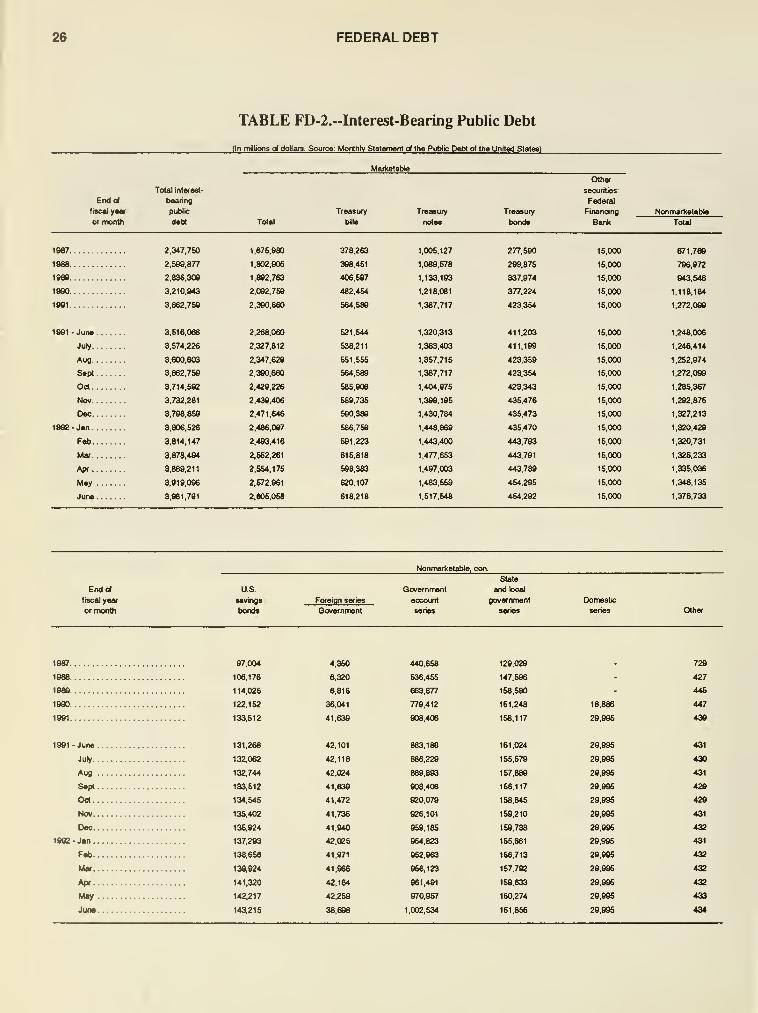
26 FEDERAL DEBT
TABLE FD-2.--Interest-Bearing Public Debt
(In millions d doMafs Source Monthly Stalemerrt al the Public Debt ol the Uniied Stales)
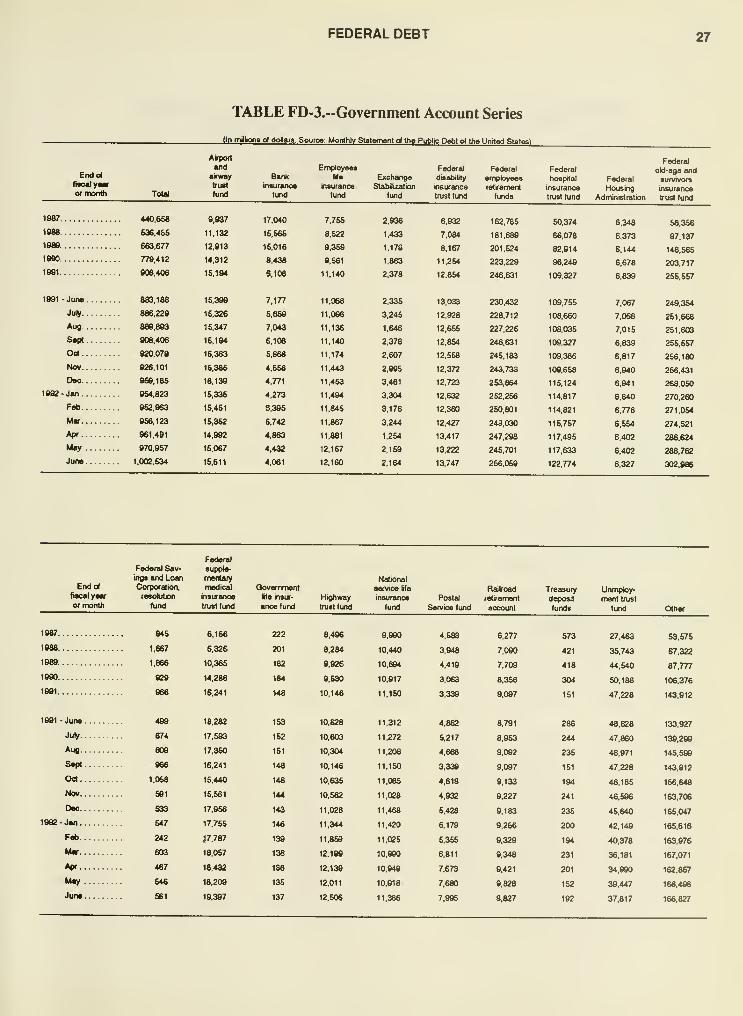
FEDERAL DEBT 27
TABLE FD-3.~Government Account Series
(In milioni o( dollare Sourot: Monthly SUlemenI o( lh« Public OabI o( the Untied States!
End of
AioalyMror month Total
^"P^ Federal™ Employees Fedeial Federal Federal old-age and•i™«y Bank lit Excliange disabilrty employees hospital Federal survivorstrust ln«urano* Innirance Stabilizalion insurance retirement insurance Housing insurance'""^ t""^ lurxJ lund trust lund funds tmslfund Administration trust fund
1987 440.658 9,937 17,040 7.755 2.936
1888 636,466 11,132 16,666 8,522 1,433
1988 663.677 12,913 16,016 9.388 1.179
1990 779.412 14,312 8.438 9.561 1.863
1991 906.406 15.194 6.108 11,140 2.378
1991 -June 883,188 15.389 7,177 11,068 2,335
<lu^ 886,229 15.326 5,659 11,096 3.245
Aug 889.893 15.347 7.043 11.136 1.646
SM 906.406 16.194 6.106 11.140 2.378
Oct 920.079 16.363 5.668 11,174 2,607
Nov 826,101 15,386 4,656 11,443 2,995
Doe 959,185 16,139 4,771 11,453 3.461
19S2-Jan 954.823 15,336 4,273 11,484 3,304
F* 952,963 16,451 6,386 11,845 3,176
Mar 956,123 16,362 6,742 11.867 3,244
Apr 961.491 14,992 4.863 11.881 1.254
May 970.957 15.067 4,432 12,157 2,159
Juno 1,002,534 15,611 4,061 12,160 2,164
6.932
7,084
8,167
11,254
12,854
13,033
12,928
12,655
12.854
12.558
12.372
12,723
12,632
12.360
12.427
13.417
13.222
13.747
162.785
181.689
201,624
223,229
246,631
230,432
228.712
227,226
246,631
245,183
243,733
253,864
252,256
250,801
249,030
247,298
245,701
256,059
50,374
66,078
82,914
96,246
109.327
109.755
108.660
108.035
109.327
109.386
109.668
115.124
114.817
114.821
115.757
117.495
117.633
122.774
6.348
6,373
6,144
6,678
6839
7,067
7.068
7.015
6.839
6.817
6.940
6.941
6,840
6,776
6,554
6,402
6,402
6.327
58.356
97.137
148.565
203,717
255,557
249,354
251,668
251,603
255,557
256,180
256,431
268,050
270,260
271,054
274,521
286,624
288,762
302,986
Endolfiscal year
or month
Federal Sav-ings and LoanCorporation,
resolution
fund
Federal
suppte-
meiilaiy
medical
Insurance
trust fuid
Qovernnwntife insur- Highwayance fund trust fund
National
service life Railroad Treasury Unmploy-insuranoe Postal retirement deposit meni trust
fund Service fund account funds fund Other
1987
1988
1988.
1990
1891
1991 -June.
JuV.
.
Aug..
Sept.
Oct..
Nov..
Deo..
ig92-Jan..
Feb..
M«..
Apr..
June.
845
1.667
1,866
828
488
674
eoe
866
1,068
SSI
S33
647
242
603
467
546
561
6,166
6.326
10,365
14,286
16,241
18.282
17,583
17,350
16.241
15.440
15.561
17,856
17,756
J7,787
18.057
16.432
18.208
18.387
222
28 FEDERAL DEBT
TABLE FD-4.-Iiiterest-Bearing Securities Issued by Government Agencies
(In mlllons ct dotera. Source: Monthly Tr»«3Ufv SMemenl ot R»cei[it« and OiiBav« ol the Unil»d SUtm Govemmenl and Financial ManaoemenI Swvica)
End of
nscalyear Total
FsdeiBl Oepost
Insurance Cofporation
Housing and Urban
Dei/elopnient Departnient
Federal Savings
Bank and Loan Insur- Federal
Insurance anoe Corporation- Housing
Qovernmsnt
National
Mortgage
Other
independent
Tennessee
Valley
19S7. 4,009 200 178 t,866 1,380 286
12.3S8 9.733 120 283
1880. 23.680 18.688 286 1.380 276
1980. 32,768 2,881 19.339 357 9,380 701
1091. 17,761 10.603
1901 - June . 24,962 1,460 12.081 428 0.380 712
July. 23,341 1.460 11,629 300 9.380 682
Aug. 21.8 86 11.425 315 682
Sept 17,751 06 6,124 10,503
Od. 18.476 95 6,119 11,231 696
18,780 6,119 11,516
Dec. 18.706 387 11.676
1992 -Jan. 17,278 2.583 13,575 692
Feb. 15,682 372 12.157
15,916 03 2.250 421
Apr. 15.E 93 419
May . 16,034 93 427 12.661 665
June. 16,022 83 2,16 432 12,645 684
FEDERAL DEBT 29
TABLE FD-5.--Maturity Distribution and Average Length of MarketableInterest-Bearing Public Debt Held by Private Investors
(In nittont t* dolare. So>ro»: Offlo» ol MarKrt nnance)
Enda«
litoilyMr
ormontt)
Amount
outttjvidlng
privatoV Within
1 VMT
1-5
yeare
Uteturlv ol««»««
&-10
yean
10-20
years
20 years
andovar Average length
30 FEDERAL DEBT
TABLE FD-7.--1Veasury Holdings of Securities
Issued by Government Corporations and Other Agencies
FEDERAL DEBT31
CHART FD-A..-Average Length of the Marketable Debt*
Privately Held
1945 47 49 51 53 55 57 59 61 63 65 67 69 71 73 75 77 79 81 83 85 87 89 91
' Source: Department ot the Treasury, Ottice of Market Finance
32FEDERAL DEBT
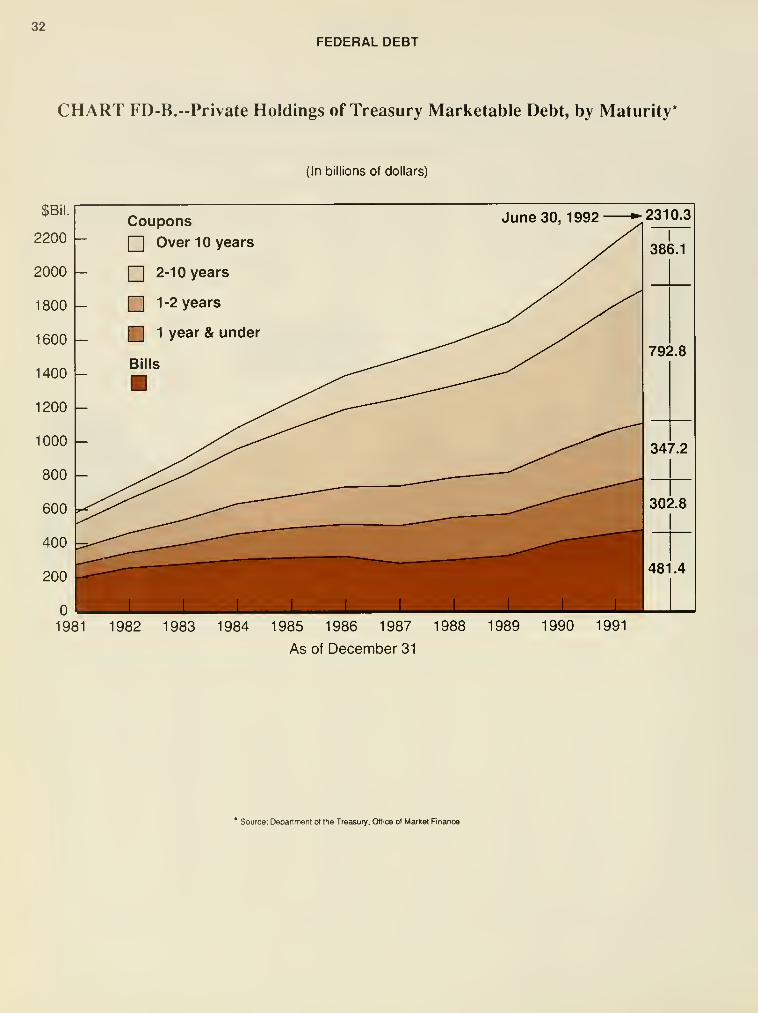
CHART FD-B.--Private Holdings of Treasury Marketable Debt, by Maturity*
(In billions of dollars)
1982 1983 1984 1985 1986 1987 1988
As of December 31
1989 1990
* Source: Depanmeni of the Treasury, Oftice of Market Finance
33
INTRODUCTION: Public Debt Operations
The Second Liberty Bond Act (31 U.S.C. 3101 , et seq.) allows the
Secretary of the Treasury to borrow money by issuing Treasury secu-
rities. The Secretary determines the terms and conditions of issue,
conversion, maturity, payment, and interest rate. New issues of Treas-
ury rK>tes mature in 2 to 10 years. Bonds mature in more ti'ian 10 yearsfrom the issue date. Eftch marketable security is listed in the Monthly
Statement of the Public Debt of the United States. The information in
this section of the Treasury Bulletin peiXaina only to marketable Treas-
ury securities, current bills, notes, and bonds.
• Tab!© PDO-1 provides a maturity schedule of interest-bearing
marketable public debt securities other than regular weekly and 52-
week bills. AH unmatured Treasury notes and bonds are listed in
maturity order, from eariiest to latest. A separate breakout is prT>vided
for the combined holdings of the Govemment accounts and Federal
Reserve banks, so that the "all other investors" category includes all
private hokJings.
• Table PDO-2 presents the results of weekly auctions of 13- and26-week bills, as well as auctions of 52-week bills, vi^ch are held everyfourth week. Treasury bills mature each Thursday. New issues of
13-week bills are rsopervngs of 26-week bills. The 26-week bill issued
every fourth week to mature on the same Thursday as an existing
52-week bill Is a reopening of the existing 52-week bill. New issues of
cash management bills are also presented. High, low, and averageyields on accepted tenders and tfie dollar value of total bids arepresented, with the dollar value of awards made on both competitive
and noncompetitive basis.
Treasury accepts noncompetitive tenders of up to $1 million for
bills and $5 million for notes and bonds in each auction of securities to
encourage participation of individuals and smaller institutions.
• Table PDO-3 lists the results of auctions of mari<etable securi-
ties, other than weekly bills, in chronological order over the past 2years. Included are: notes and bonds frtim table PDO-1; 52-week bills
from table PDO-2; and data for cash management bills. The maturities
of cash management bills coincide wiUi those of regular issues of
Treasury bills.
• Table PDO-4 indicates Uie total amount of mari^etable securities
allotted to each class of investor. The Federal Reserve banks tally into
investor classes the tenders in each auction of mari<etable securities
other than weekly auctions of 13- and 26-week bills.
34 PUBLIC DEBT OPERATIONS
TREASURY FINANCING: APRIL-JUNE 1992
APRIL
Aucti<m of 7-Year Notes
April 1 Treasury announced it would auction $9,750 million
of 7-year notes to refund $5,489 million of notes maturing
April 15, 1992, and to raise about $4,250 million of new cash.
Notes offered were Treasury notes of Series F-1999, dated
April 15, 1992, due April 15, 1999, with interest payable Octo-
ber 15 and April 15 until maturity. An interest rate of 7 percent
was set after the determination as to which tenders were
accepted on a yield auction basis.
Tenders were received prior to 1 2 noon, e.d.t., for noncom-
petitive tenders and prior to 1 p.m., e.d.t., for competitive
tenders April 8, 1992, and totaled $18,794 million, of which
$9,755 million was accepted at yields ranging from 7.09 per-
cent, price 99.510, up to 7.14 percent, price 99.239. Tenders
at the high yield were allotted 62 percent.
Noncompetitive tenders were accepted in full at the aver-
age yield, 7.11 percent, price 99.402. These totaled $474million. Connpetitive tenders accepted from private investors
totaled $9,281 million.
In addition to the $9,755 million of tenders accepted in the
auction process, $18 million was accepted from Federal Re-
serve banks as agents for foreign and international monetary
authorities, and $379 million was accepted from Federal Re-
serve banks for their own account.
Noncompetitive tenders were accepted in full at the aver-
age yield, 5.43 percent, price 99.897. These totaled $1,213million. Competitive tenders accepted from private investors
totaled $13,580 million.
In addition to the $14,793 million of tenders accepted in
the auction process, $320 million was accepted from Federal
Reserve banks as agents for foreign and international mone-tary authorities, and $1 ,234 million was accepted from Federal
Reserve banks for their own account.
Notes of Series L-1997 were dated April 30, 1992, due
April 30, 1997, with interest payable October 31 and April 30
until maturity. An interest rate of 6-7/8 percent was set after the
determination as to which tenders were accepted on a yield
auction basis.
Tenders were received prior to 1 2 noon, e.d.t., for noncom-petitive tenders and prior to 1 p.m., e.d.t., for competitive
tenders April 23, and totaled $22,358 million, of which $1 0,268
million was accepted at yields ranging from 6.92 percent, price
99.812, up to 6.94 percent, price 99.729. Tenders at the high
yield were allotted 89 percent.
Noncompetitive tenders were accepted in full at the aver-
age yield, 6.93 percent, price 99.771. These totaled $856million. Competitive tenders accepted from private investors
totaled $9,412 million.
In addition to the $10,268 million of tenders accepted in
the auction process, $880 million was accepted from Federal
Reserve banks as agents for foreign and international mone-tary authorities, and $250 million was accepted from Federal
Reserve banks for their own account.
52-Week Bills
Auction of 2-Year and 5-Year Notes
April 15 Treasury announced it would auction $14,750
million of 2-year notes of Series Y-1 994 and $1 0,250 million of
5-year notes of Series L-1997 to refund $11,313 million of
securities maturing April 30, 1 992, and to raise about $1 3,675
niillion of new cash.
Notes of Series Y-1 994 were dated April 30, 1992, due
April 30, 1 994. with interest payable October 31 and April 30
until maturity. An interest rate of 5-3/8 percent was set after the
determination as to which tenders were accepted on a yield
auction basis.
Tenders were received prior to 1 2 noon, e.d.t., for noncom-petitive tenders and prior to 1 p.m., e.d.t., for competitive
tenders April 22, and totaled $35,722 million, of whch $1 4,793
million was accepted at yields ranging from 5.42 percent, price
99.916, up to 5.43 percent, price 99.897. Tenders at the high
yield were allotted 46 percent.
March 27 tenders were invited for approximately $1 3,750
million of 364-day Treasury bills to be dated April 9, 1 992, and
to mature April 8, 1 993. The issue was to refund $11 ,022 million
of maturing 52-week bills and to raise about $2,725 million of
new cash.
Tenders were opened April 2. They totaled $40,441 million,
of which $13,857 million was accepted, including $672 million
of noncompetitive tenders from the public and $3,245 million
of the bills issued to Federal Reserve banks for themselves
and as agents for foreign and international monetary authori-
ties. An additional $375 million was issued to Federal Reserve
banks as agents for foreign and international monetary authori-
ties for new cash. The average bank discount rate was 4.34
percent.
/Vpril 24 tenders were invited for approximately $13,750
million of 364-day Treasury bills to be dated f\/lay 7, 1992, and
to mature May 6, 1 993. The issue was to refund $11 ,854 mil-
lion of maturing 52-week bills and to raise about $1 ,900 million
PUBLIC DEBT OPERATIONS 35
TREASURY FINANCING: APRIL-JUNE, con.
of new cash. Tenders were opened April 30. They totaled
$32,749 million, of which $1 3,757 million was accepted, includ-
ing $638 million of noncompetitive tenders from the public and
$3,420 million of the bills issued to Federal Reserve banks for
themselves and as agents for foreign and international mone-tary authorities. An additional $680 million was issued to Fed-
eral Reserve banks as agents for foreign and international
monetary authorities for new cash. The average bank discount
rate was 4.20 percent.
Cash Management Bills
March 30 tenders were invited for approximately $22,000
million of 13-day bills to be issued April 3, 1 992, representing
an additional amount of bills dated October 1 7, 1 991 , maturing
April 16,1 992. The issue was to raise new cash. Tenders were
opened April 1 . They totaled $64,976 million, of which $22,015
million was accepted. The average bank discount rate was 4.13
percent.
R MAY fl
May Quarterly Financing
April 29 Treasury announced it would auction $15,000
million of 3-year notes of Series P-1995, $11,000 million of
1 0-year notes of Series A-2002, and $10,000 million of 29-1/2-
year 8 percent bonds of Novennber 2021 to refund $27,478
million of Treasury securities maturing May 15 and to raise
about $8,525 million of new cash.
Notes of Series P-1995 were dated May 15, 1992,
due May 15, 1995, with interest payable on November 15 and
May 15 until maturity. An interest rate of 5-7/8 percent was set
after the determination as to which tenders were accepted on
a yield auction basis.
Tenders were received prior to 1 2 noon, e.d.t., for noncom-petitive tenders and prior to 1 p.m., e.d.t., for competitive
tenders May 5, and totaled $37,567 million, of which $15,086
million was accepted at yields ranging from 5.95 percent, price
99.797, up to 5.97 percent, price 99.743. Tenders at the high
yield were allotted 7 percent.
Noncompetitive tenders were accepted in full at the aver-
age yield, 5.96 percent, price 99.770. These totaled $1,007
million. Conpetitive tenders accepted from private investors
totaled $14,079 million.
In addition to the $15,086 million of tenders accepted in
the auction process, $522 million was accepted from Federal
Reserve banks as agents for foreign and international mone-
tary authorities, and $3,500 million was accepted from Federal
Reserve banks for their own account.
Notes of Series A-2002 were dated May 15, 1992,
due May 1 5, 2002, with interest payable November 1 5 and May15 until maturity. An interest rate of 7-1/2 percent was set after
the determination as to which tenders were accepted on a yield
auction basis.
Tenders were received prior to 12 noon, e.d.t., for noncom-petitive tenders and prior to 1 p.m., e.d.t., for competitive
tenders May 6, and totaled $33,389 million, of which $11,074
million was accepted at yields ranging from 7.53 percent, price
99.792, up to 7.53 percent, price 99.792. Tenders at the high
yield were allotted 81 percent.
Noncompetitive tenders were accepted in full at the aver-
age yield, 7.53 percent, price 99.792. These totaled $689million. Competitive tenders accepted from private investors
totaled $10,385 million.
In addition to the $11,074 million of tenders accepted in
the auction process, $614 million was accepted from Federal
Reserve banks for their own account.
Notes of Series A-2002 may be held in STRIPS form. Theminimum par amount required is $80,000. The 8 percent bonds
of November 2021 were an additional issue of bonds dated
November 15, 1991, due November 15, 2021, with interest
payable November 1 5 and May 1 5 until maturity.
Tenders for the bonds were received prior to 12 noon,
e.d.t., for noncompetitive tenders and prior to 1 p.m., e.d.t., for
corrpetitive tenders May 7, and totaled $24,900 million, of
which $1 0,044 million was accepted at yields ranging from 7.99
percent, price 100.113, up to 8.00 percent, price 100.000.
Tenders at the high yield were allotted 61 percent.
Noncompetitive tenders were accepted in full at the aver-
age yield, 8.00 percent, price 100.000. These totaled $361
million. Competitive tenders accepted from private investors
totaled $9,683 million.
In addition to the $10,044 million of tenders accepted in
the auction process, $150 million was accepted from Federal
Reserve banks as agents for foreign and international mone-tary authorities, and $300 million was accepted from Federal
Reserve banks for their own account.
The bonds of November 2021 may be held in STRIPSform. The minimum par amount required is $25,000.
Auction of 2-Year and 5-Year Notes
May 13 Treasury announced it would auction $14,750
million of 2-year notes of Series Z-1 994 and $1 0,250 million of
5-year notes of Series M-1997 to refund $11,608 million of
36 PUBLIC DEBT OPERATIONS
TREASURY FINANCING: APRIL-JUNE, con.
securities maturing May 31, 1992, and to raise about $13,400
million of new cash.
Notes of Series Z-1 994 were dated June 1 , 1 992, due May31 , 1 994, with interest payable November 30 and May 31 until
maturity. An interest rate of 5-1/8 percent was set after the
determination as to which tenders were accepted on a yield
auction basis.
Tenders were received prior to 1 2 noon, e.d.t., for noncom-
petitive tenders and prior to 1 p.m., e.d.t., for competitive
tenders May 20, and totaled $37,329 million, of which $14,765
million was accepted at yields ranging from 5.11 percent, price
100.028, up to 5.14 percent, price 99.972. Tenders at the high
yield were allotted 59 percent.
Noncompetitive tenders were accepted in full at the aver-
age yield, 5.13 percent, price 99.991. These totaled $1,059
million. Competitive tenders accepted from private investors
totaled $13,706 million.
In addition to the $14,765 million of tenders accepted in
the auction process, $390 million was accepted from Federal
Reserve banks as agents for foreign and international mone-
tary authorities, and $611 million was accepted from Federal
Reserve banks for their own account.
Notes of Series M-1997 were dated June 1, 1992, due
May 31 , 1 997, with interest payable November 30 and May 31
until maturity. An interest rate of 6-3/4 percent was set after the
determination as to which tenders were accepted on a yield
auction basis.
Tenders were received prior to 1 2 noon, e.d.t., for noncom-
petitive tenders and prior to 1 p.m., e.d.t., for competitive
tenders May 21 , and totaled $26,889 million, of which $1 0,259
million was accepted at yields ranging from 6.74 percent, price
1 00.042, up to 6.75 percent, price 1 00.000. Tenders at the high
yield were allotted 94 percent.
Noncompetitive tenders were accepted in full at the aver-
age yield, 6.75 percent, price 100.000. These totaled $872
million. Competitive tenders accepted from private investors
totaled $9,387 million.
In addrtion to the $10,259 million of tenders accepted in
the auction process, $553 million was accepted from Federal
Reserve banks as agents for foreign and international mone-
tary authorities, and $200 million was accepted from Federal
Reserve banks for their own account.
52-Week Bills
May 22 tenders were invited for approximately $13,750
million of 364-day Treasury bills to be dated June 4, 1 992, and
to mature June 3, 1993. The issue was to refund $12,289
million of maturing 52-week bills and to raise about $1 ,450
million of new cash. Tenders were opened May 28. They
totaled $40,252 million, of which $1 3,81 5 million was accepted,
including $583 million of noncompetitive tenders from the
public and $3,595 million of the bills issued to Federal Reserve
banks for themselves and as agents for foreign and interna-
tional monetary authorities. An additional $465 million wasissued to Federal Reserve banks as agents for foreign and
international monetary authorities for new cash. The average
bank discount rate was 4.07 percent.
Cash Management BUIs
May 11 tenders were invited for approximately $10,000
million of 34-day bills to be issued May 15, 1992, representing
an additional amount of bills dated December 1 9, 1 991 , matur-
ing June 18, 1992. The issue was to raise new cash. Tenders
were opened May 13. They totaled $39,825 million, of which
$1 0,019 million was accepted. The average bank discount rate
was 3.63 percent.
May 22 tenders were invited for approximately $6,000
million of 15-day bills to be issued June 3, 1992, representing
an additional amount of bills dated December 1 9, 1 991 , matur-
ing June 1 8, 1 992. The issue was to raise new cash. Tenders
were opened May 27. They totaled $38,540 million, of which
$6,014 million was accepted. The average bank discount rate
was 3.77 percent.
Auction of 2-Year and 5-Year Notes
June 17 Treasury announced it would auction $15,000
million of 2-year notes of Series AB-1994 and $10,500 million
of 5-year notes of Series N-1997 to refund $19,319 million of
Treasury notes maturing June 30 and to raise about $6,175
million of new cash.
Notes of Series AB-1994 were dated June 30, 1992,
due June 30, 1994, with interest payable December 31 and
June 30 until maturity. An interest rate of 5 percent was set after
the determination as to which tenders were accepted on a yield
auction basis.
Tenders were received prior to 1 2 noon, e.d.t., for noncom-
petitive tenders and prior to 1 p.m., e.d.t., for competitive
tenders June 23, and totaled $44,822 million, of which $1 5,051
million was accepted at yields ranging from 5. 11 percent, price
99.793, up to 5.12 percent, price 99.775. Tenders at the high
yield were allotted 32 percent.
Noncompetitive tenders were accepted in full at the aver-
age yield, 5.11 percent, price 99.793. These totaled $1,251
PUBLIC DEBT OPERATIONS 37
TREASURY FINANCING: APRIL-JUNE, con.
million. Competitive tenders accepted from private investors
totaled $13,800 million.
In addition to the $15,051 million of tenders accepted In
the auction process, $566 million was accepted from Federal
Reserve banks as agents for foreign and International mone-
tary authorities, and $1 ,604 million was accepted from Federal
Reserve banks for their own account.
Notes of Series N-1997 were dated June 30, 1992,
due June 30, 1997, with Interest payable December 31 and
June 30 until maturity. An Interest rate of 6-3/8 percent was set
after the determination as to which tenders were accepted on
a yield auction basis.
Tenders were received prior to 12 noon, e.d.t., for noncom-
petKive tenders and prior to 1 p.m., e.d.t., for competitive
tenders June 24, and totaled $29,000 million, of which $1 0,51
7
million was accepted at yields ranging from 6.41 percent, price
99.852, up to 6.43 percent, price 99.768. Tenders at the high
yield were allotted 60 percent.
Noncompetitive tenders were accepted in full at the aver-
age yield, 6.43 percent, price 99.768. These totaled $1 ,095
million. Competitive tenders accepted from private investors
totaled $9,422 million.
In addition to the $10,517 million of tenders accepted In
the auction process, $254 million was accepted from Federal
Reserve banks as agents for foreign and international mone-tary authorities, and $250 million was accepted from Federal
Reserve banks for their own account.
52-Week Bills
June 1 9 tenders were Invited for approximately $1 4,250
million of 364-day Treasury bills to be dated July 2, 1 992, and
to mature July 1 , 1 993. The Issue was to refund $1 2,680 million
of maturing 52-week bills and to raise about $1 ,575 million of
new cash. Tenders were opened June 25. They totaled
$44,289 million, of which $1 4,302 million was accepted, includ-
ing $589 million of noncompetitive tenders from the public and
$3,531 million of the bills issued to Federal Reserve banks for
themselves and as agents for foreign and international mone-
tary authorities. An additional $679 million was Issued to Fed-
eral Reserve banks as agents for foreign and International
monetary authorities for new cash. The average bank discount
rate was 3.93 percent.
38
PUBLIC DEBT OPERATIONS
TABLE PD0-1.--Maturity Schedule of Interest-Bearing Marketable Public Debt Securities
Other than Regular Weekly and 52-Week Treasury Bills Outstanding, June 30, 1992
[In millions ot dollars. Source: Monlhly Slalemenl ot the Public Debt ol the United Stales, and Ottice ot Mafkel Finance]
Amount ot maturities
Date ot tinal maturity
Description Total
Held by
U.S. Govtaccounts and
Federal Re-
serve banks
All
other
investors
1992July 15 10-3/8%-F noteJuly 31 8%-AC noteAug. 15 8-1/4%-K noteAug. 15, 87-92 4-1/4%bondAug. 15 7-7/8%-T noteAug. 15 7-1/4%bondAug. 31 8-1/8%-AD noteSept. 30 8-3/4%-P noteSept. 30 B-1/8%-AE noteOct. 1
5
9-3/4%-G noteOct. 31 7-3/4%-AF noteNov. 15 10-1/2°/<rC noteNov. 1
5
8-3/8%-L noteNov. 15 7-3/4%-U noteNov. 30 7-3/8%-AG note
Dec. 31 9-1/8%-Q noteDec. 31 7-1/4%-AH note
07/02/85
39
PUBLIC DEBT OPERATIONS
TABLE PD0-1.--Maturity Schedule of Interest-Bearing Marketable Public Debt Securities
Other than Regular Weekly and 52-Week Treasury Bills Outstanding, June 30, 1992, con.
[In millions of dollars]
Dale of final maturity
Amount of maturities
40PUBLIC DEBT OPERATIONS
TABLE PD0-1.--Maturity Schedule of Interest-Bearing Marketable Public Debt Securities
Other than Regular Weekly and 52-Week Treasury Bills Outstanding, June 30, 1992, con.
[In millions of dollars]
Dale o( final maturity
Description Issue date Total
Amount of maturities
Held by
U.S. Govtaccounts andFederal Re-serve banks
All
other
investors
1996 con.Oct. 15 8%-H noteOct. 31 6-7/8%U noteNov. 15 2 7-1/4%-D noteNov. 30 6-1/2°/<rV noteDec. 31 6-1/8%-W note
10/16/89
10/31/91
11/15/86
12/31/91
7.9899,348
20.2599.871
9.635
141200824200200
7.8489.148
19.435
9.671
9.435
Total 204.552 8.870
1997Jan. 1
5
8%-D noteJan. 31 6-1/4%-H noteFeb. 28 6-3/4%-J noteMar. 31 6-7/8%-K noteApr. 15 8-1/2%-E noteApr. 30 6-7/8%-L noteMay 15 28-1/2%-A noteMay 31 6-3/4%-M noteJune 30 6-3/8%-N noteJuly 15 8-1/2%-F noteAug. 15 2 8-5'8%-B note
Oct 15 8-3/4%-G noteNov. 15 2 8-7/8%-C note
1998Jan. 15 7-7/8'>tE noteFeb. 15 28-1/8%-A noteApr. 15 7-7/8%-F noteMay 1
5
2 9%.B noteMay 15.93-98 7% bondJuly 15 8-1/4%-G noteAug. 15 2 9-1/4%-C note
Oct. 15 7-1/8%-H noteNov. 15 2 8-7/8%-D note
Nov. 15 3-1/2%bond
1999Jan. 15 6-3/87.^E note
Feb. 16 28-7/8%-A note
Apr 15 7y,F noteMay 15 29-1/8%-B note
May 15,94-99 8-l/2%bondAug. 1
5
2 8%-C note
Nov. 15 2 7-7/8%-D note
2000Feb. 15 28-1/2%-A note
Feb. 1 5. 95-00 7-7/8% bondMay 15 28-7/8%B note
Aug. 15 2 8-3/4%-C note
Aug. 15. 95-00 8-3/8%bondNov. 15 2 8-1/2%-D note
01/16/90
41
PUBLIC DEBT OPERATIONS
TABLE PDO-1.--Maturity Schedule of Interest-Bearing Marketable Public Debt Securities
Other than Regular Weekly and 52-Week Treasury Bills Outstanding, June 30, 1992, con.
[In millions of dollars]
Amount of maturities
Date of final maturity
Description Total
Held by
U.S. Govlaccounts and
Federal Re-
serve banks
All
other
investors
2001 con.May 15 28%-B note
Aug. 15 27-7/8%-C note
Aug. 15. 96-01 8%bondAug, 15 13-^8% bondNov. 15 15-S4% bondNov. 15 27-l/2°/rD note
05/15/91
08/15/91
08/16/7607/02/81
10/07/81
11/15/91
12,39812,339
1,485
1,753
1,75324,226
420325741199163645
11,978
12,014
7441.554
1,590
23,581
Total 68.519 3,053 65,466
2002Feb. 15 14-1/4% bondMay 15 2 7-1/2%- A note
Nov. 15 1l-&8% bond
01A)6/8205/15/9209/29/82
1.75911,714
2,753
96614173
1.663
11,100
2,580
Total 16,226 882 15,344
2003Feb. 15 IO-a'4% bondMay 16 10-3'4% bondAug. 15 11 -1/8% bondNov. 15 11-7/8% bond
01/04/83
04/04/83
07/05/8310/05/83
3,0073,2493,501
7,260
16738195147
2,839
3,211
3,3067,112
Total 17,017
2004May 15 12-M%bondAug. 15 13-3/4%-bondNov. 15 2 11-5/8% bond
04/05/84
07/10/84
10/30/84
3,7554,0008,302
18311
139
3,572
3.9898.163
Total 16,057 15,724
2005May 1 5, 00-05 8-1/4% bondMay 1
5
2 12% bondAug. 15 2 10-3/4% bond
05/1 5A76
04/02/8507/02/85
4,2244,261
9,270
2,15669
248
2,068
4,191
9.022
Total 17,755 15.281
2006Feb.15. 2 9-3(8% bond
Total
2007Feb, 15.02-07.Nov. 15.02-07.
7-5/8% bond7-7/8% bond
02/15/7711/15/77
4,2341,495
1,539265
2,6951,230
1,803 3.926
42
PUBLIC DEBT OPERATIONS
TABLE PDO-l.-Maturity Schedule of Interest-Bearing Marketable Public Debt Securities
Other than Regular Weekly and 52-Week Treasury Bills Outstanding, June 30, 1992, con,
[In millions ol dollars]
Amount of maturities
Date ot linal maturrty
Description
43PUBLIC DEBT OPERATIONS
TABLE PDO-1.--Maturity Schedule of Interest-Bearing Marketable Public Debt Securities
Other than Regular Weekly and 52-Week Treasury Bills Outstanding, June 30, 1992, con.
[In millions of dollars]
Date of final maturity
Description
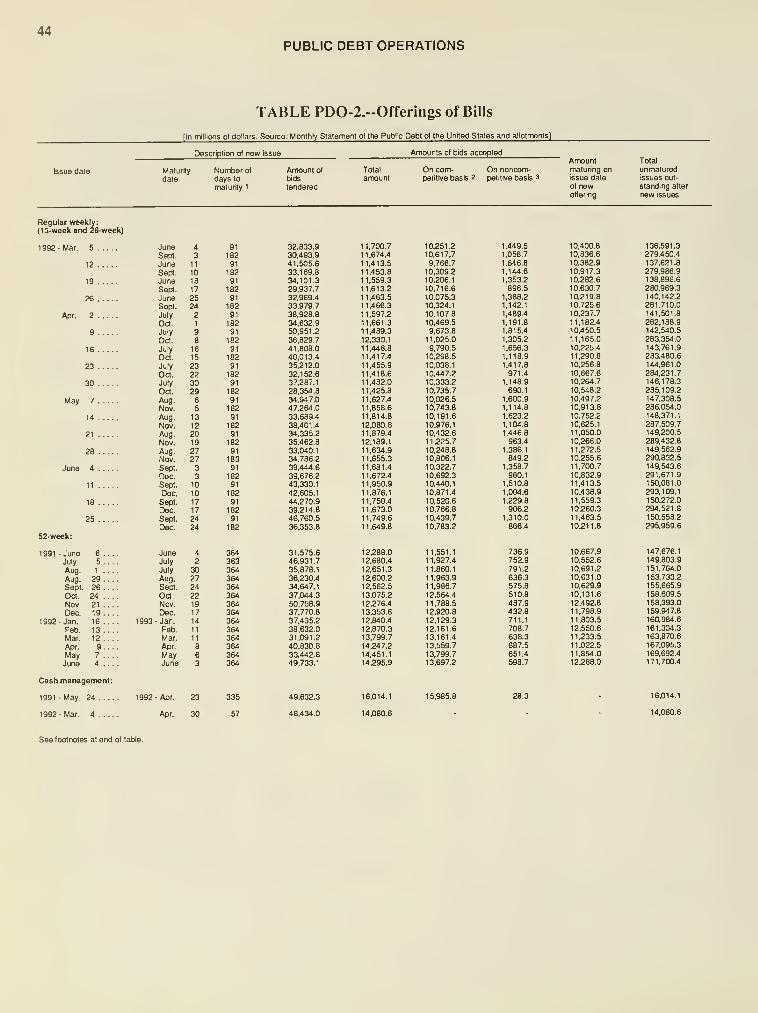
44PUBLIC DEBT OPERATIONS
TABLE PD0-2.--0fferings of Bills
[In millions ot dollars. Source: Monlhly Slatemenl ot the Public Debt d Ihe United Stales and allolmems]
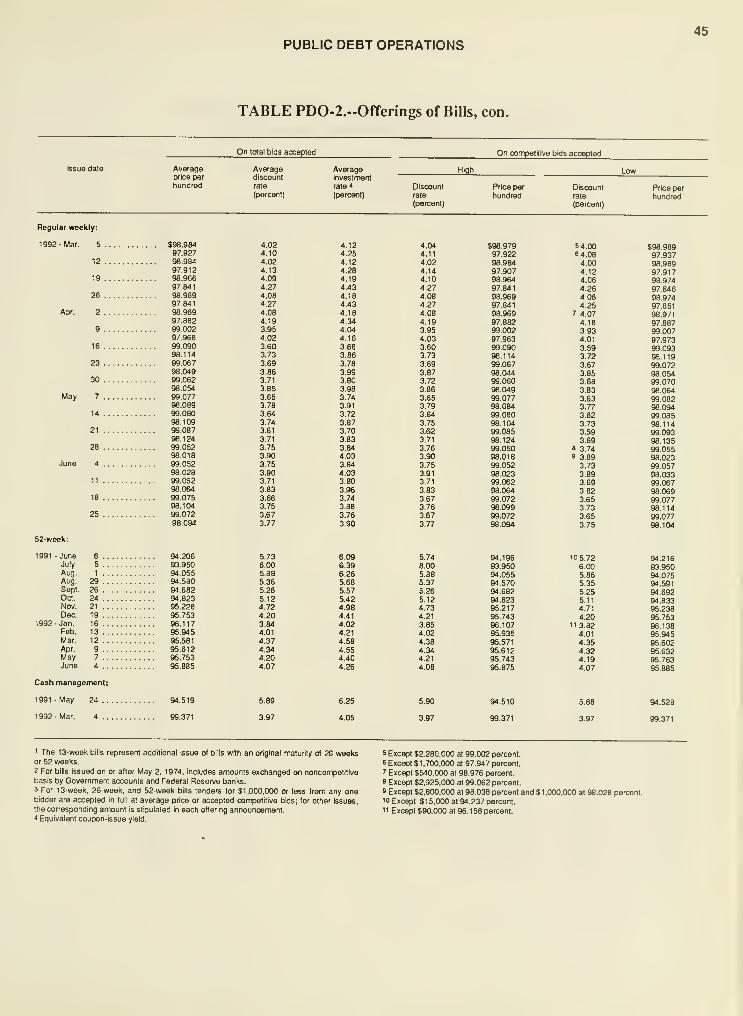
PUBLIC DEBT OPERATIONS45
TABLE PD0-2.--0fferings of Bills, con.
On total bids accepted On competitive bids accepted
Averageprice per
hundred
Averagediscount
rale
(percent)
AverageInvestment
rate 4
(percent)
High
Discount
rate
(percent)
Price perhundred
Discountrate
(percent)
Price per
hundred
Regular weekly:
1992- Mar. 5 $98,98497.927
12 98.98497.912
19 98.96697.841
26 98.96997.841
Apr. 2 98.96997.882
9 99.00297.968
16 99.09098.114
23 99.06798.049
30 99.06298.054
May 7 99.07798.089
14 99.08098.109
21 99.08798.124
28 99.05298.018
June 4 99.05298.028
11 99.06298.064
18 99.07598.104
25 99.07298.094
52-week;
1991 -June 6 94.206July 5 93.950Aug. 1 94.055Aug. 29 94.680Sept. 26 94.682Oct. 24 91.823Nov. 21 95.228Dec. 19 95.753
1992- Jan. 16 96.117Feb. 13 95.946Mar. 12 95.581Apr. 9 95.612May 7 96.753June 4 95.885
Cash management:
1991 -May 24 94 519
1992- Mar. 4 99.371
4.024.104.024.134.094.274.084.274.084.193.9S
4.02
3.603.733.69
3.863.71
3.853.653.78
3.643.743.61
3.71
3.753.90
3.75
3.903.71
3.83
3.663.75
3.67
3.77
5.73
6.00
5.885.36
5.26
5.124.724.203.844.01
4.37
4.344.20
4.07
5.89
3.97
4.124.254.124.284.194.434.184.434.184.344.044.163.68
3.863.78
3.993.80
3.983.743.91
3.72
3.873.70
3.833.844.033.84
4.033.80
3.963.74
3.883.76
3.90
6.096.39
6.265.685.57
5.424.98
4.41
4.024.21
4.584.554.404.26
6.25
4.05
4.044.11
4.02
4.144.10
4.274.084.27
4.08
4.193.95
4.03
3.603.73
3.69
3.873.72
3.86
3.653.79
3.64
3.76
3.62
3.71
3.76
3.903.75
3.91
3.71
3.83
3.67
3.76
3.67
3.77
5.74
6.005.88
5.37
6.26
5.12
4.73
4.21
3.85
4.02
4.38
4.344.21
4.08
5.90
3.97
$98,97997.92298.98497.90798.96497.841
98.96997.841
98.96997.88299.00297.96399.09098.11499,06798,04499.06098.04999.07798.08499.08098.10499.08598.12499.05098.01899.06298.02399.06298.06499.07298.09999.07298.094
91.19693.95094.06694.57094.68294.82395.21795.74396.10795.93596.57196.61296.743
96.875
94.510
99.371
5 4.006 4.08
4.00
4.124.06
4.26
4.064.25
7 4.074.18
3.93
4.01
3.693.72
3.67
3.853.68
3.83
3.63
3.77
3.623.733.59
3.698 3.749 3.89
3.73
3.89
3.69
3.82
3.663.733.65
3.75
'0 5.72
6.00
6.86
5.35
5.25
5.11
4.71
4.201
1 3.82
4.01
4.35
4.324.19
4.07
6.88
3.97
$98,98997.93798.98997.91798.97497.846
98.97497.851
98.971
97.88799.00797.97399.09398.11999.07298.06499.07098.064
99.08298.094
99.08598.11499.09398.13599.05598.02399.05798.03399.06798.06999.07798.11499.07798.104
94.21693.96094.07594.691
94.69294.83395.23895.75396.13895.94695.60295.63295.76395.885
94.628
99.371
1 The 13-week bills represent additional Issue of bills with an ohginal maturity ot 26 weeksor 52 weeks.
2 For bills issued on or after May 2, 1974. includes amounts exchanged on noncompetitivebasis by Government accounts and Federal Resen/e banks.3 For 13.week, 26-week, and 52-week bills tenders for $1,000,000 or less from any onebidder are accepted in full at average price or accepted competitive bids; for other issues.
the corresponding amount is stipulated in each offering announcement.* Equivalent coupon-issue yield.
5 Except $2,280,000 at 99.002 percent.
6 Except $1,700,000 at 97.947 percent.
7 Except $540,000 at 98.976 percent.
8 Except $2,925,000 at 99.062 percent.
9 Except $2,800,000 at 98.038 percent and $1 ,000,000 at 98.028 percent.
'0 Except $15,000 at 94.237 percent.1
1 Except $90,000 at 96. 1 58 percent.
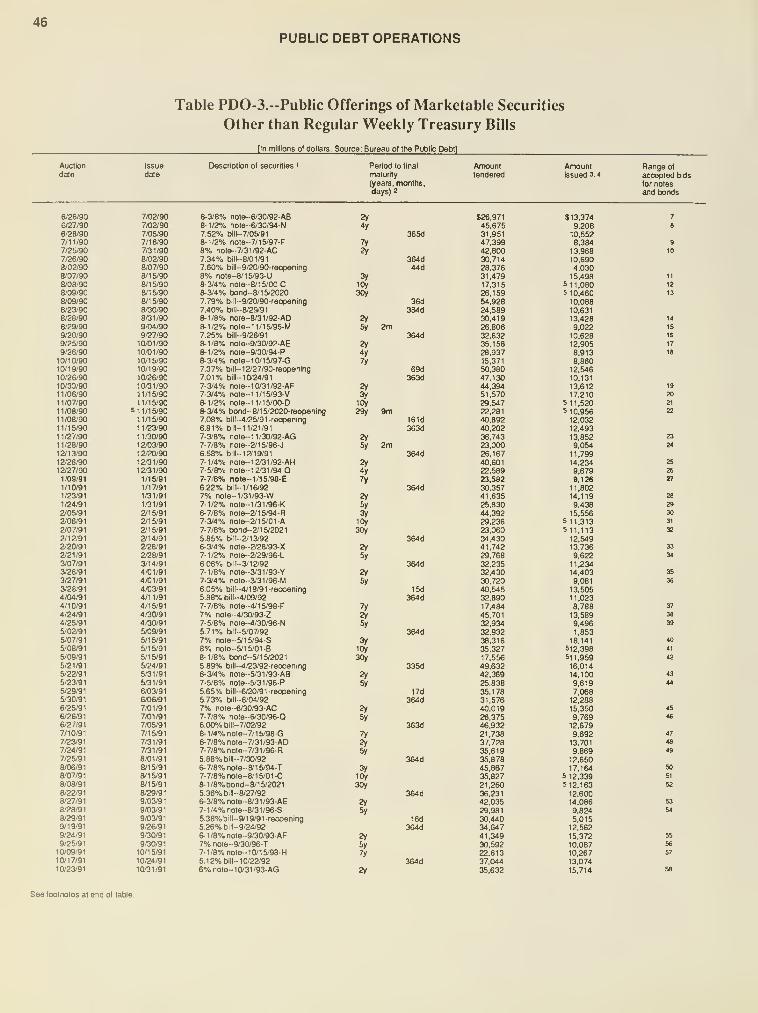
46PUBLIC DEBT OPERATIONS
Table PD0-3."Public Offerings of Marketable Securities
Other than Regular Weekly Treasury Bills
[In millions o) dollars. Source: Bureau of the Public Debt]
Auction
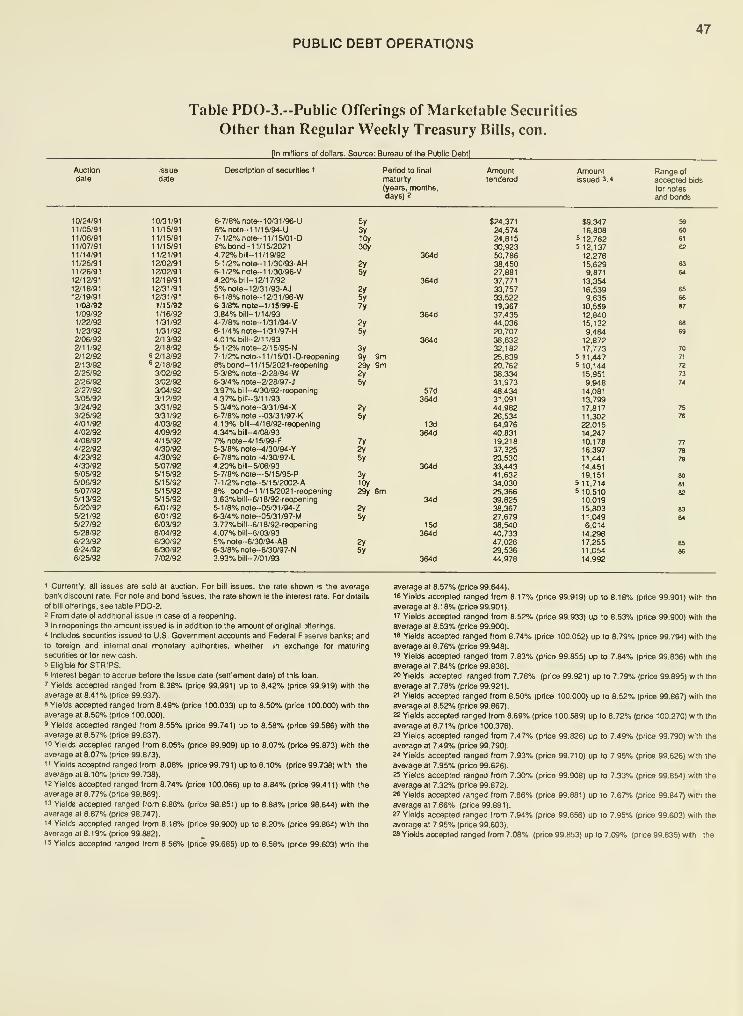
PUBLIC DEBT OPERATIONS47
Table PD0-3."PubIic Offerings of Marketable Securities
Other than Regular Weekly Treasury Bills, con.
[In millions ot dollars. Source: Bureau o( Ihe Public Debl]
Auction
daleIssue
date
Description ol securities <
48PUBLIC DEBT OPERATIONS
Table PD0-3."Public Offerings of Marketable Securities
Other than Regular Weekly Treasury Bills, con.
average al 7.09% (price 99.835).
29 Yields accepted ranged from 7.60% (price 99.590) up lo 7.63% (price 99.468) with the
average at 7.62% (price 99.509).
30 Yields accepted ranged from 6.97% (price 99.747) up to 6.98% (price 99.720) with the
average at 6.98% (price 99.720).
31 Yields accepted ranged from 7.84% (price 99.384) up to 7.85% (price 99.316) with the
average at 7.85% (price 99.316).
32 Yields accepted ranged from 7.97% (price 98.922) up to 7.98% (price 98.810) with the
average al 7.98% (price 98.810).
33 Yields accepted ranged Irom 6.85% (price 99.816) up to 6.87% (price 99.779) with the
average at 6,87% (price 99.779).
34 Yields accepted ranged from 7.50% (price 100.000) up to 7.51% (price 99.959) with the
average at 7.51% (price 99.959).
35 Yields accepted ranged from 7.13% (price 99.991) up to 7.15% (price 99.954) with the
average at 7.1 5% (price 99.954).
36 Yields accepted ranged from 7.80% (price 99.796) up to 7.81% (price 99.756) with the
average at 7.81% (price 99.756).
37 Yields accepted ranged from 7.92% (price 99.762) up to 7.94% (price 99.656) with the
average at 7.93% (price 99.709).
3« Yields accepted ranged from 6.99% (price 100.018) up to 7.00% (price 100.000) wNh the
average at 7.00% (price 100.000).
39 Yields accepted ranged from 7.69%
average at 7.70% (price 99.694).
40 Yields accepted ranged from 7.07%
average at 7.09% (price 99.761).
41 Yields accepted ranged from 8.06%
average at 8.07% (price 99.526).
42 Yields accepted ranged from 8.19%
average at 8.21% (price 99.057).
43 Yields accepted ranged from 6.81%
average at 6.81% (price 99.890).
44 Yields accepted ranged Irom 7.66%
average at 7.69% (price 99.734).
45 Yields accepted ranged from 7.03%
average al 7.06% (price 99.890).
46 Yields accepted ranged from 7.95%
average al 7.96% (price 99.655).
47 Yields accepted ranged from 8.25% (price 100.000) up to 8.26%average at 8.26% (price 99.948).
48 Yields accepted ranged from 6.93%
average at 6.94% (pnce 99.881).
49 Yields accepted ranged from 7.88%average al 7.89% (price 99.939).
50 Yields accepted ranged from 6.90%
average at 6.92% (price 99.880).
51 Yields accepted ranged from 7.94%average at 7.94% (price 99.557).
52 Yields accepted ranged from 8.15%
average at 8.1 7% (price 99.499).
53 Yields accepted ranged from 6.45%average at 6.46% (price 99.843).
54 Yields accepted ranged from 7.36%average at 7.37% (price 99.506).
55 Yields accepted ranged from 6.13%average al 6.14% (price 99.972).
56 Yields accepted ranged from 7.04%
average al 7.05% (price 99.792).
57 Yields accepted ranged from 7.19%average al 7.20% (price 99.593).
5« Yields accepted ranged from 6.00% (price 100.000) up to 6.01
[price 99.734) up to 7.70%
(price 99.814) up to 7.09%
(price 99.593) up to 8.07%
(price 99.278) up to 8.24%
;price 99.890) up to 6.83%
;price 99.857) up to 7.70%
;price 99.945) up to 7.06%
[price 99.696) up to 7.97%
[price 99.899) up to 6.95%
[price 99.980) up to 7.89%
(price 99.933) up to 6.93%
(price 99.557) up to 7.95%
(price 99.721) up to 8.19%
(price 99.862) up to 6.46%
(price 99.547) up 10 7.38%
(price 99.991) up to 6.15%
(price 99.834) up to 7.06%
(price 99.647) up to 7.20%
(price 99,694) with the
[price 99.761) with the
[price 99.526) with the
(price 98.728) with the
[price 99.853) with the
[price 99.694) with the
[price 99.890) with the
[price 99.615) with the
(price 99.948) with the
[price 99.862) with the
[price 99.339) with the
(price 99.853) with the
[price 99.489) with the
[price 99.278) with the
[price 99.843) with the
[price 99.465) with the
(price 99.954) with the
[price 99.792) wtth the
[price 99.593) with the
(price 99.981) with the
average at 6.01% (price 99.981).
59 Yields accepted ranged Irom 6.91% (price 99.854) up to 6.93% (price 99.771) with the
average at 6.92% (price 99.812).
60 Yields accepted ranged from 5.97% (price 100.081) up to 6.03% (price 99.919) with the
average at 6.00% (price 100.000).
61 Yields accepted ranged from 7.50% (price 100.000) up to 7.56% (price 99.584) with the
average at 7.53% (price 99.792).
62 Yields accepted ranged from 7.98% (price 100.227) up to 8.01% (price 99.887) with the
average al 8.00% (price 100.000).
63 Yields accepted ranged from 5.49% (price 100.019) up to 5.52% (price 99.963) with the
average al 5.51% (price 99.981).
64 Yields accepted ranged from 6.52% (price 99.916) up to 6.54% (price 99.832) with the
average at 6.54% (price 99.832).
65 Yields accepted ranged from 5.09% (price 99.831) up to 5.13% (price 99.756) with the
average al 5.12% (price 99.775).
66 Yields accepted ranged from 6.24% (price 99.513) up to 6.25% (price 99.470) with the
average al 6.24% (price 99.513).
67 Yields accepted ranged from 6.38% (price 99.972) up to 6.41% (price 99.805) with the
average al 6.40% (price 99.861).
68 Yields accepted ranged from 4.98% (price 99.802) up lo 5.00% (price 99.765) with the
average at 4,99% (price 99.784).
69 Yields accepted ranged from 6.26% (price 99.958) up lo 6.29% (price 99.831) with the
average at 6.28% (price 99.873).
70 Yields accepted ranged from 5.51% (price 99.973) up lo 5.55% (price 99.864) with the
average al 5.54% (price 99.891).
71 Yields accepled ranged Irom 7.29% (price 101.413) up lo 7.30% (price 101.344) wilh Ihe
average at 729% (price 101.413).
72 Yields accepled ranged from 7.90% (price 101.101) up lo 7.93% (price 100.757) with the
average at 7.91% (price 100.986).
73 Yields accepled ranged Irom 5.39% (price 99.972) up to 5.41% (price 99.935) with the
average at 5.40% (price 99.953).
74 Yields accepled ranged Irom 6.74% (price 100.042) up to 6.75% (price 100.000) with the
average at 6.75% (price 100.000).
75 Yields accepled ranged from 5.84% (price 99.832) up to 5.85% (price 99.814) with the
average at 5.85% (price 99.814).
76 Yields accepled ranged from 6.93% (price 99.771) up to 6.94% (price 99.729) with the
average at 6.94% (price 99.729).
77 Yields accepled ranged Irom 7.09% (price 99.510) up to 7.14% (price 99.239) with the
average at 7.11% (price 99.402).
78 Yields accepled ranged Irom 5.42% (price 99.916) up to 5.43% (price 99.897) with the
average at 5.43% (price 99.897).
79 Yields accepled ranged Irom 6.92% (price 99.812) up lo 6,94% (pnce 99.729) wilh ihe
average at 6.93% (price 99.771).
80 Yields accepted ranged from 5.95% (price 99.797) up to 5.97% (price 99.743) wrth Ihe
average al 5.96% (price 99.770).
81 The low. high, and average yield was 7.53% (price 99.792).
82 Yields accepled ranged from 7.99% (price 100.113) up to 8.00% (price 100.000) wilh
the average al 8.00% (price 100.000).
83 Yields accepled ranged Irom 5.11% (price 100.028) up to 5.14% (price 99.972) with the
average at 5.13% (price 99.991).
84 Yields accepled ranged Irom 6.74% (price 100.042) up lo 6.75% (price 100.000) with
Ihe average at 6.76% (price 100.000).
85 Yields accepled ranged Irom 5.1 1% (price 99.793) up to 5.12% (price 99.775) wilh the
average at 5.1 1% (price 99.793).
86 Yields accepted ranged from 6.41% (price 99.852) up to 6.43% (price 99.768) with the
average at 6.43% (price 99.768).
Note.--AII noles and bonds, except lor loreign-targeted issues, were sold al auction through
competitive and noncompetitive bidding. Foreign-targeted issues were sold al auction
through corrpetillve bidding only.
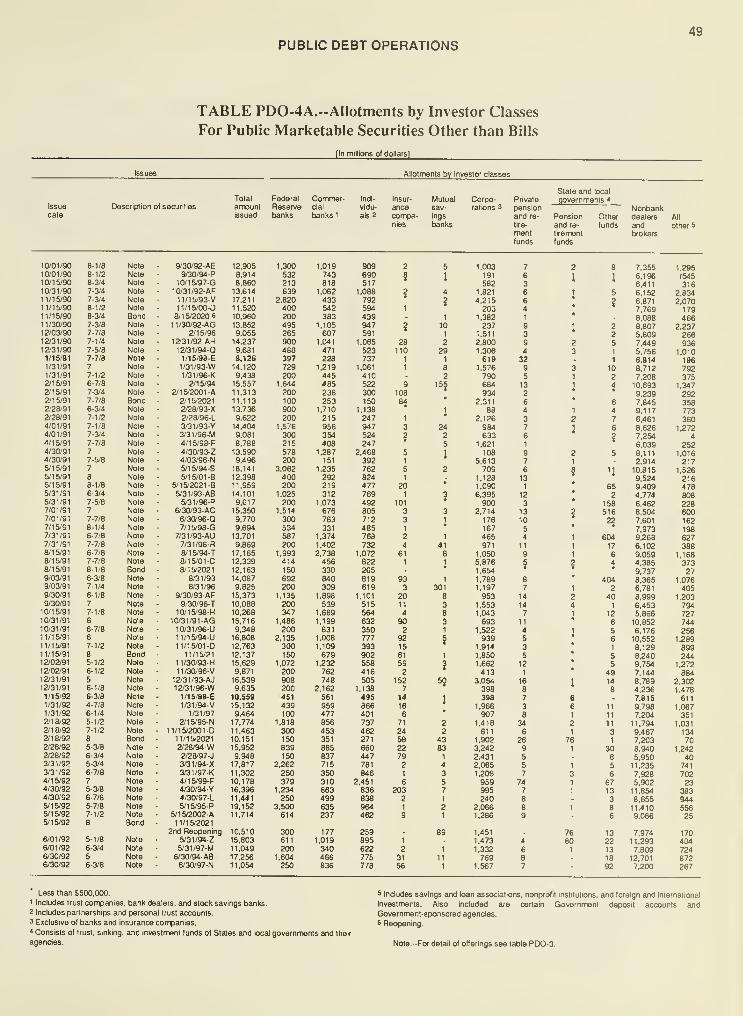
PUBLIC DEBT OPERATIONS49
TABLE PDO-4A.--Allotnients by Investor Classes
For Public Marketable Securities Other than Bills
[In millions ol dollars]
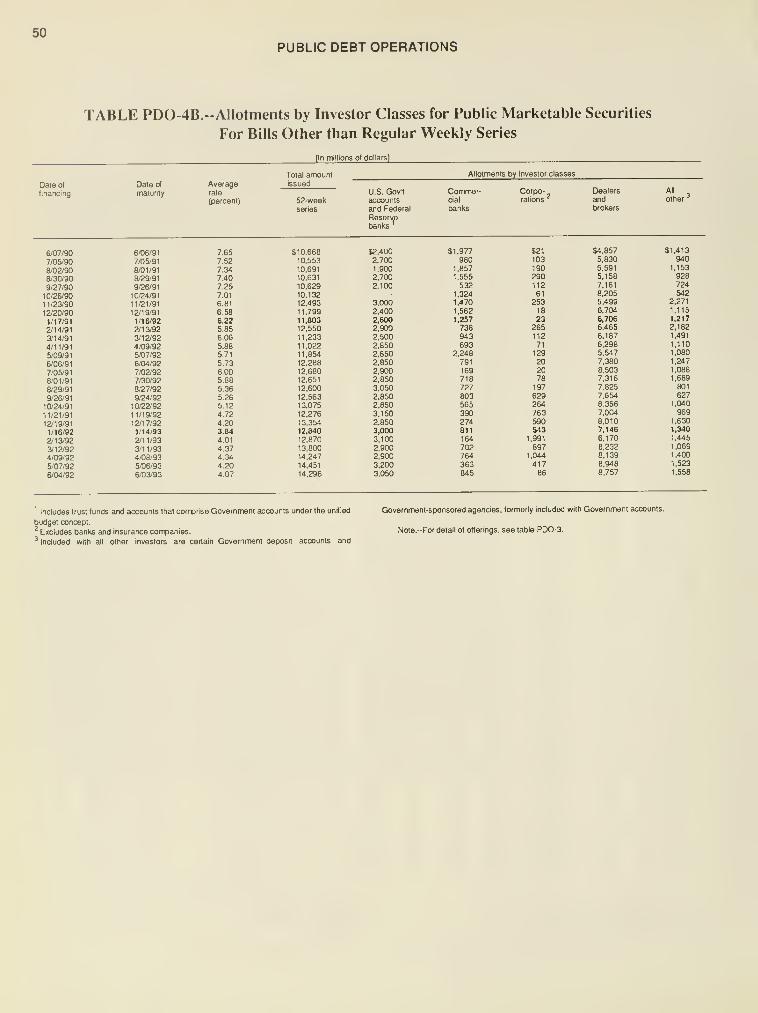
50PUBLIC DEBT OPERATIONS
TABLE PD0-4B. -Allotments by Investor Classes for Public Marketable Securities
For Bills Other than Regular Weekly Series

51
INTRODUCTION: Savings Bonds and Notes
Series EE bonds, on sale since January 1, 1980, are the only
savings bonds currently sold. Series HH bonds are Issued In exchangefor Series E and EE savings tx)nds and savings notes. Series A-D weresold from March 1 , 1 936, through April 30, 1 941 . Series E v^as on sale
from May 1 , 1 94 1 , through December 31,1 979 (through June 1 980 to
payroll savers only). Series F and G were sold from May 1, 1941,
through April 30, 1952. Series H was sold from June 1, 1952, through
December 31 , 1 979. Series HH bonds were sold for cash from January
1 , 1 980, through October 31 , 1 982. Series J and K were sold from May1, 1952, through April 30, 1957. U.S. savings notes were on sale May1 , 1 967, through June 30, 1 970. The notes were eligible for purchaseby individuals with the simultaneous purchase of series E savings
bonds. The principal temis and conditions for purcfiase and redemp-tion and infomiatlon on investment yields of savings notes appear in
the Treasury Bulletira of March 1967 and June 1968; and the AnnualReport of the Secretary of tfie Treasury for fiscal 1974.
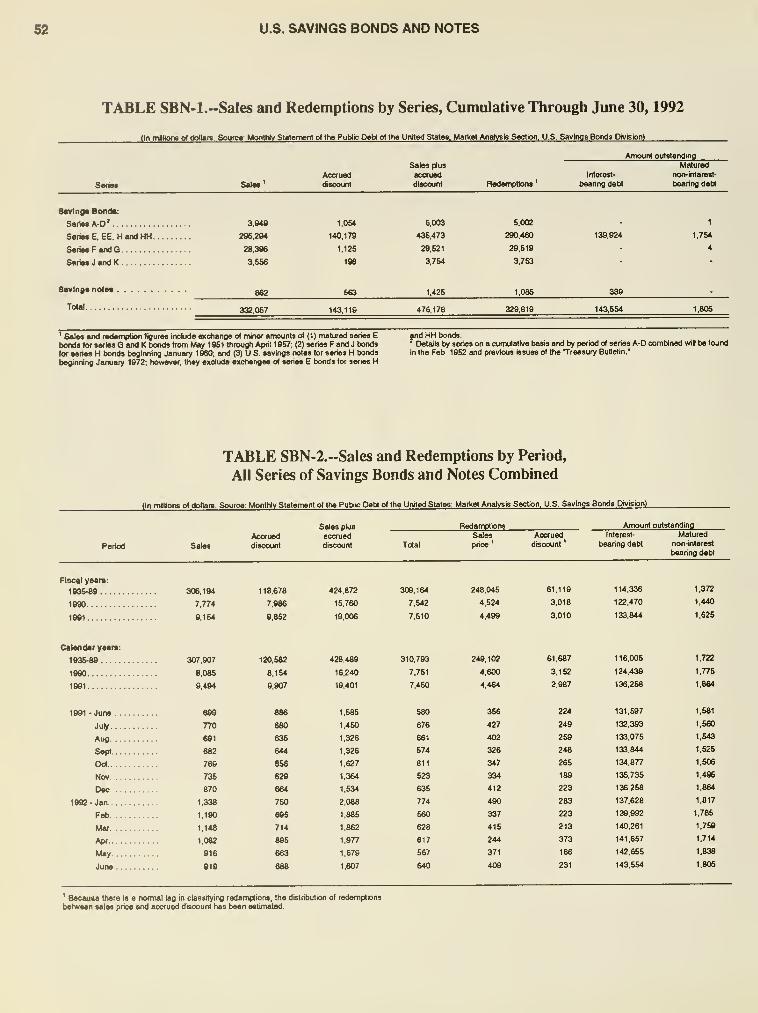
G2 U.S. SAVINGS BONDS AND NOTES
TABLE SBN-l.-Sales and Redemptions by Series, Cumulative Through June 30, 1992
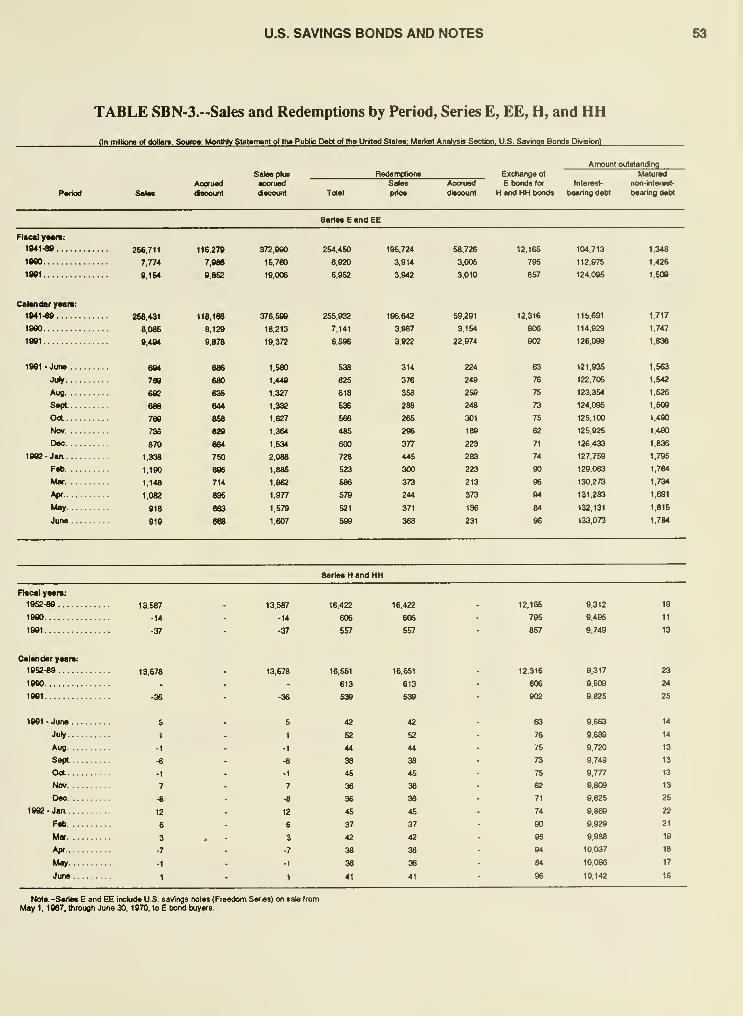
U.S. SAVINGS BONDS AND NOTES 53
TABLE SBN-3.--Sales and Redemptions by Period, Series E, EE, H, and HH
fln millions ol dollm. Souro: Monthlv Statement ol tha Pubib Dabt o) the United Statw: Market Analysis Section, US. Savings Bonds Division)
Period Sale*
Accrued
(taoowit
Sales plus
accrued
discount
Redemptions
pnoe
Accrued
discount
Exchange of
E bonds for
H and HH bonds
Amount outstanding
Matured
Interest- non-interest-
bearing debt t>earlng debt
SertM E and EE
Fiscal yeara:
1941-89
1990
1991
Calendar yearn:
1941-89
1990
1991
1991 -June ...
July....
Aug....
S«pl...
OoL....
Nov. ...
Dm:
1992 - Jaa . . .
.
Feb. . .
.
Mw. ...
Apr
May. ...
June . .
.
266,711
7,774
9,164
256,431
e,oee
9.484
694
760
769
736
870
1,338
1.190
1,148
1,082
816
818
116.278
7.986
9.8S2
118,168
8,129
9.878
680
636
644
858
629
684
760
896
714
372.090
54
INTRODUCTION: Ownership of Federal Securities
Federal securities presented in the following tables are public
debt securities such as savings bonds, bills, and notes that the
Treasury issues. The tables also detail debt issued by other Federal
agencies under special financing authorities. (See the Federal debt
(FO) tables for a more complete description of the Federal debt.)
• Table OFS-1 presents Treasury mari<etabie and nonmari<et-
able securities and debt issued by other Federal agencies held by
Government accounts, the Federal Reserve banks, and private inves-
tore. Social Security and Federal retirement trust fund investments
comprise much of the Government account holdings.
The Federal Reserve banks acquire Treasury securities in the
martlet as a means of executing monetary policy.
• Table OFS-2 presents the estimated amount of public debt
securities held by private investors. Information is obtained from
sources such as the Federal financial institution regulatory agencies.
State, local, and foreign holdings include special issues of nonmar-ketable securities to municipal entities and foreign official accounts.
They also include municipal, foreign official, and private holdings of
marketable Treasury securities. (See footnotes to the table for de-
scription of investor categories.)
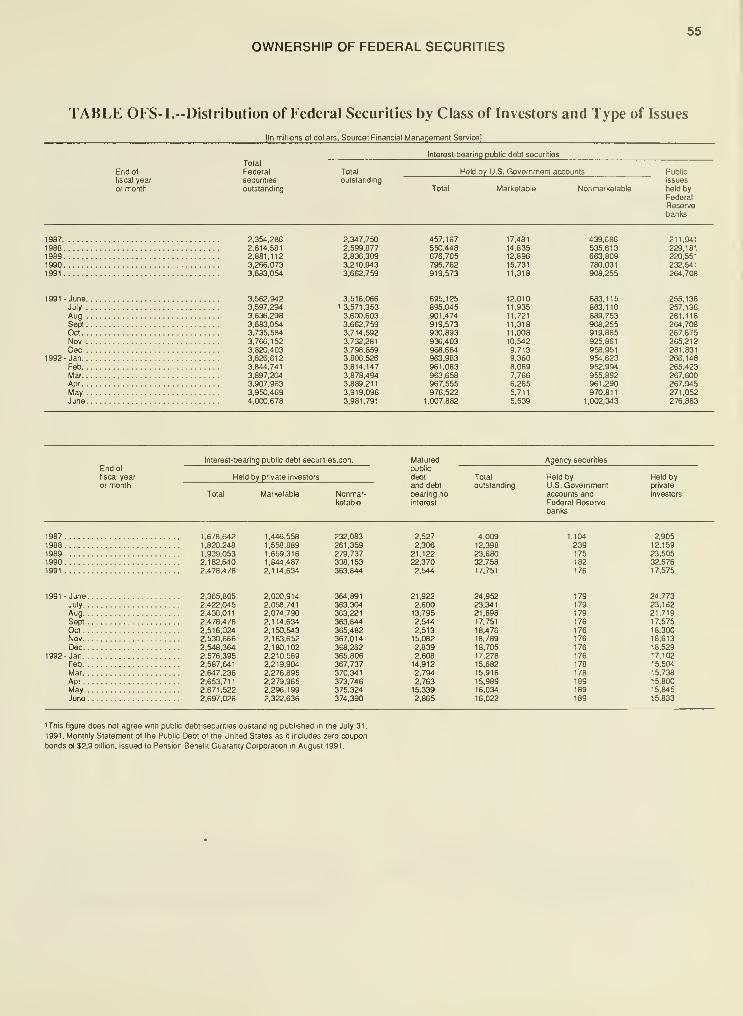
55OWNERSHIP OF FEDERAL SECURITIES
TABLE OFS-l.--Distribution of Federal Securities by Class of Investors and Type of Issues
[In millions ot dollars. Source: Financial Management Service]
End of
fiscal year
or month
Interest-bearing public debt securities
Total
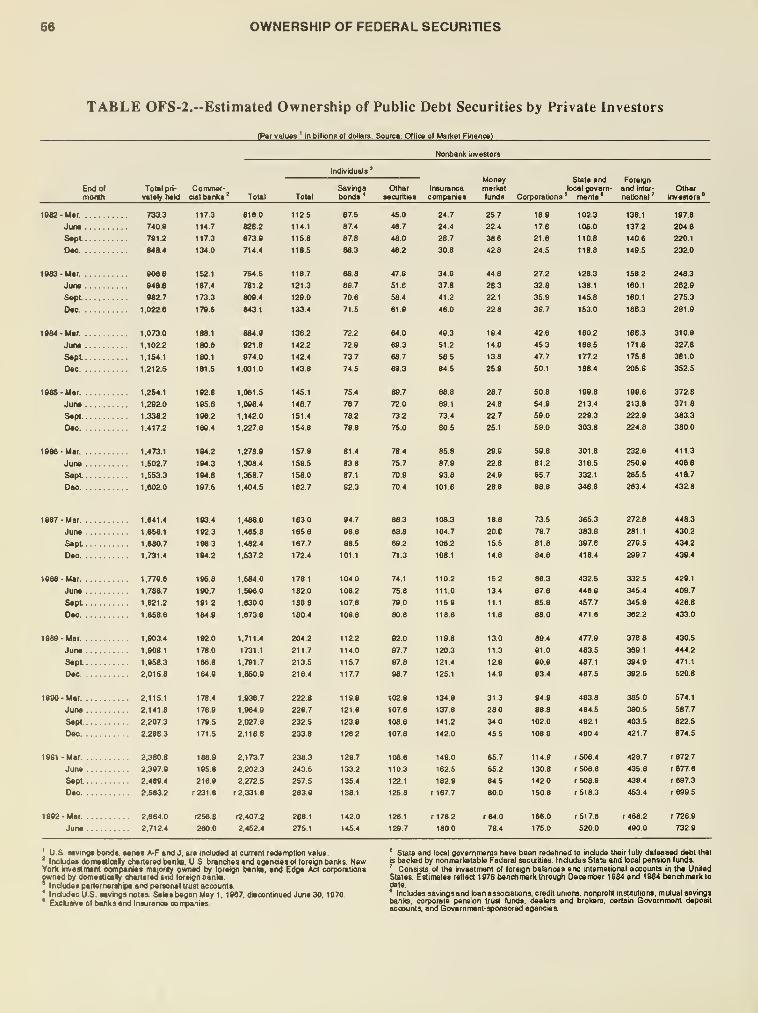
56 OWNERSHIP OF FEDERAL SECURITIES
TABLE OFS-2."Estimated Ownership of Public Debt Securities by Private Investors
(Par values in billions ot dollars. Sourca: OflioQ ol Markal FinancQ)
Nonbank investors
End of Total pri- Commaf-montti vafly hakl gal >>anl<» ' Total
1982-M«r 733.3 117.3 618.0
June 740.« 114.7 626.2
Sapt 791.2 117.3 873.8
Dm 848.4 134.0 714.4
1883 -Mar. 8066 1S2.1 754.S
JUIM 848.6 167.4 781.2
S«pt 882.7 173.3 609.4
0«e 1.022.6 179.S 643 1
1984 -Mar 1,073.0 188.1 884.8
June 1.1022 180.6 921.6
Sept. 1.1&4.1 180.1 974.0
Dm 1.212.5 181.5 1.031.0
18S5-Mar. 1.254.1 192.6 1.061.5
June 1.282.0 195.8 1.096.4
Sapt 1.338.2 186.2 1.142.0
Deo 1.417.2 188.4 1.227.8
1986 -Mar. 1,473.1 194.2 1.276.8
June 1.5027 184.3 1.308.4
Sapt 1.553.3 194.6 1.368.7
Om 1.6020 197.5 1.404.5
1887-Mar. 1.641.4 193.4 1.4880
June 1,658.1 192.3 1,465.8
Sapt 1,680.7 198.3 1,482.4
Dm 1,731.4 194.2 1,537.2
1888 -Mar. 1,778.6 186 6 1,664.0
June 1,786.7 180.7 1,566.0
Sapt 1,821.2 181.2 1,630
Dm 1,868.5 184.8 1,673.6
1888 -Mar. 1.903 4 192 1,711.4
June 1.908.1 178.0 1731.1
Sapt 1.858.3 166 6 1.791.7
Dm 2.015.8 164.8 1.860.8
1990-Mar. 2.1151 178.4 1,8367
June 2.141.8 176.9 1.864 9
Sapt 2.207.3 179.5 2,027 8
Dm 2.288.3 1715 2.116.8
1891 - Mar. 2.360 6 186 8 2.173.7
June 2.397.9 185 6 2.202 3
Sapt 2.489 4 216 8 2.272.5
Dm 2.663.2 r2316 r2.331.6
1882 -Mar 2.664 |2S6.8 r2.407.2
June 2.71 24 260.0 2.462.4

57
INTRODUCTION: Market Yields
The tables and charts in this section present yields on Treasury
marketable securities, and compare long-term yields on Treasury
securities with yields on long-term corporate and municipal securities.
• Table MY-1 lists Treasury market bid yields at corwtant maturi-
ties for bills, notes, and bonds. The ireasury yield curve in the
accompanylr>g chart, is based on current market bid quotations on the
most actively traded Treasury securities as of 3:30 p.m. on \he last
business day of the calendar quarter.
Treasury obtains quotations from the Federal Reserve Bank of
New York, which composites quotatkxis provided by five primary
dealers. Treasury uses these composite quotations to derive the yield
curve, based on semiannual interest payments and read at constant
maturity points to develop a consistent data series. Yields on Treasury
bills are coupon equivalent yields of bank discount rates at whichTreasury bills trade in the market. The Board of Governors of the
Federal Reserve System publishes the Treasury constant maturity
data series in its weekly H.15 press release.
• Table MY-2 sfiows average yields of long-term Treasury, cor-
porate, and municipal bonds. The long-term Treasury average yield is
the 30-year constant maturity yield. The corporate bond average yield
is developed by Treasury by cateulating reoffering yields on newlong-term securities maturing in at least 20 years and rated Aa by
Moody's Investors Service. The municipal borid average yield prior to
1991 was compiled by Treasury. Beginning virith January 1991, the
average yield is thie 'Municipal Bond Yield Average,' published byMoody's Investors Service for 20-year reoffering yields on selected
Aa-nated general obligations. See the footnotes for further explanation.
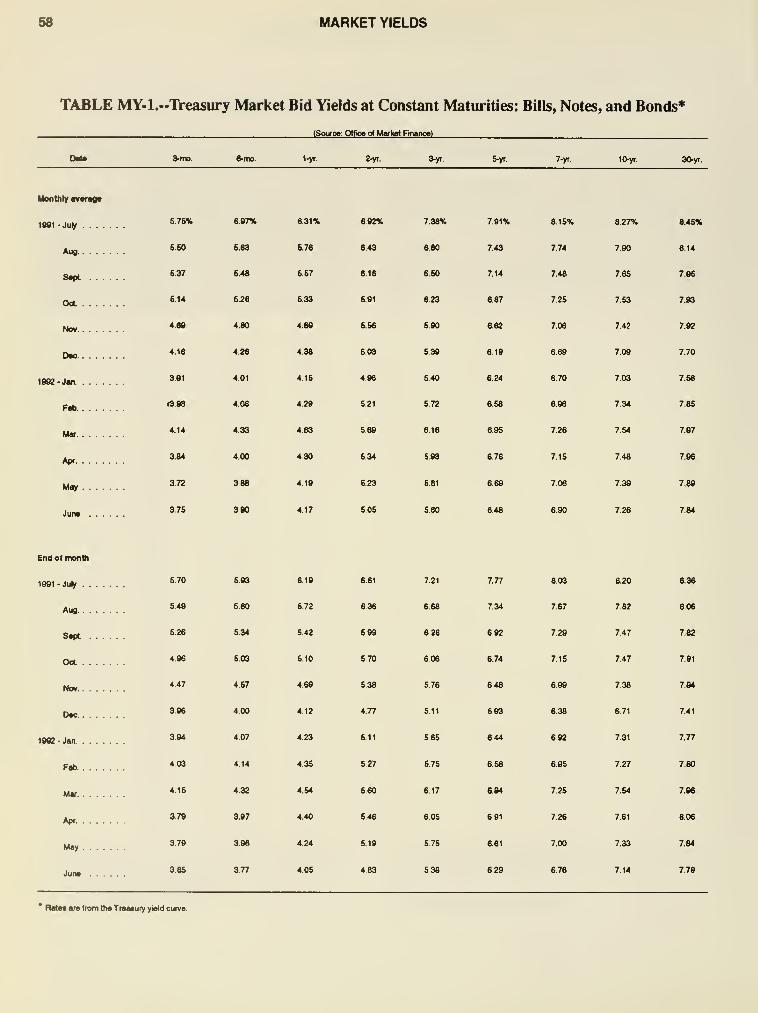
58 MARKET YIELDS
TABLE MY-l.-TVeasury Market Bid Yields at Constant Maturities: Bills, Notes, and Bonds*
(Souo»: O(fio» ot Maftol Finance)
Dal* 3-n». 6-tnB. l-yi. 2-yr. 3-yr 5-yr. 7-yr. 10-yr. 30-yr.
HonOiry avsrag*
1991 -July ^^^^ ^"^ *^^* "^ ^^®* '^^^ ^^^"^ ^"^ ^*^^
f^ 6.60 6.63 6.78 6.43 6 80 7 43 7.74 7.90 8.14
g^^ 6.37 6.48 6.67 6.18 660 7.14 7.48 7.65 7.96
0^ 5.14 6.26 5.33 5.91 6.23 687 7.25 7.53 7.93
ff^ 4.69 4.80 4.89 5.56 5.90 6.62 706 742 7.92
Q^ 4.18 4.26 4.38 603 638 619 669 7.09 7.70
1992 -Jan. ^'^ *°^ *^^ *^ ^*° ^^* *^° ^°^ ''
^
P^ 13.93 4.08 4.29 6.21 572 6.58 696 7 34 7.85
1^ 4.14 4.33 4.63 5 69 618 6.95 7.26 7.54 7.97
^ 3.84 4.00 4 30 5.34 5 93 6.78 7.15 7.48 7.96
j^ 372 3.88 4.19 6.23 6.81 6.69 7.06 7.39 7.89
j„^ 375 3.80 4.17 5.05 560 648 6.90 726 7.84
End of montti
1991- July *^° ^^ *^' **^ ^^^ ^^ ^°^ ^^° ^^
H^ 5.40 6.60 6.72 636 668 7 34 7.67 7 82 8.06
g^ 5.26 5.34 5.42 599 628 692 729 747 7 82
Q5^ 4.96 6.03 610 670 606 674 7.15 7.47 7.91
,g„ 4.47 4.57 4 69 6.38 576 648 6 99 7.38 7.94
Q^ 396 4.00 4.12 4.77 511 6 03 638 671 7.41
19Se-Jaa ^** *°^ *^ *^' *^ *** ^^ '^^ ^-^
F^ 403 4.14 4.36 6.27 675 658 6.95 7.27 7.80
Hd^ 4.16 4.32 4.64 6.60 617 694 725 7.54 7.96
f^ 379 397 4.40 546 606 691 7.26 7.61 806
H^ 379 396 4 24 5 19 5.75 661 7 00 7 33 7.84
ju^ 3.66 3.77 4.05 4.83 5 39 629 6 76 7.14 7.79
* RalM are from th« Treaaufy yMd curve.
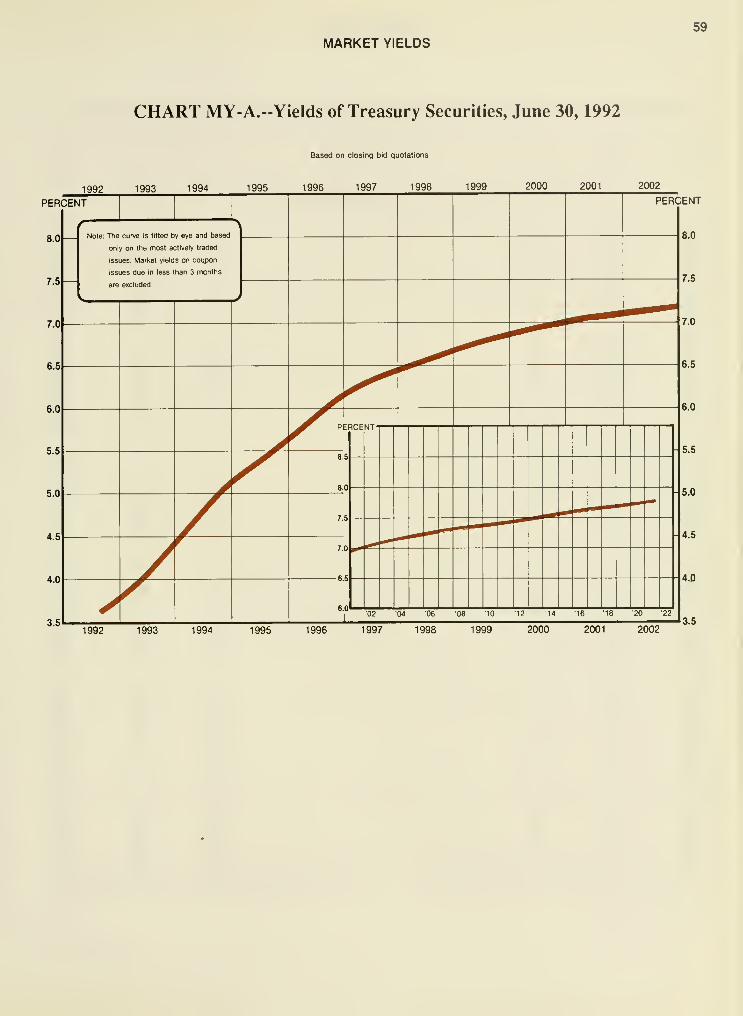
59
MARKET YIELDS
CHART MY-A.--Yields of Treasury Securities, June 30, 1992
Based on closing bid quotations
1992 1993 1994 1995 1996 1997 1998 1999 2000 2001 2002
PERCENT PERCENT
1992 1993 1994 1995 1996 1997 1998 1999 2000 2001 2002
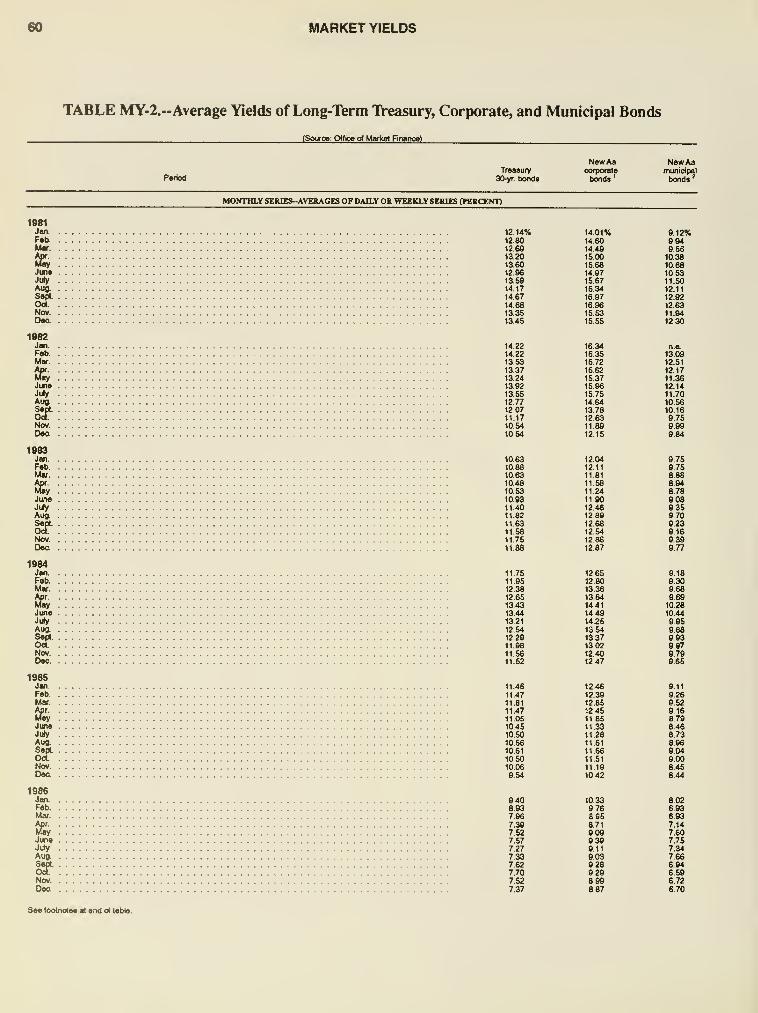
eO MARKET YIELDS
TABLE MY-2.-Average Yields of Long-Term Treasury, Corporate, and Municipal Bonds
(Soufoa: OHice o( Market Finance)
NewAa NewAaTreasury corporate municipal
Period aOirr bonds bonds
'
bonds '
MONTHLY SERIES-AVEKAGtS OF DjULY OR WEEKLY SEEIES (PERCXNT)
1981JanFabMw
i&l '.\'. '.'.'.'.'.'.'.'.'.'.'.'.'.'.'.'.'. \'. '.'.'.'.'.'.'.'.'.'.'.'.'.'.'.'.'.'.'.'.'.'.'.'.'.'.'.'.'.'.'.'. '.'.'.'.'.
JuneJulyAug.S«ptOotNow.Dwi.
1982Jan.Fab.Mar.
Vmi '.'.'.'.'.'.'.'.'.'.'.'.'.'.'.'.'.'.'.'.'.'.'.'.'.'.'.'.'.'.'.'.'.'.'.'.'.'.'.'.'.'.'.'.'.'.'.'.'.'.'.'.'.'.'.'.'.'.'.
JuneJulyAug
ir:::::::;::::::;:::::;::;::;::;;;;::::::::::::::;::;::::::;;Nov.Daa
1983JanFebMar
\&) '.'.'.'.'.'.'.'.'. '.'.'.\'. '.'.'.'.'/.'.'.'.'.'.'.'.'.'.'.'.'.'.'.'.'.'.'.'.'.'.'.'.'.'.'.'.'.'.'.'.'.'.'.'. '.'.'.'.
JuneJulyAug.
§S^;::::::::::::;::::::;::::::;::;:;:;:::;::::::::::::::::::::Nov.Daa
1984iMLFebMtf
CGv !;!:;:::;::::;;::::::;;;::::::;::::::::::::::::;:::::::::: :
JuneJiiy
Aug.
!?::::;;:::::::::::::::::::::;;;:;::::::::::::::;::::::::;;::Nov.Dea
1985JaiFeb.M«.
Vut '.'.'.'.'.'.'.'.'.'.'.'.'.'.'.'.'.'.'.'.'.'.'.'.'.'.'.'.'.'.'.'.'.'.'.'.'.'.'.'.'.'.'.'.'.'.'.'.'.'.'.'.'.'.'.'.'.'.'.
JuneJuly
Aug.
1^:::::::::::;::::;:::::::::::::::;:;::::;:;:::::::;:::::;;::Nov.Dea
1986JanFeb.Mar
V«i '.'.'.'.'.'.'.'.'.'.'.'.'.'.'.'.'.'.'.'.'.'.'.'.'.'.'.'.'.'.'.'.'.'. '.'.'.'.'.'.'.'.'.'.'.'.'.'.'.'.'.'.'.'.'.'.'.'.'.
JuneJuly
Aug.
13^::::::::::;::::::::::::::;:::::;:::::::::;:::::::::::::;:::Nov.
Dea
See lootnolaa al and d table.
12.14%
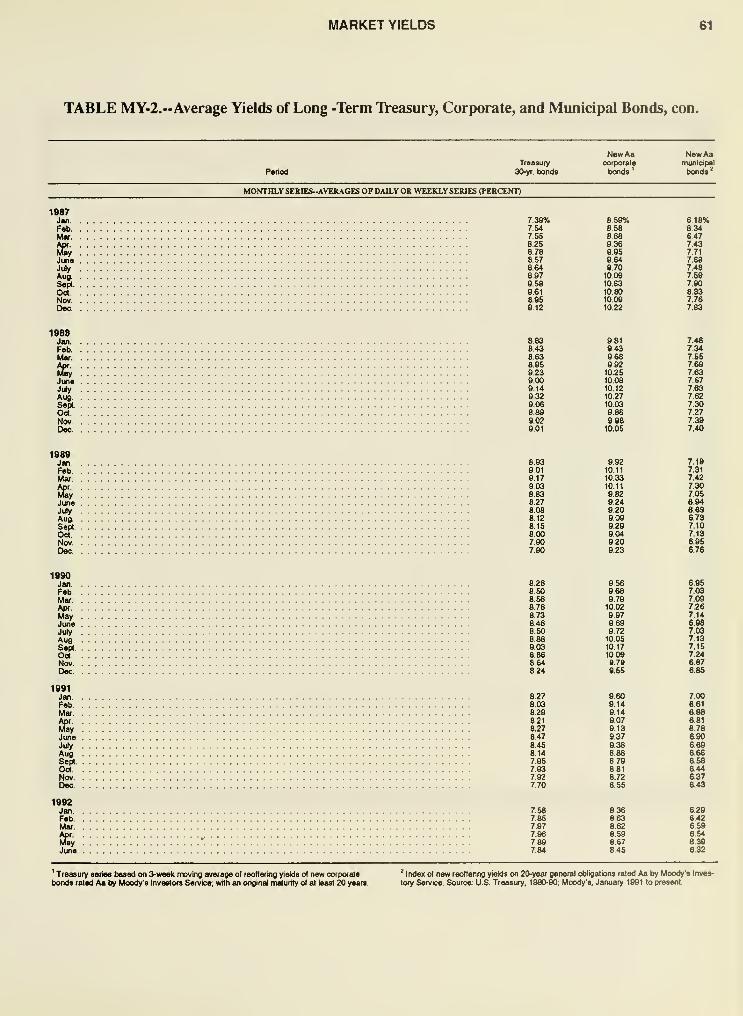
MARKET YIELDS 61
TABLE MY-l.-Average Yields of Long -Term Treasury, Corporate, and Municipal Bonds, con.
NewAa NewAaTrBasury corporate municipal
Period 30-yr. bonds bonds*
bonds^
MONTHLY SERIES-AVERAGtS OF DAILYOB WEEKLYSERIES (FERCENT)
1987JanFab.Mar
u!ii'.'.'.'.'.'.'.['.'. '.\'.\\'.'. '.'.'. \\'.'. '.'/.'.'.'.'. \'.'.'.y.'. '.'.'.'.'.'.'.'.'.
y.'.'.'.'.'.'/. '.'.'.
JuneJuly
AuaSepIOotNov.Deo.
1988JanFeb.Mtf
uii '.'//.['.'.'.'.['.\
'.'/.'.\
['//////.'.'.'.'.'//.'.'.'.\
'.
\ y. '.'/. y. '.
^
'.'.'.'.^
'.'.'.'.'.\
'.
JuneJuly
AugSaplOctNov.Dee
1989JanFebMar
Ubi)'/////.'.'.'.'.'.'.'.'.'.'.'.'.'.'.'.'.'.'.'.'.'.'.'.'.'.'.'.'.'.'.'.
y.'.'.'.'.'.'.
y.'.'.'.'.'.
\
'.'.'.\
'.'.
JuneJuly
Aug
13"::::::::::::;::::;;;;::::::::::::::::::;:::::::::::::::::::NovDeo
1990JmFebMar
li^ [ y . y . y y y. yy y y y . y yy yyyy yyyyyyyyy y y y y . y yy.JuneJulyAugSepIOdNov.Doc
1991JanFobMar
tS:/ yyy y y yyyy y y yyyyyy yyyyy . y y y y y y y y y y \ y y yyJuneJulyAug
^yyyyyyyyyyyyyyyyyyyyyyyyyyyyyyyyyyyyyyyyyyyyyyyyyyyy.Nov.Dec.
1992JmFebMw
Zyyyyyyyyyyyyyyyyyyyyyyyyyyyyyyyyyyyyyyyyyyyyyy.June
' Treasury series besad on 3-week moving average of reoffering yields o( new corporate ' Index o( new reottering yields on 20-year general obligations rated Aa by Moody's Inves-
bonds rated Aa by Moody's Investors Service, with an onginal mMurity of at least 20 years. tory Senfice. Source: U.S. Treasury. 1880-90, Moody's, January 1891 to present
7.38%
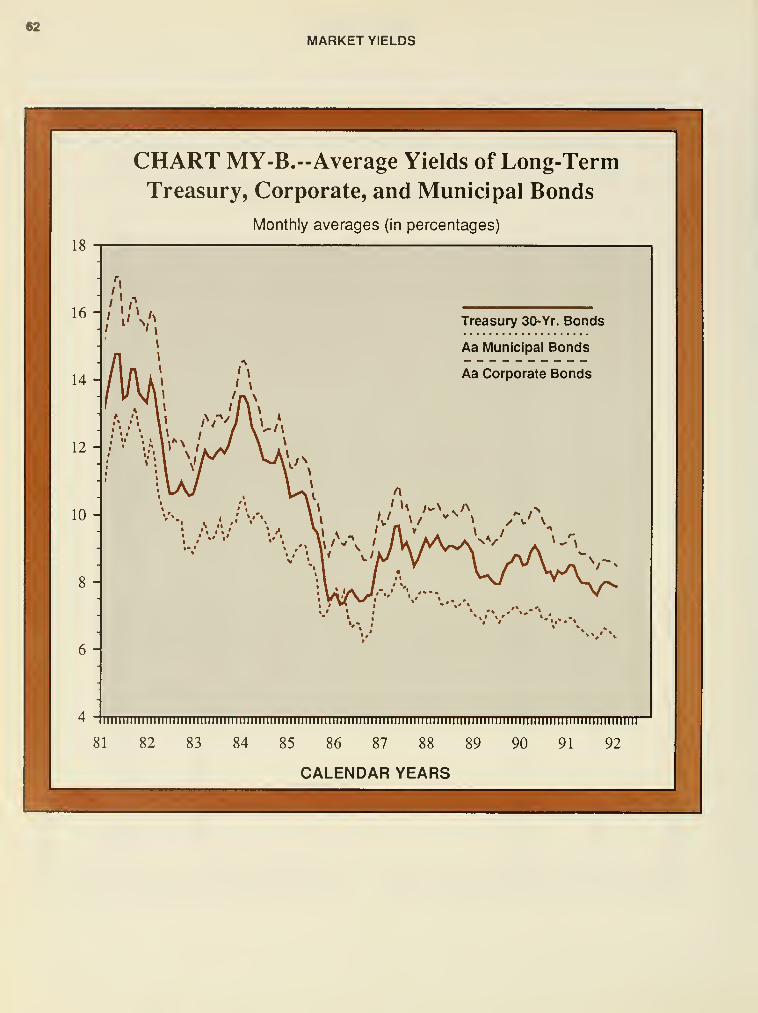
MARKET YIELDS
CHART MY-B.-Average Yields of Long-Term
Treasury, Corporate, and Municipal Bonds
Monthly averages (in percentages)
18
16
14 -
12 -
10 -
8 -
6 -
Treasury 30-Yr. Bonds
Aa Municipal Bonds
Aa Corporate Bonds
liiiiiiiiiiiiiiiiiiiiiiiiiiiiiiiiiiiiiiii
81 82 83 84
iii i i iiii iiii i iiiiiii ii ii i iiiii ii iiiiiiiii ii iiiiii iii iii i i ii i i iiiiii ii iii i i i iii iii i i iiiiiii iii
85 86 87 88 89 90 91 92
CALENDAR YEARS
...- : .- -,-r^:.».,,»^^^,^,,-»«v^^»^,^....
63
INTRODUCTION: U.S. Currency and Coin Outstanding and in Circulation
,. 1^Jll® '-'S- Currency and Com Outstanding and in Circulation(USCC) statement informs thie public of the total face value of currencyand coin used as a mecSum of exchange that is in circulation at theend of a given accounting month. The statement defines the totalamount otcurrerKy arxl coin outstanding and the portion deemed tobe in circulation, and includes some old and current rare issues thatdo not circulate, or that may do so to a limited extent Treasury includesthem in the statement t>ecause the issues were originally intended forgeneral circulation.
The USCC statement provides a description of the various Issuesof paper money. It also gives an estimated average of currency andcoin held by each individual, using estimates of population from theBureau of the Census. USCC InTormation has been published byTreasury since 1888, and was published separately untiT 1983 whenIt was incorporated into the Treasury Bulletin. The USCC comes frommonthly reports compiled by Treasury offices, various U. S. Mint officesthe Federal Reserve banks, and the Federal Resen/e Board
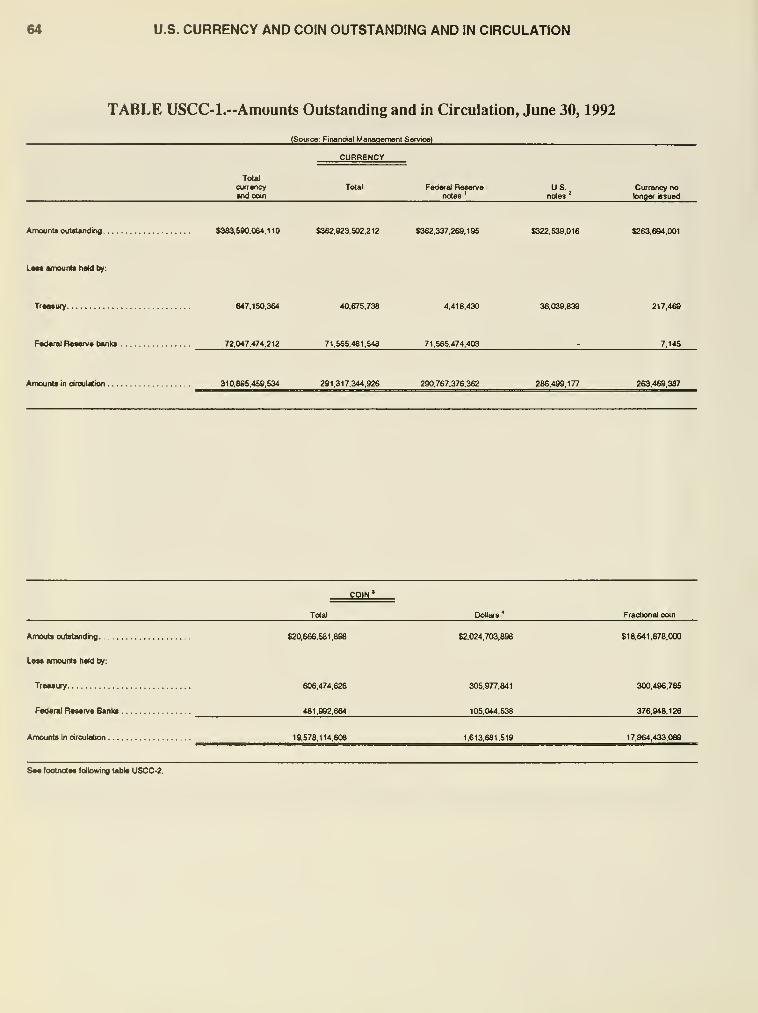
64 U.S. CURRENCY AND COIN OUTSTANDING AND IN CIRCULATION
TABLE USCC-l.--Amounts Outstanding and in Circulation, June 30, 1992
(Source: Financial Management Sofvtoe)
Total
ourrenoy Federal Resen/enotes
'
USnotes
^Currency nolongef issued
Amount* outstanding
.
$383,590,064,110 S362,923.S02,212 $362,337,269,195 $322,539,016 $263,694,001
L*« amount* held by:
Trwttuy. 40,675,738 4,418,430 36,038,839 217,4
Federal Reaerve ttanka . 72,047,474,212 71,565,481,548 71,565,474,403 7,145
Amount* in cireulMion
.
310,885,459,534 291,317.344,926 290,767,376,362 286,499,177 263,469,387
COIN'
Dollars' Fractional coin
Amouts outstanding
Le«« amount* held l)y:
TreB*ury
Federal Beaeive Banis
Amounts in oirculalion
Seelootnotee following tabb USCC-2.
$20,666,581,898
606,474,626
481,882,664
18,578,114,608
$2,024,703,896
305,877,841
105,044,538
1,613,681,518
$18,641,878,000
300,496,785
376,948,126
17,964,433,089
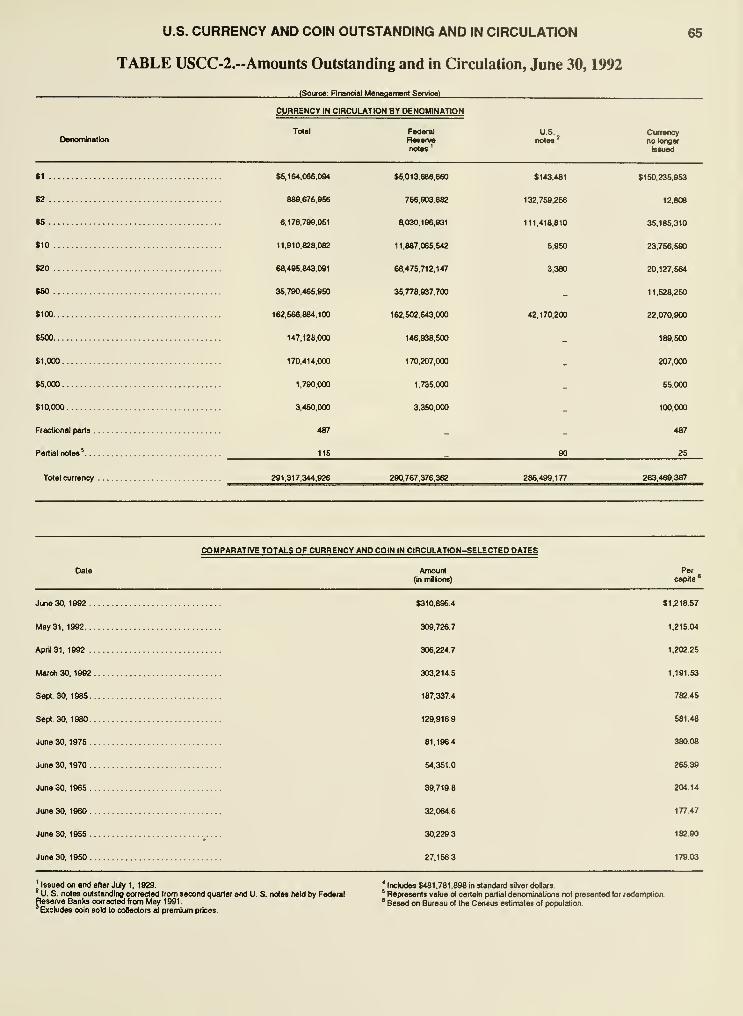
U.S. CURRENCY AND COIN OUTSTANDING AND IN CIRCULATION
TABLE USCC-2."Amounts Outstanding and in Circulation, June 30, 1992
65
(Souroe: Flnanqal Management Sarvtoo)
Denomjnallon
CURHENCY IN CIRCULATION BY DENOMINATION
Total Fedaral
Raaanwnotes'
U.S.. Currencyno longer
Issued
$1
$Z
tS
S10
$20
$50
$100
$500
$1,000
$5.000
$10,000
Fractional parts
Partial notes'
Total currency
$5,164,066,094
888,676,956
6,176.799,051
11,910,628,082
68,495.843,091
35,780.465,950
162,566.884,100
147,128,000
170,414.000
1.790.000
3.450.000
487
115
281.317.344,926
$5,013,688,660
756.903.882
6.030.196,931
11.887.065.542
68.475,712.147
35.778.937.700
162.502.643.000
146.938.500
170.207.000
1,735,000
3,350,000
290,767,376,362
$143,461
132,758,266
111,416,810
5,850
3,380
42,170,200
90
$150,235,953
12,806
35,185,310
23,756,580
20,127,564
11,526,250
22,070900
189,500
207,000
55,000
100,000
487
25
263,469,387
Percapita^
COMPARATIVE TOTALS OF CURRENCY AND COIN IN CIRCULATION-SELECTED DATES
Date Amount(in mflltons)
June 30, 1802 $310,895 4
May 31, 1992 308,726.7
April 31, 1892 306,224 7
March 30, 1992 303,214.5
Sept 30, 1985 187,337.4
Sept. 30, 1960 129,916.9
June 30, 1976 81,196.4
June 30, 1970 54,351.0
JuneSO, 1965 39,719.8
June 30, 1960 32.064 6
June 30, 1955 .^.... 30.229.3
June 30. 1950 27.156.3
' Issued on and after July 1, 1929. 'includes $481 .781.898 in standard silver doBarsUS notes outstanding corrected from second quarter and U. S. notes held by Federal ' Represents value oi certain partial denominations not presented for redemption.
Reserve Banks corrected from May 1 991
.
6 g^^^ ^^ Bureau ol the Census estimates of populationExcludes coin sold to collectors at premium prices.
$1.21857
1.215.04
1.202.25
1.181 53
782 45
58148
380 08
265.38
204.14
177.47
182.80
179 03

INTERNATIONALSTATISTICS


69
INTRODUCTION: International Financial Statistics
The tables in this section provide statistics on the U.S Govern-ment's reserve assets, liatiilities to foreigners, and its internationalfinancial position.
• Table IFS-1 shows U.S. reserve assets, Including gold stockand special drawing rights held in the Special Drawing account in theIntemaionalMonetary Fund (IMF). The table also shovw U.S. resen^eholdings and holdings of convertible foreign currencies in the IMF.
• Table IFS-2 contains statistics on Cabililies to foreign officialinsUhitons, and selected liabilities to all other foreigners, which areused in the United States balance of payments statistics.
• Table IFS-3 shows nonmarketable bonds and notes that Treas-ury issues to official institutions and other residents of foreign countriesThe figures are in dollars or dollar equivalents.
• Table IFS-4 presents the general foreign exchange value of theU.S doBar. Values presented are broader than those provided bysingle exchange rate levels and do not claim to represent a guide tomeasunng the impact of exchange rate levels on United States inter-nahonal transactions. Indices are computed as geometric averages ofindividual curency tevels with weights derived from the share of eachcountry s trade with the United States during the years 1982 and 1983
I
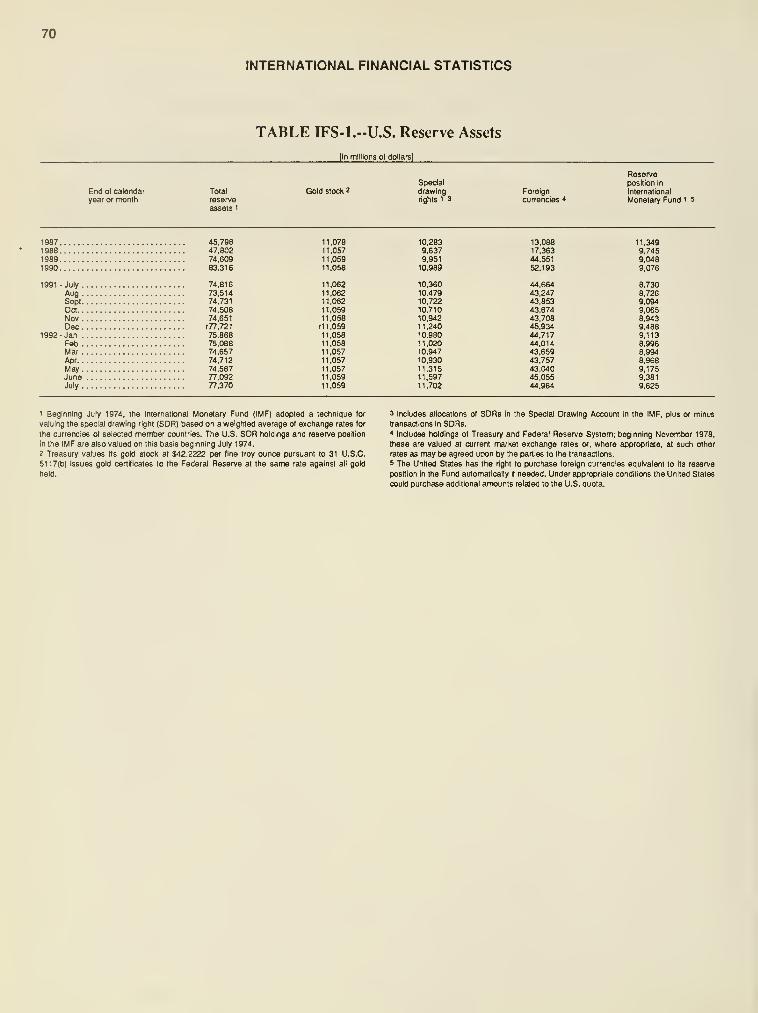
70
INTERNATIONAL FINANCIAL STATISTICS
TABLE IFS-1.--U.S. Reserve Assets
[In millions of dollars]
End of calendar
year or month
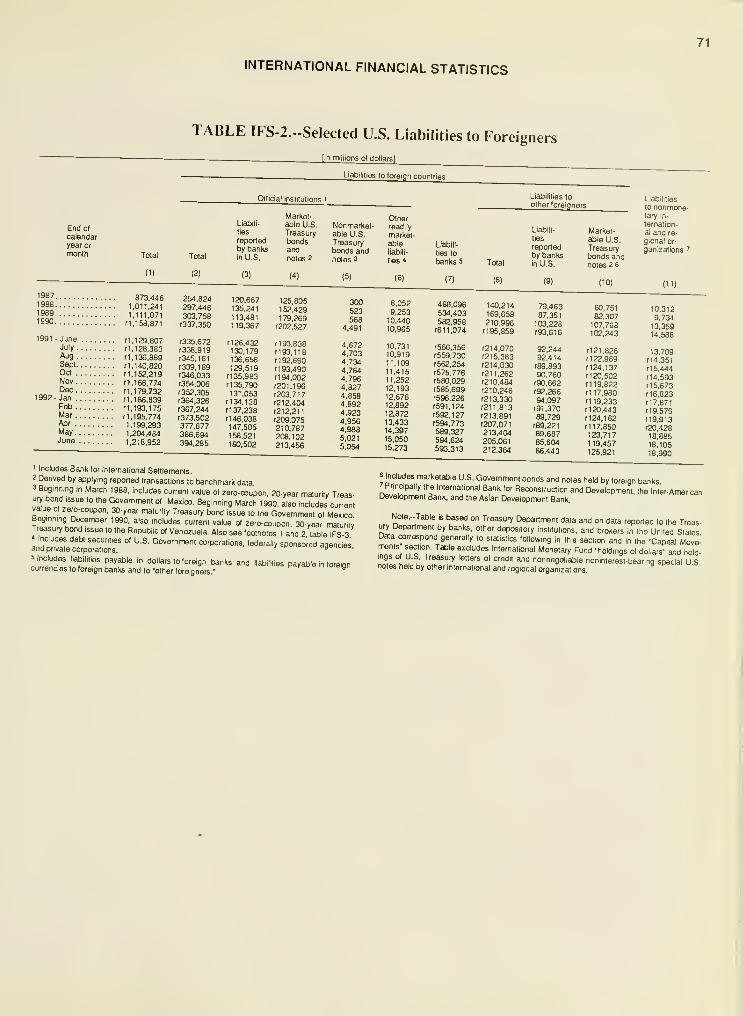
INTERNATIONAL FINANCIAL STATISTICS
71
End of
catendaryea; or
month Tola!
(1)
1987 873,446'988 1.011.2411989 1.111,0711990 rl. 168.871
1991 -June M. 129.807July n. 128.383Aug n. 136.889Sept rl. 140.820Oct rl, 152,219Nov rl, 166.774Dec rl. 179.732
1992- Jan rl. 186.839Feb r1. 193.175Mar rl, 195,774Apr 1,199,293May 1.204.484June 1.218.952
TABLE IFS-2.-Selected U.S. Liabilities to Foreigners
Total
(2)
254.824297.446
303.758r337.350
r335.672r338.919
r345.161
r339.189r346.033
r354.006
r352.305r364.326r367.244
r373.502
377.677386.694394.285
[In millions otdollarsl
Liabilities to foreign countries
Official institutions i
Liabili-
ties
reported
by banksin U.S.
(3)
Market-able U.S.
Treasury
bondsandnotes 2
(4)
Nonmarket-able U.S.
Treasurybonds andnotes 3
(5)
Otherreadily
market-
ableliabili-
ties *
(6)
Liabili-
ties to
tanks 5
(7)
120.667135.241
113.481
119.367
r126,432
130.179136,658
129.619r135.983
ft 35.790131.063rl34.138
rl 37.238r 146.038147.605158.621
160,502
125,805
152,429179,269r202,527
r193.e38rl93,118
r 192,660r 193,490ria4,002
r201,196
r203,717r212,404
r212,211
r209,075
210,787208,102213,456
300523568
4,491
4.6724.7034.734
4.7644.7964.8274.8584.8924.9234.9564.9885.021
5,054
f Includes Bank for International Settlements.
2 Derived by applying reported transactions to benchinark data3 Beginning in March 1988, includes current value of zero-coupon, 20-year maturity Treas-UT, bond issue to the Government of Mexico. Beginning March 1990, also includes current
r1^ero-coupon, 30.year maturity Treasury bond issue to the Government of f^exteo
Beginning December 1990, also includes current value of zero-coupon, 30-year maturityTreasury bond issue to the Republic of Venezuela. Also see footnotes 1 and 2 table IFS-3includes debt securities of U.S. Government corporations, federally sponsoied agenciesand private corporations.
oa"'"-'"'.
5 Includes liabilities payable in dollars to foreign banks and liabilities payable in foreigncurrencies to foreign banks and to -other foreigners."
e in loreign
8.052
9.25310.44010.965
10.731
10.919
11.109
11.41611.252
12,193
12.67612.892
12.87213.43314,397
15,050
15,273
468,096534.403
582.968r61 1.074
r566.356r559.730r562.254
r576.776r580.029
r685.699
r696.226r591,124
r592.127
r594.773
589.327594.624593,313
Total
(8)
140,214
169,668
210,996r 195,859
1214,070r2 15.383r214.030
r2 11.262r210.484
r210.246
r213.330r211.813
r213.B91
r207.071
213.404205.061
212.364
Liabilities to
other foreigners
Liabili-
ties
reported
by banksin U.S.
(9)
Market-
able U.S.
Treasurybonds andnotes 2 6
(10)
Liabilities
to nonmone-tary in-
ternation-
al and re-
gional or-
ganizations 7
(11)
79.46387.361
103.228r93.616
92,24492,414r89,893
90.760r90,662
r92,266
94,097r91,370
89,729r89,221
89,68785,60486,443
60.751
82.307107.768102.243
r 121 .826rl 22.969r124.137
rl 20.502r 119.822r 117.980rl 19,233r120,443
r124,162
rl 17,850123,7171 19,457
126,921
10,312
9.734
13.36914.588
13.709rl4.351
r 16.444
rl4.593r16.673
rl6.823
rl7.871
rt9.576rl9.913
r20.428
18.885
18.105
18.990
6 Includes marketable U.S. Government bonds and notes held by foreign banks7 Pnncipally the International Bank for Reconstruction and Development, the Inler-AmencanDevelopment Bank, and the Asian Development Bank.
Note.-Table Is based on Treasury Department data and on data reported to the Treasury Department by banks, other deposJory institutions, and brokers in the United StalesData correspond generally to slalislics following in this section and in the "Capita) Movements section. Table excludes International Monetary Fund "holdings of dollars" and hold-
'"f \. .f.^'^^"'^ '«"«'= °' "^O" and nonnegotiable noninteresl-bearmg special U Snotes held by other international and regional organizations.
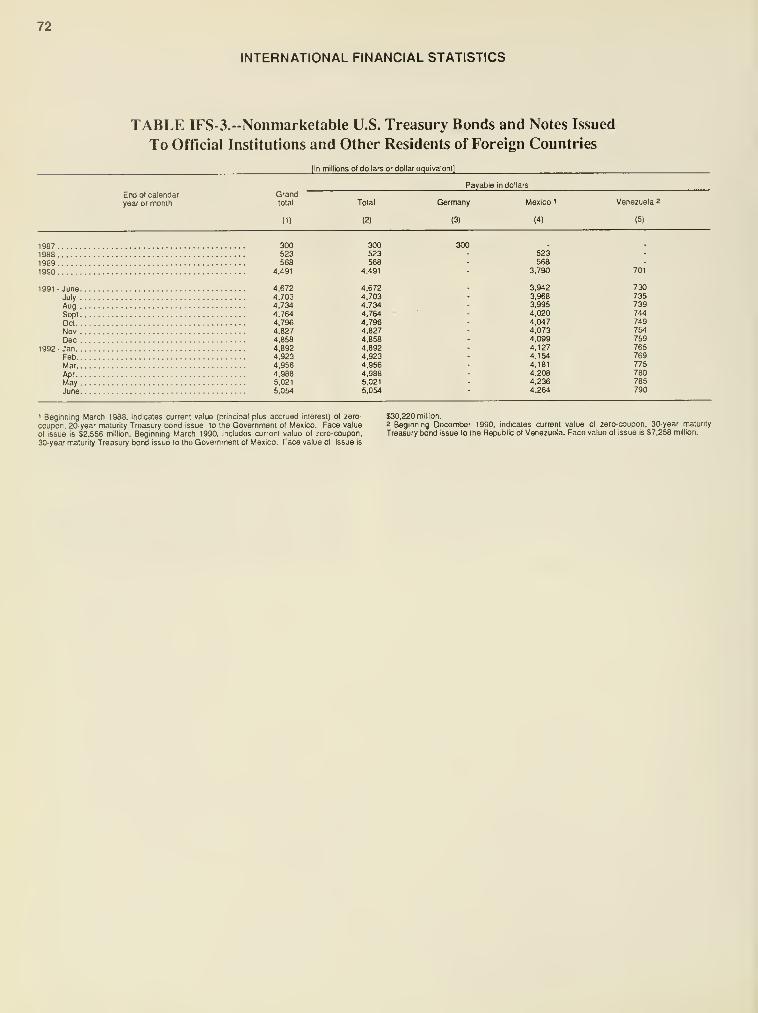
72
INTERNATIONAL FINANCIAL STATISTICS
TABLE IFS-3.--Nonmarketable U.S. Treasury Bonds and Notes Issued
To Official Institutions and Other Residents of Foreign Countries
|ln millions ot dollars or dollar equivaleni]
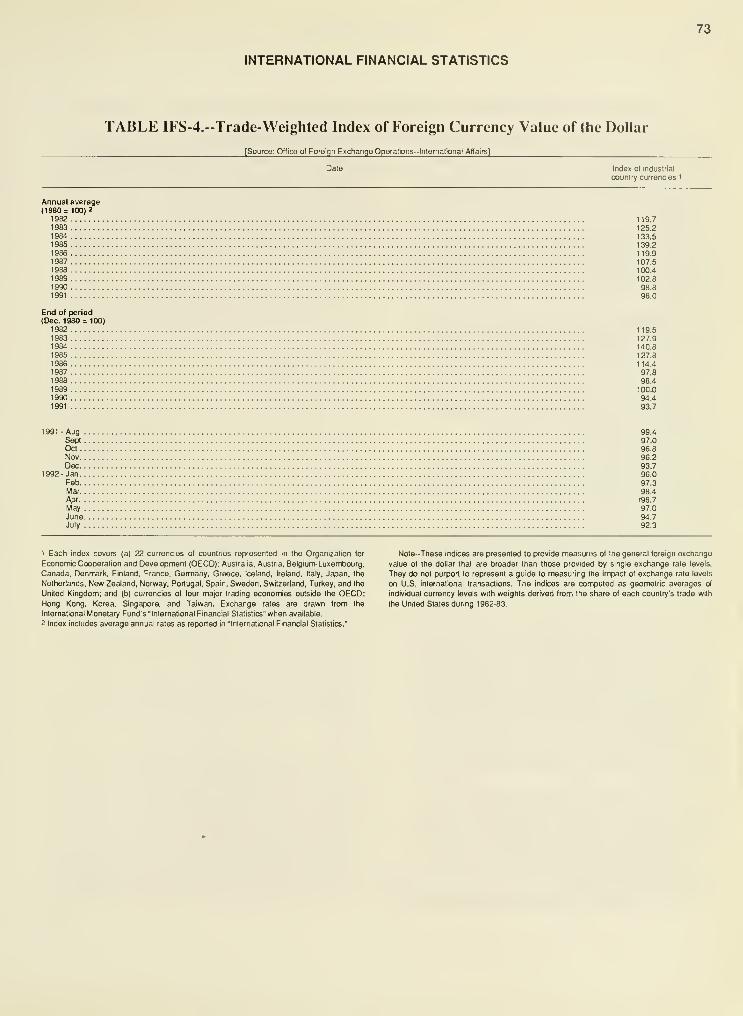
73
INTERNATIONAL FINANCIAL STATISTICS
TABLE IFS-4.--Trade-Weighted Index of Foreign Currency Value of the Dollar
[Source: Office of Foreign Exchange Operaljons-lnlernational Affairs]
Dafe Index ol industrial
country currencies i
Annual average(1980= 100)2
1982 119.71983 125.21984 133.51985 139.21986 119.91987 107.51988 100.41989 102.81990 98.81991 98.0
End of period(Dec. 1980 = 100)
1982 119.51983 127.91984 140.81985 127.81986 114.41987 97.81988 98.41989 100.01990 94.41991 93.7
1991 Aug 99.4Sept 97.0Oct 96.8Nov 96.2Dec 93.7
1992- Jan 96.0Feb 97.3Mar 98.4Apr r98.7
May 97.0June 94.7July 92.3
t Each index covers (a) 22 currencies ot countries represented in the Organization for Note-These indices are presented to provide measures of the general foreign exchange
Economic Cooperation and Development (OECD): Australia. Austria. Belgium-Luxembourg. value of the dollar that are broader than those provided by single exchange rate levels.
Canada. Denmark, Finland. France. Germany, Greece, Iceland, Ireland, Italy, Japan, the They do not purport to represent a guide to measuring the impact ol exchange rate levels
Netherlands, New Zealand, Norway, Portugal. Spain, Sweden, Switzerland, Turkey, and the on U.S. international transactions. The indices are computed as geometric averages of
United Kingdom; and (b) currencies ot four major trading economies outside the OECD: indrvkJual currency levels with weights derived from the share of each country's trade with
Hong Kong, Korea, Singapore, and Taiwan. Exchange rates are drawn from the the United Stales during 1 982-83.
International Monetary Fund's "International Financial Statistics" when available.
2 Index includes average annual rates as reponed in "International Financial Statistics."
74
INTRODUCTION: Capital Movements
Treasury collects Inromiatlon abcxit the transference of finan-
cial assets and other portfolio capital movements between the
United States and foreigners, and has since 1935. Commercialbanks and other depository institutions, bank holding companies,securities brokers and dealers, and nonbanking enterprises in the
United States file capital movement reports with cSstrict Federal Re-sen/e banks.
Forms arxj instructions are devek>ped with the cooperation of
other Government agencies and the Federal Resen/e System, andIn consultations with representatives of banks, securities firms, arx)
nonbanking enterprises. Copies of the reporting forms and instnic-
tions may be obtained from the Office of Data Management, Office
of the Assistant Secretary for Economic Policy, Department of the
Treasury, Washington, D.C., 20220, or from district Federal Re-serve blanks.
In general, information is reported opposite the country or geo-graphical area vttiere the foreigner is located, as shown on records
of reporting institutions. However, information may not always re-
flect the litimate ownership of assets. Fleporting institutions are not
required to go beyond addresses shown on their records, and so
may not be aware of the actual country of domkiile of the ultimate
beneficiary.
United States liabilities arising from the deposits of dollars with
foreign banks appear as liabilities to foreign banks, although the li-
ability of the foreign t>ank receiving the deposit may be to foreign of-
ficial institutions or to residents of another country.
Transactions with branches or agencies of foreign official Insti-
tutions, wlierever kx^ated, are reported opposite the country that
has sovereignty over the institutions. Transactions with interna-
tional and regional organizations are not reported opposite anycountry, but are accounted for In regional groupings of such organi-
zations. The only exception is information pertaining to the Bank for
International Settlements, which is reported opposite "Other
Europe."
Banks and other depository institutions, bank holding compa-nies, International Banking Facilities (IBFs), securities brokers anddealers, and nonbanking enterprises in the United States must file
reports. These enterprises include the branches, agencies, subsidi-
aries, and other affiliates in the United States of foreign tianking
and nonbanking firms. Those with liatiilities, claims, or securities
transactions below specified exemption levels are exempt from re-
porting.
Banks and other depository Institutions, and some brokers anddealers, file monthly reports covering \he\r dollar liat>ilities to, anddollar claims on, foreigners in a number of countries. Twflce a year,
June 30 and December 31 , they also report the same liabilities andclaims items to foreigners in countries not shown separately on the
monthly reports. Quarterly reports are filed for liabilities and claims
denominated in foreign currencies in relation to foreigners. The ex-
emption level applicable to Uiese banking reports is $15 million.
Banks and other depository institutions, securities brokers anddealers, and otiier enterprises report monthly their transactions
with foreigners in long-term securities. They must report securities
transactions with foreigners if their aggregate purchases or their ag-
gregate sales amount to at least $2 million during the coveredmonth.
Exporters, importers, industrial and commercial concerns, fi-
nandal institutions (other than banks, other depository institutions,
and brokers), and other nonbanking enterprises must file reports
quarterly if liabilities to, or claims on, unaffiliated foreigners amountto $10 million or more during the covered quarter.
Nonbanking enterprises also report each month their U.S. dol-
lar-denominated deposit and certificates of deposit claims of $10million or more on banks abroad.
The data in these tables do not cover all types of reported capi-
tal movements between tfie United States and other countries. The
principal exclusions are the intercompany capital transactions of
nonbanking business enterprises in the United States vi^th their
own branches and subsidiaries abroad (own foreign offices) or with
their foreign parent companies, and capital transactions of the U.S.
Government Consolidated data on all types of international capital
transactions are published by the Department of Commerce in its
regular reports on the United States balance of payments.
• Section I presents liabilities to foreigners reported by U.S.
banks and ottier depjository instibjtions, as well as brokers anddealers. Dollar liabilities are reported monthly; tiiose denominatedin foreign cunisncies are reported quarteriy. Respondents report
certain of Uieir own liabilities and all of their custody liabilities to for-
eigners.
• Section II presents claims on foreigners also reported byU.S. banks and oVrter depository instihjtions, brokers, and dealers.
Data on bank claims held for tt^eir own account are collected
montiily. Information on claims held for their domestic customers,
as well as foreign currency claims, is collected on a quarteriy basis
only. Maturity data are reported according to time remaining to ma-turity. Reporting also covers certain items held by brokers and deal-
ers in the United States.
• In Section III are supplementary statistics on U.S. banks' li-
abilities to, and claims on, foreigners. Supplementary data on bankk>ans and credits to nonbank foreigners combine selected informa-
tion from the TIC reports with data from the montiily Federal Re-serve 2502 reports submitted for major foreign branches of U.S.
banks. Otiier supplementary data on U.S. bank dollar liabilities to,
and dollar claims on, countries not regulariy reported separately ap-
pear in the June and December issues of the Treasury Bulletin.
• Section IV shows the liabilities to, and claims on, unaffili-
ated foreigners by exporters, importers, industrial and commercialconcems, financial institutions (otiier than banks, oUier depository
institutions, and brokers), and otiier nonbanking enterprises in the
United States. Information does not include accounts of nonbank-ing enterprises in the United States with their own branches andsubsidiaries abroad or with tiieir foreign parent companies. Theseare reported by business enterprises to the Department of Com-merce on its direct investinent forms. Data exclude claims on for-
eigners held through banks in tiie United States.
• Section V contains information on transactions in all types
of long-term domestic and foreign securities with foreigners re-
ported by banks, brokers, and other entities in the United States.
The data cover transactions executed in the United States for the
accounts of foreigners, and transactions executed abroad for the
accounts of reporting instihjtions and ttieir domestic customers.
This includes transactions in newly issued securities as well astransactions in, and redemptions of, outstanding issues. Also,
some transactions classified as direct investments in the balance
of payments accounts may be included. However, the data do not
include nonmari<etable Treasury bonds and notes shown in table
IFS-3.
In the case of outstarxiing securities, the geographical break-
down of the transactions data does not necessarily reflect the ulti-
mate owners of or the original issuers of the securities. This is
because the patii of a security is not tracked prior to its being pur-
chased from, or after it is sold to, a foreigner in a TIC reportable
transaction. That is, before It enters and after it departs tiie report-
ing system, ownership of a security may be transferred betweenforeigners of different countries. Such transfers may occur anynumber of times and are concealed among the net figures for U.S.
transactions opposite individual countries. Hence, U^e geographical
breakdown shows only the country of domicile of the foreign buy-
ers and sellers of securities in a particular round of transactions.
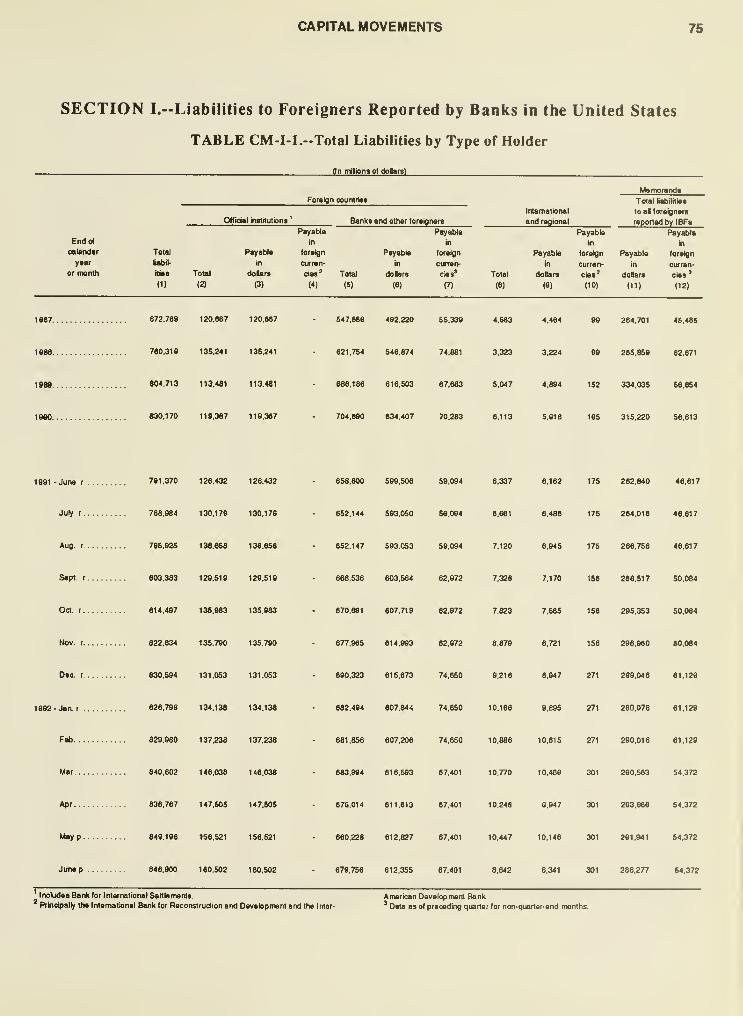
CAPITAL MOVEMENTS 75
SECTION L-Liabilities to Foreigners Reported by Banks in the United States
TABLE CM-I-l."Total Liabilities by Type of Holder
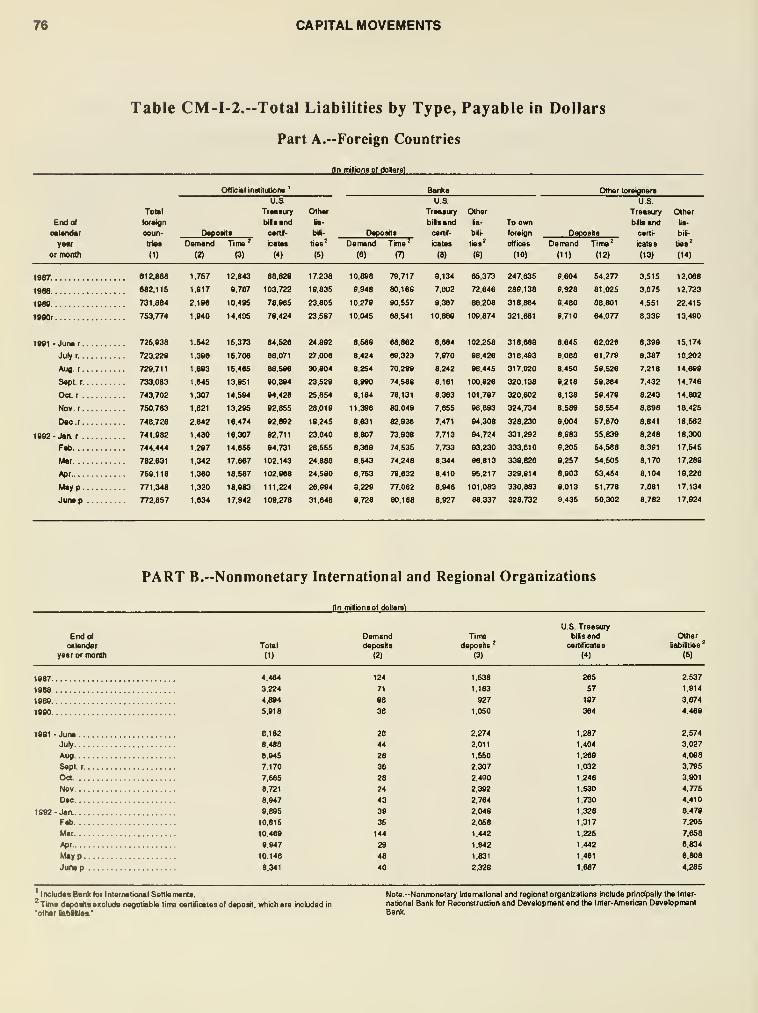
76 CAPITAL MOVEMENTS
Table CM-I-2.--TotaI Liabilities by Type, Payable in Dollars
Part A.—Foreign Countries
(In millions ol dolarsl
CAPITAL MOVEMENTS 77
TABLE CM-I-3.--Total Liabilities by Country
(Position at end of period in miHions o< dollare)
Calendar year 1992
Countiy
Europe:
Austria
BeleiunvLuxembouiD
Bulgaria
Czeohoelovakia
Denmaric
Finland
France
Qarman Democratic Republic
Qarmany
Qreece
Hungary
Ireland
Italy
Netherland*
Norway
Poland
Portugal
Romania.
Spain
Sweden
Switzertand
Turkey
United Kingdom
USSRYugoeiavia
Other Europe
Total Europe
Canada
Latin America and Caribt)ean:
Argentina
Bahama*
Bermuda
Brazil
British West Indies
Chile
Colombia
Cuba
Ecuador
Guatemala
Jamaica
Mexico
Netherlands AntJBes
Par^ma
Peru
Trinidad and Tobago
Urugusy
Venezuela
Other Latin America
and Cerribbean
Total Latin America and
Carribbean
See tootnotes at end ol table.
1868
78 CAPITAL MOVEMENTS
Table CM-I-3.--Total Liabilities by Country, con.
fPosition at end at period in milions erf ddlars)
Calendar year 1902
Country ISSO 1990 r 1991 r Feb. Mar. Apr
Asia:
Chna:
Mainland 1,796 2.429 2.626 2.607 2.726 2.802
Taiwm 19.626 11.327 11.784 10,878 10.884 10.762
Hong Kong 14,603 15.049 16.733 17.335 16.794 18.320
India 781 1.237 2.421 2,259 2,030 1,794
Indoiwsia 1,286 1,246 1,465 1,278 1,519 1,112
Israel 1,247 2,771 2,024 2,146 2,540 3,795
Japan 111,724 83,760 71,836 69.566 66,917 64,726
Korea 3,226 2,299 2,538 2,757 2,867 3,015
Lebanon 488 402 412 309 361 350
Malaysia 1,748 1,445 1,341 1,450 1,303 1,271
Pakistan 1,168 746 984 836 1,007 966
Philippinae 1,776 1,691 2,456 2,469 2,651 2,279
Singapore 13,041 13,578 11,913 10.585 10.244 10.992
Syria 120 162 177 182 174 180
Thailand 2,066 1,445 2,266 3,238 3,332 3,149
oa-oxporting countries' 13,588 16,913 15.889 18.547 19.554 18,857
Other Asia 1^286 M35 1^605 I^KO 1^607 1.671
Total Asia 189.504 157.823 148.469 148.062 146.512 146.043
Alrioa:
Egypt 688 1.451 1,621 1,632 1,338 1,611
Ghana 120 128 145 149 130 115
Liberia 518 482 455 448 423 379
Morocco 78 105 80 83 91 89
South Africa 217 228 228 199 191 188
Zaire 92 S3 31 30 35 27
Oil-exporting countries' 1,159 1,125 1,095 1.227 1.443 1.292
aher Africa ]fi2* yUi 1;2M 1J8S 1J67 1.195
TotalAifioa 3.896 4,683 4,856 4.953 4.918 4.896
Other oouitriee:
Australia 3,908 3,868 4.856 3,457 3,584 4,059
Al other 707 641 1,271 1,356 1,215 990
Ta4al other countriaa
Total foreign countriee
Intemallonal and regional:
lntem«lonal 4,072 4,612 6,643 8,464 8,271 7,407
European regional 151 61 296 281 93 88
Latin American regional 7Ca 1,122 1,260 1,579 1,878 1,881
Asian regional 48 132 427 219 346 602
African regional 62 282 582 323 182 270
Middle East regional 10 5 - _;
_Total International and lagional. . . 5,047 6,113 9,218 10,886 10.770 10,248
Grand total 804,713 830.170 830.594 829.960 840.602 836,767
* Includes Bahrain, Iran, Iraq, Ku««it, Oman, Qatar, Saudi Arabia , and the United Arab ' Includes Algeria, Gabon, Libya, and Nigeria.
Emirates (Tnicial Stalee).
Mayp Junep
2,414
CAPITAL MOVEMENTS 79
Table CM-I-4.--Total Liabilities by Type and Country, June 30, 1992, Preliminary
{Position in rriaions of doUars)
UabiWies oavabJe in ttoltaf^
Countiy
80 CAPITAL MOVEMENTS
TABLE CM-I-4."Total Liabilities by Type and Country, June 30, 1992, Preliminary, con.
(Poailion in miPions ol dolarel
Total llnblltlM Uabllti*8 payabto in dolars
To foroign official
inatitutiona andunaffiliatad foraign banka
Counuy ToMI
(1)
Payabia
in
doBara
(2)
Payabia
In
foraign
curia n-
ciaa'
(3)
Totab
Banka'
own lia-
b»i«a
(*)
Custodyliabrl-
itiaa
(5)
Deposits
Damand Tima
(8) (7)
Shon-tarmU STraasury
obiga-
tiona'
(8)
Othar
tabll-
tiaa
(9)
-Uabil-
itiesto
banks'
ownforaign
officaa
(10)
UabHiliaa to
aB ottiar foreigners randum
Deposits
DenBnd Tima
(11) (12)
Short-
term U.S.
Treasury
- obliga-
tions
(13)
Negoti-
Otliar able CDslia- hakl for
bH- all for-
itiea aignara
(14)
Aaia:
China:
Mainland ^473 2.422 SI 2.326 86 88 742 57 1.077 238 14 187 19
Taiwan 10.259 9.977 282 5.675 4.302 267 2.907 3.821 1.592 280 160 906 4 40
Hong Kong 19.107 17,035 2.072 13.356 3.679 328 1.082 3.126 998 8.720 409 1.961 73 338
India 1.715 1.713 2 1.227 486 168 10 299 385 765 22 48 - 16
Indonesia 1.390 1.387 3 766 621 171 52 554 217 152 SO 178 - 13
lamal 2.979 2.975 4 1.040 1.935 80 176 1.821 250 180 42 373 8 45
Japan 81.608 44.219 17.389 34.138 10.081 653 3.620 6.770 3.886 25.713 450 468 514 2.135
Korea 2.849 2.809 40 1.138 1,671 140 240 1.451 390 412 24 102 4 46
Lebanon 413 413 - 386 27 52 38 15 153 12 46 82 8 7
Malayala 1.241 1,241 663 578 112 103 491 99 135 14 252 2 33
Pakistan 1.169 1.168 1 652 516 98 136 493 237 149 11 41 - 3
PhH)pk)aa 1.M6 1.792 13 1,250 542 178 114 486 227 139 75 543 1 19
Shgapota 12.327 11.666 662 9.198 2,467 487 2.361 2.221 2,983 3,172 83 185 65 88
Syria '61 161 - 161 - 63 27 - 31 - 8 32
Thailand ^^^e 4.584 2 480 4.084 137 73 4,047 144 117 15 51
Other Aaia 21.217 20,871 246 16,889 4,102 424 2,345 3,058 3,582 10,124 195 685 152 406
Total Aaia 145.299 124,632 20,767 89,335 35.197 3.446 14.026 28,720 16,251 50,306 1.627 6.105 831 3.218
Africa:
Egypt 2.540 2,539 1 1,045 1,494 89 219 1,476 440 216 24 65 - 10
Ghana 148 148 - 138 9 20 52 9 36 14 3 13 1
Lbaria 458 448 10 316 132 1 - - 1 55 245 88 48
Morocco 88 87 1 86 1 16 1 - 45 10 5 8 - 1
South Africa 245 246 - 225 20 76 - 15 121 - 10 21 1 1
Zaire 28 29 - 19 10 8 - 10 - 2 2 2 - 5
Other Africa 2.374 2.354 20 2,051 303 471 330 104 846 174 138 155 1 34_
Total Africa 5.682 5.850 32 3.881 1.869 681 602 1.614 1.588 416 238 510 100 100
Other ccuntriea
Australia 3,676 3.192 484 1.352 1.840 78 32 1,626 220 413 87 49 48 628
Another 1,286 1.204 »g S8S 619 13 14 288 540 143 67 136 3
Total other
Total foreign
oountriea
International and regional:
International Sggo gg22 208 5.601 21 27 2,223 14 3 358Europaan regional ...
. 75 75 - 16 58 1 - 58 15
Latin American
regional 2.183 2,100 83 228 1,872 7 103 1,345 645 - - - - -
Asian regional 327 327 - 56 271 3 - 268 55African regional 217 217 - 217 - 2 3 - 212
Mkldia Eastern
regional ; ; ; ;^- - - - - - -
. .
Total international
and regional 8,642 8,341 301 6.118 2,223 40 2,329 1,687 4,285 - ; ;-
-
Grand total 848,900 781,198 67,702 681.867 199,341 11,402 100,459 119,892 134,270 328.732 8,436 60,302 8,782 1 7.824
(15)
12
340
168
4
2
15
383
64
4
46
1
18
86
365
17
16
1
74
4,972
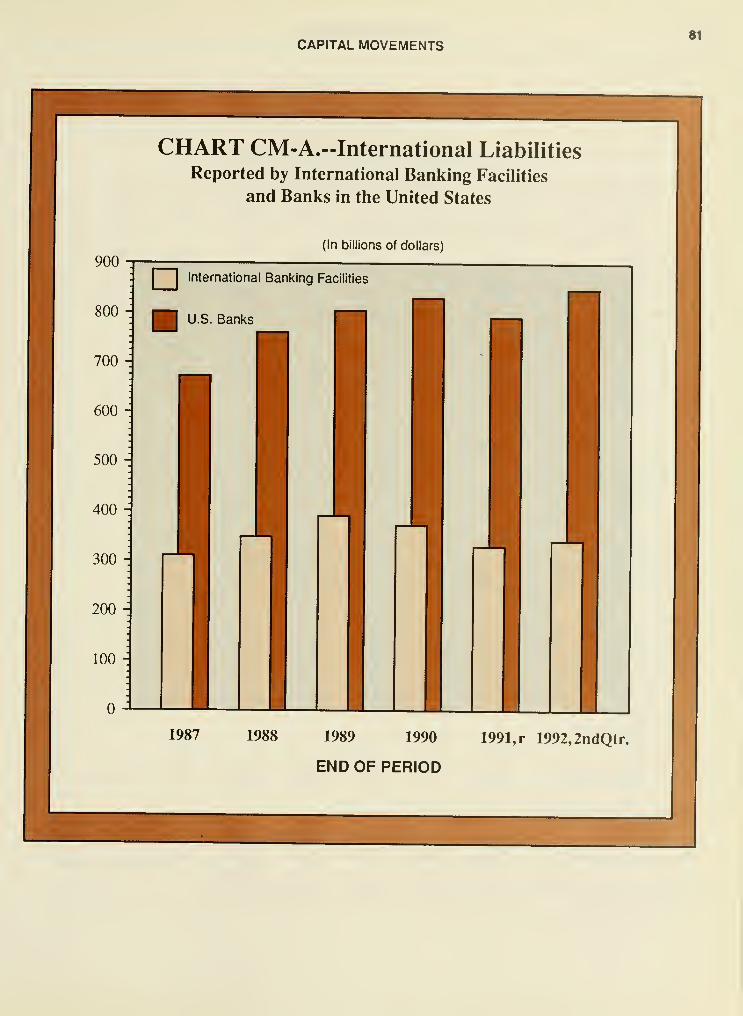
CAPITAL MOVEMENTS81
CHART CM-A.--International Liabilities
Reported by International Banking Facilities
and Banks in the United States
(In billions of dollars)
I I
International Banking Facilities
^M U.S. Banks
100
n u
1987 1988 1989 1990 1991, r 1992,2ndQtr.
END OF PERIOD
1
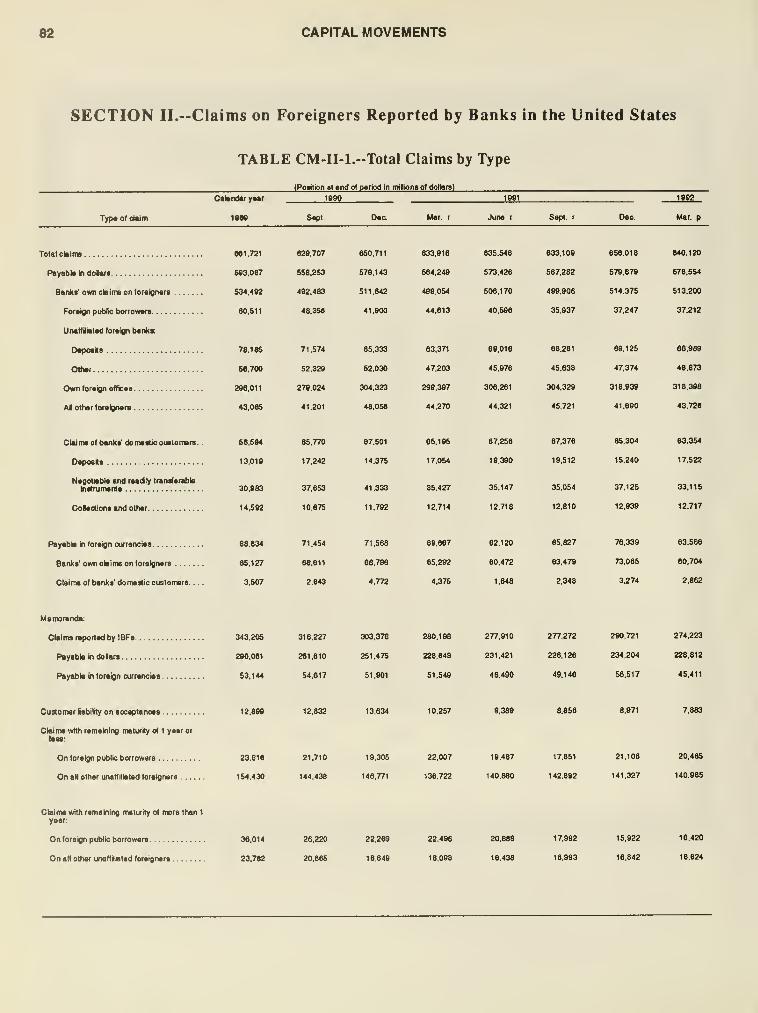
82 CAPITAL MOVEMENTS
SECTION IL—Claims on Foreigners Reported by Banks in the United States
TABLE CM-II-l.-Total Claims by Type
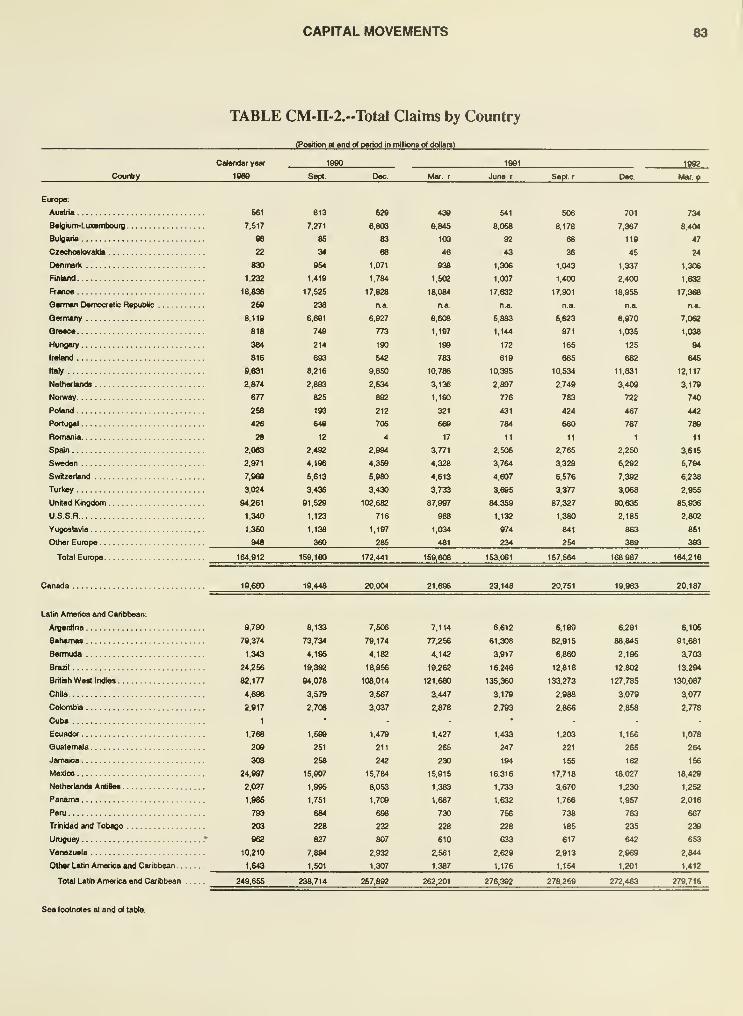
CAPITAL MOVEMENTS 83
TABLE CM-n-2.-Total Claims by Country
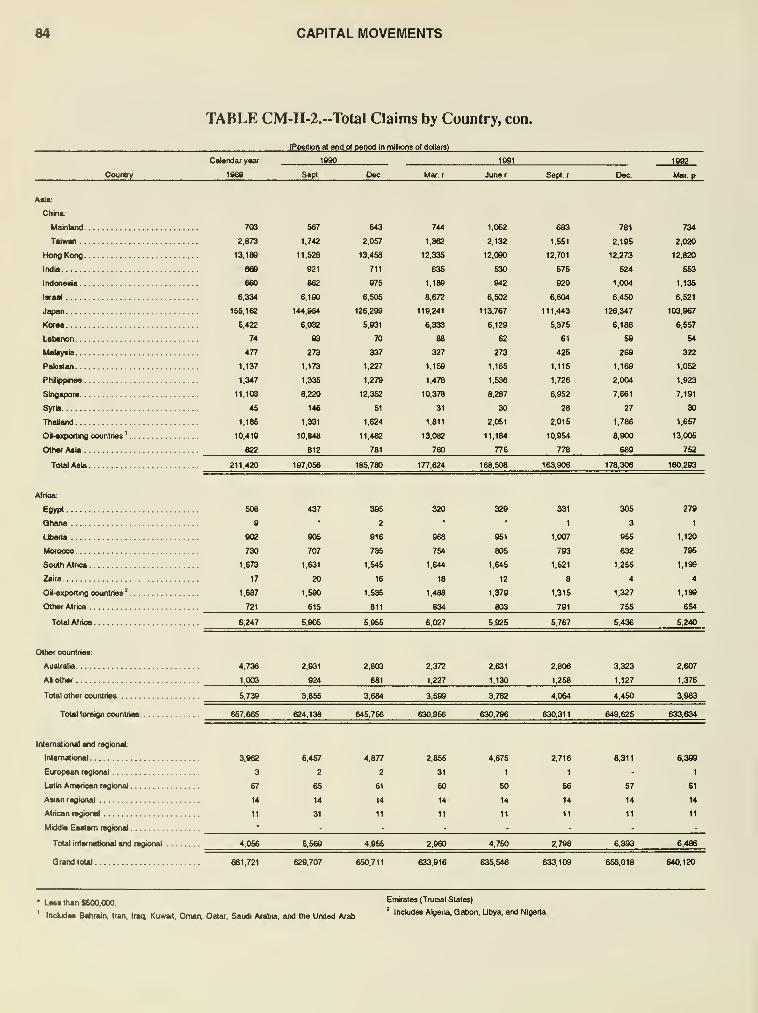
84 CAPITAL MOVEMENTS
TABLE CM-II-2.--Total Claims by Country, con.
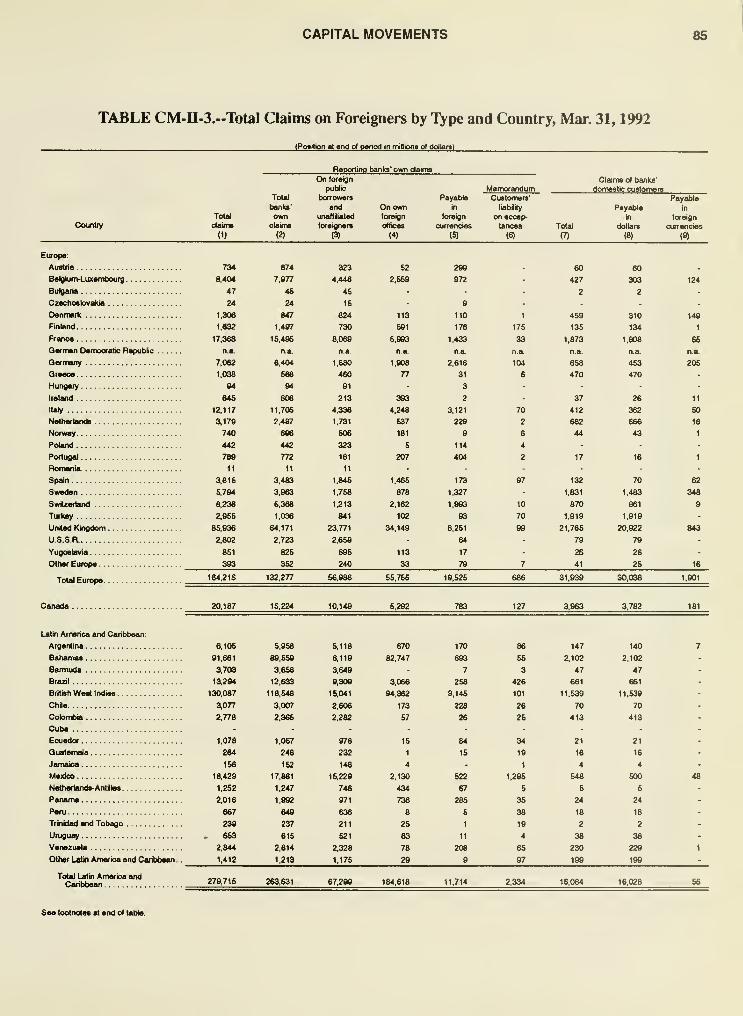
CAPITAL MOVEMENTS 85
TABLE CM-n-3.-.TbtaI Claims on Foreigners by Type and Country, Mar. 31, 1992
(Potitton «< end of penod in miDiona of doJlara)
Reporting banks' own daims
Countiy
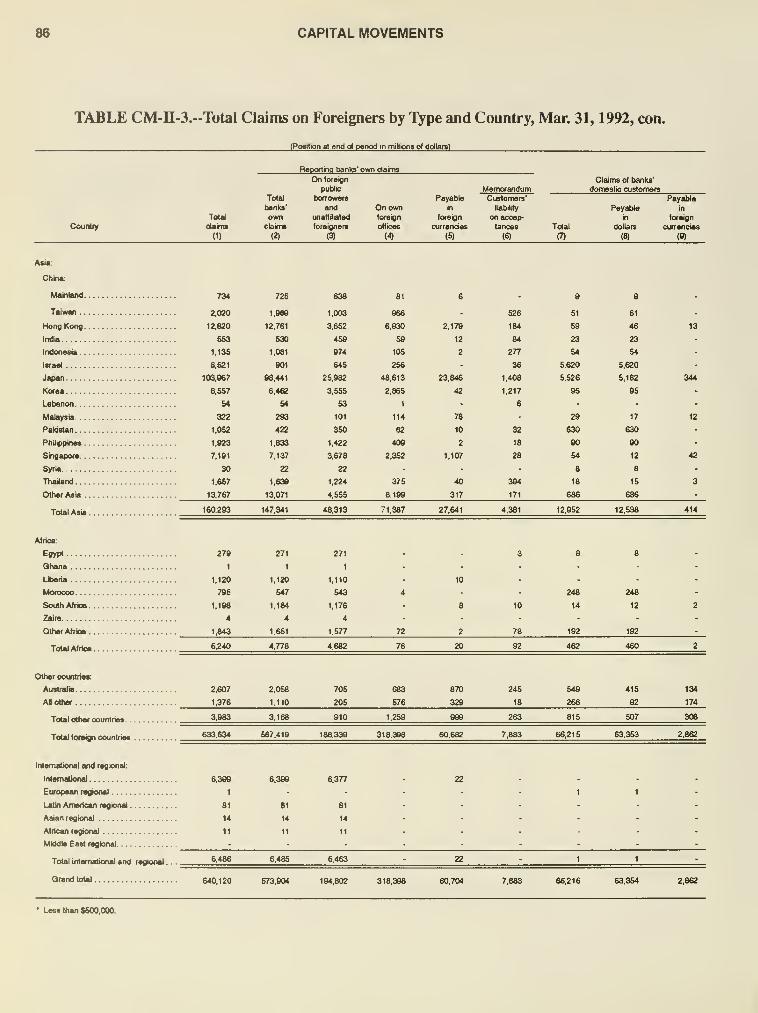
86 CAPITAL MOVEMENTS
TABLE CM-n-3.--Total Claims on Foreigners by Type and Country, Mar. 31, 1992, con.
(Position at end dl period in miUions of dojlare)
Counby
Reporting banks' own ciaims
ToUdaims
(1)
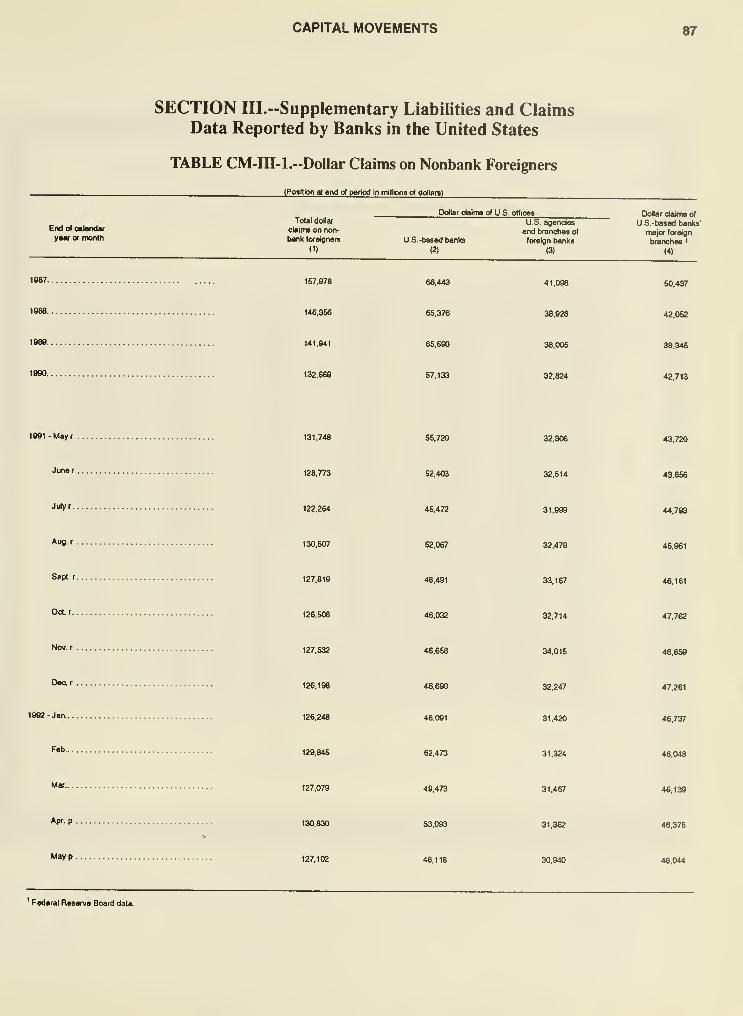
CAPITAL MOVEMENTS 87
SECTION m.-Supplementary Liabilities and ClaimsData Reported by Banks in the United States
TABLE CM-IH-l.-Dollar Claims on Nonbank Foreigners
(Po«ition at end ol period in mHlone of dollare)
End o< calendar
year or month
1887
1868
1888.
1880
1891 -Mayr
June r
Julyr
Aug. r
Sept.r
Oct r
tiM.t
Dear
1892- Jaa
Feb
Mar
Apr. p
Mayp
' Federal Reserve Board data
Total dolar
claimB on norv
bank toretgnerv
(1)
Dollar daima ol US oHices
157,878
146,356
141,841
132,668
131,748
128,773
122,264
130,507
127,819
126,508
127,532
126,198
126,248
129,845
127,078
130,830
127,102
US.-based banks
(2)
U.S. agendasand branches of
foreign t>anks
(3)
66,443
65.376
65,690
57,133
55,720
52,403
45,472
52,067
48.491
46,032
46,658
46,690
46,091
62,473
49,473
41,008
38.928
38,005
32,824
32,306
32,514
31,999
32,479
33,167
32,714
34,015
32,247
31,420
31,324
31,467
31,362
30,940
Dolar daima of
US -based banks'
(Tiajor foreign
branches t
(4)
60,437
42,052
38,345
42,713
43,720
43,856
44.783
45,861
46.161
47.762
46.858
47.261
46,737
46,048
48.138
48,375
48,044
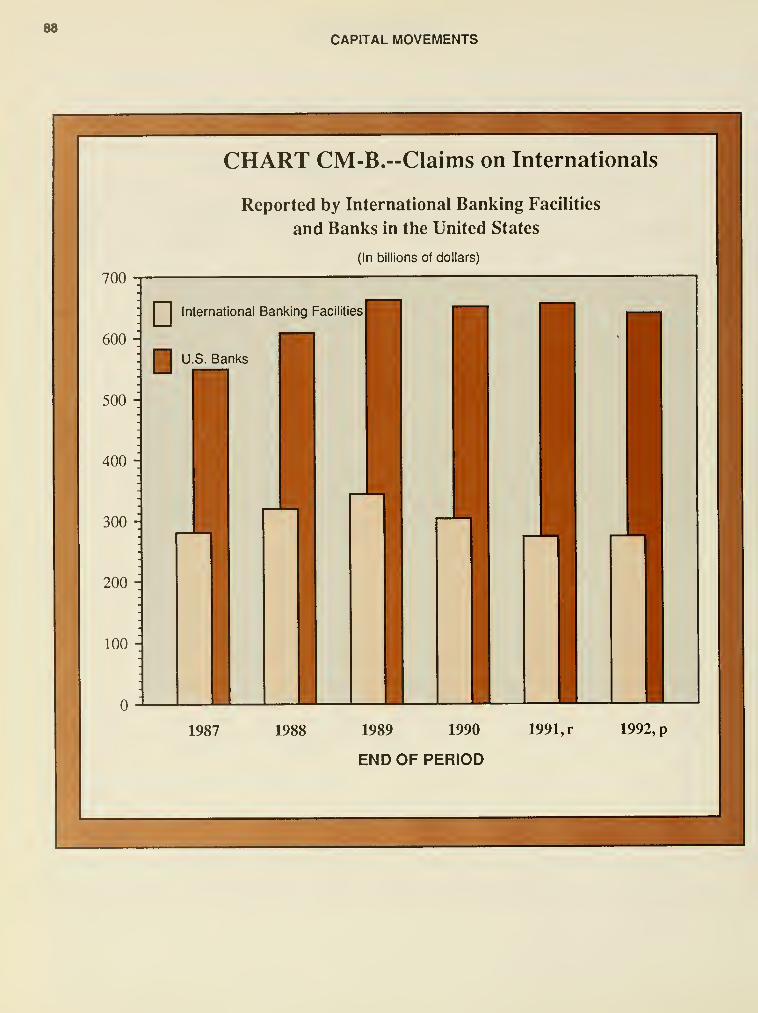
88CAPITAL MOVEMENTS
CHART CM-B.--Claims on Internationals
Reported by International Banking Facilities
and Banks in the United States
(In billions of dollars)
700
600 -
500 -
400 -
300 -
200 -
100 -
I I
International Banking Facilities
H U.S. Banks
1987 1988 1989 1990
END OF PERIOD
1991, r 1992, p
CAPITAL MOVEMENTS 89
SECTION IV.-Liabilities to, and Claims on, Foreigners
Reported by Nonbanking Business Enterprises
in the United States
TABLE CM-IV-l.--Total LiabiUties and Claims by Type
(Poaition at end o( pwiod in miliona ot ddlara)
Calendar ye
Type d Uabiiy or daim
Total llabilltle*
Payable in ddars
Rnanoial
Commercial:
Trade payaUee
Advar>ce receipts and other . .
.
Payable in foreign oirrancies
Financial
Commercial:
Trade payables
AdvarH:e receipts and other . .
Total dalma
Payable in dolara
Financial:
Deposits
Other
Commercial:
Trade receivables
Advance payments and other
.
Payable in foreign oun-enctes
Financial:
Deposits
Other
Commercial:
Trede reoelvabiss
Advance payments and other .
Sept. r Dec K4ar p
32,852 36,764
33,806
31,426
2,381
1,068
777
484
12
33,173
30,773
2,400
see
764
44,988 41.978 40,652 42,148 41,514
27,336
90 CAPITAL MOVEMENTS
TABLE CM-IV-2.--TotaI Liabilities by Country
CAPITAL MOVEMENTS 91
TABLE CM-IV-2.--Total LiabiUties by Country, con.
Country
(Posrton al end Of period in millions of doilarel
1987
Calendar year
1988 Mar. r SepI r Dec
1962
Mar p
Asia:
China:
Mainland
Taiwan
Hong Kong
India
Indonesia
Israel
Japan
Korea
Lebanon
Malaysia
Pakistan
Philippinee
Singapore
Syria
Thajand
Oil-exporting oountries'
Other Asia
Total Asia
Africa:
Egypt
Ghana
Liberia
Morocco
South Africa
Zaire
on-exporting oountriee'
Other Africa
Total Africa
Other oountriee:
Australia
AH other
TotaJ ottier oountries
Total foreign oountries
International and regional:
International
European regional
Latin American regiortal
Asian regional
African regional
Middle Eastem regional
Total International and regional
Grand total
204
92 CAPITAL MOVEMENTS
TABLE CM-IV-3.--TotaI Liabilities by Type and Country, Mar. 31, 1991, Preliminary
(Position a< end cH period in miBions c^ dollare)
Counlry
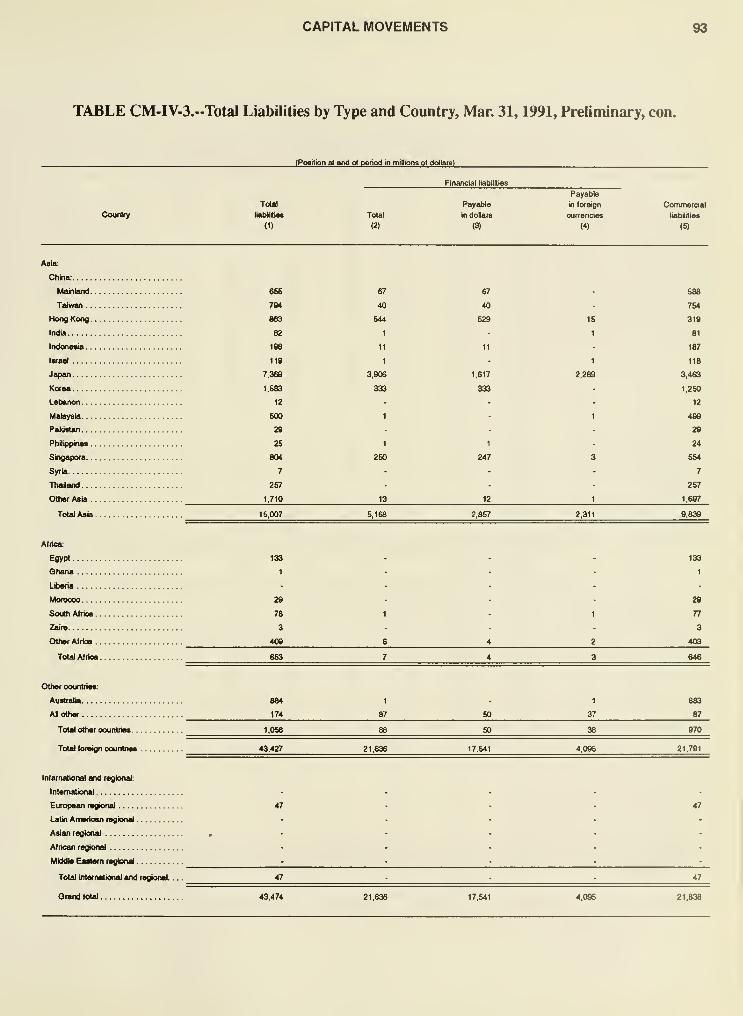
CAPITAL MOVEMENTS 93
TABLE CM-IV-3.--TotaI Liabilities by Type and Country, Mar. 31, 1991, Preliminary, con.
(Position at end ot period in millions of doJiare)
Country
Total
laMtiM
<1)
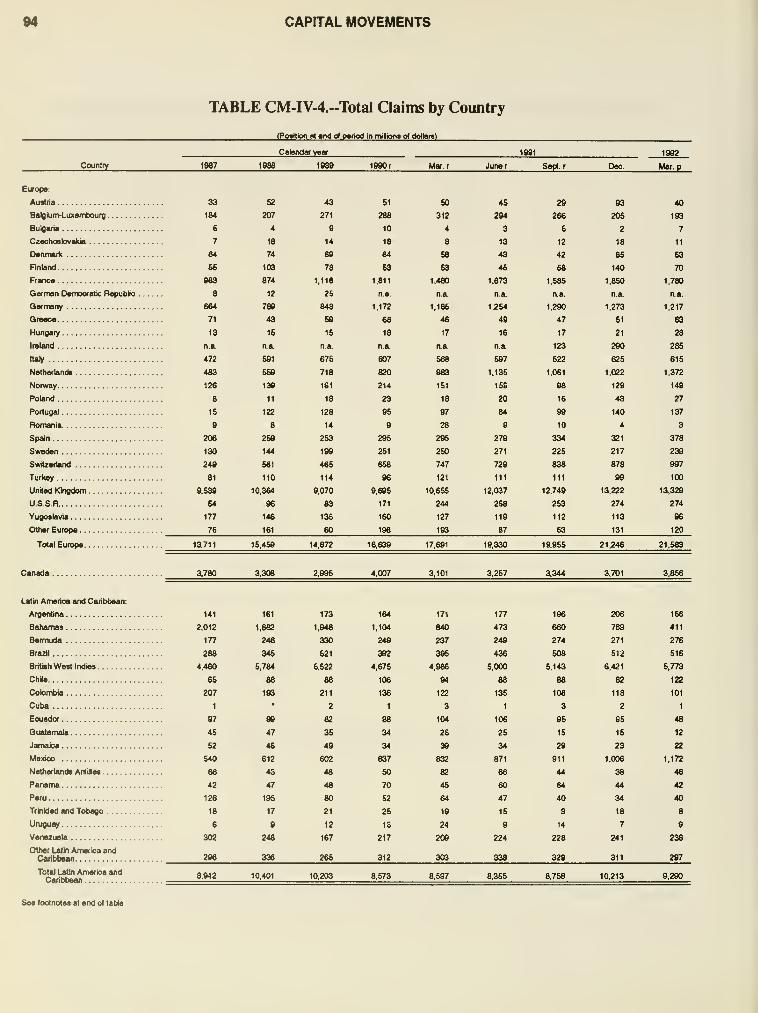
94 CAPITAL MOVEMENTS
TABLE CM-IV-4.-'IbtaI Claims by Country
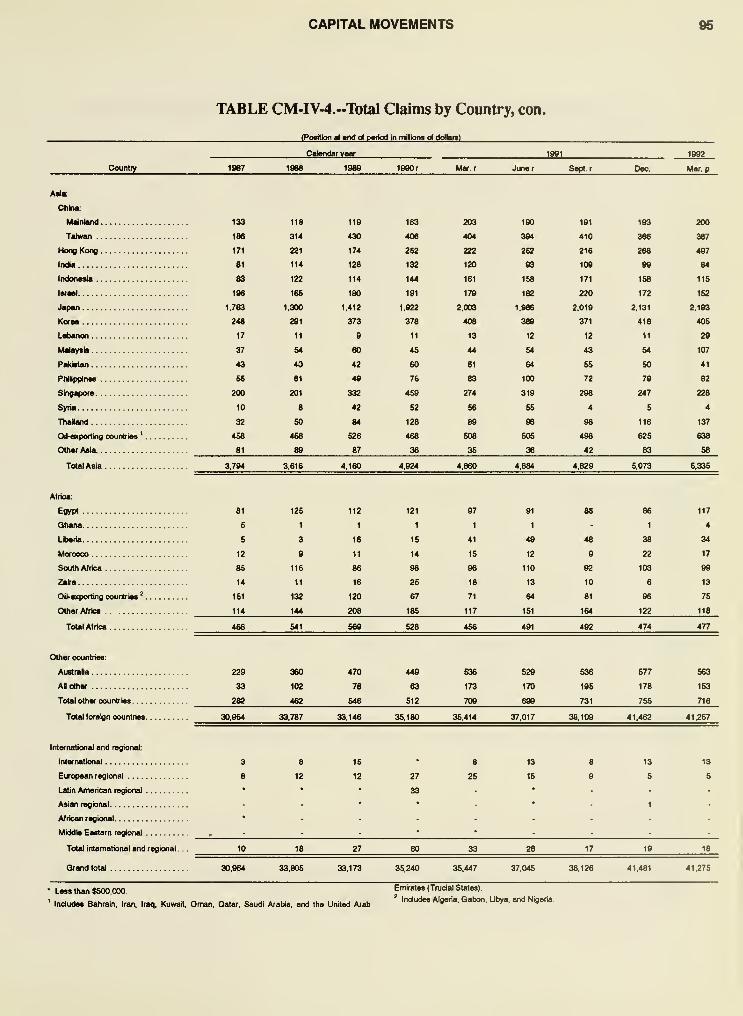
CAPITAL MOVEMENTS
TABLE CM-IV-4.-1btal Claims by Country, con.
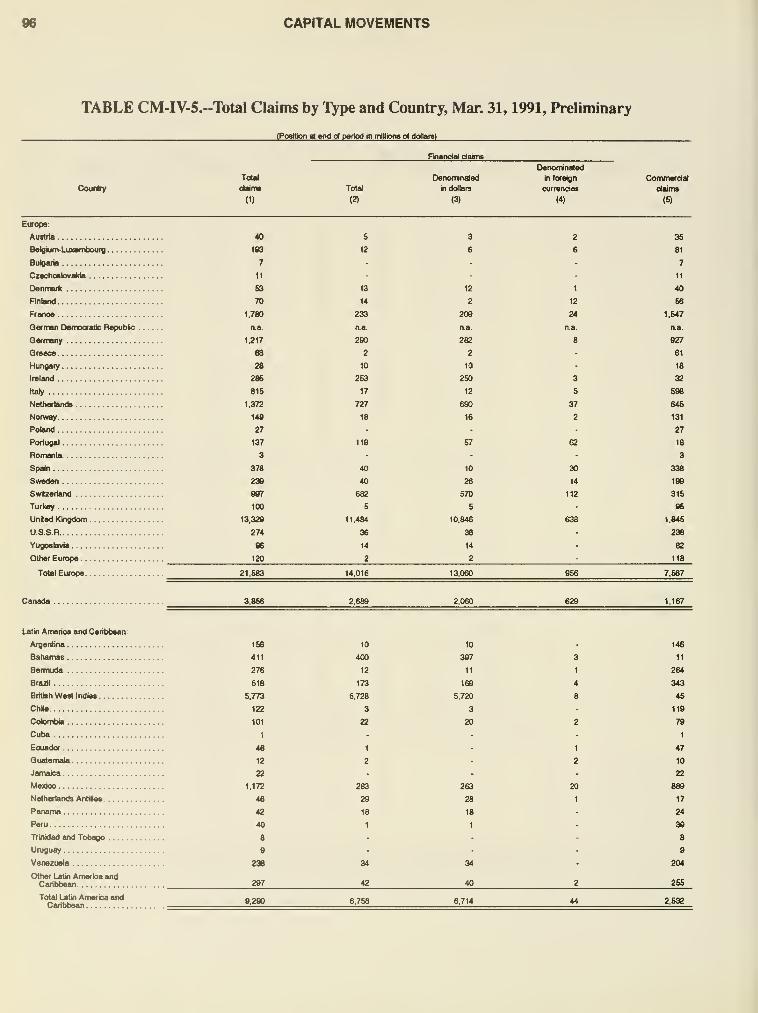
96 CAPITAL MOVEMENTS
TABLE CM-IV-5.--Total Claims by T^pe and Country, Man 31, 1991, Preliminary
(Position a end al pettod in mUtoro o< dollare)
Coufiry
Total
ol«i(ra
(1)
Total
(2)
FInandal dagns
Denominated
In dollars
(3)
Denonrinaled
in loreign
currencias
(4)
Commercial
daiira
Eivope:
Auatiia
Belgium-LuxembourB
Bulgaiia
CzeohoalovaMa
Denmenc
nnland
Franoe
Qerman Democratic Repubic
Qermany
Greece
Hungary
Ireland
Italy
Nettierlanda
Noraoy
Potand
Poilugal
Romania
Spain
oWOOOfl
Swtzertand
Turkey
United Kingdom
USSRYugoslavia
Other Europe
Total Europe
Canada
l^tin America and Cariblsean:
Argentina
Bahamas
Bermuda
Braal
British West Indies
Chle
Colombia
Cuba
Ecuador
Quatemala
Jamaica
Mexico
Netherlands Anllles
Panama
Peru
Trinidad and Tobago
Uruguay
Venezuela
Other Latin Amerioa andCaribbean
Total Latin America andCaribbean
40
193
7
11
88
7D
1,780
aa.
1,217
63
28
286
615
1,372
148
27
137
3
378
238
887
100
13,328
274
1S6
411
276
B16
5,773
122
101
1
48
12
22
1,172
46
42
40
8
8
238
287
5
12
13
14
233
aa.
280
2
10
253
17
727
18
119
40
40
682
5
11,484
10
400
12
173
5,728
3
22
1
2
283
29
18
1
34
42
12
2
2C8
aa.
282
2
10
250
12
680
16
57
10
26
57D
5
10,846
10
397
11
169
5,720
3
20
263
28
18
1
1
12
24
aa
5
37
2
62
30
14
112
20
1
35
81
7
11
40
S6
1,547
aa.
927
61
18
32
588
645
131
27
18
3
338
186
315
96
1,845
236
86
120
CAPITAL MOVEMENTS 97
TABLE CM-IV-5.--Total Claims by Type and Country, Mar. 31, 1992, Preliminary, con.
County
Alia:
China:
Mainland
Taiwan
Hong Kong
India
Indonesia
Inaal
Japan
Korea
Lebanon
Malaysia
Paldatan
Phlippinea
Singapore
Syria
ThaBand
Other Aaia
Total Atia
Africa:
Egypt
Qhana
LiMria
Morocco
South Africa
Zaire
Other Africa
Total Africa
Other countriee:
Australia
Al other
Total other countries
Total foreign countries
Intemdional and regional:
International
European regional
Latin American regional
Asian regional
African regional
Middle Eastern regional
Total Intarnatiorxl and regional.
Grand total
(Position at end of period in millions of dollars)
Total
claims
(1)
200
387
487
84
lis
152
2,183
406
28
107
41
62
228
4
137
69«
B,33S
117
4
34
17
88
13
193
477
153
716
41,257
13
5
Total
(2)
42
130
287
11
12
1
423
8
48
e
4
15
6
5
i.ooe
24
20
282
2
264
24,816
13
13
Finanaal claims
Denominated
in doitars
(3)
42
120
284
12
1
48
1
2
14
3
3_
632
24
20
10
eo
242
2
244
22,970
13
13
Oenominaled
in foreign
currencies
(4)
10
3
11
40
1,846
Commercial
dalms
(5)
156
267
200
73
103
151
1,770
396
29
58
35
66
213
4
132
4,326
111
4
10
17
79
13
183
261
151
432
16,441
41,275 24,829 22,963 1,846 16,446
98CAPITAL MOVEMENTS
CHART CM-C.--Net Purchases of Long-Term
Domestic Securities By Selected Countries
(In billions of dollars)
Canada
idermany
Japan
Switzerland
United Kingdom
I
I
I
1988 1989 1990
END OF PERIOD
1991, r 1992,2ndQtr.
CAPITAL MOVEMENTS
SECTION V.-Transactions in Long-Term Securities by Foreigners Reported by
xARiirr^*^,. . w.^^"'^s and Brokers in the United States
1ABLE LM-V.l...Foreign Purchases and Sales of Long-Term Domestic Securities by Type
tl" "»li°"» "I *"'»"»;
n.fl.iiv, lia„r« indir-at. n«. s.lee by (of„ton«ni o, r,^ c^.^ p, c«,ltol from th. I m,^ o.^^,
Martetable Treasury bonds and nolw U S Qait corDorniio™ r- ^ ^ ^Net loreian Durehn«
u o. uovi corporaUom Corpofale and other securiMesiMeiioreign purchases and (ederaly sponsoredForeign countries .^„,.i^ „ i
~oF^ ^^ntema- Gross n^, T^ RES ^ ^2^2
"r ,r r r. 'r-,'^'°" '-^^ '-- °'- -^ -- -- -- •-- ^ross
1^::::::::::;:::::: ":^ ^^ 11^. ,Z 2S ^'gll'g?^ ,IZ ^"^^ ^'^ "'g^ "'^ '^^'^ •^°°° ^«-.^«^ i«3.,bs1990 17 918 23 2S8 -iWl iM ,oTo'T., 7^'™ ' '^^ ^'^^^ ^^'296 68,899 61,602 9,941 214 071 204 129
---. ;s iS s ,i issS ;i S si ;S E 55 -^iilS iil
'"'H:::::::;:: 3 "1 ;S S SS IE i S s ? - s ;:« i^s ;sr,': *:s S ^S -Z iS ii '^1^ F •" S •:- •:" '- !*:- »S
tiiiiliiliiiiilii
TABLE CM-V.2.-Foreign Purchases and Sales of Long-Term Foreign Securities by Type
(In millions ol dotlan., neflatK/e tiflures Indcale net saiee by torewners or a net outllow ot caoM from the United Slates>
Calendar yawor month
Net foreign
purchases
of foreign
securities
(1)
1988.
1888
1980.
1991 r
1892-Jaa-Junep.
1991-Junar
Julyr
Aug. r
Sept r
Oot r.
Nov.r
Deo. r
1992- Jan r
Feb
Mar
Apr.
May p
Junep
-9,383
-18.551
-31,171
-47,286
-18.068
-5,695
-3,987
-5,736
-3,268
-7.12s
•1,232
-3.441
-3,723
-1.988
-3,616
-,021
3,668
-1,261
foreign
purchases
(2)
-7,434
-5,488
•21,948
-15,377
-6,688
-1,969
-779
-2,183
-1,062
-4,720
801
-1,686
-1,180
286
-667
-1,429
-2.646
-1,162
Foreign bonds
Gross
foreign
purchases
0)
218,621
234,775
315,108
325,133
202,654
18,917
22,052
22,179
23,663
33,258
30,085
26,296
35,479
32,845
32,004
X,294
32.928
39,104
Gross
foreign
sales
(4)
226,955
240,263
337,067
340,510
209,342
21,886
22,631
24,362
24,615
37,978
29.284
27,891
36,658
32,650
32,561
31,723
35,674
40,266
Net
foreign
purchases
(5)
-1,959
-13,062
-9,222
-31,909
-11,380
-3,626
-3,208
-3,653
-2,196
-2.406
-2,083
-1.846
-2,643
-2.284
-2,968
-2,562
-813
-88
Foreign stocks
Gross
foreign
purchases
(6)
76,366
109,850
122.641
120,698
74,385
10,094
10,276
9,685
10,015
11,424
13,217
11,027
12,467
10,617
12,772
10,986
13,840
13,713
Grv»s
foreign
sales
(7)
77,315
122,912
131,863
152,507
86,776
13,721
13,484
13,238
12,211
13,829
16,260
12,873
16,010
12,901
16,731
13,578
14,753
13,802
100 CAPITAL MOVEMENTS
TABLE CM-V-3.~Net Foreign Transactions in Long-Term Domestic Securities
by Type and Country
(In millions ot dollare; neqalrve tiqufes tndicale net sales by loreiqnerB or a net outflow ol caprtai from the United States)
Maricetabie Treasuiy
bonjs and notes
tJ.S. Gov't, corporations
and Federal agency bonds Corporate bonds Corporate stocks
1992 1992 1992
Country
Calendar Jan.
year through
1981 June
Apr
through
Junep
Calendar
year
1981
Jan.
through
June
Apr
through
Junep
year
1991
Jan.
through
Apr
through
June p
Calendar
year
1991
Jaa Apr
through through
June Junep
Eirope:
Austila
Belgium-Luxembouig ....
Bulgaria
Czechoelovakia
Denmark
Finland
France
German DemocraticRepublic
Germany
Greece
Hungary
Ireland
Italy
Netherlands
Norway
Poland
Portugal
Romania
Spain
Sweden
SwiUerland
Turkey
United Kingdom
U.S.S.R
Yugoslavia
Other Europe
Total Europe
Canada
Latin America andCaribbean:
Argentina
Bahamas
Bermuda
Brazil
British West Indie*
Chile
Colombia
Cuba
Ecuador
Guatemala
Jamak»
Mexico
Netherlands Artjtes
PanamaPeru
Trinidad and Tobago ....
Unjguay
Venezuela
Other l^tin America andCaribbean
Total Latin Americaand Cvibbean. . .
.
17
S23
-3
344
-1.068
-1,073
n.a.
4,725
309
16
430
3,277
-3,735
-216
849
6,955
-663
1,007
-521
5,656
21
1,460
-2,189
-1
-79
127
-18
-2
-21
2,920
6,213
216
2
-2
15
10
74
1,025
5
-467
-142
1,072
n.a.
2,329
-17
16
-219
-26
-2,988
18
196
3
819
828
-1,223
-313
5,656
77
261
5
-233
-127
-1,042
n.a
1,550
8
-35
-6
-171
-330
111
196
-75
1,020
246
-566
8
-1,383
30
660
-229
-44
426
n.a.
-88
7
-16
38
104
64
66
14
555
-52
-102
1.300
-2
21
168
67
•1
232
n.a.
12
29
25
-322
11
19
754
46
-51
1,783
10
77
40
8
237
na28
9
13
46
-5
19
351
27
4
662
131
-1,409
72
-36
422
na1,675
47
-23
128
933
418
-36
-1
70
-448
757
-49
7,635
1
•32
-239
-21
26
472
n.a
1,450
-5
-80
15
271
-18
19
-33
-92
-84
5,632
-1
•12
-20
16
12
445
n.a
441
1
-51
13
19
-11
-1
21
49
456
6
3,289
•43
•125
1
•2
-20
9
n.a.
-63
27
158
498
-227
-84
2
•2
-24
397
-131
-2
-354
3
22
582
-1,651
309
102
614
205
12
•1
-3
1.696
-792
•9
• 1
3
4
39
21
•93
2,066
-255
-143
372
65
-4
960
3,472
-40
3
3
-468
151
-38
-4
85
-41
-18
-4
-5
84
-43
138
•2
-2
15
-1
216
463
-4
600
1
-20
9
3
1
28
221
420
-2
2
6
239
2
188
296
233
1
-1
7
2
1
33
138
158
-2
2
6
133
161
114
547
92
802
61
62
18
18
7
93
307
236
3
1
78
68
65
278
1,064
68
688
14
20
11
7
13
48
301
123
1
1
7
61
17
104
290
29
236
16
14
7
4
1
37
86
75
122
3
-220
49
740
86
77
17
19
9
205
572
291
11
3
100
84
-24
-273
123
-4
-72
n.a
-76
-4
3
56
-91
-266
-32
26
142
487
6
-2,373
1
35
106
10
-217
268
43
32
20
13
152
-25
68
3
3
58
168
-25
-191
94
-2
207
n.a.
99
5-1
14
-147
-179
-32
17
36
208
2
-1.0*5
1
1
716
CAPITAL MOVEMENTS 101
TABLE CM.V-3.--Net Foreign Transactions in Long-Term Domestic Securitiesby Type and Country, con.
* Lose than SSOO.OOO
Includes Bahrain, Iran, liaq, Kuwait, Oman, Qatar. Saudi Arabia, and the United Arab
Emirates (Tradal States).
Includes Algeria, Gabon, Libya, and Nigeria.
102 CAPITAL MOVEMENTS
TABLE CM-V-4."Foreign Purchases and Sales of Long-Term Securities, by Type and Country,
During the Second Quarter 1992, Preliminary
(In iTtfiona of doBara)
Country
Total
fUM-
oha«a«
(1)
Gro«» purcha—s by foreignefi
MwliM-
M»Trw>-
u(y&
Financ-
ing
BM)k
bonds
¬e«
(2)
Dom»Klo»»ouritia«
Bonds
o<U.S.
Qovl.
oorp.
•ndlad-
•rally
•poo-
sored
agcndn
(3)
Cofporala
and other
Bonds Stocks
(5)
Foreign
securities
Bonds
(6)
Stocks
(7)
Total
sales
(8)
Gross sales by toreioners
Market-
able
Treas-
uiy&
Federal
Financ-
ing
Bank
bonds
& notes
(9)
Domestic securHiee
Bonds
o(US.
Qo«^Corp.
andled-
eraly
sport-
sored
agencies
(10)
Corporate
and ot tier
Bonds
(11)
Stocks
(12)
Foreign
wwntie»Bonds
(13)
Stocks
(14)
Europe:
Austria 1,769 1,204
Beigium-Luxamtourg 8,702 4,226
Bulgaria
Czschoskwakia 5 S
Dennark 2,631 2,048
Finland 1,082 885
France 28,934 18,060
German DemocratioRepuUlo n.a n.a.
Germany 20,416 15,027
Greece 443 303
Hungary 30 30
Ireland 3,721 3,163
Italy 6,737 2,198
Netherianda 0.017 4,846
Norway 1,762 1,444
Poland 200 200
Portugal 687 615
Romania
Spain 12,626 10,876
Sweden 4,101 3,084
SwiUerland 0,365 2,040
Turkey 856 796
United Kingdom 283,325 189,282
USSR 1
Yugoslavia
Other Europe
Total Europe
Canada
Latin America andCarit>bean:
Argentina 506 30
Bahamas 5,221 2.986
Bonnuda 21,127 16.142
Brazil 1,645 1,251
British West Indie* 13,51
6
4.304
Chlo 638 377
Cokxnbia 211 118
CubaEcuador 53 11
Guatemala 37 1
Jamaica 11
Mexico 6,107 3,800
Netherlands Artiles 26. 123 1 7,344
Panama 1,217 260
Peru 14
Trinidad and Tobago .... 8 3
Uniguay 280 8
Venezuela 1,005 373
Other ijrtin Amerfca and „CaritAean 734 266
Total Latin America —,..„ .-,„„,andC»»)be«n. . .
.78,442 47.284
15
1,100
63
42
260
n.a
54
34
26
866
1
10
414
36
27
4,024
65
18
1.006
n.a.
856
3
80
80
248
8
ee
65
380
7
11,802
140
1,224
189
7
2,292
n.a.
1,436
42
110
817
1,103
155
81
345
4,175
8
14,876
1
271
1,260
197
19
3.340
n.a
1.632
3
320
2,349
741
103
16
556
363
780
34
47,101
74
233
1,872
8,553
6
74 2,946
11 1,566
1,887 27,961
n.a.
1,411
2
14
267
1,224
51
14
601
298
1,064
11
16,050 285,365
1
n.a.
18,320
454
66
3.704
4.998
9.367
2.105
4
813
1
11.169
3.777
10.627
846
1,127
3,965
2,281
1,112
19.092
n.a
13.477
385
65
3,169
2,360
5,175
1,333
4
9.855
2.838
3.606
788
180,665
5 77
1,113 580
23
34
32
n.a.
26
26
13
810
6
63
9
23
44
6
651
n.a.
414
2
131
67
220
10
78
16
846
1
8,703
185
1,415
05
9
2,085
n.a
1,337
37
1
96
064
1,282
187
1
64
309
3,067
6
15,021
406
1,206
3
403
364
3,765
n.a.
1,670
2
267
1,204
638
391
617
222
762
23
50,839
92
265
3
too
11
2,336
n.a.
1,386
28
16
381
1,233
169
121
1
482
383
1,424
28
15,875
1
6
4,526
CAPITAL MOVEMENTS 103
TABLE CM-V-4.-Foreign Purchases and Sales of Long-Term Securities, by Type and Country,During Second Quarter 1992, Preliminary, con.
(In mWons ot dolara)
Cour*y
Grow purohaaea by loretgnare
DofflMteMou^llsa
Grow sales by lorelflnere
Total
pur-
chases
(1)
MwM-able
Treas-
uiy&
Faderal
Rnano-
lOfl
Bwik
bonds
& notes
(2)
Bonds
of USGovtoorp.
and fed-
erally
spon-
sored
agencies
(3)
Corporate
and other
Foreign
seouitties
Bonds
(4)
Stocks
(S)
Bonds
(6)
Slocks
(7)
Total
sales
(8)
Maiket-
able
Treas-
ury&
Federal
Rnano-
Ins
Bank
bonds
& notes
(9)
Domestic securities
Bonds
OIU.S.
Govl
oorp.
and fed-
erally
spon-
sored
agencies
(10)
Corporate
and other
Foreign
securities
Bonds
(11)
Stocks
(12)
Bonds
(13)
Asia:
China:
Mainland 3.468
Taiwan 17,412
Hong Kong 9,422
India 46
Indonaeja 311
Israal 3,220
Japan 116,346
Kor«a 674
Lebanon 68
Malaysia 2,362
PaUatan 5
PhlipplnM 404
SingapoiB 12,930
Syria 4
Thaland 896
Other Asia 19,354
TotolAsia 185,911
Africa:
Egypt 27
Ghana 2
Uberta 529
MoiDooo 2
South Afrna 13
Zaire 5
Other Africa 288
Total Africa ggg
Other counlnes:
Australia 7,908
Al other 903
Total other
Total foreign countries
International and reglonai:
International 32,072
European regional 31
Latin American regkinal .
.
856
Asian regional 572
African regional 399
Mkldie Easternregbnal 161
Total international andregk>nal 34,081
Grand total 762,802
3,048
13.797
4.164
34
276
2,706
82.661
479
3
2.167
172
11.631
847
14,526
209
1,642
292
1
22
7.660
21
7
1
142
1,723
21
836
232
6
69
2.014
112
7
2
1
12
202
1.053
12
119
1,674
7
13
68
4,426
11
36
33
4
62
266
4
3
1,892
1,025
8
114
12,827
33
4
57
146
440
2
113
4
20
2,145
6
8
262
6.868
18
1
113
11
349
44
47
1.979
13,138
9.404
81
3,062
111,232
680
47
2,664
10
420
14.306
2
927
19,821
1,761
11,958
4,115
73
280
2.461
79,271
488
2,199
299
13,322
807
16,260
106
248
71
2
2
6,218
2
25
1,146
33
29
160
1
22
1,605
45
4
1
4
55
5
452
10
94
1,558
6
30
74
6,108
9
36
15
4
68
230
2
2
1,815
76
797
664
3
350
12,722
87
3
81
13
288
84
136,379 11.620 4.567 8.529 15,941 8,885 178,062 133,284 2,416
1
2
228
1
252
20
15 153
5
26
53
104 CAPITAL MOVEMENTS
TABLE CM-V-5."Foreign Purchases and Sales of Long-Term Securities, by Type andCountry, During Calendar Year 1991
(In millions of dollars)
Country
TotaJ
pur-
chases
(1)
Gross purchases by lofeigners
Donnestic securities
Mar1(etat>le
Treasury &Federal
Financ-
ing Bank
t)ond8
& notes
(2)
Bonds of
U.S^ Govt
Corp. and
lederaDy
sponsored
agencies
(3)
Corporate
and other
Foreign
securities
Bonds
(4)
Stocks
(S)
Bonds
(6)
Stocks
(7)
Total
sales
(8)
Gross sales by foreigners
IDomesttc securities
MarketabJe Bonds
Treasury o< U.S
& Federal Gov't
Financ- ccrp. and
ing Bank federally
t)Onds sponsored
& notes agencies
(9) (10)
Corporate
and other
Foreign
securities
Bonds
(11)
Stocks
(12)
Bonds
(13)
Stocks
(14)
Europe.
Austna 6,528 3.682
BelgiunvLuxembourg . . . . 27,764 11,791
Bulgaria 35 35
Czechostovakia 1
Oenmatlt 16,282 1 1.744
Finland 3,472 2,811
France 72,280 47,618
German DsmoeratieRepuUic n.a n.a
Germwiy 66,704 42,462
Greece 1.553 1,152
Hungary 122 80
Ireland 9,022 7,036
Italy 16.238 5,086
Netherlands 48,21
1
36.216
Norway 13,038 10,682
Poland 4
Portugal 2,646 2,454
Romania. ' *
Spain 62,603 56,956
Svmdan 22,290 15,031
SwiUerland 48,852 20,350
Turkey 2,697 2.553
United Kingdom 8S7.619 608.633
U.S.S.R 4
Yugoslavia
Other Europe
Total Europe
Canada
Latin America andCariblsean:
Argenlina 1,262 82
Bahamas 16,486 5,377
Bermuda 66,801 52,668
Brazil 2,251 1,320
British West Indies 28,669 9,732
Chile 1,954 790
Cokimbia 853 438
Cuba
Ecuador 160 62
Qualemala 146 18
Jamaica 68 7
Maxkx) 14,904 7.684
Netherlands Antilles 70.782 46.157
Panama 4,438 663
Peru 72 2
Trinidad and Tobago .... 19 '
Uruguay 638 85
Venezuela 1.267 261
Other Latin America andCaribbean 2.163 496
Total Latin America „.,,„„ .„,,.„and Caribbean. . .
.211,933 125,743
49
1,768
388
118
n.a
144
63
6
164
117
606
251
39
2,217
74
115
1
11,8(»
190
1,994
983
31
1,934
na3,182
60
11
467
1,259
754
33
17
190
69
3,047
23
38,568
1
708
6,188
1
547
77
7,438
n.a
6,027
222
2
543
3,391
4,468
671
3
19
362
1,488
17.334
21
55.729
3
766
6.130
2,373
383
8,488
n.a.
10,773
48
5
668
4,953
3,116
1,004
99
2.002
4.510
3.810
20
126,935
133
903
6.652
28.748
38
3.665
11.268
38
227 16.186 11.401
52 4.720 3.889
6.208 76,665 48,581
n.a
4.116
8
143
1.433
4.162
417
17
1.876
1.118
4,195
78
45,945
n.a.
68,652
1,155
143
8,570
12,075
64,963
13,135
2
1,733
55.938
22.793
47.465
3.295
897.632
20
n.a
47.188
843
83
6,606
1,808
38.960
10,878
1,605
49.000
15.694
19.344
3.074
602.976
18
1.088
627
162
267
n.a
242
56
22
125
13
442
185
26
1.662
126
217
10.510
2
58
3.403
921
67
1,512
na.
1.507
12
34
339
326
336
17
120
516
2.290
72
30.933
761
6.313
988
5.744
549 2.415
97 426
7.430 11.101
n.a
6.091
195
1
385
2,893
4.695
756
1
21
386
1.092
17.464
23
56.083
n.a.
8.987
20
3
865
4,979
6,127
653
18
2,222
3,654
3,628
14
142,892
17
484 540 16 2.060 435 227 710 473 164
171
822
272
68
7.764
n.a.
5.637
28
249
2.056
4,433
584
47
2,548
1,711
4,522
111
54,238
3
13,010
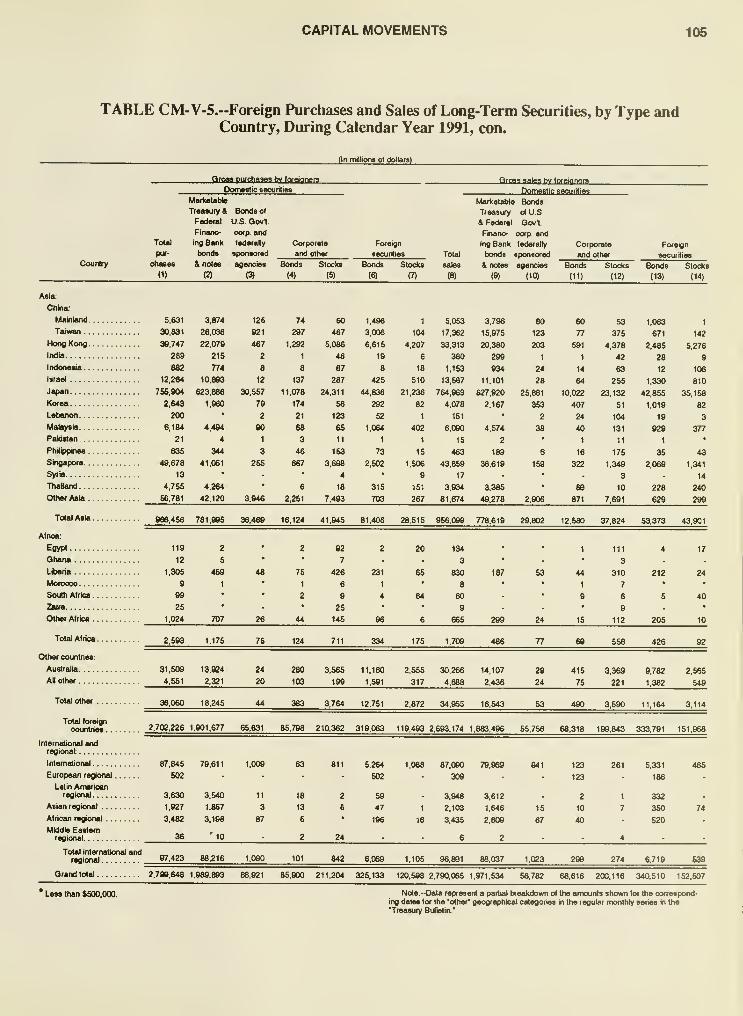
CAPITAL MOVEMENTS 105
TABLE CM-V-5.--Foreign Purchases and Sales of Long-Term Securities, by Type andCountry, During Calendar Year 1991, con.
Qn mdliore of doHars)
Country
Qfosa purchases bv tofeianefs
106
INTRODUCTION: Foreign Currency Positions
Information on holdings of foreign currondes, or foreign currency
positions, of banks and nonbanking firms in the United States has
been collected since 1074. It has also been collected on those of
foreign branches, majority-owned foreign partnersNps and subsidiar-
ies of United States banks and nonbanking firms.
Reports cover five major foreign exchange market currencies
arKl U.S. dollars held abroad. This information is published In the
Treasury Bulletin in seven sections. FCP-I is a summary of worldwide
net poaitiorw in all of the currencies reported. FCP-)I through -VI
present information on specifled foreign currencies. FCP-VII presents
the U.S. ddlar positions of the foreign branches and subsidiaries of
U.S. firms that are required to report in orw or more of the specified
foreign currencies. Reporting is required by title II of Public Law93-110, which is an amendment to the Par Value Modification Act of
September 21, 1973, and by implementing Treasury regulations.
Information for ttie United States includes amounts reported by
sole proprietorships, parta^rships, and corporations in the United
States, including tfie tJ.S. branches and sutjsidiaries of foreign non-
banking ooncems. The Weekly Bank Positions category includes
figures reported by agencies, branches, and sut)sidiaries of foreign
banks as well as tianking institijtions located in the United States.
Data for foreign branches' and 'eibroad' include amounts reported
by the branches arKl by majority-owr^ed partr^rships and subsidiaries
of U.S. banking and nonbanking concerns.
Data generally do rxjt reflect foreign currency positions of foreign
parents or their subsidiaries located abroad except ttirough intercom-
pany accounts. Data do include the foreign subisidiaries of a fewforeign-owned U.S. corporations. Assets, liabilities, and foreign ex-
change contract data are reported based on time remaining to matur-
ity as of Uie date of the report, regardless of tine original maturity of
tiie instrument involved.
Since January 1982, tiie exemption level for tanks and banking
institijtions has been $100 million. The exemption level for nonbank-
ing firms is also $100 million on positions in the United States, and onforeign branch's and subsidiaries' positions since March 1982.
Firms must report their entire position in a foreign currency if the
specified U.S. dollar equivalent exemption level is exceeded in any
category of assets, liabiilities, exchange contracts bought and sold, or
in the r>et position of tiiat currency.
In general, exemption levels are applied to ttie entire firm. In
reports on ttieir foreign branches and majority-owned partnerships
and subsidiaries, U.S. banks and nontsanks are required to report the
U.S. dollar-denominated assets, liabilities, exchange contracts
bought and sokd, and net positions of ttiose branches, parb^erships,
and subsidiaries with nonexempt holdings in the specified foreign
currencies.
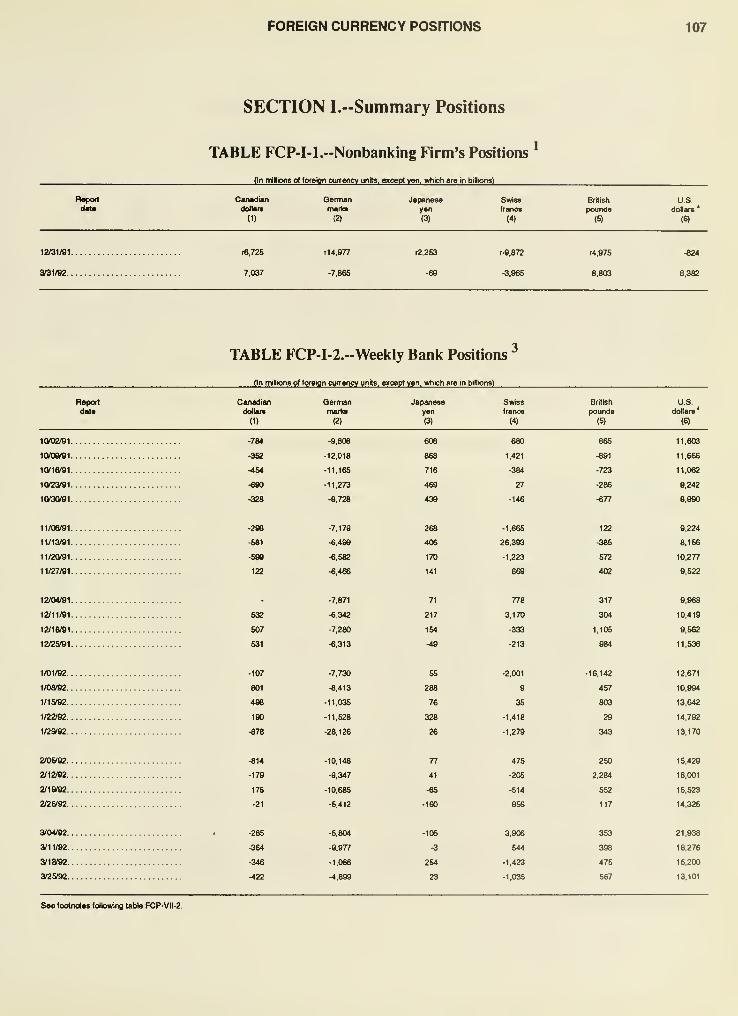
FOREIGN CURRENCY POSITIONS 107
SECTION I..-Summary Positions
TABLE FCP-I-l.--Nonbanking Firm's Positions^
(In milions o) tofeion cmrencv units, except yen, which are in bilional
Rvpoft Canadian
dollare
(1)
Qermanmarks
(2)
Japaneseyen
(3)
Swiss
francs
(4)
British
pounds
(5)
US.dollars*
(6)
12/31/91.
3«1/92.
.
16.725
7,037
r14,977
-7,866
i2,2S3 r-9,672
-3,965
r4,975
8,803
-824
6,382
TABLE FCP-I-2."WeekIy Bank Positions
fln milions o( loreiqn cmrencv units, exoepi yen, which are in taillionsl
Report
data
Canadian
dollars
(1)
Qermanmarks
(2)
Japanese
yen
(3)
Swiss
francs
(4)
British
pounds
(5)
USdollare*
(6)
i(V02/gi.
icvoerai.
i(via/9i.
10/23/91.
IQ^G/91.
11/06/81.
ii/ia«i.
11/2(V91.
11/27/91.
12/04/91.
12/11/91.
12/16/91.
12/25«1.
1/01/92.
.
1/0a«2.
.
1/15«2.
.
1/22/92.
.
1/2^92. .
2/05/92.
.
2/12/92.
.
2/ia'92 .
2/2^92 .
3/04/92. .
3/11/92..
3/18«2 .
3/2^92. .
-784
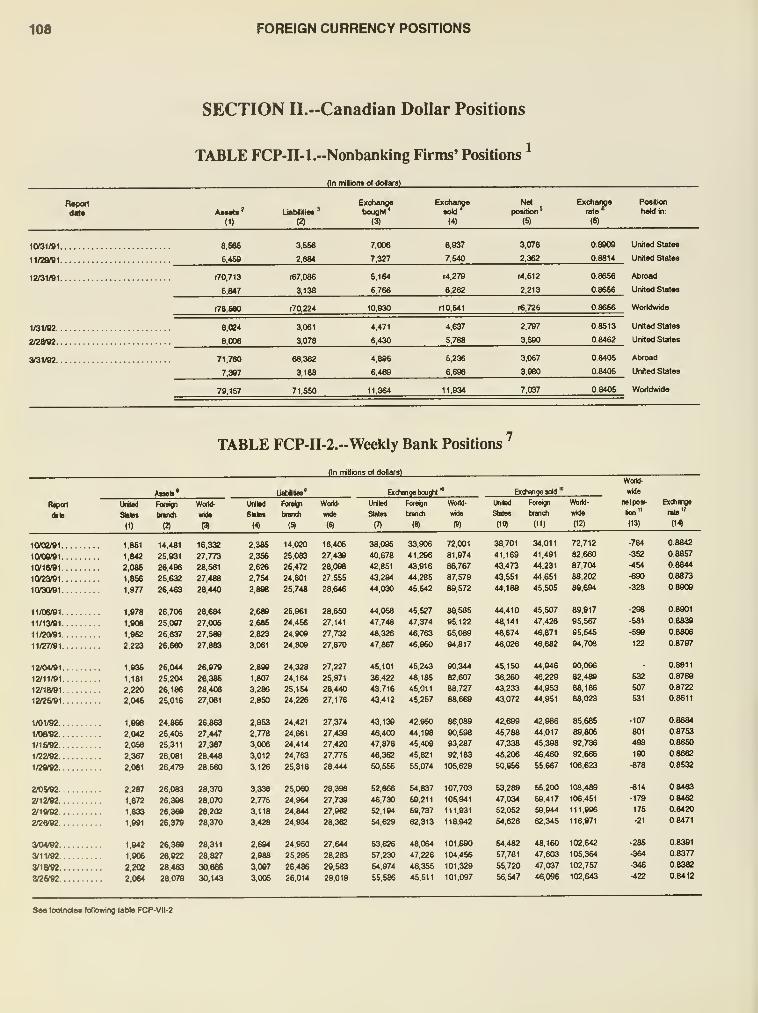
108 FOREIGN CURRENCY POSITIONS
SECTION Il.-Canadian Dollar Positions
TABLE FCP-n-l."Nonbanking Firms' Positions^
(In fTilion* ol doHaral
Report
(1)
LiabililiM'
(2)
Exchangotxxjght'
(3)
Exchange
•oW'^
(4)
N«t
position^
(S)
Exchi
rat<
(6)
iara«
rato°^
Posilian
h«Min:
1(V31/B1
U/2U9^
12/31/91
1/31/B2.
2/28f92.
a/31/92.
6.E66
6.456
3.556
2.884
7.006
7,327
6.937
7,540
3,078
2,362
08909
0.B814
r70.713
5,847
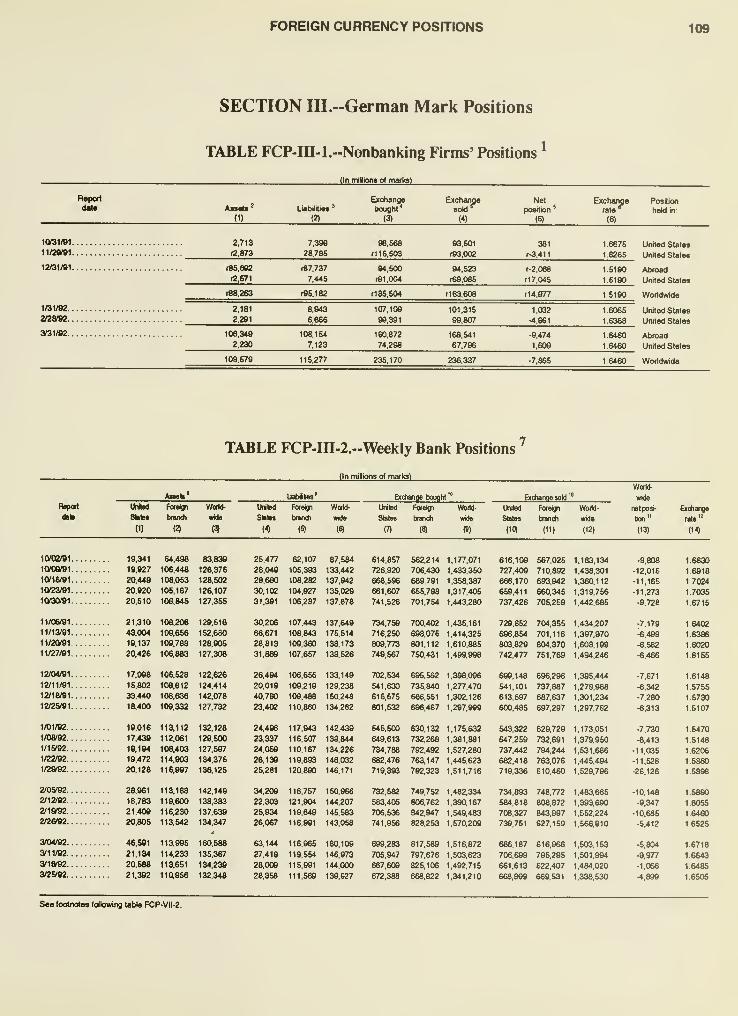
FOREIGN CURRENCY POSITIONS 109
SECTION III.-German Mark Positions
Rsport
TABLE FCP-ra-l.-Nonbanking Firms' Positions*
(In itiilion» ot mafks)
An«tt'(1) (2)
Exchangebought*
(3)
Exchange Net
position'
(6)
Exchangerate'^
(6)
Position
held in:
i(V3i/gi
ii/2a«i
12^1/81
1/31/92.
2/2a«2
3^1/92.
2,713
t2.873
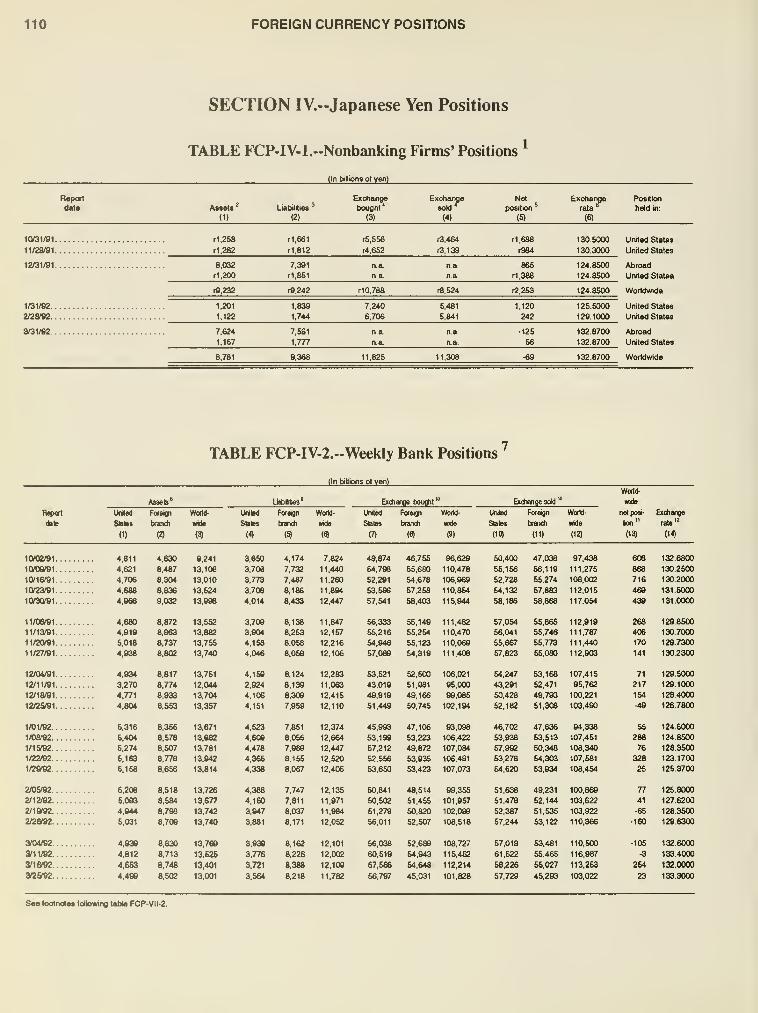
110 FOREIGN CURRENCY POSITIONS
SECTION IV.--Japanese Yen Positions
TABLE FCP-IV-l.-Nonbanking Firms' Positions^
(In blUions of yen)
Report
dttt AssaU'(1)
Liabilities
(2)
Exchange
txxight^
(3)
:xcnange
sow'^
(4)
Net
position^
(5)
Excha[>
rate"
(6)
Position
held in:
1(V31/01
ii/2a«i
12/31/91
1/31/92.
2/2^92.
3^1/92.
r1,25e
r1,282
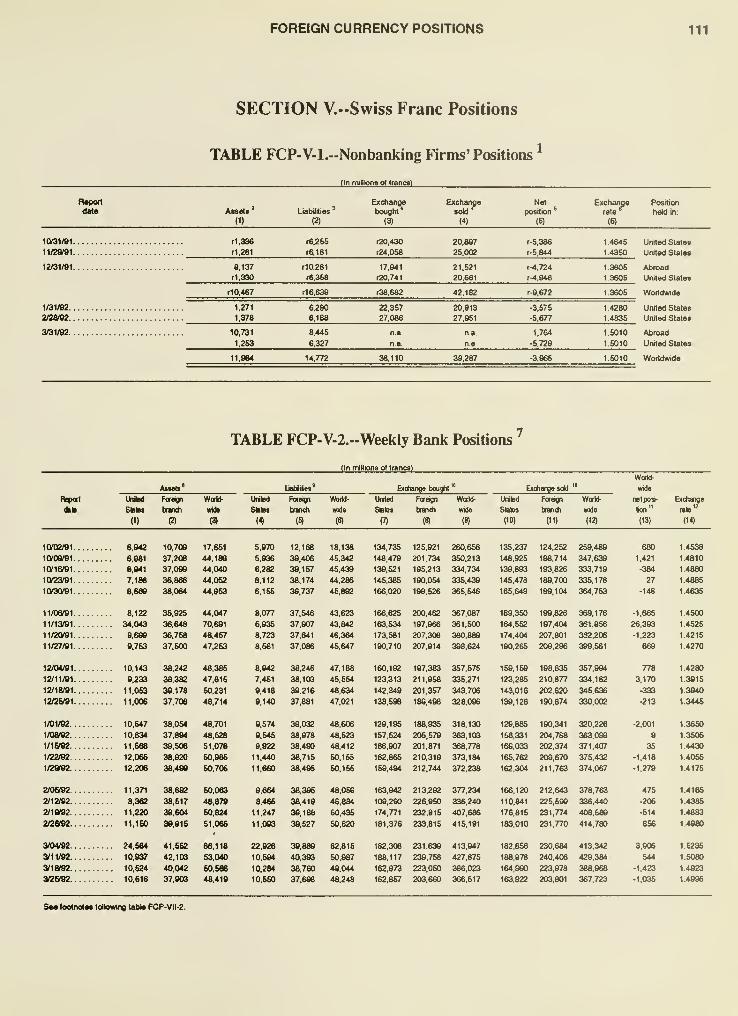
FOREIGN CURRENCY POSITIONS 111
SECTION V.--Swiss Franc Positions
TABLE FCP-V-l.--Nonbanking Firms' Positions^
(In millions ol tranog)
Assats
(1)
Liabilities
"
(2)
Exchange
bought'
(3)
Exchange
sou'^Net
position^
(S)
Exchamerale^
(6)
Position
held in:
1001/91
11/2S«1
12/31/91
1/31/92.
2/2aV2.
3/31/92.
r1.336
r1.281
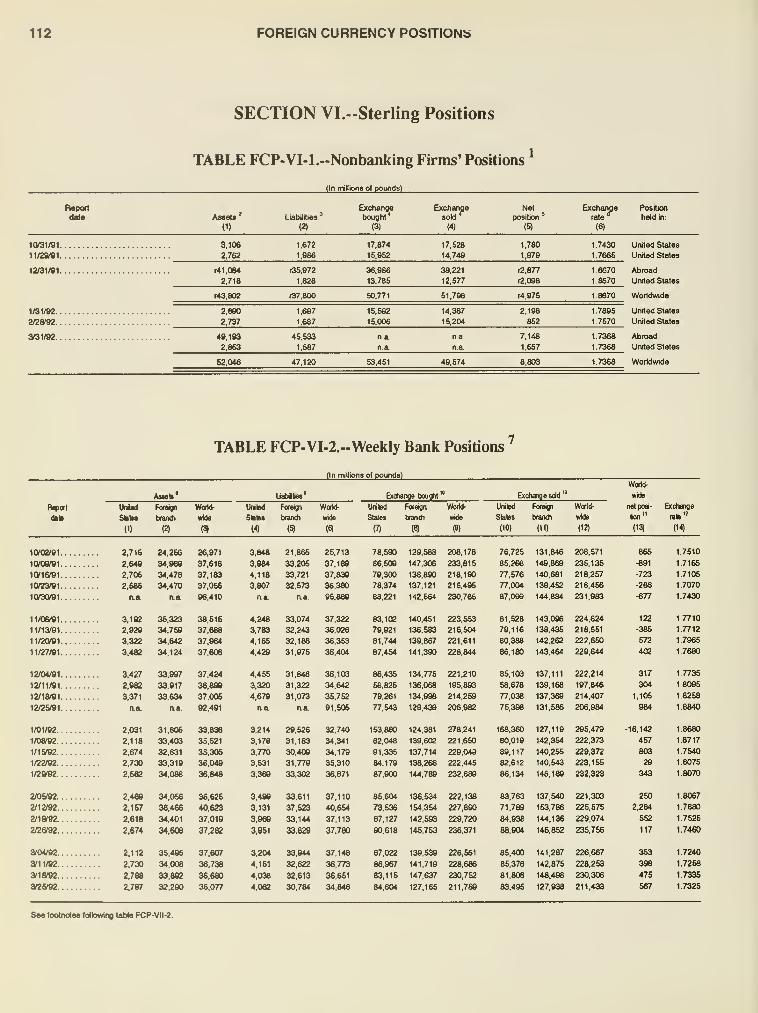
112 FOREIGN CURRENCY POSITIONS
SECTION Vl.-Sterling Positions
TABLE FCP-VI-l.--Nonbanking Firms' Positions^
(in iTiMions ot pounds)
Report
Anels'(1)
Liabilities-"
(2)
Exchange
bought*
(3)
Exchangesold'^
m
Net
position*
(5)
Exchangerate*^
(6)
Position
held in:
1(^31/91
11/2M1
12/31/01
1/31/S2.
2/2V92.
3^1/02.
3,106
2,762
FOREIGN CURRENCY POSITIONS 113
SECTION VII.--U.S. Dollar Positions
TABLE FCP-Vn-l,--Nonbanking Firms' Foreign Subsidiaries' Positions*
(In miHions at ddHan)
Repoildale Atseto^
(1)
LiabiHies''
(2)
Exchangebought
*Exchangesold '
(4)
Net ,
114
FOREIGN CURRENCY POSITIONS
FOOTNOTES: Tables FCP-I through FCP-VII
SECTION I
' Worldwide net positions on the last business day of the calendar quarter ol nonbanking
business concerns in the United States, their foreign branches and majority-owned
partnerships and subsidiaries. Excludes receivables and installment paper that have been
sold Of discounted before maturity. U.S. parent companies* investments In their
majority-owned foreign subsidiaries, fixed assets (plant and equipment), and capitalized
leases for plant and equipment.
Foreign branches, majorIty-owned partnerships and subsidiaries only.
^ Weekly worldwide net positions of banks and banking institutions in the United States,
their foreign branches, and majority-owned foreign subsidiaries. Excludes capital assets
and liabilities.
* Foreign branches and majority-owned subsWiarles only.
SECTIONS 11 THROUGH VHPositions of nonbanking business concerns in the United Slates, their foreign branches,
majority-owned partnerships, and subsidiaries. In section VII, positions of foreign branches.
majorityKwndd partnerships and subsidiaries only.
Excludes receivables and installment paper sold or discounted before
assets {plant and equipment), and parents' investment in majority
subsidiaries.
^ Capitalized plant and equipment leases are excluded.
* Includes both spot and fonward exchange rates.
Columns 1 and 3 lees columns 2 and 4.
® Representative rales on the report date. Canadian dollar and United Kingdi
are expressed in U.S. dollars per unit of foreign currency, all others in foreigi
dollar. The source of the automated representative rales changed as of Juni
Banks and banking institutions in the United States, their foreign
majority-owned subsidiaries. In sectran VII, foreign branches and
subsidiaries only.
Excludes capital assets.
Excludes capital liabilities.
'° Includes both spot and forward exchange contracts.'
' Columns 3 and 9 less columns 6 and 1 2.
'^ See footnote 6.
maturity, fixed
owned foreign
om pound rates
n units per U.S.
I 30, 1988.
branches, and
nnajority-owned
lis
INTRODUCTION: Exchange Stabilization Fund
To stabilize the exchange value of the dollar, the ExchangeStal^ilization Fund (ESF) was established under the Gold Reserve Act
of January 30, 1934 (31 U.S.C. 822a), which authorized estatilishment
of a Treasury Department fund to t>s operated under the exclusive
control of the Secretary, with approval of the PresidenL
Sut>3equent amendment of the Gold Reserve Act modified the
original purpose somewhat to reflect termination of the fixed exchangerate system.
Resources of the furxd include dollar balances, partially invested
'tt\ U.S. Government securities. Special drawing riglits (SDRs), andbalances of fonei^ currencies. Principal sources dl income (losses)
for the fund are profits (losses) on SDRs and foreign exchange, as well
as interest earned on assets.
• Table ESF-1 presents the assets, liabilities, and capital of the
fund. The figures are In U.S. dollars or their equivalents based oncurrent exchange rates computed according to the accrual method of
accounting. The capital account represents the original capital appro-
priated to the fund by Congress of $2 billion, minus a subsequenttransfer of $1 .8 billion to pay for the initial U.S. quota subscription to
the IMF. Gains and losses are reflected in the cumiJative net income(loss) account
• Table ESF-2 shows the results of operations by quarter. Fig-
ures are in U.S. dollars or their equivalents computed according to the
accmal method. "Profit (loss) on foreign exchange' includes realized
profits or losses on currencies held. 'Adjustment for change in valu-
ation of SDR holdings and allocations' reflects net gain or loss onrevaluation of SDR holdings and allocations for the quarter.
116 EXCHANGE STABILIZATION FUND
TABLE ESF-1.--Balances as of Dec. 31, 1991, and Mar. 31, 1992
{In thousands ol doUars)
Asaqts, tobilrttes, and capital
Asaatt
U.S. doUws:
HsIdalFadac^RMeneBankolNewYorit .
Held with Treasury:
U.S. Qoveinment secunties
Other
Special drawing right*
'
Foreign exchange and securities:'
German marks
Japanese yen
Pounds stertng.
Swiss tiancs
Accounts reoeivabte
Total assets
Uabllltlas and capital
Current Batsktiee.
Accounts payable
Advanoj from US. Tteaaury (U.S. drawings on
Total current liabilities
Other liabililws:
Special drawing rights certificates
Special drawing rights allocations
Total other BabiBties
Capital:
Capital aocouit
Net income (loss) (sea table ESF-2)
Total capital
Total liat»lities and caprtal
Oec 31, 1991 Dec. 31. 19S1, through l^r 31, 1992 Mar. 31, 1992
3,101,007
369,753
1.067,000
11,239,668
8,350,451
9,935,276
29,049
33,992
252,746
-220,546
3.550
-292.353
-466.591
-346.070
-1,387
-2,651
4.540
34,368.939 -1.321.408
200.000
15.993.570
16.193,570
-1,025.367
-1.025.367
34.368.938
2.880.461
363.303
1.067.000
10.947,313
7,883.860
9.589.206
27,662
31.441
267.286
33,047,531
81,960
1,067,000
SPECIAL REPORT
Consolidated Financial Statements
of the United States Government
Prototype 1991

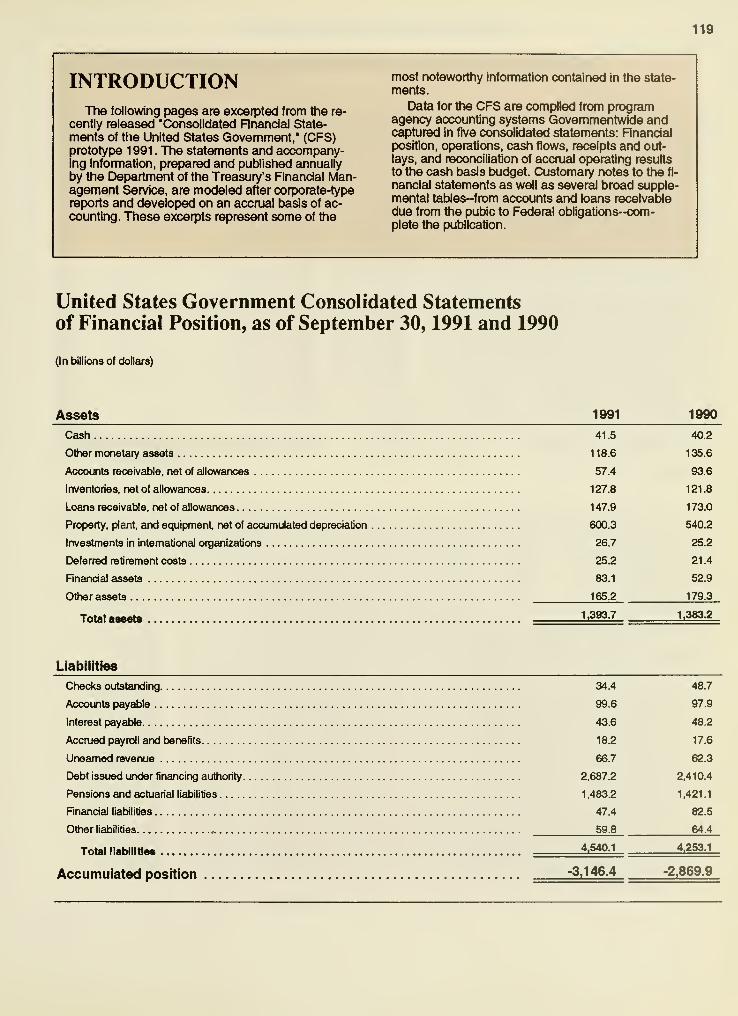
119
INTRODUCTIONThe following pages are excerpted from tfie re-
cently released 'Consolidated Financial State-
ments of the United States Government," (CFS)prototype 1 991 . The statements and accompany-ing information, prepared and published annually
by the Department of the Treasury's Financial Man-agement Service, are modeled after corporate-type
reports and developed on an accrual basis of ac-
counting. These excerpts represent some of the
most noteworthy information contained in the state-
ments.
Data for the CFS are compiled from programagency accounting systems Govemmentwide andcaptured in five consolidated statements: RnandalpoJsition, operations, cash flows, receipts and out-
lays, and reconciliation of accmal operating results
to the cash basis budget. Customary notes to the fi-
nanciai statements as well as several broad supple-mental tables-from accounts and loans recelvatde
due from the pubic to Federal obligations-com-plete the publication.
United States Government Consolidated Statementsof Financial Position, as of September 30, 1991 and 1990
(In billions of dollars)
Assets
Cash
Other monetary assets
Accounts receivable, net of allowances
Inventories, net of allowances
Loans receivable, net of allowances
Property, plant, and equipment, net of accumulated depreciation
Investments in international organizations
Deferred retirement costs
Rnandal assets
Other assets
Total a88«ts ,
Llabllittes
Checks outstanding
Accounts payable
Interest payable
Accrued payroll and benefits
Unearned revenue
Debt issued under financing authority
Pensions and actuarial liabilities
Financial liabilities
Other liabilities ,
Total llabllttles
Accumulated position
1991 1990
41.5
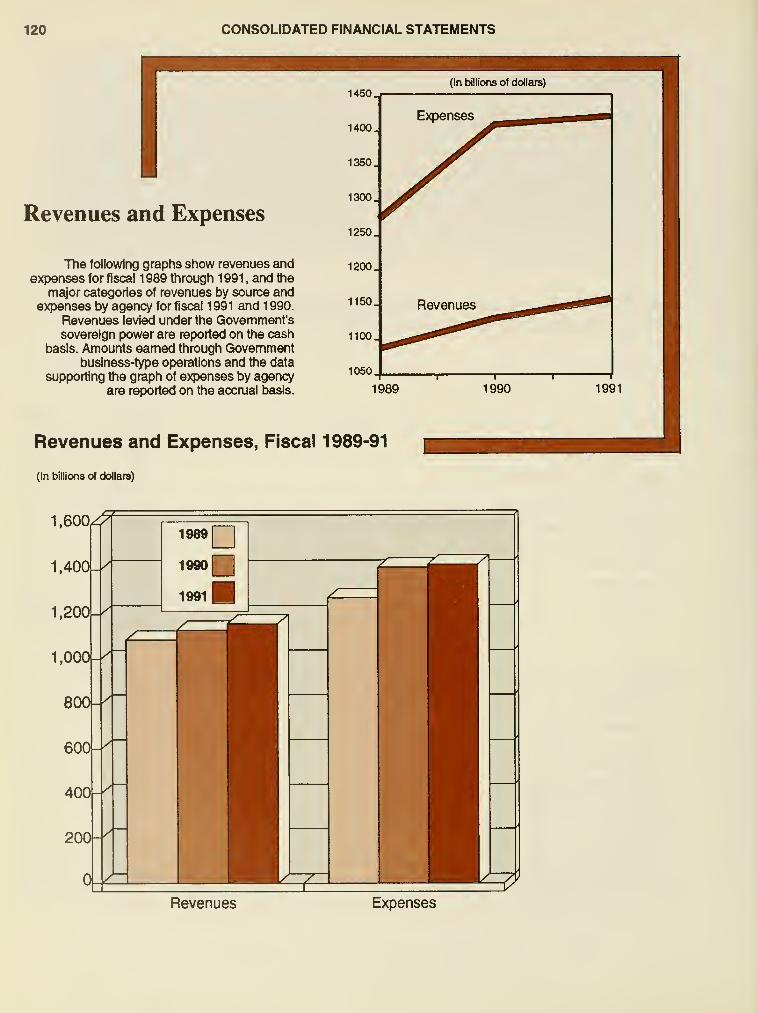
120 CONSOLIDATED FINANCIAL STATEMENTS
Revenues and Expenses
The following graphs show revenues andexpenses for fiscal 1989 through 1991 , and the
major categories of revenues by source andexpenses by agency for fiscal 1 991 and 1 990.
Revenues levied under the Government's
sovereign power are reported on the cash
basis. Amounts earned through Governmentbusiness-type operations and the data
supporting the graph of expenses by agency
are reported on the accrual basis.
1450.^
1400.
(In billions of dollars)
1989 1990 1991
Revenues and Expenses, Fiscal 1989-91
(In billions of dollars)
Revenues Expenses
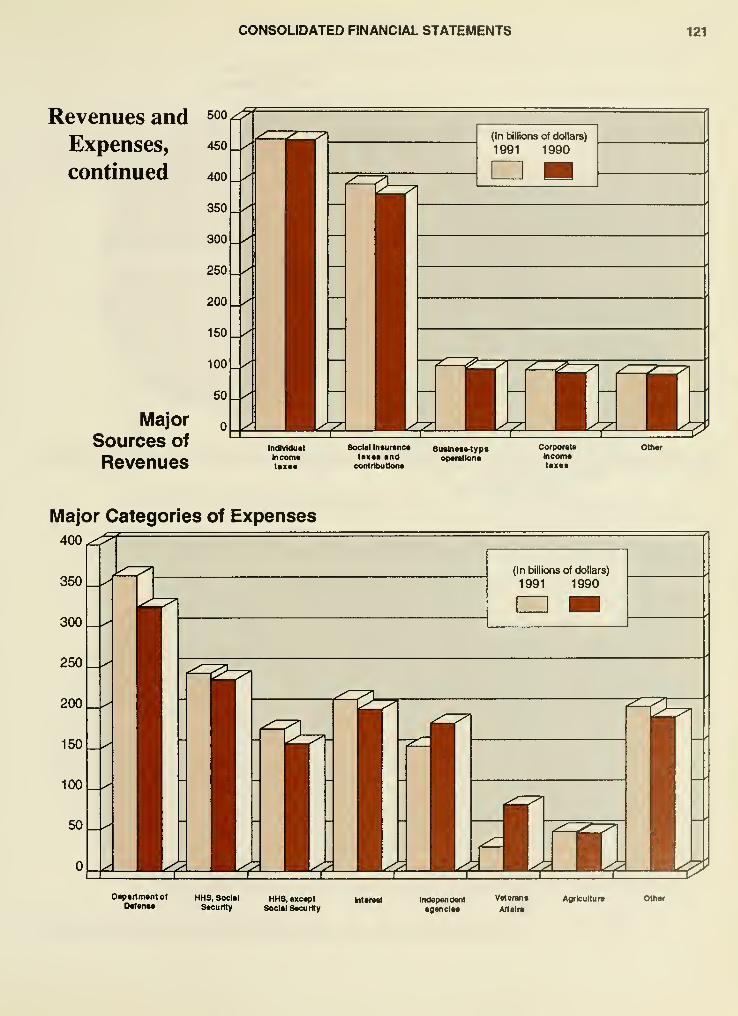
CONSOLIDATED FINANCIAL STATEMENTS 121
Revenues and ^oo
Expenses,
continued 400
Major Q
Sources of
RevenuesIndMOutl
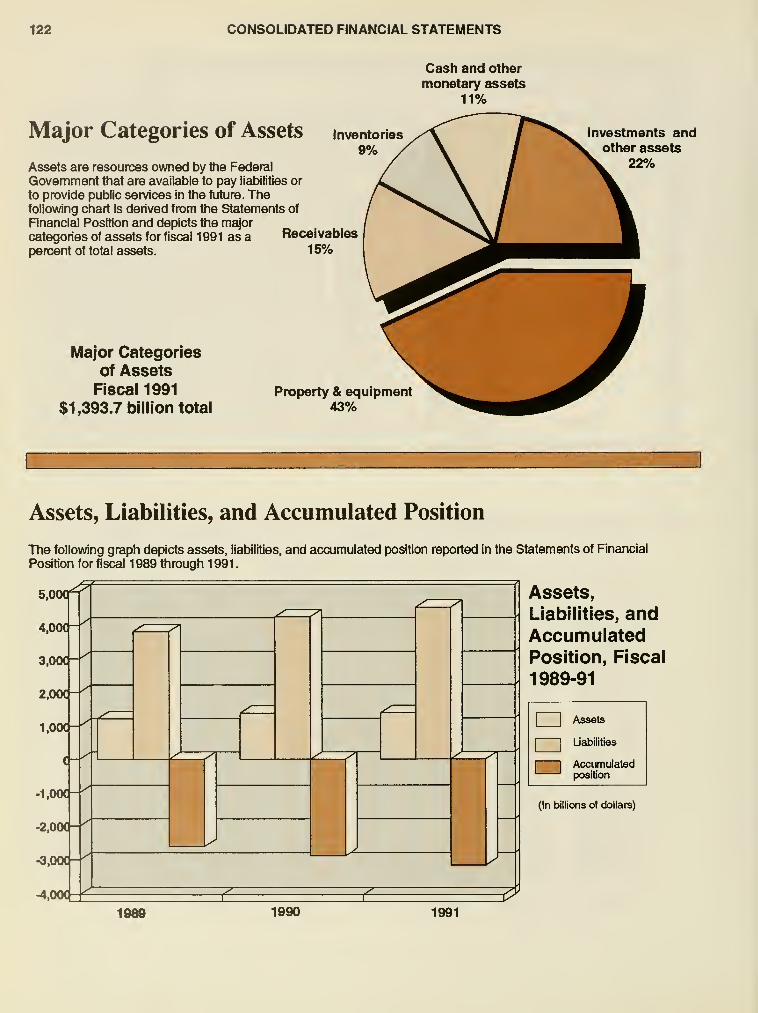
122 CONSOLIDATED FINANCIAL STATEMENTS
Major Categories of Assets Inventories
9%Assets are resources owned by the Federal
Government that are available to pay liab>ilities or
to provide public services in the future. Thefollowing chart is derived from the Statements of
Rnanclal Position and depicts the major
categories of assets for fiscall 99 1 as a Receivables
percent of total assets. 15%
Major Categories
of AssetsFiscal 1991
$1,393.7 billion total
Cash and other
monetary assets
11%
Property & equipment43%
Investments andother assets
22%
Assets, Liabilities, and Accumulated Position
The following graph depicts assets, liabilities, and accumulated position reported in the Statements of Financial
Position for fiscal 1 989 through 1 991
.
S.OOOfT^
4,00t-'^
3,00C-'^
2,00(-'^
I.OOC-'^
-i.ooc-^
-2,00(-f
•3,00(
•4,00C ^ ^1980 1990 1991
^
Assets,
Liabilities, andAccumulatedPosition, Fiscal
1989-91
1 1
Assets
1 1
Liabilitiss
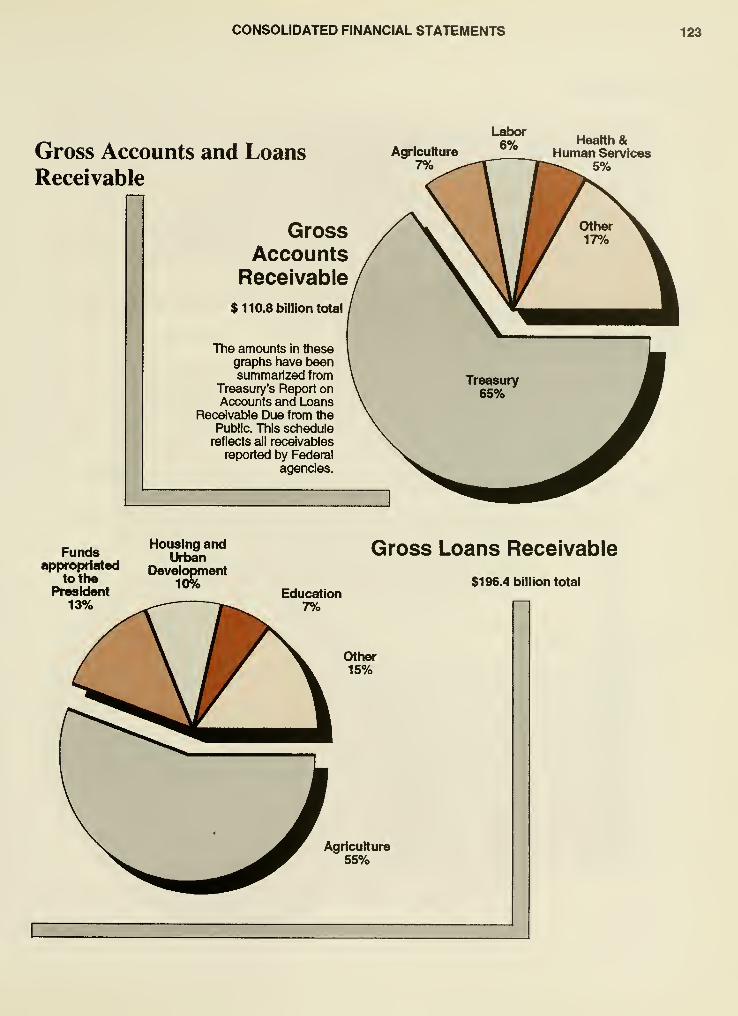
CONSOLIDATED FINANCIAL STATEMENTS 123
Gross Accounts and LoansReceivable
GrossAccounts
Receivable
$110.8 billion total
The amounts in thesegraphs have beensummarized from
Treasury's Report onAccounts and Loans
Receivatrie Due from the
Public. This schedulereflects all receivables
reported by Federal
agencies.
Agriculture
7%
Labor6% Health &
Hunfian Services
Fundsappropriated
to thePresident
13%
Housing andUrban
Development10%
Education7%
Gross Loans Receivable
$196.4 billion total
Other15%
Agriculture
55%
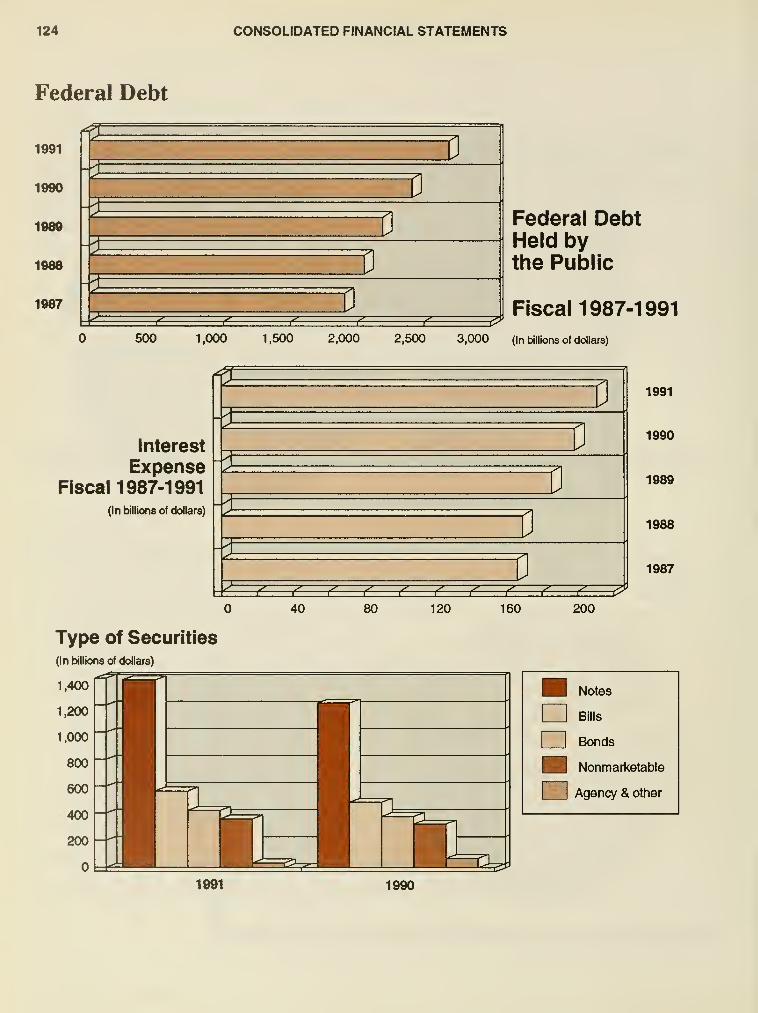
124 CONSOLIDATED FINANCIAL STATEMENTS
Federal Debt
1991
1990
1989
1988
1987
-1
-5
P
P
-5P
-1P
2 P^ ^ ^
Federal DebtHeld bythe Public
Fiscal 1987-1991
500 1,000 1,500 2,000 2,500 3,000 (In billions of dollars)
Interest
ExpenseFiscal 1987-1991
(In billions of dollars)
^P
P
P
P
P^
.
-".
-^.
'^ .^ .
-".
-^ / V ^ ,
^ =^
1991
1990
1989
1988
1987
40 80 120 160 200
Type of Securities
(In billions of dollars)
1,400
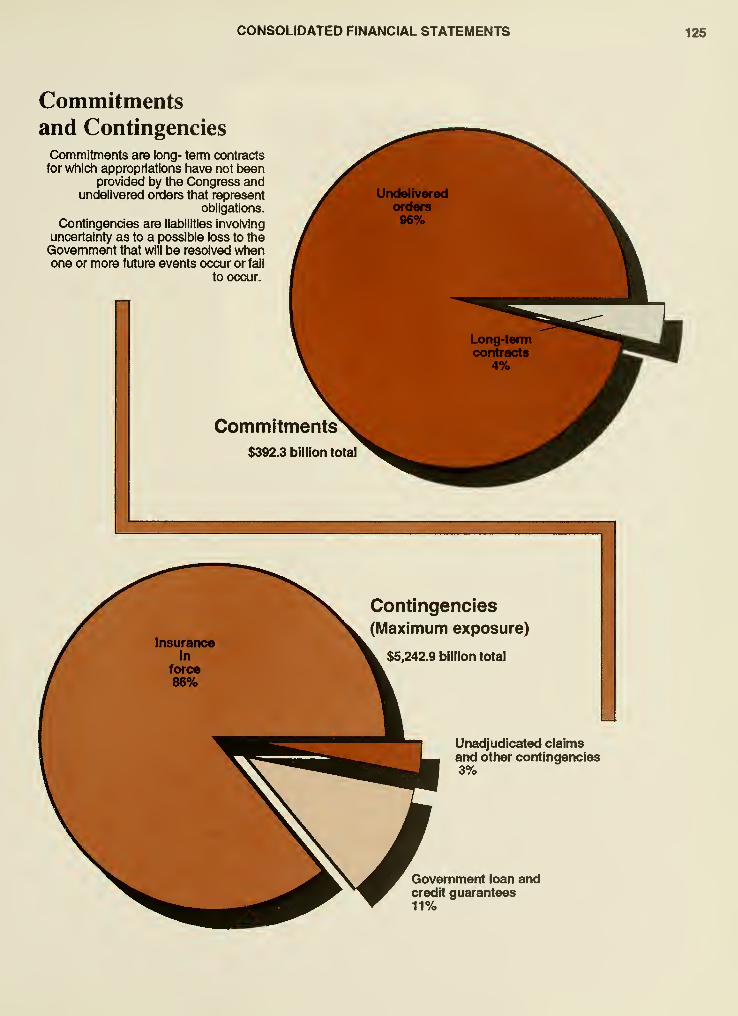
CONSOLIDATED FINANCIAL STATEMENTS 125
Commitmentsand Contingencies
Commitments are long- temn contracts
for which appropriations have not beenprovided by the Congress and
undelivered orders that representobligations.
Contingencies are li£ibilities involving
uncertainty as to a possible loss to theGovernment that will be resolved wtienone or more future events occur or fail
to occur.
Commitments$392.3 billion total
Contingencies
(Maximum exposure)
$5,242.9 billion total
Unadjudicated claimsand other contingencies3%
Government loan andcredit guarantees11%


TECHNICAL PAPERS

TREASURY ISSUES 129
Recent Reports and Studies
Economic Developments andReforms in the Former Soviet Union
The Gross Domestic Product (GDP) for the former Soviet
Union fell by as much as 12 percent in 1991 , and the Interna-
tional Monetary Fund (IMF) estimated inflatbn of 140 percent
for the same year, according to David C. Mulford, UnderSecretary of the Treasury for International Affairs. The UnderSecretary spoke to the House Committee on Banking, Finance,
and Urban Affairs, and the Subcommittee on International
Development, Finance, Trade, and Monetary Policy on Febru-
ary 5, 1 992, regarding economy reform measures in the former
Soviet Union.
According to the Under Secretary, the budget deficit in-
creased to more than 22 percent of GDP. However, a trade
surplus was the result of declines in both imports and exports.
In January of this year, the Russian government introduced a
28 percent value added tax, a 32 percent profits tax, and a 37percent wage tax. Overall consumer prices have roughly dou-
bled since January.
The Russian Federation is working in cooperation with the
IMF to pursue economic reform. Plans include changes in fiscal
and monetary polk;ies, the foreign exchange system, price
liberallzatbn, and privatization. Russia has cut both domestic
and military spending substantially. Several other former re-
publics are also working with the IMF and other international
institutions. Secretary of State James Brady announced U.S.
support for early consideration of IMF and World Bank mem-be rship for new states establishing diplomatic relatbns with the
United States.
The exchange rate for commercial transactions is 110
rubles to the dollar. Russian authorities expect the value of the
ruble to strengthen as confidence in the reform program in-
creases. However, a proposal by the Central Bankfor a 'loreign
investment" rate of 8-10 rubles to the dollar could have a
substantial negative impact on foreign investment.
The Western response to the reforms taking place in-
cludes debt deferral by leading creditor countries,
humanitarian and food aid, technical assistance, and nuclear
risk reduction.
Contrasting the current situation with the rebuilding of
Europe following World War II, the Under Secretary said "the
process in the new states requires creation of institutbns andsystems for a market-based economy, which has not existed
in these countries during much of the present century."
Changing Economic and Financial Relationships Between the United States and Pacific Region
The nature of relationships between the United States and
Taiwan and Korea has changed as Asian economies havegrown and prospered, according to Treasury's Deputy Assis-
tant Secretary for Developing Nations, who spoke to the
Bankers' Association for Foreign Trade on January 23.
The first objective in consultations with Korea and Taiwan
is to improve treatment of U.S. financial firms, ensuring themequality of competitive opportunity with domestic counterparts.
The United States is also seeking broader liberalization of
financial markets to include interest deregulation, elimination
of capital controls, and changes to exchange rate policies.
In both Korea and Taiwan, policies exist that discriminate
against foreign institutions. Taiwan strictly limits foreign banks'
access to domestic funding resources and restricts foreign
exchange activities. Korea offers a "cfosed, protected, unfair,
and discriminatory environment for foreign institutbns," andstrictly controls and directs foreign exchange activities. Banksmust adhere to a bng list of prohibited activities. A regulatory
system is used in Korea with minimal written implementatbn.
The Deputy Assistant Secretary concluded that the newly
industrializing economies must "take up the challenge of liber-
alization and opening markets" if more equitable financial
markets are to be established.
Deputy Secretary Rohson Addresses the Mortgage Bankers' Association
Deputy Secretary of the Treasury John E. Robson de-
scribed the economy as "unsatisfactorily sluggish" due to
"forces in the business cycle" while addressing the Mortgage
Bankers' Associatbn. The Deputy Secretary spoke February
3, 1992, to discuss the Administration's proposals for bankreforms aimed in part at strengthening the real estate industry.
He referred to the President's economic growth plan that
includes passive loss relief, using pensbn funds for real estate
investment, extending tax credits to stimulate construction and
refurbish low income rental housing, and cutting the capital
gains tax.
The plan also incorporates a $5,000 credit and penalty
free withdrawal from Individual Retirement Accounts (IRAs)for
first time buyers, and other tax incentives. The plan is intended
to result in increased real estate values and a stronger market.
Concerning the present "credit crunch," the Deputy Sec-
retary said that too little credit has been available to fuel the
130 TREASURY ISSUES
real estate industry, and called on banks to "come out of
hibernation and start lending."
"Banking," he said, "is not risk free and not intended to be
so. And bankers shouH be stepping forward now to make loans
to sound borrowers." Credit crunch guidelines were created by
the four bank regulatory agencies to ensure "balance and good
judgment" in bank and thrift examinatbns. They instruct exam-iners to view real estate values in the long term.
"We cannot have examiners hanging a scarlet letter on
real estate," Deputy Secretary Robson said. The Administra-
tbn supports changes in regulatory law, including flexibility for
the Office of Thrift Supervisksn (OTS) in granting extensbns to
thrifts that must set aside capital against real estate invest-
ments, as well as a reduction in the amount of capital that must
be set aside.
Deputy Secretary Robson blamed the weak banking sys-
tem on antiquated laws that prevent financial health and reduce
international competitiveness. In his argument for fundamental
bank reform, he said that rather than adopting the Administra-
tion's bank reforms Congress has passed "flawed legislation
that imposes more regulation, higher costs, and offers no
opportunity for the banks to strengthen themselves financially."
The Administration's Views on Thrift Institutions' Deductions ofReimbursed Losses
Under capital loss protectbn provisions, the Federal Sav-
ings and Loan Insurance Corporation (FSLIC) agreed to
protect resolved institutions against losses realized on the sale
of or write down on designated assets. Institutbns were gen-
erally reimbursed for the difference between the book value of
an asset and the selling price or the write down value.
Under guaranteed yield maintenance, institutbns were
guaranteed a minimum yield or return on covered assets.
Assistance agreements made in 1988 and 1989 obligated the
FSLIC to make ongoing assistance payments to 91 remaining
institutions resolved in 1988 and 1989 transactbns. Those
institutions take the position that the Government assistance
is deductible for income tax purposes.
February 11 , 1992, Terrill A. Hyde, Deputy Tax Legislative
Counsel for Regulatory Affairs, presented to the House Com-
mittee on Ways and Means the Administration's views on the
extent to whch thrift institutions shoukJ be permitted to deduct
losses reimbursed with tax free Government assistance.
Treasury's "Report on Tax Issues Relating to the 1988/89
Federal Savings and Loan Insurance Corporatbn Assisted
Transactbns" concludes that reimbursed losses should not be
deductible and that the issue is governed by principles of tax
law precluding deductbn of compensatbn by insurance.
The report recommends legislation to clarify deductibility
to avoid the delay and cost of litigation on this issue by the
Internal Revenue Service (IRS). The report determines that the
potential cost to the taxpayer of continuing the incentives to
hoW covered assets and to minimize the value of assets whensokj woukJ outweigh the cost of "creating the perceptbn that
the Government is not adhering to its bargain."
Report to Congress on the Requestfor Additional Fundingfor the Resolution Trust Corporation
The Resolutbn Trust Corporation (RTC) Oversight Board
requested additbnal funds to cover losses, as well as working
capital to finance RTC's acquisitbn of failed thrifts. September
12, 1991, Deputy Secretary of the Treasury John E. Robsonspoke to the House Subcommittee on Financial Institutbns
Supervisbn, Reguiatbn and Insurance, in support of additional
funding for RTC, RTC assetdispositbn, and RTC restructuring.
(The bill has since been passed to the full committee.)
The Board estimated that another $80 billbn in loss funds
woukJ be needed, doubling the amount already authorized. It
also requested that RTC's borrowing limit be raised from $125
billbn to $160 billbn. Also, RTC is requesting an extensbn of
Offbe of Thrift Supervision transfer authority until September
30, 1993, citing a larger than expected case bad. Deputy
Secretary Robson said RTC is "making progress" in meeting
clean-up goals, and that mandated improvements in RTC
management include a uniform Consen/atorship Operatbns
Manual, a soon-to-be-operational computerized securKies
portfolio management system, an assets tracking system, and
standardized contracting policies and procedures.
As of June 30, 1991 , RTC had sob 51 percent of seized
assets, netting $168.2 billion. Also, 73 percent of RTC's book
value of securities has been sob with only a 3 percent loss.
Through August of 1991, RTC has sold $2.5 billbn of its
mortgage-backed securities and is consbering securing com-mercial loans.
The RTC has introduced a portfolb sales program to
increase asset sales due to growing inventories of hard-to-sell
assets and is promoting the sale of single- and multi-family
homes. As of June 30, 1991, 22 percent of its single-family
homes; 10 percent of the multi-family homes had been sob.
Report to Congress on Tax Simplification, Employee Benefits; Proposals Concerning Tax Deposits,
Earned Income Tax Credit, and Pension Coverage and Portability
The Tax Simplificatbn Act of 1991 (S. 1394) is estimated
by the Office of Tax Analysis to be "nearly revenue neutral, with
a bss of $89 millbn in fiscal 1992 and $47 millbn over the
5-year budget period," according to Kenneth W. Gideon, As-
TREASURY ISSUES 131
sistant Secretary of the Treasury for Tax Policy, who addressed
the Senate Subcommittee on Taxatbn and the Committee onFinance on tax simplification proposals pending (S. 1394 andS. 1364) and related proposals September 10, 1991. TheEmployee Benefits Simplification and Expansion Act of 1991
(S. 1364), according to the Administration, would lose approxi-
mately $16 billion in its current form.
Although the Administration believes that simplification of
benefit provlsbns 'can be achieved within the parameters of
the budget agreement,' It opposes legislatbn that loses reve-
nue. Proposed simplification of the empbyment tax deposit
system (H.R. 2775) would require semi-weekly deposits in-
stead of the eight monthly deposits required by the current
system. Also proposed are repeals of 'interaction mles" pre-
venting taxpayers from receiving full benefit of health insurance
credit, the young child credit, and other provisions, and the
simplification of tax laws to expand pensbn coverage andenhance pensbn portability. The proposals also include sim-
plifying and encouraging tax free roll-overs, establishing asimplified empbyee pension program, simplifying the admini-
stration of 401 (k) and other plans, extending 401 (k) plans to
Govemment empbyees and empbyees of tax-exempt organi-
zations, and adopting a uniform vesting standard.
The Administration's Views on a Proposal To Allow U.S. -Controlled Foreign Corporations To Elect
To Be Taxed as Domestic Corporations
The Administration opposes H.R. 2889, whbh would elimi-
nate deferral on income from property imported into the United
States, including profits, commissions, and fees, according to
Philip D. Morrison, Internatbnal Tax Counsel, Department of
the Treasury. He presented to the House Committee on Waysand Means the Administratbn's views on H. R. 2889 and on the
proposed taxing of U.S.-controlled foreign corporatbns on
October 3, 1991.
The Administration's oppositbn stems from the difficulty
in enforcement, the fact that the proposal differs significantly
from the traditional focus, and the lack of impact, due in part to
excess foreign tax credits.
Under the bill, the IRS would be required to trace indirect
sales, as well as determine whether a U.S.-controlled corpo-
ratbn should have ".. . expected at the time of the initial sale
that the property would ultimately be imported into the United
States." Adding to the complexity of these tasks is the fact that
the bill also applies to components incorporated into other
products, which are subsequently imported. Further complicat-
ing enforcement would be the importation of components usedin U.S. manufacturing of products to be exported.
Another concern is that the bill would increase taxes for
U.S.-controlled agricultural or mineral companies that, due to
geographical limitatbns, must operate abroad. The Admini-
stration also expresses reservations concerning the impact of
the bill for companies who import from both high-tax andlow-tax countries.
The Administratbn also opposes U.S. sharehoWers being
allowed to treat U.S.-controlled foreign corporations as U.S.
corporations. It is the Administration's view that, without safe-
guards, a reduction in tax liabilities would result in
approximately $1 .5 billbn in revenue losses over the 5-year
budget window.
Copte* of th« precadlng statement* are avallabi* through the U.S. Department of the Treasuiy , 1 500 Pennsyh/ania Ave., NW., Office of Public Affairs,
Room 231S, Washington, O.C. 20220, telephone number<202) 622-2960.
Integration of the Corporate and Individual Tax Systems
The current tax system taxes corporate profits distributed
to sharehobers at least twice-once at the corporate level and
once at the sharehober level. On January 6, 1992, Treasury
released the "Report of the Department of the Treasury on
Integration of the Individual and Corporate Tax Systems: Tax-
ing Business Income Once," which documents distortbns
created by the double tax and describes several integration
prototypes for taxing corporate income once.
The Report does not contain any legislative recommenda-tbns, but rather is intended to stimulate discussbn of the
prototypes and encourage serbus consideratbn of proposals
for integrating the indivbual and corporate tax systems in the
United States. The report is available from the GovernmentPrinting Office, GPO Stock Number 048-000-00430-0, at a cost
of $14.
Tax Treatment ofDeferred Compensation Under Section 457
Sectbn 457 of the Internal Revenue Code limits the
amount of deferred compensation provbed to empbyees of
tax-exempt organizatbns and State or tocal governments,
according to the "Report to the Congress on the Tax Treat ment
of Deferred Compensatbn Under Section 457," released on
January 7, 1992.
The report summarizes the legislative history and the
underlying policies of sectbn 457, regarding tax-exempt or-
132 TREASURY ISSUES
ganizatbns and concludes that statutory limits are appropriate
because, unlike taxable employers, empbyers that are exemptfrom income taxation have no tax incentive to limit deferred
compensatton. Moreover, section 457 sen/es as an incentive
for tax-exempt empbyers to provide greater benefits through
tax-qualified plans.
The report recommends section 401 (k) cash or deferred
arrangements be extended to nongovernmental, tax-exemptempbyers, as current law does not albw certain tax-exemptempbyers to offer salary reduction plans to their empbyees.
Allocation ofExcess Pension Plan Assets in the Case ofBridge Banks
In response to the requirements of Sectbn 6067(b) of the
Technical and Miscellaneous Revenue Act of 1988, Treasury
released its "Study on the Albcatbn of Excess Pensbn Plan
Assets in the Case of Bridge Banks" January 7, 1992. Thestudy examines conflicting goals of pensbn policy and bankinsurance poHcy in an over-funded defined benefit pensbn plan
sponsored by a bank holding company for the joint benefit of
the employees of the bank holding company and a failing
subsidiary bank. According to the study, the current provision
in the Internal Revenue Code should be amended to require
an equitable allocatbn of the full amount of excess pension
assets whenever a bridge bank receives assets and liabilities
of an insured bank cbsed by regulations.
Report to the Congress on the Tax Treatment ofBad Debts by Financial Institutions
Recently proposed regulatbns generally albw banks and
thrifts to conform their tax and regulatory accounting for the
charge-off of bad debts, according to Treasury's "Report to the
Congress on the Tax Treatment of Bad Debts by Financial
Institutbns,' released on September 16, 1991.
The report studies the criteria to be used in determining
whether a debt is worthless for Federal tax purposes and
specifcally considers circumstances under which a conclusive
or rebuttable presumptbn of worthlessness is appropriate.
The report concludes that conformity of tax and regulatory
treatment should not apply to accrued but unpaid interest onloans that are placed in nonaccrual status for regulatory pur-
poses.
The report further states that extensbn of the conformity
rules to unregulated lenders would be a significant departure
from settled policy and practice that should be left to Congress
to consider.
Copl«softhss«raportsmay bs purchased from th* National Tachnlcal Infomiatlon Service, S2B5 Port Royal Road, Springfield, VA 22161
telephone number (703) 467-4660.
Revenue Impact ofProposed Capital Gains Tax Reductions
In recent years, a considerable amount of debate hascentered on the likely effect of a decrease in the capital gains
tax. While analysis of the issue has been split between two
approaches-estimating aggregate responsiveness of capital
gains real'izatbns, as well as focusing on individual taxpayer
responsiveness-neither has provided conclusive evidence to
decide the issue.
Research Paper No. 9003. "The effect of Marginal Tax
Rates on Capital Gains Revenue: Another Look at the Evi-
dence," by Robert Gillingham and John 8. Greenlees (Office
of Economic Polby, Department of the Treasury), focuses on
aspects of the debate. The authors define the responsiveness
of revenue to tax rates at the individual and aggregate levels.
Citing an analysis by the Congressbnal Budget Office they
present an econometric data analysis procedure.
The study also includes time-series evidence incorporat-
ing revisbns in the National Accounts and Fbw of Funds data
to demonstrate the effect of the Tax Reform Act of 1 986 on the
estimated relatbnship.
The aim of the paper is to give a better understanding of
the relatbnship among capital gains tax realizations, revenues,
and tax rates. And although analyses do not give conclusive
evidence on the effect of proposed tax rate changes, the
authors conclude that the evidence does not suggest that a tax
reduction woub decrease tax revenues.
* * * * *
A related study concludes that a capital gains tax reduction
woukJ increase the number and anfKiunts of such gains de-
clared by taxpayers. And it would do so in suffbient amountsto increase tax revenues. Research Paper No. 9004, "An
Econometric Model of Capital Gains Realizatbn Behavbr," by
Robert Gillingham, John S. Greenlees, and Kimberly D. Zi-
eschang (Offbe of Prices, Bureau of Labor Statistics), expbres
the revenue impact of proposed reductbns In capital gains
taxation, as well as the expected response of taxpayers.
The marginal tax rate on long-term gains has a negative
impact on both the proportbn of taxpayers realizing capital
TREASURY ISSUES 133
gains and on the value of those gains declared, according to
the study. The researchers further stated that there was noevidence that income switching as a result of the reduct'ons
would offset expected tax revenue increases. The study in-
cludes taxpayer data covering three historical tax policy
regimes that varied widely in their treatment of capital gains.
The authors supported their predictions by citing a 1988study finding, in the past, the majority of capital gains were
never realized for tax purposes. That 1988 study found only
3.1 percent of the stocl< of accrued gains realized each yearbetween 1960-84. This large ftaw of unrealized gains, accord-
ing to the authors, supports their conclusion that a reduction in
the capital gains tax would yield a permanent increase in
government revenues.
(For related studies on the capital gains tax issue, seeResearch Paper Nos. 8801 and 9002.)
Report on Social Security and the Public Debt
For the next 25 years, the social security program is
expected to have average surpluses of .6 percent of GrossNational Product (GNP), according to James E. Duggan'sResearch Paper No. 9102. After that, the senior economist
says, deficits will reach 1 .7 percent of GNP (4 percent afterthe
addition of health care). These deficits could result in large.
unstable debt ratbs and may affect future U.S. debt policy. Thestudy stresses the public debt implications of the long-run
financial status of the program and presents three alternatives,
or combinations thereof, for financing Social Security obliga-
tions. James E. Duggan is a senbr economist. Office of
Economic Policy, U.S. Department of the Treasury.
Coptocof th**«re*«aich papers may b* obtained by writing to Shiriey Bryant, US. Dapartmant of the Traaaury, 1 5th & Pennsylvania Avenue, NW.,Room 4422, Washington, D.C. 20220; phone (202) 622-2110.
134 TREASURY ISSUES
RESEARCH PAPER SERIES
Available Through the Office of the Assistant Secretary for Economic Policy
8701
.
"The Empirical Reliability of Monetary Aggregates as indicators: 1983-1987." iVIIchael R. Darby, Angelo R. Mascaro,and Michael L. Marlow.
8702. "The Impact of Government Deficits on Personal and National Saving Rates." Michael R. Darby, Robert Giilingham,
and John 8. Greenlees.
8703. "The Ins and Outs of Unemployment: The Ins Win." Michael R. Darby, John C. Haltlwanger, and Mari< W. Plant
8704. "Accounting for the Deficit: An Analysis of Sources of Change In the Federal and Total Government Deficits."
Michael R. Darby.
8801. "The Direct Revenue Effects of Capital Gains Taxation: A Reconsideration of the Time Series Evidence." Michael
R. Darby, Robert Giilingham, and John S. Greenlees.
9001. "Some Economic Aspects of the U.S. Health Care System." James E. Duggan.
9002. "Historical Trends In the U.S. Cost of Capital." Robert Giilingham and John S. Greenlees.
9003. "The Effect of Marginal Tax Rates on Capital Gains Revenue: Another Look at the Evidence." Robert Giilingham
and John S. Greenlees.
9004. "An Econometric Model of Capital Gains Realization Behavior." Robert Giilingham, John S. Greenlees, andKImberly D. Zleschang.
9101
.
"The Impact of Government Deficits on Personal and National Saving Rates." (Revised) Michael R. Darby, Robert
Giilingham, and John S. Greenlees.
9102. "Social Security and the Public Debt." James E. Duggan.
Copiss of th»*« rssaarch papers may b« obtalnad by writing to Shiriey Bryant, U.S. Ospartment of the Treasury, 1 5th & Pennsyhrania Avenue, NW.,
Room 4422, Washington, D.C. 20220; phone (202) 622-2010.
TREASURY ISSUES 135
Index
Previous Treasury Issues articles are listed below by subject, title, Issue, and page.
DOMESTIC FINANCE
"Findings of ttie Joint Report on the Government Securltl» Market Revealed by Assistant Secretary for DomesticFinance." Powell, Jerome H. March 1992, pp. 18-19.
Findings of the review of the Government Securities Marl<et undertal<en by Treasury, the Federal Reserve, and the
Securities Exchange Commission, after the admission of wrongdoing by Salomon Brothers.
"Assistant Secretary for Domestic Finance Jerome H. Powell Talks About the Latest Developments In the GovernmentSecurities Market;" "Recent Changes to Treasury Auctions and Rules;" and "Auction Violations Lead to Closer Scrutiny
of the Government Securities Market" Powell, Jerome H. December 1991, pp. 3-13.
Exclusive interview in which the Assistant Secretary for Domestic Finance expands on the Salomon Brothers' auction
violations and their effects; recent auction changes; a summary of Powell's September statement to Congress.
ECONOMIC POLICY
"Secretary of the Treasury Discusses the President's Economic Proposals, The." Brady, Nicholas F. March 1992,
pp. 12-17.
A summary of Secretary Brady's address to the House Committee on Ways and Means concerning the economic
proposals announced by President Bush in his State of the Union address and detailed in the President's budget for fiscal 1993.
"Moderate Growth Projected for U.S. Economy." Jones, Sidney L. September 1 991 , pp. 3-4.
An article by the Assistant Secretary of the Treasury for Economic Policy on projected economic growth and recovery
from the ninth postwar recession.
INTERNATIONAL AFFAIRS
"Treasury Official Tells Congress Dropping Japanese Market Will Not Significantly Affect Independent U.S. Stock
Market." Powell, Jerome H. June 1992, pp. 3-7.
Excerpt from a statement given by then Assistant Secretary of the Treasury for Domestic Finance Jerome H. Powell
addressing the possible effect of recent economic and financial developments in Japan on the U.S. economy.
"New OECD Tied AkI Agreement Expected to Benefit U.S. Exporters Says Deputy Assistant Secretary For Trade andInvestment Policy William E. Barreda." Barreda, William E. March 1992, page 3.
Interview summarizing the tied aid rules recently agreed to by the Organization for Economic Cooperation andDevelopment designed to reduce trade distortions.
"Foreign Partlclpatton In U.S. Futures Markets Grows." Cayton, Michael. March 1992, pp. 7-11.
This first of a kind Treasury report on the scope of foreign participation in the U. S. futures market previews some of the
information included in the upcoming release of the Foreign Investment Portfolio Survey.
"Director of the Office for Trade Finance William L. McCamey Explains New OECD Agreement to Congress." McCamey,William L. March 1992, pp.4-6.
Summary of statement to Congress by the Director of the Office of Trade Finance detailing the tied aid agreement.

Glossary 137
Expanded, With References to Applicable Sections and Tables
Accrued discount (SBN-1, -2, -3)-lnterest that accumulates onsavings bonds from the date of purcnase until the date of redemptionor final maturity, whichever comes first. Series A, B, C, D, E, EE, F, andJ are discount or accrual type bonds-meaning principal and interest
are paid when bonds are redeemed. Series G, H, HH, and K arecurrent-income bonds, and the semiannual interest paid to their hold-
ers Is not included in accrued discount
Amounts outstanding and In circulation (USCC)-lncludes all is-
sues by the ButBau of the Mint purposely intended as a medium of
exchange. Coins sold by the Bureau of the Mint at premium prices areexcluded; however, uncirculated coin sets sold at face value plus
handling charge are included.
Average discount rate (PDO-2, -3)-ln Treasury bill auctions, pur-
chasers tender competitive bids on a discount rate basis. The averagediscount rate is the weighted, or adjusted, average of ail bids acceptedin the auction.
Budget authority ("Federal Fiscal Operatlons")-Congress passeslaws giving budget authority to Government entities, which gives the
agencies me power to spend Federal funds. Congress can stipulate
various criteria for the spending of these funds. For example, Congresscan stipulate that a given agency must spend within a specific year,
number of years, or any time in tne future.
The basic forms of budget authority are appropriations, authority to
borrow, and contract auttiority. The period of time during which Con-gress makes finds available may be specified as 1 -year, multiple-year,
or no-year. The available amount may be classified as either definite
or indefinite; a specific amount or an unspecified amount can be madeavailable. Autfiority may also be classified as current or permanent-Permanent authority requires no current action by Congress.
Budget deflcit-The total, cumulative amount by which budget outlays
(spending) exceed budget receipts (income).
Capital ("Federal Obllgatlons")-Assets, such as land, equipment,and financial reserves.
Cash management bills (PDO-2)-Marketable Treasury bills of irregu-
lar maturity lengths, sold periodically to fund short-term cash needs of
Treasury. Their sale, having higher minimum and multiple purchaserequirements than those of omer issues, is generally restricted to
competitive bidders.
Competitive tenders ("Treasury Financing Operatiorra">-A bid to
purchase a stated amount of one Issue of Treasury securities at aspecified yield or discount. The bid is accepted if it is within the rangeaccepted in tiie auction. (See Noncompetitive tenders.)
Coupon l88ue-The issue of bonds or notes (public debt).
Currency no longer Issued (USCC)-Old and new series gold andsilver certificates. Federal Reserve notes, national bank notes, and1890 Series Treasury notes.
Current Income bonds ("U.S. Savings Bonds and Notes")-Bondspaying semiannual interest to holders. Interest Is not induded in
accrued dscounL
Debt outstanding subject to limitation (FD-6>-The debt incurred bythe Treasury subject to the statutory limit set by Congress. Until WoridWar I, a specific amount of debt was authorized to each separatesecurity Issue. Beginning with the Second Liberty Loan Act of 1917,
ttie nature of the limitation was modified until, in 1 941 , it developed into
an overall limit on ttie outstanding Federal debt In 1991 , the debt limit
was $4,145,000 million; the limit may change from year to year.
The debt subject to limitation includes most of Treasury's public debtexcept securities Issued to the Federal Financing Bank, upon whichthere is a limitation of $1 5 billion, and certain categories of older debt(totaling approximately $595 million as of February 1991).
Discount-The interest deducted In advance when purchasing notesor bonds. (See Accrued discount)
Discount rate (PDO-2)-The difference between par value and the
actual purchase price paid, annualized over a 360-day year Becausethis rate is less than the actual yield (coupon-equivalent rate), the yield
should be used in any companson with coupon issue securities.
Dollar coins (USCC)-lnclude standard silver and nonsilver coins.
Domestic series (FD-2)-Nonmari<etable, interest and non-interest-
bearing securities issued periodically by Treasury to the ResolutionFunding Corporation (RFC) for investment of funos authorized undersection 21 B of the Federal Home Loan Bank Act (12 U.S.C. 1441b).
Federal Intratund transactions ("Federal Fiscal Operatlons")-ln-trabudgetary transactions in which payments and receipts both occurwithin me same Federal fund group (Federal funds or taist funds).
Federal Reserve notes (USCC)-lssues by the U.S. Government to
the public through the Federal Resen/e tanks and theirmember banks.They represent money owed by the Government to the public. Cur-rently, the item "Federal Reserve notes-amounts outstanding' con-sists of new series issues. Tlie Federal Reserve note is the only class
of cunency cunently issued.
Foreign ("Foreign Currency Positions," IFS-2. -3)-(intemational)
Locations other man those included under the definition of the United
States. (See United States.)
Foreigner ("Capital Movements," IFS-2)-AII institutions and indi-
viduals living outside the United States, including U.S. citizens living
abroad, and"branches, subsidiaries, and other affiliates abroad of U.S.
banks and business concerns; central governments, central banks,
and ottier official institutions of countries other than the United States,
and international and regional organizations, wherever located. Also,
refers to persons in the iJnited States to the extent that they are knownby reportng institutions to be acting for foreigners.
Foreign official Institutions ("Capital Movements")-Includes cen-tral governments of foreign countnes, including all departments andagencies of national governments; central banks, exchange authori-
ties, and all fiscal agents of foreign national governments that under-
take activities similar to those of a treasury, central bank, or stabilization
fund; diplomatic and consular establishments of foreign national gov-ernments; and any intemational or regional organization, including
subordinate and affiliate agencies, created by treaty or conventionbetween sovereign states.
Foreign public twrrower ("Capital Movements")-lncludes foreign
officiaJ institutions, as defined above, the corporations and agenciesof foreign central governments, including development bariks andinstitutions, and other agencies that are majority-owned by the central
government or its departments; and state provincial and local govern-ments of foreign countries and their departments and agencies.
Foreign-targeted Issue (PDO-1, -3)-ForBign-targeted issues werenotes sold between October 1984 and February 1986 to foreign
institutions, foreign branches of U.S. institutions, foreign central banksor monetary authorities, or to intemational organizations in which the
United States held membership. Sold as companion issues, they couldbe converted to domestic (normal) Treasury notes with the samematurity and interest rates. Interest was paid annually.
Fractional coins (USCC)-Coins minted in denominations of 50, 25,
and 10 cents, and minor coins (5 cents and 1 cent).
Government account series (FD-2)-Certain trust fund statutes re-
quire the Secretary of ttie Treasury to apply monies held by these fundstoward the issuance of nonmarketable special securities. These secu-rities are sold directly by Treasury to a specific Government agency,tmst fund, or account. Their rate is based on an average of martlet
yiekis on outstanding Treasury obligations, and they may be redeemedat the optron of the holder Roughly 80 percent of these are issued to

138 Glossary
five holders: the Federal old-age arxJ survivors insurance tnjst fund;
the civil service retirement and disability fund; the Federal hospital
Insurance tmst fund; the military retirement furid; and ttie unemploy-ment trust fund.
international Monetary Fund ("Exchange StatMtlzaUon Fund,"iFS-l)-(IMF) Established by the United Nations, the IMF promotesinternational trade, stability of exchange, and monetary cooperation.
Members are allowed to draw from the fund.
Interfund transactions ("Federal Fiscal OperatIon8"V-Trans-ac-
tions in which payments are made from one fund group (either Federal
funds or trust finds) to a receipt account In another group.
Intrabudgetary transactions ("Federal Fiscal Operations")-Theseoccur when payment and receipt tx>th occur within the budget, or whenpayment is made from off-budget Federal entities whose budgetauthority and outlays are excluded from the budget totals.
Majority-owned foreign partnerships ("Foreign Currency Posl-
tlons")-PartnersNps organized under ttie laws oTa foreign country in
which one or more U.S. nonbanking concerns or nonprofit Institutions,
directly or IndirscUy, owns more than 50 percent profit Interest.
Majority-owned foreign subsidiaries ("Foreign Currency Posi-
tlon8")-Foreign corporations in which one or more nont)ankinq busi-
ness concerns or nonprofit Institutions located in the United States,
directly or Indirectly, owns stock with more than 50 percent of the total
combined voting power, or of the total value of all classes of stock.
Matured nort-lnterest-t>earing detn (SBN-1, -2, -3)-The value of
outstanding savings bonds ancfnotes that have reached final maturity
and no longer earn Interest. Includes all Series A-D, R G, J, and Kbonds. Series E bonds (Issued between May 1941 and November1965), Series EE (Issued since January 1980), Series H (issued from
June 1952 through Decemlser 1979), and savings notes Issued t>e-
tween May 1987 and October 1970 have a final maturity of 30 years.
Series HH bonds (issued since January 1 980) mature after 20 years.
Noncompetitive tenders ("Treasury Financing Operatlon8")-Of-fers by an Investor to purchase Treasury securities at the price equiva-
lent to the weiqhted average discount rate or yield of acceptedcompetitive tenders in a Treasury auction. Noncompetitive tenders are
always accepted in full.
Obligation ("Federal Obllgatlon8")-An unpaid commitment to ac-
quire goods or services.
Off-budget Federal entities ("Federal Fiscal Operatlons")-Feder-ally owned and controlled entitles whose transactions are excluded
from the Ixidget totals under provisions of law. Their receipts, outlays,
and surplus or deficit are not included In budget receipts, outlays, or
deficits. Their Ixidget authority Is not Included in totals of the budget.
Own foreign offices ("Capital Movements">~Refer3 to U.S. report-
ing institutions' parent organizations, branches and/or majority-ownedsubsidiaries located outside the United States.
Outlays ("Federal Rscal Operatlon8")-(expendlturBs, net dislxirse-
ments) Payments on obligations in the form of cash, checks, the
issuance or bonds or notes, or the maturing of Interest coupons.
Par vaiue-The face value of Isonds or notes, including interest.
Quarterly financing ("Treasury Financing Operations")- Treasury
Inas historically offered packages of several "coupon" security Issues
on tfie 15th of February, May, August, and November, or on tfie next
working day. These Issues currency consist of a 3-year note, a 1 0-year
note, and a 30-year bond. Treasury sometimes offers additional
amounts of outstanding long-term notes or bonds, rather than selling
new security Issues. (See Reopening.)
Receipts ("Federal Fiscal Operations")-Funds collected from sell-
ing land, capital, or services, as well as collections from the public
(budget receipts), such as taxes, fines, duties, and fees.
Reopening (PDO-3, -4)-The offer for sale of additional amounts of
outstanding issues, rather than an entirely new Issue. Areopened Issuewill always have the same maturity date, CUSIP-numt)er, and Interest
rate as the original Issue.
Short-term ("Foreign Currency Po8ltlon8")-Securitie3 maturing In
1 year or less.
Special drawing rights ("Exchange Stabilization Fund," IFS-1)-Intemational assets created by IMF fat serve to Increase International
liquidity and provkie additional International reserves. SDRs may bepurchased and sold among ellgitile holders through IMF. (See IMF.)
SDR allocations are the counterpart to SDRs issued t)y IMF basedon members' quotas in IMF. Although shown In exchange stabilization
fijnd (ESF) statements as lialsillties, they must be redeemed by ESFonly in the event of liquidation of, or U.S. withdrawal from, the SDRdepartment of IMF or cancellation of SDRs.
SDR certificates are issued to the Federal Reserve System against
SDRs when SDRs are legalized as money Proceeds of monetization
are deposited Into an ESF account at the Federal Resen/e Bank of
New Yorit
Spot ("Foreign Currency Po8ltion8")-Due for receipt or delivery
within 2 wort<aays.
State and local government series (FD-2V-(SLUG3) Special non-mart<etable certificates, notes, and bonds offered to State and local
governments as a means to invest proceeds from theirown tax-exemptfinancing. Interest rates and maturities comply with IRS artDJtrage
provisions. SLUGS are offered in txDth time deposit and demanddeposit forms. Time deposit certificates hiave matunties of up to 1 yearNotes mature In 1 to 1 years and bonds mature In more than 1 years.
(Demand deposit securities are 1 -day certificates rolled over wnth a rate
adjustment daily
Statutory debt limit (FD-6)-By Act of Congress there is a limit, either
temporary or permanent, on the amount of public debt that may beoutstanding. When this limit Is reactied. Treasury may not sell new debt
Issues unbT Congress Increases or extends tfne limit. For a detailed
listing of changes in the limit since 1941 , see the Budget of the United
States Government. (See Debt outstanding subject to limitation.)
STRIPS (PDO-1, -3)-Separate Trading of Registered Interest andPrincipal Securities. Long-term notes and bonds may t3e divided Into
principal and Interest-paying components, wfiich may be transferred
and soW In amounts as small as $1 ,000. STRIPS are sold at auction
at a minimum par amount, varylrig for each Issue. The amount Is anarithmetic function of the issue s interest rate.
Treasury biiis-Tlie shortest term Federal security (maturity datesnormally varying from 3 to 12 months), they are sold at a discount
Trust fund transaction ("Federal Rscal Operatlons")-An Intra-
budgetary transaction In which toth payments and receipts occur
within the same trust fund group.
United States-Includes the 50 States, District of Columbia, Common-wealth of Puerto Rico, American Samoa, Midway Island, Virgin Islands,
Wake Island, and all other territories and possessions.
U.S. notes (USCC)-Legal tender notes of five different Issues: 1862($5-$1 ,000 notes); 1 862 ($1 -$2 notes); 1 863 ($5-$1 ,000 notes); 1 863($1 -$10,000 notes); and 1901 ($10 notes).
Woridwide ("Foreign Currency Posltlon">-Sum of "United States'
and "foreign trade.
zlri!2 Eo
cc
<LUCCHLU
o
LU
CC<a.LUQLU


O'der Processing Code
*6359 VISA
Superintendent of Documents Publications Order FormCharge your order.
It's easy!
LJ YES, please send me the following indicated publications: To fax your orders and inquiries -(202) 275-0019
copies of CONSOLIDATED FINANCIAL STATEMENTS OF THE UNITED STATES GOVERNMENT,FISCAL YEAR 1991 S/N 048-000-00436-9 at $3.75 each.
I I Please send me your Free Catalog of hundreds of bestselling Government books.
The total cost of my order is $ (International customers please add 25%.) Prices include regular domestic postage andhandling and are good throughl2/93. After this date, please call Order and Information Desk at 202-783-3238 to verify prices.
Please Choose Method of Favnient:
(Company or personal name) (Please type or print)
(Additional address/attention line)
I I Check payable to the Superintendent of Documents
I I GPO Deposit Account DI I
VISA or MasterCard Account
(Street address)
(City, State, ZIP Code)
( )
(Daytime phone including area code)
Information about the Superintendent of Documents Subscription Service
Current Subscribers
To know when to expect your renewal notice and keep a good thing coming ... to keep subscription prices down, the
Government Printing Office mails each subscriber only one renewal notice . You can learn when you will get your renewal
notice by checking the number that follows ISSDUE on the top line of your label as shown in this example :
When this digit is 0. a renewal notice/ 7.. will be sent.
. TRBU SMITH212J ISSDUEOOO R 1
. JOHN SMITH
. 212 MAIN ST
. FORESTVILLE MD 20747
When that number reads ISSDUEOOO, you have received your last issue unless you renew. You should receive your renewal
notice around the same time that you receive the issue with ISSDUEOOO on the top line.
To be sure that your service continues without interruption, please return your renewal notice promptly. If your subscription
service is discontinued, simply send your mailing label from any issue to the Superintendent of Documents, Washington, DC20402-9372 with the proper remittance, and your service will be reinstated.
To change your address . . . please SEND YOUR MAILING LABEL, along with your new address, to the Superintendent of
Documents, Attn: Chief, MaU List Branch, Mail Stop: SSOM, Washington, DC 20402-9373.
To inquire about your subscription service . . . please SEND YOUR MAILING LABEL, along with your correspondence, to
the Superintendent of Documents, Attn: Chief, Mail List Branch, Mail Stop: SSOM, Washington, DC 20402-9375.
New Subscribers
To order a new subscription . . . please use the order form provided below.
Order Processing Code:
*6160
Superintendent of Documents Subscriptions Order Form
Charge your orderIt's Easy!
^ffl

rr
i
'-^'^su^y
LI3M^y

\'!f-.
DEPARTMENT OF THE TREASURYFINANCIAL MANAGEMENT SERVICE
OFFICE OF THE COMMISSIONERWASHINGTON, D.C. 20227
OFFICIAL BUSINESSPENALTY FOR PRIVATE USE, $300
FIRST-CLASS MAILPOSTAGE & FEES PAIDDepartment of the Treasury
Permit No. G-4
New this issue
PROFILE OF THE ECONOMYConsumer Prices
Consumer prices rose .1 percent in July ; food and apparel prices edged down slightly, shelter
costs remained constant, and energy prices went up. The core rate-nonfood, nonenergy index-
increased by .2 percent, the same as the past 2 months. That index is used to measure "core
inflation," and it has not grown by less than that percentage in nearly a decade. In 1992, the
series is up at an annual rate of 3.6 percent, off from 4.4 percent (1 991 ) and 5.2 percent (1 990).
16
All items
Excluding food and energy
80 81 82 83 84 85 86 87 88 89 90 91 92
(Percent change from a year earlier)