Embed Size (px)
Citation preview

1
Treasury Wine Estates
Interim 2017 financial result
Treasury Wine Estates will host an investor and media webcast and conference call commencing at 11:00am
(AEDT) on 14 February 2017 (dial-in details below). The webcast and presentation material will be available
at www.tweglobal.com. A replay of the presentation will also be available on the website from approximately
1:00pm.
TELECONFERENCE DIAL IN NUMBERS:
Participant Passcode 464017 Dial In:
Australia-wide 1800 558 698 Australia – NSW 02 9007 3187 UK 0 800 051 8245 USA (855) 881 1339 USA – New York (914) 202 3258 Canada 855 881 1339 China 4001 200 659 France 0800 913 848 Hong Kong 800 966 806 Italy 800 793 500 Japan 0053 116 1281 New Zealand 0800 453 055 Norway 800 69 950 Singapore 800 101 2785 Sweden 020 791 959 Switzerland 0800 820 030

2
MEDIA RELEASE 14 February 2017
Net Profit after Tax and EPS more than double the prior year1 Premiumisation and momentum across all regions
Treasury Wine Estates Ltd (ASX:TWE) today announced its interim 2017 financial result, with Reported Net
Profit After Tax (NPAT) and Earnings Per Share (EPS) more than double the previous corresponding period2
(pcp) with NPAT at $136.2m and EPS at 18.5 cents per share.
TWE reported Earnings Before Interest, Tax, SGARA and material items (EBITS) of $226.8m, up 58.8% on
a reported currency basis.
The Company also delivered outstanding EBITS margin accretion, up 4.3ppts to 17.5% in 1H17 and up
2.5ppts relative to TWE’s F163 EBITS margin of 15.0%, which included 6 months of the Diageo Wine
contribution.
The Board declared an interim dividend of 13.0 cents per share; representing a 5 cent per share increase
(+63%) and a 64% payout ratio.
On today’s result, TWE’s Chief Executive Officer, Michael Clarke commented: “I am delighted to report a
strong interim 2017 financial result highlighted by further margin accretion, excellent cash conversion and
outstanding EPS growth, despite the higher share base. All regions delivered double digit EBITS growth and
importantly, growth was delivered sustainably”.
Australia & New Zealand (ANZ) reported 13.2% EBITS growth to $53.1m and an EBITS margin of
16.4%, driven by above-category volume growth in Australia (despite reallocating Luxury Australian
wine to Asia), outstanding marketing and in-store activation, strengthened customer partnerships and
a low cost culture
Europe reported 34.3% EBITS growth to $23.1m and an EBITS margin of 12.3%, driven by strong
customer partnerships, focused brand building investment on core Commercial brand tiers and the
acquisition of Diageo Wine
Asia reported 75.6% EBITS growth to $79.0m and an EBITS margin of 36.2%. Reflecting continued
investment in TWE’s business models, customer partnerships and brand portfolio, volume increased
strongly and price increases across key brands delivered positive NSR per case growth
Americas reported 75.4% EBITS growth to $90.7m and an EBITS margin of 16.0% reflecting the
acquisition of Diageo Wine and portfolio premiumisation. During the period, TWE front-ended a 30%
increase in Advertising & Promotion (A&P) per case to re-set and refresh its US brand portfolio to
position it for growth in both the US and in Asia in 2H17. Also included in 1H17 EBITS was a net, one-
off $5m benefit, principally reflecting profit on asset sales
TWE’s Supply Chain Optimisation initiative delivered Cost of Goods Sold (COGS) savings of $15m in 1H17
bringing the total cumulative savings to $56m, driven by realisation of cost reductions and benefits from
production asset optimisation. This was partially offset by higher vintage costs from the 2014 and 2015
vintages in Australia and the 2015 vintage in the US.
The acquisition of the Diageo Wine business on 1 January 2016 has already delivered positive upside to
TWE, despite the significant investment in re-setting the brands as well as addressing unsustainable volume
1 Statutory Net Profit After Tax and Reported EPS (including material items) 2 Unless otherwise stated, all Dollar and percentage movements are pre material items and stated on a reported currency basis 3 To reflect the change in accounting standards with respect to Agricultural Assets, F16 EBITS have been restated to $334m (from $342m) on a reported currency basis
3
and customer contracts in F16. As stated at the time of acquisition, the rationale for acquiring Diageo Wine
was to secure increased access to Luxury and Masstige fruit which would in turn, deliver immediate portfolio
mix benefits to TWE’s US business. The immediate portfolio mix benefit of the acquisition is evident in the
America’s 1H17 result.
Having commenced a number of Supply Chain integration initiatives, TWE is well positioned to deliver run-
rate, cash synergies of US$35m by F20.
TWE targets financial metrics that are consistent with an investment grade credit profile. TWE’s balance
sheet continues to provide the Company with the flexibility to pursue value accretive opportunities for
shareholders, with net debt / EBITDAS (adjusted for operating leases) of 1.5x and interest cover of 16.0x.
Continued strong cash conversion of 104% in 1H17 was driven by TWE’s strong operating performance
across all regions and favourable movements in working capital.
In addition to TWE’s interim 2017 result, TWE also advised today the appointment of Gunther Burghardt, as
the Company’s Chief Financial Officer (CFO), based in Napa. In addition, Matt Young, TWE’s current
Financial Controller has been promoted to Deputy CFO, based in Southbank.
Michael Clarke will be co-locating between Australia and the US over the next 12 months. On Mr Clarke’s
co-location, TWE’s Chairman, Paul Rayner commented: “With a global and highly collaborative Management
team, I am pleased our Chief Executive Officer is able to spend more time in the US; one of TWE’s regions
with the most potential.”
Future perspectives
The outlook for TWE remains positive, with the Company continuing to deliver against its strategy of
transitioning from an agricultural to a brand-led, high performance organisation.
Absent significant fluctuations in foreign exchange rates, TWE expects 2H17 EBITS to be broadly in line with
1H17.
Beyond F17, TWE is on track to deliver total, run-rate cash synergies recognised from the acquisition of
Diageo Wine of US$35m by F20 as well as at least $100m of run-rate COGS savings by F20 driven by the
Company’s Supply Chain Optimisation initiative.
Furthermore, TWE is also on track to deliver a high-teens EBITS margin by F18 and at the same time, deliver
enhanced value to shareholders via improved Return On Capital Employed.
Michael Clarke commented on TWE’s future prospects: “Today’s result announcement demonstrates that we
are executing on all the initiatives we have communicated to the market and importantly, that TWE is
continuing to deliver sustainable value to its shareholders”.
Contacts / further information:
Media Investors
Carolyn Coon Jane Betts Tel: +61 3 8533 3923 Tel: +61 3 8533 3493 Mob: +61 405 183 628 Mob: +61 437 965 620

4
Profit Report Financial Performance
Financial headlines4,5
• Net Sales Revenue (NSR) up 20% on a reported currency basis
and by 24% on a constant currency basis6
• EBITS $226.8m, up 59% on a reported currency basis and 69%
on a constant currency basis
• 4.3ppts EBITS margin accretion to 17.5% on a reported
currency basis
• Strong uplift in Net Profit after Tax, Reported EPS and EPS
(before material items & SGARA)
• Strong cash conversion at 104%
• Net debt7 / EBITDAS, adjusted for operating leases 1.5x and
interest cover 16.0x8
Business headlines
• Margin accretion delivered by acquired business and strong
portfolio premiumisation (notably in the US), enhanced price
realisation, accelerated growth in Asia, Supply Chain savings
and lower Cost Of Doing Business margin
• All four regions delivered double digit EBITS growth
• Re-set of US brand portfolio supported by 30% higher A&P per
case, front-ended in 1H17; portfolio positioned for growth in US
and Asia in 2H17
• Strengthened partnerships with wholesale and retail customers
in all regions supported by outstanding global marketing
campaigns and in-region sales execution
• Sale of non-priority Commercial (NPC) brand portfolio9 in July
2016; comprising approximately 1m cases sold annually
• TWE recognised a cumulative run rate supply chain savings of
$56m; of which $15m was recognised in 1H17
Dividend
• Interim dividend 13.0 cents per share, unfranked, 5 cents per
share higher than the pcp (up 63%)
• Dividend pay-out ratio 64%; consistent with dividend policy10
Outlook
• Absent significant fluctuations in foreign exchange rates, TWE
expects 2H17 EBITS to be broadly in line with 1H17
• Total cash synergies recognised from the acquisition of Diageo
Wine to reach a run-rate of US$35m by F20
• Total COGS savings from TWE’s Supply Chain Optimisation
initiative to reach a run-rate of at least $100m by F20
• High-teens EBITS margin by F18
4 Financial information in this report is based on reviewed financial statements. Non-IFRS measures have not been subject to audit or review. The non-IFRS measures are used internally by Management to assess the operational performance of the business and make decisions on the allocation of resources 5 Comparative balances have been restated to reflect the final purchase price allocation for the Diageo acquisition, reallocation of inter-regional corporate and IT costs, and a change in accounting standards relating to Agricultural Assets. Refer to Appendix 1 6 Unless otherwise stated all percentage or Dollar movements from prior periods are pre any material items and on a constant currency basis 7 Borrowings increased by $3.6m (1H16: $5.3m, F16: $12.7m) to reflect a fair value hedge of a portion of US Private Placement notes 8 Interest cover calculated as the ratio of earnings to net interest expense, where earnings is the consolidated pre-tax profit (pre material items and SGARA) plus the sum of the amount of net interest expense adjusted for amortised interest costs, per financial covenants 9 Divested NPC brands include: Little Penguin, Stone Cellars, Cellar No 8, Colores Del Sol, Black Opal, Century Cellars, Great American Wine Company, Chateau La Paws, Once Upon A Vine, Rosenblum, Snapdragon and Orogeny 10 TWE targets a dividend payout ratio of between 55%-70% of Net Profit After Tax (pre-material items and SGARA) over a fiscal year
$Am (unless otherwise stated) 1H17 1H16 Change 1H16 Change
Volume (m 9L cases) 18.7 15.8 18.7 % 15.8 18.7 %
Net sales revenue 1,294.7 1,079.4 19.9 % 1,041.9 24.3 %
NSR per case ($) 69.08 68.38 1.0 % 66.01 4.7 %
Other Revenue 73.7 58.6 25.8 % 58.9 25.1 %
Cost of goods sold (867.8) (739.7) (17.3)% (718.6) (20.8)%
Cost of goods sold per case ($) 46.31 46.86 1.2 % 45.52 (1.7)%
Gross profit 500.6 398.3 25.7 % 382.2 31.0 %
Gross profit margin (% of NSR) 38.7% 36.9% 4.9 % 36.7% 5.4 %
Cost of doing business (273.8) (255.5) (7.2)% (248.1) (10.4)%
Cost of doing business margin (% of NSR) 21.1% 23.7% 2.6ppts 23.8% 2.7ppts
EBITS 226.8 142.8 58.8 % 134.1 69.1 %
EBITS margin (%) 17.5% 13.2% 4.3ppts 12.9% 4.6ppts
SGARA (10.5) (14.5) 27.6 % (14.3) 26.6 %
EBIT 216.3 128.3 68.6 % 119.8 80.6 %
Net finance costs (13.1) (7.5) (74.7)% (7.7) (70.1)%
Tax expense (60.4) (35.2) (71.6)% (34.6) (74.6)%
Net profit after tax (before material items) 142.8 85.6 66.8 % 77.5 84.3 %
Material items (after tax) (6.1) (26.9) 77.3 % (26.7) 77.2 %
Non-controlling interests (0.5) (0.1) NM (0.1) NM
Net profit after tax 136.2 58.6 132.4 % 50.7 NM
Reported EPS (A¢) 18.5 8.5 117.6 %
Net profit after tax (before material items and
SGARA)148.6 94.3 57.6 % 87.3 70.2 %
EPS (before material items and SGARA) (A¢) 20.2 13.7 47.4 %
Average no. of shares (m) 736.6 690.7
Dividend (A¢) 13.0 8.0
Reported
Currency
Constant
Currency
5
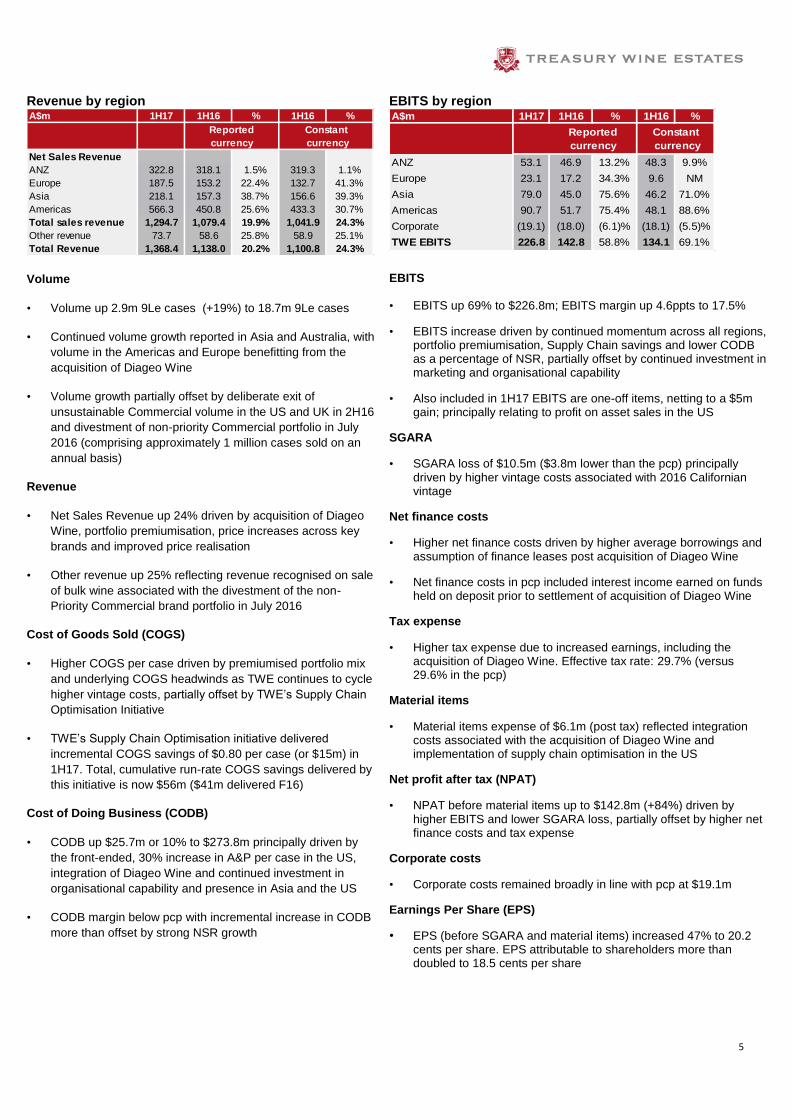
Revenue by region
Volume
• Volume up 2.9m 9Le cases (+19%) to 18.7m 9Le cases
• Continued volume growth reported in Asia and Australia, with
volume in the Americas and Europe benefitting from the
acquisition of Diageo Wine
• Volume growth partially offset by deliberate exit of
unsustainable Commercial volume in the US and UK in 2H16
and divestment of non-priority Commercial portfolio in July
2016 (comprising approximately 1 million cases sold on an
annual basis)
Revenue
• Net Sales Revenue up 24% driven by acquisition of Diageo
Wine, portfolio premiumisation, price increases across key
brands and improved price realisation
• Other revenue up 25% reflecting revenue recognised on sale
of bulk wine associated with the divestment of the non-
Priority Commercial brand portfolio in July 2016
Cost of Goods Sold (COGS)
• Higher COGS per case driven by premiumised portfolio mix
and underlying COGS headwinds as TWE continues to cycle
higher vintage costs, partially offset by TWE’s Supply Chain
Optimisation Initiative
• TWE’s Supply Chain Optimisation initiative delivered
incremental COGS savings of $0.80 per case (or $15m) in
1H17. Total, cumulative run-rate COGS savings delivered by
this initiative is now $56m ($41m delivered F16)
Cost of Doing Business (CODB)
• CODB up $25.7m or 10% to $273.8m principally driven by
the front-ended, 30% increase in A&P per case in the US,
integration of Diageo Wine and continued investment in
organisational capability and presence in Asia and the US
• CODB margin below pcp with incremental increase in CODB
more than offset by strong NSR growth
EBITS by region
EBITS
• EBITS up 69% to $226.8m; EBITS margin up 4.6ppts to 17.5%
• EBITS increase driven by continued momentum across all regions, portfolio premiumisation, Supply Chain savings and lower CODB as a percentage of NSR, partially offset by continued investment in marketing and organisational capability
• Also included in 1H17 EBITS are one-off items, netting to a $5m gain; principally relating to profit on asset sales in the US
SGARA
• SGARA loss of $10.5m ($3.8m lower than the pcp) principally driven by higher vintage costs associated with 2016 Californian vintage
Net finance costs
• Higher net finance costs driven by higher average borrowings and assumption of finance leases post acquisition of Diageo Wine
• Net finance costs in pcp included interest income earned on funds held on deposit prior to settlement of acquisition of Diageo Wine
Tax expense
• Higher tax expense due to increased earnings, including the acquisition of Diageo Wine. Effective tax rate: 29.7% (versus 29.6% in the pcp)
Material items
• Material items expense of $6.1m (post tax) reflected integration costs associated with the acquisition of Diageo Wine and implementation of supply chain optimisation in the US
Net profit after tax (NPAT)
• NPAT before material items up to $142.8m (+84%) driven by higher EBITS and lower SGARA loss, partially offset by higher net finance costs and tax expense
Corporate costs
• Corporate costs remained broadly in line with pcp at $19.1m
Earnings Per Share (EPS)
• EPS (before SGARA and material items) increased 47% to 20.2 cents per share. EPS attributable to shareholders more than doubled to 18.5 cents per share
A$m 1H17 1H16 % 1H16 %
Net Sales Revenue
ANZ 322.8 318.1 1.5% 319.3 1.1%
Europe 187.5 153.2 22.4% 132.7 41.3%
Asia 218.1 157.3 38.7% 156.6 39.3%
Americas 566.3 450.8 25.6% 433.3 30.7%
Total sales revenue 1,294.7 1,079.4 19.9% 1,041.9 24.3%
Other revenue 73.7 58.6 25.8% 58.9 25.1%
Total Revenue 1,368.4 1,138.0 20.2% 1,100.8 24.3%
Constant
currency
Reported
currency
A$m 1H17 1H16 % 1H16 %
Constant
currency
ANZ 53.1 46.9 13.2% 48.3 9.9%
Europe 23.1 17.2 34.3% 9.6 NM
Asia 79.0 45.0 75.6% 46.2 71.0%
Americas 90.7 51.7 75.4% 48.1 88.6%
Corporate (19.1) (18.0) (6.1)% (18.1) (5.5)%
TWE EBITS 226.8 142.8 58.8% 134.1 69.1%
Reported
currency

6
11 Unless otherwise stated, all balance sheet percentage or Dollar movements from the previous corresponding period are on a reported currency basis and in respect of the pcp. Movement in working capital is in respect of the 6 months from 30 June 2016 to 31 December 2016 to align with the reconciliation of net debt disclosure on page 7 12 Appendix 1 provides a detailed breakdown of prior year restatements in respect of TWE’s Balance Sheet following finalisation of Purchase Price Accounting adjustments and the impact of an accounting standards change relating to Agricultural Assets 13 Borrowings increased by $3.6m (1H16: $5.3m, F16: $12.7m) to reflect a fair value hedge of a portion of US Private Placement notes
Balance Sheet (condensed)11,12
Balance sheet movements as at 31 December 2016
Net assets up $104.5m reflecting the acquisition of Diageo
Wine. Adjusting for movements in foreign currency, net
assets increased $108.8m
Cash and cash equivalents
• Lower cash balance in 1H17 versus pcp due to receipt
of shareholder funds related to the Diageo Wine
acquisition in 1H16, which were held in escrow ahead of
transaction settlement on 1 January 2016
• Relative to 30 June 2016, higher cash balances were
driven by continued momentum across all regions
Working Capital
Higher working capital balance relative 30 June 2016, driven
by;
• Higher receivables driven by strong trading performance
across key festive occasions in 2Q17 in all regions,
partially offset by some improved collection terms with
customers
• Inventory broadly in line with 30 June 2016 balance,
reflecting depletion of Australian and New Zealand
vintages partially offset by the intake of the high yielding
2016 Californian vintage
• Seasonally lower payables, principally driven by
increased payments made to growers following the
conclusion of the high yielding 2016 Australian and New
Zealand vintages in 2H16
Inventory
Total inventory increased $400.6m. Factors driving the movement in inventory included:
• Significant uplift in total Luxury inventory; up $283m to $881m in the period driven by the outstanding 2016 vintages in Australia, the US and New Zealand and the acquisition of Diageo Wine in 2H16
• Increase in Current Luxury inventory driven by strong inventory mix and robust demand for TWE’s Luxury wine portfolio, globally
• Continued optimisation of inventory mix by reducing Commercial and lower-end Masstige inventory holdings, ongoing SKU rationalisation and shift to an outsourced model for Commercial wine in the US
• NPC brand portfolio divested in July 2016 (comprising circa 1m cases sold annually)
Property, Plant & Equipment
Property, Plant & Equipment increased $264.2m to $1,354.2m reflecting winery and packaging facilities acquired under the Diageo Wine acquisition, partially offset by the implementation of Supply Chain Optimisation initiatives across Australia, New Zealand and the US
Agricultural assets
Increase in agricultural assets to $37.2m reflects the market value of unharvested grapes prior to the 2017 Australian and New Zealand vintages
Intangibles
Increase in intangible assets reflected goodwill and brand value on acquisition of Diageo Wine
Provisions
Lower provisions relative to the pcp driven by utilisation of restructuring-related provisions in respect of TWE’s Supply Chain Optimisation initiative
Other Assets / Other Liabilities
Net movement in Other Assets and Other Liabilities reflected movements in Deferred Tax Assets (DTA) and Deferred Tax Liabilities in 1H17 relative to 1H16 driven by current year movements in assets and liabilities and the recognition of a net DTA driven by the acquisition of Diageo Wine
Borrowings13
Borrowings decreased $30.7m to $640.2m reflecting repayment of the US$125m Diageo Wine acquisition bridge facility in 2H16, partially offset by inclusion of acquired finance leases from Diageo Wine acquisition
Balance sheet leverage
Net debt / EBITDAS 1.5x (adjusted for operating leases) and interest cover of 16.0x
Funding structure
At 31 December 2016, TWE had committed debt facilities totalling approximately $1bn, comprising;
• Drawn bank facilities of $207.8m and US Private Placement notes of $346.4m
• Undrawn committed, syndicated debt facilities total $473.2m
• Weighted average term to maturity of committed facilities 3.9 years
A$m 1H17 F16 1H16
Cash & cash equivalents 339.9 256.1 1,101.2
Receivables 622.3 611.4 593.8
Current inventories 927.3 895.7 710.9
Non-current inventories 645.2 678.4 461.0
Property, plant & equipment 1,354.2 1,347.8 1,090.0
Agricultural assets 37.2 35.8 36.0
Intangibles 1,120.3 1,101.5 812.2
Assets held for sale 37.7 68.2 17.6
Other assets 261.3 291.6 191.3
Total assets 5,345.4 5,286.5 5,014.0
Payables 704.2 726.3 509.3
Borrowings 640.2 631.1 670.9
Provisions 78.3 83.1 105.9
Other liabilities 274.3 276.8 184.0
Total liabilities 1,697.0 1,717.3 1,470.1
Net assets 3,648.4 3,569.2 3,543.9

7
Cash flow – reconciliation of net debt
Movement in net debt
Net debt decreased $69.3m to $295.9m. Drivers of the
movement in net debt included:
EBITDAS
EBITDAS increased $93.3m on a reported currency basis driven
by continued momentum across all regions, the acquisition of
Diageo Wine, portfolio premiumisation, strengthening customer
partnerships and strong brand and portfolio execution
Movement in working capital
Favourable movement in working capital driven by:
• Lower inventory, principally driven by operating cash flow
movements reflecting the depletion of Australian and New
Zealand vintages largely offset by harvest costs associated
with the 2016 vintage in the US
• Increased receivables driven by strong trading performance
across all regions, partially offset by some improved
collection terms with customers
• Seasonally lower payables principally driven by increased
payments made to growers following the conclusion of the
high yielding 2016 Australian and New Zealand vintages in
2H16
Capital expenditure
Capital expenditure up $17.3m to $60.7m comprising:
• Continued investment in premiumisation activities, including
investment in vineyard redevelopments and upgrades to Luxury
wine making facilities
• Implementation of Supply Chain Optimisation initiative
• Integration of Diageo Wine
Maintenance and replacement expenditure not expected to be more
than $110m in F17. Capital expenditure required to deliver TWE’s
integration synergies of US$35m (run rate by F20) is expected to be
circa $80m in F17
Net investment expenditure
Net investment expenditure reflects proceeds received on the sale of
St. Clement cellar door and surplus assets as TWE continues to
optimise its production asset footprint
Net interest paid
Increase in net interest paid in line with higher average net debt
Dividends paid
Increase in dividends paid commensurate with F16 final dividend of
12 cents per share, 4 cents higher than the pcp
Tax paid
Higher tax paid reflected increase in underlying earnings. 1H16 tax
paid included the benefit of the franking deficit tax offset which was
fully utilised during F16
Material items
Lower net material items inflows driven by:
• Proceeds from the sale of assets across Australia, New Zealand
and the US as part of TWE’s Supply Chain Optimisation initiative
in 1H17
• Offset by restructuring and redundancy outflows and costs
associated with the acquisition of Diageo Wine
Proceeds from issue of shares, less transaction costs
Proceeds from issue of shares, net of transaction costs of $475.5m in
1H16 related to the cash inflow from the equity funding component of
the Diageo Wine acquisition
On-market share purchases
Increase driven by greater number of vested Long Term Incentive
Plan versus pcp as well as appreciation in TWE’s share price
Exchange rate impact
Lower period-end exchange rates used to revalue foreign currency
borrowings and cash flows as at 31 December 2016 increased net
debt by $41.6m
Cash conversion
Cash conversion was 104%, compared with 125.6% in the pcp
A$m (unless otherwise stated) 1H17 1H16
EBITDAS 283.9 190.6
Change in working capital 12.8 42.5
Other items (2.8) 6.2
Net operating cash flows before financing costs, tax &
material items293.9 239.3
Cash conversion 103.5% 125.6%
Capital expenditure (60.7) (43.4)
Net investment expenditure/other 14.7 2.3
Cash flows after net capital expenditure, before financing
costs, tax & material items247.9 198.2
Net interest paid (11.5) (6.3)
Tax paid (22.8) (2.2)
Cash flows before dividends & material items 213.6 189.7
Dividends/distributions paid (88.6) (52.1)
Cash flows after dividends before material items 125.0 137.6
Material item cash flows 3.1 35.8
Issue of shares, less transaction costs - 475.5
On-market share purchases (18.3) (4.6)
Total cash flows from activities 109.8 644.3
Opening net debt at 30 June (365.2) (213.9)
Total cash flows from activities (above) 109.8 644.3
Proceeds from settlement of derivatives 1.1 13.6
Debt revaluation and foreign exchange movements (41.6) (7.2)
Decrease in net debt 69.3 650.7
Closing net debt at 31 December (295.9) 436.8

8
Regional Summaries
Australia & New Zealand (ANZ)
Financial performance Business performance
Historical EBITS and EBITS margin
* Chart presented on a reported currency basis
• Volume up 13.1k 9Le cases (+0.3%) to 4,178.4k. Australia
volume up 32.6k 9Le cases (+1.0%); outperforming the
category14
• TWE made the deliberate decision to reallocate Australian
customers who service Asia to the Asia market; adjusting for this
reallocation, volume grew 2% in Australia
• NSR up 1% reflecting favourable portfolio mix and price
realisation
• Increased COGS per case in 1H17. Portfolio premiumisation and
higher vintage costs from lower yielding 2014 and 2015 vintages
partially offset by Supply Chain optimisation benefits, particularly
in Commercial segment
• Lower A&P spend driven by investment optimisation in 1H17
and elevated A&P in the pcp to support strong pipeline of NPD
and innovation in 1H16
• Favourable CODB margin driven by lower overheads, optimised
brand building spend and NSR growth
• Exit from less profitable volume and growth in the Masstige
segment delivered positive mix and EBITS growth in New
Zealand in the period
• EBITS up 9.9% to $53.1m
• EBITS margin accretion delivered, up 1.3ppt to 16.4%
ANZ regional perspectives
• Continued focus on strengthening partnerships with strategic
customers in Australia underpinned by investment in consumer
insights and category leading growth initiatives
• Depletions ahead of shipments in 1H17 demonstrating strong
customer and consumer response to marketing and promotion
activities across key festive periods in 1H17
• Investment in innovation that drives portfolio premiumisation,
further optimisation of brand building investment and ongoing
focus on cost management expected to drive further margin
accretion in F17 and beyond
14 Aztec Sales Data | Off premise only | Bottled Wine Only | Scan MAT to January 2017 and Company estimates
A$m 1H17 1H16 % 1H16 %
Volume (m 9Le) 4.2 4.2 0.3% 4.2 0.3%
NSR (A$m) 322.8 318.1 1.5% 319.3 1.1%
NSR per case (A$) 77.25 76.37 1.2% 76.66 0.8%
EBITS (A$m) 53.1 46.9 13.2% 48.3 9.9%
EBITS margin (%) 16.4% 14.7% 1.7ppts 15.1% 1.3ppts
Reported currency Constant currency
A$m

9
Regional Summaries
Europe
Financial performance
Business performance
Historical EBITS and EBITS margin
* Chart presented on a reported currency basis
• Total volume, NSR, EBITS and EBITS margin up driven by the
acquisition of the Diageo Wine business
• Volume headwinds driven by TWE’s SKU rationalisation initiative
and ongoing category decline in the UK
• NSR up 41% driven by acquisition of Diageo, partially offset by
adverse portfolio mix, with Commercial brand NSR up 48%
• Lower NSR per case driven by acquired Commercial wine volume
and continued reallocation of Luxury wine to optimise global
margins
• Masstige portfolio in Europe delivered 12% volume growth driven
by Wolf Blass, Rosemount and 19 Crimes
• Lower COGS per case reflected acquired business
• Higher A&P investment driven by acquisition of Diageo Wine and
targeted investment in core tiers of Wolf Blass, Lindeman’s and 19
Crimes
• CODB margin favourable versus pcp as NSR growth more than
offset increased brand building investment and slightly higher
Overheads due to the acquisition of Diageo Wine in the period
• LATAM EBITS up strongly at $2.6m; ongoing investment in sales
and marketing capability delivering positive momentum
• EBITS up $13.5m to $23.1m
• EBITS margin accretion delivered, up 5.1ppts to 12.3% (prior year
impacted by elevated A&P per case)
Europe regional perspectives
• Continued category decline in the UK and a reduction in under-
bond trading in response to changes introduced by HMRC in the
UK to tighten up the control of alcohol sales are headwinds in
Europe in 2H17
• Movements in foreign exchange rates as a result of Brexit leading
to higher COGS for Australian and US imported wine in F17,
notably Blossom Hill
• While distribution of priority brands remains strong – supported by
strong customer partnerships and brand marketing – SKU
rationalisation program expected to continue to lower overall
volume in Europe
• Impact of Brexit on customer and consumer demand remains
uncertain; cost and revenue mitigation plans in effect
A$m 1H17 1H16 % 1H16 %
Volume (m 9Le) 5.0 3.4 47.2% 3.4 47.2%
NSR (A$m) 187.5 153.2 22.4% 132.7 41.3%
NSR per case (A$) 37.82 45.50 (16.9)% 39.41 (4.0)%
EBITS (A$m) 23.1 17.2 34.3% 9.6 NM
EBITS margin (%) 12.3% 11.2% 1.1ppts 7.2% 5.1ppts
Reported currency Constant currency
A$m

10
Regional Summaries Asia Financial performance
Business performance
Historical EBITS and EBITS margin
* Chart presented on a reported currency basis
• Volume up 39% to 1.7m 9Le cases, delivered by both North Asia
(+27%) and South East Asia & Middle East & Africa (SEAMEA)
(+65%)
• Volume growth driven by Australian brand portfolio; US brand portfolio
in growth, up circa 200k case in the period
• Favourable NSR per case reflected price increases on select brand
tiers
• Higher COGS per case driven by portfolio mix, partially offset by
Supply Chain savings and diversified portfolio mix
• A&P investment in line with prior year, supporting price increases
taken and brand-led marketing campaigns for Singles Day, Mid-
Autumn Festival and ahead of Chinese New Year
• Investment in consumer marketing and on-the-ground sales and
marketing capabilities to support new routes-to-market more than
offset by strong NSR growth; CODB margin down 7ppts
• EBITS up $32.8m to $79.0m; strong EBITS margin accretion delivered,
up 6.7ppts to 36.2%
Asian regional perspectives
• Fundamentals of Asian wine markets continue to be highly attractive;
imported wine category grew 17% in CY15 versus historical CAGR of
13% per annum between CY10 and CY1415
• Relative to 2H, TWE expects 1H in Asia to be seasonally stronger by
volume due to timing of key consumption and gift giving occasions
requiring shipments in 1H
• Refreshed US brand portfolio now positioned for growth in 2H17
following official launch of 90+ collection in Shanghai in November;
elevated brand investment to support US portfolio expected in 2H17
• Continued focus on deepening customer partnerships and more
efficient routes-to-market across Asia, notably in China and Japan
• New route-to-market established in Japan in January 2017; expected
to facilitate closer and more direct customer partnerships and
increased consumer connections in Asia’s second largest wine market
• Asia region continues to focus on driving a balanced brand and
country-of-origin (i.e. Australian, US and New Zealand wine) mix via
portfolio diversification strategy
• EBITS margin toward the higher end of the previously communicated
30%-35% range expected in F17 driven by portfolio mix diversification,
continued investment in marketing and sales presence, partially offset
by optimised pricing and brand building investment
15 IWSR still and sparkling wines only (excludes non-grape and fortified wines)
A$m 1H17 1H16 % 1H16 %
Volume (m 9Le) 1.7 1.2 38.5% 1.2 38.5%
NSR (A$m) 218.1 157.3 38.7% 156.6 39.3%
NSR per case (A$) 131.77 131.65 0.1% 131.07 0.5%
EBITS (A$m) 79.0 45.0 75.6% 46.2 71.0%
EBITS margin (%) 36.2% 28.6% 7.6ppts 29.5% 6.7ppts
Reported currency Constant currency
A$m

11
Regional Summaries
Americas
Financial performance Business performance
Historical EBITS and EBITS margin
* Chart presented on a reported currency basis
• Volume and NSR up strongly driven by contribution from the acquired
Diageo Wine business, partially offset by divestment of Non-Priority
Commercial brand portfolio in July 2016 (comprising approximately 1m
cases sold annually)
• Outstanding NSR per case growth reflects portfolio premiumisation
with volume and value growth delivered by Luxury, Masstige and
Commercial segments, price increases on select brands and focus on
sustainable volume
• Increased COGS per case reflects premiumised portfolio mix and
higher inventory costs, partially offset by Supply Chain optimisation
savings
• Re-set of US brand portfolio underpinned higher brand building
investment that was front-ended in 1H17; A&P per case increased
30%
• Following US brand reset and refresh, shipments exceeded depletions
by 150k cases in 1H17
• Despite increase in brand building spend and investment in
organisational talent in 1H17, CODB margin in line with pcp with NSR
growth higher than the incremental increase in costs
• EBITS reported in Canada below pcp driven by operational challenges
and adverse macroeconomic conditions. New route-to-market
announced in January 2017
• EBITS up 89% to $90.7m principally reflecting acquisition of Diageo
Wine and portfolio premiumisation. TWE also recognised one-off
items, netting to $5m gain in 1H17, principally relating to the profit on
asset sales
• EBITS margin accretion delivered, up 4.9ppts to 16.0%
Americas regional perspectives
• Fundamentals of the US wine market remain attractive; total bottled
wine category in volume and value growth of 0.9% and 2.8%,
respectively. TWE expects to deliver volume and value growth in line
with category in 2H1716
• Reset of US brand portfolio on-track; TWE well positioned to rebuild
distribution of refreshed portfolio with enhanced margin structures
• Strengthened partnerships with distributor and retail customers in
1H17; further opportunity exists to drive improved performance with
key customers and distributors
• TWE will continue to cycle higher vintage costs in 2H17 and 1H18 due
to the low-yielding, but high quality 2015 vintage in California. TWE’s
Supply Chain Savings is partially offsetting these COGS headwinds
• Continued margin accretion to be underpinned by volume growth and
portfolio premiumisation, enhanced returns from the Diageo Wine
business, optimisation of brand investment and cost management
16 Total Wine Category $4+ Table (excluding Box) - Source: IRI Market Advantage, Table $4+ excluding Box and Aseptic Wine Size Package, 26 weeks ending 1/8/17, Total Multi Outlet + Liquor
A$m 1H17 1H16 % 1H16 %
Volume (m 9Le) 7.9 7.1 12.6% 7.1 12.6%
NSR (A$m) 566.3 450.8 25.6% 433.3 30.7%
NSR per case (A$) 71.24 63.87 11.5% 61.39 16.0%
EBITS (A$m) 90.7 51.7 75.4% 48.1 88.6%
EBITS margin (%) 16.0% 11.5% 4.5ppts 11.1% 4.9ppts
Reported currency Constant currency
A$m

12
Summary
In summary, the strong interim result demonstrates that
TWE is executing on all strategic initiatives; enabling the
Company to transition TWE from an agricultural, order-
taking company to a brand-led, high performance
organisation.
Crucial to this transition is embedding balanced and
sustainable business models across TWE’s brand and
regional earnings mix, as well as building further flexibility
and diversification into the Company’s supply model.
TWE is now marketing and selling its key brands across
all four quarters of the year, rather than delivering the
majority of its earnings from only a few brands in the final
quarter of the fiscal year. As a result, TWE’s earnings will
continue to be more evenly spread across the fiscal year.
Furthermore, the Company’s brand building investment is
focused on a global, ‘portfolio of brands’ approach, which
in turn, diversifies the revenue and earnings composition.
TWE is also diversifying its sourcing profile; driving an
improved balance across key varietals, sourcing regions
and appellations.
In 1H17, TWE has been focused on integrating Diageo
Wine, with integration and rationalisation of acquired
brands and supply chain assets in progress. As TWE
updates and refreshes the acquired brands, TWE is
increasingly well positioned to grow distribution of these
brands in both the US and in Asia with improved creatives
and promotions and importantly, enhanced margin
structures.
Following the strong 1H17 performance and with
accelerating momentum across the business, the outlook
for TWE is positive. As a result, TWE is on track to deliver
previously stated targets of:
Total cash synergies recognised from the acquisition
of Diageo to reach a run-rate of US$35m by F20
Total COGS savings from its Supply Chain
Optimisation initiative to reach a run-rate of at least
$100m by F20
High-teens EBITS margin by F18
Vintage update
Californian
The 2016 growing season started three weeks later than
2015 with a desirable extended ripening phase and
yields returning to the long term average. Strong yields
were noted on high-demand varietals including Napa
Cabernet and Santa Barbara Pinot Noir. Quality and
yields of these varietals were comparable to the strong
2013 harvest. While the 2016 Californian harvest
assisted in bridging some of the shortfall of the 2015
vintage, the market is still in deficit on key varietals,
notably Cabernet, with grape prices for cabernet
increasing. Drought conditions that have persisted in
California for the last five years began to lift at the
beginning of the 2016 harvest which positively impacted
yields and quality across all regions.
Australia
An excellent Winter and well-timed Spring rains have
resulted in healthy canopies and a 2017 Australian
harvest which will be later than prior vintages. Hail
storms across the Riverland and Sunraysia regions have
reduced industry yield expectations, however the more
premium areas have benefited from the additional
ground moisture. Provided favourable conditions
continue through the remainder of the harvest, TWE
expects quality and yield to be in line with the
outstanding 2016 Australian vintage.
New Zealand
The 2017 New Zealand harvest to date has been
characterised by a wet Spring and Summer, leading to
consistent fruit set and yields across regions. Conditions
to date have favoured most varietals, notably Central
Otago Pinot Noir and Marlborough Sauvignon Blanc.
Yield and quality are expected to be in line with the 2016
high yielding and excellent quality harvest, with the New
Zealand earthquake not expected to impact yields.
13
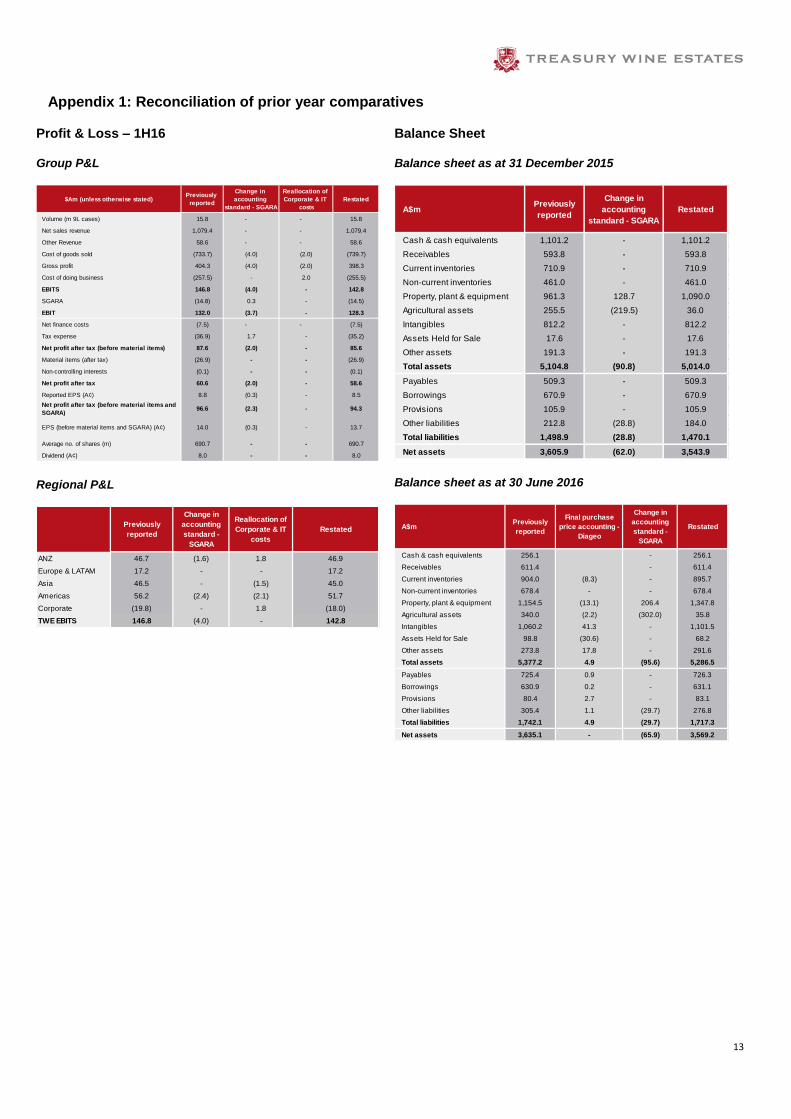
Appendix 1: Reconciliation of prior year comparatives
Profit & Loss – 1H16
Group P&L
Regional P&L
Balance Sheet
Balance sheet as at 31 December 2015
Balance sheet as at 30 June 2016
$Am (unless otherwise stated)Previously
reported
Change in
accounting
standard - SGARA
Reallocation of
Corporate & IT
costs
Restated
Volume (m 9L cases) 15.8 - - 15.8
Net sales revenue 1,079.4 - - 1,079.4
Other Revenue 58.6 - - 58.6
Cost of goods sold (733.7) (4.0) (2.0) (739.7)
Gross profit 404.3 (4.0) (2.0) 398.3
Cost of doing business (257.5) - 2.0 (255.5)
EBITS 146.8 (4.0) - 142.8
SGARA (14.8) 0.3 - (14.5)
EBIT 132.0 (3.7) - 128.3
Net finance costs (7.5) - - (7.5)
Tax expense (36.9) 1.7 - (35.2)
Net profit after tax (before material items) 87.6 (2.0) - 85.6
Material items (after tax) (26.9) - - (26.9)
Non-controlling interests (0.1) - - (0.1)
Net profit after tax 60.6 (2.0) - 58.6
Reported EPS (A¢) 8.8 (0.3) - 8.5
Net profit after tax (before material items and
SGARA)96.6 (2.3) - 94.3
EPS (before material items and SGARA) (A¢) 14.0 (0.3) - 13.7
Average no. of shares (m) 690.7 - - 690.7
Dividend (A¢) 8.0 - - 8.0
Previously
reported
Change in
accounting
standard -
SGARA
Reallocation of
Corporate & IT
costs
Restated
ANZ 46.7 (1.6) 1.8 46.9
Europe & LATAM 17.2 - - 17.2
Asia 46.5 - (1.5) 45.0
Americas 56.2 (2.4) (2.1) 51.7
Corporate (19.8) - 1.8 (18.0)
TWE EBITS 146.8 (4.0) - 142.8
A$mPreviously
reported
Change in
accounting
standard - SGARA
Restated
Cash & cash equivalents 1,101.2 - 1,101.2
Receivables 593.8 - 593.8
Current inventories 710.9 - 710.9
Non-current inventories 461.0 - 461.0
Property, plant & equipment 961.3 128.7 1,090.0
Agricultural assets 255.5 (219.5) 36.0
Intangibles 812.2 - 812.2
Assets Held for Sale 17.6 - 17.6
Other assets 191.3 - 191.3
Total assets 5,104.8 (90.8) 5,014.0
Payables 509.3 - 509.3
Borrowings 670.9 - 670.9
Provisions 105.9 - 105.9
Other liabilities 212.8 (28.8) 184.0
Total liabilities 1,498.9 (28.8) 1,470.1
Net assets 3,605.9 (62.0) 3,543.9
A$mPreviously
reported
Final purchase
price accounting -
Diageo
Change in
accounting
standard -
SGARA
Restated
Cash & cash equivalents 256.1 - 256.1
Receivables 611.4 - 611.4
Current inventories 904.0 (8.3) - 895.7
Non-current inventories 678.4 - - 678.4
Property, plant & equipment 1,154.5 (13.1) 206.4 1,347.8
Agricultural assets 340.0 (2.2) (302.0) 35.8
Intangibles 1,060.2 41.3 - 1,101.5
Assets Held for Sale 98.8 (30.6) - 68.2
Other assets 273.8 17.8 - 291.6
Total assets 5,377.2 4.9 (95.6) 5,286.5
Payables 725.4 0.9 - 726.3
Borrowings 630.9 0.2 - 631.1
Provisions 80.4 2.7 - 83.1
Other liabilities 305.4 1.1 (29.7) 276.8
Total liabilities 1,742.1 4.9 (29.7) 1,717.3
Net assets 3,635.1 - (65.9) 3,569.2