Embed Size (px)
Citation preview
Treatment Fidelity: Relation to Treatment Acceptability and Change Over Time
A DISSERTATION SUBMITTED TO THE FACULTY OF THE GRADUATE SCHOOL
OF THE UNIVERSITY OF MINNESOTA BY
Gizem Tanol, M.A.
IN PARTIAL FULFILLMENT OF THE REQUIREMENTS FOR THE DEGREE OF
DOCTOR OF PHILOSOPHY
Jennifer J. McComas, Adviser LeAnne Johnson, Co-adviser
November, 2010

© Gizem Tanol, November 2010
i
Acknowledgements
First and foremost, I would like to thank my advisors Jennifer McComas and
LeAnne Johnson who spent countless hours and resources guiding me with their
thoughtful insights. It would not be possible to complete my dissertation without your
invaluable guidance and encouragement. I would also like to thank Scott McConnell for
being a mentor throughout my graduate training with his positive attitude and support.
I extend my greatest appreciation to the faculty, graduate assistants, and staff at
the University of Minnesota, Vanderbilt University, and Virginia Commonwealth
University who developed and spent countless hours conducting “Reducing Severe
Behavior Problems in Schools” multi-site project. To principal investigators Joe
Wehby, Craig Kennedy, Jennifer McComas, Frank Symons, Kevin Sutherland, Donald
Oswald who kindly extended the permission to examine the dataset and made it
possible for me to have the resources to complete my dissertation. I would also like to
sincerely thank LeAnne Johnson for guiding me every step of this process.
Finally, I wish to thank my family for believing in me and encouraging me to do
my best. My friends for making me smile. Most importantly, I would like to thank my
husband, Yigit, for his patience, endless support, and love that kept me going every day.
ii
Dedication This dissertation is dedicated to my parents, Nebahat and Nejat Tatarer, for their love,
endless support, and confidence that I can accomplish anything in life.
iii
Table of Contents
LIST OF TABLES......................................................................................................... vi
LIST OF FIGURES ..................................................................................................... vii
CHAPTER PAGE
I. INTRODUCTION .......................................................................................................1
Statement of the Problem ......................................................................................1
Limitations of the Literature .................................................................................3
Purpose of the Study .............................................................................................3
Research Questions ..............................................................................................4
Terminology .........................................................................................................4
Organization of the Remainder of the Paper ........................................................5
II. LITERATURE REVIEW ..........................................................................................7
Implications of Monitoring Treatment Fidelity.....................................................7
Treatment Fidelity in Relation to Validity ................................................8
Treatment Fidelity in Relation to Intervention Outcomes.........................9
Factors Influencing Treatment Fidelity ..............................................................12
Relevance of Monitoring Treatment Acceptability ............................................13
Treatment Acceptability and Treatment Fidelity ...............................................14
Conceptual Models .................................................................................14
Treatment Acceptability and Fidelity in Educational Research .............16
Treatment Fidelity Over Time ............................................................................21
Summary .............................................................................................................22
Research Questions ............................................................................................23
III. METHODS .............................................................................................................24
Summary .............................................................................................................24
iv
Study Background ..............................................................................................24
Setting and Participants ......................................................................................25
Eligibility Criteria ...............................................................................................26
Multi-Component Classroom Management Intervention Package ....................26
Classroom Organization and Management Program (COMP) ...............27
Good Behavior Game (GBG) .................................................................27
Self-Monitoring ......................................................................................28
Procedures ..........................................................................................................28
Training and Consultation ......................................................................29
Classroom Organization and Management Program (COMP) ...29
Good Behavior Game (GBG) .....................................................29
Self-Monitoring ..........................................................................30
Independent Variables ........................................................................................30
Treatment Acceptability .........................................................................30
COMP Treatment Acceptability .................................................31
GBG Treatment Acceptability ....................................................32
Self-monitoring Treatment Acceptability ...................................33
Overall Treatment Acceptability ................................................34
Dependent Variables ..........................................................................................35
Treatment Fidelity ..................................................................................35
COMP Treatment Fidelity ..........................................................36
GBG Treatment Fidelity .............................................................37
Self-monitoring Treatment Fidelity ............................................38
Overall Treatment Fidelity .........................................................39
Reliability of the Observation System ........................................39
Data Analysis ......................................................................................................40
IV. RESULTS ...............................................................................................................41
Research Questions .............................................................................................41
Participants with Prior Exposure to the Interventions.........................................41
v
Time-points Sampled for Analyses .....................................................................42
Assumptions Analysis .........................................................................................43
Question 1: ..........................................................................................................43
Time 1 .....................................................................................................44
Time 2 .....................................................................................................46
Time 3 .....................................................................................................47
Question 2: ..........................................................................................................48
Repeated Measures ANOVA .................................................................48
Main Effects of Group Membership Over Time ........................49
Main Effects of Time ..................................................................52
Intra-class Correlation Coefficients (ICC) .........................................................54
V. DISCUSSION ...........................................................................................................55
Discussion of Findings .......................................................................................56
Question 1: ..............................................................................................56
Question 2: ..............................................................................................59
Limitations ..........................................................................................................63
Scope ......................................................................................................63
Measurement and Reliability ..................................................................64
Analysis ...................................................................................................65
Implications ........................................................................................................66
Future Directions ................................................................................................69
BIBLIOGRAPHY..........................................................................................................71
APPENDIX A: Treatment Acceptability Rating Scales ................................................90
APPENDIX B: Treatment Fidelity Check Lists.............................................................95
vi
List of Tables
TABLE PAGE
1. Demographics Data for Participating Teachers.........................................................79
2. Descriptive Information on Treatment Acceptability Measures and Fidelity of
Intervention Components Across Time Points .........................................................80
3. Test of Normality for Fidelity of Implementation of Overall and Individual
Components. .............................................................................................................81
4. Correlations Between Treatment Acceptability Measures and Treatment Fidelity of
Intervention Components Across Time Points..........................................................82
5. Descriptive Data for High and Low Acceptability Groups Across Time Points .....83
6. Repeated measures Analysis of Variance..................................................................84
vii
List of Figures
FIGURE PAGE
1. Witt and Elliott’s (1985) Model of Treatment Acceptability ……………………85
2. Reimers, Wacker, and Koeppl’s (1987) Model of Treatment Acceptability…….86
3. Elliott’s (1988) Model of Treatment Acceptability………………………………87
4. Q-Q Plots for Fidelity of Implementation of Overall and Individual Components
……………………………………………………………………………………88
5. Mean Treatment Fidelity for High and Low Treatment Acceptability Groupings of
Teachers across Three Time Points………………………………………………89
1
CHAPTER ONE
Introduction
Statement of the Problem
In clinical research, with highly controlled settings and researchers as
intervention providers, behavioral interventions are likely to be implemented with
near-perfect fidelity. However, in applied settings such as classrooms, this is not
always true (Wilder, Atwell, & Wine, 2006). In educational research, developing
efficacious interventions only serves as the first step. The second step is
implementing these programs by intervention providers (i.e., teachers) in classroom
settings (Wickstrom, Jones, LaFleur, & Witt, 1998). An essential factor in the
implementation process is ensuring that teachers deliver the intervention accurately,
in other words with fidelity (Smith, Daunic, & Taylor, 2007). However, as Detrich
(1999) stated, “There is much more known about the effectiveness of interventions
than is known about how to get those interventions implemented with fidelity” (pg.
609). By defining and measuring treatment fidelity, researchers are able to uncover
critical information about the success or failure of an intervention program through
systematic evaluation of outcomes relative to implementation (Sanchez, Steckler,
Nitirat, Hallfors, Cho, & Brodish, 2007). For example, by measuring treatment
fidelity, researchers may determine whether the intervention itself or idiosyncratic
implementation is influencing the outcomes. Although it is critical for the effective
implementation of evidence-based practices in school settings, treatment fidelity and
the factors affecting it are often overlooked (Gresham, 1989; Lane, Bocian,
MacMillan, & Gresham, 2004; Sterling-Turner & Watson, 2002; Yeaton & Sechrest,
1981). Several effective school-based behavioral interventions have been identified
as evidence-based practices. However, the existence of an evidence-base does not
always guarantee that an intervention will be viewed as effective by teachers and
2
implemented with fidelity (Kazdin, 2000; Rotheram-Borus & Duan, 2003). Thus,
there are a number of challenges to implementing evidence-based interventions.
Jensen (2003) in his commentary suggested that efficacious interventions are most
often not disseminated, increasing the need to examine the acceptability (feasibility,
affordability) of interventions.
In the school-based intervention literature, treatment acceptability is discussed
as a factor affecting fidelity of implementation (Elliott, 1988; Reimers, Wacker, &
Koeppl, 1987; Sterling-Turner & Watson, 2002). Researchers suggest that no matter
how well an intervention is grounded in theoretical principles and how well it works
in laboratory or controlled settings, its ultimate implementation is likely to be
influenced by the degree to which it is perceived acceptable by the intervention
providers (Elliott, 1988; Kazdin, 1981; Kurita & Zarbatany, 1991). Treatment
acceptability is purported to affect fidelity of implementation and, therefore, may
result in varying levels of behavior change (Kazdin, 1981; Remiers et al., 1987).
Treatment acceptability may also determine the level of teacher resistance to
recommended protocols (Broughton & Hester, 1993). Exploring treatment
acceptability and its relation to treatment fidelity represents a key step in
understanding the degree to which interventions are implemented and maintained in
applied settings. Moreover, it is important to assess the nature of fidelity of
implementation over time, in relation to treatment acceptability, to provide a better
understanding of fidelity in the context of longitudinal implementation. Therefore,
educational researchers need to conduct rigorous studies to examine the relation
between acceptability and fidelity of implementation over time.
3
Limitations of the Literature
Despite the intuitive appeal of conceptual models in which treatment
acceptability predicts treatment fidelity, rigorous studies are needed to examine this
relation in further detail (Calvert & Johnston, 1990). To date, findings on the
relation between treatment acceptability and treatment fidelity have been
inconsistent. Further, the studies have been mainly analogue (e.g., Sterling-Turner &
Watson, 2002) or limited to self-report as the primary outcome measure (e.g.,
Allinder & Oats, 1997; Reimers & Wacker, 1992). Additionally, very little attention
has been given to the assessment of treatment fidelity over time (Reimers & Wacker,
1992). Therefore, further research is necessary to investigate the relationship
between treatment acceptability and its fidelity of implementation.
Purpose of this Study
Reimers and Wacker (1992) suggested that future research should investigate
whether fidelity of implementation can be predicted via treatment acceptability
ratings to develop effective school-based interventions. To accomplish this, Sterling-
Turner and Watson (2002) recommended that future research should examine the
relation between treatment acceptability and treatment fidelity in applied settings
and with real intervention providers. It is important to investigate treatment
acceptability in natural context with actual consumers (i.e., teachers) and to assess
its relationship to the fidelity of implementation in less controlled settings, as it
provides stronger generalization and ecological validity (Greene, 1995; Finn &
Sladeczek, 2001; Miltenberger, 1990; Reimers et al., 1987). The main purpose of
this investigation is: (a) to examine the relation between acceptability and fidelity of
an intervention package in natural classroom settings, and (b) to examine how
fidelity of implementation varies in relation to high vs. low treatment acceptability
4
over the course of an academic school year.
Research Questions
In the context of a longitudinal efficacy trial of a classroom management package:
1. How does treatment acceptability of individual and combined components
relate to treatment fidelity?
2. Does fidelity of implementation of individual and combined components
vary as a function of treatment acceptability over time?
Terminology
For the purposes of clarifying the terminology used in this study, definitions of
the terms are presented below.
Treatment Fidelity
Treatment fidelity is defined as the extent to which an intervention is
implemented as originally designed and intended (Gresham, 1989; Gresham &
Gansle, 1993; Gresham, MacMillan, Beebe-Frankenberger, & Bocian, 2000; Lane,
Bebe-Frankenberger, & Lambros, 2001; Moncher & Prinz, 1991; Yeaton &
Sechrest, 1981). It reflects the accuracy and consistency of the implementation of
each component of the intervention (Gresham et al., 2000; Lane et al., 2001; Lane et
al., 2004; Smith et al., 2007). In the literature, treatment fidelity and treatment
integrity are used interchangeably (Moncher & Prinz, 1991; O’Donnell, 2008).
However, there is some disagreement as to whether these words should be used
synonymously. For example, in his review of educational literature, O’Donnell
(2008) criticized the inconsistent terminology used in the literature, suggesting that
misusing the vocabulary has led to confusion. In order to prevent such confusion in
this paper, the term treatment fidelity will be used to address the extent to which an
intervention is implemented as originally designed.
5
Treatment Acceptability
Treatment acceptability refers to judgments by laypersons, clients and other
consumers of an intervention (e.g., caregivers, teachers, and children) of whether the
procedures are fair, reasonable, justified and consistent with the notions of what the
intervention should be for the problem addressed or the client (Kazdin, 1980;
Kazdin, 2000). Even though the term treatment acceptability is often used
synonymously with social validity, there are distinctions between these terms. Wolf
(1978) described the three levels that make up social validity as: (a) the social
significance of the goals, (b) the social appropriateness of the procedures, and (c) the
social importance of the effects. Therefore social validity indicates the extent of
agreement between the importance of the goals of an intervention plan,
appropriateness of the procedures and the importance of the results to a treatment
agent. By contrast, treatment acceptability is a more specific term that examines
only the acceptability of the procedures and may or may not address other
components such as goals and outcomes (Miltich Lyst, Gabriel, O’Shaughnessy,
Meyers, & Meyers, 2005). Therefore, treatment acceptability is considered a sub-
domain of social validity rather than a synonym (Miltich Lyst et al., 2005). The
current study will focus particularly on the acceptability of a school-based
intervention package, examining mainly the acceptability of the procedures.
Therefore the term treatment acceptability will be used throughout this paper.
Organization of the Remainder of the Paper
Chapter 2 provides a comprehensive review of the literature on the importance
of treatment fidelity and the factors affecting treatment fidelity. Additionally, the
literature on the relationship between treatment acceptability and treatment fidelity
will be described, focusing on conceptual models of acceptability, and to the
6
limitations of the existing literature. Chapter 3 explains participant demographics,
procedures and methods utilized in this study. Chapter 4 describes the results in
relation to the research questions of interest. Finally, Chapter 5 provides a summary
of the important findings, their relevance to the educational literature, as well as
limitations and implications for future research.
7
CHAPTER II
Literature Review
The literature review first examines the implications of monitoring treatment
fidelity, its importance, and the factors influencing treatment fidelity. Second,
pertaining to the first research question, the review describes the relevance of
monitoring treatment acceptability, conceptual models of acceptability, and its
relation to fidelity in educational research. Third, to address the second research
question, the importance of monitoring fidelity over time and the limitations of the
existing literature are explained. The literature review concludes with a summary of
limitations and future directions.
Implications of Monitoring Treatment Fidelity
It is important to monitor treatment fidelity because the main purpose of any
type of scientific investigation is to demonstrate experimental control. Experimental
control is defined as the changes in a dependent variable that are caused by the
independent variable (Gresham et al., 2000). In the field of education, there is
increasing emphasis on scientific rigor, particularly for the applied studies
conducted in school settings (IDEA, 2004; NCLB, 2001). Monitoring treatment
fidelity makes it possible to obtain information on how well an intervention is
implemented, which in turn plays an important role in the assessment of intervention
effectiveness. Moreover, several studies have concluded that monitoring treatment
fidelity increases the possibility of obtaining successful intervention outcomes
(Arkoosh, Derby, Wacker, Berg, McLaughlin, & Baretto, 2007; Greenwood, Terry,
& Arreaga-Mayer, 1992; Noell, Gresham, & Gansle, 2002; Wilder et al., 2006),
suggesting a strong relation between treatment fidelity and outcome effectiveness
(Gresham & Gansle, 1993). A detailed description of factors pertaining to the
importance of treatment fidelity and its relation to effective outcomes is provided in
the next sections.
8
Treatment Fidelity in Relation to Validity
Failure to implement an intervention with fidelity increases the possibility that
outcomes will be affected by a variety of other variables that create threats to
validity (Cook & Campbell, 1979; Gresham et al., 2000; Moncher & Prinz, 1991).
If treatment fidelity is not measured, it is difficult for researchers to determine
whether study outcomes are due to the independent variable (intervention) or to
authentic implementation of the intervention (Bellg, Borelli, Resnick, Hecht,
Minicucci, & Ory et al., 2004; Gresham, 1989; Smith et al., 2007). It is particularly
challenging in educational research to achieve accurate implementation given the
vast differences among the intervention providers, high attrition rate for teachers and
students, and less control in naturally-occurring settings such as schools and
classrooms (Smith et al., 2007). Given these challenges, interventions that are
implemented idiosyncratically by teachers are difficult to replicate among other
students, settings, or intervention providers. Consequently, it is difficult to interpret,
compare, and generalize the effects of the interventions (Gresham & Gansle, 1993;
Gresham et al., 2000; Johnson & Pennypacker, 1993; Moncher & Prinz, 1991).
Moncher and Prinz (1991) stated that consistent measurement of treatment fidelity
increases researchers' ability to (a) explain the findings of a study, (b) make
revisions for future replication, and (c) increase statistical power and effect size by
reducing random variability. Moreover, ongoing measurement of treatment fidelity
allows detection of differences caused by the inconsistent implementation. These
differences, when measured, may allow for systematic evaluations of effect sizes
and enhanced statistical power to detect relations that may vary as a function of
fidelity (Gresham et al., 2000). It is important to control for idiosyncratic variability,
because it can lead to the rejection of intervention programs that are effective if
implemented with fidelity (Borelli, Sepinwall, Ernst, Bellg, Czajkowski, & Breger et
al., 2005; Henggeler, Melton, Brondino, Scherer, & Hanley, 1997; Moncher &
Prinz, 1991) or the acceptance of intervention programs that are originally
ineffective (Peterson, Homer, & Wonderlich, 1982).
9
Treatment Fidelity in Relation to Intervention Outcomes
Pertaining to this review, there are two conclusions of interest in the literature.
First, there is a body of literature suggesting that good treatment fidelity increases
the probability of successful intervention outcomes. Second, researchers also
suggest that expecting perfect or near-perfect implementation is unrealistic and
deviation from the intervention protocol to a certain degree still results in effective
outcomes (Durlak & DuPre, 2008; Gresham, 1989).
Gresham and Gansle (1993) reviewed the literature published between 1980
and 1990 on child-based experimental studies conducted in school settings. In their
review, Gresham and Gansle (1993) concluded that there was a significant
relationship between effect size and the percentage of treatment fidelity monitored (r
= .51, p < .05), as well as percentage of non-overlapping data and percentage of
treatment fidelity (r = .58, p < .05). Therefore, results revealed a correlation between
high fidelity of implementation and larger effect sizes.
Similarly, in a recent meta-analysis, Durlak and DuPre (2008) examined the
impact of implementation on intervention outcomes. The meta-analysis covered the
literature from 1976 to 2006, conducted in applied settings by non-researcher
intervention providers. The Durlak and DuPre study included a review of 59 studies
and five other meta-analyses summarizing 483 studies (e.g., Derzon, Sale, Springer,
& Brounstein, 2005; DuBois, Holloway, Valentine, & Cooper, 2002; Smith,
Schneider, Smith, & Ananiadou, 2004;Wilson, Lipsey, & Derzon, 2003). DuBois
and colleagues (2002) focused on the overall effects of mentoring programs on
youth and examined the affects of variables such as program design and
implementation fidelity. The findings of their meta-analysis revealed that monitoring
implementation was one of the strongest predictors of successful outcomes along
with ongoing training and parent support. Smith and colleagues (2004) synthesized
the existing literature on bullying prevention programs implemented in schools.
Similar to the DuBois findings, the results of the Smith study revealed that programs
monitoring treatment fidelity yielded more positive outcomes than programs lacking
10
any formal monitoring procedures. Moreover, Wilson and colleagues (2003)
examined the effectiveness of school-based psychosocial prevention programs for
reducing aggressive behavior. The findings of the meta-analysis revealed that
interventions implemented in classroom settings with high fidelity resulted in larger
reductions in aggressive behavior compared to pullout programs and interventions
implemented with low fidelity. Derzon and colleagues (2003) implemented a meta-
analytic regression to assess the potential effectiveness of high-risk youth study on
reducing substance abuse under optimal implementation conditions. The overall
mean effect size for the program effectiveness in reducing substance use was .02.
However, when the effects of low treatment fidelity were controlled, the overall
effect size increased to .24, highlighting the importance of fidelity of
implementation. Lastly, Durlak and DuPre analyzed 59 additional articles to
examine fidelity of implementation in further detail. The results revealed a
significant positive relationship between fidelity of implementation and intervention
outcome effectiveness for seventy-six percent of the articles (45 out of 59 articles)
reviewed. Notably, Durlak and DuPre concluded that, among the literature reviewed,
no studies have documented 100% fidelity for all intervention providers and very
few studies reached fidelity levels greater than 80%. In addition to this finding, they
concluded that positive outcome effectiveness was achieved with fidelity levels
around 60% suggesting that fidelity and adaptation inevitably co-occur where some
aspects of the intervention are replicated and some are modified (Durlak & DuPre;
Ringwalt, Ennett, Johnson, Rohrbach, Simons-Rudolph, & Vincus et al., 2003).
In addition to the meta-analyses conducted in the literature, experimental
studies have revealed relations between fidelity of implementation and outcome
effectiveness. In a correlational study, Greenwood and colleagues (1992), examined
variations of implementation of a class-wide peer tutoring intervention on students’
rate of accurately spelled words. The fidelity of implementation differed across the
five teachers participating in the study. The variability in implementation was
reflected in student outcomes, with lower point gains for students who received low
11
fidelity treatments (Greenwood et al.).
In a more controlled study, Wilder and colleagues (2006) examined the effects
of different levels of treatment fidelity (100%, 50%, and 0%) in the context of a
three-step prompting procedure on child compliance. Three different types of
instructions (e.g., "Give me the snack item", "Put the toy away") were randomly
assigned to three levels of treatment fidelity for the two participants. During the
100% fidelity sessions, the therapist implemented three-step prompting in all
opportunities. In 50% fidelity sessions, the therapist implemented the three-step
prompting only in 50% of opportunities. During 0% fidelity three-step prompting
was not implemented. The results of the study supported the findings of the meta-
analyses, indicating that different levels of treatment fidelity resulted in different
levels of child compliance. The 100% fidelity sessions resulted in 91% to 71%
compliance for the two participants, while 50% fidelity resulted in 54% to 41%
compliance, and 0% fidelity resulted in 6% to 0% compliance. The results of this
study concluded that the same intervention strategy could result both in 91% and 0%
compliance depending on how well the components are implemented, providing
strong evidence of the importance of treatment fidelity. Nonetheless, in educational
research, teachers, by and large, adjust intervention recommendations to the context,
setting, or individual participants (Smith et al., 2007). Therefore research is
warranted to determine how far those adjustments can go and still result in behavior
change (Gresham, 1989; Ringwalt et al., 2003; Smith et al., 2007).
In a more recent study, Wood, Umbreit, Liaupsin, and Gresham (2007)
conducted a fine-grained measurement of fidelity of implementation. The authors
monitored treatment fidelity using 30s intervals during implementation. The results
revealed a strong correlation between fidelity of implementation and student
outcomes per session. Therefore, Wood and colleagues concluded that the
assessment of fidelity of implementation makes it possible to attribute observed
effects to a particular intervention, rather than to extraneous factors. Overall
monitoring of treatment fidelity is critical to interpreting intervention outcomes.
12
Monitoring fidelity of implementation also enables researchers to determine the
most important components of an intervention plan and to assess the parts that can
be adapted and the parts that should be replicated. The literature suggests that
adapted implementation is more likely to be effective when critical components are
retained (Riley-Tillman, Chafouleas, Eckert, & Kelleher, 2005). Therefore, it is
important to investigate the right mixture of the fidelity and adaptation for each type
of intervention. The factors influencing the fidelity of implementation will be
addressed in the following section.
Factors Influencing Treatment Fidelity
In order to increase and sustain implementation, it is important to identify the
variables that influence treatment fidelity (Noell & Witt, 1996; Sterling-Turner &
Watson, 2002; Witt, Gresham, & Noell, 1996). Durlak and DuPre (2008) conducted
a literature review of factors affecting the implementation process in studies
implemented in natural settings by non-researcher intervention providers. Based on
the findings, Durlak and DuPre suggested a framework for effective implementation,
which takes into consideration the following 5 categories: (a) community-level
factors such as the context in which a program is conducted, the prevention research
system, politics, policy (e.g., NCLB, 2001), and funding (Cooke, 2000; Jensen,
1993), (b) the prevention delivery system such as effective leadership, shared
decision-making and collaboration in the organization (Cooke, 2000; Mihalic &
Irwin, 2003), (c) prevention support system such as training and technical assistance
(Moncher & Prinz, 1991; Smith et al., 2007), (d) innovation characteristics such as
compatibility and adaptability (Detrich, 1999; Rotheran-Borus & Duan, 2003), and
(e) provider characteristics such as the perceptions related to the need for the
intervention, and perceptions related to the potential benefits of the innovation, self-
efficacy, and skill proficiency (Durlak & DuPre, 2008; Greene, 1995). With regard
to innovation characteristics, researchers have regarded treatment acceptability as
playing a crucial role in treatment fidelity (Gresham, 1989; Sterlin-Turner &
Watson, 2002). In fact, treatment acceptability has received the most attention in
13
school-based intervention literature and has been considered a fundamental
component to implementation (Remiers et al., 1987; Sterling-Turner & Watson,
2002; Wolf, 1987). The present study was designed to address treatment
acceptability, an innovation characteristic purported to be related to fidelity, and its
relation to fidelity of implementation in school settings over an academic school
year. In the next section, a detailed description of treatment acceptability and its
importance for treatment fidelity research will be provided.
Relevance of Monitoring Treatment Acceptability
In educational research, teachers are the primary intervention providers who
have the opportunity to implement behavioral interventions in classroom settings
where there is limited control over extraneous factors. Within the context of
numerous behavioral interventions available, it is important to examine the
acceptability of interventions for use in natural settings (Rotheram-Borus & Duan,
2003). No matter how well an intervention is grounded in theoretical principles and
how well it works in laboratory settings, its ultimate implementation and
maintenance is likely to depend, in part, on the degree to which it is perceived to be
useful by the teachers (Elliott, 1988; Kazdin, 1981; Kurita & Zarabatany, 1991).
Wolf (1978) stated that, "If the participants don't like the treatment, then they may
avoid it, or run away, or complain loudly. And thus, society will be less likely to use
our technology, no matter how potentially effective and efficient it might be" (p.
206) (as cited in Miltenberger, 1993). Similarly, Broughton and Hester (1993) stated
that treatment acceptability is an important component of behavioral consultation
models, because interventions with low acceptability may lead to teacher resistance
against the implementation of the suggested interventions. Therefore, especially in
the educational literature, treatment acceptability is considered to be essential for the
success of a given treatment (Elliott, 1988; Remiers et al., 1987; Sterling-Turner &
Watson, 2002).
14
Scientifically based interventions may be more or less acceptable as a function
of how they are presented, their components, and how they are administered
(Kazdin, 1980). Therefore, examining acceptability of intervention components
might be valuable as it provides information on which parts of the intervention must
be adapted to increase the acceptability (Kazdin, 1980). Improving the overall
acceptability may increase the likelihood that intervention is implemented with
higher fidelity (Kazdin, 1980). Given that teachers’ acceptability ratings of a
recommended intervention may affect compliance with or adherence to the
intervention procedures, providing the most acceptable plan may result in greater
implementation, and therefore desired behavior change (Kazdin, 1981; Remiers et
al., 1987). Therefore it is important to further investigate treatment acceptability and
how it relates to fidelity of implementation.
Treatment Acceptability and Treatment Fidelity
Conceptual Models
In the literature, it is suggested that treatment fidelity is a central component to
treatment acceptability and outcome effectiveness (Witt & Elliott, 1985; Wolf,
1978). This section describes the conceptual models attempting to explain the
relation between acceptability, fidelity and other factors such as the use and
effectiveness of interventions.
Witt and Elliott’s (1985) Model
Witt and Elliott (1985) proposed a model of acceptability which stresses the
sequential and reciprocal relations among treatment acceptability, use, fidelity, and
its effectiveness (as cited in Elliott, 1988). Witt and Elliott suggested that
interventions perceived to be acceptable by the intervention providers are more
likely to be implemented with fidelity, therefore more likely to be effective in
changing behavior than interventions perceived not acceptable (Eckert & Hintze,
2000; Gresham et al., 2000; Von Brock & Elliott, 1987). On the contrary, when an
intervention is not perceived as acceptable, there is an increased chance that the
intervention will be implemented with low fidelity, which in turn will decrease the
15
chances that the intervention will be effective (Elliott, 1988). Witt and Elliott also
suggested a bidirectional relationship between the variables (see Figure 1), where if
an intervention results in effective outcomes, it is more likely to be perceived
acceptable next time it is implemented.
Reimers, Wacker, and Koeppl’s (1987) Model
Building on Witt and Elliott’s (1985) model, Reimers, Wacker, and Koeppl
(1987) developed a more complex model (see Figure 2) that incorporated
“intervention understanding” and “environmental disruption” components to Witt
and Elliott’s model (Eckert & Hintze, 2000; Elliott, 1988). Reimers and colleagues
suggested that acceptability should be assessed only on those interventions that are
well understood. The proposed model indicated that interventions that are well
understood by the clients and have high acceptability ratings are more likely to be
implemented with higher treatment fidelity. The interventions implemented with
higher treatment fidelity would either result in effective or non-effective outcomes.
Highly effective interventions are more likely to be maintained if they are less
disruptive to the environment in which the intervention takes place. Highly
disruptive interventions need to be re-assessed and modified to make sure that they
are more likely to be maintained in the future (Eckert & Hintze 2000; Reimers et al.,
1987).
Elliott (1988) Model
Elliott (1988) suggested that there is a complex array of variables that
potentially interact to influence the model. Therefore, he proposed a modification to
the Reimers and colleagues model by suggesting that, in addition to the interactions
described in Reimer and colleagues model, there might also be a possible relation
between high acceptability and low fidelity, as well as a relation between low
acceptability and high fidelity (see Figure 3). The author suggested that the proposed
models, including his, should be viewed as heuristic guides to stimulate research and
be investigated in more detail.
The models of treatment acceptability created the theoretical foundation in the
16
literature and pioneered the studies emphasizing the relationship between treatment
acceptability and treatment fidelity. The review of available literature on treatment
acceptability and fidelity in educational research will be provided in the next
section.
Treatment Acceptability and Fidelity in Educational Research
Even though ratings of treatment acceptability and fidelity of implementation
are repeatedly reported to be crucial factors in implementation process, there seems
to be a wide gap between the available research and proposed theoretical models.
Recently, School Psychology Quarterly devoted a special issue to the discussion of
treatment acceptability (“Acceptability Research,” 2000). However, as Sterling-
Turner and Watson noted in 2002, no empirical studies were published in the special
issue. In addition to the limited studies available, treatment acceptability and
treatment fidelity traditionally have been investigated using analogue methodology,
fictitious case descriptions, and hypothetical treatment plans (Calvert & Johnston,
1990; Finn & Sladeczek, 2001; Reimers & Wacker, 1992). In this section, the
available literature on acceptability and fidelity is reviewed in two segments: (1)
studies indicating a significant relation, and (2) studies indicating no significant
relation.
A significant relation exists between treatment acceptability and fidelity.
Reimers and Wacker (1992) examined analog and natural ratings of treatment
acceptability of parents with children receiving in-clinic behavior management
services. Parents rated the acceptability of case studies and in-clinic application of
interventions with their children prior to implementation, one-, three-, and six-
months following their clinic visits. The Treatment Acceptability Rating Form
Revised (TARF-R; Reimers & Wacker, 1992) was used to measure acceptability,
and an additional item was added to the TARF-R to measure treatment fidelity. The
results of the cross-lag correlations revealed a significant correlation between
parental report of treatment fidelity at the1-month follow-up and the acceptability
score at 3-months indicating that parents’ treatment fidelity at 1-month follow-up
17
was significantly related to their rating of acceptability at 3 months (Reimers &
Wacker, 1992). The findings of this study provide preliminary data on the relation
between treatment acceptability and treatment fidelity. Even though this study is an
important contribution to the treatment acceptability and fidelity literature by
expanding the literature to natural settings, there are various limitations to the study.
Perhaps most notably, treatment fidelity data is limited to parent self-report as the
primary outcome measure (Sterling-Turner & Watson, 2002). Using self-reports to
monitor treatment fidelity is not recommended because, as an indirect measure of
fidelity, it does not always reveal the actual implementation (Wickstrom et al.,
1998). Another limitation of this study is the assessment of treatment fidelity with
one item, which limited the measurement of implementation and precluded a
component analysis. Therefore it is unknown whether the parents actually
implemented the intervention as intended.
Drawing on the models of treatment acceptability proposed by Witt and Elliott
(1985), and Reimers, Wacker, and Koeppl (1987), Allinder and Oats (1997)
examined the relationship between teachers’ acceptability of implementing
Curriculum-Based Measurement (CBM) to monitor progress, the fidelity of teacher
implementation of CBM procedures, and its relation to intervention outcomes on
math growth (i.e., average weekly gains in digits correct per minute). The CBM
Acceptability scale (CBM-AS), a 20-item Likert-type scale (1 = strongly disagree, 6
= strongly agree), was developed to assess acceptability of CBM to monitor
progress. Treatment fidelity was assessed via permanent product data (i.e., student
performance graphs) and teacher self-report of using CBM method components
(e.g., number of CBM tests given for each target child, the ambitiousness of the
goals, number of times student performance goals were increased, etc.) Post-
acceptability analyses were conducted by dividing teachers into high- and low-
acceptability groups. The results of the multivariate analysis of variance
(MANOVA) indicated that the group of teachers who rated the CBM procedure as a
more acceptable way of monitoring progress tended to give more CBM probes
18
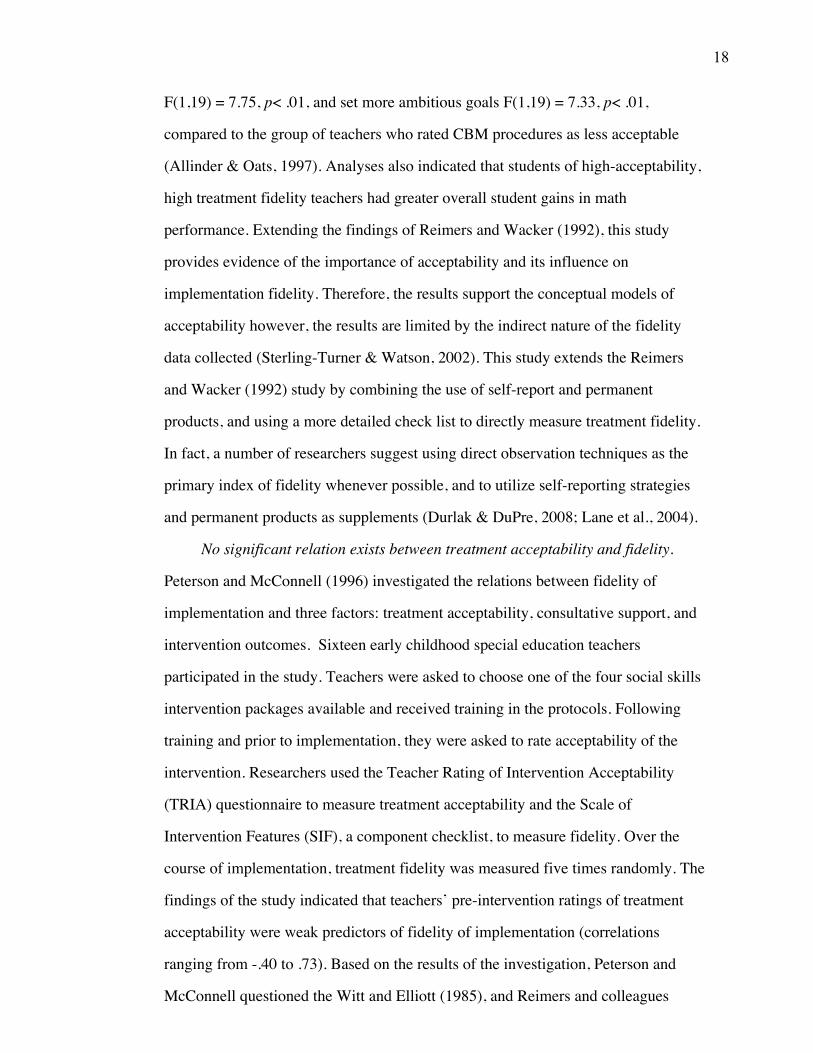
F(1,19) = 7.75, p< .01, and set more ambitious goals F(1,19) = 7.33, p< .01,
compared to the group of teachers who rated CBM procedures as less acceptable
(Allinder & Oats, 1997). Analyses also indicated that students of high-acceptability,
high treatment fidelity teachers had greater overall student gains in math
performance. Extending the findings of Reimers and Wacker (1992), this study
provides evidence of the importance of acceptability and its influence on
implementation fidelity. Therefore, the results support the conceptual models of
acceptability however, the results are limited by the indirect nature of the fidelity
data collected (Sterling-Turner & Watson, 2002). This study extends the Reimers
and Wacker (1992) study by combining the use of self-report and permanent
products, and using a more detailed check list to directly measure treatment fidelity.
In fact, a number of researchers suggest using direct observation techniques as the
primary index of fidelity whenever possible, and to utilize self-reporting strategies
and permanent products as supplements (Durlak & DuPre, 2008; Lane et al., 2004).
No significant relation exists between treatment acceptability and fidelity.
Peterson and McConnell (1996) investigated the relations between fidelity of
implementation and three factors: treatment acceptability, consultative support, and
intervention outcomes. Sixteen early childhood special education teachers
participated in the study. Teachers were asked to choose one of the four social skills
intervention packages available and received training in the protocols. Following
training and prior to implementation, they were asked to rate acceptability of the
intervention. Researchers used the Teacher Rating of Intervention Acceptability
(TRIA) questionnaire to measure treatment acceptability and the Scale of
Intervention Features (SIF), a component checklist, to measure fidelity. Over the
course of implementation, treatment fidelity was measured five times randomly. The
findings of the study indicated that teachers’ pre-intervention ratings of treatment
acceptability were weak predictors of fidelity of implementation (correlations
ranging from -.40 to .73). Based on the results of the investigation, Peterson and
McConnell questioned the Witt and Elliott (1985), and Reimers and colleagues
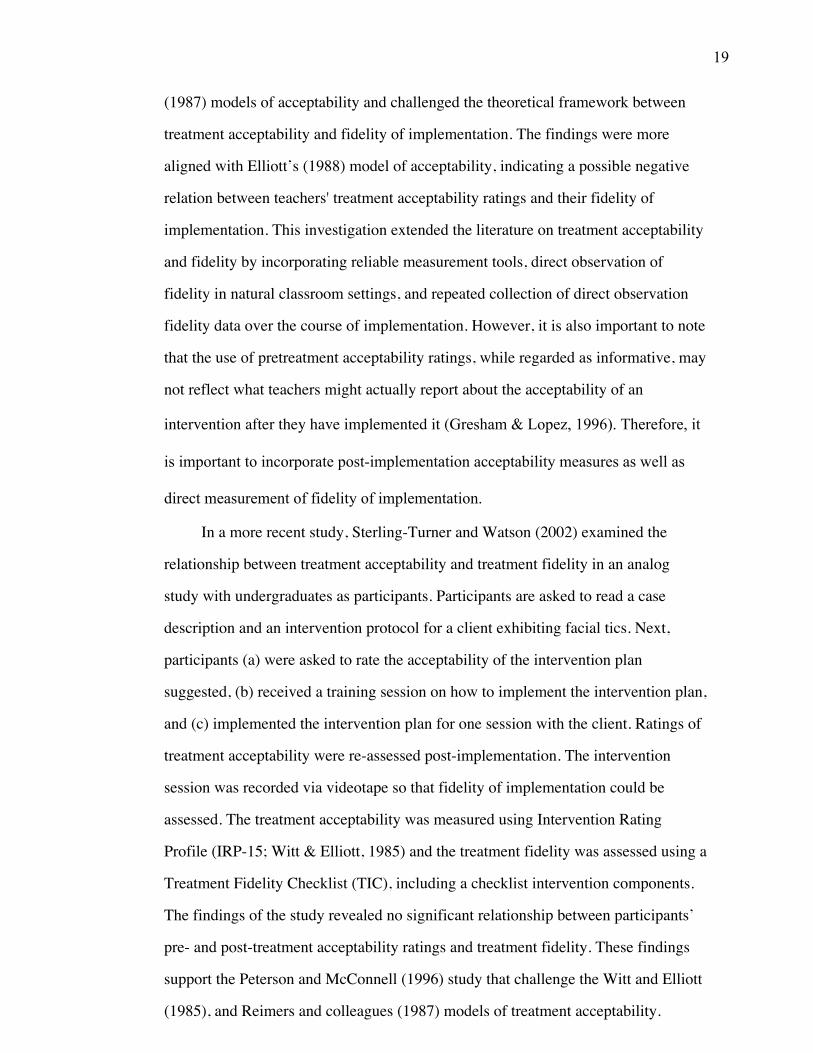
19
(1987) models of acceptability and challenged the theoretical framework between
treatment acceptability and fidelity of implementation. The findings were more
aligned with Elliott’s (1988) model of acceptability, indicating a possible negative
relation between teachers' treatment acceptability ratings and their fidelity of
implementation. This investigation extended the literature on treatment acceptability
and fidelity by incorporating reliable measurement tools, direct observation of
fidelity in natural classroom settings, and repeated collection of direct observation
fidelity data over the course of implementation. However, it is also important to note
that the use of pretreatment acceptability ratings, while regarded as informative, may
not reflect what teachers might actually report about the acceptability of an
intervention after they have implemented it (Gresham & Lopez, 1996). Therefore, it
is important to incorporate post-implementation acceptability measures as well as
direct measurement of fidelity of implementation.
In a more recent study, Sterling-Turner and Watson (2002) examined the
relationship between treatment acceptability and treatment fidelity in an analog
study with undergraduates as participants. Participants are asked to read a case
description and an intervention protocol for a client exhibiting facial tics. Next,
participants (a) were asked to rate the acceptability of the intervention plan
suggested, (b) received a training session on how to implement the intervention plan,
and (c) implemented the intervention plan for one session with the client. Ratings of
treatment acceptability were re-assessed post-implementation. The intervention
session was recorded via videotape so that fidelity of implementation could be
assessed. The treatment acceptability was measured using Intervention Rating
Profile (IRP-15; Witt & Elliott, 1985) and the treatment fidelity was assessed using a
Treatment Fidelity Checklist (TIC), including a checklist intervention components.
The findings of the study revealed no significant relationship between participants’
pre- and post-treatment acceptability ratings and treatment fidelity. These findings
support the Peterson and McConnell (1996) study that challenge the Witt and Elliott
(1985), and Reimers and colleagues (1987) models of treatment acceptability.
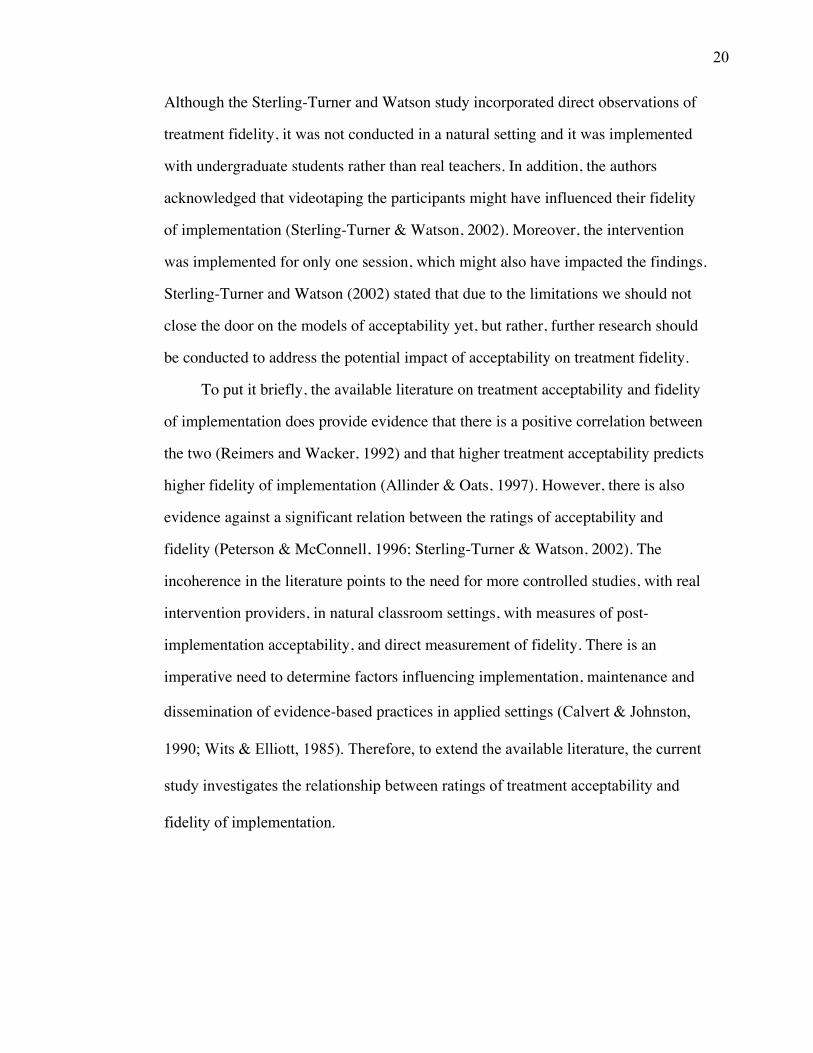
20
Although the Sterling-Turner and Watson study incorporated direct observations of
treatment fidelity, it was not conducted in a natural setting and it was implemented
with undergraduate students rather than real teachers. In addition, the authors
acknowledged that videotaping the participants might have influenced their fidelity
of implementation (Sterling-Turner & Watson, 2002). Moreover, the intervention
was implemented for only one session, which might also have impacted the findings.
Sterling-Turner and Watson (2002) stated that due to the limitations we should not
close the door on the models of acceptability yet, but rather, further research should
be conducted to address the potential impact of acceptability on treatment fidelity.
To put it briefly, the available literature on treatment acceptability and fidelity
of implementation does provide evidence that there is a positive correlation between
the two (Reimers and Wacker, 1992) and that higher treatment acceptability predicts
higher fidelity of implementation (Allinder & Oats, 1997). However, there is also
evidence against a significant relation between the ratings of acceptability and
fidelity (Peterson & McConnell, 1996; Sterling-Turner & Watson, 2002). The
incoherence in the literature points to the need for more controlled studies, with real
intervention providers, in natural classroom settings, with measures of post-
implementation acceptability, and direct measurement of fidelity. There is an
imperative need to determine factors influencing implementation, maintenance and
dissemination of evidence-based practices in applied settings (Calvert & Johnston,
1990; Wits & Elliott, 1985). Therefore, to extend the available literature, the current
study investigates the relationship between ratings of treatment acceptability and
fidelity of implementation.

21
Treatment Fidelity Over Time
In the educational literature, there is a need for rigorous studies that allow
longitudinal assessment of teacher and student behavior to make it possible to
examine the intervention outcomes comprehensively (Kutash, Duchnowski, & Lynn,
2009). Nevertheless, very little attention is given to the assessment of treatment
fidelity over time. The PsycINFO database contains more than one thousand peer-
reviewed journal articles devoted to the topic of “treatment fidelity” (aka procedural
fidelity, integrity, treatment compliance, and adherence). However, only six articles
emerge when the search criteria are narrowed down to longitudinal examination of
fidelity in the context of educational studies. Of the journal articles on the topic,
only one (i.e., Kutash et al., 2009) focuses particularly on fidelity of implementation
in the educational literature over time in applied settings.
Kutash and colleagues (2009) conducted a two-phased investigation to
examine the degree to which implementation of evidence-based practices were
sustained over time in school settings. The study was conducted with teachers in two
phases. Phase I included development of effective strategies tailored to classroom
needs. Phase II included examination of fidelity of implementation longitudinally, 5
months and 13 months after Phase I was completed. Twenty-five special education
teachers (10 from the comparison school, and 15 from the project school)
participated in the study. Over the course of Phase I and II, teachers in the project
school received five training sessions and one booster session five months after the
final training session. The results suggested significant differences between the
project (M = 24.8, SD = 4.8) and control schools (M = 17.4, SD = 6.2) in fidelity of
implementation [t(22) = 10.07, p < .01]. Moreover, teachers in the project school
maintained 62% of the fidelity of intervention components 13 months after Phase I.
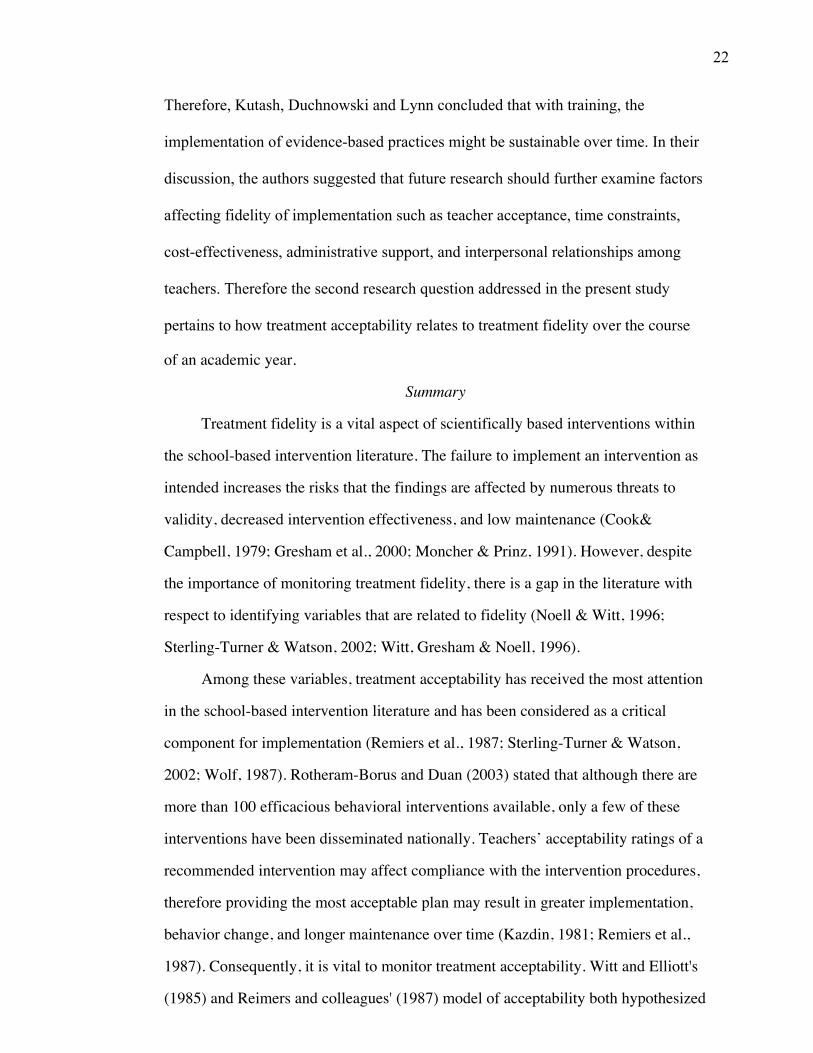
22
Therefore, Kutash, Duchnowski and Lynn concluded that with training, the
implementation of evidence-based practices might be sustainable over time. In their
discussion, the authors suggested that future research should further examine factors
affecting fidelity of implementation such as teacher acceptance, time constraints,
cost-effectiveness, administrative support, and interpersonal relationships among
teachers. Therefore the second research question addressed in the present study
pertains to how treatment acceptability relates to treatment fidelity over the course
of an academic year.
Summary
Treatment fidelity is a vital aspect of scientifically based interventions within
the school-based intervention literature. The failure to implement an intervention as
intended increases the risks that the findings are affected by numerous threats to
validity, decreased intervention effectiveness, and low maintenance (Cook&
Campbell, 1979; Gresham et al., 2000; Moncher & Prinz, 1991). However, despite
the importance of monitoring treatment fidelity, there is a gap in the literature with
respect to identifying variables that are related to fidelity (Noell & Witt, 1996;
Sterling-Turner & Watson, 2002; Witt, Gresham & Noell, 1996).
Among these variables, treatment acceptability has received the most attention
in the school-based intervention literature and has been considered as a critical
component for implementation (Remiers et al., 1987; Sterling-Turner & Watson,
2002; Wolf, 1987). Rotheram-Borus and Duan (2003) stated that although there are
more than 100 efficacious behavioral interventions available, only a few of these
interventions have been disseminated nationally. Teachers’ acceptability ratings of a
recommended intervention may affect compliance with the intervention procedures,
therefore providing the most acceptable plan may result in greater implementation,
behavior change, and longer maintenance over time (Kazdin, 1981; Remiers et al.,
1987). Consequently, it is vital to monitor treatment acceptability. Witt and Elliott's
(1985) and Reimers and colleagues' (1987) model of acceptability both hypothesized
23
that acceptable interventions are more likely to be implemented with higher
treatment fidelity, which is assumed to result in more effective intervention
outcomes. Elliott's (1988) model of acceptability extended the Reimers and
colleagues' model to reflect a possible relation between low acceptability and high
fidelity, as well as high acceptability and low fidelity. The models of treatment
acceptability created the theoretical foundation in the literature and stimulated the
studies examining the relationship between treatment acceptability and treatment
fidelity. However, very few studies have been published on the topic in the
educational literature. The scarcity of available research and the inconsistency in the
results point to the need for more controlled studies, with real intervention providers,
in natural classroom settings, with measures of post-implementation acceptability,
and direct measurement of fidelity.
The present study proposes to fill this gap by examining the relationship
between teachers’ post-treatment acceptability ratings and direct observations of
fidelity of implementation. Moreover, there is a scarcity of longitudinal studies
investigating fidelity of implementation and the factors affecting it. Therefore, to
further extend the literature, the present investigation also focuses on examining
how treatment acceptability relates to treatment fidelity over the course of an
academic year.
Research Questions
In the context of a longitudinal efficacy trial of a classroom management package:
1. How does treatment acceptability of individual and combined components
relate to treatment fidelity?
2. Does fidelity of implementation of individual and combined components
vary as a function of treatment acceptability over time?

24
CHAPTER III
Method
This investigation was designed to address two research questions: (a) How
does treatment acceptability of individual and combined components relate to
treatment fidelity?, and (b) Does fidelity of implementation of individual and
combined components vary as a function of treatment acceptability over time?
Summary
Forty-four teachers participated in this investigation. After two weeks of
training, teachers implemented the multi-component intervention package
(Classroom Organization and Management Program, Good Behavior Game, and
Self Monitoring) in their classrooms. Once a week, trained observers conducted
direct observation of treatment fidelity and offered feedback to teachers. The study
was carried out for an academic school year with fidelity data collected for an
average of 15.5 weeks (excluding training, school breaks, and missing data). At the
end of the school year, teachers filled out acceptability ratings for the combined and
individual components of the intervention package. The relation between treatment
acceptability and fidelity of implementation was studied by examining the fidelity of
implementation on weeks 2, 7, and 12, and the total treatment acceptability score.
Study Background
The current investigation was a complementary analysis for the federally
funded multi-site project, “Reducing Severe Behavior Problems in Schools.” The
project was implemented to evaluate the efficacy of combined classroom
management interventions and academic tutoring for students at-risk for or
diagnosed with emotional and behavioral disorders (EBD). It was implemented over
the course of two academic years. The current study examined pre-existing data on

25
the subset of teachers who participated in the study for the duration of the second
academic year. Data from year two was chosen for this investigation given the
increased number of teachers participating over a longer duration of time, thereby
making it possible to examine the data longitudinally with the highest number of
participants.
Setting and Participants
Participants were selected from 15 schools that agreed to participate in the
federally funded project. The schools were distributed across three large
metropolitan school districts from three regions of the United States. Districts
ranged in size from 23,200 – 70,140 enrolled students with an average racial
demographic of 58% Black, 24% White, 12% Hispanic, 4 % Asian, and 2%
American Indian. Across all three districts, an average of 12% of students had
limited English proficiency, 15% received special education services, and 69%
qualified for free or reduced lunch.
The participants represented a diverse sample of special and general
education teachers serving kindergarten through 6th grade. Forty-four teachers
participated in the current investigation. Four out of 44 teachers included in the
current analysis had missing demographics data. As shown in Table 1,
demographics on the remaining participants included 40 teachers; 9 men and 31
women. Seven (17.5%) teaching at kindergarten level, 14 (35%) at 1st grade level,
18 (45%) at 2nd grade level, 23 (57.5 %) at 3rd grade level, 14 (35%) at 4th grade
level, 4 (10%) teaching at 5th grade level and 5 (12.5%) teaching at 6th grade level.
Twenty-one (52.5%) teachers self-reported as White, 17 (42.5%) as Black, 1 (2.5%)
as American Indian, and 1 (2.5%) teacher declined to state ethnicity.
26
Fifteen (37.5%) were general education teachers, 24 (60%) were special
education teachers, 5 (12.5%) taught as itinerant teachers (i.e., teaching at multiple
schools), and 1 (2.5%) taught as a long-term substitute teacher. Teachers had a mean
of 10.5 years of teaching experience (SD = 10; Range = 0 to 32 years) and a mean of
8.2 years of teaching experience with children receiving special education services
(SD = 9.5; Range = 0 to 32 years). Ten (25%) teachers had a Bachelor’s degree, 15
(37.5%) had completed 1 year of course work additional to Bachelor’s degree, 12
(30%) had a Masters degree, and 3 (7.5%) had completed 1-year coursework
additional to Masters degree.
Eligibility criteria
The current study examined pre-existing data on the sample of teachers who
participated in the study during the second academic year of the efficacy trial. Fifty-
three teachers were identified to participate in the study. Out of the fifty-three
teachers, 9 were excluded from the study due to missing data for both the
independent and dependent variables. Therefore 44 teachers were included for the
data analyses associated with this investigation.
Multi-Component Classroom Management Intervention Package
Ineffective classroom management strategies tend to set the stage for
negative student-teacher interactions and therefore contribute to increased levels of
problem behavior (Gunter & Coutinho, 1997). A multi-component classroom
management package was developed to improve student behavior. The package
consisted of Classroom Organization and Management Program (COMP; Evertson
& Harris, 2003), Self Monitoring (Sutherland & Wehby, 2001), and the Good
Behavior Game (GBG; Barrish, Saunders, & Wolf, 1969). A brief description of
each component of the package is provided below.
27
Classroom Organization and Management Program (COMP)
COMP is designed to improve implementation of research-based
instructional and organizational strategies in classroom settings (Evertson, Emmer,
Sanford, & Clements, 1983; Weade & Evertson, 1988). It is based on the notion that
effective classroom teachers use proactive strategies, combine management and
instruction in a positive environment, and utilize students as active participants.
COMP consists of seven core components, including (a) organizing the classroom,
(b) planning and teaching rules and procedures, (c) managing student work and
improving student accountability, (d) maintaining good student behavior, (e)
planning and organizing, (f) conducting instruction and maintaining momentum, and
(g) getting the year off to a good start.
Good Behavior Game (GBG)
The GBG is an interdependent group-oriented contingency in which teachers
offer systematic responses to a pre-specified set of rules that result in some form of
visual consequence (e.g., a mark on the board) for the team. At the end of the
scheduled period playing the GBG, groups of students either gain or lose reinforcers
depending on compliance with the rules of the game. A number of studies have
demonstrated the effectiveness of GBG for decreasing noncompliance (Barrish et
al., 1969; Harris & Sherman, 1973; Lannie & McCurdy, 2007; Medland & Stachnik,
1972; Swiezy, Matson, & Box, 1992; Tanol, Johnson, McComas, & Cote, 2010;
Tingstrom, Sterling-Turner & Wilczynski, 2006).
28
Self-Monitoring
Self-monitoring (Sutherland & Wehby, 2001) is a method in which teachers
monitor the frequency of their own praise statements and opportunities to respond
(OTRs) directed to students. It compliments COMP and GBG by creating
opportunities for teachers to systematically evaluate their own instructional methods
and in turn to create an opportunity to increase the use of effective instructional
practices (Sutherland, Alder, & Gunter, 2003; Sutherland & Wehby, 2001;
Sutherland, Wehby, & Copeland, 2000).
Procedures
Prior to implementation, all teachers as well as behavioral consultants
participated in a two-day COMP workshop that was conducted by a nationally
certified COMP trainer. In addition to the two-day training, all teachers received two
weeks of small group and individualized training on procedures for GBG and self-
monitoring. Project directors and behavioral consultants conducted the trainings on
GBG and self-monitoring. To ensure that all teachers were directed to implement the
same procedures, identical presentation materials and fidelity of implementation
checklists were used with all participants. At the completion of training, behavioral
consultants conducted weekly direct observations of treatment fidelity, with the
checklists used in training. The observations were continued for an average of 15.5
weeks. The behavioral consultants consisted of graduate students in special
education and related disciplines. The behavioral consultants were responsible for
collecting data, consultation, and teacher training. The consultation included: (a)
direct observation of language arts instruction, (b) providing resources needed to
initiate and sustain implementation, (c) providing explicit feedback following
instruction on the treatment fidelity checklist observations, and if necessary (d)

29
modeling implementation for the teacher. The project coordinators in each site were
responsible for the weekly supervision of behavioral consultants.
Training and Consultation
Classroom Organization and Management Program (COMP)
Teachers participated in a two-day workshop given by a nationally certified
COMP trainer and received COMP manuals for future reference. As part of the
training, teachers were: (a) asked to organize their classrooms to allow for
instructional efficiency and minimal distractions, (b) plan and teach rules and
routines in the classroom, (c) manage student work to improve student
accountability, (d) use behavior specific praise to encourage appropriate student
behavior, (e) organize instructional activities to increase learning, (f) increase
student interest and pace of teaching, and (g) plan for a structured beginning of the
school year. Weekly consultations were continued after the completion of training.
The consultations included retraining and modeling on the core elements,
brainstorming solutions to daily classroom management problems, and developing
classroom rules.
Good Behavior Game (GBG)
Teachers were exposed to approximately 2 hours of training as a group with
a behavioral consultant on the project. During training, teachers received the
resources needed for implementation (i.e., timer, poster, etc.), identified their
classroom rules, and selected teams of students. As part of the training, teachers
were asked to: (a) identify up to three behaviors to be targeted for change and come
up with rules to address these behaviors, (b) assign students to teams, (c) monitor the
occurrences of target behaviors for 10 minutes, (d) review the number of
occurrences and announce the winners at the end of 10 minutes. For the first two

30
weeks after group training, additional individualized support was offered to each
teacher that involved 1-2 additional hours of discussion with a consultant about the
procedures for implementation, direct observation of early attempts to implement,
and modeling of implementation by the consultant. After training, teachers received
weekly performance feedback, retraining, and modeling on the intervention
procedures based on the consultant’s direct observation of implementation.
Self-Monitoring
As part of the training, teachers were asked to: (a) use an audiotape recorder
to record 15 minutes of their language arts instruction on a daily basis, (b) monitor
their use of praise statements and OTRs by listening to a 5 minute sample from the
recordings and record the occurrences of both behaviors, (c) calculate the rate of
praise statements and OTRs for 15 minutes, (d) graph the daily rates on each
behavior, (e) establish a personal goal based on the daily performance. After two
weeks of training, consultants provided weekly feedback on implementation. The
weekly consultations included any combination of the following: listening to the
audiotapes with teachers, giving feedback on identifying praise statements and
OTRs, providing materials such as audiotapes and batteries, graphing charts with
teachers, and completing weekly fidelity observations on the procedures
implemented.
Independent Variables
Treatment Acceptability
The present study was carried out for an academic school year with fidelity
data collected for an average of 15.5 weeks (excluding training, school breaks, and
missing data). At the end of the school year, teachers completed post-treatment
acceptability ratings on the combined and individual components of the intervention
31
package. Researchers provided teachers with the acceptability rating scales and
asked them to take 30 minutes to complete the acceptability rating scales. The rating
scales were collected a week after they were distributed. Rating scales were
collected for the following; (a) Overall acceptability of the comprehensive package,
(b) COMP treatment acceptability, (c) GBG treatment acceptability, and (d) Self-
monitoring treatment acceptability. Treatment acceptability measures were selected
as the independent variables examined in this investigation. See APPENDIX A for
the treatment acceptability rating scales. The Cronbach’s alpha for the treatment
acceptability rating scales and the items excluded/included are described in detail
below.
COMP Treatment Acceptability
A 10-item checklist was adopted for measuring the acceptability of COMP
component. Ratings from items were rated on a scale ranging from 1 (strongly
disagree) to 5 (strongly agree). Possible scores ranged from 10 to 50, with higher
scores indicating greater acceptability. The Cronbach’s alpha for the COMP
treatment acceptability rating scale was .94, indicating strong reliability.
The items consisted of (a) I enjoyed implementing COMP elements in my
classroom, (b) I plan to use COMP in my classroom in the future, (c) After using
COMP elements in my classroom, I was able to see immediate changes in my
students’ behavior, (d) The addition of COMP elements has improved academics in
my classroom, (e) The addition of COMP elements has improved behavior in my
classroom. (f) I found it easy to use COMP in my classroom, (g) COMP was a good
fit for students in my classroom, (h) Adding elements of COMP did not interfere
with academic instruction and routines in my classroom, (i) Using COMP elements
32
did not take up too much of my time, and (j) I understood the COMP elements I was
trained on.
One item was excluded from the rating scale depending on the results of
“Cronbach’s alpha if item deleted” analysis. Item deleted is “I received adequate
training on COMP elements.” The models of treatment acceptability also supported
the exclusion of the items since adequate training is an important factor that affects
the level of treatment acceptability but not necessarily considered as a part of
treatment acceptability (Reimers et al., 1987).
GBG Treatment Acceptability
A 12-item checklist was adopted for measuring GBG treatment acceptability.
Each item is rated on a 5-point Likert-type scale (1 = strongly disagree; 5 = strongly
agree). Possible scores ranged from 12 to 60, with higher scores indicating greater
acceptability. The Cronbach’s alpha for the rating scale was .96, indicating strong
reliability.
The items on the rating scale were as follows (a) I enjoyed implementing
GBG in my classroom, (b) I plan to use GBG in my classroom in the future, (c)
After using GBG in my classroom, I was able to see immediate changes in my
students’ behavior, (d) The addition of GBG has improved academics in my
classroom, (e) The addition of GBG has improved behavior in my classroom, (f)
The addition of the GBG has improved the atmosphere in my classroom, (g) I found
it easy to use GBG in my classroom, (h) GBG was a good fit for students in my
classroom, (i) Adding GBG did not interfere with academic instruction and routines
in my classroom, (j) Using GBG did not take up too much of my time, (k) I
understood how to use the GBG, and (l) I do not know of any other interventions
that would be a better fit for my students.
33
One item was excluded from the rating scale depending on the results of
“Cronbach’s alpha if item deleted” analysis. Similar to COMP treatment
acceptability, item deleted was “I received adequate training on GBG in my
classroom.” The item was also excluded for being a predictor of treatment
acceptability rather than being a part of treatment acceptability definition (Reimers
et al., 1987).
Self-Monitoring Treatment Acceptability
An 11-item checklist was adopted for use with Self-Monitoring. Ratings
from items were rated on a scale ranging from 1 (strongly disagree) to 5 (strongly
agree). Possible scores on the rating scale range from 12 to 60, with higher scores
indicating greater acceptability. The Cronbach’s alpha for the rating scale was .93,
indicating strong reliability.
The items consisted of (a) I would recommend this program to other
teachers, (b) I plan to use this program in the future, (c) I believe I will take away
lasting benefits from using this program, (d) I noticed positive changes in my
behavior quickly after beginning to implement this program, (e) I am pleased with
the behavioral changes this program created, (f) This program has improved the
atmosphere in my classroom, (g) I found this program easy to use, (h) This program
did not interfere with my teaching activities and other responsibilities, (i) This
program did not take up too much of my time, (j) I received ongoing support and
feedback while using this program, and (k) This program was cost-effective to
implement in my classroom. One item was excluded from the rating scale depending
on the results of “Cronbach’s alpha if item deleted” analysis. Similar to COMP and
GBG treatment acceptability, item deleted was “I was well trained in how to
implement this program.”

34
Overall Treatment Acceptability
Overall treatment acceptability rating scale consisted of perceived
acceptability of the multi-component intervention package. A 12-item checklist was
developed by primary investigators to assess the overall acceptability. Each item
was rated on a 5-point Likert-type scale (1 = strongly disagree; 5 = strongly agree).
Possible total scores ranged from 12 to 60, with higher scores indicating greater
acceptability. The Cronbach’s alpha for the overall treatment acceptability rating
scale was .96, indicating strong reliability.
The items on the rating scale were as follows (a) I would recommend this
program to other teachers, (b) I would use this program with future students in my
classroom, (c) The program was effective in improving my students’ behavior, (d) I
am happy with the academic changes this program created, (e) I am happy with the
behavioral changes this program created, (f) My students will probably take away
permanent benefits from this program, (g) I liked the procedural components of this
program, (h) I found the program to be reasonable based on the characteristics of my
students, (i) The program did not interfere with my other teaching
activities/responsibilities, (j) The program was easy to use in my classroom, (k) The
program did not take up too much of my time each day, and (l) The program was
cost-effective to implement in my classroom. One item was excluded from the
analysis based on the results of “Cronbach’s alpha if item deleted” analysis. Item
deleted was “This program has improved the atmosphere in my classroom.”
35
Dependent Variables
Treatment Fidelity
Treatment fidelity was monitored weekly for the duration of language arts
instruction to evaluate teachers’ implementation of the intervention package. Three
time points were selected to examine fidelity of implementation. The second week
of independent implementation was selected as a logical starting point for the
analysis (Time 1). The intervals between time points were kept constant at five
weeks, therefore week 7 and week 12 were chosen as Time 2 and Time 3.
Checklists were adopted for use with each individual component (i.e.,
COMP, GBG, and Self-monitoring). See APPENDIX B for the checklists.
Treatment fidelity scores for combined and individual components of the
intervention package were identified as the dependent variables to be examined in
this investigation. Dichotomous ratings of observed and not observed, and quality
ratings of implementation were completed for each item on the checklist. Quality
ratings were incorporated because various researchers suggested moving from
simple measurement of treatment fidelity to more complex measures incorporating
the extent to which an intervention occurs (Durlak & DuPre, 2008; Smith et al.,
2007). However, treatment fidelity measures did not have identical metric systems
for the quality ratings. Therefore, to merge dichotomous and quality ratings, and to
have an identical metric system across the individual components of the intervention
package a standardization process is implemented which transformed the scales,
ranging from 0 to 1. The fidelity checklists for each component of the intervention
package are described below.

36
COMP Treatment Fidelity
A 28-item checklist was adapted to measure COMP treatment fidelity. The
checklist consisted of three components including (a) 12-items for teacher praise, (b)
9-items for rules and procedures, (c) 7-items for physical arrangement. The quality
of treatment fidelity was rated 1 (strongly disagree), 2 (disagree), 3 (neutral), 4
(agree) and 5 (strongly agree). To standardize the ratings, COMP treatment fidelity
rating was transformed to (1) “0” if the component was not implemented, (2) “0.2”
if the component was implemented with strong disagreement to the quality of
implementation, (3) “0.4” if the component was implemented with disagreement to
the quality of implementation, (3) “0.6” if the component was implemented with
neutral agreement to the quality of implementation (4) “0.8” if the component was
implemented with agreement to the quality of implementation, (5) “1” if the
component was implemented with strong agreement to the quality of
implementation. In order to calculate the rating score, percentage value is calculated
by adding the total number of points obtained from three components of COMP,
dividing it by total score available, and multiply by 100.
The items on teacher praise component of COMP fidelity check list
consisted of (a) Teacher is verbally affectionate to students, (b) Teacher is
physically affectionate with students, (c) Teacher is positive and reinforcing, (d)
Teacher seems to have good control of and influence over students, (e) There are
friendly relations between teacher and students, (f) Teacher relates positive, rather
than negative, comments about children to other students and adults, (g) The teacher
speaks courteously and calmly, (h) The body language, facial expressions and
intonation of the teacher are positive, (i) Teacher reprimands are constructive and
37
specific, (j) Teacher praise is specific, and (k) Teacher praise is distributed equally
among students.
The items on rules and procedures component of COMP fidelity check list
consisted of (a) Classroom rules are posted clearly and are visible to all students, (b)
There is an effective classroom management system in place, (c) The class schedule
is clearly posted and is visible to all students, (d) Major class procedures (i.e.,
student talk, lining up, etc.) are followed without prompting, (e) Teacher reinforces
appropriate behavior effectively (i.e. following rules), (f) Rules are enforced
consistently, (g) Transition times are governed by rules and run smoothly, (h) The
teacher’s method of getting student’s attention is effective, and (i) Administrative
routines (i.e., attendance, record keeping etc.) are carried out efficiently.
The items on physical arrangement component of COMP fidelity check list
consisted of (a) Teacher is able to monitor students effectively, (b) Students can see
all necessary instructional displays clearly, (c) Teachers and students can move
around the classroom with ease, (d) Congestion does not occur often in certain areas
of the classroom, (e) Students have adequate personal space (i.e., desks, cubbies,
etc.), (f) The classroom is crowded or cluttered, and (g) Elements of the room (i.e.,
windows, displays, computers etc.) are not distracting to students.
GBG Treatment Fidelity
An 18-item checklist was adapted to measure GBG treatment fidelity. The
quality of treatment fidelity was rated 1 (not implemented), 2 (minimal fidelity), 3
(half/partial fidelity), 4 (adequate fidelity), and 5 (full fidelity). To standardize the
ratings, the COMP treatment fidelity was transformed to (1) “0” if the component
was rated as not implemented, (2) “0.25” if the component was implemented with
minimal fidelity, (3) “0.5” if the component was implemented with partial fidelity,
38
(4) “0.75” if the component was implemented with good fidelity, (5) “1” if the
component was implemented with full fidelity. In order to calculate the weekly
score, the percentage of treatment fidelity was calculated by adding the total number
of points obtained from GBG measure, dividing it by total score available, and
multiply by 100.
The items on the fidelity check list consisted of (a) Announcing the game
before beginning, (b) Announcing group members before beginning, (c) Referring to
classroom rules, (d) Explaining classroom rules, (e) Explaining the requirements to
win, (f) Explaining the violation process, (f) Setting the game timer, (g) Announcing
the start of the game, (h) Responding immediately to rule violation, (i) Responding
with a normal tone of voice, (j) Identifying the child or team, (k) Praising the other
team(s), (l) Reviewing scores at the end of the game, (m) Reviewing rules at the end
of the game, (n) Record each team’s performance on data sheet, (o) Handing out
prizes or deliver other reinforces, and (p) Erase game board for the following day,
and (q) Inform students that the game will be played during some days of the week,
and that there will be a weekly winner.
Self-Monitoring Treatment Fidelity
A 7-item checklist was adapted to measure Self-monitoring treatment
fidelity. Dichotomous ratings of observed and not observed were completed for each
item on the checklist. However, quality ratings were not assigned due to the nature
of items (e.g., teacher listened to audiotape of lesson for 5 min at least once per
week). Therefore the rating scores assigned were (1) “0” for not implementation,
and (2) “1” for implementation.

39
The items consisted of (a) Teacher listened to audiotape of lesson for 5 min
at least once per week, (b) Teacher coded OTR from 5 min segment at least once per
week, (c) Teacher coded praise from 5 min segment at least once per week, (d)
Teacher converted Opportunities to Respond (OTR) rate per 15 min segment, (e)
Teacher converted praise rate per 15 min segment, (f) Teacher graphed OTR rate
(converted) at least once per week, and (g) Teacher graphed praise rate (converted)
at least once per week.
Overall Treatment Fidelity
The overall treatment fidelity was calculated by adding the percentage score
for all three components of the intervention package (GBG, COMP, Self-
Monitoring). First the percentage of treatment fidelity for each intervention
component was calculated by adding the total number of points obtained from each
measure, dividing it by total score available, and multiplying by 100. After obtaining
a percentage score for each intervention component, the obtained scores were added
to determine the overall score. The scores were computed for each week of
implementation, for an average of 15.5 weeks of implementation. This gave an
opportunity to examine the overall fidelity of implementation for the comprehensive
intervention package as well as the individual components of the intervention.
Reliability of the observation system
The reliability of the observation systems for this study was established by
calculating intra-class correlation coefficients (ICC) for each dependent variable
(COMP treatment fidelity, GBG treatment fidelity, and Self-monitoring treatment
fidelity).
40
Data Analysis
To address the first research question examining the relation between
acceptability and fidelity, correlation tables were constructed based on Pearson
correlations. To address the second research question examining differences in
implementation over time for groups based on high and low ratings of treatment
acceptability, a series of repeated measure analyses of variance (RM-ANOVA) were
completed.
41
CHAPTER IV
Results
Research Questions
In the context of a longitudinal efficacy trial of a classroom management package:
1. How does treatment acceptability of individual and combined components
relate to treatment fidelity?
2. Does fidelity of implementation of individual and combined components
vary as a function of treatment acceptability over time?
Participants with Prior Exposure to the Interventions
The data examined for this investigation included a subset of teachers with
previous exposure (6 weeks) to the intervention package during the academic year
that preceded the 15.5 weeks of implementation for this study. To ensure that there
were no group differences between teachers with previous exposure to the
intervention package (N = 20) and those without previous exposure (N = 22) in
measures of treatment acceptability (TA) and treatment fidelity (TF), an independent
groups t-test was performed. Overall TA for teachers with prior exposure to the
intervention package (M = 44.10, SD = 8.9), did not significantly differ from the
teachers without prior exposure (M = 46.7, SD = 9.33) (t(38) = .902, p = .37).
Similarly, no significant difference was found between COMP TA for teachers with
(M = 37.65, SD =5.9), and without prior exposure (M = 40.82, SD = 7.1) to the
intervention package (t(35) = -1.49 p = .15). GBG TA for teachers with prior
exposure (M = 42.35, SD = 11.52), did not significantly differ from the teachers
without prior exposure (M = 44, SD = 10.3) to the treatment intervention (t(39) =
.48, p = .63). Lastly, there was no significant difference between teachers with (M =
42.35, SD = 7.2) and without prior exposure (M = 41.43, SD = 8) to the intervention
42
package in terms of SM TA (t(39) = -.35, p = .73). In sum, based on these findings,
there were no differences on ratings of treatment acceptability and treatment fidelity
between teachers with previous exposure to the interventions and those without.
Therefore, both sets of teachers were included for all subsequent analyses.
Time-points sampled for analyses
The study was conducted for an academic school year with fidelity data
collected for an average of 15.5 weeks (excluding training, school breaks and
missing data). At the completion of implementation, teachers completed
acceptability checklists for each component of the package. The relation between
treatment acceptability and fidelity of implementation was studied by examining the
fidelity of implementation on weeks 2, 7, and 12, and the total treatment
acceptability score. Three time points were selected for the longitudinal analyses.
Teachers received two weeks of training prior to independent implementation of
intervention package. At the completion of training, teachers were given one week
to independently implement the intervention strategies. At the second week of
independent implementation teachers were expected to fully implement the
intervention strategies independently. Therefore, the second week was selected as a
logical starting point for the analysis (Time 1). The intervals between time points
were kept constant at five weeks. Therefore, for the purposes of this investigation,
week 7 and week 12 were designated as Time 2 and Time 3. See Table 3 for
descriptive statistics on treatment acceptability measures for each individual
component across each of the three time points.
43
Assumptions Analysis
Normality and homogeneity of variance assumptions were assessed by
examining Q-Q plots, skewness and kurtosis for each dependent variable to analyze
whether the dataset follows an acceptable normal distribution (see Table 3). The
distribution of the standardized Q-Q plots, skeweness and kurtosis values were
determined to be within the range of normality for overall fidelity of
implementation, COMP and GBG components (see Figure 4). The self-monitoring
component revealed slight deviation from the normality with kurtosis values close or
equal to-/+ 2. However, researchers have suggested that analyses such as
correlations and analysis of variance are relatively robust against non-extreme
deviations from normality (Utts & Heckard, 2006). Moreover, the skewness and
kurtosis values are deemed within the normal range if smaller than 2 standard errors
-/+. Therefore it was concluded that it was appropriate to proceed with the analyses.
The assumption of sphericity was investigated with Mauchly’s tests. The
results of Mauchly’s tests were not statistically significant, indicating sphericity for
each analysis. However, Mauchly’s test results generally cannot be trusted
(Keselman, Mendoza, Rogan, & Breen, 1980). Therefore Greenhouse-Geisser
adjustment was implemented to protect against the inflated type I error for each
separate analysis.
Research Question 1: How does treatment acceptability of individual and combined
components relate to treatment fidelity?
The classroom management package developed for the purposes of this study
consisted of three individual components: COMP, Self-monitoring, and GBG. Each
component was implemented to supplement the other and, as a package, to enhance
the intervention effects in classrooms. Given that the interventions were
44
implemented concurrently, the relation between overall acceptability and overall
fidelity was analyzed. Nonetheless, the intervention package did contain individual
components, therefore the relation between acceptability and fidelity of individual
components of the package were analyzed as well. Table 4 displays the Pearson
correlations between treatment fidelity and treatment acceptability for individual
components (COMP, GBG, Self-monitoring) and the combined classroom
management package.
Time 1
First, the relation between Overall TA (M = 45.1, SD = 9.18) and Overall TF
(M = 1.27, SD = 1) was examined to determine whether teachers who found the
overall classroom management package acceptable were more likely to implement it
with fidelity. The findings revealed a statistically significant correlation, r(41) =
0.37, p < 0.05, indicating that Overall TA and Overall TF were positively related.
Second, the correlation between teachers’ acceptability ratings of the overall
classroom management package and their fidelity of implementation for each
component was examined to determine whether there was a significant correlation
between teachers who found the overall package acceptable and their
implementation of its components. The relation between Overall TA (M = 45.1, SD
= 9.18) and COMP TF (M = 0.56, SD = 0.38) was statistically significant, r(41) =
0.41, p < 0.01, indicating a positive relation between teachers’ overall ratings of TA
and the fidelity with which COMP was implemented. In addition, the relation
between Overall TA (M = 45.1, SD = 9.18) and GBG TF (M = 0.28, SD = 0.38) was
also found statistically significant, r(41) = 0.29, p < 0.05, indicating that similar to
the relation between Overall TA and COMP, there was a positive correlation
between teachers’ overall ratings of TA and the fidelity with which GBG was
45
implemented. The relation between Overall TA and self-monitoring was not
statistically significant.
Third, treatment acceptability ratings for individual components were
examined in relation to treatment fidelity of individual components. The rationale
for this analysis was to examine whether there was a significant correlation between
teachers’ ratings of acceptability of individual components and the fidelity of those
components that are rated acceptable. The relation between COMP TA (M = 39.1,
SD = 6.5) and COMP TF (M = 0.56, SD = 0.38) was statistically significant, r(38) =
0.39, p < 0.01, indicating that the acceptability ratings of COMP were positively
related to the fidelity with which it was implemented. No significant comparisons
were found between GBG acceptability and fidelity or between self-monitoring
acceptability and fidelity.
Lastly, the correlation between acceptability of individual components and
the fidelity of overall implementation was examined to determine whether there was
acceptability of a specific component that related to the overall implementation of
the classroom management package. The relation between COMP TA (M = 39.1, SD
= 6.5) and Overall TF (1.27, SD = 1) was statistically significant r(38) = 0.36, p <
0.05, indicating a positive correlation between the ratings of acceptability of COMP
component and fidelity of implementation of the overall classroom management
package. No other comparisons between the individual components (GBG and self-
monitoring) and fidelity of overall implementation at Time 1 were found to be
statistically significant.
46
Time 2
Consistent with findings at Time 1, the relation between Overall TA (M =
45.1, SD = 9.18) and Overall TF (M = 1.57, SD = 1) was again statistically
significant, r(41) = 0.28, p < 0.05, indicating a positive correlation between teachers
ratings of acceptability for the overall classroom management package and their
fidelity of implementation.
Similar to the analyses conducted in Time 1, the correlation between
teachers’ acceptability ratings of the overall classroom management package and
their fidelity of implementation for each component was examined. However, unlike
the findings in Time 1, the correlation between overall acceptability of the
classroom management package and the fidelity of GBG component at Time 2 was
no longer statistically significant. No other comparisons between teachers’
acceptability ratings of the overall classroom management package and their fidelity
of implementation for each component (COMP and self-monitoring) were found to
be statistically significant.
In addition, congruent with the analyses in Time 1, acceptability ratings for
individual components were examined in relation to treatment fidelity of individual
components. The relation between COMP TA (M = 39.1, SD = 6.5) and COMP TF
(M = .39, SD = .35) was statistically significant, r(38) = 0.33, p < 0.05, indicating
that these two variables were positively related . This finding was consistent with the
results observed in Time 1. Similar to the analyses in Time 1, no significant
comparisons were found between GBG acceptability and fidelity, as well as, self-
monitoring acceptability and fidelity.
47
Lastly, the relation between acceptability rating for individual components
and the overall fidelity of implementation was analyzed. The findings suggested that
the relation between COMP TA (M = 39.1, SD = 6.5) and Overall TF (M = 1.56, SD
= 1) was again statistically significant r(38) = 0.53, p < 0.01, indicating a positive
correlation between the ratings of COMP acceptability and fidelity of
implementation of the overall classroom management package. These results were
consistent with those at Time 1. No other comparisons between acceptability rating
for individual components (GBG and self-monitoring) and the overall fidelity of
implementation at Time 2 were found to be statistically significant.
Time 3
The same analyses were conducted for Time 3. However, unlike the findings
at Time 1 and Time 2, the relation between overall acceptability and overall fidelity
of the classroom management package was not statistically significant.
Next, the correlation between teachers’ acceptability ratings of the overall
classroom management package and their fidelity of implementation for each
component was examined. The findings were again different from Time 1 and Time
2, revealing that the relation between Overall TA (M = 45.1, SD = 9.18) and SM TF
(M = .45, SD = .49) was statistically significant, r(41) = 0.34, p < 0.05, indicating
that these two variables were positively related at Time 3. No other comparisons
between teachers’ acceptability ratings of the overall classroom management
package and their fidelity of implementation for each component (COMP and GBG)
were found to be statistically significant.
Congruent with the analyses in Time 1 and Time 2, acceptability ratings for
individual components were then examined in relation to treatment fidelity of
individual components. However, unlike Time 1 and Time 2, no significant
48
correlations were found between COMP acceptability and the fidelity of COMP
component. Similar to the analyses in Time 1 and Time 2, no significant
comparisons were found between GBG acceptability and fidelity or between self-
monitoring acceptability and fidelity.
Finally, the relation between acceptability ratings for individual components
and overall fidelity of implementation was examined. Consistent with findings at
Time 1 and Time 2, the relation between COMP TA (M = 39.1, SD = 6.5) and
Overall TF (M = 1.39, SD = 1.1) was statistically significant r(38) = 0.31, p < 0.05,
indicating a positive correlation. No other comparisons between acceptability ratings
for individual components (GBG and self-monitoring) and overall fidelity of
implementation at Time 3 were found to be statistically significant.
Research Question 2: Does fidelity of implementation of individual and combined
components vary as a function of treatment acceptability over time?
Repeated Measures ANOVA
Teachers’ fidelity of implementation of individual and combined
components of the intervention package was analyzed in a repeated measure
analysis of variance (RM-ANOVA). To conduct this analysis, teachers were first
grouped into groups of high vs. low acceptability for each intervention component
by their median ratings of treatment acceptability. Table 5 illustrates descriptives for
the groups of teachers’ ratings of high and low acceptability in relation to fidelity of
implementation across three time points. Figure 5 displays the mean distribution for
Overall TF for low and high treatment acceptability teachers over time.
To conduct RM-ANOVA analyses, time of measurement (Time 1 vs. Time 2
vs. Time 3) was selected as the within-subjects factor. The teacher’s ratings of
treatment acceptability of individual and combined components of the treatment
49
package (high treatment acceptability vs. low treatment acceptability) was selected
as the between-subjects factor. The results are summarized as main effects of group
membership over time, and the main effects of time. For each factor, analysis of
variance (ANOVA) was conducted to further extend the findings.
Main Effects of Group Membership over Time
Overall Treatment Package. Teachers with high ratings of treatment
acceptability had a mean fidelity of 1.38 on Time 1; 1.66 on Time 2; and 1.54 on
Time 3. Teachers with low ratings of acceptability with fidelity had a mean of .9 on
Time 1; 1.28 on Time 2; and 1.21 on Time 3. Although mean differences were
observed between groupings of teachers, the differences between groups across time
were not statistically significant F(1.95, 36) = .11, p = .89 (see Table 6).
Following RM-ANOVA analyses, group effects for each time point were
analyzed in an analysis of variance (ANOVA). The results suggested that, in Time 1,
teachers who rated overall classroom management package as highly acceptable (M
= 1.51, SD= 1.04) demonstrated no significant differences compared to teachers who
rated overall classroom management package as low acceptable (M = 1.05, SD =
.94), F(1,44) = 2.39, p = .13. Similarly, at Time 2, no significant differences were
found between Overall TF for high acceptability (M = 1.76, SD = 1.04) and low
acceptability (M = 1.38, SD = .99) groupings of teachers, F(1,42) = 1.47, p = .23.
The findings also indicated that, in Time 3, teachers with high ratings of
acceptability (M = 1.54, SD = 1.03) did not significantly differ in their fidelity of
implementation from teachers with low ratings of acceptability (M = 1.21, SD =
1.08) , F(1,36) = .91, p = .35.
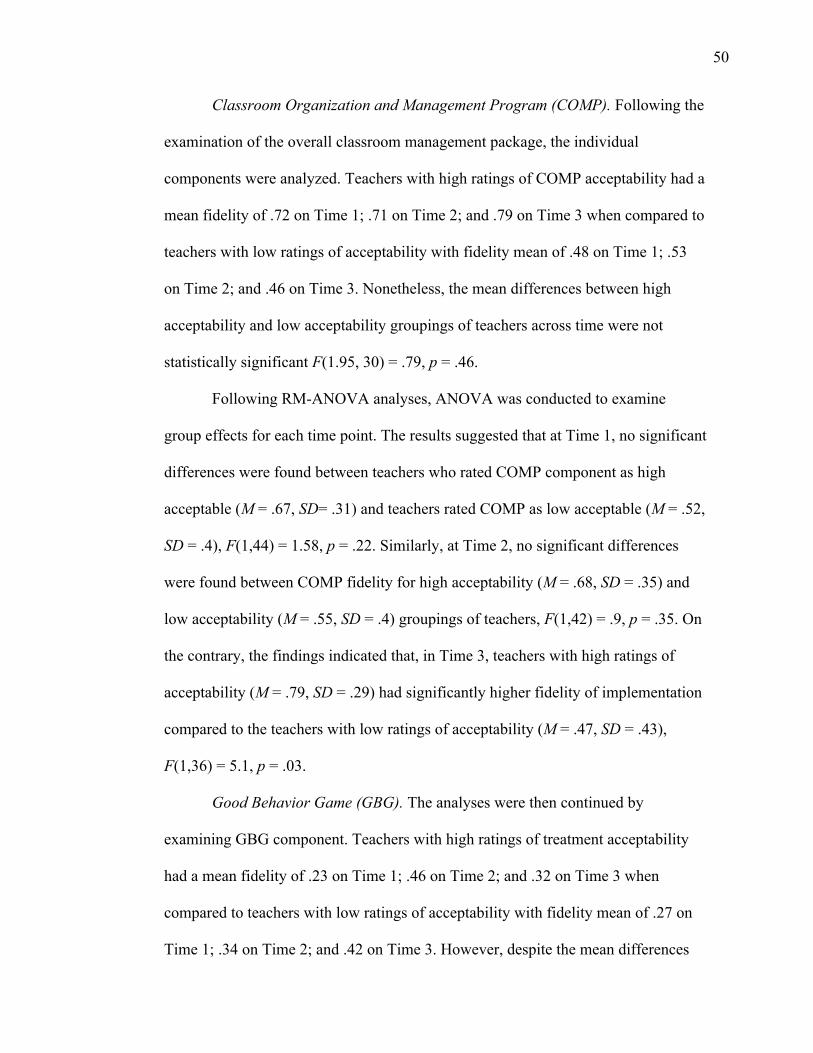
50
Classroom Organization and Management Program (COMP). Following the
examination of the overall classroom management package, the individual
components were analyzed. Teachers with high ratings of COMP acceptability had a
mean fidelity of .72 on Time 1; .71 on Time 2; and .79 on Time 3 when compared to
teachers with low ratings of acceptability with fidelity mean of .48 on Time 1; .53
on Time 2; and .46 on Time 3. Nonetheless, the mean differences between high
acceptability and low acceptability groupings of teachers across time were not
statistically significant F(1.95, 30) = .79, p = .46.
Following RM-ANOVA analyses, ANOVA was conducted to examine
group effects for each time point. The results suggested that at Time 1, no significant
differences were found between teachers who rated COMP component as high
acceptable (M = .67, SD= .31) and teachers rated COMP as low acceptable (M = .52,
SD = .4), F(1,44) = 1.58, p = .22. Similarly, at Time 2, no significant differences
were found between COMP fidelity for high acceptability (M = .68, SD = .35) and
low acceptability (M = .55, SD = .4) groupings of teachers, F(1,42) = .9, p = .35. On
the contrary, the findings indicated that, in Time 3, teachers with high ratings of
acceptability (M = .79, SD = .29) had significantly higher fidelity of implementation
compared to the teachers with low ratings of acceptability (M = .47, SD = .43),
F(1,36) = 5.1, p = .03.
Good Behavior Game (GBG). The analyses were then continued by
examining GBG component. Teachers with high ratings of treatment acceptability
had a mean fidelity of .23 on Time 1; .46 on Time 2; and .32 on Time 3 when
compared to teachers with low ratings of acceptability with fidelity mean of .27 on
Time 1; .34 on Time 2; and .42 on Time 3. However, despite the mean differences
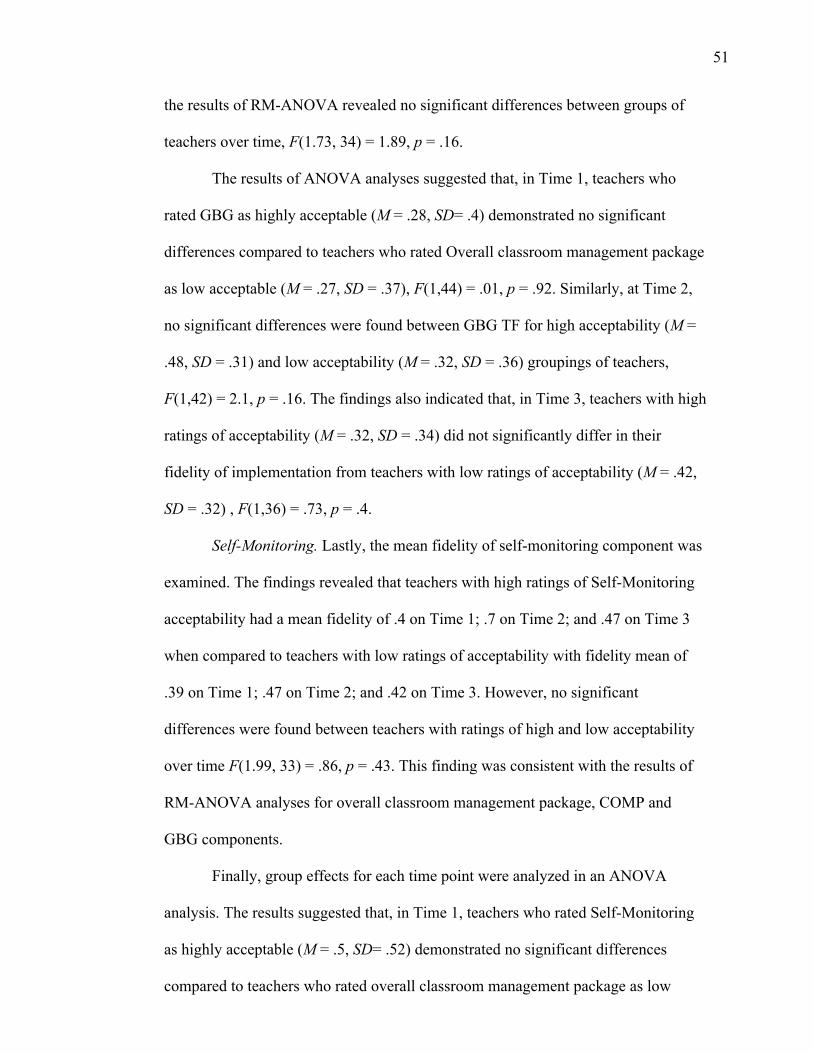
51
the results of RM-ANOVA revealed no significant differences between groups of
teachers over time, F(1.73, 34) = 1.89, p = .16.
The results of ANOVA analyses suggested that, in Time 1, teachers who
rated GBG as highly acceptable (M = .28, SD= .4) demonstrated no significant
differences compared to teachers who rated Overall classroom management package
as low acceptable (M = .27, SD = .37), F(1,44) = .01, p = .92. Similarly, at Time 2,
no significant differences were found between GBG TF for high acceptability (M =
.48, SD = .31) and low acceptability (M = .32, SD = .36) groupings of teachers,
F(1,42) = 2.1, p = .16. The findings also indicated that, in Time 3, teachers with high
ratings of acceptability (M = .32, SD = .34) did not significantly differ in their
fidelity of implementation from teachers with low ratings of acceptability (M = .42,
SD = .32) , F(1,36) = .73, p = .4.
Self-Monitoring. Lastly, the mean fidelity of self-monitoring component was
examined. The findings revealed that teachers with high ratings of Self-Monitoring
acceptability had a mean fidelity of .4 on Time 1; .7 on Time 2; and .47 on Time 3
when compared to teachers with low ratings of acceptability with fidelity mean of
.39 on Time 1; .47 on Time 2; and .42 on Time 3. However, no significant
differences were found between teachers with ratings of high and low acceptability
over time F(1.99, 33) = .86, p = .43. This finding was consistent with the results of
RM-ANOVA analyses for overall classroom management package, COMP and
GBG components.
Finally, group effects for each time point were analyzed in an ANOVA
analysis. The results suggested that, in Time 1, teachers who rated Self-Monitoring
as highly acceptable (M = .5, SD= .52) demonstrated no significant differences
compared to teachers who rated overall classroom management package as low
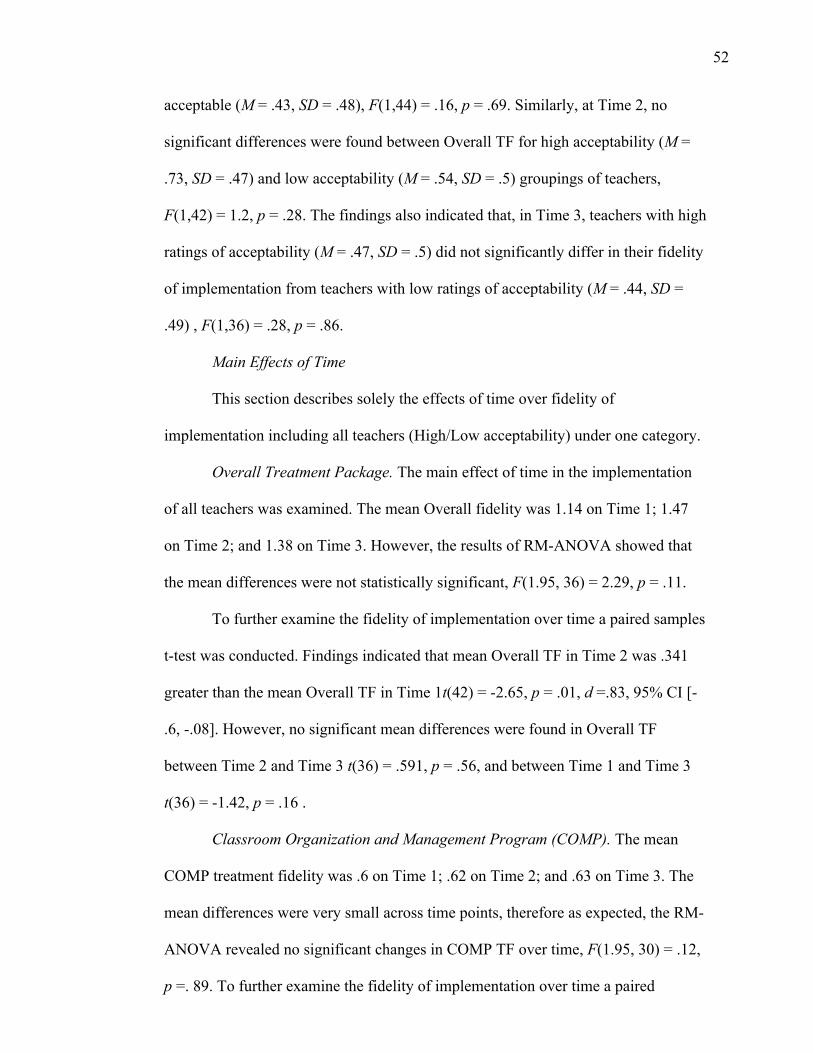
52
acceptable (M = .43, SD = .48), F(1,44) = .16, p = .69. Similarly, at Time 2, no
significant differences were found between Overall TF for high acceptability (M =
.73, SD = .47) and low acceptability (M = .54, SD = .5) groupings of teachers,
F(1,42) = 1.2, p = .28. The findings also indicated that, in Time 3, teachers with high
ratings of acceptability (M = .47, SD = .5) did not significantly differ in their fidelity
of implementation from teachers with low ratings of acceptability (M = .44, SD =
.49) , F(1,36) = .28, p = .86.
Main Effects of Time
This section describes solely the effects of time over fidelity of
implementation including all teachers (High/Low acceptability) under one category.
Overall Treatment Package. The main effect of time in the implementation
of all teachers was examined. The mean Overall fidelity was 1.14 on Time 1; 1.47
on Time 2; and 1.38 on Time 3. However, the results of RM-ANOVA showed that
the mean differences were not statistically significant, F(1.95, 36) = 2.29, p = .11.
To further examine the fidelity of implementation over time a paired samples
t-test was conducted. Findings indicated that mean Overall TF in Time 2 was .341
greater than the mean Overall TF in Time 1t(42) = -2.65, p = .01, d =.83, 95% CI [-
.6, -.08]. However, no significant mean differences were found in Overall TF
between Time 2 and Time 3 t(36) = .591, p = .56, and between Time 1 and Time 3
t(36) = -1.42, p = .16 .
Classroom Organization and Management Program (COMP). The mean
COMP treatment fidelity was .6 on Time 1; .62 on Time 2; and .63 on Time 3. The
mean differences were very small across time points, therefore as expected, the RM-
ANOVA revealed no significant changes in COMP TF over time, F(1.95, 30) = .12,
p =. 89. To further examine the fidelity of implementation over time a paired
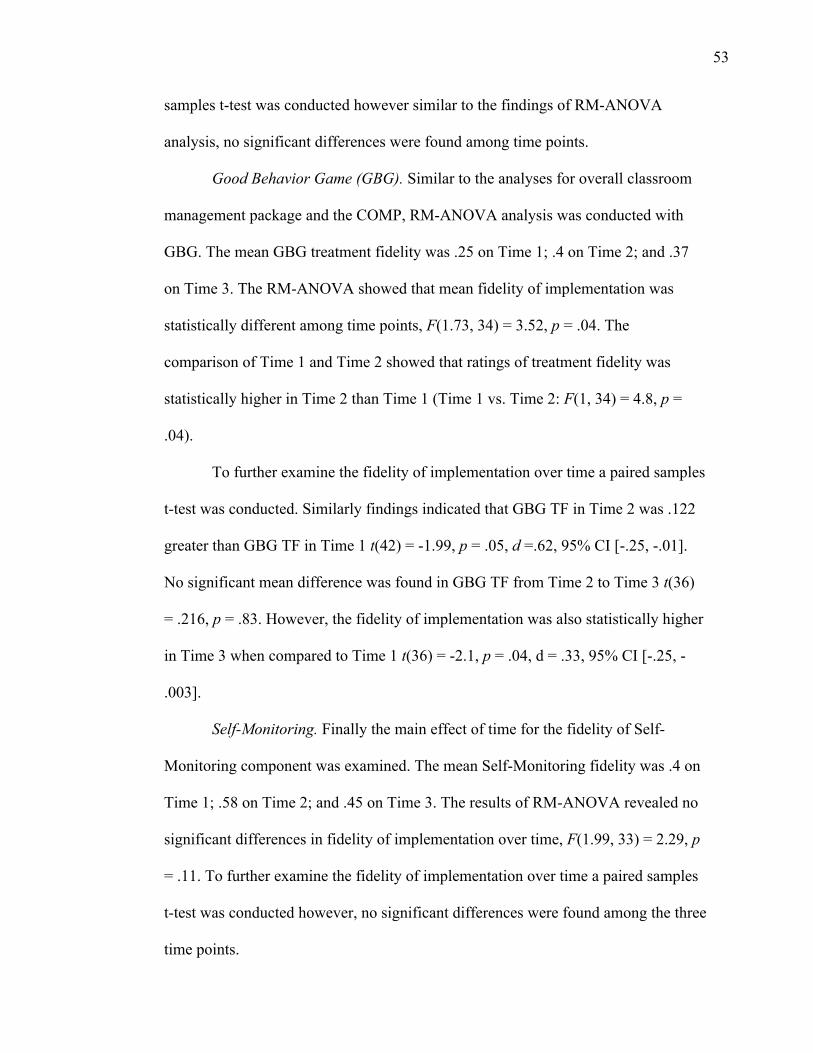
53
samples t-test was conducted however similar to the findings of RM-ANOVA
analysis, no significant differences were found among time points.
Good Behavior Game (GBG). Similar to the analyses for overall classroom
management package and the COMP, RM-ANOVA analysis was conducted with
GBG. The mean GBG treatment fidelity was .25 on Time 1; .4 on Time 2; and .37
on Time 3. The RM-ANOVA showed that mean fidelity of implementation was
statistically different among time points, F(1.73, 34) = 3.52, p = .04. The
comparison of Time 1 and Time 2 showed that ratings of treatment fidelity was
statistically higher in Time 2 than Time 1 (Time 1 vs. Time 2: F(1, 34) = 4.8, p =
.04).
To further examine the fidelity of implementation over time a paired samples
t-test was conducted. Similarly findings indicated that GBG TF in Time 2 was .122
greater than GBG TF in Time 1 t(42) = -1.99, p = .05, d =.62, 95% CI [-.25, -.01].
No significant mean difference was found in GBG TF from Time 2 to Time 3 t(36)
= .216, p = .83. However, the fidelity of implementation was also statistically higher
in Time 3 when compared to Time 1 t(36) = -2.1, p = .04, d = .33, 95% CI [-.25, -
.003].
Self-Monitoring. Finally the main effect of time for the fidelity of Self-
Monitoring component was examined. The mean Self-Monitoring fidelity was .4 on
Time 1; .58 on Time 2; and .45 on Time 3. The results of RM-ANOVA revealed no
significant differences in fidelity of implementation over time, F(1.99, 33) = 2.29, p
= .11. To further examine the fidelity of implementation over time a paired samples
t-test was conducted however, no significant differences were found among the three
time points.
54
Intra-class correlation coefficients (ICC).
The observation system used to record fidelity of implementation was
initially developed and tested across the three sites that participated in this study. A
total of 10 observers completed a total of 607 observations distributed across 51
teacher participants. The reliability of the observation system in this study was
established by calculating intraclass correlation coefficients (ICC) in which two
observers simultaneously completed 9 observations. ICC for the implementation
ratings used in this study was .95 (95% CI = .91 - .98), suggesting that the
observation system may be reliably scored across trained observers.
55
CHAPTER V
Discussion
Failure to implement and sustain the use of effective interventions as
intended has been discussed as a major reason for poor student outcomes in special
education programs (Greenwood & Abbott, 2001; Landrum, Tankersley, &
Kauffman, 2003; Kutash, et al., 2009). Recent studies (e.g., Wood et al., 2007 and
Wilder et al., 2006) have demonstrated a significant positive relation between
fidelity of implementation and intervention outcome effectiveness which provides a
strong rationale for the importance of assessing treatment fidelity (Durlak & DuPre,
2008). Despite the importance of monitoring treatment fidelity, there is still a
paucity of literature identifying the factors that influence it (Noell & Witt, 1996;
Sterling-Turner & Watson, 2002; Witt et al., 1996). In educational literature,
treatment acceptability is often suggested as a factor affecting fidelity of
implementation (Elliott, 1988; Reimers et al., 1987; Sterling-Turner & Watson,
2002). However, the available literature examining treatment acceptability with
intervention fidelity provides inconsistent findings; revealing both significant (e.g.,
Allinder & Oats, 1997; Reimers & Wacker, 1992) and non-significant results (e.g.,
Peterson & McConnell, 1996; Sterling-Turner & Watson, 2002). These inconsistent
findings may be attributed to indirect nature of the fidelity data collected (e.g.,
Allinder & Oats, 1997; Reimers & Wacker, 1992), implementation with
undergraduate students in analog settings (e.g., Sterling-Turner & Watson, 2002)
and limiting observations to pretreatment acceptability ratings (e.g., Peterson &
McConnell, 1996). To extend the available research this study conducted a more
controlled examination that, (a) occurred in natural classroom settings, (b) involved
practitioners as the intervention providers, (c) measured post-implementation

56
acceptability, and (d) was based on direct observation of fidelity. Moreover,
consistent with recommendations from Kutash et al., 2009, this study was based on
longitudinal data collection to provide an opportunity to examine how fidelity may
vary over time. By combining these methodological features with a systematic
examination of high and low ratings of acceptability, this study extends existing
literature to a more dynamic exploration of fidelity and acceptability over time. The
findings for each research question are discussed in the following section.
Discussion of Findings
The study was conducted for an academic school year with fidelity data
collected for an average of 15.5 weeks (excluding training, school breaks and
missing data). Forty-four teachers participated in the current investigation. The
participants represented a diverse sample of special and general education teachers,
serving kindergarten through 6th grade. Following implementation, teachers rated the
acceptability of each intervention component. The relation between treatment
acceptability and fidelity of implementation was studied by examining direct
observation ratings of fidelity of implementation on weeks 2 (Time 1), week 7
(Time 2), and week12 (Time 3) with a comparison the post-treatment acceptability
ratings provided by each teach implementer.
Research Question 1: How does treatment acceptability of individual and
combined components relate to treatment fidelity?
The present study revealed a significant but weak relation between teachers’
ratings of acceptability and their fidelity of implementation (ranging from .28 to
.53). The findings are consistent with Peterson and McConnell, in that teacher
ratings of acceptability may be a significant but not a strong predictor of fidelity. In
further detail, the present study revealed a significant correlation between higher
ratings of acceptability to the overall classroom management package and higher
57
fidelity of overall implementation at Time 1 and Time 2 (.37 and .28, respectively).
However, unlike Peterson and McConnell (ranging from -.40 to .73), no inverse
relation was found between acceptability ratings and fidelity of implementation.
Researchers have speculated that use of pretreatment acceptability ratings may not
reflect what teachers would actually report about the acceptability of an intervention
after they have gone through a period of time being asked to implement it
(Gresham& Lopez, 1996). This study extended the work of Peterson and McConnell
by incorporating post-implementation acceptability measures, larger sample size and
a dynamic measurement fidelity over time, and found that treatment acceptability
and treatment fidelity are correlated , in that higher ratings of acceptability is more
likely to be related to higher fidelity of implementation and vice versa.
The findings of the present study for individual components also revealed
weak but positive correlations between teachers’ assigned ratings of acceptability to
the package as a whole and fidelity for implementation of COMP (.41) and GBG
(.29) components in Time 1, and fidelity for implementation of Self-Monitoring
(.34) in Time 3. The findings are consistent with Allinder and Oats’s (1997) findings
which revealed that the group of teachers who rated the CBM procedure as a more
acceptable way of monitoring progress tended to give more CBM probes and set
more ambitious goals, compared to the group of teachers who rated CBM
procedures as less acceptable. Moreover, although the findings revealed a weak
correlation between teachers’ ratings of acceptability and their implementation,
contrary to Sterling-Turner’s (2002) study, the relationships were statistically
significant. This suggests that although the correlation between acceptability ratings
and fidelity of implementation is weak, there is still support to suggest significance.
Based on the findings of the present study, it is plausible to question Elliott's
(1988) model of acceptability and challenge the conceptual framework indicating a
58
possible relation between low treatment acceptability and high fidelity of
implementation. The findings of this current investigation could be viewed as
aligned with Witt and Elliott’s (1985) model of acceptability, indicating a possible
relation between high acceptability and high fidelity of implementation and vice
versa. However, the present study could be viewed as more aligned with Reimers
and colleagues' (1987) model of acceptability that incorporates “intervention
understanding” and “environmental disruption” components to Witt and Elliott's
model (Eckert & Hintze, 2000). Reimers and colleagues (1987) proposed that
acceptability should be assessed only on those interventions that are well
understood. To date, extensive training and ongoing performance feedback have
been well researched and proven to be a strategy as a means to initiate and
sustaining implementation (Noell, Slider, Connell, Gatti, & Williams et al., 2005;
Smith, et al., 2007). Reimers and colleagues' (1987) suggested that interventions that
are well understood by the clients and have high acceptability ratings are more likely
to be implemented with higher treatment fidelity. In support of the Reimers and
colleagues model, this study revealed that in the context of intensive training and
ongoing support, higher ratings of treatment acceptability is more likely to be related
to higher ratings of fidelity of implementation.
The findings of this study also revealed differential findings for intervention
package components. Unlike GBG and Self-Monitoring components, COMP
acceptability resulted in significant relations to overall fidelity of implementation
across time points. The results suggested that, the teachers’ higher ratings of
acceptability to COMP components was significantly related to higher fidelity for
implementation of the overall classroom management package in Time 1, Time 2,
and Time 3 (.36, .53, and .31, respectively). It may be argued that the COMP
component, consisting of general classroom management guidelines, might require
the least amount of effort from teachers compared to the other classroom
59
management components (GBG and Self-Monitoring), and utilize already existing
practices in the classroom. COMP procedures, once implemented, are more likely to
remain in place. By contrast, the GBG and Self-Monitoring both require weekly
active teacher implementation. This might explain that although teachers rated
COMP as generally having higher treatment acceptability, there was a significant,
albeit weak, correlation with overall fidelity of implementation across the three time
points when all three intervention components were examined in aggregate. In
addition, the teachers’ higher ratings of acceptability to COMP components was
significantly related to higher fidelity for implementation of COMP in Time 1 (.39)
and in Time 2 (.33).
To sum it up, the series of correlation analyses revealed a significant
correlation between teachers’ ratings of acceptability and direct observations of
treatment fidelity. However, the results should be viewed cautiously as the
correlation between acceptability and fidelity of implementation was considered
weak. Thus, to ensure full implementation, it might be important to investigate other
factors that may be strongly related of treatment fidelity.
Research Question 2: Does fidelity of implementation of individual and combined
components vary as a function of treatment acceptability over time?
The results of RM-ANOVA analyses revealed no significant differences
between teachers’ ratings of acceptability and the fidelity of implementation over
time, indicating that teachers’ fidelity of implementation did not differentiate over
time in relation to their ratings of post-acceptability. When the differences between
groupings of teachers were assessed within each time point, the results revealed that,
with the exception of COMP component, there was no significant difference in
60
fidelity of implementation between teachers who had high and low ratings of post-
treatment acceptability.
Similar to question 1, significant differences were observed in COMP
fidelity between high/low acceptability groups. The descriptive analyses (see Table
5) indicated that mean fidelity of implementation at Time 3 was higher (.79) for
teachers who rated COMP to be more acceptable when compared to teachers who
rated COMP to be less acceptable (.47). The findings also suggest that for low
acceptability group, there was more variability in fidelity at Time 3 whereas for the
high acceptability group, there was less variability. Perhaps teachers who rated
COMP to be less acceptable started the academic year implementing intervention
components with moderate fidelity, had higher fidelity of implementation mid-
semester however, did not maintain implementation towards to end of the school
year. The findings for COMP component in particular are consistent with Allinder
and Oats (1997) study which revealed that the group of teachers who rated the CBM
procedure as a more acceptable way of monitoring progress tended to implement it
with higher fidelity, compared to the group of teachers who rated CBM procedures
as less acceptable. The current investigation, with a systematic examination of high
and low ratings of acceptability, extends existing literature to a more dynamic
exploration of fidelity and acceptability over time.
Other comparisons examining specific intervention components were also
analyzed. The descriptive analyses revealed higher fidelity of implementation for
teachers in high acceptability group within and across time points for all intervention
components, when compared to teachers in low treatment acceptability group.
However, no significant differences were found in fidelity, based on the groupings
of teachers by high and low ratings of acceptability. Therefore, although the findings
for COMP component revealed significant differences, the remaining components of
61
the classroom management package did not result in significant group differences,
failing to support Allinder and Oats (1997) study.
Given the scarcity of longitudinal studies of treatment fidelity, Kutash,
Duckhowski and Lynn (2009) emphasized the importance of conducting studies that
allow for longer longitudinal follow-up of implementation data. Therefore to extend
the literature, the fidelity of implementation over time was examined in further
detail. All teachers (High/Low acceptability) were combined under one category to
examine the change in fidelity of implementation over time. The results of the
analyses revealed that, across the three time points, there was a significant difference
in the GBG fidelity. However, the findings did not reveal significant results for the
remaining components of the intervention package.
The findings of the study revealed that the fidelity of GBG component was
significantly higher in Time 2 compared to Time 1 (see Table 2). This finding
suggests that within the context of an efficacy trial, with extensive training and
weekly consultation, the GBG procedures were better implemented around mid-
academic year compared to initial implementation. The paired samples t-test results
examining the mean differences between three time points also indicated that GBG
procedures still had significantly higher fidelity in Time 3 when compared to Time 1
This finding suggested that the fidelity of implementation increased mid-academic
year and maintained until the end of the study. The assessment of follow-up data
would shed further light to the nature of fidelity of implementation, so future studies
should incorporate follow-up measures as well.
Although no significant differences were found in fidelity of implementation
across the three time points, the mean differences between each time point was
explored for overall fidelity of implementation and the remaining components. The
62
findings revealed that for overall fidelity of implementation of the classroom
management package, fidelity increased from Time 1 to Time 2 and was maintained
throughout the course of academic school year. These findings suggest that with
training and weekly consultation, fidelity increased for the overall package mid-
academic year and was maintained until the end of implementation. However, these
findings failed to be replicated with COMP and Self-Monitoring components,
indicating no mean differences observed between time points. The fairly robust
nature of COMP component and the time required to complete Self-Monitoring may
have affected these findings.
In sum, these findings were complementary to Kutash and colleague’s study,
where they found that 13 months after the final version of the intervention package
was developed, teachers maintained 62% of their previous level of implementation.
It is important to keep in mind that both the current findings and those of Kutash
provided training, teacher consultations, and booster sessions over the course of
implementation. It could be argued that, with consistent support and training, fidelity
of evidence-based practices can be sustained over time. Providing such training and
support is consistent with type of performance delivery system that Durlak and
DuPre (2008) suggested as of five factors influencing fidelity of implementation.
Performance feedback has been well researched and supported as an effective means
to initiate and sustain fidelity of implementation (Codding et al., 2005; Moncher &
Prinz, 1991; Noell et al., 2005; Smith et al., 2007; Witt et al., 1998).
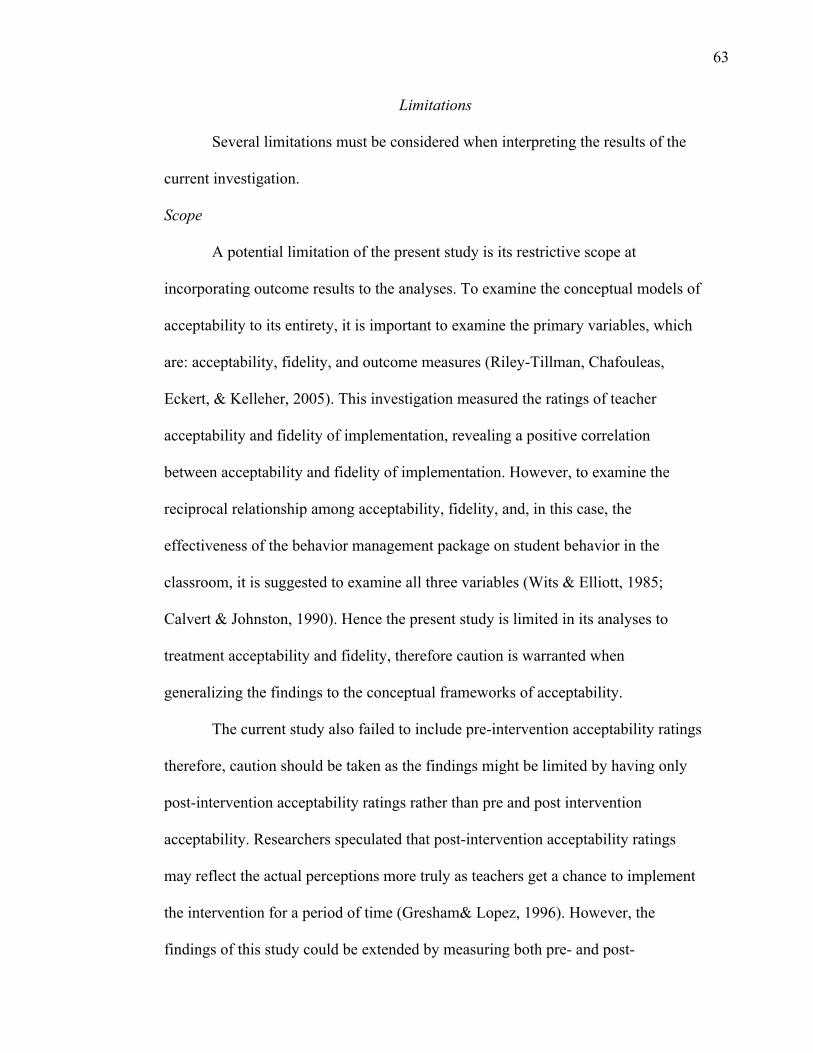
63
Limitations
Several limitations must be considered when interpreting the results of the
current investigation.
Scope
A potential limitation of the present study is its restrictive scope at
incorporating outcome results to the analyses. To examine the conceptual models of
acceptability to its entirety, it is important to examine the primary variables, which
are: acceptability, fidelity, and outcome measures (Riley-Tillman, Chafouleas,
Eckert, & Kelleher, 2005). This investigation measured the ratings of teacher
acceptability and fidelity of implementation, revealing a positive correlation
between acceptability and fidelity of implementation. However, to examine the
reciprocal relationship among acceptability, fidelity, and, in this case, the
effectiveness of the behavior management package on student behavior in the
classroom, it is suggested to examine all three variables (Wits & Elliott, 1985;
Calvert & Johnston, 1990). Hence the present study is limited in its analyses to
treatment acceptability and fidelity, therefore caution is warranted when
generalizing the findings to the conceptual frameworks of acceptability.
The current study also failed to include pre-intervention acceptability ratings
therefore, caution should be taken as the findings might be limited by having only
post-intervention acceptability ratings rather than pre and post intervention
acceptability. Researchers speculated that post-intervention acceptability ratings
may reflect the actual perceptions more truly as teachers get a chance to implement
the intervention for a period of time (Gresham& Lopez, 1996). However, the
findings of this study could be extended by measuring both pre- and post-
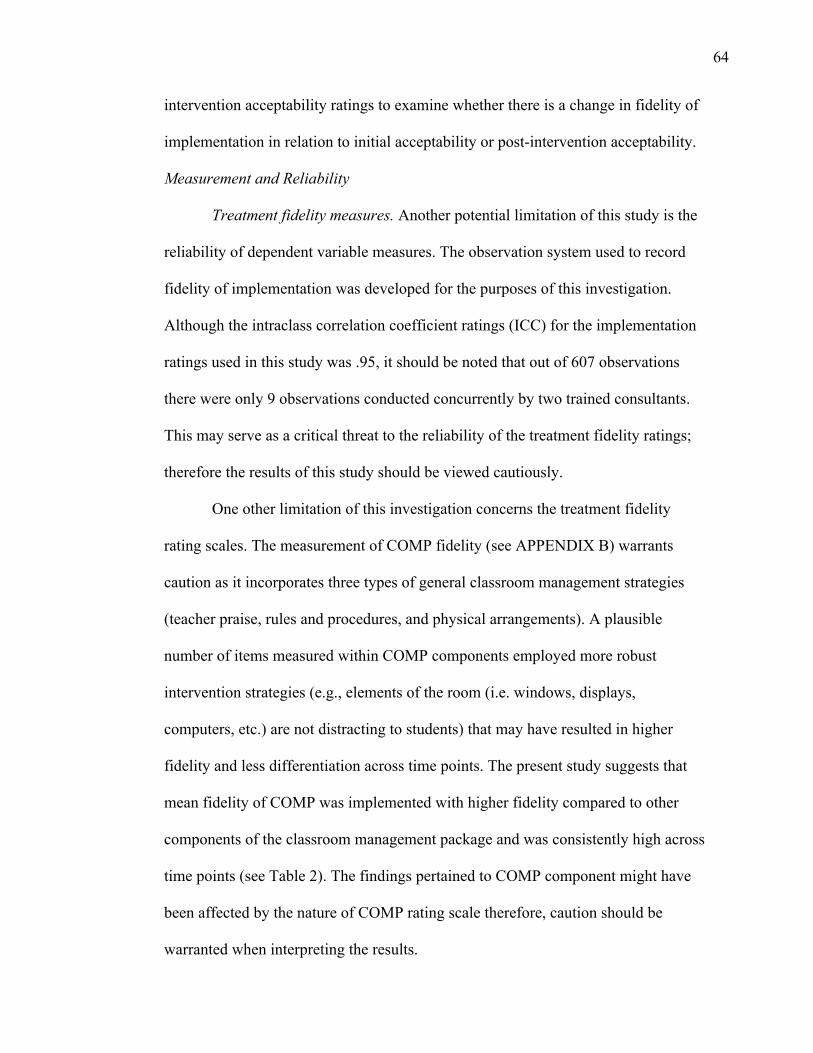
64
intervention acceptability ratings to examine whether there is a change in fidelity of
implementation in relation to initial acceptability or post-intervention acceptability.
Measurement and Reliability
Treatment fidelity measures. Another potential limitation of this study is the
reliability of dependent variable measures. The observation system used to record
fidelity of implementation was developed for the purposes of this investigation.
Although the intraclass correlation coefficient ratings (ICC) for the implementation
ratings used in this study was .95, it should be noted that out of 607 observations
there were only 9 observations conducted concurrently by two trained consultants.
This may serve as a critical threat to the reliability of the treatment fidelity ratings;
therefore the results of this study should be viewed cautiously.
One other limitation of this investigation concerns the treatment fidelity
rating scales. The measurement of COMP fidelity (see APPENDIX B) warrants
caution as it incorporates three types of general classroom management strategies
(teacher praise, rules and procedures, and physical arrangements). A plausible
number of items measured within COMP components employed more robust
intervention strategies (e.g., elements of the room (i.e. windows, displays,
computers, etc.) are not distracting to students) that may have resulted in higher
fidelity and less differentiation across time points. The present study suggests that
mean fidelity of COMP was implemented with higher fidelity compared to other
components of the classroom management package and was consistently high across
time points (see Table 2). The findings pertained to COMP component might have
been affected by the nature of COMP rating scale therefore, caution should be
warranted when interpreting the results.
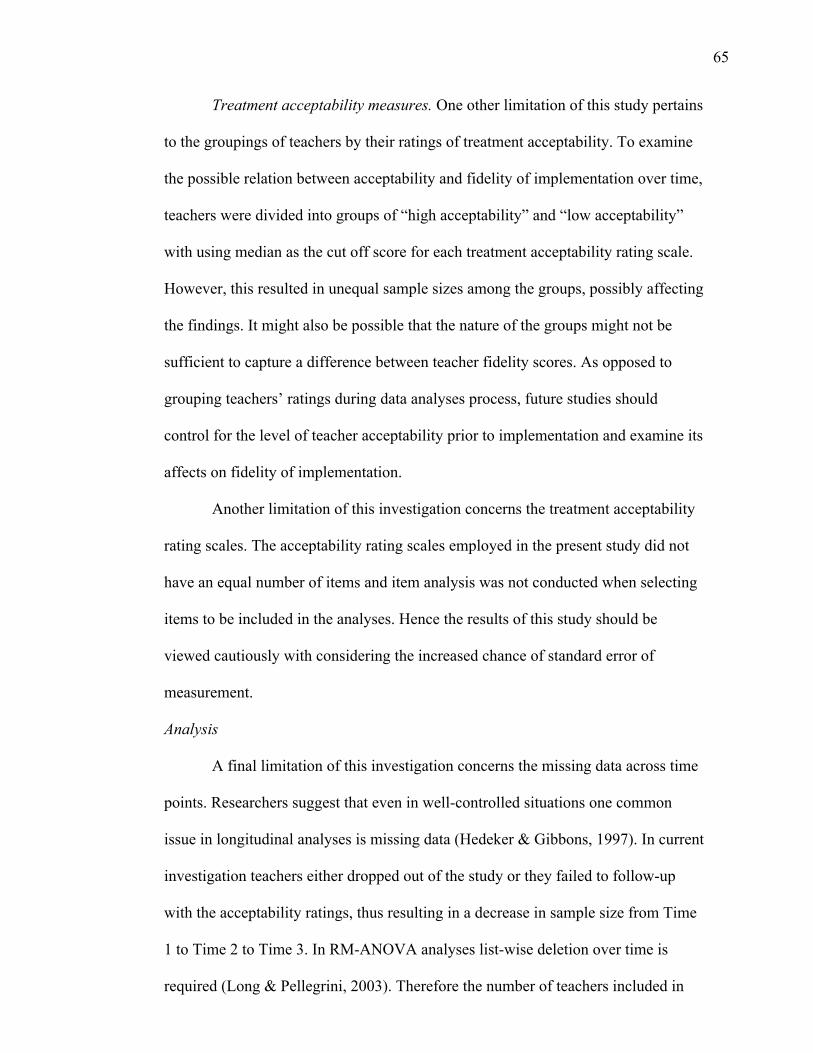
65
Treatment acceptability measures. One other limitation of this study pertains
to the groupings of teachers by their ratings of treatment acceptability. To examine
the possible relation between acceptability and fidelity of implementation over time,
teachers were divided into groups of “high acceptability” and “low acceptability”
with using median as the cut off score for each treatment acceptability rating scale.
However, this resulted in unequal sample sizes among the groups, possibly affecting
the findings. It might also be possible that the nature of the groups might not be
sufficient to capture a difference between teacher fidelity scores. As opposed to
grouping teachers’ ratings during data analyses process, future studies should
control for the level of teacher acceptability prior to implementation and examine its
affects on fidelity of implementation.
Another limitation of this investigation concerns the treatment acceptability
rating scales. The acceptability rating scales employed in the present study did not
have an equal number of items and item analysis was not conducted when selecting
items to be included in the analyses. Hence the results of this study should be
viewed cautiously with considering the increased chance of standard error of
measurement.
Analysis
A final limitation of this investigation concerns the missing data across time
points. Researchers suggest that even in well-controlled situations one common
issue in longitudinal analyses is missing data (Hedeker & Gibbons, 1997). In current
investigation teachers either dropped out of the study or they failed to follow-up
with the acceptability ratings, thus resulting in a decrease in sample size from Time
1 to Time 2 to Time 3. In RM-ANOVA analyses list-wise deletion over time is
required (Long & Pellegrini, 2003). Therefore the number of teachers included in
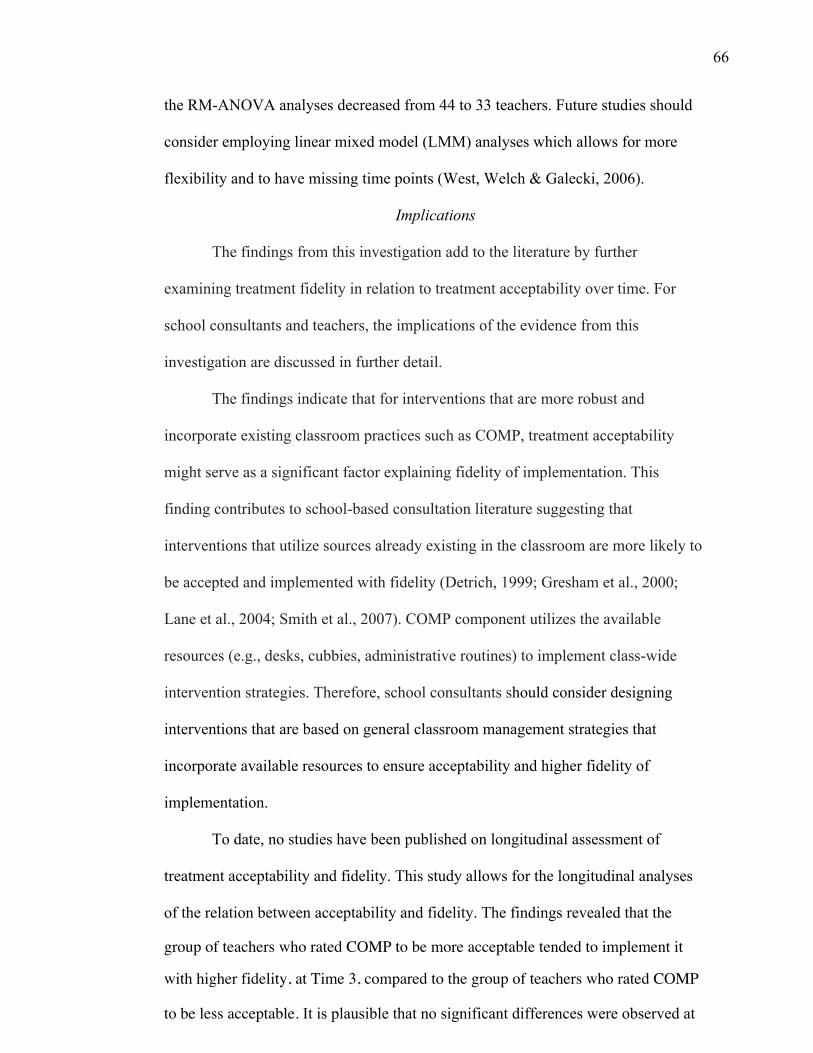
66
the RM-ANOVA analyses decreased from 44 to 33 teachers. Future studies should
consider employing linear mixed model (LMM) analyses which allows for more
flexibility and to have missing time points (West, Welch & Galecki, 2006).
Implications
The findings from this investigation add to the literature by further
examining treatment fidelity in relation to treatment acceptability over time. For
school consultants and teachers, the implications of the evidence from this
investigation are discussed in further detail.
The findings indicate that for interventions that are more robust and
incorporate existing classroom practices such as COMP, treatment acceptability
might serve as a significant factor explaining fidelity of implementation. This
finding contributes to school-based consultation literature suggesting that
interventions that utilize sources already existing in the classroom are more likely to
be accepted and implemented with fidelity (Detrich, 1999; Gresham et al., 2000;
Lane et al., 2004; Smith et al., 2007). COMP component utilizes the available
resources (e.g., desks, cubbies, administrative routines) to implement class-wide
intervention strategies. Therefore, school consultants should consider designing
interventions that are based on general classroom management strategies that
incorporate available resources to ensure acceptability and higher fidelity of
implementation.
To date, no studies have been published on longitudinal assessment of
treatment acceptability and fidelity. This study allows for the longitudinal analyses
of the relation between acceptability and fidelity. The findings revealed that the
group of teachers who rated COMP to be more acceptable tended to implement it
with higher fidelity, at Time 3, compared to the group of teachers who rated COMP
to be less acceptable. It is plausible that no significant differences were observed at
67
the initial implementation and mid-year however, towards the end of the academic
year teachers in high acceptability group did implement interventions with higher
fidelity. Hence school consultants should consider utilizing acceptability ratings
especially for interventions implemented longer periods of time and providing more
intense support for fidelity early in the implementation process.
In continuing to extend what is known about the models of acceptability, the
present study supported Reimers and colleagues' (1987) model of acceptability
revealing that in the context of intensive training and ongoing support, higher ratings
of treatment acceptability are more likely to be related to higher ratings of fidelity of
implementation. However, consultants should also keep in mind that there is lack of
support for a strong link between acceptability and fidelity, therefore to extend the
models of acceptability, it is important to conduct further studies examining factors
such as training and ongoing performance feedback in relation to acceptability and
fidelity.
This study provides further insight to the adaptation vs. fidelity debate.
Research suggests that interventions often get modified during implementation and
high levels of fidelity levels do not reach to 100%, leaving room for adaptation to
intervention providers (Durlak & DuPre, 2008; Gresham, 1989). Adding to this
finding, they concluded that positive outcome effectiveness was achieved with
fidelity levels around 60% suggesting that fidelity and adaptation inevitably co-
occur where some aspects of the intervention are replicated and some are modified
(Durlak & DuPre, 2008; Ringwalt et al., 2003). Consistent with Durlak and DuPre’s
findings, the present study revealed mean fidelity levels between 27% and 79%
between the groupings of high and low acceptability across time points. In the
literature it is suggested that teachers often fail to implement agreed-upon
intervention strategies in the absence of ongoing performance feedback and fidelity
68
after a week following initial training (Noell, Witt, LaFleur, Mortenson, Rainer, &
LeVelle, 2000). Taking the literature into consideration, the present study
incorporated extensive training and ongoing weekly performance feedback, yet
failed to reach mean fidelity levels higher than 79%. Borelli (2005) concluded that
only 15.5% of articles reviewed for the meta-analysis had 80% or greater fidelity
and considered in “high treatment fidelity” category. The literature suggests that
adapted implementation is more likely to be effective when critical components are
retained (Riley-Tillman, Chafouleas, Eckert, & Kelleher; 2005). Based on the
available literature and findings of the present study, school consultants should
expect some level of adaptation even in highly supervised efficacy trials therefore, it
is important to for school consultants to investigate the right mixture of the fidelity
and adaptation for each type of intervention (Gresham, 1989; Ringwalt et al., 2003;
Smith et al., 2007).
Furthermore, the present study extended the literature on longitudinal
examination of fidelity to other factors influencing fidelity of implementation and its
change over time. Like the Kutash study, this study contributes to consultation
models by suggesting that with extensive training and weekly consultation meetings
over the course of implementation, fidelity may be increased from the initial to mid-
implementation and sustained over time. As mentioned before, it is important to
acknowledge that both the current findings and those of Kutash provided training,
teacher consultations, and booster sessions over the course of implementation. As a
final point, it could be argued that, with consistent support and training, fidelity of
evidence-based practices can be sustained over time. The future directions are
discussed in further detail in the next section.
69
Future Directions
Given that longitudinal assessment of fidelity in educational literature is in
its infancy, current study provides promising findings and implications for the
assessment of treatment fidelity and acceptability. Nonetheless, the findings of the
current study, which directly measured only treatment acceptability and fidelity of
implementation, highlight the need for further investigations that incorporate factors
such as treatment outcomes and maintenance. The assessment of additional factors
would allow for a more extensive analysis of acceptability models, revealing the
interactions among the variables. Moreover, future researchers should also consider
employing both pre- and post-intervention acceptability ratings to examine whether
there is a change in fidelity of implementation in relation to initial or post-
intervention acceptability.
In addition to assessing the models of acceptability, future research should
also consider examining fidelity of implementation in a broader context in
conjunction with other factors. Riley-Tillman and colleagues (2005) suggested that
although acceptability may be an important factor in predicting implementation,
other factors may also contribute to implementation of interventions. Therefore,
further study of variables such as: (a) contextual variables (compatibility,
adaptability), (b) teacher characteristics (skill-proficiency, perceived benefits), and
(c) interpersonal relationship among teachers and administrative support
(collaboration, shared-decision making) may be warranted. In addition, future
research should address the relative influence of different factors affecting treatment
fidelity and how they interact in real world settings (Durlak & DuPre, 2008).There is
limited literature on the relation between different factors such as innovation
characteristics, provider characteristics and prevention support system. Consistent
70
with this idea, future research also might evaluate whether matching interventions to
contextual variables results in higher treatment fidelity than interventions that do not
consider contextual variables (Detrich, 1999). Further, future research should
examine the influence of teacher factors (e.g., characteristics) within school-based
treatment outcomes and whether commonly recommended behavior management
strategies are compatible with the expectations, capacities, motivations, and
behavioral styles of teachers (Greene, 1995).
Finally, this study points to the need for more rigorous evaluations of
implementation process. Future studies are needed to better understand how to
conceptualize and measure fidelity of implementation during efficacy and
effectiveness trials (O’Donnell, 2008). Future research might move from simple
measurement of treatment fidelity to more complex measures incorporating the
extent to which an intervention occurs (Durlak & DuPre, 2008; Smith et al., 2007).
For example, a measurement tool could be created to combine dichotomous ratings
of observed and not observed with quality ratings of implementation for each item
on the checklist, which would allow for a more comprehensive analysis. Although
the current findings are promising, future studies should use further refined
measurement of treatment fidelity to decrease measurement error and increase
statistical power (Durlak & DuPre, 2008).
71
BIBLIOGRAHY
Allinder, R. M., & Oats, R. G. (1997). Effects of acceptability on teachers'
implementation of curriculum-based measurement and student achievement
in mathematics computation. Remedial & Special Education, 18, 113-120.
Arkoosh, M. K., Derby, K. M., Wacker, D. P., Berg, W., McLaughlin, T. F., &
Barretto, A. (2007). A descriptive evaluation of long-term treatment
Integrity. Behavior Modification, 31, 880-895.
Barrish, H. H., Saunders, M., & Wolf, M. M. (1969). Good behavior game: Effects
of individual contingencies for group consequences on disruptive behavior in
a classroom. Journal of Applied Behavior Analysis, 2, 119-124.
Bellg, A. J., Borrelli, B., Resnick, B., Hecht, J., Minicucci, D. S., Ory, M., et al.
(2004). Enhancing treatment fidelity in health behavior change studies: Best
practices and recommendations from the NIH behavior change consortium.
Health Psychology, 23, 443-451.
Borrelli, B., Sepinwall, D., Ernst, D., Bellg, A. J., Czajkowski, S., Breger, R., et al.
(2005). A new tool to assess treatment fidelity and evaluation of treatment
fidelity across 10 years of health behavior research. Journal of Consulting
and Clinical Psychology, 73, 852-860.
Broughton, S. F., & Hester, J. R. (1993). Effects of administrative and community
support on teacher acceptance of classroom interventions. Journal of
Educational and Psychological Consultation, 4, 169-177.
Calvert, S. C., & Johnston, C. (1990). Acceptability of treatments for child behavior
problems: Issues and implications for future research. Journal of Clinical
Child & Adolescent Pscyhology, 19, 61-74.
Codding, R. S., Feinberg, A. B., Dunn, E. K., & Pace, G. M. (2005). Effects of
immediate performance feedback on implementation of behavior support
plans. Journal of Applied Behavior Analysis, 38, 205.
Cook, T. D., & Campbell, D. T. (1979). Quasi-experimentation: Design & analysis
issues for field settings. Boston: Houghton Mifflin.
Cooke, M. (2000). The dissemination of a smoking cessation program: Predictors of
program awareness, adoption and maintenance. Health Promotion
International, 15, 113-124.
Detrich, R. (1999). Increasing treatment fidelity by matching interventions to
72
contextual variables within the educational setting. School Psychology
Review, 28, 608.
DuBois, D. L., Holloway, B. E., Valentine, J. C., & Cooper, H. (2002).
Effectiveness of mentoring programs for youth: A meta-analytic review.
American Journal of Community Psychology, 30, 157–198.
Durlak, J. A., & DuPre, E. P. (2008). Implementation matters: A review of research
on the influence of implementation on program outcomes and the factors
affecting implementation. American Journal of Community Psychology, 41,
327-350.
Eckert, T. L., & Hintze, J. M. (2000). Behavioral conceptions and applications of
acceptability: Issues related to service delivery and research methodology.
School Psychology Quarterly, 15, 123-148.
Elliott, S. N. (1988). Acceptability of behavioral treatments: Review of variables
that influence treatment selection. Professional Psychology: Research and
Practice, 19, 68-80.
Evertson, C. M., & Emmer, E. T., Sanford, J. P., & Clements, B. S. (1983).
Improving classroom management: An experiment in elementary school
classrooms. The Elementary School Journal, 84, 172-188.
Evertson, C. M., & Harris, A. H. (2003). Creating Conditions for Learning: A
Comprehensive Program for Creating an Effective Learning Environment—
Secondary Level. Nashville: Vanderbilt University.
Finn, C. A., & Sladeczek, I. E. (2001). Assessing the social validity of behavioral
interventions: A review of treatment acceptability measures. School
Psychology Quarterly, 16, 176-206.
Greene, R. W. (1995). Students with ADHD in school classrooms: Teacher factors
related to compatibility, assessment and intervention. School Psychology
Review, 24, 81.
Greenwood, C. R., & Abbott, M. (2001). The research to practice gap in special
education. The Journal of the Teacher Education Division of the Council for
Exceptional Children, 24, 276-289.
Greenwood, C. R., Terry, B., & Arreaga-Mayer, C. (1992). The classwide peer
tutoring program: Implementation factors moderating students' achievement.
Journal of Applied Behavior Analysis, 25, 101-116.
Gresham, F. M. (1989). Assessment of treatment integrity in school consultation and
73
prereferral intervention. School Psychology Review, 18, 37-50.
Gresham, F. M., & Gansle, K. A. (1993). Treatment integrity of school-based
behavioral intervention studies: 1980-1990. School Psychology Review, 22,
254-273.
Gresham, F. M., MacMillan, D. L., Beebe-Frankenberger, M. E., & Bocian, K. M.
(2000). Treatment integrity in learning disabilities intervention research: Do
we really know how treatments are implemented? Learning Disabilities
Research & Practice, 15, 198-205.
Gunter, P. L., & Coutinho, M. J. (1997) Negative reinforcement in classrooms:
What we’re beginning to learn. Teacher Education and Special Education,
20, 249-264.
Harris, W. V., & Sherman, J. A. (1973). Use and analysis of the “Good Behavior
Game” to reduce disruptive classroom behavior. Journal of Applied Behavior
Analysis, 6, 405-417.
Hedeker, D., & Gibbons, R. D. (1997). Application of random-effects patter-mixture
models missing data in longitudinal studies, Psychological Methods, 2, 64-
78.
Henggeler, S. W., Melton, G. B., Brondino, M. J., Scherer, D. G., & Hanley, J. H.
(1997). Multisystemic therapy with violent and chronic juvenile offenders
and their families: The role of treatment fidelity in successful dissemination.
Journal of Consulting and Clinical Psychology, 65, 821-833.
Individuals with Disabilities Education Improvement Act of 2004 (IDEA), Pub. Law
no. 94-142.
Jensen, P. S. (2003). Commentary: The next generation is overdue. American
Academy of Child and Adolescent Psychiatry, 42, 527-530.
Johnston, J. M., & Pennypacker, H. S. (1993). Strategies and tactics of behavioral
research. Hillsdale, NJ: Lawrence Erlbaum.
Kazdin, A. E. (2000). Perceived barriers to treatment participation and treatment
acceptability among antisocial children and their families. Journal of Child
and Family Studies, 9, 157-174.
Kazdin, A. E. (1982). The token economy: A decade later. Journal of Applied
Behavior Analysis, 15, 431–445.
Kazdin, A.E. (1981). Acceptability of child treatment techniques: The influence of
treatment efficacy and adverse side effects. Behavior Therapy, 12, 493-506.
74
Kazdin, A.E. (1980). Acceptability of alternative treatments for deviant child
behavior. Journal of Applied Behavior Analysis, 13, 259-273.
Keselman, H. J., Rogan, J. C., Mendoza, J. L., & Breen, L. J. (1980). Testing the
validity conditions of repeated measures F tests. Psychology Bulletin, 87,
479-481.
Kurita, J. A. & Zarbatany, L. (1991). Teachers’ acceptance of strategies for
increasing students’ achievement motivation. Contemporary Educational
Psychology, 16, 241-253.
Kutash, K., Duchnowski, A. J., & Lynn, N. (2009). The use of evidence-based
instructional strategies in special education settings in secondary schools:
Development, implementation and outcomes. Teaching and Teacher
Education, 25, 917-923.
Landrum, T. J., Tankersley, M., Kauffman, J. M. (2003). What is special about
special education for students with emotional or behavioral disorders? The
Journal of Special Education, 37, 148-156.
Lane, K. L., Beebe-Frankenberger, M. E., & Lambros, K. M. (2001). Designing
effective interventions for children at-risk for antisocial behavior: An
integrated model of components necessary for making valid inferences.
Psychology in the Schools, 38, 365-380.
Lane, K. L., Bocian, K. M., MacMillan, D. L., & Gresham, F. M. (2004). Treatment
integrity: An essential-but often forgotten-component of school-based
interventions. Preventing School Failure, 48, 36-43.
Lannie, A. L., & McCurdy, B. L. (2007). Preventing disruptive behavior in the
urban classroom: Effects of the good behavior game on student and teacher
behavior. Education and Treatment of Children, 30, 85-98.
Long, J. D., & Pellegrini, A. D. (2003). Studying change in dominance and bullying
with linear mixed models. School Psychology Review, 32, 401-417.
Medland, M. B., & Stachnik, T. J. (1972). Good behavior game: A replication and
systematic analysis. Journal of Applied Behavior Analysis, 5, 45-51.
Mihalic, S. F., & Irwin, K. (2003). Blueprints for violence prevention: From
research to real-world settings—Factors influencing the successful
replication of model programs. Youth Violence and Juvenile Justice, 1, 307-
329.
75
Miltenberger, R. G. (1990). Assessment of treatment acceptability: A review of the
literature. Topics in Early Childhood Special Education, 10, 24-38.
Miltich Lyst, A., Gabriel, S., O'Shaughnessy, T. E., Meyers, J., & Meyers, B.
(2005). Social validity: Perceptions of check and connect with early literacy
support. Journal of School Psychology, 43, 197-218.
Moncher, F. J., & Prinz, R. J. (1991). Treatment fidelity in outcome studies. Clinical
Psychology Review, 11, 247-266.
No Child Left Behind Act of 2001 (NCLB), Pub. L. No. 107-110.
Noell, G. H., Gresham, F. M., & Gansle, K. A. (2002). Does treatment integrity
matter? A preliminary investigation of instructional implementation and
mathematics performance. Journal of Behavioral Education, 11, 51-67.
Noell, G. H., Witt, J. C., LaFleur, L. H., Mortenson, B. P., Rainer, D. D., & LeVelle,
J. (2000). Increasing intervention implementation in general education
following consultation: A comparison of two follow-up strategies.
Noell, G.H., & Witt, J.C. (1996). A critical evaluation of five fundamental
assumptions underlying behavioral consultation. School Psychology
Quarterly 11, 189–203.
Noell, G. H., Witt, J. C., Slider, N. J., Connell, J. E., Gatti, S. L., Williams, K. L., et
al. (2005). Treatment implementation following behavioral consultation in
schools: A comparison of three follow-up strategies. School Psychology
Review, 34, 87-106.
O'Donnell, C. L. (2008). Defining, conceptualizing, and measuring fidelity of
implementation and its relationship to outcomes in K-12 curriculum
intervention research. Review of Educational Research, 78, 33-84.
Peterson, L., Homer, A. L., & Wonderlich, S. A. (1982). The integrity of
independent variables in behavior analysis. Journal of Applied Behavior
Analysis, 15, 477–492.
Peterson, C. A., & McConnell, S. R. (1996). Factors related to intervention integrity
and child outcome in social skills interventions. Journal of Early
Intervention, 20, 146-164.
Reimers, T. M., & Wacker, D. P. (1992). Acceptability of behavioral treatments for
children: Analog and naturalistic evaluation by parents. School Psychology
Review, 21, 628.
Reimers, T. M., Wacker, D. P., & Koeppl, G. (1987). Acceptability of behavioral
76
treatments: A review of the literature. School Psychology Review, 16, 212-
227.
Riley-Tillman, T. C., Chafouleas, S. M., Eckert, T. L., & Kelleher, C. (2005).
Bridging the gap between research and practice: A framework for building
research agendas in school psychology, Psychology in the Schools, 42, 459-
473.
Ringwalt, C. L., Ennett, S., Johnson, R., Rohrbach, L. A., Simons-Rudolph, & A.,
Vincus, A. et al. (2003). Factors associated with fidelity to substance use
prevention curriculum guides in the nation’s middle schools. Health
Education & Behavior, 30, 375-391.
Rotheram-Borus, M. J., & Duan, N. (2003). Next generation of preventive
interventions. American Academy of Child and Adolescent Psychiatry, 42,
518-526.
Sanchez, V., Steckler, A., Nitirat, P., Hallfors, D., Cho, H., & Brodish, P. (2007).
Fidelity of implementation in a treatment effectiveness trial of reconnecting
youth. Health Education Research, 22, 95-107.
Smith, S. W., Daunic, A. P., & Taylor, G. G. (2007). Treatment fidelity in applied
educational research: Expanding the adoption and application of measures to
ensure evidence-based practice. Education & Treatment of Children, 30,
121-134.
Smith, J. D., Schneider, B. H., Smith, P. K., & Ananiadou, K. (2004). The
effectiveness of whole-school antibullying programs: A synthesis of
evaluation research. School Psychology Review, 33, 547-560.
Sutherland, K. S., Alder, N., & Gunter, P. L. (2003). The effects of varying rates of
opportunities to respond to academic request on the classroom behavior of
students with EBD. Journal of Emotional & Behavioral Disorders, 11, 239-
249.
Sutherland, K. S., & Wehby, J. H. (2001). The effects of self-evaluation on teaching
behavior in classrooms for students with emotional and behavioral disorders.
Journal of Special Education, 35, 161-171.
Sutherland, K. S., Wehby, J. H., & Copeland, S. R. (2000). Effect of varying rates of
behavior specific praise on the on-task behavior of students with emotional
and behavioral disorders. Journal of Emotional and Behavioral Disorders, 8,
2-8.
77
Sterling-Turner, H. E., & Watson, T. S. (2002). An analog investigation of the
relationship between treatment acceptability and treatment integrity. Journal
of Behavioral Education, 11, 39-50.
Swiezy, N. B., Matson, J. L., & Box, P. (1992). The good behavior game: A token
reinforcement system for preschoolers. Child & Family Behavior Therapy,
14, 21-31.
Tanol, G., Johnson L., McComas, J. & Cote, E. (in press, 2010). Responding to rule
violations or rule following: A comparison of two versions of the good
behavior game with kindergarten students. Journal of School Psychology.
Tingstrom, D. H., Sterling-Turner, H. E., & Wilczynski, S. M. (2006). The good
behavior game: 1969-2002. Behavior Modification, 30, 225-253.
Utts, J. M., & Heckard, R. F. (2006). Statistical ideas and methods. Belmont, CA:
Thomson Brooks/Cole.
Weade, R., & Evertson, C. M. (1988). The construction of lessons in effective and
less effective classrooms (Report no. NIE-G-83-0063). Washington, DC:
Office of Educational Research and Improvement.
West, B. T., Welch, K. B., & Galecki, A. T. (2007). Linear mixed models: A
practical guide using statistical software. Broken Sound Parkway, NW:
Taylor & Francis Group, LLC.
Wickstrom, K. F., Jones, K. M., LaFleur, L. H., & Witt, J. C. (1998). An analysis of
treatment integrity in school-based behavioral consultation. School
Psychology Quarterly, 13, 141-54.
Wilder, D. A., Atwell, J., & Wine, B. (2006). The effects of varying levels of
treatment integrity on child compliance during treatment with a three-step
prompting procedure. Journal of Applied Behavior Analysis, 39(3), 369-373.
Wilson, S. J., Lipsey, M. W., & Derzon, J. H. (2003). The effects of school-based
intervention programs on aggressive behavior: A meta-analysis. Journal of
Consulting and Clinical Psychology, 71, 136–149.
Witt, J. C., & Elliott, S. N. (1985). Acceptability of classroom intervention
strategies. In T. R. Kratochwill (Ed.), Advances in school psychology (pp.
252-288). Hillsdale, NJ: Erlbaum.
Witt, J. C., Gresham, F. M., & Noell, G. H. (1996). What's behavioral about
behavioral consultation. Journal of Educational & Psychological
Consultation, 7, 327-344.
78
Wolf, M. M. (1978). Social validity: The case for subjective measurement or how
applied behavior analysis is finding its heart. Journal of Applied Behavior
Analysis, 11, 203–214
Wood, B. K., Umbreit, J., Liaupsin, C. J., & Gresham, F. M. (2007). A treatment
integrity analysis of function-based intervention. Education & Treatment of
Children, 30, 105-120.
Yeaton, W. H., & Sechrest, L. (1981). Critical dimensions in the choice and
maintenance of successful treatments: Strength, integrity, and effectiveness.
Journal of Consulting and Clinical Psychology, 49, 156-167.
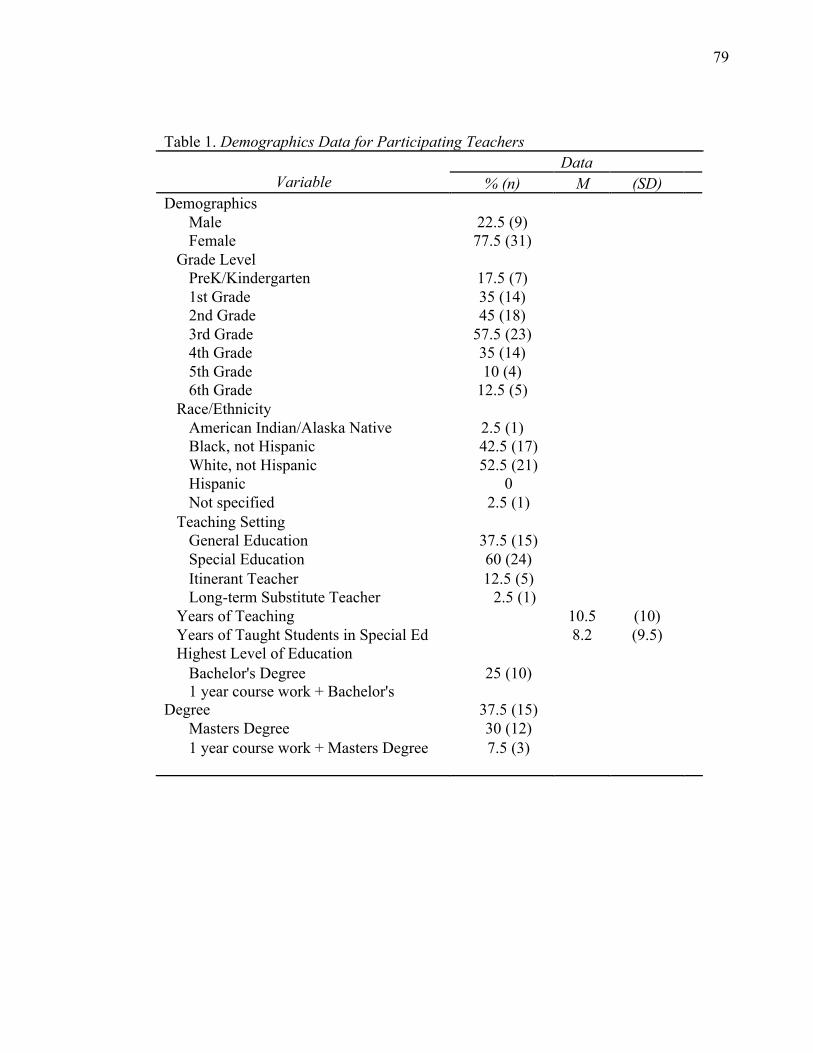
79
Table 1. Demographics Data for Participating Teachers Data
Variable % (n) M (SD) Demographics
Male 22.5 (9) Female 77.5 (31)
Grade Level PreK/Kindergarten 17.5 (7) 1st Grade 35 (14) 2nd Grade 45 (18) 3rd Grade 57.5 (23) 4th Grade 35 (14) 5th Grade 10 (4) 6th Grade 12.5 (5)
Race/Ethnicity American Indian/Alaska Native 2.5 (1) Black, not Hispanic 42.5 (17) White, not Hispanic 52.5 (21) Hispanic 0 Not specified 2.5 (1)
Teaching Setting General Education 37.5 (15) Special Education 60 (24) Itinerant Teacher 12.5 (5) Long-term Substitute Teacher 2.5 (1)
Years of Teaching 10.5 (10) Years of Taught Students in Special Ed 8.2 (9.5) Highest Level of Education
Bachelor's Degree 25 (10) 1 year course work + Bachelor's
Degree 37.5 (15) Masters Degree 30 (12) 1 year course work + Masters Degree 7.5 (3)
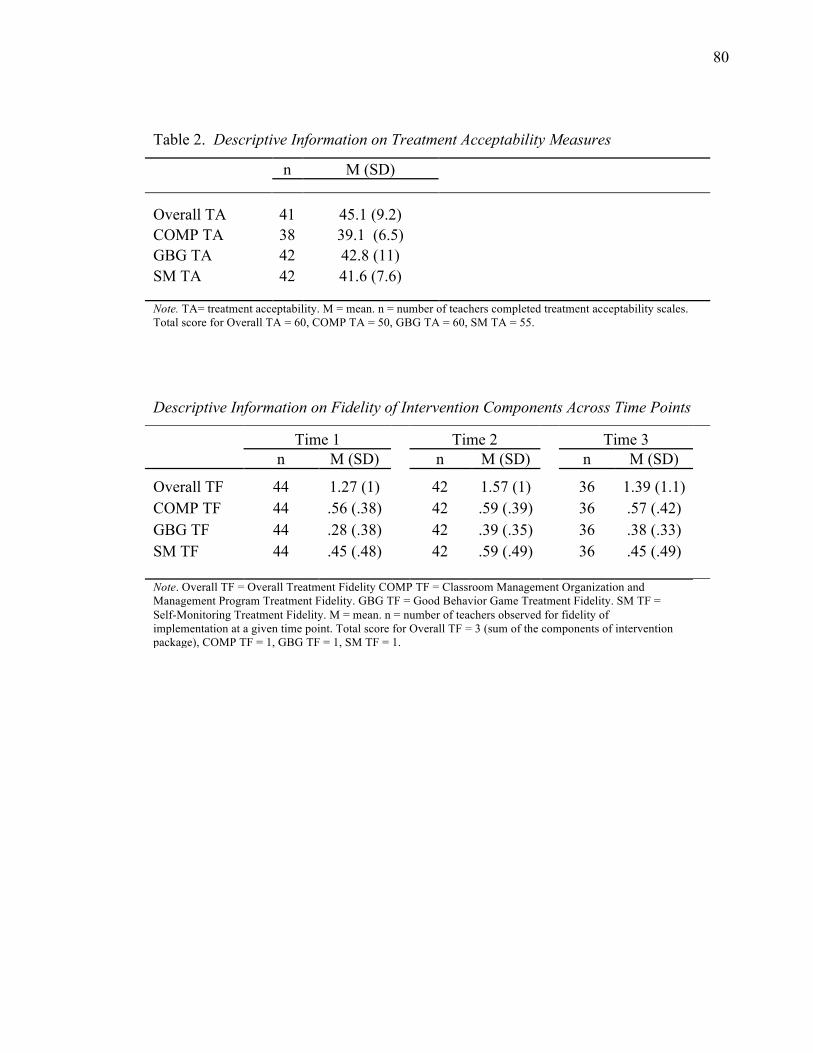
80
Table 2. Descriptive Information on Treatment Acceptability Measures
n M (SD)
Overall TA 41 45.1 (9.2) COMP TA 38 39.1 (6.5) GBG TA 42 42.8 (11) SM TA 42 41.6 (7.6) Note. TA= treatment acceptability. M = mean. n = number of teachers completed treatment acceptability scales. Total score for Overall TA = 60, COMP TA = 50, GBG TA = 60, SM TA = 55.
Descriptive Information on Fidelity of Intervention Components Across Time Points
Time 1 Time 2 Time 3
n M (SD) n M (SD) n M (SD)
Overall TF 44 1.27 (1) 42 1.57 (1) 36 1.39 (1.1)
COMP TF 44 .56 (.38) 42 .59 (.39) 36 .57 (.42)
GBG TF 44 .28 (.38) 42 .39 (.35) 36 .38 (.33)
SM TF 44 .45 (.48) 42 .59 (.49) 36 .45 (.49) Note. Overall TF = Overall Treatment Fidelity COMP TF = Classroom Management Organization and Management Program Treatment Fidelity. GBG TF = Good Behavior Game Treatment Fidelity. SM TF = Self-Monitoring Treatment Fidelity. M = mean. n = number of teachers observed for fidelity of implementation at a given time point. Total score for Overall TF = 3 (sum of the components of intervention package), COMP TF = 1, GBG TF = 1, SM TF = 1.
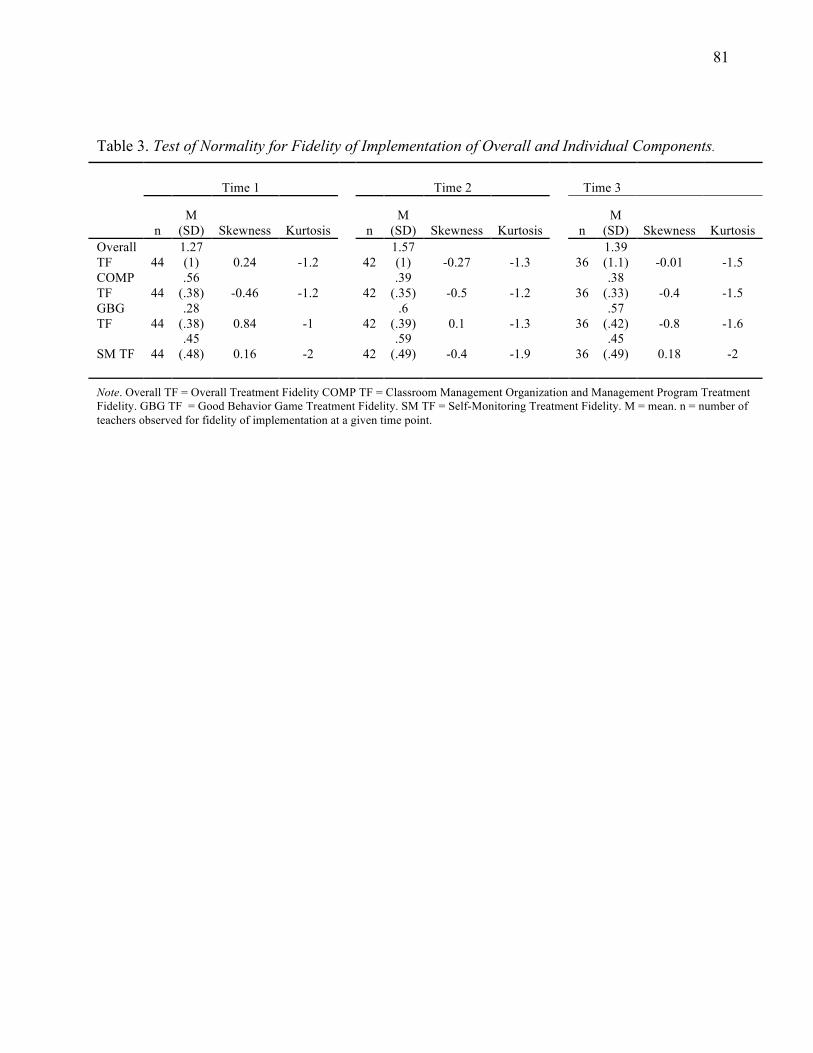
81
Table 3. Test of Normality for Fidelity of Implementation of Overall and Individual Components.
Time 1 Time 2 Time 3
n M
(SD) Skewness Kurtosis n M
(SD) Skewness Kurtosis n M
(SD) Skewness Kurtosis Overall TF 44
1.27 (1) 0.24 -1.2 42
1.57 (1) -0.27 -1.3 36
1.39 (1.1) -0.01 -1.5
COMP TF 44
.56 (.38) -0.46 -1.2 42
.39 (.35) -0.5 -1.2 36
.38 (.33) -0.4 -1.5
GBG TF 44
.28 (.38) 0.84 -1 42
.6 (.39) 0.1 -1.3 36
.57 (.42) -0.8 -1.6
SM TF 44 .45
(.48) 0.16 -2 42 .59
(.49) -0.4 -1.9 36 .45
(.49) 0.18 -2
Note. Overall TF = Overall Treatment Fidelity COMP TF = Classroom Management Organization and Management Program Treatment Fidelity. GBG TF = Good Behavior Game Treatment Fidelity. SM TF = Self-Monitoring Treatment Fidelity. M = mean. n = number of teachers observed for fidelity of implementation at a given time point.
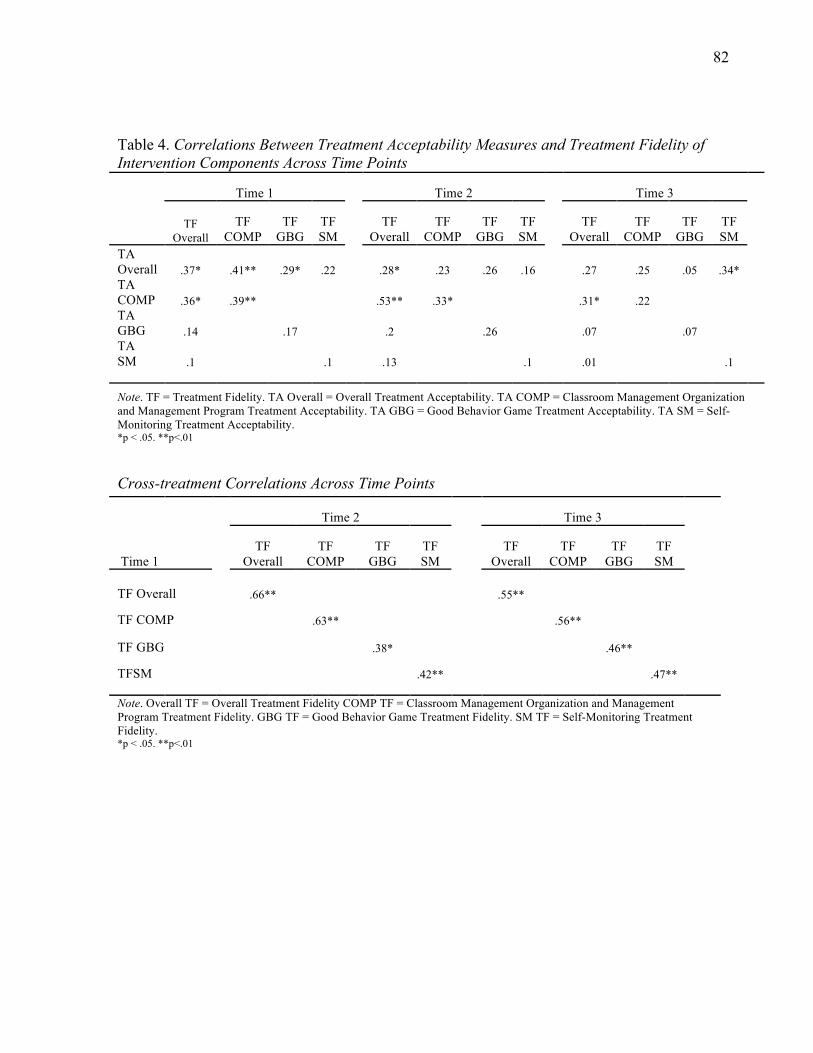
82
Table 4. Correlations Between Treatment Acceptability Measures and Treatment Fidelity of Intervention Components Across Time Points
Time 1 Time 2 Time 3
TF
Overall TF
COMP TF
GBG TF SM
TF Overall
TF COMP
TF GBG
TF SM
TF Overall
TF COMP
TF GBG
TF SM
TA Overall .37* .41** .29* .22 .28* .23 .26 .16 .27 .25 .05 .34* TA COMP .36* .39** .53** .33* .31* .22 TA GBG .14 .17 .2 .26 .07 .07 TA SM .1 .1 .13 .1 .01 .1
Note. TF = Treatment Fidelity. TA Overall = Overall Treatment Acceptability. TA COMP = Classroom Management Organization and Management Program Treatment Acceptability. TA GBG = Good Behavior Game Treatment Acceptability. TA SM = Self-Monitoring Treatment Acceptability. *p < .05. **p<.01
Cross-treatment Correlations Across Time Points
Time 2 Time 3
Time 1 TF
Overall TF
COMP TF
GBG TF SM
TF Overall
TF COMP
TF GBG
TF SM
TF Overall .66** .55**
TF COMP .63** .56**
TF GBG .38* .46**
TFSM .42** .47** Note. Overall TF = Overall Treatment Fidelity COMP TF = Classroom Management Organization and Management Program Treatment Fidelity. GBG TF = Good Behavior Game Treatment Fidelity. SM TF = Self-Monitoring Treatment Fidelity. *p < .05. **p<.01
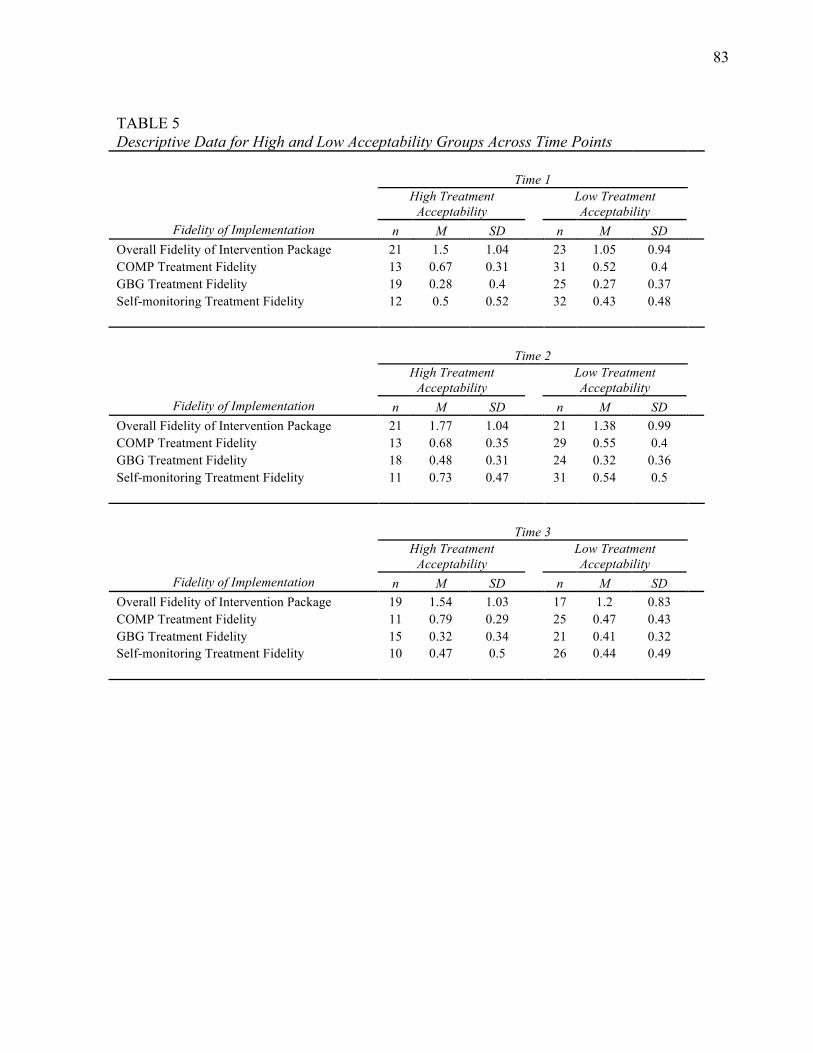
83
TABLE 5 Descriptive Data for High and Low Acceptability Groups Across Time Points Time 1
High Treatment Acceptability
Low Treatment Acceptability
Fidelity of Implementation n M SD n M SD Overall Fidelity of Intervention Package 21 1.5 1.04 23 1.05 0.94 COMP Treatment Fidelity 13 0.67 0.31 31 0.52 0.4 GBG Treatment Fidelity 19 0.28 0.4 25 0.27 0.37 Self-monitoring Treatment Fidelity 12 0.5 0.52 32 0.43 0.48 Time 2
High Treatment Acceptability
Low Treatment Acceptability
Fidelity of Implementation n M SD n M SD Overall Fidelity of Intervention Package 21 1.77 1.04 21 1.38 0.99 COMP Treatment Fidelity 13 0.68 0.35 29 0.55 0.4 GBG Treatment Fidelity 18 0.48 0.31 24 0.32 0.36 Self-monitoring Treatment Fidelity 11 0.73 0.47 31 0.54 0.5 Time 3
High Treatment Acceptability
Low Treatment Acceptability
Fidelity of Implementation n M SD n M SD Overall Fidelity of Intervention Package 19 1.54 1.03 17 1.2 0.83 COMP Treatment Fidelity 11 0.79 0.29 25 0.47 0.43 GBG Treatment Fidelity 15 0.32 0.34 21 0.41 0.32 Self-monitoring Treatment Fidelity 10 0.47 0.5 26 0.44 0.49
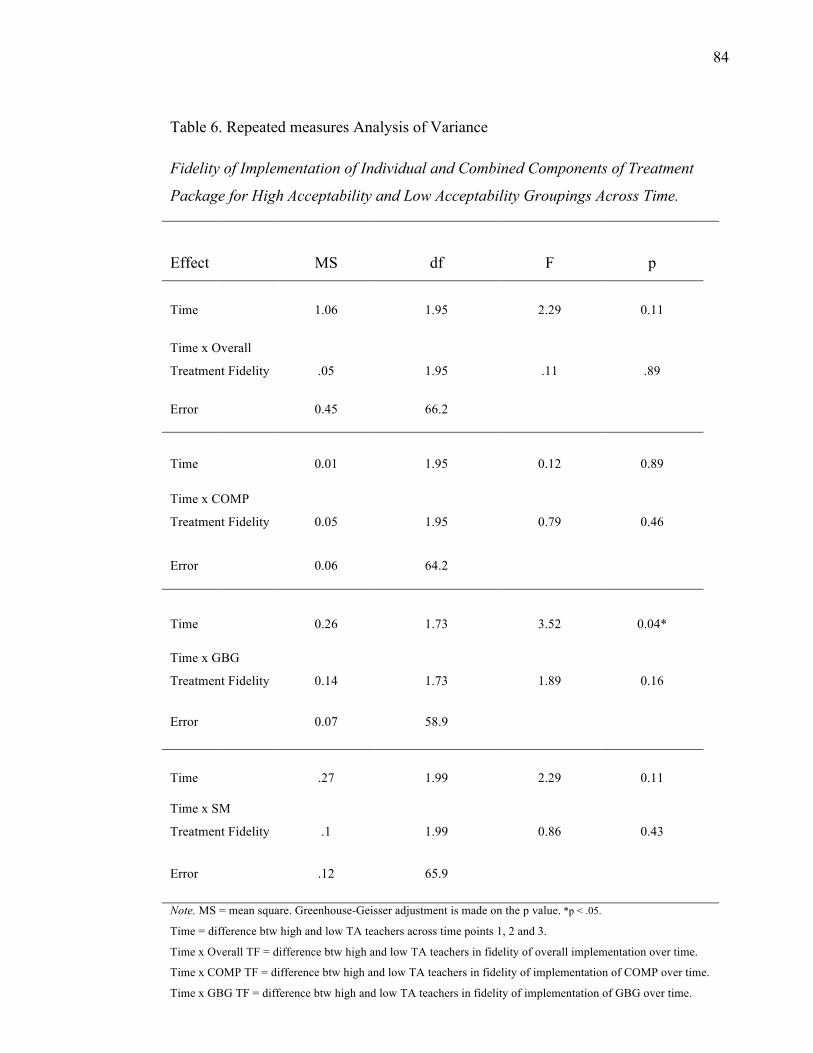
84
Table 6. Repeated measures Analysis of Variance
Fidelity of Implementation of Individual and Combined Components of Treatment
Package for High Acceptability and Low Acceptability Groupings Across Time.
Effect MS df F p
Time 1.06 1.95 2.29 0.11
Time x Overall
Treatment Fidelity .05 1.95 .11 .89
Error 0.45 66.2
Time 0.01 1.95 0.12 0.89
Time x COMP
Treatment Fidelity 0.05 1.95 0.79 0.46
Error 0.06 64.2
Time 0.26 1.73 3.52 0.04*
Time x GBG
Treatment Fidelity 0.14 1.73 1.89 0.16
Error 0.07 58.9
Time .27 1.99 2.29 0.11
Time x SM
Treatment Fidelity .1 1.99 0.86 0.43
Error .12 65.9
Note. MS = mean square. Greenhouse-Geisser adjustment is made on the p value. *p < .05.
Time = difference btw high and low TA teachers across time points 1, 2 and 3.
Time x Overall TF = difference btw high and low TA teachers in fidelity of overall implementation over time.
Time x COMP TF = difference btw high and low TA teachers in fidelity of implementation of COMP over time.
Time x GBG TF = difference btw high and low TA teachers in fidelity of implementation of GBG over time.
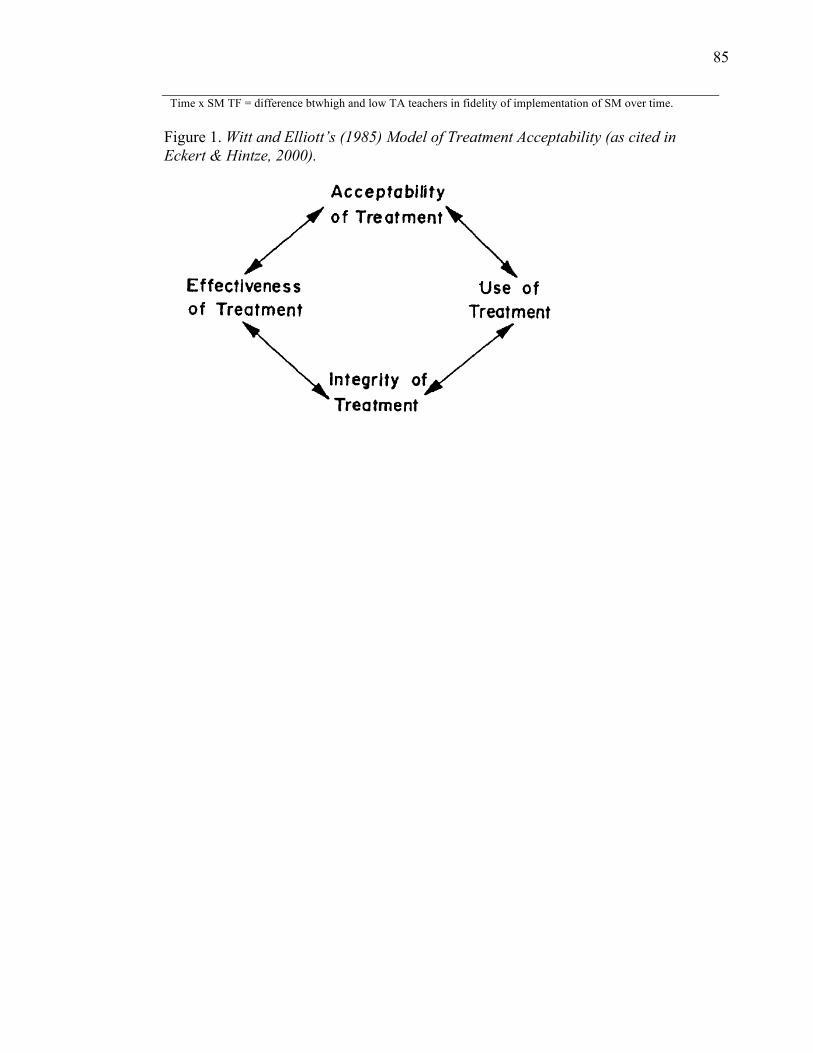
85
Time x SM TF = difference btwhigh and low TA teachers in fidelity of implementation of SM over time.
Figure 1. Witt and Elliott’s (1985) Model of Treatment Acceptability (as cited in Eckert & Hintze, 2000).
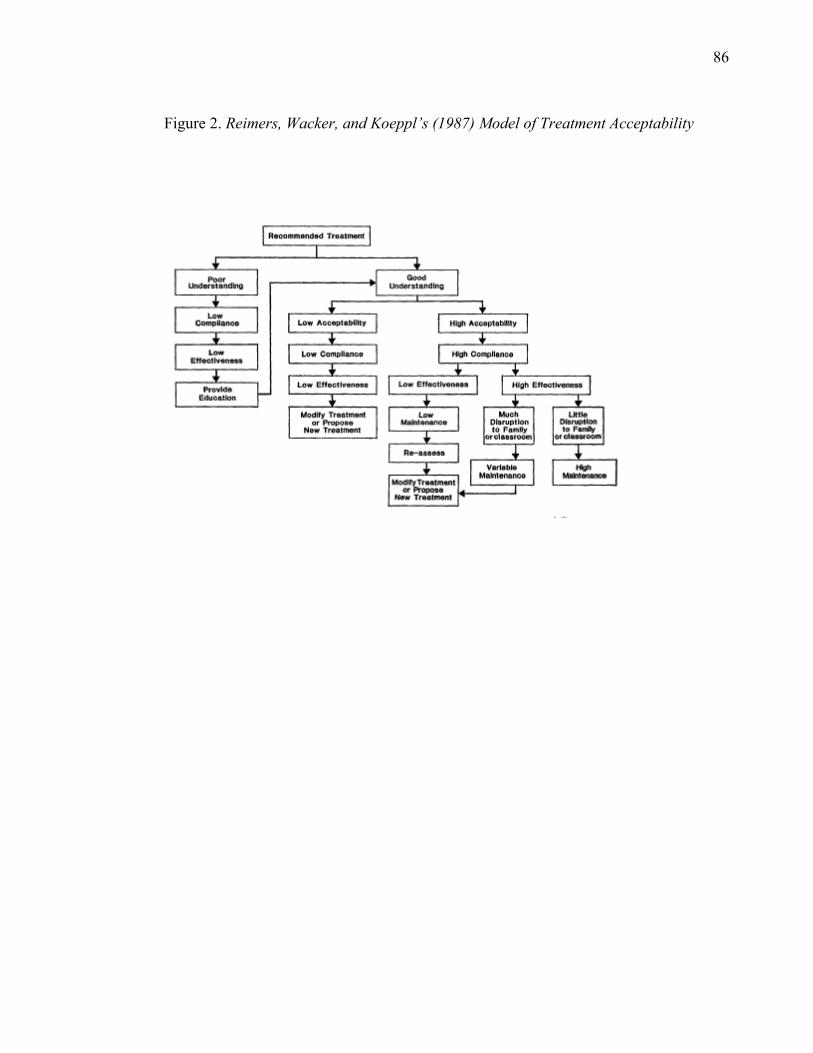
86
Figure 2. Reimers, Wacker, and Koeppl’s (1987) Model of Treatment Acceptability
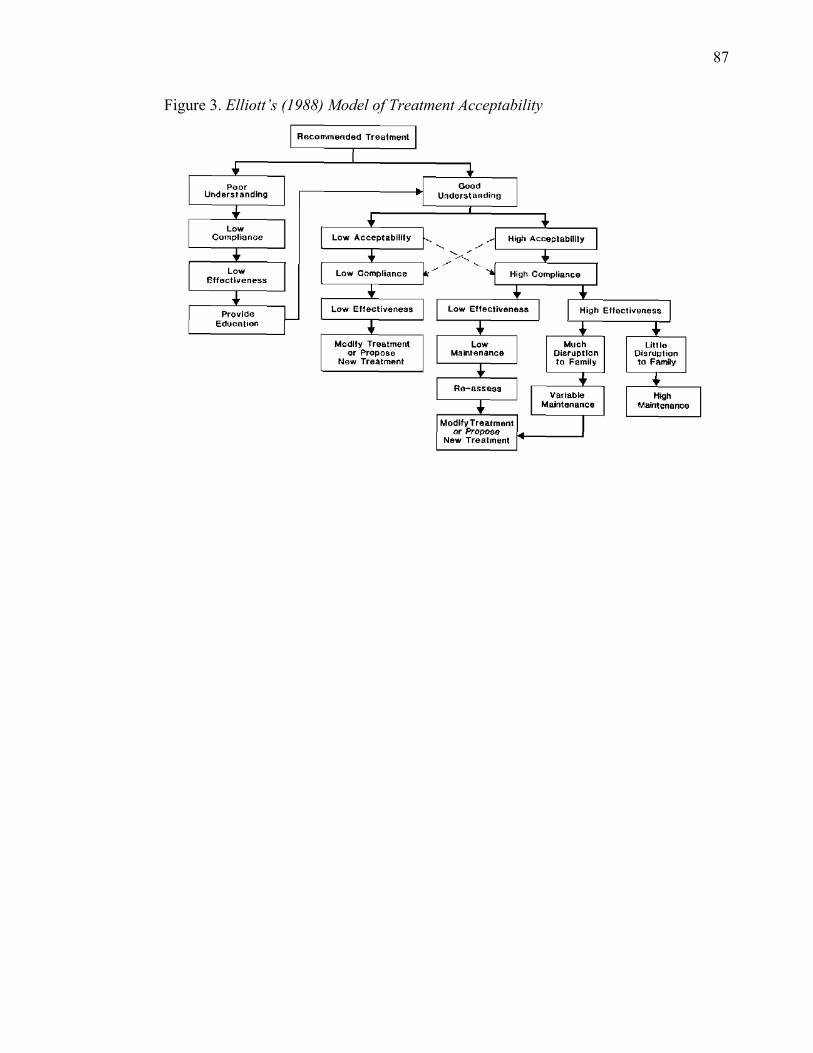
87
Figure 3. Elliott’s (1988) Model of Treatment Acceptability
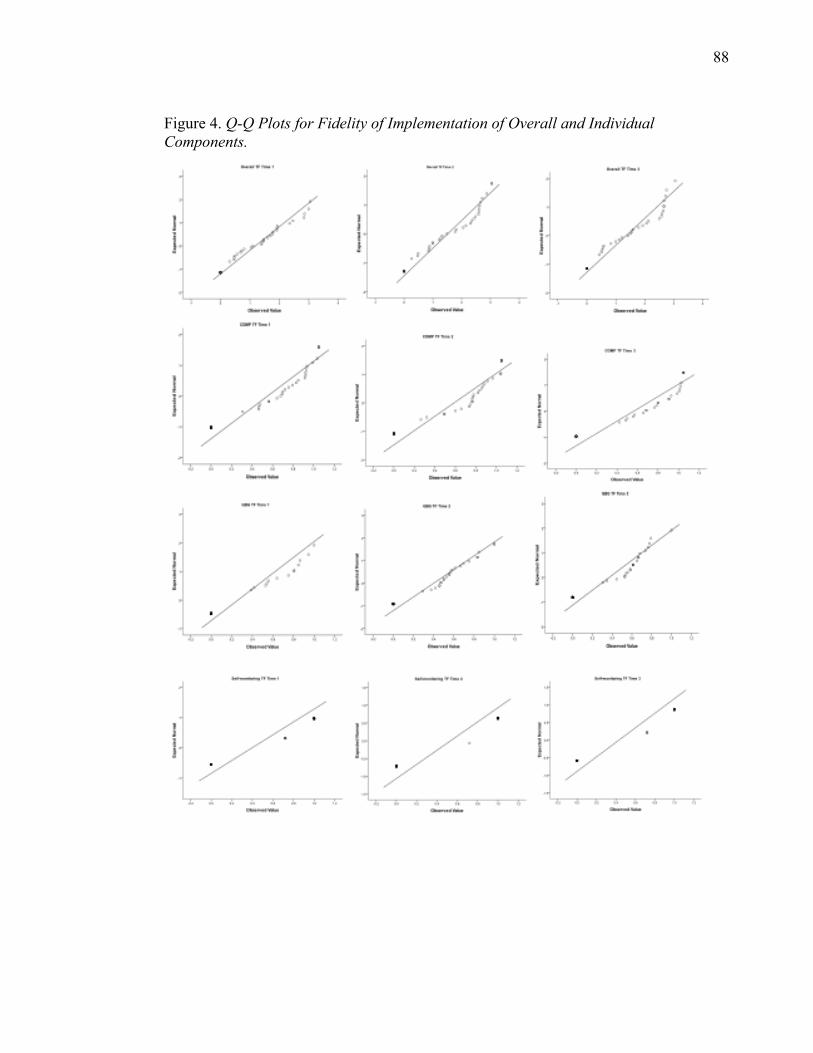
88
Figure 4. Q-Q Plots for Fidelity of Implementation of Overall and Individual Components.
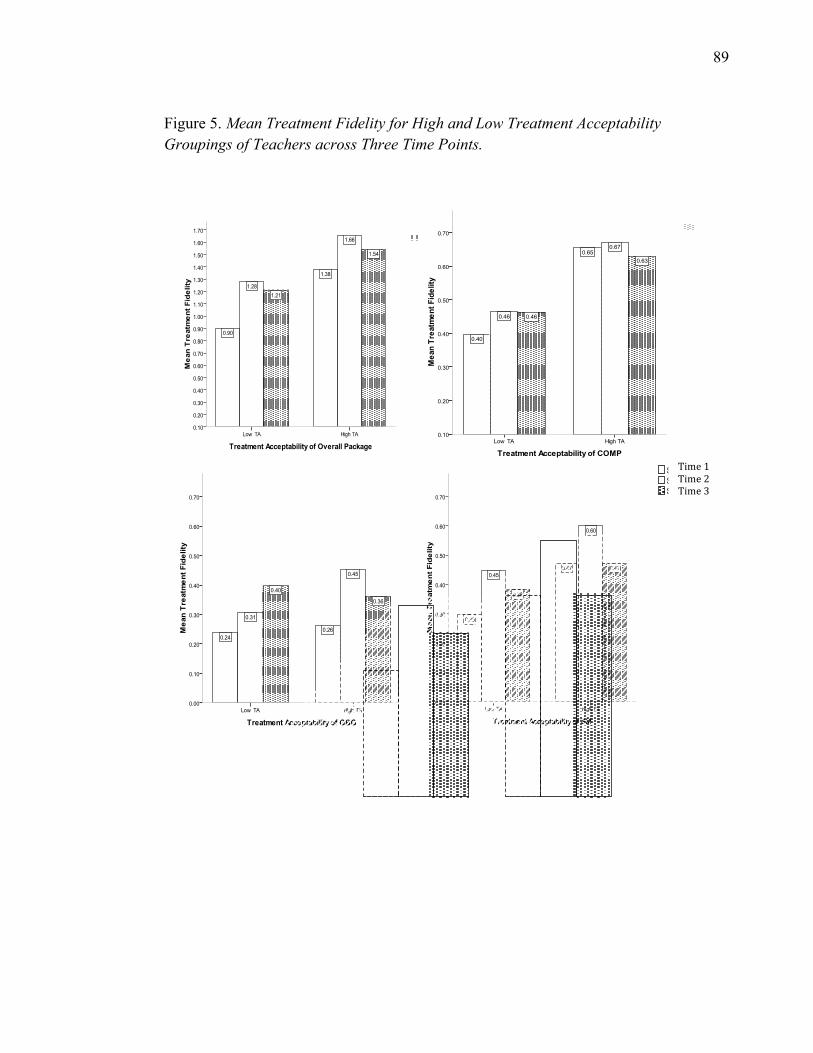
89
Figure 5. Mean Treatment Fidelity for High and Low Treatment Acceptability Groupings of Teachers across Three Time Points.
Time 1 Time 2 Time 3

90
APPENDIX A
Treatment Acceptability Rating Scales
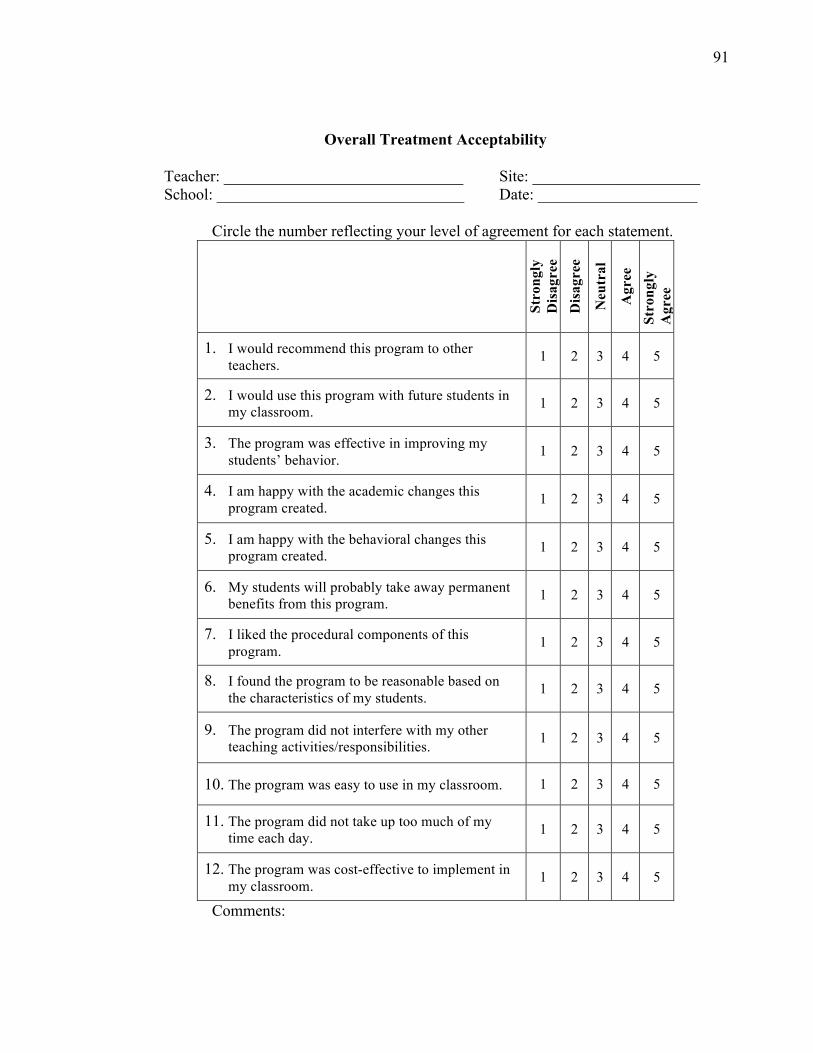
91
Overall Treatment Acceptability Teacher: ______________________________ Site: _____________________ School: _______________________________ Date: ____________________
Circle the number reflecting your level of agreement for each statement.
Stro
ngly
D
isag
ree
Dis
agre
e N
eutr
al
Agr
ee
Stro
ngly
A
gree
1. I would recommend this program to other teachers. 1 2 3 4 5
2. I would use this program with future students in my classroom. 1 2 3 4 5
3. The program was effective in improving my students’ behavior. 1 2 3 4 5
4. I am happy with the academic changes this program created. 1 2 3 4 5
5. I am happy with the behavioral changes this program created. 1 2 3 4 5
6. My students will probably take away permanent benefits from this program. 1 2 3 4 5
7. I liked the procedural components of this program. 1 2 3 4 5
8. I found the program to be reasonable based on the characteristics of my students. 1 2 3 4 5
9. The program did not interfere with my other teaching activities/responsibilities. 1 2 3 4 5
10. The program was easy to use in my classroom. 1 2 3 4 5
11. The program did not take up too much of my time each day. 1 2 3 4 5
12. The program was cost-effective to implement in my classroom. 1 2 3 4 5
Comments:
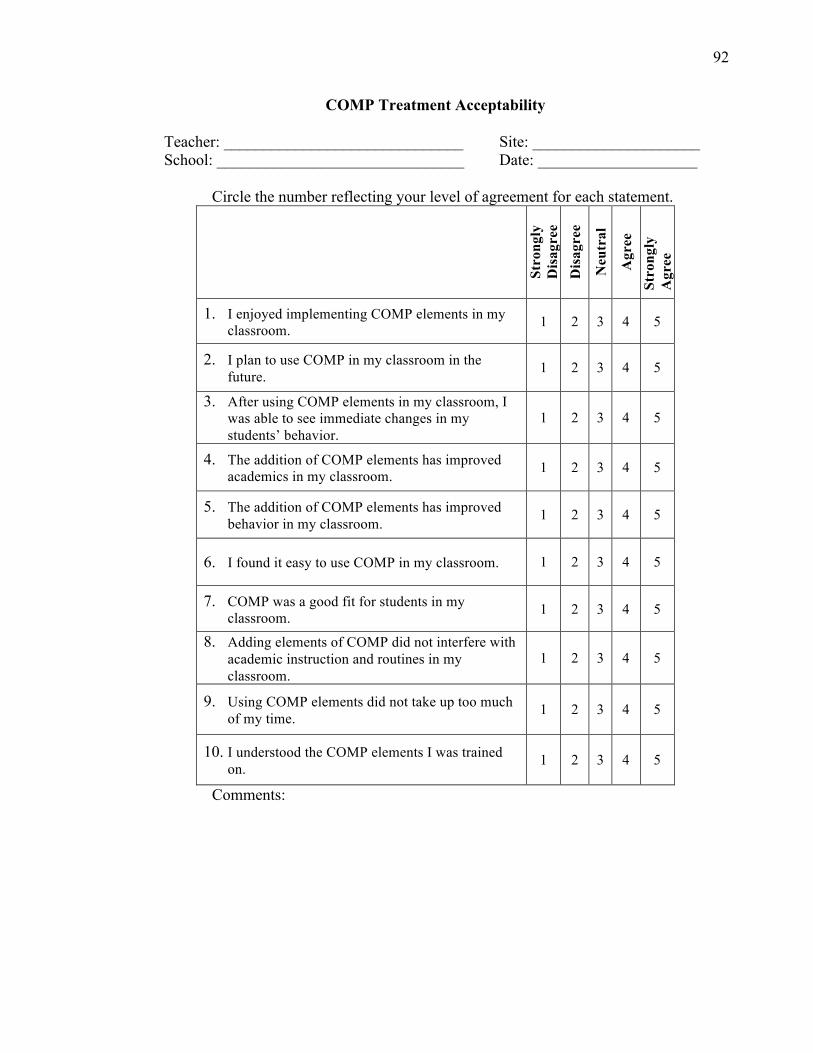
92
COMP Treatment Acceptability Teacher: ______________________________ Site: _____________________ School: _______________________________ Date: ____________________
Circle the number reflecting your level of agreement for each statement.
Stro
ngly
D
isag
ree
Dis
agre
e N
eutr
al
Agr
ee
Stro
ngly
A
gree
1. I enjoyed implementing COMP elements in my classroom. 1 2 3 4 5
2. I plan to use COMP in my classroom in the future. 1 2 3 4 5
3. After using COMP elements in my classroom, I was able to see immediate changes in my students’ behavior.
1 2 3 4 5
4. The addition of COMP elements has improved academics in my classroom. 1 2 3 4 5
5. The addition of COMP elements has improved behavior in my classroom. 1 2 3 4 5
6. I found it easy to use COMP in my classroom. 1 2 3 4 5
7. COMP was a good fit for students in my classroom. 1 2 3 4 5
8. Adding elements of COMP did not interfere with academic instruction and routines in my classroom.
1 2 3 4 5
9. Using COMP elements did not take up too much of my time. 1 2 3 4 5
10. I understood the COMP elements I was trained on. 1 2 3 4 5
Comments:
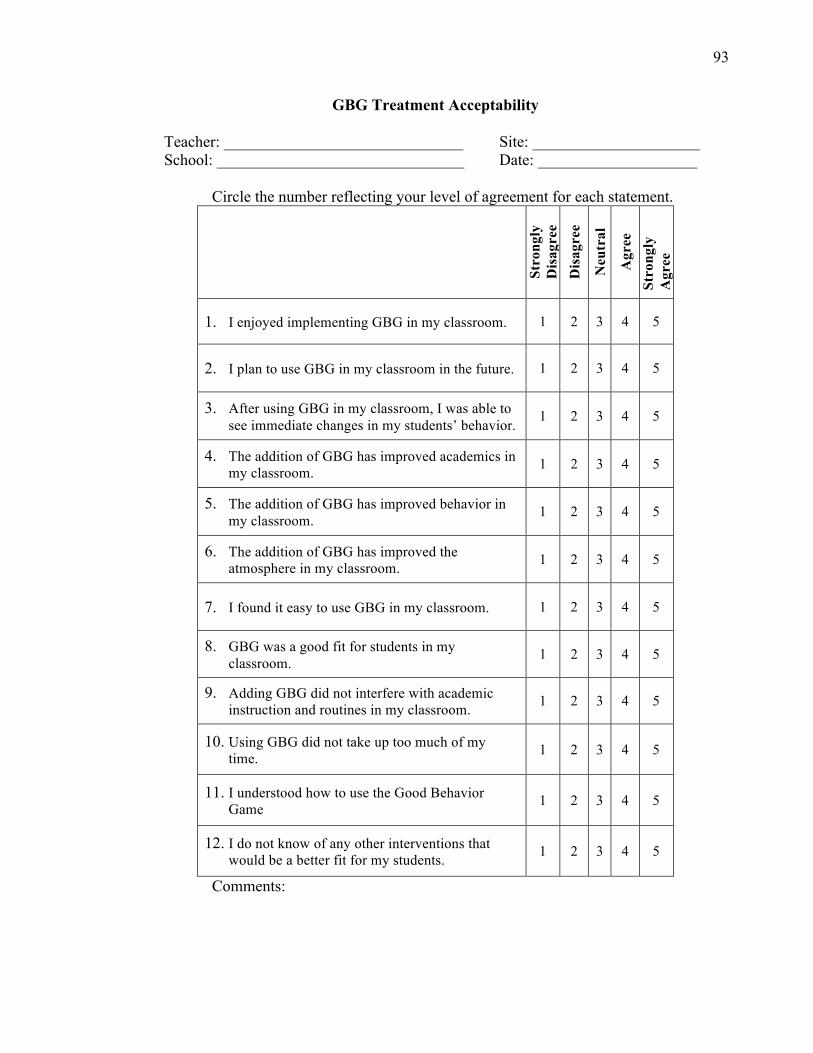
93
GBG Treatment Acceptability Teacher: ______________________________ Site: _____________________ School: _______________________________ Date: ____________________
Circle the number reflecting your level of agreement for each statement.
Stro
ngly
D
isag
ree
Dis
agre
e N
eutr
al
Agr
ee
Stro
ngly
A
gree
1. I enjoyed implementing GBG in my classroom. 1 2 3 4 5
2. I plan to use GBG in my classroom in the future. 1 2 3 4 5
3. After using GBG in my classroom, I was able to see immediate changes in my students’ behavior. 1 2 3 4 5
4. The addition of GBG has improved academics in my classroom. 1 2 3 4 5
5. The addition of GBG has improved behavior in my classroom. 1 2 3 4 5
6. The addition of GBG has improved the atmosphere in my classroom. 1 2 3 4 5
7. I found it easy to use GBG in my classroom. 1 2 3 4 5
8. GBG was a good fit for students in my classroom. 1 2 3 4 5
9. Adding GBG did not interfere with academic instruction and routines in my classroom. 1 2 3 4 5
10. Using GBG did not take up too much of my time. 1 2 3 4 5
11. I understood how to use the Good Behavior Game 1 2 3 4 5
12. I do not know of any other interventions that would be a better fit for my students. 1 2 3 4 5
Comments:
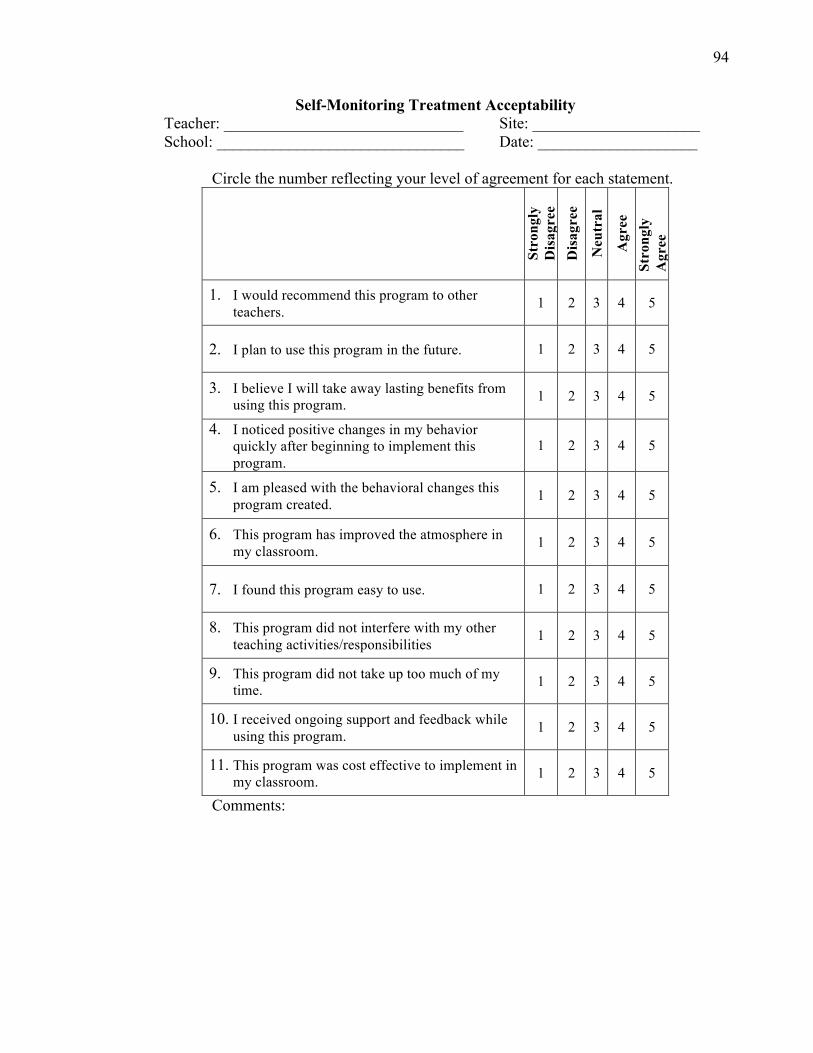
94
Self-Monitoring Treatment Acceptability Teacher: ______________________________ Site: _____________________ School: _______________________________ Date: ____________________
Circle the number reflecting your level of agreement for each statement.
Stro
ngly
D
isag
ree
Dis
agre
e N
eutr
al
Agr
ee
Stro
ngly
A
gree
1. I would recommend this program to other teachers. 1 2 3 4 5
2. I plan to use this program in the future. 1 2 3 4 5
3. I believe I will take away lasting benefits from using this program. 1 2 3 4 5
4. I noticed positive changes in my behavior quickly after beginning to implement this program.
1 2 3 4 5
5. I am pleased with the behavioral changes this program created. 1 2 3 4 5
6. This program has improved the atmosphere in my classroom. 1 2 3 4 5
7. I found this program easy to use. 1 2 3 4 5
8. This program did not interfere with my other teaching activities/responsibilities 1 2 3 4 5
9. This program did not take up too much of my time. 1 2 3 4 5
10. I received ongoing support and feedback while using this program. 1 2 3 4 5
11. This program was cost effective to implement in my classroom. 1 2 3 4 5
Comments:
95
APPENDIX B
Treatment Fidelity Check Lists
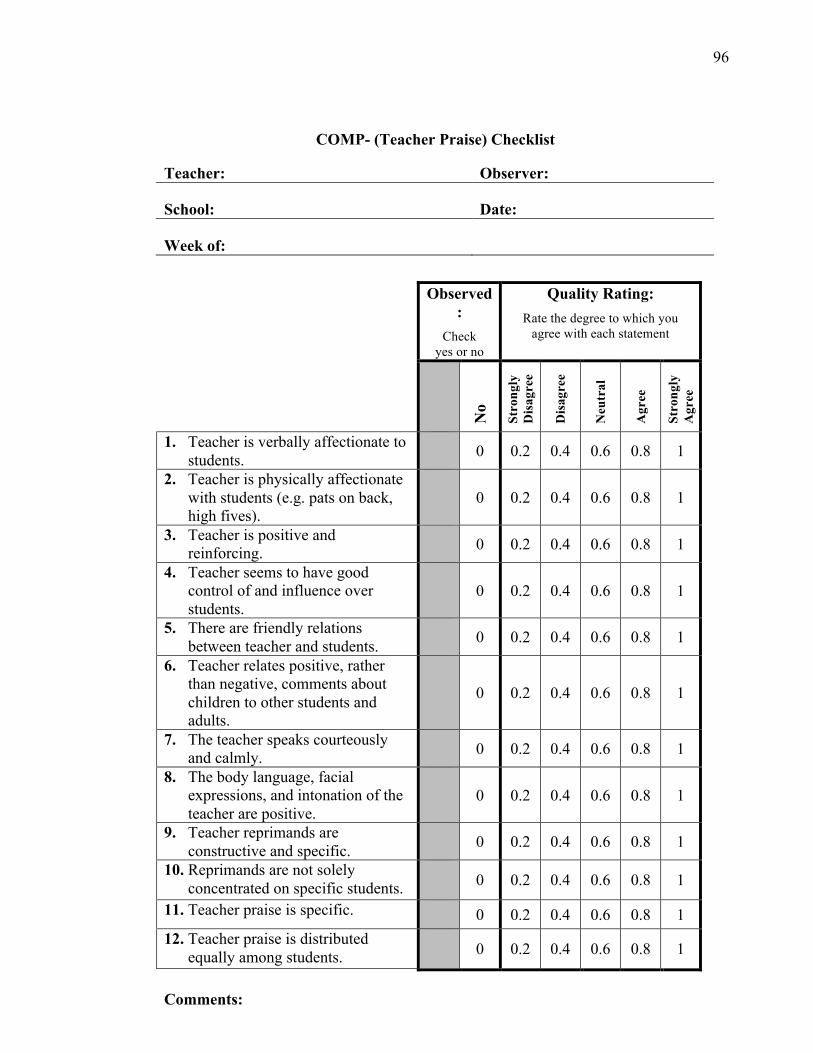
96
COMP- (Teacher Praise) Checklist
Teacher: Observer:
School: Date:
Week of:
Observed
:
Check yes or no
Quality Rating:
Rate the degree to which you agree with each statement
No
Stro
ngly
D
isag
ree
Dis
agre
e
Neu
tral
Agr
ee
Stro
ngly
A
gree
1. Teacher is verbally affectionate to students.
0 0.2 0.4 0.6 0.8 1
2. Teacher is physically affectionate with students (e.g. pats on back, high fives).
0 0.2 0.4 0.6 0.8 1
3. Teacher is positive and reinforcing.
0 0.2 0.4 0.6 0.8 1
4. Teacher seems to have good control of and influence over students.
0 0.2 0.4 0.6 0.8 1
5. There are friendly relations between teacher and students.
0 0.2 0.4 0.6 0.8 1
6. Teacher relates positive, rather than negative, comments about children to other students and adults.
0 0.2 0.4 0.6 0.8 1
7. The teacher speaks courteously and calmly.
0 0.2 0.4 0.6 0.8 1
8. The body language, facial expressions, and intonation of the teacher are positive.
0 0.2 0.4 0.6 0.8 1
9. Teacher reprimands are constructive and specific.
0 0.2 0.4 0.6 0.8 1
10. Reprimands are not solely concentrated on specific students.
0 0.2 0.4 0.6 0.8 1
11. Teacher praise is specific. 0 0.2 0.4 0.6 0.8 1 12. Teacher praise is distributed
equally among students. 0 0.2 0.4 0.6 0.8 1
Comments:
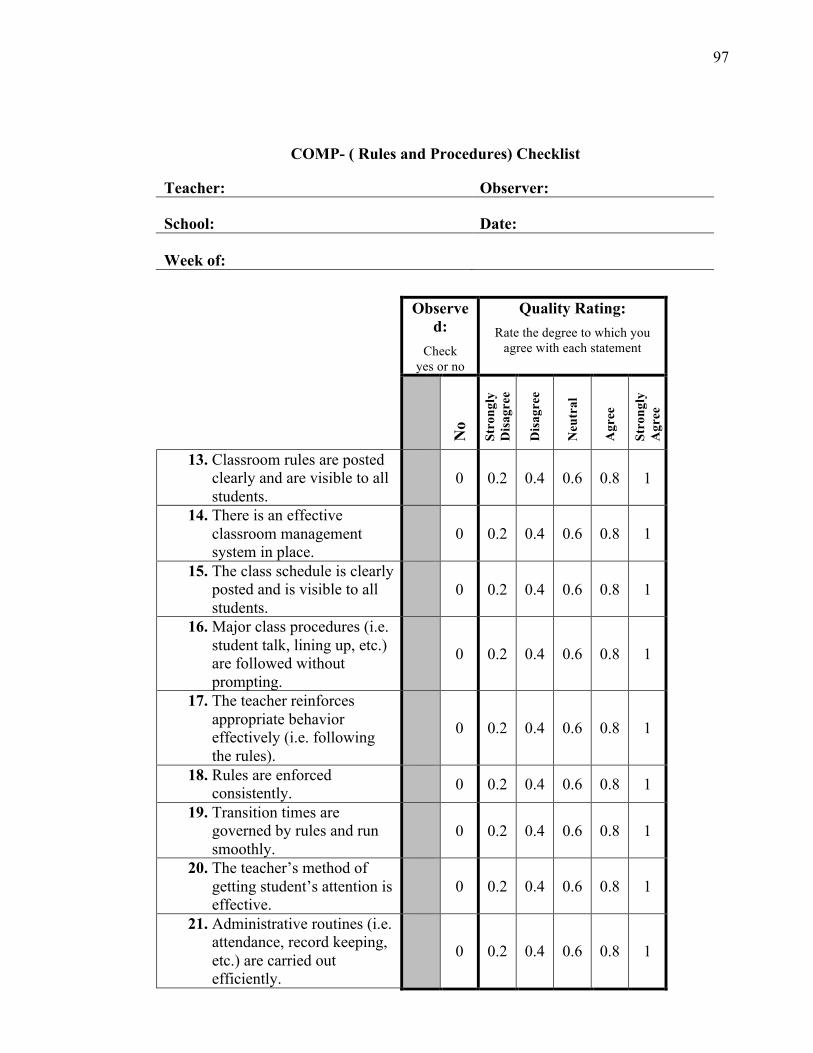
97
COMP- ( Rules and Procedures) Checklist
Teacher: Observer:
School: Date:
Week of:
Observe
d:
Check yes or no
Quality Rating:
Rate the degree to which you agree with each statement
No
Stro
ngly
D
isag
ree
Dis
agre
e
Neu
tral
Agr
ee
Stro
ngly
A
gree
13. Classroom rules are posted clearly and are visible to all students.
0 0.2 0.4 0.6 0.8 1
14. There is an effective classroom management system in place.
0 0.2 0.4 0.6 0.8 1
15. The class schedule is clearly posted and is visible to all students.
0 0.2 0.4 0.6 0.8 1
16. Major class procedures (i.e. student talk, lining up, etc.) are followed without prompting.
0 0.2 0.4 0.6 0.8 1
17. The teacher reinforces appropriate behavior effectively (i.e. following the rules).
0 0.2 0.4 0.6 0.8 1
18. Rules are enforced consistently.
0 0.2 0.4 0.6 0.8 1
19. Transition times are governed by rules and run smoothly.
0 0.2 0.4 0.6 0.8 1
20. The teacher’s method of getting student’s attention is effective.
0 0.2 0.4 0.6 0.8 1
21. Administrative routines (i.e. attendance, record keeping, etc.) are carried out efficiently.
0 0.2 0.4 0.6 0.8 1
98
Comments:
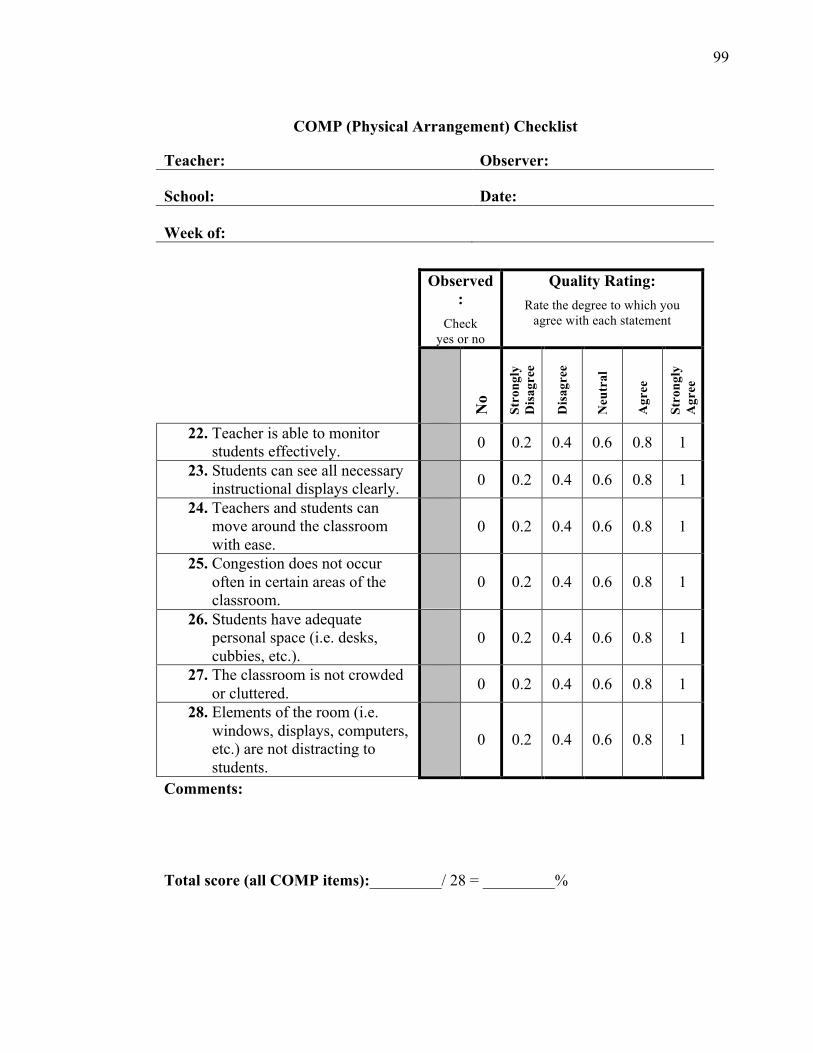
99
COMP (Physical Arrangement) Checklist
Teacher: Observer:
School: Date:
Week of:
Observed
:
Check yes or no
Quality Rating:
Rate the degree to which you agree with each statement
No
Stro
ngly
D
isag
ree
Dis
agre
e
Neu
tral
Agr
ee
Stro
ngly
A
gree
22. Teacher is able to monitor students effectively.
0 0.2 0.4 0.6 0.8 1
23. Students can see all necessary instructional displays clearly.
0 0.2 0.4 0.6 0.8 1
24. Teachers and students can move around the classroom with ease.
0 0.2 0.4 0.6 0.8 1
25. Congestion does not occur often in certain areas of the classroom.
0 0.2 0.4 0.6 0.8 1
26. Students have adequate personal space (i.e. desks, cubbies, etc.).
0 0.2 0.4 0.6 0.8 1
27. The classroom is not crowded or cluttered.
0 0.2 0.4 0.6 0.8 1
28. Elements of the room (i.e. windows, displays, computers, etc.) are not distracting to students.
0 0.2 0.4 0.6 0.8 1
Comments: Total score (all COMP items):_________/ 28 = _________%
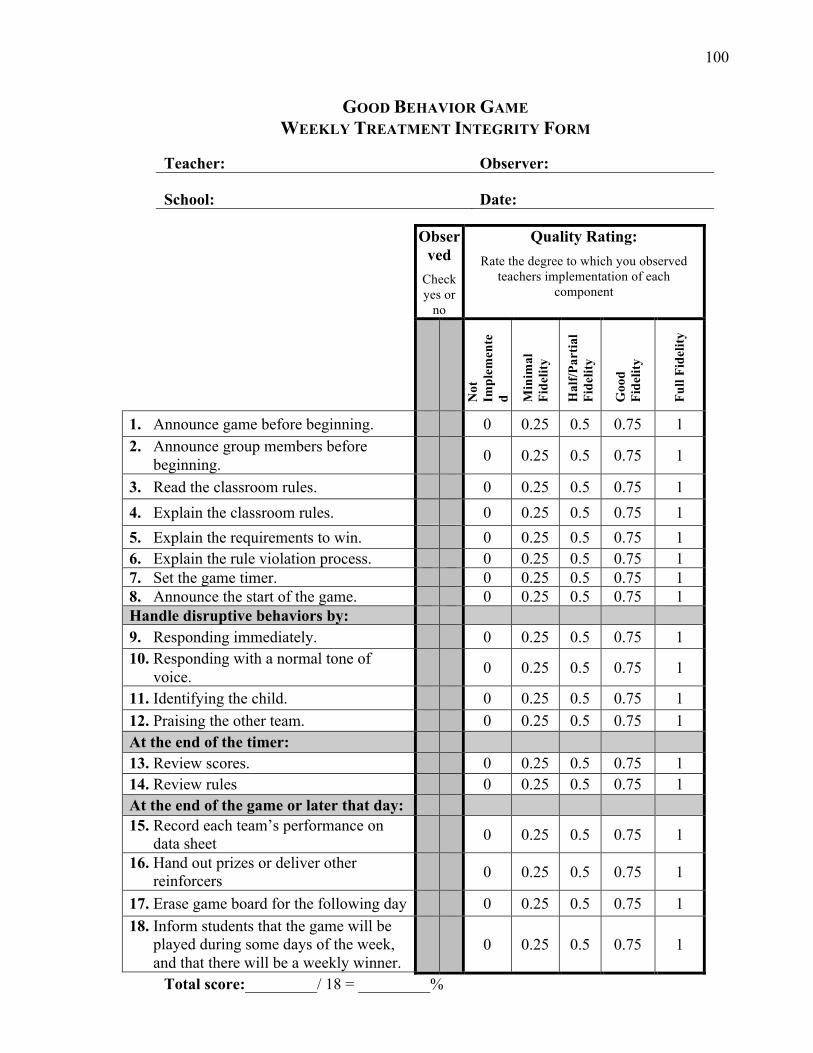
100
GOOD BEHAVIOR GAME WEEKLY TREATMENT INTEGRITY FORM
Teacher: Observer:
School: Date:
Observed
Check yes or
no
Quality Rating:
Rate the degree to which you observed teachers implementation of each
component
Not
Im
plem
ente
d Min
imal
Fi
delit
y
Hal
f/Par
tial
Fide
lity
Goo
d Fi
delit
y
Full
Fide
lity
1. Announce game before beginning. 0 0.25 0.5 0.75 1 2. Announce group members before
beginning. 0 0.25 0.5 0.75 1
3. Read the classroom rules. 0 0.25 0.5 0.75 1 4. Explain the classroom rules. 0 0.25 0.5 0.75 1 5. Explain the requirements to win. 0 0.25 0.5 0.75 1 6. Explain the rule violation process. 0 0.25 0.5 0.75 1 7. Set the game timer. 0 0.25 0.5 0.75 1 8. Announce the start of the game. 0 0.25 0.5 0.75 1 Handle disruptive behaviors by: 9. Responding immediately. 0 0.25 0.5 0.75 1 10. Responding with a normal tone of
voice. 0 0.25 0.5 0.75 1
11. Identifying the child. 0 0.25 0.5 0.75 1 12. Praising the other team. 0 0.25 0.5 0.75 1 At the end of the timer: 13. Review scores. 0 0.25 0.5 0.75 1 14. Review rules 0 0.25 0.5 0.75 1 At the end of the game or later that day: 15. Record each team’s performance on
data sheet 0 0.25 0.5 0.75 1
16. Hand out prizes or deliver other reinforcers
0 0.25 0.5 0.75 1
17. Erase game board for the following day 0 0.25 0.5 0.75 1 18. Inform students that the game will be
played during some days of the week, and that there will be a weekly winner.
0 0.25 0.5 0.75 1
Total score:_________/ 18 = _________%

101
SELF-MONITORING WEEKLY TREATMENT INTEGRITY
Teacher: Observer:
School: Date:
Week of:
Check yes or no to indicate if each component was completed this week.
Yes No 1. Teacher listened to audiotape of lesson for 5 min at least once
per week.
2. Teacher coded OTR from 5 min segment at least once per week.
3. Teacher coded praise from 5 min segment at least once per week.
4. Teacher converted OTR rate (rate x 3 = per 15 min segment).
5. Teacher converted praise rate (rate x 3 = per 15 min segment).
6. Teacher graphed OTR rate (converted) at least once per week.
7. Teacher graphed praise rate (converted) at least once per week.
Comments:
Total score:_________/ 7 = _________%